Towards a Resilience Index for Pacific Island Nations (RIPIN) · >39cm4 or maximum elevation
4
Arup has taken the first step towards developing a resilience index to focus action and support to improve resilience of low lying Pacific Island Nations to sea level rise. The world’s climate is changing. Sea level rise in the western tropical areas of the Pacific Ocean is currently four times the global average 1 . Many atolls in the Pacific are less than 5m above sea level and are home to thousands who feel connected with both their land and ocean. A changing climate will affect their physical environment, customs and culture. Mean sea levels are predicted to increase between 0.26m and 0.82m by 2100 depending on global emissions, mainly due to thermal expansion and glacial melt 2 . The sea level also varies from west to east across the Pacific Ocean often for years or decades due to changing trade winds affected by El Niño- Southern Oscillation (ENSO) 2 . There is more uncertainty about frequency and intensity of short term extreme sea levels, affected by climate and non-climate factors (see figures overleaf). These are caused by three components: • Short-term weather events such as cyclones and storm surges. Tropical cyclones are projected to decrease in frequency but increase in severity, which increases the potential for extreme damage 4 . • Tides (king tides in the region can be as high as 3.2m 3 ) and; • Seasonal or longer-term fluctuations caused by sea currents and surface water temperatures affecting wind, temperature and rainfall such as ENSO. Sea level rise causes coastal inundation, which may result in damage to land-based infrastructure and critical assets, salinisation of ground water, damage to agricultural land, houses and sites of cultural significance. Ultimately, it may mean relocation is required. Towards a Resilience Index for Pacific Island Nations (RIPIN) Above: An island in Palau
Transcript of Towards a Resilience Index for Pacific Island Nations (RIPIN) · >39cm4 or maximum elevation

Arup has taken the first step towards developing a resilience index to focus action and support to improve resilience of low lying Pacific Island Nations to sea level rise.The world’s climate is changing. Sea level rise in the western tropical areas of the Pacific Ocean is currently four times the global average1. Many atolls in the Pacific are less than 5m above sea level and are home to thousands who feel connected with both their land and ocean. A changing climate will affect their physical environment, customs and culture. Mean sea levels are predicted to increase between 0.26m and 0.82m by 2100 depending on global emissions, mainly due to thermal expansion and glacial melt2. The sea level also varies from west to east across the Pacific Ocean often for years or decades due to changing trade winds affected by El Niño-Southern Oscillation (ENSO)2.
There is more uncertainty about frequency and intensity of short term extreme sea levels, affected by climate and non-climate factors (see figures overleaf). These are caused by three components:• Short-term weather events such as cyclones and storm surges.
Tropical cyclones are projected to decrease in frequency but increase in severity, which increases the potential for extreme damage4.
• Tides (king tides in the region can be as high as 3.2m3) and;• Seasonal or longer-term fluctuations caused by sea currents
and surface water temperatures affecting wind, temperature and rainfall such as ENSO.
Sea level rise causes coastal inundation, which may result in damage to land-based infrastructure and critical assets, salinisation of ground water, damage to agricultural land, houses and sites of cultural significance. Ultimately, it may mean relocation is required.
Towards a Resilience Index for Pacific Island Nations (RIPIN)
Above: An island in Palau
Phase 1: Initial Review
Understanding the Problem Understanding the Problem Understanding the ProblemNation Profile
Approach
Metric
People Impacted
Population >500 people
Figure 1: Resilience Index (RIPIN) approach
Figure 2: Sea level rise projections for the (medium) emissions scenario 2081–2100 relative to 1981–2000 (Source: adapted from Pacific Climate Change Science Program, 20115)
Figure 3 The impact of wind, tide, storms, and climate features (source PACCSAP)7
GDP per capita Population density Ratio of coastline length to land area
Tbd with reference to the City
Resilience Index
Location of physical & socio-economic assets. Plausible range of sea levels & hazard frequency.
Adequacy of flood protection systems.Future projected sea level rise
>39cm4 or maximum elevation <500m
Adaptive Capacity Adaptive CapacityHazards Vulnerabiltiy ContextImpact Vulnerability in Detail
Nation Profile Nation Profile
Phase 2: Vulnerability Ranking Phase 3: Understand Resilience and Vulnerability
RIPIN ProcessArup undertook an initial literature review to understand the existing knowledge base with regard to this issue. Using this evidence, we have begun to develop a three stage process to understand the resilience and vulnerability of specific Pacific Island Nations (see figure 1):
Phase 1: We drew up a long list of the most physically vulnerable islands in the region based on an affected population of over 500, and low lying islands under 500m above sea level or those that are projected to have above average sea level rise for the region, as shown in figure 2.
Phase 2: We adapted an existing approach for an international vulnerability index, developed by Barnett & Adger, 20036 and applied it to the long list. The most vulnerable islands are those with a low GDP/captia, high population density and high length of coastline compared to area.
Phase 3: An outline has been developed and further work will be required to assess this stage in detail. See page 4 for more details.
© J
odie
Gat
field
, Aus
AID
2
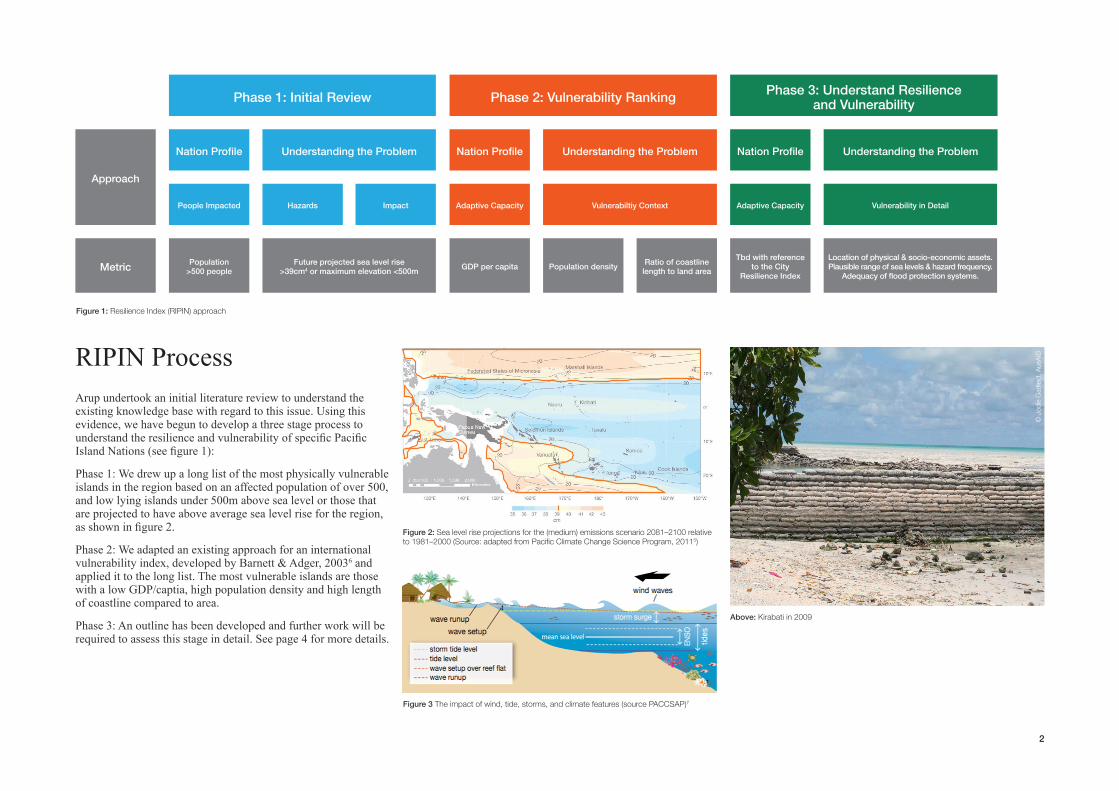
Above: Kirabati in 2009
KiribatiTuvaluMarshall Islands
Federation States of
Micronesia Tokelau Nauru Guam Palau Vanuatu East Timor Niue
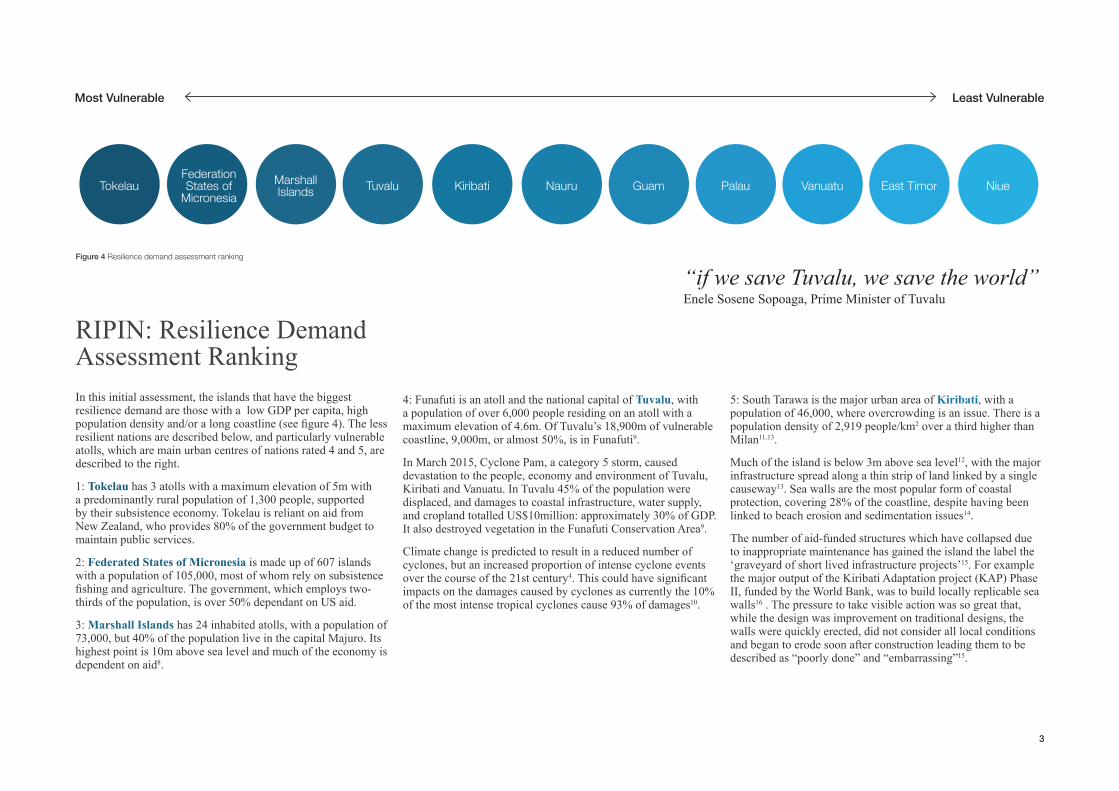
RIPIN: Resilience Demand Assessment RankingIn this initial assessment, the islands that have the biggest resilience demand are those with a low GDP per capita, high population density and/or a long coastline (see figure 4). The less resilient nations are described below, and particularly vulnerable atolls, which are main urban centres of nations rated 4 and 5, are described to the right.
1: Tokelau has 3 atolls with a maximum elevation of 5m with a predominantly rural population of 1,300 people, supported by their subsistence economy. Tokelau is reliant on aid from New Zealand, who provides 80% of the government budget to maintain public services.
2: Federated States of Micronesia is made up of 607 islands with a population of 105,000, most of whom rely on subsistence fishing and agriculture. The government, which employs two-thirds of the population, is over 50% dependant on US aid.
3: Marshall Islands has 24 inhabited atolls, with a population of 73,000, but 40% of the population live in the capital Majuro. Its highest point is 10m above sea level and much of the economy is dependent on aid8.
4: Funafuti is an atoll and the national capital of Tuvalu, with a population of over 6,000 people residing on an atoll with a maximum elevation of 4.6m. Of Tuvalu’s 18,900m of vulnerable coastline, 9,000m, or almost 50%, is in Funafuti9.
In March 2015, Cyclone Pam, a category 5 storm, caused devastation to the people, economy and environment of Tuvalu, Kiribati and Vanuatu. In Tuvalu 45% of the population were displaced, and damages to coastal infrastructure, water supply, and cropland totalled US$10million: approximately 30% of GDP. It also destroyed vegetation in the Funafuti Conservation Area9.
Climate change is predicted to result in a reduced number of cyclones, but an increased proportion of intense cyclone events over the course of the 21st century4. This could have significant impacts on the damages caused by cyclones as currently the 10% of the most intense tropical cyclones cause 93% of damages10.
5: South Tarawa is the major urban area of Kiribati, with a population of 46,000, where overcrowding is an issue. There is a population density of 2,919 people/km2 over a third higher than Milan11,13.
Much of the island is below 3m above sea level12, with the major infrastructure spread along a thin strip of land linked by a single causeway13. Sea walls are the most popular form of coastal protection, covering 28% of the coastline, despite having been linked to beach erosion and sedimentation issues14.
The number of aid-funded structures which have collapsed due to inappropriate maintenance has gained the island the label the ‘graveyard of short lived infrastructure projects’15. For example the major output of the Kiribati Adaptation project (KAP) Phase II, funded by the World Bank, was to build locally replicable sea walls16 . The pressure to take visible action was so great that, while the design was improvement on traditional designs, the walls were quickly erected, did not consider all local conditions and began to erode soon after construction leading them to be described as “poorly done” and “embarrassing”15.
Most Vulnerable Least Vulnerable
3
Figure 4 Resilience demand assessment ranking
“if we save Tuvalu, we save the world”Enele Sosene Sopoaga, Prime Minister of Tuvalu
Next StepsWork undertaken to date has enabled us to understand resilience and vulnerability at a high level. As seen in the case studies, there is a lot of complexity and nuance within each of the island nations. Further analysis to understand the location of important physical and socio-economic assets, anticipated water levels, and an assessment of the adequacy of flood protection systems would enable us to understand sea-level rise risk in more detail.
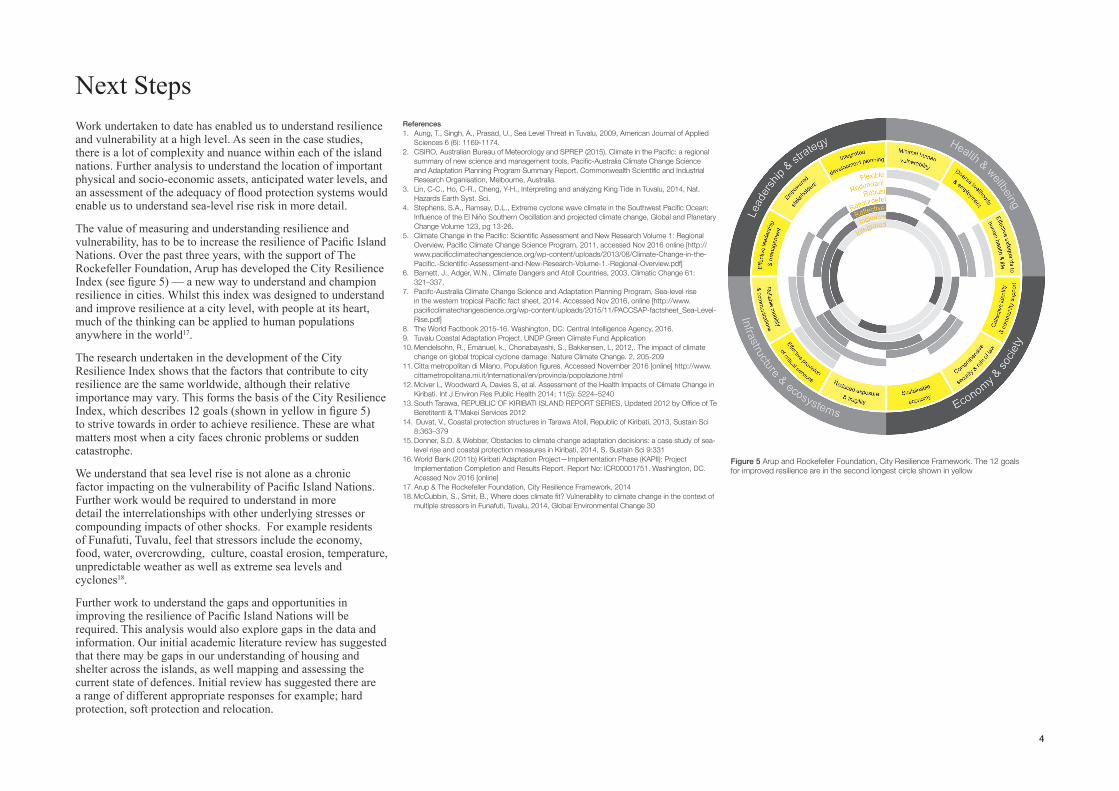
The value of measuring and understanding resilience and vulnerability, has to be to increase the resilience of Pacific Island Nations. Over the past three years, with the support of The Rockefeller Foundation, Arup has developed the City Resilience Index (see figure 5) — a new way to understand and champion resilience in cities. Whilst this index was designed to understand and improve resilience at a city level, with people at its heart, much of the thinking can be applied to human populations anywhere in the world17.
The research undertaken in the development of the City Resilience Index shows that the factors that contribute to city resilience are the same worldwide, although their relative importance may vary. This forms the basis of the City Resilience Index, which describes 12 goals (shown in yellow in figure 5) to strive towards in order to achieve resilience. These are what matters most when a city faces chronic problems or sudden catastrophe.
We understand that sea level rise is not alone as a chronic factor impacting on the vulnerability of Pacific Island Nations. Further work would be required to understand in more detail the interrelationships with other underlying stresses or compounding impacts of other shocks. For example residents of Funafuti, Tuvalu, feel that stressors include the economy, food, water, overcrowding, culture, coastal erosion, temperature, unpredictable weather as well as extreme sea levels and cyclones18.
Further work to understand the gaps and opportunities in improving the resilience of Pacific Island Nations will be required. This analysis would also explore gaps in the data and information. Our initial academic literature review has suggested that there may be gaps in our understanding of housing and shelter across the islands, as well mapping and assessing the current state of defences. Initial review has suggested there are a range of different appropriate responses for example; hard protection, soft protection and relocation.
References1. Aung, T., Singh, A., Prasad, U., Sea Level Threat in Tuvalu, 2009, American Journal of Applied
Sciences 6 (6): 1169-1174.2. CSIRO, Australian Bureau of Meteorology and SPREP (2015). Climate in the Pacific: a regional
summary of new science and management tools, Pacific-Australia Climate Change Science and Adaptation Planning Program Summary Report. Commonwealth Scientific and Industrial Research Organisation, Melbourne, Australia.
3. Lin, C-C., Ho, C-R., Cheng, Y-H., Interpreting and analyzing King Tide in Tuvalu, 2014, Nat. Hazards Earth Syst. Sci.
4. Stephens, S.A., Ramsay, D.L., Extreme cyclone wave climate in the Southwest Pacific Ocean: Influence of the El Niño Southern Oscillation and projected climate change, Global and Planetary Change Volume 123, pg 13-26.
5. Climate Change in the Pacific: Scientific Assessment and New Research Volume 1: Regional Overview, Pacific Climate Change Science Program, 2011, accessed Nov 2016 online [http://www.pacificclimatechangescience.org/wp-content/uploads/2013/08/Climate-Change-in-the-Pacific.-Scientific-Assessment-and-New-Research-Volume-1.-Regional-Overview.pdf]
6. Barnett, J., Adger, W.N., Climate Dangers and Atoll Countries, 2003, Climatic Change 61: 321–337.
7. Pacifc-Australia Climate Change Science and Adaptation Planning Program, Sea-level rise in the western tropical Pacific fact sheet, 2014. Accessed Nov 2016, online [http://www.pacificclimatechangescience.org/wp-content/uploads/2015/11/PACCSAP-factsheet_Sea-Level-Rise.pdf]
8. The World Factbook 2015-16. Washington, DC: Central Intelligence Agency, 2016. 9. Tuvalu Coastal Adaptation Project, UNDP Green Climate Fund Application10. Mendelsohn, R., Emanuel, k., Chonabayashi, S., Bakkensen, L, 2012,. The impact of climate
change on global tropical cyclone damage. Nature Climate Change. 2, 205-209 11. Citta metropolitan di Milano, Population figures. Accessed November 2016 [online] http://www.
cittametropolitana.mi.it/international/en/provincia/popolazione.html12. Mciver L, Woodward A, Davies S, et al. Assessment of the Health Impacts of Climate Change in
Kiribati. Int J Environ Res Public Health 2014; 11(5): 5224–5240 13. South Tarawa, REPUBLIC OF KIRIBATI ISLAND REPORT SERIES, Updated 2012 by Office of Te
Beretitenti & T’Makei Services 201214. Duvat, V., Coastal protection structures in Tarawa Atoll, Republic of Kiribati, 2013, Sustain Sci
8:363–37915. Donner, S.D. & Webber, Obstacles to climate change adaptation decisions: a case study of sea-
level rise and coastal protection measures in Kiribati, 2014, S. Sustain Sci 9:33116. World Bank (2011b) Kiribati Adaptation Project—Implementation Phase (KAPII): Project
Implementation Completion and Results Report. Report No: ICR00001751. Washington, DC. Acessed Nov 2016 [online]
17. Arup & The Rockefeller Foundation, City Resilience Framework, 201418. McCubbin, S., Smit, B., Where does climate fit? Vulnerability to climate change in the context of
multiple stressors in Funafuti, Tuvalu, 2014, Global Environmental Change 30
Figure 5 Arup and Rockefeller Foundation, City Resilience Framework. The 12 goals for improved resilience are in the second longest circle shown in yellow
4