
Towards a gestural control of environmental sound texture ...
59
Master’s thesis Towards a gestural control of environmental sound texture synthesis Aymeric MASURELLE supervised by Diemo SCHWARZ Baptiste CARAMIAUX Norbert SCHNELL August 5, 2011
Transcript of Towards a gestural control of environmental sound texture ...
Master’s thesis
Towards a gestural control of
environmental sound texturesynthesis
Aymeric MASURELLE
supervised by
Diemo SCHWARZ Baptiste CARAMIAUX Norbert SCHNELL
August 5, 2011


Acknowledgements
Thanks to IRCAM for its creative working atmosphere.
Thanks to the Real Time Musical Interaction team for their interesting researches andapplications which motivate me to do this project.Especially, thanks to Diemo Schwarz for making this project possible, for his work, hisinterest, his curiosity and his calm; thanks to Baptiste Caramiaux for sharing his experi-ence, providing pertinent comments; thanks to Norbert Schnell for his idea and conceptualview on the project. And thanks to Tommaso Bianco and Sarah Fdili Alaoui for beinghelpful with me.
Thanks to the Perception and Sound Design team, for letting me put my working spotin their balcony, lending me one of their audiometric booth for a while, spreading calmand relax ambiance, and especially thanks to Nicolas Misdariis for pertinent advises tohelp me creating a perceptual experiment.
Thanks to Jérôme Nika, Benjamin Cauchi, Pierre Beauguitte, Thomas Humbert, JulesFrançoise, José Echeveste, Julien Colafrancesco, Louis Delebecque, Van Phan Quang, Au-rélie Frère, Sandrine Bonnot, Laure Cornu for those moments spent on The Passerelle,your laughter and the time that you passed to help me in this work.
Thanks to Sylvie Benoit, Youcef Bensaid, Alessandro Saccoia for those assistanceswhich make work easier.
Thanks to Carlos Agon for your smile, your good mood, your patience.
i

ii

Abstract
Through this project, a development of a methodology to guide the creation of intu-itive and pertinent mappings between one-hand gesture and environmental sound tex-ture (rain, wind, wave) descriptors is shown. The proposed methodology is composedof two complementary key stages. First, a perceptual investigation on sound descriptorscontrolling a corpus-based concatenative synthesis process is carried out to figure outthe relevant ones. Afterwards an experiment where participants perform gestures whilelistening to sound texture morphologies is achieved to create a sound and gesture-relateddescriptor dataset. Then by applying a canonical correlation analysis on those sound andgesture-related data, one is able to determine pertinent gesture features and their cor-respondences with the retrieved relevant sound features. Thus pertinent clues to creategesture-to-sound mappings are provided by this method.
iii

iv

Contents
Acknowledgements i
Abstract iii
1 Introduction 1
2 Background 3
2.1 Sound texture synthesis . . . . . . . . . . . . . . . . . . . . . . . . . . . 32.1.1 Definition of sound texture . . . . . . . . . . . . . . . . . . . . . . 32.1.2 Sound texture synthesis . . . . . . . . . . . . . . . . . . . . . . . 4
2.2 Gestural control of sound synthesis . . . . . . . . . . . . . . . . . . . . . 62.2.1 Mapping strategies . . . . . . . . . . . . . . . . . . . . . . . . . . 62.2.2 Gesture control of granular synthesis . . . . . . . . . . . . . . . . 62.2.3 Methodologies for gesture-to-sound mapping design . . . . . . . . 7
3 A perceptually-motivated synthesis control of environmental sound tex-
tures 9
3.1 First steps . . . . . . . . . . . . . . . . . . . . . . . . . . . . . . . . . . . 93.1.1 Environmental sound perception . . . . . . . . . . . . . . . . . . . 93.1.2 Environmental sound texture synthesis . . . . . . . . . . . . . . . 9
3.2 Perceptual experiment on synthesis of environmental sound texture mor-phology . . . . . . . . . . . . . . . . . . . . . . . . . . . . . . . . . . . . 103.2.1 Environmental sound texture morphology resynthesis . . . . . . . 103.2.2 Design of the experiment . . . . . . . . . . . . . . . . . . . . . . . 123.2.3 Results of the experiment . . . . . . . . . . . . . . . . . . . . . . 14
3.3 Conclusion . . . . . . . . . . . . . . . . . . . . . . . . . . . . . . . . . . . 16
4 Towards a gestural control of environmental sound texture 19
4.1 Introduction . . . . . . . . . . . . . . . . . . . . . . . . . . . . . . . . . . 194.1.1 Gesture . . . . . . . . . . . . . . . . . . . . . . . . . . . . . . . . 194.1.2 Canonical correlation analysis . . . . . . . . . . . . . . . . . . . . 21
4.2 Experiment . . . . . . . . . . . . . . . . . . . . . . . . . . . . . . . . . . 224.2.1 Experiment protocol . . . . . . . . . . . . . . . . . . . . . . . . . 224.2.2 Experiment results . . . . . . . . . . . . . . . . . . . . . . . . . . 234.2.3 Choice of gesture descriptors . . . . . . . . . . . . . . . . . . . . . 234.2.4 Sound-gesture relationships . . . . . . . . . . . . . . . . . . . . . 23
4.3 Discussion and conclusion . . . . . . . . . . . . . . . . . . . . . . . . . . 27
v

5 Texture descriptor development 29
5.1 Impact rate descriptor . . . . . . . . . . . . . . . . . . . . . . . . . . . . 295.1.1 Method description . . . . . . . . . . . . . . . . . . . . . . . . . . 295.1.2 Evaluation of impact rate . . . . . . . . . . . . . . . . . . . . . . 30
5.2 Conclusion . . . . . . . . . . . . . . . . . . . . . . . . . . . . . . . . . . . 32
6 Conclusion 33
A Perceptually relevant audio descriptors for environmental sound 39
B Details on participants 41
B.1 For the similarity perceptual study on environmental texture morpholigyresynthesis . . . . . . . . . . . . . . . . . . . . . . . . . . . . . . . . . . . 41
B.2 For the gesture-sound relationship study . . . . . . . . . . . . . . . . . . 42
C Two sample t-test 43
D More CCA results 45
vi

List of Figures
2.1 Potential information content of a sound texture vs time, [SaP95] . . . . 32.2 Left: the CrumbleBag with cereal, coral and styrofoam fillings. Right: the
PeddleBox. [OE04]. . . . . . . . . . . . . . . . . . . . . . . . . . . . . . . 62.3 Recorded signal of the PebbleBox (top) and granulated response using a
Hammer grain (bottom) of the complete granulation process, [OE04]. . . 7
3.1 Interface of the perceptual experiment for environmental sound textureresynthesis. . . . . . . . . . . . . . . . . . . . . . . . . . . . . . . . . . . 13
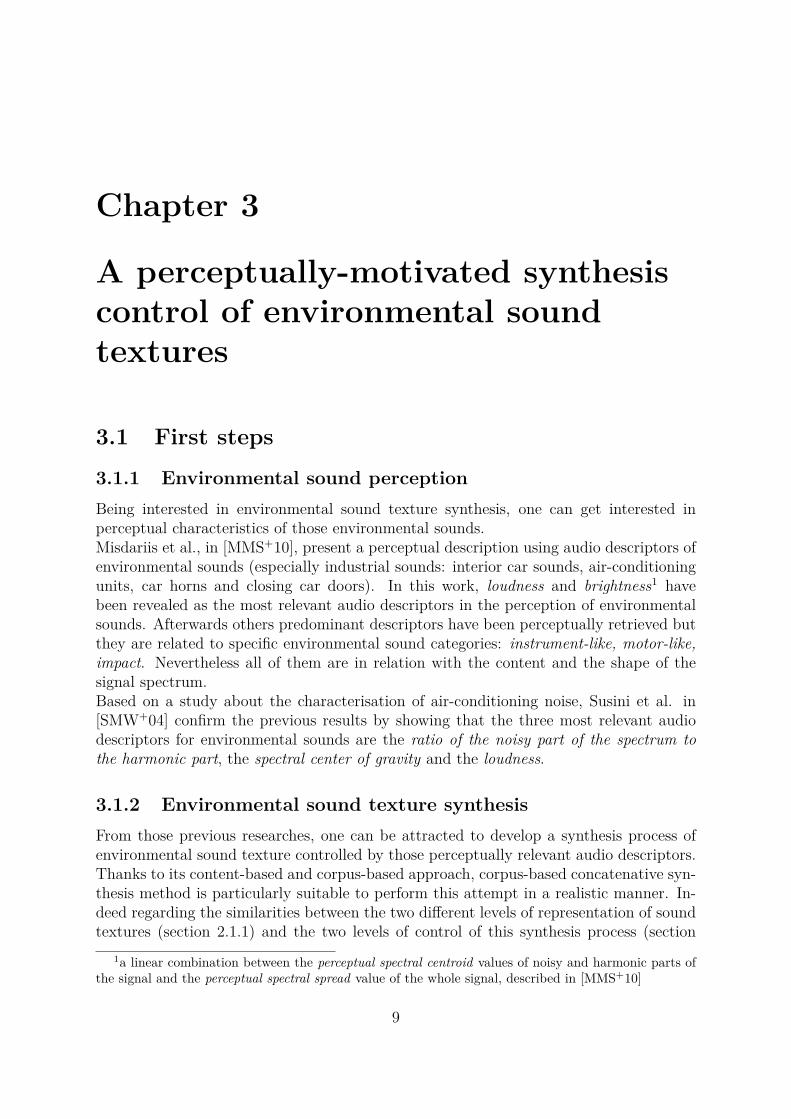
4.1 Illustration of the setup for capturing the motion of a performer’s handin a plane through an embeded inertial sensor (wii mote) and a webcamproviding depth maps (kinect). . . . . . . . . . . . . . . . . . . . . . . . 21
4.2 Representation of the canonical correlation strength and the canonicalloadings for all relevant performances over all sound textures and partici-pants (94 sound extracts). Lo: loudness, SF: spectral flatness, SC: spectralcentroid. HP: horizontal position, VP: vertical position, Ve: absolute ve-locity, Ac: absolute acceleration, An: absolute angle, AV: absolute angularvelocity. . . . . . . . . . . . . . . . . . . . . . . . . . . . . . . . . . . . . 24
4.3 Representation of the canonical correlation strength and the canonicalloadings for all relevant performances over all wind textures and partici-pants (43 performances). Lo: loudness, SF: spectral flatness, SC: spectralcentroid. HP: horizontal position, VP: vertical position, Ve: absolute ve-locity, Ac: absolute acceleration, An: absolute angle, AV: absolute angularvelocity. . . . . . . . . . . . . . . . . . . . . . . . . . . . . . . . . . . . . 25
4.4 Representation of the canonical correlation strength and the canonicalloadings for all relevant performances of a single wave sound texture ex-tract over all participants (21 performances). Lo: loudness, SF: spectralflatness, SC: spectral centroid. HP: horizontal position, VP: vertical posi-tion, Ve: absolute velocity, Ac: absolute acceleration, An: absolute angle,AV: absolute angular velocity. . . . . . . . . . . . . . . . . . . . . . . . . 26
D.1 Representation of the canonical correlation strength and the canonicalloadings for all relevant performances of a single wind sound texture ex-tract over all participants (16 performances). Lo: loudness, SF: spectralflatness, SC: spectral centroid. HP: horizontal position, VP: vertical posi-tion, Ve: absolute velocity, Ac: absolute acceleration, An: absolute angle,AV: absolute angular velocity. . . . . . . . . . . . . . . . . . . . . . . . . 45
vii

D.2 Representation of the canonical correlation strength and the canonicalloadings over all relevant performances (8 performances) on the differentsound extracts of wind texture for one participant (subject 2). Lo: loud-ness, SF: spectral flatness, SC: spectral centroid. HP: horizontal position,VP: vertical position, Ve: absolute velocity, Ac: absolute acceleration, An:absolute angle, AV: absolute angular velocity. . . . . . . . . . . . . . . . . 46
D.3 Representation of the canonical correlation strength and the canonicalloadings over all relevant performances (7 performances) on the differentsound extracts of wind texture for one participant (subject 6). Lo: loud-ness, SF: spectral flatness, SC: spectral centroid. HP: horizontal position,VP: vertical position, Ve: absolute velocity, Ac: absolute acceleration, An:absolute angle, AV: absolute angular velocity. . . . . . . . . . . . . . . . . 47
viii
List of Tables
2.1 Brainstorm - examples of sound textures, [SA95]. . . . . . . . . . . . . . 4
3.1 Parameters’ value for environmental sound texture morphology resynthesis 123.2 Table of the results of the perceptual experiment for each considered sound
texture (rain, wave, wind). . . . . . . . . . . . . . . . . . . . . . . . . . . 143.3 Table of the results of the perceptual experiment over all considered sound
textures (rain, wave, wind). . . . . . . . . . . . . . . . . . . . . . . . . . 153.4 Table of the T-test results on the perceptual experiment data. . . . . . . 16
5.1 F-measure of the presented impact rate measure, in [%], for each combi-nation of frequency repetition and signal-to-noise ratio. . . . . . . . . . . 31
B.1 Details on the test persons which participates in the similarity perceptualstudy on environmental texture morpholigy resynthesis. . . . . . . . . . . 41
B.2 Details on the test persons which participates in the gesture-sound rela-tionship study. . . . . . . . . . . . . . . . . . . . . . . . . . . . . . . . . 42
ix

x

Chapter 1
Introduction
To create a realistic synthesis of environmental sound texture (rain, wave, wind, ...) is animportant issue for domains such as cinema, games, multimedia creations, installations.Existing methods achieve a certain level of realism in performing this task, but they arenot really interactive whereas controlling interactively the synthesis can improve realismdue to the inherently multimodal nature of perception.The present work is part of the ANR project, Topophonie, that deals with virtual nav-igable sound spaces, composed of sounding or audio-graphic objects, [sit11]. It focuseson the development of a methodology for providing a pertinent mapping between gestureand environmental sound texture. Through the following method, one is able to guidethe creation of a mapping for controlling interactively an environmental sound texturesynthesizer by one hand gesture.For this purpose, a real-time corpus-based concatenative synthesis system, CataRT [SCB08],is used. Its data-driven approach allows to control the sound synthesis by drawing tar-get audio descriptor trajectories in order to build a sound unit sequence out of a graincorpus.Several investigations, [MMS+10, SMW+04], have already been done to find the mostperceptually relevant audio descriptors in environmental sounds (especially industrialsounds). Based on those previous contributions, a perceptual similarity experiment iscarried out to retrieve a pertinent set of audio descriptors to drive the corpus-based con-catenative synthesis.A system using inertial sensors (wii mote) and a webcam furnishing a rgb image flow withits associated depth (kinect) capture the movement of the performer’s hand to obtain itspositions, rotations, velocities and accelerations.In order to explore the relationship between gesture and sound, a method deeply inspiredby [CBS10] is used. First, subjects perform hand movements while listening to soundexamples. The latter are created with CataRT by following trajectories of audio de-scriptors identified as being most meaningful in the above perceptual experiment. Then,based on canonical correlation analysis, the relationship between gesture and audio de-scriptors is quantified by linear multivariate regression. This method reveals a part of thecomplex relationship between gesture and sound. This gives pertinent clues to constructa gesture-sound mapping for the efficient gestural control of sound texture synthesis byperceptually meaningful audio descriptors.
1

2
Chapter 2
Background
2.1 Sound texture synthesis
2.1.1 Definition of sound texture
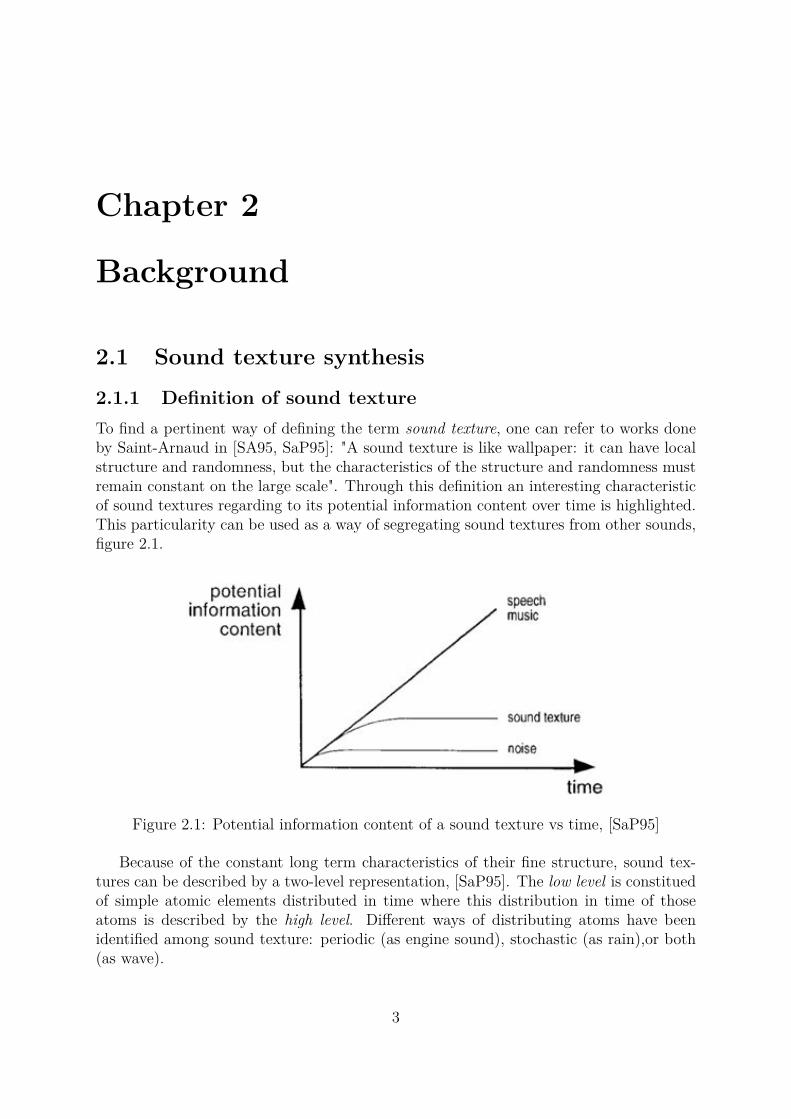
To find a pertinent way of defining the term sound texture, one can refer to works doneby Saint-Arnaud in [SA95, SaP95]: "A sound texture is like wallpaper: it can have localstructure and randomness, but the characteristics of the structure and randomness mustremain constant on the large scale". Through this definition an interesting characteristicof sound textures regarding to its potential information content over time is highlighted.This particularity can be used as a way of segregating sound textures from other sounds,figure 2.1.
Figure 2.1: Potential information content of a sound texture vs time, [SaP95]
Because of the constant long term characteristics of their fine structure, sound tex-tures can be described by a two-level representation, [SaP95]. The low level is constituedof simple atomic elements distributed in time where this distribution in time of thoseatoms is described by the high level. Different ways of distributing atoms have beenidentified among sound texture: periodic (as engine sound), stochastic (as rain),or both(as wave).
3

Texture Not a Texture
rain running water one voicevoices whisper telephone ringfan jungle musictraffic crickets radio stationwaves ice skating single laughwind city ambiance single hand claphum bar, cocktail sine waverefrigerator amplifier humengine 60 Hzradio static coffee grinderlaugh track (in TV show) bubblesapplause fireelectric crackle whispersbabble snare drum rollmurmur heart beat
Table 2.1: Brainstorm - examples of sound textures, [SA95].
Sometimes the term sound texture means non-tonal, non-percussive sound material,or non-harmonic, non-rhythmic musical material, [Sch11].And, it is important to make the distinction between sound texture and soundscape. Asoundscape is a sum of sounds that compose a scene where each sound component couldbe a sound texture.
In order to clarify the concept of sound texture, one could refer to examples of soundtextures that have been listed by Saint-Arnaud [SA95] through brainstorm session, table2.1.
2.1.2 Sound texture synthesis
Following the different characteristics of sound textures exposed in the previous part,different synthesis approaches have been developped for sound texture generation.Schwarz, in [Sch11], proposes a complete state of the art about existing sound texturesynthesis approaches. The following part is a short listing of different synthesis methodshighlighted in this paper.
Substractive synthesis - Noise filtering Using this method, different analysis-synthesis models for texture synthesis have been developped: 6-band Quadrature Mir-ror filtered noise in [SaP95], cascaded time and frequency domain linear prediction in[AE03, ZW04] and a neurophysically motivated statistical analysis of the kurtosis of en-ergy in subbands in [MDOS09]. Those different synthesis techniques seem to be especiallysuitable for unpitched sound texture like rain, fire, water.
4

Additive sinusoidal+noise synthesis Through this approach, filtered noise is com-plemented by oscillators to add sinusoidal partials. It allows to synthesize more complexand well-informed sound texture models such, as traffic noise [Gui08] and large classes ofenvironmental sounds (liquids, solids, aerodynamic sounds) [Ver10], achieving a certaindegree of details.
Physical modeling By applying physically-informed models, sound texture synthesiscan be carried out, [OSG02, MLS+08, LGDM08, Coo07, Ver10, PTF09]. Even thoughthose synthesis techniques attains realistic performances, this approach presents a prin-cipal drawback that for each class of texture sounds (i.e friction, rolling, machine noise,impact,...) a specific model should be developed.
Non-standard synthesis Other synthesis methods are used for sound texture synthe-sis, such as fractal synthesis or chaotic maps, in order to provide expressiveness throughthe synthesis process, [Sci99, FAC06].
Wavelets From a multiscale decomposition of a signal, a wavelet coefficient tree can bebuilt for sound texture synthesis to model temporal and hierarchic dependencies thanksto its multi-level approaches, [DBJEY+02, BJDEY+99, KP10]. With this method theoverall sound of the synthesized textures is recognisable but their fine temporal structuregets lost.
Granular synthesis This method recomposes short segments of original recording,called grains or snippets, with possible transpositions following a statistical model inorder to obtain texture sounds, [DBJEY+02, BJDEY+99, PB04, HP01, Hos02, FH09,LLZ04, Str07].
Corpus-based concatenative synthesis Based on granular synthesis, corpus-basedconcatenative synthesis proposes a content-based approach for sound texture synthesis,[Car04, Sch06, SBVB06, SCB08, SS10, PTF09, Fin09].Through his work [Sch06, SBVB06], Schwarz et al. propose a real-time corpus-basedconcatenative synthesis system, CataRT. This system allows to drive in real-time the se-lection and concatenation of sound grains by drawing target audio descriptor trajectoriesin a predefined audio descriptor space. Those sound units coming from a grain corpusare selected regarding to the proximity between their global1 audio descriptors and thetarget ones. This corpus is created by segmenting sounds from a database of pre-recordedaudio into units and analysing this units by computing their global audio descriptors.Thanks to its corpus-based approach, this synthesis technique can perform realistic soundsby feeding the used corpus with a real sound database. Moreover it allows to control thecreation of novel timbral evolutions through while keeping the fine details of the originalcorpus sounds. Then two levels of control are then enabled through this synthesis process:a low level and a high level. The low level of control deals with the local sound structureof the corpus units. Expressed while choosing the sounds to feed the corpus, this controldefines the fine sound details of the resulting synthesis. Then an attentive care should be
1over the entire unit signal
5
taken while creating the sound data base in order to match the fine sound characteristicsof the wanted synthesis. The other level of synthesis control, the high level, is performedby targetting positions (or path) in a predefined audio descriptor space for selecting thesound unit to be played regarding its global audio descriptors.
2.2 Gestural control of sound synthesis
Through recent researches in the domain of neurosciences [KKA+02, MG03] and percep-tion [VTR91, Alv05, Ber97], the inherently multimodal nature of perception has beenhighlighted by showing the predominant role of action in perception. Then, by provid-ing an interactive control of a sound synthesis process through gesture, one can createa system which improves the realism of the sound synthesis thanks to its multimodalapproach. To achieve this goal, the gesture-sound relationship has to be determined inorder to find a pertinent way of linking gesture-control data and the sound process, i.e.a gesture-to-sound mapping, allowing musical expression of the produced sound throughgestural control.
2.2.1 Mapping strategies
In the literature, several mapping strategies have been developed such as one-to-one, one-to-many, many-to-one and many-to-many, [BMS05]. This latter category of mappingsdespite its complexity can show more satisfying results, after a learning phase, thanone-to-one mappings, [Wan02].
2.2.2 Gesture control of granular synthesis
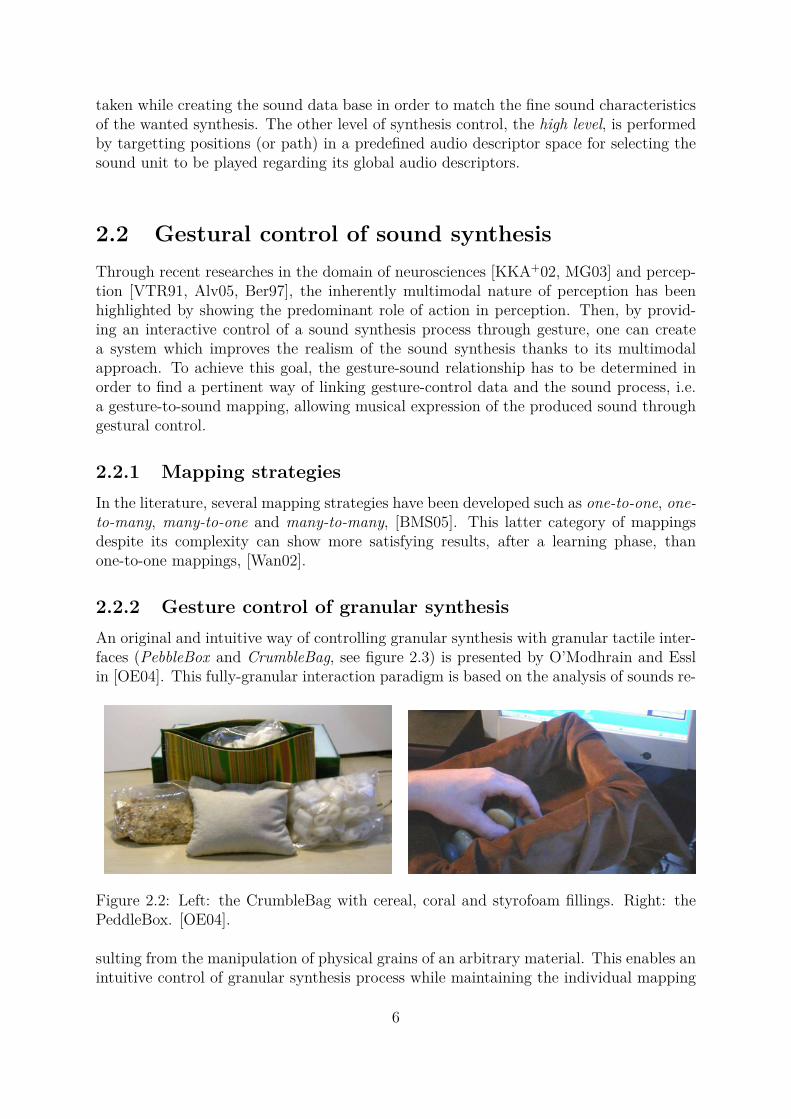
An original and intuitive way of controlling granular synthesis with granular tactile inter-faces (PebbleBox and CrumbleBag, see figure 2.3) is presented by O’Modhrain and Esslin [OE04]. This fully-granular interaction paradigm is based on the analysis of sounds re-
Figure 2.2: Left: the CrumbleBag with cereal, coral and styrofoam fillings. Right: thePeddleBox. [OE04].
sulting from the manipulation of physical grains of an arbitrary material. This enables anintuitive control of granular synthesis process while maintaining the individual mapping
6

of fine-structure temporal behavior (10-100 ms) of granular event to haptic interactions.This analysis extracts parameters as grain rate, grain amplitude and grain density whichare then used to control the granulation of sound samples in real-time. This process isillustrated in figure 2.3.
Figure 2.3: Recorded signal of the PebbleBox (top) and granulated response using aHammer grain (bottom) of the complete granulation process, [OE04].
With this approach, a certain variety of environmental sounds like dropping or shuf-fling of objects can be performed.
2.2.3 Methodologies for gesture-to-sound mapping design
In a context of artistic performance, Bencina et al. in [BWL08] present a technique fordeveloping new gesture-sound mappings, the Vocal Prototyping. With this technique, amovement sound vocabulary are extracted by three exercises:
1. first person vocalise, other find movement that corresponds,
2. first person gesture, other find vocalisations that correspond,
3. each make their own movement/sound pairings.
Thus, from the outcomes of the Vocal Prototyping, Bencina et al. "strove to maintain abalance in the relationship between movement and resultant sound that was easy to per-ceive for audience and performance alike" to create their gesture-sound mappings. Thisresults in a intentionally simple mapping inviting a dramaturgical mode of composition.
Caramiaux et al., in [CBS10], introduce an pertinent and original method for thequantitative multimodal analysis of movement and sound. Using sound and gesture-related data sets from an experiment where subjects performed free hand movement whilelistening to short sound examples, Caramiaux et al. employed a canonical correlationanalysis (CCA) to investigate and highlight mutual shared variance between a set ofgesture parameters, like position, velocity, normal acceleration, and audio descriptors, asloudness, sharpness by a linear multivariate regression. Even though this method cannot
7

exhibit non-linear relations between gesture and sound, it can be used as a selection toolto create relevant gesture-sound mappings.
8
Chapter 3
A perceptually-motivated synthesis
control of environmental sound
textures
3.1 First steps
3.1.1 Environmental sound perception
Being interested in environmental sound texture synthesis, one can get interested inperceptual characteristics of those environmental sounds.Misdariis et al., in [MMS+10], present a perceptual description using audio descriptors ofenvironmental sounds (especially industrial sounds: interior car sounds, air-conditioningunits, car horns and closing car doors). In this work, loudness and brightness1 havebeen revealed as the most relevant audio descriptors in the perception of environmentalsounds. Afterwards others predominant descriptors have been perceptually retrieved butthey are related to specific environmental sound categories: instrument-like, motor-like,impact. Nevertheless all of them are in relation with the content and the shape of thesignal spectrum.Based on a study about the characterisation of air-conditioning noise, Susini et al. in[SMW+04] confirm the previous results by showing that the three most relevant audiodescriptors for environmental sounds are the ratio of the noisy part of the spectrum tothe harmonic part, the spectral center of gravity and the loudness.
3.1.2 Environmental sound texture synthesis
From those previous researches, one can be attracted to develop a synthesis process ofenvironmental sound texture controlled by those perceptually relevant audio descriptors.Thanks to its content-based and corpus-based approach, corpus-based concatenative syn-thesis method is particularly suitable to perform this attempt in a realistic manner. In-deed regarding the similarities between the two different levels of representation of soundtextures (section 2.1.1) and the two levels of control of this synthesis process (section
1a linear combination between the perceptual spectral centroid values of noisy and harmonic parts ofthe signal and the perceptual spectral spread value of the whole signal, described in [MMS+10]
9

2.1.2), corpus-based concatenative synthesis systems seem quiet suitable to synthesizeglobal evolutions, also called morphologies, of a specific sound textures.Thus the CataRT system is synthesis technique is the one used as real-time audio engine forour project. The handled version is cataRT-1.2.12 using the library FTM 2.5-beta173
on Max 5.1.84.
However to efficiently synthesize environmental sound textures with CataRT, a studyon finding out the most appropriate set of audio descriptors to drive this synthesis shouldbe carried out.
3.2 Perceptual experiment on synthesis of environ-
mental sound texture morphology
Through this part, a perceptual similarity experiment is presented. Its goal is to evaluatethe similarity between original sound texture morphologies and their respective resynthe-sis driven by different sets of audio descriptors. From the experiment results, the bestcombinaison of descriptors to control the resynthesis for each proposed sound texturescan be revealed. Moreover the overall resynthesis process can be as well validated.
3.2.1 Environmental sound texture morphology resynthesis
To achieve this perceptual similarity experiment, a set of original and resynthesized en-vironmental sound texture morphologies has to be created. Through this part, the pro-cedure to create this sound set is described.
Corpus creation
As seen in section 2.1.1, sound textures have two levels of representation: a low level com-posed of simple atomic elements and a high level describing the time distribution of thoseatoms. In section 2.1.2 the two levels of control of the chosen synthesis method (corpus-based concatenative synthesis) have been highlighted. A low level of control achievedby constituting the corpus defines the possible fine sound details for the synthesis and ahigh one enabling to comtrol the creation of novel timbral evolutions playing sequencesof corpus units by drawing trajectories through a predefined audio descriptors space.Thus to fit the different levels of sound texture representation with the different levels ofsynthesis control, the used corpus for a specific sound texture should be properly created.First in order to have a realistic illustration of sound textures, recordings of true soundtextures (SoundIdeas database) have been used to feed the different corpora. In addition,for this synthesis process each sound texture has its associated corpus. For example, thecorpus for synthesizing a rain texture is composed of sound units coming from true rainrecordings only. Thus the fine atomic details of the sound texture synthesis is realisticallyillustrated. Then to create an associated corpus for each of those sound textures (rain,
2http://imtr.ircam.fr/imtr/CataRT3http://ftm.ircam.fr4http://cycling74.com
10

wave and wind), recordings of rain5 (19 sound files, 29.5 min), wind6 (16 sound files, 24.1min) and wave7 (14 sound files, 25.8 min) from the SoundIdeas database are respectivelyfeeding the rain, wind and wave corpora.
Moreover the length of the corpus units has to be discussed. About this aspect noliterature has been found. For synthesizing rain sound textures with their prototype tex-ture synthesizer ([SS10]), Schwarz and Schnell uses a corpus of rain recording units oflength 666 ms. In our case, in order to provide a reactive gestural control of the synthesisthe tendancy is to reduce the unit lengt to allow more abrupt timbral changes. But toprovide pertinent timbral evolutions of sound textures, each corpus unit should representa certain time distribution of sound texture atomic elements. Then a unit length of 250ms seems to be a good compromise between a reactive control and the high level of soundtexture representation.
Experiment’s audio descriptor sets
According to its data-driven approach, the CataRT-1.2.1 system proposes 25 differentaudio features. Those features are related to either units’segment descriptors, unit’s cat-egory descriptors, symbolic and score descriptors, signal descriptors, perceptual descrip-tors or spectral descriptors. Regarding to previous contributions presented in section3.1.1 ([MMS+10, SMW+04]), only signal descriptors, perceptual descriptors and spectraldescriptors are pertinent in environmental sounds. Thus to achieve a perceptually rele-vant synthesis control, this is the sound descriptors provided by CataRT that have beenselected: loudness, spectral centroid, spectral flatness, mid- and high-frequency energies.Those descriptors are detailed in appendix A.From this descriptor selection, five sets of audio descriptors have been built to controlglobal evolutions of environmental sound textures according to their perceptual weight:
1. loudness ;
2. loudness, spectral centroid ;
3. loudness, spectral centroid, spectral flatness ;
4. loudness, spectral centroid, mid- and high-frequency energies ;
5. loudness, spectral centroid, spectral flatness, mid- and high-frequency energies.
Morphology resynthesis
In order to have realistic environmental sound texture morphology resynthesis, true mor-phologies are extracted from real environmental sound texture recordings. From theanalysis of those original recording pieces, the trajectories of the selected audio descrip-tors (section 3.2.1) are utilized as targets to perform their resynthesis. Thus for each
5light, medium and heavy rain6aspen wind, storm wind, canyon wind, storm wind, hangar wind7light, medium and heavy waves from ocean and lack
11

Parameters Values
trigger mode bow (allows units’ overlap)unit length 250 msunit overlap 125 ms
fade-in, fade-out 125 ms through linear rampselection radius 0.1
number of closest 10neightbour units
Table 3.1: Parameters’ value for environmental sound texture morphology resynthesis
original sound texture morphology a set of five associated resynthesis is created.
In pratice, several resynthesis problems have been encountered. First while concate-nating sound units, sound artefacts are appearing at each unit junction. To solve thisproblem, one can overlap adjacent units. This reduces in a consequent manner soundartefacts but abrupt timbral changes are noticed at the start of each new units. Then afade-in and a fade-out can be applied on played sound units. This results in a smoothermorphology resynthesis.Through this synthesis process another problem has been revealed in the unit selection.When the evolution of successive target positions in the descriptor space are quasi un-changed, the same unit can be repeated successively which introduces another soundartefact. This problem can be partly solved by defining a selection radius and a numberof closest neightbour units to be considered for the unit selection. The selection radiusallows to randomly select an unit in a certain interval around the specified target descrip-tor position. The number of closest neighbour units defines the number of units whichare enable to be selected according to their proximity to a target position in the currentdescriptor space. Those adjustements allows to choose in between several units whilestaying close enough to a target descriptor position.Table 3.1 shows the different parameter values for the CataRT system allowing to makethose adjustements.
3.2.2 Design of the experiment
Participants
Through this perceptual experiment, fifteen test subjects have been asked to evaluatethe similarity between original environmental sound morphologies and their associatedresynthesis. Those participants were volunteer and have not been selected regarding toany personal characteristics. Details about them can be found in appendix B.1.
Materials
As previously mentioned, we choose to work with three sound textures: rain, wind, wave.For each sound texture, five sets of short audio files (≈ 5-9 s) have been created. Each set
12

Figure 3.1: Interface of the perceptual experiment for environmental sound texture resyn-thesis.
is composed of six audio files: one original and five different resynthesis. Those resynthe-sis are built by selecting units within a texture-related corpus according to trajectoriesof different target descriptor sets from their associated original morphology.
To perform this perceptual experiment without background noise annoyance, partic-ipants are seated in a double-walled IAC sound booth. The different sounds are playedwith a couple of loudspeakers8. In order to have a proper sound level through this ex-periment, a sound level calibration is achieved. This calibration is done by adjusting thesound level of a pure tone (1 kHz) to 84.5 dB SPL. This measure is made through a soundlevel meter9 at a potential head position, i.e. at a distance of 50 cm from both speakersand 1.01 m from the floor.
For the purpose of this perceptual experiment, an interface has been implemented inMax/MSP10, see figure 3.1. In this interface a continuous slider for each resynthesis isprovided to evaluate the different morphology resynthesis regarding to their associatedoriginal morphology. On those scales five different graduations have been added to givecategorial marks to test subjects:
very different, significantly different, quite different,slightly different, identical
This type of scoring furnishes a categorial and continuous score for each audio descriptorset used to resynthesize morphologies. Then the mean and the standard deviation for
8YAMAHA MSP5 powered monitor speakers9Brüel & Kjaer 2238 mediator
10http://cycling74.com
13

each of the resynthesis can be calculated over all participants. From those results, oneis able to validate or not the overall resynthesis process thanks to the categorial aspectof these results and to choose the best combination of audio descriptors to control theresynthesis of environmental sound textures thanks to the continuous aspect of thoseresults.
Procedure
Before that participants start this experiment, a short training session has been providedfor each of them. Through this training session, the interface is first presented. After-wards participants are asked to work their own strategy out for evaluating morphologysimilarities through an single training set of morphologies (one original morphology andfive associated resynthesis).
In order to keep test subjects highly concentrated and to avoid confusion throughthe experiment, the number of listening for the resynthesis sounds is limited to threetimes. On the other hand, the original morphologies can be listened as many times astest subjects want.
To reduce the risk of unwanted effects, the presentation order of the different soundtexture resynthesis is randomly chosen: first the presentation order of the different soundtextures is randomized, then for each sound texture the presentation order of the differ-ent morphologies is also randomized, and finally for each morphology sliders are as wellrandomly affected to the different resynthesis.
3.2.3 Results of the experiment
Being interested in finding a pertinent set of audio descriptors to drive the synthesisfor each environmental sound texture, the mean and the standard deviation over allparticipant evaluations are calculated separately for each environmental sound texture.
15 17 18 19 20 15 18 19 20 15 17 18 15 18 15Rain 144.6 126.4 138.7 104.6 25.3
±40.8 ±43.0 ±41.1 ±56.8 ±24.7Wave 108.8 106.2 105.2 100.2 75.2
±48.1 ±45.1 ±48.4 ±47.4 ±38.6Wind 94.8 94.9 86.1 76.1 36.9
±39.8 ±47.3 ±38.8 ±37.1 ±30.4
Table 3.2: Table of the results of the perceptual experiment for each considered soundtexture (rain, wave, wind).
Table 3.2 shows the obtained mean and standard deviation over all participants forthe rain, wave and wind sound textures on a notation scale going from 0 (very different)
14

to 200 (identical). In this table, the different sets of audio descriptors are indicated bytheir descriptor index in CataRT:
15 → loudness ; 17 → spectral flatness ; 18 → spectral centroid19 → high-frequency energy ; 20 → mid-frequency energy
From table 3.2, one can notice that there is a group constituted by three sets of audiodescriptors which seems to be the most perceptually relevant through all consideredtextures:
• 15 17 18 19 20 → loudness, spectral centroid, spectral flatness, mid- and high-frequency energies ;
• 15 18 19 20 → loudness, spectral centroid, mid- and high-frequency energies ;
• 15 17 18 → loudness, spectral centroid and spectral flatness ;
It seems that the considered textures have the same relevant audio descriptor setsto drive their synthesis. Then a global view of their evaluation over all textures can beinteresting, see table 3.3.
15 17 18 19 20 15 18 19 20 15 17 18 15 18 15All textures 116.1 109.2 110.0 93.6 45.8
±47.9 ±47.0 ±48.2 ±49.4 ±38.2
Table 3.3: Table of the results of the perceptual experiment over all considered soundtextures (rain, wave, wind).
From table 3.3 the three audio descriptor sets seems to have been evaluated in anequivalent manner. In order to affirm this hypothesis, one can performed a student’s t-test (see appendix C) to know if their means can be considered as equal. In table 3.4, theresults of the performed student’s t-test of the null hypothesis that data are independentsamples from normal distributions with equal means and equal but unknown variances,are presented.With this method, one is able to know if the null hypothesis is rejeted or not at a certainsignificance level, 5 % in our case. This test is achieved for each possible couple ofdescriptor sets by using the data over all textures.
From those results (table 3.4), one can see that for the couple where only the threebest sets of descriptors are involved in the null hypothesis is accepted. This shows thattheir means and variances can be considered as equal at the 5 % significant level. Thusone can consider that those three audio descriptor sets are equivalent for the resynthesisprocess of environmental sound textures. Regarding to the efficienty of the three best de-scriptor sets, the set 15 17 18 is the best of those three because it uses the fewest numberof audio descriptors compared to the two others. Then to take the set 15 17 18 (loudness,spectral flatness, spectral centroid) for synthesizing environmental sound textures seemsto be a pertinent choice.
15

couples of null
descriptors set hypothesis
15 17 18 19 20 15 18 19 20 accepted
15 17 18 19 20 15 17 18 accepted
15 17 18 19 20 15 18 rejected15 17 18 19 20 15 rejected
15 18 19 20 15 17 18 accepted
15 18 19 20 15 18 rejected15 18 19 20 15 rejected
15 17 18 15 18 rejected15 17 18 15 rejected
15 18 15 rejected
Table 3.4: Table of the T-test results on the perceptual experiment data.
Moreover the mean of the chosen descriptor set over all textures is 110.0 out of 200.This value is above the mean of the notation scale and is situated between the mark-ers quite different and slightly different. Thus one may conclude that the performedresynthesis process driven by the chosen descriptor set is satisfying.
3.3 Conclusion
After that each participant performed the present experiment, a discussion was under-taken to get comments about this experiment.The main drawback highlighted is that the different sounds are too long which involvesan increase in the difficulty of the experiment. Then shorter sound files (less than fiveseconds) should be provided. Another interesting comment has formulated by two ofthe participants: a small and regular sound intensity modulation were perceived along allresynthesis. This problem seems to come from the frequency at which units are launched.Indeed using a linear ramp to achieve the fade-in and the fade-out of each unit can inducethis modulation. To avoid this phenomenon a square-root ramp should be used.
An attempt to validate the resynthesis method has been performed regarding to theoriginal morphologies but nothing has been proposed to evaluate the realism of the resyn-thesis methods. Nevertheless through the ’after-experiment’ discussion, participants saidthat the presented resynthesis are quite realistic in spite of certain sound artefacts intro-duced by the synthesis process.
Another important improvement should be carried out on the proposed audio de-scriptors through this presented selection process. In our case we choose to use audiodescriptors provided by cataRT-1.2.1 which seem to be the closest to the ones proposedby perceptual studies ([MMS+10, SMW+04]). However this audio descriptor adaptationis not really pertinent. One should have avoid to adapt the proposed audio descrip-tors and use them through this selection process. The concerned audio descriptors are:
16

loudness, brightness, perceptual spectral centroid, perceptual spectral spread, harmonic-to-noise ratio, roughness and cleaness. For details about those descriptors, please refer tothe Misdariis et al.’s article, [MMS+10].To achieve this perceptual study in a more conventional way, multidimensional scaling(MDS) techniques should have been used to analyze data from the experiment. Thosetechniques are commonly used in perceptual investigations of complex sound stimuli,[MMS+10, SMW+04, Gre77, MWD+95]. They allow to determine the multidimensionalperceptual space and its corresponding physical space (i.e. audio descriptor space) of theconsidered sound set. Thus perceptually pertinent combinaisons of sound descriptors canbe obtained using MDS. Details on MDS techniques can be found in the articles citedabove.
17

18

Chapter 4
Towards a gestural control of
environmental sound texture
Now that a set of audio features has been found as perceptually relevant to controlenvironmental sound texture synthesis (rain, wave, wind), we want to find out a gesture-to-sound mapping in order to control the evolution of those audio descriptors throughgestures. For this purpose, the relationships between those audio descriptors and gesturalparameters should be revealed.In this chapter, an experiment, inspired by [CBS10], for bringing out the linear parts ofthose relationships is presented. Then the results obtained with it are shown and dis-cussed.
4.1 Introduction
4.1.1 Gesture
In our case, gesture is considered as the motion of one hand to control environmentalsound texture synthesis. This one hand gesture is represented through a set of parame-ters. In their gesture-sound relationship study, Carmiaux et al. [CBS10] are consideringthe following gestural observations: position, velocity, normal acceleration, tangentialacceleration, curvature, radius, torsion. But only the following gesture parameters arefound as pertinent:
position, velocity, normal acceleration
Being interested in revealing either the positional (position), kinetic (velocity) or dynamic(acceleration) aspects of gestures for controlling audio descriptor morphologies, the abovepertinent gestural observations seem to be a good starting point for our attempt.
In order to capture those different aspects of gesture, two commercial devices are used:the Wii Remote Plus1 and the Kinect2. The wii remote embeds intertial sensors and di-
1http://www.nintendo.com/wii/console/controllers2http://www.xbox.com/en-US/Xbox360/Accessories/Kinect/Home
19

rectly streams reconstructed accelerations and orientations in a relative three-dimensionspace via bluetooth. This bluetooth communication is then translated into an OSC proto-col3 by the Osculator system4. This makes possible to use the provided data flow throughthe software Max. In our purpose, this device is used to retrieve the dynamic aspect ofthe hand motion and the positional and kinetic aspects of the hand rotation. The kinectis a webcam which furnishes a rgb image flow with its associated depth maps at a framerate of 30 Hz via a USB connector. To grab those images from the software Max, onecan utilize the external object jit.freenect.grab5 which makes use of the OpenKinectproject’s libfreenect library6. From the provided depth maps one is able to track the handpositions in the video frames under certain conditions. In our case participants are askedto face the kinect and to keep their hand in front of their body. Moreover their handshould roughly stay in a plane perpendicular to the central axis of the webcam. Underthose conditions, the hand position can be tracked by detecting and tracking the closestblob7 through depth maps provided by the kinect. This tracking process is implementedin Max software using the computer vision for jitter library, cv.jit-1.7.2 8. This allowsto obtain the position and then the velocity of the user’s hand in a two-dimensional space.Then this device is used to obtain the positional and kinetic aspect of the user’s handmovement.
The following list sums up the different gestural features which can be calculated withthe above setup:
• wii mote
horizontal, vertical, depth- and absolute9 hand’s accelerationhorizontal, vertical, depth- and absolute10 hand’s angle
horizontal, vertical, depth- and absolute11 hand’s anglular velocity
• kinect
horizontal, vertical and absolute12 hand’s positionhorizontal, vertical and absolute13 hand’s velocity
An illustration of this setup is shown in figure 4.1.
3http://archive.cnmat.berkeley.edu/OpenSoundControl4http://www.osculator.net5version ’Release Candidate 3’, provided by Jean-Marc Pelletier - http://jmpelletier.com/freenect6https://github.com/OpenKinect/libfreenect7region in images that have different characteristics compared to its surrounding8http://jmpelletier.com/cvjit9accabs =
�acc2
hor + acc2ver + acc2
dep
10angabs =�
ang2hor + ang2
ver + ang2dep
11aveabs =�
ave2hor + ave2
ver + ave2dep
12posabs =�
pos2hor + pos2
ver13velabs =
�vel2
hor + vel2ver
20
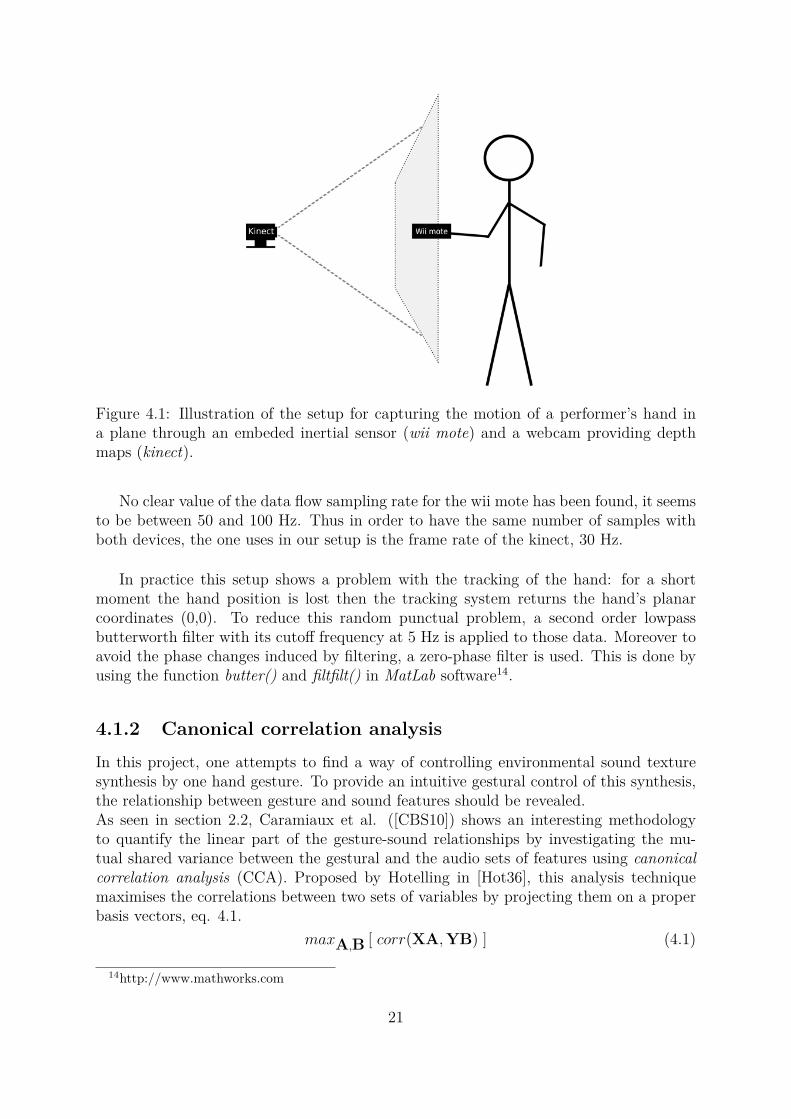
Figure 4.1: Illustration of the setup for capturing the motion of a performer’s hand ina plane through an embeded inertial sensor (wii mote) and a webcam providing depthmaps (kinect).
No clear value of the data flow sampling rate for the wii mote has been found, it seemsto be between 50 and 100 Hz. Thus in order to have the same number of samples withboth devices, the one uses in our setup is the frame rate of the kinect, 30 Hz.
In practice this setup shows a problem with the tracking of the hand: for a shortmoment the hand position is lost then the tracking system returns the hand’s planarcoordinates (0,0). To reduce this random punctual problem, a second order lowpassbutterworth filter with its cutoff frequency at 5 Hz is applied to those data. Moreover toavoid the phase changes induced by filtering, a zero-phase filter is used. This is done byusing the function butter() and filtfilt() in MatLab software14.
4.1.2 Canonical correlation analysis
In this project, one attempts to find a way of controlling environmental sound texturesynthesis by one hand gesture. To provide an intuitive gestural control of this synthesis,the relationship between gesture and sound features should be revealed.As seen in section 2.2, Caramiaux et al. ([CBS10]) shows an interesting methodologyto quantify the linear part of the gesture-sound relationships by investigating the mu-tual shared variance between the gestural and the audio sets of features using canonicalcorrelation analysis (CCA). Proposed by Hotelling in [Hot36], this analysis techniquemaximises the correlations between two sets of variables by projecting them on a properbasis vectors, eq. 4.1.
maxA,B [ corr(XA, YB) ] (4.1)
14http://www.mathworks.com
21

where A and B are the two projection matrices maximising the correlations between theprojected variables. X and Y are the two matrices representing the two sets of variableswith their variables (resp. observations) along the columns (resp. rows). These twomatrices must have the same number of observations but they can have different numbersof variables. The projected variables, XA and YB, are called canonical variates and thestrength between two canonical variates is given by the canonical correlation. From thecanonical correlation, one can examine the importance of the relationship between twocanonical variates. Then in order to determine the involvement of each original variablein the different associated canonical variates, their canonical loading can be expressed.Canonical loadings measure the correlation between variables of the original set and theircorresponding projections, eq. 4.2.
LX = corr(X, XA) (4.2)
Thus from those values, canonical correlations and canonical loadings, one can ob-tained a measure of the linear relationship between gesture and sound features. Eventhough this techniques shows limitations, it can be used as a selection tool for guidingthe creation of a pertinent gesture-sound mapping.
More details about this analysis technique can be found in [HSST04].
4.2 Experiment
Being interested in controlling the synthesis of environmental sound textures by gesture,an experiment allowing to study gesture-sound relationships through CCA is built. Thisexperiment is highly inspired to the one presented in [CBS10].
4.2.1 Experiment protocol
For this experiment eight subjects are invited to perform one-hand movements while lis-tening to nine different sound extracts. Those sound extracts are environmental soundtexture morphology resynthesis driven by the chosen set of audio descriptors (loudness,spectral flatness, spectral centroid) coming from the perceptual similarity of environmen-tal sound texture resynthesis. For each studied category of environmental sound textures(rain, wave, wind), three sound morphologies have been arbitrary chosen. Their durationis between 5 and 9 seconds. For each presented sound extract participants are askedto imagine an one-hand gesture which could control its sound synthesis process. Afteran arbitrary number of rehearsals, participants perform three times their imagined ges-ture listening to the corresponding sound extract. Those final three performances arerecorded. This results in a data set of gestural control imitation for each environmentalsound texture synthesis.
In order to play the different sound extracts and record the gesture data, a Maxpatch is implemented. An audio-visual signal is provided to performers for helping themto synchronize their gesture with the different sounds. Once the user is ready to performhis/her gesture, he/she launches a metronome (1 Hz) which beeps twice with a red flash
22

before the sound starts. Then, following the same rhythm, a green light (without soundbeep) is switched on when the sound is played until its playback is finished.
From this experiment, gesture data sets related to sound are obtained. As seen intable 3.1, a new sound unit of 250 ms is played every 125 ms through the synthesisprocess. Then the different sounds are analysed through non-overlapping windows of 125ms to get the global evolutions of its perceptually relevant audio descriptors. Thus thesampling rate of those sound data sets is 8 Hz. For achieving a CCA, the sampling rateof both data sets (sound and gesture-related data sets) should be the same. Then thesound data sets are resampled at the gesture data’s sampling rate: 30 Hz.
4.2.2 Experiment results
4.2.3 Choice of gesture descriptors
In CCA, the choice of the input variables can change significantly the obtained results.The more numerous the input variables, the higher the resulting correlation between thetwo sets of variates. Nevertheless by adding variables, one can easily loose the pertinenceof this correlation measure. Then in order to minimise the dimensionality of the gesturaldata keeping a global representation of performed gestures, one can take only the fiveabsolute parameters of gesture. By taking only absolute parameters, the gesture is as-sumed to be independent from direction. Since gravity and the distance to the floor canbe considered as strong references for performers, we decide to use the horizontal andvertical position in our analysis instead of the absolute position.Then the chosen set of one-hand gesture features is constituted by horizontal position,vertical position, absolute velocity, absolute angle, absolute angular velocity and absoluteacceleration.
4.2.4 Sound-gesture relationships
Now that sets of audio descriptors (sec.3.2.3) and gesture features (sec.4.2.3) have beenchosen, an analysis of the sound-gesture relationships can be achieved.
For this purpose, only performances showing at least one of their canonical correla-tion coefficients superior to 0.7 through CCA are kept as relevant results. Over the 216experimental results (72 for each sound texture) only 94 (43.5 %) of them are consideredas relevant. Through those 94 relevant performances, 9 (12.5 %) have been performedon the rain sound texture, 42 (58.3 %) on the wave one and 43 (59.7 %) on the windone. For rain sound texture, the 9 gesture performances expressing a strong correlationwere all achieved on the same sound extract. Through wave sound texture, 21 relevantgesture performances were achieved on one of the sound extract and the other 21 oneson another sound extract. For wind sound texture, relevant performances has been doneon each sound extracts, 18 on one of them, 16 on another one and 9 on the remaining one.
From this result selection, one can see that results about sound-gesture relationshipsfor rain texture are quite poor, i.e. only few strong correlations between sound and ges-
23

Figure 4.2: Representation of the canonical correlation strength and the canonical load-ings for all relevant performances over all sound textures and participants (94 soundextracts). Lo: loudness, SF: spectral flatness, SC: spectral centroid. HP: horizontal posi-tion, VP: vertical position, Ve: absolute velocity, Ac: absolute acceleration, An: absoluteangle, AV: absolute angular velocity.
ture have been revealed. Nevertheless for the two other sound textures, wave and wind,the obtained results are a way better. More than half of them are found as relevant.
As seen previously in section 4.1.2, gesture and sound loadings should be studiedto investigate relationships between the different audio and gesture features according totheir associated canonical correlation strength. Those values for all relevant performancesover all sound textures and participants are shown in figure 4.2.
From figure 4.2, it can be seen that no clear relationship between sound and gestureparameters are highlighted: despite a strong first canonical correlation coefficient and astrong sound loading for loudness, all corresponding gestural loadings achieves low cor-relation and none of them can be distinguished regarding the others. This means thatparticipants are not using the same control strategy through their gesture and/or for dif-ferent sound textures the strategy of sound control are not similar. Nevertheless one cannotice loudness is the perceptual audio descriptor that participants are following firstly.Then it can be interesting to specify our study to reveal sound-gesture relationships for
24

Figure 4.3: Representation of the canonical correlation strength and the canonical load-ings for all relevant performances over all wind textures and participants (43 perfor-mances). Lo: loudness, SF: spectral flatness, SC: spectral centroid. HP: horizontal posi-tion, VP: vertical position, Ve: absolute velocity, Ac: absolute acceleration, An: absoluteangle, AV: absolute angular velocity.
a particular sound texture.
Figure 4.3 shows the obtained gesture-sound relationships over all participants butjust for wind sound texture which is the most successfull among the proposed soundtextures with 43 relevant performances. Again, no clear sound-gesture relationship arebrought out. The only assumption which can be proposed by watching figure 4.3 is thatloudness is not related to vertical position. This confirms that participants do not performthe same control strategy while listening to a specific sound texture and/or performerschange their strategy from one sound extracts to another one.
To continue on this way, figure 4.4 illustrates the obtained gesture-sound relation-ships over all participants for a single sound extract of wave texture which is one of themost successfull one regarding to all proposed sound extracts (21 relevant performances).From figure 4.4 a tendancy in sound-gesture relationships is shown: loudness seems to berawly related to kinectic and dynamic aspects of the hand’s movement (absolute veloc-
25
Figure 4.4: Representation of the canonical correlation strength and the canonical load-ings for all relevant performances of a single wave sound texture extract over all partic-ipants (21 performances). Lo: loudness, SF: spectral flatness, SC: spectral centroid. HP:horizontal position, VP: vertical position, Ve: absolute velocity, Ac: absolute acceleration,An: absolute angle, AV: absolute angular velocity.
ity, absolute acceleration and absolute angular velocity). Nevertheless figure D.1, placedin appendix D, shows that a positional aspect of gesture (horizontal position) could beinvolved in the control strategy of loudness. Then the above tendancy for wave soundtexture is not really generalised to others sound textures for all participants.
Another attempt to find a way of showing tendancies in sound-gesture relationshipsis done by analysing performances of a participant through the different sound extractsof the same sound texture. Figures D.2 and D.3 placed in appendix D, illustrate therevealed gesture-sound relationships over the different proposed sound extracts for thewind sound texture through relevant performances of two participants. From them, itcan be seen that the control strategy is changing with the participant. But each partic-ipant keeps more or less the same strategy for each sound texture. For the participant2, the strategy control of loudness is essentially done through positional aspect with thehorizontal position gestural feature. On the other side, the participant 6 chooses mainlythe kinetic aspect of gesture for his control strategy of loudness: absolute velocity of the
26
hand movement.
4.3 Discussion and conclusion
Being interested in controlling environmental sound texture synthesis, an experiment toobtained sound and gesture-related is built. Based on a preliminary study on the rele-vant perceptive audio features, this experiment consists in inviting participants to per-form one-hand’s movements while listening to environmental sound texture morphologies(rain, wave, wind). Afterwards CCA technique is used to retrieve the linear part of thecomplex gesture-sound relationship in two steps: first based on the canonical correlationsa selection of pertinent gesture features is achieved, then the analysis of the correlationbetween the selected gesture features and the audio descriptors is performed.
Through this analysis process, no generalization about sound-gesture relationshipsover all participants has been achieved. The resulting sound-gesture correlations are spe-cific to each participant and to each sound texture.
Through discussions with participants, imitation of control of rain sound texture hasbeen found as a really hard task. They find this texture too monotonic in a high level ofrepresentation with a lot of details in a low one. This were confusing the participants.Thus one of the participant told us that the inertial capture system is too contrainingand restrain the expressiveness of the participant because she wanted to use her finger forcontrolling fine details of the sound texture, especially for rain and wind. Then anothercapture system letting the hand and its fingers free should be provided for this kind ofexperiments
By observing the different participants performing this task, numerous problem havehighlighted. First participants have been in trouble to synchronize their gesture on theplayed sound extract. This is due to the length of the different sound extracts, they aretoo long with too many sound changes in it. Several times participants were surprizedby sound events and then tried to hold back or accelerate their gesture to match withthe playback sound. Thus performers were more into a gestural illustration strategy ofthe sound than into a control strategy. To reduce this problem, a second step in theexperiment is needed. A proposition for this task is that participants should try theproposed CCA-mapping (from the previous experiment) to reproduce a specific soundtexture morphology or just freely and then tune this gesture-sound mapping to fit withwhat they feel intuitive.
Anyway, the presented method can be used to guide a performer through his/hercreation of a personal gesture-to-sound mapping.
27

28
Chapter 5
Texture descriptor development
As seen in the previous chapter, rain texture is quite problematic for performers thoughthe gesture-related-to-sound experiment. After discussions with the experiment’s partic-ipants, one could conclude that rain texture morphologies are monotonic on a high-levelof representation. While performing gesture on rain texture almost all participants wereshaking their hand. They were more interested in controlling the fine texture detailscomposed of water drop impacts. For this purpose, audio descriptors should be createdto describe impact characteristics such as impact rate, impact rate variance, impact am-plitude, impact amplitude variance in order to be able to discriminate different types ofrain, for example light rain, medium rain and heavy rain. Then those descriptors shouldbe perceptually relevant.
Through this chapter an investigation on an impact rate descriptor is carried out.
5.1 Impact rate descriptor
An impact is characterized by an abrupt increase in the energy profile of the sound signal.Based on this definition, a method for computing an impact rate descriptor is proposed.This method is partly inspired from [OE04].
5.1.1 Method description
In this part the succesive steps to achieve the calculation of our impact rate descriptorare presented.
Instantaneous energy The total instantaneous energy is derived by taking the squareof the waveform signal:
Einst[n] = (s[n])2 (5.1)
where n the index of the temporal sample.
Envelop The signal envelop can be obtained by low-pass filtering the instantaneousenergy. To do so, one can convoluate this latter by a Hamming window of 5 ms duration.
29

This process describes a low-pass filter with a cut-off frequency at 132 Hz.
Env[n] = (Einst ∗ Hamming)[n] (5.2)
Framification Afterwards the obtained signal is cut into frames of 250 ms durationwith a overlap of 50 % according to the parameter of our synthesis process (see table3.1).
Impact detection In order to detect impacts in the different frames, peaks are localizedthrough the signal envelop.
PicLoc[k, i] = {(Env[k, i] − Env[k, i − 1]) > 0}&{(Env[k, i + 1] − Env[k, i]) < 0} (5.3)
where k the frame index, i the sample index of the associated frame with 2 ≤ i ≤ N andN the sample number of a frame.Once peaks are localized a threshold is applied to keep only consistent ones. This thresh-old is equal to twice the mean of the associated frame. In order to make this selectionmore robust to noise another condition should be fullfilled. If a consistent peak is found,at least another peak should be present in the following 0.5 ms. Then to avoid multipleimpact detections a retriggering delay, 10 ms, is observed before allowing any new impactdetection, [OE04].
Impact rate Thanks to theprevious impact detection, one is able to count the numberof impacts per frame and thus to derive a measure of the impact rate.
ImpactRate[k] = Nimpacts[k] · Fs
Nsamples[k] (5.4)
where Nimpacts[k] the number of retrieved impacts in the kth frame, Nsamples[k] the number
of samples in the kth frame and Fs the sampling frequency of the signal.
5.1.2 Evaluation of impact rate
Creation of evaluation audio files
To evaluate the present method, a set of evaluation audio files is created. First fourdifferent single rain drops are extracted from real rain sound extracts (from SoundIdeasdatabase). Then from those single rain drops, a matlab program has implemented tocreate audio files in which those drops are repeated at a certain frequency. This is thedifferent used frequency values: 1, 2, 3, 4, 5, 7, 10, 15, 20, 30, 40, 50, 60, 70, 80, 90, 100,110 Hz. An additional audio file is created with a frequency repetition varying from 3 Hzto 80 Hz. Moreover in order to see the noise sensibility of the method, a gaussian noiseis added to the obtained audio files. Its amplitude is set to have, for each obtained audiofiles, different signal-to-noise ratio: −10, −5, 0, 5 and 10 dB. In total, a set of 380 audiofiles is created.
30

Signal-to-noise ratio [dB]−10 −5 0 5 10
Freq
uenc
yR
epet
ition
[Hz]
1 100 100 100 100 1002 100 100 100 100 1003 100 100 100 100 1004 100 100 100 100 1005 100 100 100 100 1007 100 100 100 100 10010 100 100 100 100 10015 99 100 100 100 10020 91 100 100 100 10030 34 100 100 100 10040 4 99 100 100 10050 0 85 100 100 10060 0 53 100 100 10070 0 17 99 100 10080 0 3 91 95 9590 0 1 86 100 100100 0 0 52 76 75110 0 0 26 63 67
3 − 80 61 100 100 100 100
Table 5.1: F-measure of the presented impact rate measure, in [%], for each combinationof frequency repetition and signal-to-noise ratio.
Evaluation
To evaluate the present method, one can derive the F-measure:
Fmeasure = 2 · precision · recall
precision + recall(5.5)
where precicion is equal to |{trueImpact} ∩ {retrievedImpact}|/|retrievedImpact| andrecall is equal to |{trueImpact} ∩ {retrievedImpact}|/|trueImpact|. An interval errorof ±2.5 ms is allowed while achieving the intersection between the true impacts and theretrieved ones. Table 5.1 shows the obtained results with this evalutaion technique.
Through the presented tables, one can see that the measure does not induce errorsfor the frequency rates from 1 Hz to 10 Hz. Afterwards from 15 to 90 Hz proper resultsare achieved for a signal-to-noise ratio is superior to 0 dB. Then for superior repetitionfrequencies the results get poor, this is due to the retriggering delay which is equal to 10ms implying then a limit about 100 Hz regarding the possible detectable impact repetitionfrequency.
31
5.2 Conclusion
The presented impact rate descriptor gives satisfying results according to the performedF-measure. Despite the simplicity of this implementation, numerous parameters are in-volved in it and some of them induces limitations (for example the retriggering delay).Those parameters have been rawly adjusted by a heuristic approach. Then for continuingthis audio descriptor investigation, one should find a way to reduce the number of pa-rameters for computing this descriptor and to pertinently adjust the different parameters.Moreover the method to get this descriptor can be seen as an onset detection technique.This similarity between our descriptor and onset descriptor techniques shows that ourdescriptor expresses more a physical measure than a perceptual one. Then perceptualexperiment should be carried out in order to evaluate this impact rate descriptor.
This descriptor can be interesting for characterizing other impact sound textures suchas fire, electric crackle, coffee grinder...
32

Chapter 6
Conclusion
Through this project, a methodology to guide the construction of a mapping for control-ling environmental sound textures (rain, wave, wind) through one-hand gesture has beendeveloped.Based on previous contributions, a perceptual experiment is carried out in order to findan efficient and perceptually relevant set of audio descriptors for controlling corpus-basedconcatenative synthesis process of environmental sound textures. From this experiment,the audio descriptor set composed of loudness, spectral flatness and spectral centroid arerevealed as the most efficient and pertinent set of audio descriptors to use for controllingthe environmental sound texture synthesis. Moreover through this perceptual experi-ment our overall synthesis process for environmental sound textures has been consideredas satisfying regarding to the obtained results.Afterwards an explorative experiment where participants are asked to perform one-handgestures pretending that their motions would create the sounds they hear. Through thisexperiment a set of sound and gesture-related features are obtained. Then by applyingCCA to those obtained data, the linear part of gesture-sound relationships can be re-vealed. From this analysis, first, we noticed that this gesture-sound experiment is notadapted to rain textures. For the two others studied sound textures, wave and wind,significant correlations are expressed. Those two studies show that there is one of theaudio descriptors, loudness, which is mainly followed by the participants through theirgesture. Nevertheless no common gesture-sound relationship over all participants andsound textures is highlighted. Then we decide to focuse this analysis technique on par-ticular participant over sound extracts coming from a single sound texture. From thisattempt correlations between gesture and sound are figure out. But those correlations arespecific to participants. Thus no generalization about gesture-to-sound mappings overall participants and all sound textures can be done. However the presented methodologycan be used for guiding the construction of personal gesture-to-sound mappings.
In future works, sets of perceptually relevant descriptors specific to the different cat-egories of sound textures (periodic, stochastic or both) should be retrieved. This shouldallow more apropriated control of environmental sound texture synthesis. Moreover anextended and less-constraining gesture capture system should be provided to performers.A full 3D hand tracking system allowing to capture the motion of the user’s two handsand also his/her finger’s motion in order to propose several independent levels of control
33

through gestures should be developed. In addition through our gesture-sound experi-ment, we noticed that participants were mainly and almost only following the loudnesscontour of the sound extracts. Thus for futur experiments, participants with a strongmusical background should be chosen in order to make more than one sound descriptorto be followed by participants.
34
Bibliography
[AE03] Marios Athineos and Daniel P. W. Ellis. Sound texture modelling withlinear prediction in both time and frequency domains. In Proc. ICASSP,pages 648–651, 2003.
[Alv05] Noë Alva. Action in Perception. Massachusetts Institute of TechnologyPress, Cambridge, USA, 2005.
[Ber97] Alain Berthoz. Le Sens du Mouvement. Odile Jacob, Paris, France, 1997.
[BJDEY+99] Z. Bar-Joseph, S. Dubnov, R. El-Yaniv, D. Lischinski, and M. Werman.Statistical learning of granular synthesis parameters with applications forsound texture synthesis. In Proceedings of the 1999 International ComputerMusic Conference (ICMC), pages 178–181, 1999.
[BMS05] Frédéric Bevilacqua, Remy Müller, and Norbert Schnell. Mnm: a max/mspmapping toolbox. In New Interfaces for Musical Expression, pages 85–88,Vancouver, Mai 2005.
[BWL08] Ross Bencina, Danielle Wilde, and Somaya Langley. Gesture ≈ soundexperiments: Process and mappings. In Proc. of the 2008 Int. Conf. onNew Interfaces for Musical Expression (NIME08), 2008.
[Car04] M. Cardle. Automated sound editing. Technical report, Computer Labo-ratory, University of Cambridge, UK, 2004.
[CBS10] Baptiste Caramiaux, Frédéric Bevilacqua, and Norbert Schnell. Towardsa gesture-sound cross-modal analysis. In Gesture in Embodied Commu-nication and Human-Computer Interaction: LNAI 5934, pages 158–170.Springer Verlag, 2010.
[Coo07] P. Cook. Din of an iquity: Analysisand synthesis of environmentalsounds. In Proceedings of the International Conference on Auditory Display(ICAD2007), pages 167–172, 2007.
[DBJEY+02] S. Dubnov, Z. Bar-Joseph, R. El-Yaniv, D. Lischinski, and M. Werman.Synthesizing sound textures through wavelet tree learning. IEEE ComputerGraphics and Applications, 22(4):38–48, 2002.
[FA05] J. Filatriau and D. Arfib. Instrumental gestures and sonic textures. In Pro-ceedings of the International Conference on Sound and Music Computing(SMC), 2005.
35

[FAC06] J. Filatriau, D. Arfib, and J. Couturier. Using visual textures for sonictextures production and control. In Digital Audio Effects (DAFx), 2006.
[FH09] Martin Fröjd and Andrew Horner. Sound texture synthesis using anoverlap-add/granular synthesis approach. Journal of the Audio EngineeringSociety, 57:29–37, 2009.
[Fin09] N. Finney. Autonomous generation of soundscapes using unstructuredsound databases. Master’s thesis, MTG, IUA-UPF, Barcelona, Spain, 2009.
[Gre77] J M Grey. Multidimensional perceptual scaling of musical timbres. Journalof the Acoustical Society of America, 61(5):1270–1277, 1977.
[Gui08] Sandro Guidati. Auralisation and psychoacoustic evaluation of traffic noisescenarios. Acoustical Society of America Journal, 123:3027, 2008.
[Hos02] R. Hoskinson. Manipulation and Resynthesis of Environmental Sounds withNatural Wavelet Grains. PhD thesis, The University of British Columbia,2002.
[Hot36] Harold Hotelling. Relations between two sets of variates. Biometrika,28(3/4):321–377, 1936.
[HP01] R. Hoskinson and D. Pai. Manipulation and resynthesis with natural grains.In Proceedings of the International Computer Music Conference (ICMC),pages 338 – 341, Havana, Cuba, 2001.
[HSST04] David R. Hardoon, Sándor Szedmák, and John Shawe-Taylor. Canonicalcorrelation analysis: An overview with application to learning methods.Neural Computation, 16(12):2639–2664, 2004.
[KKA+02] Evelyne Kohler, Christian Keysers, M. Aless, Ra Umiltà, Leonardo Fogassi,Vittorio Gallese, and Giacomo Rizzolatti. Hearing sounds, understandingactions: action representation in mirror neurons. Science, pages 846–848,2002.
[KP10] Stefan Kersten and Hendrik Purwins. Sound texture synthesis with hiddenmarkov tree models in the wavelet domain. In Sound and Music ComputingConference, Barcelona, Spain, 2010.
[LGDM08] Mathieu Lagrange, Bruno L Giordano, Philippe Depalle, and StephenMcAdams. Objective quality measurement of the excitation of impactsounds in a source/filter model. Acoustical Society of America Journal,123(5):3746, 2008.
[LLZ04] Lie Lu, Wenyin Liu, and Hong-Jiang Zhang. Audio textures: theory andapplications. IEEE Transactions on Speech and Audio Processing, 12:156–167, 2004.
36

[MDOS09] J.H. Mc Dermott, A.J. Oxenham, and E. Simoncelli. Sound texture syn-thesis via filter statistics. In Proceedings IEEE Workshop on Applicationsof Signal Processing to Audio and Acoustics, Mohonk NY, 2009.
[MG03] Thomas Metzinger and Vittorio Gallese. The emergence of a shared ac-tion ontology: building blocks for a theory. Consciousness and Cognition,12(4):549–571, 2003.
[MLS+08] Emma Murphy, M. Lagrange, Gary Scavone, Philippe Depalle, and Cather-ine Guastavino. Perceptual evaluation of a real-time synthesis techniquefor rolling sounds. In Proceedings of Enactive ’08, Pisa, Italy, 2008.
[MMS+10] Nicolas Misdariis, Antoine Minard, Patrick Susini, Guillaume Lemaitre,Stephen McAdams, and Etienne Parizet. Environmental sound percep-tion: Metadescription and modeling based on independent primary studies.Eurasip Journal on Audio, Speech, and Music Processing, 2010:1–27, 2010.
[MWD+95] Stephen McAdams, Suzanne Winsberg, Sophie Donnadieu, Geert De Soete,and Jochen Krimphoff. Perceptual scaling of synthesized musical timbres :Common dimensions, specificities, and latent subject classes. PsychologicalResearch, 58:177–192, 1995.
[OE04] M. Sile O’Modhrain and Georg Essl. Pebblebox and crumblebag: Tactileinterfaces for granular synthesis. In NIME, pages 74–79, 2004.
[OSG02] James F. O’Brien, Chen Shen, and Christine M. Gatchalian. Synthesiz-ing sounds from rigid-body simulations. In The ACM SIGGRAPH 2002Symposium on Computer Animation, pages 175–181. ACM Press, 2002.
[PB04] J. Parker and B. Behm. Creating audio textures by exmple: tiling andstitching. In Proceedings of IEEE International Conference on Acoustics,Speech, and Signal Processing (ICASSP ’04), volume 4, 2004.
[PTF09] Cécile Picard, Nicolas Tsingos, and François Faure. Retargetting examplesounds to interactive physics-driven animations. In AES 35th InternationalConference on Audio for Games, 2009.
[SA95] Nicolas Saint-Arnaud. Classification of sound textures. Master’s thesis,Massachusetts Institute of Technology, 1995.
[SaP95] Nicolas Saint-arnaud and Kris Popat. Analysis and synthesis of soundtextures. In Readings in Computational Auditory Scene Analysis, pages125–131, 1995.
[SBVB06] Diemo Schwarz, Grégory Beller, Bruno Verbrugghe, and Sam Britton. Real-time corpus-based concatenative synthesis with catart. In 9th InternationalConference on Digital Audio Effects (DAFx), pages 279–282, Montreal,Canada, Septembre 2006.
37
[SCB08] Diemo Schwarz, Roland Cahen, and Sam Britton. Principles and appli-cations of interactive corpus-based concatenative synthesis. In Journéesd’Informatique Musicale (JIM), Albi, France, Mars 2008.
[Sch06] Diemo Schwarz. Concatenative sound synthesis: The early years. Journalof New Music Research, 35-1:3–22, 2006.
[Sch07] Diemo Schwarz. Corpus-based concatenative synthesis : Assembling soundsby content-based selection of units from large sound databases. IEEE SignalProcessing, 24-2:92–104, 2007.
[Sch11] Diemo Schwarz. State of the Art in Sound Texture Synthesis. In DAFx,Paris, France, 2011.
[Sci99] Agostino Di Scipio. Synthesis of environmental sound textures by iteratednonlinear functions. In Proceedings of the 2nd COST G-6 Workshop onDigital Audio Effects (DAFx99), pages 109–117, 1999.
[sit11] Topophonie’s presentation. http://www.topophonie.fr/apropos, 2010-2011.
[SMW+04] P. Susini, S. McAdams, S. Winsberg, I. Perry, S. Vieillard, and X. Rodet.Characterising the sound quality of air-conditiong noise. Applied Acoustics,2004.
[SS10] Diemo Schwarz and Norbert Schnell. Descriptor-based sound texture sam-pling. In Sound and Music Computing (SMC), pages 510–515, Barcelona,Spain, Juillet 2010.
[Str07] Gerda Strobl. Parametric sound texture generator. Master’s thesis, Uni-versität für Musik und darstellende Kunst, Graz; Technische UniversitätGraz, 2007.
[Ver10] Charles Verron. Synthèse immersive de sons d’environnement. PhD thesis,Université Aix-Marseille I, 2010.
[VTR91] Francisco Varela, Evan Thompson, and Eleanor Rosch. The embodied mind:cognitive science and human experience. Massachusetts Institute of Tech-nology Press, Cambridge, USA, 1991.
[Wan02] Marcelo Wanderley. Mapping strategies in real-time computer music. Or-ganised sound, 7(2), 2002.
[ZW04] X. Zhu and L. Wyse. Sound texture modeling and time-frequency lpc.Digital Audio Effects (DAFx), 4, 2004.
38

Appendix A
Perceptually relevant audio
descriptors for environmental sound
Loudness
L[m] = 10 · log10(�N
n=1 x[m, n]2N
) (A.1)
where x the waveform of the signal, m the frame index, n the relative sample index andN the number of samples in the current frame.
Spectral centroïd
SC[n] =k2�
k=k1
fk · |X[k, n]|�k2
k=k1 |X[k, n]|(A.2)
where n the current frame index, k the frequency bin index, X[k, n] the complex sig-nal magnitude of the frequency bin k for the current frame and fk the frequency valueof the k
th frequency bin. In CataRT, the default values for k1 and k2 are respectivelycorresponding to the frequency values 44 and 3014 Hz.
Mid- and High-frequency energy
E[n, k1 → k2] =�k2
k=k1 X[k, n]2Nfft
(A.3)
where n the current frame index, k the frequency bin index, X[k, n] the complex signalmagnitude of the frequency bin k for the current frame and Nfft the number of frequencybins. In CataRT, the default values for k1 and k2 are respectively corresponding to thefrequency values:
• 44 and 1033 Hz for the mid-frequency energy,
• 4996 and 10034 Hz for the high-frequency energy.
39

Spectral flatness
SF [n] =(�k2
k=k1 |X[n, k]|)1/(k2−k1+1)
1k2−k1+1
�k2k=k1 |X[n, k]|
(A.4)
where n the frame index, k the frequency bin index, X[k, n] the complex signal magnitudeof the frequency bin k for the n
th frame and fk the frequency value of the kth frequency
bin. In CataRT, the default values for k1 and k2 are respectively corresponding to thefrequency values 1507 and 8613 Hz.
40

Appendix B
Details on participants
B.1 For the similarity perceptual study on environ-
mental texture morpholigy resynthesis
test persongender age
expert inmusician
experiment
index sound domain duration
0 m 22 yes yes 41 min1 m 25 yes yes 16 min2 m 26 yes yes 23 min3 f 30 no no 44 min4 m 27 yes no 39 min5 f 25 yes no 35 min6 m 22 yes yes 32 min7 m 25 yes yes 44 min8 m 25 yes yes 20 min9 m 22 yes yes 36 min10 m - yes yes 29 min11 m 22 yes yes 35 min12 m 31 yes no 33 min13 f 27 yes no 18 min14 m 27 no no 31 min
Table B.1: Details on the test persons which participates in the similarity perceptualstudy on environmental texture morpholigy resynthesis.
41

B.2 For the gesture-sound relationship study
test persongender age
expert inmusician dancer
index sound domain
0 m 22 yes yes no1 m 22 yes yes no2 f 27 yes no yes3 m 27 yes no no4 m 25 yes yes no5 f 25 yes no no6 m 25 yes yes no7 m - yes yes no
Table B.2: Details on the test persons which participates in the gesture-sound relationshipstudy.
42

Appendix C
Two sample t-test
Null hypothesis
In our case the null hypothesis is that data in two independent vectors, x and y, of randomsamples from normal distributions with equal means and equal but unknown variancesregarding a certain significance level (5% in our case), against the alternative that themeans are not equal.
T-statistic
t = x − y
s
�1
nx+ 1
ny
(C.1)
s =
����(nx − 1)s2x + (ny − 1)s2
y
nx + ny − 2 (C.2)
where x and y the respective sample means, ny and nx the respective sample numbers,sx and sy the respective sample standard deviations of the two sample vectors x and y.
Criterion
From table of critical value of t-distribution, the critical value for our test is 1.0 accordingto the degree of freedom (i.e. (nx +ny −2), 448 in our case) and the significance level,5 %.
If t is inferior to the critical value, the null-hypothesis is accepted: the means can beconsidered as equal. Otherwise, the null-hypothesis is rejected: the means are not equal.
43

44

Appendix D
More CCA results
Figure D.1: Representation of the canonical correlation strength and the canonical load-ings for all relevant performances of a single wind sound texture extract over all partic-ipants (16 performances). Lo: loudness, SF: spectral flatness, SC: spectral centroid. HP:horizontal position, VP: vertical position, Ve: absolute velocity, Ac: absolute acceleration,An: absolute angle, AV: absolute angular velocity.
45

Figure D.2: Representation of the canonical correlation strength and the canonical load-ings over all relevant performances (8 performances) on the different sound extracts ofwind texture for one participant (subject 2). Lo: loudness, SF: spectral flatness, SC:spectral centroid. HP: horizontal position, VP: vertical position, Ve: absolute velocity, Ac:absolute acceleration, An: absolute angle, AV: absolute angular velocity.
46

Figure D.3: Representation of the canonical correlation strength and the canonical load-ings over all relevant performances (7 performances) on the different sound extracts ofwind texture for one participant (subject 6). Lo: loudness, SF: spectral flatness, SC:spectral centroid. HP: horizontal position, VP: vertical position, Ve: absolute velocity, Ac:absolute acceleration, An: absolute angle, AV: absolute angular velocity.
47