Towards a generalized team task complexity model
150
Louisiana State University LSU Digital Commons LSU Doctoral Dissertations Graduate School 2006 Towards a generalized team task complexity model Ashok Darisipudi Louisiana State University and Agricultural and Mechanical College, [email protected] Follow this and additional works at: hps://digitalcommons.lsu.edu/gradschool_dissertations Part of the Engineering Science and Materials Commons is Dissertation is brought to you for free and open access by the Graduate School at LSU Digital Commons. It has been accepted for inclusion in LSU Doctoral Dissertations by an authorized graduate school editor of LSU Digital Commons. For more information, please contact[email protected]. Recommended Citation Darisipudi, Ashok, "Towards a generalized team task complexity model" (2006). LSU Doctoral Dissertations. 3231. hps://digitalcommons.lsu.edu/gradschool_dissertations/3231
Transcript of Towards a generalized team task complexity model

Louisiana State UniversityLSU Digital Commons
LSU Doctoral Dissertations Graduate School
2006
Towards a generalized team task complexity modelAshok DarisipudiLouisiana State University and Agricultural and Mechanical College, [email protected]
Follow this and additional works at: https://digitalcommons.lsu.edu/gradschool_dissertations
Part of the Engineering Science and Materials Commons
This Dissertation is brought to you for free and open access by the Graduate School at LSU Digital Commons. It has been accepted for inclusion inLSU Doctoral Dissertations by an authorized graduate school editor of LSU Digital Commons. For more information, please [email protected].
Recommended CitationDarisipudi, Ashok, "Towards a generalized team task complexity model" (2006). LSU Doctoral Dissertations. 3231.https://digitalcommons.lsu.edu/gradschool_dissertations/3231

TOWARDS A GENERALIZED TEAM TASK COMPLEXITY MODEL
A Dissertation
Submitted to the Graduate Faculty of the Louisiana State University and
Agricultural and Mechanical College in partial fulfillment of the
requirements for the degree of Doctor of Philosophy
in
The Interdepartmental Program in Engineering Science
by Ashok Darisipudi
B.S., Jawaharlal Nehru Technological University, India, 1999 M.S., Clemson University, 2001
May, 2006

ii
© Copyright 2006 Ashok Darisipudi All rights reserved

iii
ACKNOWLEDGEMENTS
There are many individuals who deserve my sincere thanks for their support and
encouragement throughout the achievement of this goal. First of all I would like to express my
gratitude, respect and admiration to Dr. Craig Harvey for his endless support, encouragement and
valuable guidance without which I could have never fulfilled my dream of pursuing a doctoral
degree. He always stood behind me as academic leader and supported me whenever I needed
him. I would like to extend my sincere thanks to Dr. Fereydoun Aghazadeh for his invaluable
suggestions and support as Co-Chair in shaping up this research and Dr. Barry Moser for his
direction and assistance through the development of the experimental portion of this research. A
special mention has to be given to Dr. Ling Rothrock from Penn State University who extended
his support by giving team based simulation and critical suggestions and Dr. David Blouin for
guiding me in the designing of experiments. I would also like to thank my committee members
Dr. Andera Houston, Dr. Ramachandra Devireddy for their support and critical suggestions.
I would also like to thank my brother Madhusudhan for his love, continuous
encouragement and being my motivational force right through my primary education days till
today. Sincere thanks to my close friends Durga Madhavi Mamidipalli, Balaji Kollu, Kalyan
Nidumolu, Rajesh Peruri, Sandhya Etikala, and roommates Ravi Palakurthy, Uma Mahesh,
Ravindra Nath and Kiran for their encouragement and support.
Finally I want to dedicate this work to my parents Venkateswarlu and Jaya Lakshmi, my
sister Rani, my brother Madhusudhan and my guru Shirdi Sri Sai Baba. Thank you for your
support, and love through these years. I am so thankful to God for the beautiful family that he
gave me, and for giving me the ability and strength to succeed in my educational goals.

iv
TABLE OF CONTENTS
ACKNOWLEDGEMENTS ..................................................................................... iii
LIST OF TABLES....................................................................................................vii
LIST OF FIGURES...................................................................................................ix
ABSTRACT................................................................................................................x
CHAPTER 1. INTRODUCTION ..............................................................................1 1.1. Rational and Objectives ...................................................................................2
CHAPTER 2. LITERATURE REVIEW...................................................................4 2.1. What Is Team?.................................................................................................4
2.1.1. Team Definition ..........................................................................................5 2.2. Team Theories and Models ..............................................................................6
2.2.1. Input-Process-Output Model........................................................................6 2.2.2. Pinsonneault and Kraemer’s Model .............................................................7 2.2.3. Maturity Models..........................................................................................9 2.2.4. Team Adaptation Model............................................................................12
2.3. Typology of Teams........................................................................................13 2.4. Team Elements ..............................................................................................14
2.4.1. Coordination .............................................................................................15 2.4.2. Communication.........................................................................................17 2.4.3. Work Organization-Division of Labor .......................................................19
2.5. Typology of Tasks: A Literature Review........................................................20 2.5.1. Intuitive Classification Method – Roby and Lanzetta.................................20 2.5.2. Task Description and Classification Method – Hackman ...........................21 2.5.3. Categorization Scheme Method – Steiner ..................................................23 2.5.4. Typology of Tasks Method – Laughlin ......................................................25 2.5.5. Typology of Tasks Method – McGrath’s Task Circumplex........................27
2.6. Task Complexity............................................................................................29 2.7. Team Performance .........................................................................................33
2.7.1. Time Windows..........................................................................................36 2.8. Discussion......................................................................................................39
CHAPTER 3. PROPOSED MODEL AND HYPOTHESES ..................................41 3.1. Rationale........................................................................................................41 3.2. Developing a Conceptual Model of Task Complexity and Team Performance...................................................................................................42
3.2.1. Task Complexity vs. Task Performance.....................................................45 3.3. Proposed Conceptual Model: Towards A Generalized Team Task Complexity Model.................................................................................45 3.4. Model Description: Generalized Model of Task Complexity Components......46

v
3.4.1. Hypotheses for Supporting Proposition 1...................................................48 3.4.2. Hypotheses for Supporting Proposition 2...................................................49
CHAPTER 4. METHOD..........................................................................................51 4.1. Experimental Design and Layout ...................................................................51 4.2. Participants ....................................................................................................54 4.3. Equipment and Material .................................................................................55 4.4. Experimental Design Procedure .....................................................................55
4.4.1. Experimental Task.....................................................................................58 4.5. Hypothesis Analysis.......................................................................................66
4.5.1. Hypothesis 1..............................................................................................66 4.5.2. Hypothesis 2..............................................................................................67 4.5.3. Hypothesis 3..............................................................................................68 4.5.4. Hypothesis 4..............................................................................................69 4.5.5. Hypothesis 5..............................................................................................69
CHAPTER 5. RESULTS AND DISCUSSION........................................................71 5.1. Experimental Results .....................................................................................71
5.1.1. Hypothesis 1: Full Model Analysis............................................................71 5.1.2. Analysis of 3-Way Interaction...................................................................76 5.1.3. Hypothesis 2..............................................................................................80 5.1.4. Hypothesis 3..............................................................................................81 5.1.5. Hypothesis 4..............................................................................................83 5.1.6. Hypothesis 5..............................................................................................85 5.1.7. Perceived Task Work Load Vs Team Performance....................................87
CHAPTER 6. SUMMARY AND CONCLUSIONS ................................................89 6.1. Reflections.....................................................................................................89
6.1.1. Literature Reflection..................................................................................89 6.2. Implications ...................................................................................................90
6.2.1. Theoretical Contribution............................................................................90 6.2.2. Practical Contributions ..............................................................................95 6.2.3. Limitations of the Current Model ..............................................................96
6.3. Future Directions ...........................................................................................96
BIBLIOGRAPHY ....................................................................................................98
APPENDIX A: PARTICIPANT REQUEST POSTER ........................................107
APPENDIX B: PERSONAL INFORMATION AND PRIOR EXPERIENCE QUESTIONNAIRE……………………………….………….…... 109
APPENDIX C: EXPERIMENT RULES OF ENGAGEMENT............................112
APPENDIX D: CONSENT FORM........................................................................118
vi
APPENDIX E: PERCEIVED TASK-WORKLOAD (NASA TLX) ....................125
APPENDIX F: SAS CODE FOR STATISTICAL ANALYSIS ...........................129
APPENDIX G: TASK PERFORMANCE DATA TABLE ..................................134
APPENDIX H: PERCEIVED WORKLOAD DATA TABLE (NASA TLX)......136
VITA............................................................................................................................138

vii
LIST OF TABLES
Table 2.1 Task Description Frameworks (Hackman, 1969)......................................................22
Table 2.2 Steiner’s Task Typology (Steiner, 1972)..................................................................25
Table 2.3 Description of McGrath’s Task Categories (McGrath, 1984) ...................................29
Table 2.4 Task Features Proposed to Impact Complexity (Harvey, 2001) ................................32
Table 3.1 Task Features Proposed to Impact Complexity.........................................................43
Table 3.2 Model Components and Supporting Literature.........................................................47
Table 4.1 33 Full Factorial Designs ..........................................................................................53
Table 4.2 Description of Task Complexity Levels of Each Task-Dimension............................54
Table 4.3 Required Equipment and Material............................................................................56
Table 4.4 Experimental Procedure...........................................................................................57
Table 4.5 Primary Tasks: AAWC and AIC..............................................................................59
Table 4.6 TASP Simulation Rules of Engagement (ROEs) ......................................................62
Table 5.1 Summary of Team Performance Data ......................................................................72
Table 5.2 Summary of Fit........................................................................................................74
Table 5.3 Analysis of Variance................................................................................................75
Table 5.4 Effect Tests..............................................................................................................75
Table 5.5 Task-Scope Role in 3-Way Interaction.....................................................................77
Table 5.6 Task-Coordination Role in 3-Way Interaction..........................................................78
Table 5.7 Task-Uncertainty Role in 3-Way Interaction............................................................79
Table 5.8 Analysis of Hypothesis 2 .........................................................................................81
Table 5.9 Effect Tests: Hypothesis 3 .......................................................................................82
Table 5.10 Task-Scope: Least Square Means.............................................................................82

viii
Table 5.11 Effect Tests: Hypothesis 4 .......................................................................................84
Table 5.12 Task-Coordination: Least Square Means..................................................................85
Table 5.13 Effect Tests: Hypothesis 5 .......................................................................................86
Table 5.14 Task-Uncertainty: Least Square Means....................................................................86
Table 5.15 Pair-Wise Correlation: Work Load Vs Team Performance.......................................88

ix
LIST OF FIGURES
Figure 2.1 Hackman’s Task Framework (Hackman, 1969) ........................................................24
Figure 2.2 McGrath Task Circumplex (McGrath, 1984) ............................................................28
Figure 2.3 Team Task Complexity Profiles (Rothrock, Harvey and Burns, 2005)......................34
Figure 2.4 Possible Time Window Outcomes (Rothrock, 2001) ................................................38
Figure 2.5 Possible Time Window Outcomes (Rothrock, 2005) ................................................38
Figure 3.1 Towards a Generalized Team Task Complexity Model.............................................46
Figure 4.1 Experimental Set-Up................................................................................................58
Figure 4.2 AAWC Interface ......................................................................................................60
Figure 4.3 AIC Interface ...........................................................................................................61
Figure 5.1 Actual Vs Predicted Performance Plot......................................................................74
Figure 5.2 Task-Scope Vs Performance Least Square Means Plot .............................................82
Figure 5.3 Task-Coordination Vs Performance Least Square Means Plot ..................................84
Figure 5.4 Task-Uncertainty Vs Performance Least Square Means Plot ....................................87

x
ABSTRACT
The objective of this research was to develop and validate a generalized team task-
complexity model and framework by drawing on the literature from various team and task
factors grouped into three task-dimensions, which compose task-complexity space and how these
affect the task-performance. A number of task typologies have been presented in the teams’
literature to better define and understand the critical role of the tasks and the associated team
processes. In addition, most of the research work has defined team measures as highly abstract
concepts not capable of providing the quantitative comparison of team performances from
various domains.
This research proposed a model of task-complexity based on different task-characteristics
including task-scope, task-coordination and task-uncertainty that provide the capability to
quantify different attributes that impact team performance. A multiple linear regression analysis
was used to validate the contribution of each task-complexity dimension towards complexity and
performance. Analysis of variance was also used to account variance in measurement scales and
not to force linear relationship.
The results indicate a significant three-way interaction of task-scope, task-coordination
and task-uncertainty. Since three-way interaction was significant, all the three task-complexity
dimensions were significant and not equally contributing towards team task-performance. Two-
way interaction of task-scope and task-coordination was significant when task-uncertainty was
negligible. Thus both were not equally contributing towards team task-performance. From effect
tests, task-coordination and task-uncertainty were found to be highly significant with relation to
task-performance. Though task-scope was not significant, further analysis reveals that it had
xi
significant impact on task-performance at its highest level and when task-uncertainty was
negligible. Thus explains its inclusion in the three-way interaction.
Workload, a subjective team performance measure in team literature, was used for model
cross-validation. Results found a significant negative correlation between perceived task-
workload and task-performance, thereby validating the model from workload perspective. This
study summarizes the different task-characteristics affecting the team task-performance. This
study has practical implications in the design and evaluation of collaborative tools and team
training. Further research would develop a synthetic collaborative system that would emulate
certain complex work environments and enable the collection of team performance data for
assessing hypotheses about collaboration.

1
CHAPTER 1
INTRODUCTION
Today’s organizations are increasingly using teams to streamline processes, enhance
participation, and improve quality (Cohen and Bailey, 1997). The use of teams in organizations
has expanded dramatically to solve complex problems and to get a competitive edge over
competitors. Hence, teams are becoming the primary building block of most organizations
(Brooks, 1994; McGrath, 1997). A recent study by Gordon (1992) found that 82% of American
companies with strength of 100 or more employees utilize some form of teams. Irrespective of
private or public sector organization, the reliance on teams and work groups is present. Teams
are found in diverse fields such as education, science, engineering and technology, and the
military.
With ‘teams’ comes the term ‘task’ that they need to perform in order to solve
organizational problems. That’s why some early researchers treated teams as vehicles for
performing tasks (Arrow, McGrath, and Berdahl, 2000). Because task performance was central
to these early researchers, a part of their research dealt with the effects of different types of tasks
on performance of the teams (e.g., Kent and McGrath, 1969; Steiner, 1972; McGrath, 1984).
Thus the tasks which experimental teams are asked to undertake has proven to be one of the
important moderators of team behavior and effectiveness (McGrath, 1984). Since teams engage
in many different collective activities, a number of task typologies and descriptions have been
presented in the team and related literature in an effort to better define and understand the critical
role of the tasks and the associated team processes.
Roby and Lanzetta (1958) proposed one of the first useful team-task classification
systems in which tasks are classified based on an analysis and definition of the properties

2
(objective and modal properties) of the task. They also suggested that classification should
involve a description of the properties of the relationships between critical task events. This is a
very important task typology as it represents one of the first systems for quantifying tasks based
on both objective task characteristics and behavioral requirements. Task typologies by Hackman
(1969), McGrath (1984), and Wood (1986) were built based on this system. But it is Wood
(1986) that suggested that the construct of the task complexity might represent a more useful
means for differentiating tasks. However as defined by Wood, the task complexity construct
applies to individuals rather than groups (Wood, 1986; p.66). But later researchers concluded
that since the model of the task complexity is built on the task as behavior requirements and task
qua frameworks (frameworks which are independent of the task performers), that the task
complexity construct could be applied to group tasks as well. Thus the nature of the task
complexity dimension has long been a topic of consideration in teams and small groups’
research.
1.1 Rational and Objectives
The predominance of team decision-making and performance assessment literature has
defined team measures as highly abstract concepts. Terms such as team leadership, competence,
innovation, and empowerment are replete in team literature (Brannick, Salas, and Prince 1997,
Smith-Jentsch, Johnson, and Payne 1998). While these terms are intuitively appealing (e.g.
successful teams are empowered), they are often without specified mathematical meanings and,
therefore, without quantifiable relationships to other team constructs. Characterizations that most
successful teams are well-led, innovative, competent, and empowered are helpful criteria for
expert practitioners who have their own sense of what these terms mean. However, they are of
less utility when informing the design of training systems for future team technologies.

3
Most complex decisions involve many data, human, and technological sources
collaborating to support decision makers. However when the responsibility for task
accomplishment moves from the province of one person to a multitude of natural and artificial
intelligences, the system changes quantitatively and qualitatively. Quantitatively, the system is
more complex and dynamic. This complexity increases further as the constituent intelligences
are separated in time. Qualitatively, the system exhibits properties that were not evident when a
lone individual is working on a set of tasks.
Thus the tools and methodologies that have been developed to understand the work of the
sole individual do not necessarily accommodate the interaction of multiple members. Much work
has been done to attempt to understand the team environment in the form of cognitive
engineering, computer cooperative supported work, and groupware. Much of the work in this
area focuses on teams that create a common artifact where debate and negotiation are often not
constrained by time.
This research focuses on the team task-complexity space and how any team task can be
represented in this team task-complexity space, of three dimensions, by objectively assessing
team performance in any task environment. Further this research develops a generalized team
task-complexity model and dimensions which is built on the team task-complexity dimensions
proposed by Harvey (1997) and Harvey (2001). Considering the practical difficulty of
experimentally testing many tem-tasks from different domains, a thorough validation of these
task-dimensions is done my experimentally testing a number of team-tasks designed within a
particular selected domain of command and control. Objectively quantifying task-complexity
dimensions pave the way for comparing the different team tasks of different complexity levels in
different environments.

4
CHAPTER 2
LITERATURE REVIEW
Since the teams and teamwork are becoming more important and common, the answers to
some basic questions concerning teams also become more important. Some of the basic
questions about teams include: How do teams work? What factors affect team performance?
How does one assess team performance? In order to answer these questions and to know more
about what have researchers done related to teams, let us look into the literature on teams and
small groups. The lay out of team literature section consists of an overview of team and its
definition, typology of teams, team theories and models.
2.1. What Is Team?
The words “team” and “group” are both equally prevalent in team literature. But most of
the popular management literature uses the term “team”(e.g. team effectiveness, marketing
teams) where as the academic literature uses the word “group”(e.g. group cohesion, group
dynamics). According to some researchers groups vary in their degree of “groupness” (how
much the team/group members dependent on each other), with some groups being more
interdependent and integrated than others. According to Brannick and Prince (1997) teams can
be distinguished from small groups as teams have unique requirements for coordination and task
interdependency. Some authors use ‘team’ for groups that have a high degree of “groupness”
(Katzenbach and Smith, 1993). In other words, groups become teams when they develop a sense
of shared commitment and strive for synergy among the members (Guzzo and Dickson, 1996).
Though there might be some differences between the terms ‘team’ and ‘group’ expressed by
some researchers throughout this document, the terms ‘team’ and ‘group’ are used

5
interchangeably for convenience. Before going into the details about what researchers have done
related to teams, let us define the term team. Multiple definitions exist for the term ‘team’.
2.1.1 Team Definition
Several definitions of team exist within the team and small group literature including,
1. Teams consist of two or more individuals, who have specific role assignments,
perform specific tasks and who must interact or coordinate to achieve a common goal
or outcome. (Baker and Salas, 1997)
2. Teams consist of two or more individuals, who make decisions (Orasanu and Salas,
1993)
3. Teams consist of two or more individuals, who have specialized knowledge and skills
(Cannon-Bowers et. Al., 1995).
4. Team is a bounded system composed of a set of interdependent individuals organized
to perform specific tasks that affect others (Guzzo and Dickson, 1996).
5. “A team is a collection of individuals who are interdependent in their tasks, who
share responsibility for outcomes, who see themselves and who are seen by others as
an intact social entity embedded in one or more larger social systems (for example,
business unit or the corporation), and who manage their relationships across
organizational boundaries” (Cohen and Bailey, 1997).
By this definition, team members from the same department who work on
separate projects is not a team. The above definition was derived from the work of
Hackman (1987) and Sundstrom, De Meuse, and Futrell (1990).
6
6. A team is a complex, adaptive, dynamic, coordinated, and bounded set of patterned
relations among team members, tasks, and tools. (Arrow, McGrath, and Berdahl,
2000).
Arrow, McGrath, and Berdahl (2000) definition of team is a very comprehensive one.
Their definition is based on the synthesis of a vast literature on teams and small groups. They
included complex, adaptive and dynamic nature of teams along with coordination and
relationships among team members to define teams. But most important thing is the notion of
considering relationships among team members, tasks and tools into the definition. Thereby
stating teams as not mere group of people who work together on a common objective and share
the work responsibilities but also the tools they utilize to perform and relations among team
members, tasks and tools.
2.2 Team Theories and Models
In general there are three important team theories and models in the team literature. They
are input-process-output model (McGrath, 1984; Hackman, 1987), maturation models (e.g. Team
Evolution And Maturation (TEAM) model (Morgan et al., 1986), Forming-Storming-Norming-
Performing Model (Tuckman, 1965)) and Adaptability model (Entin and Serfaty, 1999).
2.2.1 Input-Process-Output Model
A good amount of team theory and research is based on the classic systems theory of
input-process-output (Ilgen, 1999). However it is McGrath (1984) and Hackman (1987) who
described traditional small groups research of classic systems theory terms with inputs,
processes, and outputs. Inputs usually include the task characteristics, some elements of context
and people who composed the teams. Processes include interactions among the team members,
communication, coordination and interpersonal influence mechanisms like leadership. Outputs

7
include task-focused things such as team performance outcomes such as performance quality and
number of errors and socio-emotional outcomes such as member satisfaction and group
cohesiveness. Traditional approaches have tended to focus more on the development of
psychological process theories (e.g. Steiner’s (1972) Model of Group Process and Cooper’s
(1975) book on theories of group processes). Teams tasks, contexts, and composition (on input
side) often were of interest only as boundary conditions there by restricting behaviors and
contexts over which process theories generalized. In organizations, inputs like task
characteristics and outputs like task performance, are more important and critical team factors
(Ilgen, 1999). As organizations use more teamwork oriented approaches the importance of teams
and team behaviors increases. Thus more research is focused on the identification and
determination of input factors like task-context and behavioral factors that contribute to effective
teamwork, and output factors like team performance. This change in orientation leads to the
development of normative models. Since most of all the earlier research on small groups is
descriptive, Hackman (1987) identified the need of normative models. Normative models in
contrast to descriptive ones (input-process-output model) usually start with a purpose to develop
ways to improve teams so that behavior on them will meet some objective (Ilgen, 1999).
Hackman’s (1987) work on the design of work teams is an example of a normative model as he
is explicit in the goal to develop a model based on the scientific data available that will increase
the probability that teams with characteristics outlined in the model will perform better.
2.2.2 Pinsonneault and Kraemer’s Model
Pinsonneault and Kraemer (1989) came up with another framework/model for analysis
from systematic review of research in organization behavior and group psychology. Pinsonneault
and Kraemer (1989) conceptualized and framed their group model more or like in the similar

8
lines of traditional input-process-output model. But their prime concern is the technological
support and group outcomes. Pinsonneault and Kraemer’s model consists of four broad sets of
factors. They are
1. Contextual Variables: Contextual variables refer to factors in the immediate environment
of the group rather than in the broader organizational environment. Five contextual
variables appear to be important in the behavioral research on groups: personal factors,
situational factors, group structure, technological support, and task characteristics.
2. Group Process: Group process variables refer to characteristics of the group’s interaction
and attempts to capture the dynamics of that interaction. Group process includes
decisional, communication, interpersonal characteristics, and structure imposed by Group
Decision Support Systems (GDSS) and Group Communication Support Systems (GCSS).
3. Task-Related Outcomes: Task-related outcomes include characteristics of the decision,
implementation of the decision and attitude of group members. Each of these variables
further affected by technological support.
4. Group-Related Outcomes: Group-related outcomes include satisfaction of the group
members with regard to the process and their willingness to work in groups in future.
Both task-related and group-related outcomes are further interrelated.
The prime goal of this model was to address the technological support to groups and its
help in reducing the errors in decision processes as well as reducing the communication barriers
between members of group (Pinsonneault and Kraemer, 1989). This model suggested that Group
Decision Support Systems (GDSS) increase the task-oriented communication and clarification
efforts; increase the degree of participation and decrease the domination by few team members;
and increase the consensus among members of the group. These impacts further increase the

9
quality of decisions, which in turn increase the confidence and satisfaction of group members
towards the decision. Similarly the model showed that Group Communication Support Systems
(GCSS) increase the total effort put in by the group member and also increase the participation of
group members thereby increasing the quality of decisions. However results indicated
surprisingly that GCSS decreases the overall cooperation thereby resulting a decrease in the
confidence of group members taking decisions. This model further paved way for the importance
and need of technology introduction to assist teams.
2.2.3 Maturity Models
In addition to the input-process-output models, maturity models have found an important
place in team literature. Some examples of the maturation models are Forming-Storming-
Norming-Performing (FSNP) Model (Tuckman, 1965), Team Evolution And Maturation
(TEAM) model (Morgan et al., 1986).
2.2.3.1 Forming-Storming-Norming-Performing Model
Tuckman (1965) proposed a team model that shows the four stages that teams go
through: from Forming to Storming to Norming to Performing.
In the Forming stage, team members are introduced. They state why they were chosen or
volunteered for the team and what they hope to accomplish within the team. Members cautiously
explore the boundaries of acceptable group behavior. This is a stage of transition from individual
to member status, and of testing the leader’s guidance both formally and informally. Because
there is so much going on to distract members’ attention in the beginning, the team accomplishes
little, if anything, that concerns its project goals. Which is considered perfectly normal.
The Storming phase is called the team’s transition from the “As-Is” to the “To-Be”. All
members have their own ideas as to how the process should look, and personal agendas are

10
rampant. Storming is probably the most difficult stage for the team. They begin to realize the
tasks that are ahead are different and more difficult than they imagined. Impatient about the lack
of progress, members argue about just what actions the team should take. They try to rely solely
on their personal and professional experience, and resist collaborating with most of the other
team members.
The Norming phase is when the team reaches a consensus on the “To-Be” process.
Everyone wants to share the newly found focus. Enthusiasm is high, and the team is tempted to
go beyond the original scope of the process. During this stage, members reconcile competing
loyalties and responsibilities. They accept the team, team ground rules, their roles in the team,
and the individuality of fellow members. Emotional conflict is reduced as previously competitive
relationships become more cooperative.
The team has now settled its relationships and expectations. They can begin performing
by diagnosing, solving problems, and choosing and implementing changes. At last team
members have discovered and accepted each other’s strengths and weakness, and learned what
their roles are. The team is now an effective, cohesive unit. You can tell when your team has
reached this stage because you start getting a lot of work done according to Tuckman (1965).
2.2.3.2 Team Evolution And Maturation (TEAM) Model
Traditional descriptive team models do not deal with the temporal aspects of team
performance or the processes involved in the development of teams as a result of time,
experience, or training (Morgan, Salas, and Glickman, 1994). As a result team performance was
not addressed in a systematic way. Later on team-performance gained more attention as an
important aspect. Thus a number of approaches to team performance have evolved. Four are
mentioned here as illustrations of different ways to address team performance. Morgan and his

11
colleagues (Baker and Salas, 1992; Cannon-Bowers et al., 1995; McIntyre and Salas, 1995; and
Morgan et al., 1986) followed the classic criterion development model to construct the Team
Evolution And Maturation (TEAM) measure of team performance.
Morgan et al. (1986) postulated that there are two distinguishable tracks that co-develop
over the maturation period of a team: a taskwork track and a teamwork track. Taskwork consists
of behaviors that are performed by individual team members and are critical to the execution of
individual team member function. Teamwork consists of behaviors that are related to team
member interactions and are necessary to establish coordination among individual team members
to achieve team goals. In general, critical teamwork behaviors were organized around seven
behavioral dimensions: giving suggestions or criticisms, cooperation, communication, team spirit
and morale, adaptability, coordination, and acceptance of suggestions or criticism (Salas et al.
1995).
Later the TEAM research took a longitudinal approach to meet its goals providing the
opportunity to look into teams’ development over a period of time. That laid the foundation
further by looking into real operational teams working in natural contexts like high workloads,
time pressure and to deal with complex situations (McIntyre and Salas, 1995). This kind of
methodology helps in examining behaviors that distinguish effective teams from less effective
teams and is used extensively by Navy researchers. But Morgan and his colleagues’ (1986)
themselves depicted and discussed four sub-dimensions of teamwork that were needed for
effective teams (performance monitoring, feedback, closed-loop communications, and backing-
up behaviors) and paved the way for methodology of distinguishing effective teams from less
effective teams.

12
2.2.4 Team Adaptation Model
Entin and Serfaty (1999) proposed a theoretical framework for team adaptation, which
also closely resembles the traditional input-process-output model. In this adaptation model,
inputs are operational conditions, individual/team characteristics, and team structure. These
inputs are connected to stress processes, which in turn connected to team processes having
taskwork and teamwork tracks. The taskwork track and teamwork track form a feedback loop by
connecting back to stress processes by means of decision-making adaptation and coordination
adaptation respectively. Teamwork track also makes a feedback loop with team structure, part of
input, by means of structural reconfiguration. Finally the team processes are connected to
performance (output). Here the adaptation strategies used by teams to manage the stress
processes and are represented in the form of feedback loops.
Effective teams are able to ‘push’ information and action to team members before it is
needed as opposed to ‘pulling’ information and actions from each other under stress (high-
workload conditions) (Entin and Serfaty, 1999). Underlying the notion of anticipation is the idea
of a shared mental model of the team and the task. That is, because members understand the
team task, and each other’s task roles and functions, effective teams are able to anticipate what
information and action other team members need. The dual concepts of shared mental models
and adaptive coordination are a productive approach for understanding and developing effective
teamwork. There are many methods by which team members can acquire anticipation skills and
shared mental models. These include cross training on others’ jobs (Cannon-Bowers et al.,
1998), and training feedback on teamwork behaviors (Stout, Salas and Fowlkes, 1997).
13
2.3 Typology of Teams
According to Cohen and Bailey (1997) four types of teams can be identified in
organizations today: (1) work teams; (2) parallel teams; (3) project teams; and (4) management
teams. Other researchers such as Sundstrom, De Meuse, and Futrell (1990) used integration and
differentiation as the taxonomy to differentiate the four types of groups. They define teams as (1)
advice and involvement groups; (2) production and service teams; (3) project and development
teams; and (4) action and negotiation teams. Though Cohen and Bailey (1997) and Sunderstrom,
De Meuse, and Futrell (1990) offer different typologies in identifying different teams, their
categories overlap with each other. Though the names kept by researchers are different, Cohen
and Bailey argue that their categories overlap with others. For example work teams correspond
to production and service teams, parallel teams correspond to advice and involvement teams and
project teams correspond to project and development teams. Similarly management teams
correspond to action and negotiation teams. Thus while the names may defer their definitions are
very similar. Following is a brief explanation to Cohen and Bailey’s (1997) four teams
mentioned before.
1. Work teams: Work teams are work units responsible for producing goods or providing
services where their membership is stable and well defined. Work teams are directed by
supervisors who make most of the definitions about what is done, how is it done, and who
does it. Self-managing or semi-autonomous or empowered work teams are special
alternative form of work teams where employees involve in making decisions without the
need of supervisors and managers. Examples for work teams include teams found in
manufacturing and mining crews etc.

14
2. Parallel teams: Parallel teams pull together people from different work units or jobs to
perform functions that the regular organization is not equipped to perform well. In other
words, they literally exist in parallel with the formal organization structure and used mostly
for problem solving and improvement oriented activities. Examples include quality
improvement teams and task forces etc.
3. Project teams: Project teams are time-limited teams. They always produce one-time out-puts
like new product or service marketing or developing a new information system or setting up
a new plant etc. They are non-repetitive in nature and require considerable application of
knowledge, judgment and expertise. As they always work on new products and
applications, they draw their members from different departments of the organization. Thus
they can also be termed as cross-functional teams.
4. Management teams: Management teams coordinate and provide direction to the sub-units
under their authority and control, laterally integrating interdependent sub-units across key
business processes. The management team is responsible for the overall performance of a
business unit in an organization. Most of the time they are composed of managers
responsible for each sub-unit. Examples include strategic development teams of any
organization that gives a competitive edge over its competitors.
2.4 Team Elements
McGrath (1984) proposed a conceptual framework for the study of groups in which he
proposes group interaction process is the central piece of the conceptual group model, as the
essence of group lies in the interaction of its members in some recognized relation to one
another. In other words, the communication process can be regarded as an important element.
Similarly other elements of teams like coordination and work organization, which consists of

15
task allocation or task distribution, are also very important dimensions or elements for
measurement of team performance (McIntyre and Salas, 1995). The importance of coordination
and communication processes increases as the task interdependence increases (Saavedra, Early,
and Linn Van Dyne, 1993). Though several elements have been evaluated over the years to
impact team performance, this literature review considers only coordination, communication and
work organization as these three team elements are useful in defining the team task-complexity
space and dimensions.
2.4.1 Coordination
Malone and Crowston (1994) define coordination as “managing dependencies between
activities”. Other researchers such as Guastello and Guastello (1998) say that “Coordination
occurs when two or more people do the same or complementary tasks at the same time”.
Cooperation and collaboration are two lose words that many people think are the same as
coordination. Cooperation implies shared goals among different members where as collaboration
more implies peers working together on some intellectual and tactical endeavor. In fact,
collaboration needs some form of coordination. The reason for pointing them out is to clarify any
confusion that exists among these words. In today’s world of collaborative teams, interaction
may not and probably will not be accomplished through face-to-face interaction. Thus how
coordinated activities are achieved becomes of interest. The type of coordination necessitated
may ultimately depend on the task to be accomplished. Coordination is supported by a number of
processes such as implicit and explicit learning processes of acquiring the understanding among
team members and communication process (Guastello and Guastello, 1998). However
communication processes will be discussed as a separate section as it is helps in achieving
coordination but it aids many other teams elements such as group decision-making.

16
Implicit and explicit learning: Implicit and explicit learning processes help in acquiring
the understanding among team members. “Implicit learning is essentially an unconscious
thinking process that is coupled with an explicit-learning set” (Guastello and Guastello, 1998).
Implicit learning occurs to a greater or lesser extent compared with explicit learning depending
on the salience of the information to be learned and the selectivity of the learner. In general,
coordination will consist of both explicit and implicit components. The explicit component is to
observe and understand other members’ task and perform ones assigned tasks. Thereby going
towards achieving the common goals and tasks of the team. Implicit learning is more like one’s
expectation of the other team members acts coupled with the experience gained over a period of
time working in a team. In order to achieve coordination in a group or team, each member
provides stimuli and some sort of feedback for the others in addition to the feedback associated
with the explicit task performed.
From the team literature, implicit and explicit learning process in a broad sense could be
expressed either as team situational awareness or shared mental models. Researchers such as
Orasanu and Salas (1993), who focused the cognitive processes associated with teamwork,
hypothesized that team members may develop and rely on shared mental models to enhance
coordination and ultimately improve team performance. Shared mental models are nothing but
organized bodies of knowledge that are shared across members of the team (Salas et al., 1995).
Team situational awareness is nothing but sharing of a common perspective among team
members regarding current environmental events, their meaning and about future status
(Wellens, 1993). So it is more or like shared mental models mingled with current situation.
Situation could be an environmental situation, solving a new group problem etc. Team
situational awareness is made of individual situational awareness and team process that team

17
members use to build and exchange information and enhance team coordination (Salas et al.,
1995).
Research in the broad area of cognitive psychology suggests that knowledge of the
interrelationships between the concepts in a domain is a critical variable that influences initial
learning, subsequent retention, and later knowledge transfer. In order to work together
successfully teams must perceive, encode, store, and retrieve information available for each
individual team member. Thus the quality of a team’s output will depend not only on the
information available to the individual team member but also on the shared or team mental
model (Langan-Fox, Code and Langfield-Smith, 2000). The utility of this implicit and explicit
learning or shared/team mental models or situational awareness is thought to stem from its utility
in providing team members with a set of organized expectations for team performance from
which timely and accurate predictions about the task and team can be drawn (Cannon Bowers et
al., 1995). Such knowledge could form the basis of team functioning by providing an
understanding of teamwork skills and team goals. In other words, improved team coordination
will further lead to good team performance. Recently a new term “team knowledge” is in greater
usage. Team knowledge can be defined as the collection of task- and team-related knowledge
held by teammates and their collective understanding of the current situation (Cooke, Salas,
Cannon-Bowers, and Stout, 2000).
2.4.2 Communication
Communication is perhaps the most important process used to manage dependencies
(Harvey and Koubek, 2000). Communication has been defined as clearly and accurately sending
and acknowledging information, instructions, or commands (Brannick et al., 1995). Teams
generally consist of members from many different disciplines and parts of the organization to

18
share information and ideas. Since each team member has different backgrounds, knowledge,
and expertise, difficulties can arise due to communication ineffectiveness and communication
lapses. It is evident from several reports that communication can be the downfall of complex
engineering projects (Boeing, 1999; NASA, 1999). Thus in a team, communication is an
important element as it contains information relevant to completing team tasks or contains socio-
emotional information about either team members or about outside people not in the team
(Arrow, McGrath, and Berdahl, 2000). Any error in processing the information provided in the
team communication is a very important team performance measure. If the team is working
under a complex and dynamic collaborative situation any misinterpretation can cause devastating
effects upon its failure. According to Brannick et al. (1995), teams that were proficient in
communication acknowledged members’ speech, accurately sent and received information and
informed other teams of their mission progress. Teams have to identify and solve many problems
while performing their task and to reach overall team goal(s) that necessitates decision-making.
Decision-making is an inevitable part of the group processes and in order to understand the
complexities of decision-making, communication in general will first be evaluated. Since most of
the present day teams work as geographically distributed when compared to traditional teams, we
need to identify the different communication patterns other than face-to-face communications.
Literature related to teams and groups has shown that communication is fundamentally affected
by medium through which the team members interact (Carey and Kacmar, 1997).
Communication media affect group functioning in large part by the degree to which they
transmit social context cues (Straus and McGrath, 1994). Communication patterns other than
face-to-face communications will cause a loss in the visual cues (Example: emotions, physical
expressions), verbal cues and behavioral cues. Because of this reason, alternative communication

19
modes such as video conferencing and computer-mediated communications need to have greater
degree of clarification. However, distributed teams have been found to be more argumentative
and display less consensus concerning their decisions (Hammond, Koubek, and Harvey, 2001).
2.4.3 Work Organization-Division of Labor
To accomplish some complex tasks teams face two issues: how to divide up the labor,
and how to coordinate their efforts. In any organization this division of labor and its coordination
is attributed mainly to its organizational structure. Many theories of organizational structures are
proposed and used in different organizations. Some examples are matrix, project and hierarchical
organizational forms.
There are two aspects of division of labor (Mintzberg, 1992). First, there are technical
aspects of the task which determine in what way and to what extent you can break up the task
into subtasks that can be performed by a single person. This often determines what jobs or
positions may exist in the organization. There is some discretion here, but in general there is not
a lot that an organization can do to change how this is done short of adopting a different
technology altogether. Second, there is the allocation of people to jobs. People have different
competencies, and are better placed in certain jobs rather than others. They also have different
interests, and so have different levels of motivation for different jobs. Placing people in the right
jobs is a crucial strategic issue.
As organizations enter the 21st century, the source of competitive advantage is
increasingly human resources. This may sound strange in a technological age where machines do
more and more of the work, but it is precisely technology that creates this dependence on human
resources. This is because technology is knowledge-driven. It is all about understanding how
things work and being able to exploit that knowledge to solve client problems. The most

20
important resource most organizations have is human smarts. Given that the key problem in
division of labor is the assignment of people with certain competencies and interests to tasks,
part and parcel of the division of labor is the notion of specialization (Mintzberg, 1992).
2.5 Typology of Tasks: A Literature Review
With ‘teams’ comes the ‘task’ that they need to perform in order to solve the
organizational problems. That’s why some early researchers treated teams as vehicles for
performing tasks (Arrow, McGrath, and Berdahl, 2000). Because task performance was central
to these early researchers, a part of their research dealt with the effects of different types of tasks
on performance of the teams (e.g., Kent and McGrath, 1969; Steiner, 1972; McGrath, 1984).
Since teams engage in many different collective activities, a number of task typologies and
descriptions have been presented in the team related literature in an effort to better define and
understand the critical role of the tasks and the associated team processes.
While not exhaustive, this section will present a short discussion of many of the
important task typologies that have been proposed in the psychological, small groups,
communication, and information systems literature. The frameworks are presented in a
chronological order with the method used and/or the name of the author(s) who proposed or
popularized each system. The frameworks are useful for understanding how tasks can be
classified and distinguished.
2.5.1 Intuitive Classification Method – Roby and Lanzetta
Roby and Lanzetta (1958) proposed one of the first useful task classification systems.
Their approach to classifying tasks required first an analysis and definition of the properties of
the task. This is called intuitive classification method. They suggested two properties,

21
1. Objective properties – represents inherent and quantifiable task characteristics
2. Modal properties – represents those typical behaviors that groups or individuals
exhibit while processing the task.
They also suggest that a task classification should involve a description of the properties
of the relationships between critical task events (e.g., between input and output activities). Three
properties were proposed:
1. Descriptive aspects – the qualitative and quantitative nature of the events
2. Distribution – The physical relationship among the events
3. Functional behavior – the occurrence of the events over time
Based on these properties, critical task demands or behavioral requirements can be
identified as well as used to classify and distinguish between tasks.
The importance of this task typology is that it represents one of the first systems for
quantifying tasks based on both objective task characteristics and behavioral requirements. Later,
a good number of task typologies, particularly those of Hackman (1969), McGrath (1984), and
Wood (1986), were built on this system.
2.5.2 Task Description and Classification Method – Hackman
Hackman (1969) proposed a framework for examining how individuals process tasks.
Hackman examines three issues related to understanding experimental tasks: 1) issues associated
with defining the components and characteristics of an adequate task definition; 2) issues
associated with understanding what are the most appropriate bases for making task descriptions
and comparisons; and 3) issues associated with understanding task effects (i.e., how task factors
influence how people think and behave).

22
Hackman (1969) reviewed and synthesized four frameworks for task descriptions
originally proposed by McGrath and Altman (1966) and Ferguson (1956). The four frameworks
are labeled task qua task, task as behavior requirement, task as behavior description, and task as
ability requirement. A description of these task definitions is presented in Table 2.1. After
thoroughly reviewing these methods for describing tasks, Hackman came to a conclusion that the
task as behavior requirement represents the best basis for defining tasks. Since it differentiates
tasks based on the critical behaviors required for success that remain relatively constant for a
task across subjects. The task as behavior description and task as ability requirement approaches
are unsuitable since they rely on characteristics of task performers that vary across individuals
for any one task. He also finds that the task qua task approach is unsuitable because an almost
infinite number of potential stimuli and task dimensions exist which makes it difficult to identify
which characteristics should be used to define the task.
Table 2.1 Task Description Frameworks (Hackman, 1969)
Task Qua Task: What pattern of stimuli are impinging on the subject? These are the objective
dimensions of the task such as the physical nature of the task, its matter, characteristics of the
stimuli.
Task As Behavior Requirements: What responses should the subjects emit, given the
stimulus situation, to achieve some criterion of success? These are the critical success factors
that are needed to complete the task successfully.
Task As Behavior Description: What responses does the subject actually emit, given the
stimulus response? These are the actual behaviors that people engage in when they are
confronted with the task.
Task As Ability Requirement: What are the patterns of personal abilities or traits, which are
required for successful task completion? These are the individual physical, psychological, and
background characteristics, which are necessary for successful job performance.

23
Hackman’s definition of task is as follows:
“A task may be assigned to a person (or group) by an external agent or may be self
generated. It consists of a stimulus complex and a set of instructions, which specify what is to be
done vis a vis the stimuli. The instructions indicate what operations are to be performed by the
subject(s) with respect to the stimuli and/or what goal is to be achieved” (p.113).
The three important components of this definition are 1) the stimuli present in the task, 2)
the instructions about operations, and 3) the instructions about goals. From this
conceptualization, combined with the notion that individuals will redefine tasks, Hackman
proposed a framework for analyzing how individuals’ process tasks (see Figure 2.1). This
framework attempts to map the 1) inputs, which are brought into a task scenario (e.g., the task
stimuli, instructions, individual characteristics), 2) the redefinition process (individual
interpretation of the task), 3) the development of strategies and tactics for completing the task, 4)
execution of the task, and 5) the impact task execution on outcomes, perceptions, and learning.
2.5.3 Categorization Scheme Method – Steiner
Steiner (1972) viewed task as one of the key determinants of a group’s productivity. His
classifications of task focused on the outcome that was to be accomplished and the task imposed
constraints that governed the means of accomplishing the outcome. A summary of Steiner’s task
typology is presented in Table 2.2.
This view of group tasks distinguishes between unitary tasks, where mutual assistance is
infeasible, and divisible tasks that can be achieved through a division of labor. Steiner takes a
normative view in which tasks are extensively described in terms of maximizing and optimizing
the group’s product. A group’s maximum productivity is referred to as its potential productivity.

24
Figure 2.1 Hackman’s Task Framework (Hackman, 1969)
This potential productivity represents the most effective use of the group’s resources
(e.g., member knowledge, skills, and coordination).
According to Steiner, however, a group’s actual productivity may be less than its
potential productivity because of faulty processes:
Actual Productivity = Potential productivity – Losses due to faulty processes (1)
Processes are the “actual steps taken by an individual or group when confronted by a
task,” (p. 8). This view of group performance and task asserts that a group’s performance is
contingent on 1) the group’s resources and 2) the process of collecting those resources to address
the task. Table 2.2 also lists Steiner’s key determinant(s) (resource, process, or both) of
productivity for each type of task.

25
Table 2.2 Steiner’s Task Typology (Steiner, 1972)
2.5.4 Typology of Tasks Method – Laughlin
Laughlin (1980) and colleagues (Davis, Laughlin, and Komorita, 1976) have formulated
a typology of tasks, which classifies tasks based both on the activities that groups are
26
undertaking as well as the relationship between the actors. For instance, they distinguish between
tasks that are carried out by cooperating groups and those conducted by groups, which are
competing (i.e., mixed-motive groups). For cooperating groups, they distinguish between
intellective and decision-making tasks.
Intellective tasks possess a demonstrably correct solution (i.e., the solution can be
measured and evaluated in terms of its correctness) while decision-making tasks involve the
development of solutions, which are not demonstrably correct (i.e., an objective measure of
correctness is not available and preference among alternatives is a matter of individual or
subjective assessments). In summary, an intellective task requires that the group attempt to
discover the correct solution while a decision-making task requires that group members align
individual preferences to reach an agreement.
Tasks, which are performed by mixed-motive groups, are split into several categories.
For instance, a distinction is drawn between bargaining tasks and negotiation tasks with the
former involving an attempt to resolve differences related to an individual issue or concept and
the latter involving a more complex process of resolving differences related to multiple issues.
Other mixed-motive tasks include those, which involve coalition formation and those, which
might be called prisoner dilemma-type problems. Tasks that involve coalition formation are, for
example, often structured to examine how differential payoffs for various members of a group
influence the development of subgroups. Prisoner dilemma problems involve a class of dilemma
problems where participants are given, either explicitly or implicitly, a pay-off matrix for either
competing or cooperating with other participants.

27
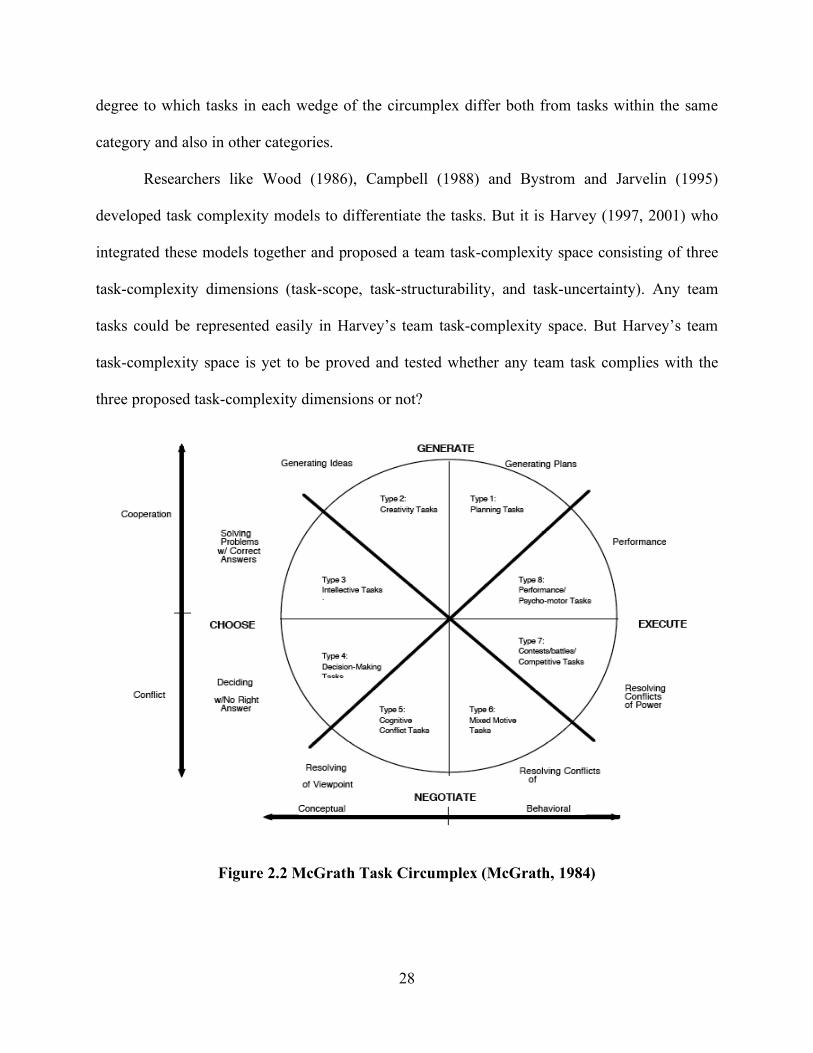
2.5.5 Typology of Tasks Method – McGrath’s Task Circumplex
McGrath (1984) proposed what he termed a Task Circumplex by integrating the work of
Hackman and Morris (1975, 1978), Laughlin (1980), Shaw (1973), Davis (1980), and others into
a conceptually and visually elegant framework for classifying group tasks (see Figure 2.2 and
Table 2.3).
Hackman (1968) and Hackman and Morris (1975, 1978) identified production (generate
alternatives), discussion (dealing with issues), and problem-solving (generating plans for action)
task types based on the behavioral and performance processes required to complete the task (i.e.,
using the task as behavior requirement framework). McGrath built on Hackman’s observations
and described four general processes (depicted as quadrants): generate, choose, negotiate, and
execute. Within these general processes he incorporated more specific sub-tasks based on the
task qua task framework. For example, the model includes Laughlin’s (1980) distinction between
intellective tasks, which have a demonstrably correct answer, and decision-making tasks, which
have no correct answer but rely on group consensus.
McGrath designed the Task Circumplex categories to be 1) mutually exclusive between
categories, 2) collectively exhaustive, 3) logically related, and 4) useful for comparing
similarities and differences of various tasks used in group research. The circumplex is divided on
two dimensions: the horizontal axis defines the conceptual/behavioral dimension while the
vertical axis defines tasks in terms of conflict/cooperation. These axes are defined using the task
as behavior description framework since these axes define, at least in part, behaviors which are
likely to be produced by the tasks which project on these behavioral dimensions. An important
limitation of the circumplex is that it does not provide a means for objectively measuring the
28
degree to which tasks in each wedge of the circumplex differ both from tasks within the same
category and also in other categories.
Researchers like Wood (1986), Campbell (1988) and Bystrom and Jarvelin (1995)
developed task complexity models to differentiate the tasks. But it is Harvey (1997, 2001) who
integrated these models together and proposed a team task-complexity space consisting of three
task-complexity dimensions (task-scope, task-structurability, and task-uncertainty). Any team
tasks could be represented easily in Harvey’s team task-complexity space. But Harvey’s team
task-complexity space is yet to be proved and tested whether any team task complies with the
three proposed task-complexity dimensions or not?
Figure 2.2 McGrath Task Circumplex (McGrath, 1984)

29
Table 2.3 Description of McGrath’s Task Categories (McGrath, 1984)
2.6 Task Complexity
Tasks differ in terms of their complexity as determined by their characteristics (Prasad
and Akhilesh, 2002). Task complexity has been examined within three bodies of literature
according to Campbell (1988): the information processing and decision-making, task and job
design, and goal-setting research literature. Within this literature, complexity is treated as:
primarily a psychological experience, an interaction between task and person characteristics, and
a function of objective task characteristics. Wood (1986) stated that many of the complexity
definitions combine task and non-task elements thereby complicating their use for different tasks

30
within different environments. In order to identify the components of the task that would
represent behavior independent of complexity and describe the task and individual’s
characteristics of the task. Harvey (1997, 2001) came-up with an ideology of an integrative
framework for task complexity (Wood, 1986; Campbell, 1988; Byström and Järvelin, 1995).
Prior to delving into task complexity, it seems significant to understand what defines a task.
While Steiner says a task is anything that must be done to accomplish some purpose,
Wood (1986) defines a clearer framework for defining tasks. Every task, according to Wood, is
composed of three components: products, (required) acts, and information cues. Products are
defined as the entities created or produced through behavior or acts that are independent of the
goals and expectations of the individuals who performed the task. Acts are defined as the pattern
of behaviors that have a definable purpose toward the creation of the product. The third element,
information cues, is the pieces of information used by an individual to make judgments during
the performance of a task. Therefore any definition of complexity must incorporate an analysis
of at least these three elements.
The starting point to define the concept of team task complexity will be drawn from
Harvey (1997, 2001). Harvey draws from existing literature (Daft and Macintosh, 1981; Wood,
1986; Campbell, 1988; Campbell, 1991; Byström and Järvelin, 1995; Chen and Lin, 2003) and
creates a comprehensive definition of complexity along three primary characteristics: scope,
structurability, and uncertainty. Since the task forms the foundation by which teams collaborate,
quantifying tasks is essential to allow researchers to compare experimental results.
The task scope is the breadth, extent, range, reach, or general size of a task. The scope is
a function of the sub-tasks, outcome(s), information processed, and the outcome characteristics
and their conflicting objectives. Each task can be decomposed into sub-tasks. A sub-task has

31
identifiable behaviors or steps with an identifiable purpose or direction (McGrath, 1991).
Outcomes are the entities created that result from activities of the collaborative individuals and
are independent of the behaviors used to produce them. For each outcome, there exists a set of
characteristics by which its success is measured. Outcome characteristics include the attribute,
aspect, property, quality, or trait of an outcome. Characteristics may conflict with each other and
thus increase the complexity of the task. For example, altitude and accuracy may conflict with
each other in an aerial intelligence seeking information task. The last element that defines the
task scope is information. Information is the amount of required knowledge in the
accomplishment of the task.
With this basic understanding of a task and its scope, the other two dimensions can be
explained. Task structurability represents how well defined the sequence and relationships
between subtasks are, and are determined by the elements analyzability, alternatives, and
coordination. Analyzability reflects the degree of consistency between sub-tasks and their
outcomes. If characteristics reflected by an outcome can be reached in more ways than one, the
number of paths to reach it is summed as task alternatives. Moreover, if task accomplishment is
contingent on coordination among sub-tasks, the number of relationships required is counted as
task coordination. Chen and Lin (2003) identify three information flows in complex tasks:
independent (uncoupled), dependent (decoupled), and interdependent (coupled). Interdependent
tasks require more interaction by the team and thus are likely to make team task completion
difficult.
The task uncertainty dimension attempts to measure complexity based on the degree of
predictability or confidence associated with a task. Internal confidence indicates the degree of
certainty or predictability of the structure established among tasks, alternatives, sub-tasks, and

32
characteristics. External events include changes in the set of required product characteristics that
are imposed by higher echelons of command. It is worth noting that random events have been
included since these chance events can ultimately affect a task’s complexity.
Using the defined task features, one might suggest that a three-dimensional team
complexity space exists where vastly different team environments can be placed (refer to Figure
2.3). Table 2.4 details each of the features of the task taxonomy within the three dimensions as
proposed by Harvey (1997, 2001).
Table 2.4 Task Features Proposed to Impact Complexity (Harvey, 2001)
Task Scope
1. Sub-tasks: decomposed components of the task for which there are behaviors or steps
with an identifiable purpose complexity increases as the number of subtasks
increase (Steiner, 1972; Wood, 1986)
2. Products: products (or sub-components) that result from the task complexity
increases as the number of products increase unless they are related or reused sub-
components (Wood, 1986) (Campbell, 1988)
3. Product Characteristics: characteristics by which the success of the product is measured
(i.e., quality, time to delivery, flexibility of modification, cost, weight, etc.)
complexity increases as a function of the number of characteristics (Campbell, 1988)
4. Characteristic Conflicts: presence of conflicting product characteristics (i.e., quality vs.
speed) complexity increases as a function of the number of conflicting
characteristics (Campbell, 1988)
5. Information: amount of information processed in the accomplishment of the task
complexity increases as the amount of information to be processed increases (Wood,
1986) (Campbell, 1988)
Task Structurability
Analyzability: the ability to create sub-task relationships and identify the cause and effect
(table cont’d.)

33
relationships between sub-tasks and their outcome complexity increases as the task
analyzability decreases (Daft and Macintosh, 1981)
Alternatives: multiple paths to reach the desired product characteristics complexity
increases as a function of the number of paths that can be taken to arrive at the product
(Campbell, 1988)
Coordination: relationships between sub-tasks in the accomplishment of the task
complexity increases as a function of the number of coordination information flows
increases for a task (e.g., independent, dependent, or interdependent) (Wood, 1986;
Chen and Lin, 2003)
Task Uncertainty
1. Internal Confidence: the degree of certainty or predictability of the structure established
among tasks alternatives, sub-tasks, and characteristics complexity will increase
when the links between sub-tasks and alternatives and sub-tasks and task characteristics
cannot be established with certainty (Campbell, 1988)
2. External Constraints: changes in the set of required product characteristics that are
organizationally imposed complexity increases as a function of the amount of
changes (Wood, 1986)
3. Random Events: chance occurrences or irregular events that take place during the
course of a task which disrupt its completion complexity increases as the number of
unexpected events increases (Daft and Macintosh, 1981)
2.7 Team Performance
The first and foremost concrete work that resulted in evolution of team performance
model was of Nieva, Fleishman and Rieck (1978), which is based on an extensive review of the
group performance literature. According to their findings, team performance has two primary
components.

34
Figure 2.3 Team Task Complexity Profiles (Rothrock, Harvey and Burns, 2005)
They are,
1. Individual task behaviors – the behaviors requiring no coordination among team
members
2. Coordinated task-related processes, functions, and behaviors – all the behaviors that
promote coordination among team members and sub-tasks.
The above two components combine to determine the level and nature of the team
performance. However the weight of each component’s contribution to team performance varies
according to nature of the particular task characteristics. They also identified four classes of
variables: external conditions, member resources, team characteristics, and task characteristics
and demands. These variables are useful in determining the time needed to complete the task, the
critical requirements and member resources that combine to form relationships etc for successful
team performance. To fully understand these variables that relate to team performance, Nieva,

35
Fleishman and Rieck (1978) proposed taxonomy of team functions. Later Fleishman and
Zaccorro (1992) prepared an extensive taxonomy of team functions consisting of seven
functions. They are,
1. Orientation Functions – the processes used by team members in information exchange
needed for task accomplishment.
2. Resource Distribution Functions – processes used to assign members and their resources
to particular task responsibilities.
3. Timing Functions – organization of team activities and resources to complete the tasks
within time frame and temporal boundaries.
4. Response Coordination Functions – coordination and integration and synchronized
member activities.
5. Motivational functions – definition of team objectives/goals and motivational processes
for members to achieve the proposed objectives.
6. Systems Monitoring Functions – error detection in the team as a whole and individual
members
7. Procedure Maintenance – maintenance of synchronized and individual actions in
compliance with established performance standards.
By means of these seven team functions, one could easily understand the team
performance measurement tools used by many researchers such as Observational Scales (Smith-
Jentsch, Tannenbaum, and Cannon-Bowers, 1995), critical incidents-based observational
protocols (e.g. Johnston, Smith_jentsch, and Cannon-Bowers, 1997), expert opinion (e.g., in the
form of rating scales; see Borman, 1991), TARGET methodology and checklists (Fowlkes et al.,
1994), Anti-Air Warfare Team Performance Index (Johnston, Smith-Jentsch, and Cannon-

36
Bowers, 1997). These team performance measurement tools take goal accomplishment,
accuracy, number of errors and accomplishment time into account for calculating team
performance (Cannon-Bowers and Salas, 1997).
However most of these measurement tools are subjective in nature and are developed in
relation to military teams and training. The problem with subjective team performance measures
is that it is cumbersome and time-consuming process. In general, when team performance is
assessed, the evaluation methods rely on instructors or other subject matter experts (SMEs) to
provide numerical ratings of performance (Modrick, 1986). According to Dwyer et al. (1997),
rating scales, though carefully constructed, have several deficiencies that limit them as
evaluation tools. First, they lack diagnostic specificity, as they do not point out specific
performance deficiencies. Second, rating techniques usually require highly trained subject matter
experts (SMEs) to achieve adequate measurement properties. Thus one cannot relate and
compare the results from different teams in different contexts. Especially for today’s
collaborative teams in the world of complex and technologically advanced systems, we need a
more robust team performance measurement construct.
2.7.1 Time Windows
A proper understanding of team performance characteristics is required for designing
complex systems that involve team tasks. While human factors texts provide some insights into
basic performance issues, the emergence of highly automated computing systems have
fundamentally altered the way humans work. Thus to quantify and analyze human performance
within a complex, time-critical system we need a proper measurement construct. Time window,
which enables a functional relationship between constraints on team activities and time
availability, is one such measurement construct that is of great use (Rothrock, 2001).

37
Rothrock (2001) defines time window as a construct that specifies a functional
relationship between a required situation and a time interval that specifies availability for action.
The time windows formulation by Rothrock is an extension of the theory of situativity proposed
by Greeno (Greeno and Moore, 1993; Greeno, 1998). A time window does not specify what
action must be taken, but only that there exists an action that will result in the required situation.
Using temporal logic (Allen, 1984; Gabbay, Hodkinson, and Reynolds, 1994) and a Boolean
algebra, a truth maintenance system (TMS) is established to specify whether a decision maker is
early, on-time, or late in taking an action. Moreover, it also specifies what actions are
acceptable.
Time windows represent a belief system of required situations that are time and
environment-based. Therefore, a truth maintenance system (Doyle 1979) is needed to maintain
time windows throughout the timeframe of team interaction. The utility of a time window is not
only in its temporal and functional descriptions, but also in the richness of the possible outcomes.
The complete space of possible time window outcomes (see Figure 2.4) proposed by Rothrock
(2001) is represented by the fundamental relationships between time windows and operator
actions. In itself, the existence of a required situation does not impact team performance. It is
the presence of operator action in a temporal context that specifies whether performance is good
or poor. An action that is wrong is termed as incorrect action ((4), in Figure 2.4). A correct
action, on the other hand, can be further characterized as early ((1), in Figure 4), on-time ((2) in
Figure 4), or late ((3) in Figure 2.4). An action with no corresponding required situation is
categorized as False Alarm ((5), in Figure 2.4). A non-action for an existing situation
requirement is characterized as a miss (6). In the recent discussions with, Rothrock (2005), early
correct and late correct actions can be considered as false alarms since they do not practically

38
exist. Thus early correct (2) and late correct (3) should be categorized and placed with false
alarms (5). Figure 2.5 shows modified version of the possible time window outcomes.
Figure 2.4 Possible Time Window Outcomes (Rothrock, 2001)
Note: The environment is delineated in terms of situation required (time window exists) or no situation is required (time window does not exist). 1-4 represent actions that are relevant to a time window. 1-3 represent actions that result in the required situation (correct actions). 4 represent actions that do not meet the required situation (incorrect actions) even though they are relevant.
Figure 2.5 Possible Time Window Outcomes (Rothrock, 2005)
Note: 1 represents actions that result in the required situation (correct actions). 2-3 represent actions that fall under as false alarm. 4 represent actions that do not meet the required situation (incorrect actions) even though they are relevant.
False
Alarm
MissCorrect
Rejection
Situation No Situation
Required Required
Environment
Action
No Action
Response
Correct
Incorrect
Early On-time Late
(2) (1) (3)
(4)
(6)
(5)
False
Alarm
MissCorrect
Rejection
Situation No Situation
Required Required
Environment
Action
No Action
Response
Correct
Incorrect
Early On-time Late
(2) (1) (3)
(4)
(6)
(5)

39
2.8 Discussion
A good amount of team theory and research is based on the classic systems theory of
input-process-output (Ilgen, 1999). However it was both McGrath (1984) and Hackman (1987)
who described traditional small groups’ research of classic systems theory terms with inputs,
processes, and outputs. However the traditional input-process-output approaches tended to focus
more on the development of psychological process theories (e.g. Steiner’s (1972) Model of
Group Process and Cooper’s (1975) book on theories of group processes). Teams’ tasks,
contexts, and composition (on input side) often were of interest only as boundary conditions
thereby restricting behaviors and contexts over which process theories generalized.
In organizations, inputs like task characteristics and outputs like task performance, are
more important and critical team factors (Ilgen, 1999). As organizations use more teamwork
oriented approaches the importance of teams and team behaviors increases. Thus more research
is focused on the identification and determination of input factors like task-context and
behavioral factors that contribute to effective teamwork, and output factors like team
performance.
• So it is important to have a generalized team–tasks oriented approach that conceives
different teams as embedded entities in a task-space developed based on the task
context, task characteristics, and task-complexity.
In today’s world of collaborative teams, interaction may not and probably will not be
accomplished through face-to-face interaction. Thus how coordinated activities are achieved
becomes of interest. The type of coordination necessitated may ultimately depend on the task to
be accomplished. Coordination is supported by a number of processes such as implicit and
explicit learning processes of acquiring the understanding among team members, time-dependent

40
information processing, and communication process (Guastello and Guastello, 1998). Though
communication helps in achieving coordination but it also aids many other team elements such
as group decision-making.
• Thus the generalized team–tasks oriented approach should also include coordination
and communication in some way to develop the task-space.
The team performance measures developed are cumbersome in nature as well as a time-
consuming process. In general, when team performance is assessed, the evaluation methods rely
on instructors or other subject matter experts (SMEs) to provide numerical ratings of
performance (Modrick, 1986; Dwyer et al., 1997). Thus one cannot relate and compare the
results from different teams in different contexts.
• Thus the generalized team-task oriented approach should have the ability to relate and
compare the results from different teams in different contexts.
In order to have such a generalized model, first a task-space has to be conceptualized.
Harvey (1997, 2001) proposed one such kind of team task-complexity space (refer to section 2.6
for details) having task-scope, task-structurability and task-uncertainty as its three dimensions
where team-tasks in the domain of distributed engineering design could be represented. The
current research builds a conceptual model of generalized team task-complexity space based on
the ideology of Harvey (1997, 2001).

41
CHAPTER 3
PROPOSED MODEL AND HYPOTHESES
3.1 Rationale
The literature review indicates that the research towards a generalized team–tasks
oriented approach for building team task-complexity space has a good potential to help the
distributed team environments. Therefore, research in this area has the scope to generate new
concepts for team collaboration and to define a quantification mechanism for teams by means of
new metrics. As a result, there is a possibility for new team performance measures.
From the discussion section of the literature review (see section 2.8), the generalized
team–tasks oriented approach could be defined as follows,
The generalized team–tasks oriented approach is an approach that would conceive
different teams as embedded entities in a task-space developed based on the task context, task
characteristics, task-complexity, coordination, and communication with a strong ability to
compare the results from different teams in different contexts.
In order to have such a generalized model, first a task-space has to be conceptualized.
Harvey (1997, 2001) proposed one such kind of team task-complexity space (refer to section 2.6
for details) having task-scope, task-structurability and task-uncertainty as its three dimensions.
Though it is a very good integrated model of task complexity, Harvey’s team task-complexity
space and its three dimensions are built in the perspective of distributed engineering design and
is completely domain specific. At the same time it has not been completely experimentally
validated and thus a generalized integrated model of task complexity still does not exit. The
current research builds a conceptual model of generalized team task-complexity space based on
the ideology of Harvey (1997, 2001).

42
After a thorough review of Harvey (1997, 2001), a summary of the following
observations could be outlined,
• The task-scope sub-dimension, products, which is defined as sub-components that
result from the tasks, is specific to the domains of distributed engineering design and
manufacturing. Also products are dependent on the tasks and sub-tasks. Including it
adds a repetitive component to the complexity taxonomy. Thus the generalized team
task-complexity space cannot allocate this sub-dimension into its task-scope
dimension.
• Similarly the task-scope sub-dimensions, product characteristics and characteristic
conflicts, which are also specific to distributed engineering design and manufacturing,
cannot be allocated in the generalized team task-complexity space.
• The task-structurability sub-dimension, analyzability, is defined as the ability to
create sub-task relationships and identify the cause and effect relationships between
sub-tasks and their outcome (Daft and Macintosh, 1981). However according to Daft
and Macintosh (1981), the unanalyzable tasks (tasks with low analyzability) bring in
the ‘response’ uncertainty. Therefore, this component and the uncertainty component
seemed to be highly related.
• All the task-uncertainty sub-dimensions are well emphasized and are not domain
specific.
Table 3.1 shows definition of the proposed task features or sub-dimensions that form of the
generalized task-complexity space and dimensions.
3.2 Developing a Conceptual Model of Task Complexity and Team Performance
From McGrath task circumplex (1984), decision-making tasks are defined as the tasks where a
correct answer is unknown. Whenever there involves some from of decision-making, team

43
members discuss and come to a consensus after reviewing all possible options to accomplish the
tasks.
Table 3.1 Task Features Proposed to Impact Complexity
Task Scope
1. Sub-tasks: decomposed components of the task for which there are behaviors or steps
with an identifiable purpose complexity increases as the number of subtasks
increase (Steiner, 1972; Wood, 1986)
2. Information: amount of information processed in the accomplishment of the task
complexity increases as the amount of information to be processed increases (Wood,
1986; Campbell, 1988; Carey and Kacmer, 1997)
Task Coordination
1. Coordination: relationships between sub-tasks in the accomplishment of the task
complexity increases as a function of the number of coordination information flows
increases for a task (e.g., independent, dependent, or interdependent) (Wood, 1986;
Chen and Lin, 2003)
Task Uncertainty
1. Internal Confidence: the degree of certainty or predictability of the structure
established among tasks alternatives, sub-tasks, characteristics and outcomes
complexity will increase when the links between sub-tasks and alternatives, sub-tasks
and task characteristics sub-tasks and task outcomes cannot be established with
certainty (Campbell, 1988; Perrow, 1967; Daft and Macintosh, 1981; Daft and Lengel,
1986)
2. External Constraints: changes in the set of required task characteristics that are
organizationally imposed complexity increases as a function of the amount of
changes (Wood, 1986; Wood, 1988)
3. Random Events: chance occurrences or irregular events that take place during the
course of a task which disrupt its completion complexity increases as the number of
unexpected events increases (Daft and Macintosh, 1981; Speier, Vessey and Valacich,
2003)

44
Thus decision-making brings in complexity into the team tasks (Arrow, McGrath, and
Berdahl, 2000; McGrath, 1984). Further decision-making will also lead to some form of
uncertainty and ambiguity, as teams have to choose one of possible solutions based on the
knowledge of alternatives, knowledge of consequences (e.g. risks associated with decisions),
decision rules, amount and accuracy of information available (March, 1988; March, 1991;
Hollenbeck et al., 1995). From this point of view, broadly one could divide the team tasks as
team tasks with uncertainty and team tasks without uncertainty. With this argument the following
conclusions could be drawn,
Team Tasks without Uncertainty: Uncertainty is zero for team tasks without
uncertainty (e.g. Intellective Tasks from McGrath, 1984). Thus it is proposed that the task-scope
and task-coordination dimensions are enough to represent such team tasks, as there is no
uncertainty or a negligible amount of uncertainty.
So the 2-dimensional space is enough to represent this type of team tasks. Thus, the
following proposition is framed,
Proposition 1: Team tasks without uncertainty can be represented in a 2-dimensional
task space of task-scope and task-coordination as dimensions. (e.g., intellective tasks from
McGrath (1984))
Team Tasks with Uncertainty: Uncertainty is clearly believed to contribute to task
complexity for many tasks. So the three dimensions of task-scope, task-coordination and task-
uncertainty are needed to represent such team tasks.
Proposition 2: Team tasks with uncertainty can be represented in a 3-dimensional task
complexity space of task-scope, task-coordination and task-uncertainty as dimensions. (e.g.,
decision-making tasks from McGrath (1984))

45
3.2.1 Task Complexity vs. Task Performance
Tasks with more complexity typically contain more information cues than tasks with less
complexity. Therefore, an increase in task-complexity increases the amount of information cues
to be processed, which results in some information cues not being processed and may deteriorate
task performance (Wood, 1986). Consequently, the perceived workload and stress increases as
the task-complexity increases and inhibit performance (Speier, Vessey and Valacich, 2003).
However, it is not true for all the teams. Entin and Serfaty (1999) found that an increase in the
level of task complexity and stress did not necessarily result in a decrease in the team’s outcome
performance. They felt that some teams are able to adapt to these conditions and reasoned that
switching from explicit to implicit coordination helped them. According to Morgan and Bowers
(1995), the effect of increased workload on team performance is not yet clear. However the
saliency of workload factor caused by complex, dynamic and ambiguous characteristics of task
environments, coupled with its known effects on individual task performance, suggests that it is
likely to have a negative effect on team performance (Urban et al., 1995). After a thorough
consideration of the above facts, one could state that there exists some task-complexity level
after which the performance would decrease.
3.3 Proposed Conceptual Model: Towards A Generalized Team Task Complexity Model
Thus, this thesis proposes to define the underlying dimensions that compose a task which
contribute to complexity in a team environment. McGrath’s circumplex defines tasks of different
notional complexities; however, his model stops short of identifying the mechanisms that
compose the complexity. A more defined model would provide designers of the team tasks to
clearly understand the elements that contribute to the complexity and thus allow for better design
of the team tasks.

46
As discussed in the literature review, several dimensions potentially represent task
complexity. For the purpose of this thesis, these variables are grouped into three complexity
dimensions: task-scope, task-coordination, and task-uncertainty. These complexity dimensions
are hypothesized to affect the teams’ task performance. Figure 3.2 displays the proposed
generalized team task-complexity conceptual model in concert with how it fits with McGrath’s
task definitions. Refer to Table 3.1 to see the definition of the proposed task features or sub-
dimensions that form of the generalized task-complexity space and dimensions.
3.4 Model Description: Generalized Model of Task Complexity Components
The conceptual model displayed in Figure 3.1 is composed of several components and
relationships. Table 3.2 identifies each major component along with the supporting literature.
Figure 3.1 Towards a Generalized Team Task Complexity Model

47
Table 3.2 Model Components and Supporting Literature
Model Components Summary Support for Model Assumptions Task Complexity
Dimensions
Task Scope Sub-tasks
Complexity increases as the number of sub-tasks increase
Steiner (1972) Wood (1986)
Information Complexity increases as the amount of information to be processed increases
Wood (1986) Campbell (1988) Campbell (1991) Carey and Kacmer (1997)
Task Coordination
Coordination Complexity increases as a function of the number of coordination information flows
Wood (1986) Chen and Lin (2003)
Task Uncertainty
Internal Confidence
Complexity will increase when the links between sub-tasks and alternatives; sub-tasks and task characteristics; and sub-tasks and outcomes cannot be established
Campbell (1988) Campbell (1991) Perrow (1967) Daft and Macintosh (1981) Daft and Lengel (1986)
External Constraints
Complexity increases as a function of the amount of changes
Wood (1986) Wood et al. (1988)
Random Events
Complexity increases as the number of random events increases
Daft and Macintosh (1981) Speier, Vessey and Valacich (2003)
Task Performance
Complexity increases the perceived workload and stress there by deteriorating the task performance.
Wood (1986) Speier, Vessey and Valacich (2003) Entin and Serfaty (1999) Morgan and Bowers (1995) Urban et al. (1995) Carey and Kacmer (1997)
Previous Task Complexity
Models
Some general references to task complexity research and models
Wood (1986) Bystrom and Jarvelin (1995) Harvey (1997, 2001) Zhao (1992)

48
3.4.1 Hypotheses for Supporting Proposition 1
Task-scope is a function of sub-tasks and information processed. In other words they are
the sub-dimensions of task-scope. From the teams’ literature, as the amount of information-
processed increases the task complexity increases thereby the team performance will decrease
after crossing a certain information load (Wood, 1986; Campbell, 1988).
Similarly, as the number of sub-tasks increases the task complexity increases thereby
decreasing the team performance after crossing a certain limit (Steiner, 1972; Wood, 1986).
Thus, by keeping one task dimension constant and testing a team task with various levels of
second task dimension, one can validate whether team tasks would comply to the task
complexity dimensions or not.
Three hypotheses are designed to validate proposition 1. One hypothesis each designed to
validate and evaluate whether task-scope and task-coordination as task complexity dimensions
would really affect the team task performance or not? Another hypothesis is designed to validate
whether both task-scope and task-coordination contribute equally towards task complexity and
team task performance.
So the list of hypotheses supporting proposition 1 are as below,
1. Difference in team task-performance exists as task complexity is increased by the task-
scope.
2. Difference in team task-performance exists as task complexity is increased by the task-
coordination
3. Task-scope and task-coordination, as dimensions of task complexity, do not contribute in
equal proportion to the team task-performance.

49
3.4.2 Hypotheses for Supporting Proposition 2
Task-uncertainty is a function of internal confidence, external constraints and random
events. In other words, they are the sub-dimensions of task-uncertainty. From the teams’
literature,
• Task complexity increases when the links between sub-tasks and alternatives, sub-
tasks and task characteristics and sub-tasks and outcomes cannot be established with
certainty there by decreasing the team performance after crossing certain level.
(Campbell, 1988; Campbell, 1991; Perrow, 1967; Daft and Macintosh, 1981; Daft
and Lengel, 1986)
• Task complexity increases as a function of the amount of changes in external events
there by decreasing the team performance after crossing certain level. (Wood, 1986;
Wood et al., 1988)
• Task complexity increases as occurrence of unexpected or random events increases
there by decreasing the team performance after crossing certain level. (Daft and
Macintosh, 1981; Speier, Vessey and Valacich, 2003)
• Thus, testing a team task with various levels of task-uncertainty dimension one can
validate whether it really acts as a task-complexity dimension or not?
• Similarly validation is needed to know whether the three task complexity dimensions
would really affect and contribute equally towards team task performance or not?
Thus, two hypotheses are designed to validate proposition 2. One hypothesis is designed
to validate and evaluate whether task-uncertainty as a task complexity dimension would really
affect the team task performance or not? Another hypothesis is designed to validate whether the

50
three task complexity dimensions (scope, coordination and uncertainty) contribute equally
towards the task complexity and team performance or not?
So the list of hypotheses supporting proposition 2 are as below,
1. Difference in team task-performance exists as task complexity is increased by the
task-uncertainty
2. Task-scope, task-coordination, and task-uncertainty, as dimensions of task
complexity, do not contribute in equal proportion to the team task-performance.
Objective of the proposed generalized team task-complexity model is to define and
validate the underlying dimensions that compose a task which contribute to complexity in a team
environment. Thus, main objective is to validate the three task-complexity dimensions and
evaluate how they affect the team task performance.
So from the discussion of hypotheses supporting proposition 1 and 2, hypotheses are
numbered in the order of importance.
Hypothesis 1: Task scope, coordination, and uncertainty, as dimensions of task
complexity, do not contribute in equal proportion to the team task-performance.
Hypothesis 2: Task scope and task coordination, as dimensions of task complexity, do
not contribute in equal proportion to the team task-performance.
Hypothesis 3: Difference in team task-performance exists as task complexity is increased
by the task-scope.
Hypothesis 4: Difference in team task-performance exists as task complexity is increased
by the task-coordination.
Hypothesis 5: Difference in team task-performance exists as task complexity is increased
by the task-uncertainty.

51
CHAPTER 4
METHOD
The purpose of this section is to describe the methods, procedures, and analysis that are
used to test the previously defined hypothesis. The experimental design, subjects, equipment,
experimental task, and procedure for experiment will be discussed in detail. Each hypothesis,
including its independent, and dependent variables, will be reviewed along with the appropriate
analysis technique.
4.1 Experimental Design and Layout
As proposed in the generalized team task-complexity model, the task-complexity depends
on three dimensions (factors) namely task-scope, task-coordination and task-uncertainty.
Therefore, in this case a multiple linear regression analysis is necessary to capture the
contribution of each dimension towards complexity and performance. Thus, the general problem
of fitting the model is,
Y =
!
"0+
!
"1S+
!
"2C+
!
"3U + 4! S*C + 5! C*U + 6! S*U + 7! S*C*U (2)
Where,
Y = Team task-performance
S = Task Scope
C = Task Coordination
U = Task Uncertainty
!
"0,
!
"1,
!
"2,
!
"3, 4! , 5! , 6! , and 7! are regression coefficients.
As the exact behavior of the three dimensions (factors) of task-complexity is not
completely known, a 33 full factorial design is an appropriate design of experiment (DOE) in the
present proposed generalized team task-complexity theory. After getting enough participant

52
teams, the initial idea of running a reduced model of 20 data scenarios generated by a D-optimal
design was put aside, and the full 33 factorial design model is used. Thus 33 full factorial design
(3*3*3) with three levels for all the three task-complexity dimensions (factors) is used for
generating the number of runs necessary for the multiple linear regression analysis. The analysis
of variance (ANOVA) model is used to accommodate the 3 levels of each task-complexity
dimension and avoid the requirement that the 3 levels of any given task-complexity dimension be
equally spaced. Analysis of variance (ANOVA) is also used to account variance in measurement
scales and not to force linear relationship. All 27 scenarios (or data points) would be conducted
two times to capture a better picture of how teams perform various task-complexity scenarios. As
per the full factorial design all participant teams (2-member teams) would be randomly assigned
to perform one particular run or task-complexity scenario. Thus the present experimental design
needs a total of 54 two-member teams (108 participants).
Table 4.1 gives the 27 runs or task-complexity scenarios of the 33 full factorial design.
Task-performance values of all the 54 data points will be calculated. A multiple linear regression
analysis would be conducted to see the variation of teams’ task performance and to test all the
five hypotheses. Table 4.2 explains the description of the complexity levels of each task-
dimension (1 (low), 0 (medium) and 1 (high) levels) considered for the purpose of the present
experimental study.
Example: A task scenario of low task-scope (-1) that requires medium coordination (0)
with high uncertainty (1) is, T (-1, 0, 1) = Identifying 10 (hostile and friendly) planes requiring
20 ideal interactions (or chunks of information exchange flows) with 8 random (uncertain)
events. Section 4.5.1.5 explains the task complexity metrics and quantification with a sample
task scenario.

53
Table 4.1 33 Full Factorial Designs
Run Number
Task -scope (S)
Task-coordination (C)
Task-uncertainty (U)
No of Repetitions
Team task- performance (Y)
1 -1 -1 -1 2 2 -1 -1 0 2 3 -1 -1 1 2 4 -1 0 -1 2 5 -1 0 0 2 6 -1 0 1 2 7 -1 1 -1 2 8 -1 1 0 2 9 -1 1 1 2 10 0 -1 -1 2 11 0 -1 0 2 12 0 -1 1 2 13 0 0 -1 2 14 0 0 0 2 15 0 0 1 2 16 0 1 -1 2 17 0 1 0 2 18 0 1 1 2 19 1 -1 -1 2 20 1 -1 0 2 21 1 -1 1 2 22 1 0 -1 2 23 1 0 0 2 24 1 0 1 2 25 1 1 -1 2 26 1 1 0 2 27 1 1 1 2
Note: -1, 0 and 1 represent low, medium and high levels of the three dimensions (Factors)

54
Table 4.2 Description of Task Complexity Levels of Each Task-Dimension
Complexity Level
Task Scope Task Coordination Task Uncertainty
-1 (low) 10 Objects to be identified (Hostile & Friendly)
2 DCA 10 Other Objects
Ideal Interactions Necessary = 2 planes requiring coordination *5 information exchange flows=10
No Random Events
0 (Medium) 20 Objects to be identified (Hostile & Friendly)
4 DCA 10 Other Objects
Ideal Interactions Necessary = 4 planes requiring coordination *5 information exchange flows = 20
4 Random Events
1(High) 30 Objects to be identified (Hostile & Friendly)
6 DCA 10 Other Objects
Ideal Interactions Necessary = 8 planes requiring coordination *5 information exchange flows = 40
8 Random Events
All the events were generated as described in the Table 4.2. In all these scenarios, random
events are the only form of task uncertainty.
4.2 Participants
One hundred and eight participants were recruited from undergraduate/graduate students
at Louisiana State University on a volunteer basis who had the knowledge and experience of
working as teams for academic class projects and computer simulation/video games. Participants
were recruited using posters (See Appendix B) that indicated the need for participants for an
experiment that focuses on teams and task-complexity. Participants recruited from classes were
given extra bonus points by the faculty member in their respective classes for participating in the
experiment.
All participants had an equivalent amount of computer experience and have normal or
corrected to normal vision. A survey questionnaire was conducted before the experiment to
ensure subjects have relatively the same level of experience. Participants were awarded the
bonus credit irrespective of their eligibility to participate in the experiment. Each participant was
asked to indicate his or her level of experience on group projects and computer simulation tasks

55
to ensure all the participants have relatively the same level of experience. Participants work as
teams of two people in performing the experimental task. Thus 54 teams were formed with two
participants in each team. Participants were randomly picked to form a particular team.
4.3 Equipment and Material
The equipment and material needed to conduct the experimental task are as described in
the Table 4.3. Each team, which has two members, has two roles to be performed. A 2-role Team
Aegis Simulation Platform (TASP) simulation was used for these experiments. It requires 3-
networked computers with one computer acting as server and two other computers, located in
different rooms, used by each team member. The roles of team members were assigned on a
random basis and were explained in a detailed manner by the experimenter. Section 4.5.1
provides more details of the TASP simulation, roles of the team members, Script Maker and
Converter software.
4.4 Experimental Design Procedure
The experimental procedure was a two-stage procedure comprising the training stage and
experimental stage. The participant team was subjected to meet a minimum amount of team
performance in order to participate in the experimental stage. This was to make sure all that all
the participant teams had sufficient knowledge in performing the experimental task and to avoid
the possibility of inconsistency. The experimental procedure used is portrayed in Table 4.4. In
the training stage, teams consisting of two participants first complete initial data forms (subject
information and prior experience questionnaire, and experiment consent form).
Upon completion of these forms, teams were given the experimental task description and
guidelines packet that consists of Rules of Engagement (ROEs) and other technical information
to be remembered in order to perform TASP simulation tasks. During this stage, any of the
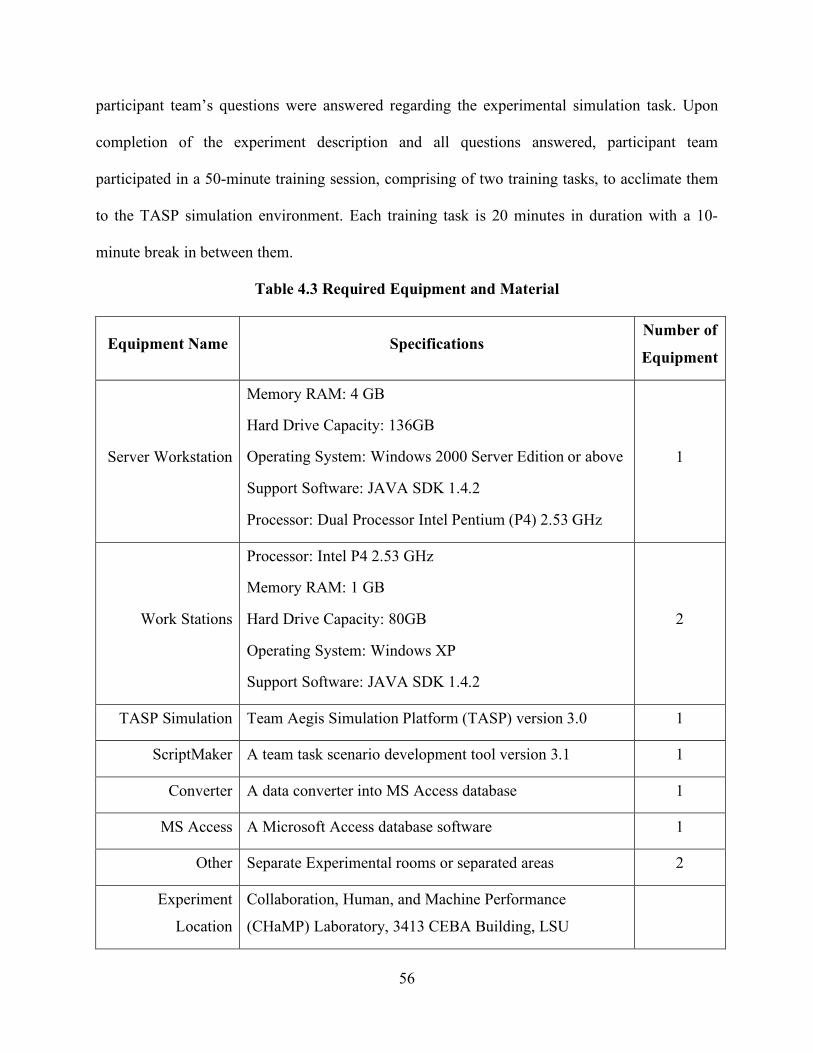
56
participant team’s questions were answered regarding the experimental simulation task. Upon
completion of the experiment description and all questions answered, participant team
participated in a 50-minute training session, comprising of two training tasks, to acclimate them
to the TASP simulation environment. Each training task is 20 minutes in duration with a 10-
minute break in between them.
Table 4.3 Required Equipment and Material
Equipment Name Specifications Number of
Equipment
Server Workstation
Memory RAM: 4 GB
Hard Drive Capacity: 136GB
Operating System: Windows 2000 Server Edition or above
Support Software: JAVA SDK 1.4.2
Processor: Dual Processor Intel Pentium (P4) 2.53 GHz
1
Work Stations
Processor: Intel P4 2.53 GHz
Memory RAM: 1 GB
Hard Drive Capacity: 80GB
Operating System: Windows XP
Support Software: JAVA SDK 1.4.2
2
TASP Simulation Team Aegis Simulation Platform (TASP) version 3.0 1
ScriptMaker A team task scenario development tool version 3.1 1
Converter A data converter into MS Access database 1
MS Access A Microsoft Access database software 1
Other Separate Experimental rooms or separated areas 2
Experiment
Location
Collaboration, Human, and Machine Performance
(CHaMP) Laboratory, 3413 CEBA Building, LSU

57
Participant teams were informed to come for second stage, experimental stage, provided
they meet the minimum required team performance of identifying 50 percent of the given target
objects. Experimental stage consists of a quick review and performing the actual experimental
task scenario (30 mins) followed by post-experimental data collection (Perceived Task-Workload
Survey or NASA TLX Form). Past studies by Rothrock (2001 and 2002) and colleagues
observed lack of interest by the teams if duration of the team simulation games is more than 30
minutes. Thus, all the actual experimental scenarios are created for 30 minutes in duration.
Table 4.4 Experimental Procedure
Experimental Stage Time Description
Training Stage Day 1- Duration = 70 minutes
Participant Data
Collection 10 mins
Participant Information and Prior Experience
Questionnaire, Experiment Consent Forms.
Task Description and
Guidelines 15 mins
Task-description and guidelines packet will be given for
reading and concerning questions will be answered.
Training Task 1 20 mins TASP simulation training task 1
Break 10 mins Ten-minute break period
Training Task 2 20 mins TASP simulation training task 2
Experimental Stage Day 2 – Duration = 50 minutes
Quick Review 10 mins Brief review of the experimental task and guidelines packet
Experimental Scenario 30 mins Randomly assigned scenario (out of 20 scenarios) would
be performed by the team
Post-experimental data
collection 10 mins
Perceived Task-Workload Survey (NASA TLX form) –
used for cross validation of the team task-performance

58
4.4.1 Experimental Task
The present study used the 2-Role Team Aegis Simulation Platform (TASP) simulation
where the team is organized into a command hierarchy of one team leader (AAWC) and one
supporting team member. The 2-Role TASP Simulation requires 3-networked computers, one
server computer and the remaining two computers were used by each team member. The
overarching team responsibilities are protecting their own ship and other friendly assets in the
battlegroup by monitoring the airspace, identifying unknown air contacts, and taking both
defensive and offensive actions as prescribed by the Rules of Engagement (ROEs) (refer to Table
12). Description of rules of engagement (ROEs) would be provided during the training
stage/experimental stage to all the team members. These ROEs are same for all the 27
experimental scenarios (runs). A detailed view of experimental set-up is shown in the Figure 4.1.
Figure 4.1 Experimental Set-Up
4.4.1.1 Anti-Air Warfare Coordinator (AAWC)
The team leader, the Anti-Air Warfare Coordinator (AAWC), is responsible for
monitoring a radar scope and identifying all air contacts that appear on the screen. The radar

59
scope along with the air contacts are pictured on the right side of the interface displayed in
Figure 4.2. To make identifications, the AAWC may use a variety of information about the
unknown air contacts displayed in the Character Readout (CRO) located in the upper left-hand
corner of the screen. Examples of this information include altitude, speed, range from their own
ship, point of origin, and direction of travel. The AAWC uses either the keyboard or a mouse to
interact with the menu displayed across the bottom of the interface. The AAWC coordinates with
the supporting team member, Air Intercept Coordinator (AIC), to obtain additional information
prior to making identifications. Table 4.5 shows the primary tasks of Anti-Air Warfare
Coordinator (AAWC) and Table 4.6 shows the TASP simulation rules of engagement.
4.4.1.2 Air Intercept Coordinator (AIC)
The Air Intercept Coordinator (AIC) is responsible for monitoring, managing, and
protecting friendly air assets called Defensive Counter Aircraft (DCA). DCA may be ordered by
the AIC to vector to an unidentified air contact and make a definitive visual identification (VID).
The control of DCA is accomplished using the panel under the CRO in Figure 4.3. Table 4.5
shows the primary tasks of Air Intercept Coordinator (AIC) and Table 4.6 shows the TASP
simulation rules of engagement.
Table 4.5 Primary Tasks: AAWC and AIC
AAWC (Primary Tasks) AIC (Primary Tasks)
Enter track designation Engage track from DCA
Enter track primary identification Illuminate track from DCA
Engage track from own ship Vector DCA to obtain track VID
Illuminate track from own ship Vector DCA to refuel
Requisition replacement DCA Vector DCA to range within 256 NM
Vector DCA to range outside of 20 NM
Vector DCA outside of danger zone

60
Figure 4.2 AAWC Interface
The new CRO - These values are
synchronized on all two workstations.
The DCA information panel that provides
updates on all DCA launched. The Selected Track is in Blue
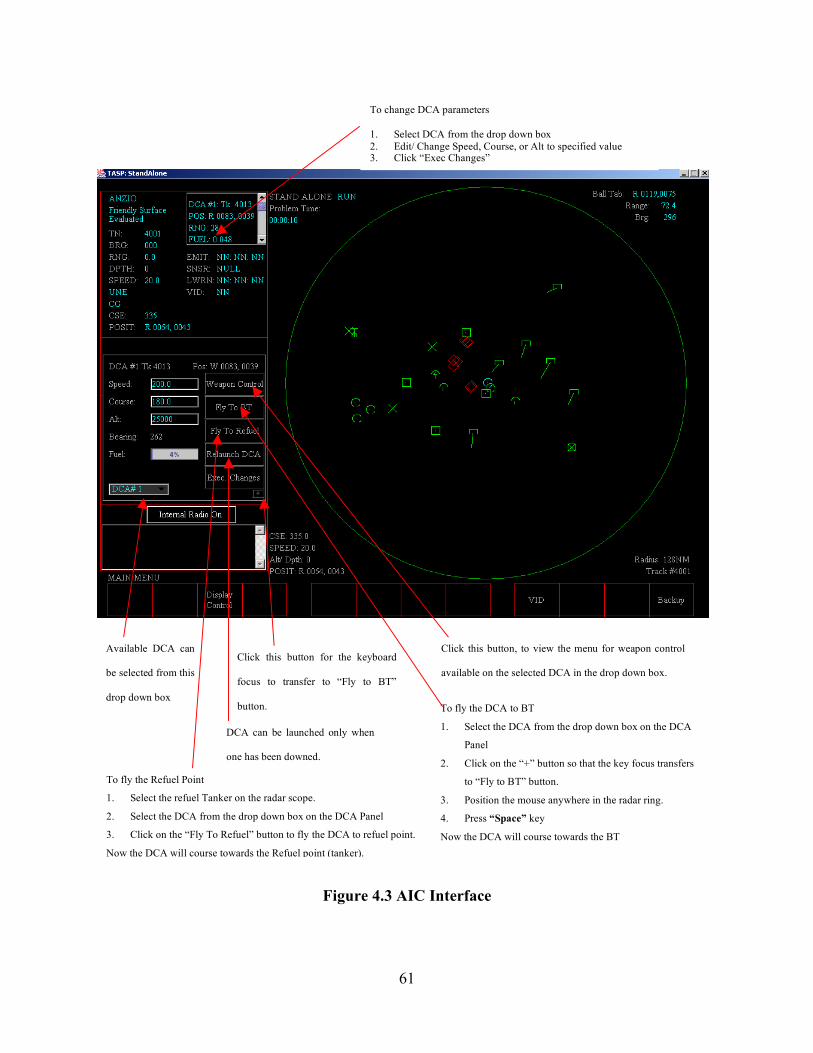
61
Figure 4.3 AIC Interface
Click this button for the keyboard
focus to transfer to “Fly to BT”
button.
Available DCA can
be selected from this
drop down box
To change DCA parameters
1. Select DCA from the drop down box 2. Edit/ Change Speed, Course, or Alt to specified value 3. Click “Exec Changes”
To fly the DCA to BT
1. Select the DCA from the drop down box on the DCA
Panel
2. Click on the “+” button so that the key focus transfers
to “Fly to BT” button.
3. Position the mouse anywhere in the radar ring.
4. Press “Space” key
Now the DCA will course towards the BT
DCA can be launched only when
one has been downed.
Click this button, to view the menu for weapon control
available on the selected DCA in the drop down box.
To fly the Refuel Point
1. Select the refuel Tanker on the radar scope.
2. Select the DCA from the drop down box on the DCA Panel
3. Click on the “Fly To Refuel” button to fly the DCA to refuel point.
Now the DCA will course towards the Refuel point (tanker).

62
Table 4.6 TASP Simulation Rules of Engagement (ROEs)
TASP Rule
Number Description of Rules of Engagement (ROEs)
1 All hostile air platforms within the range of 20 NM must be engaged
2 All hostile air platforms within the range of 30 NM must be illuminated
3 All hostile air platforms must be issued a level 1 warning between the ranges of
50 and 40 NM (given once)
4 All hostile air platforms must be issued a level 2 warning between the ranges of
40 and 30 NM (given once)
5 All hostile air platforms must be issued a level 3 warning between the ranges of
30 and 20 NM (given once)
6 DCAs are restricted to fly between 20 and 256 NM
7 All unknown tracks (i.e., hostile & neutral platforms) must be assigned correct
primary identifications
8 All unknown tracks (i.e., hostile & neutral platforms) must be assigned correct
designations
9 AIC must follow all lawful AAWC orders (i.e., consistent with Rules 1-8)
10 Maintain DCA’s by taking preventive measures such as timely refuel, avoiding
danger zone and being engaged.
4.4.1.3 Script Maker
The scenario generation tool, called Script Maker (Rothrock, 2002) provides the context
for the simulation through the construction of scenario events that are bounded by temporal,
kinematic, and knowledge-based constraints (Builder, 1983; Pace, 1986; Cannon-Bowers, Burns,
Salas, and Pruitt, 1998; Maule, Hockey, and Bdzola, 2000). The present study uses the Script
Maker tool to create a set of scenarios that require extensive use of teamwork skills. For
example, incorporating a large number of events that are likely to overwhelm one of the team
members creates a situation that requires the teamwork skill of backing up your teammate.

63
Similarly, designing a scenario in which the context dramatically changes (perhaps from routine
to threatening) requires the use of effective leadership and communication to help the team
maintain a common situational awareness.
4.4.1.4 Converter
TASP Simulation collects the data of both the AAWC and AIC operators every 6 seconds
and stores them as the text files. These text files later can be converted into MS Access database
using the Converter software. The required information for the present research could be further
synthesized to calculate the team performance for that particular scenario (one of the 27 runs of
the 33 full factorial design as shown in the Table 4.7).
4.4.1.5 Task-Complexity Metrics and Quantification
Task-complexity score is calculated by means of the chunks of information as the
metrics. An example scenario will be explained for better understanding.
Example Scenario [Task (-1, 0, 1)]: A task scenario of low task scope (-1) that requires
medium coordination (0) with high uncertainty (1) is,
T (-1, 0, 1) = Identifying 10 Objects (Hostile & Friendly) to be identified with 4 objects
requiring coordination with 5 ideal interactions per object while encountering 8 random (or
unexpected) events.
1. Task-Scope
Number of sub-tasks or objectives, O = 10 unidentified planes (chunks of information)
Amount of information processed, I = (total number of planes) * (number of parameters
processed per plane + number of rules of engagement) = (TP) * (P + ROEs)
Amount of information, I = (20) * (6 + 10) = 320 (chunks of information)
Total number of planes used in the scenario, TP = 20 (chunks of information)

64
Number of parameters processed per plane, P = 6 (such as range, track number, VID
number, IFF code, altitude and speed)
Total task-scope (S) = number of sub-tasks (O) + amount of information (I) (3)
Total task-scope, S= 10 + 320 = 330 (chunks of information)
2. Task-Coordination
Number of interactions needed to achieve an objective = 5 (chunks of information flow)
Each Interaction ideally requires: AAWC requests VID from AIC + AIC requests track
information from AAWC+ AAWC sends Track information to AIC + AIC sends VID
information to AAWC+ AAWC confirms VID
Total task-coordination I = Number of objectives that require an coordination * 5
Total task-coordination I = 4*5 =20 (chunks of information flow)
3. Task-Uncertainty
Internal Confidence = Amount of Uncertainty = 0
External Constraints = No External Constraints = 0
Random Events = Number of Unexpected Events = 8 unexpected planes (chunks of information)
Total Uncertainty (U) = 8 (chunks of information of unexpected planes)
4.4.1.6. Team Performance
The performance measurement approach is centered on a measurement construct called
time windows (Rothrock, 2001). A time window is essentially an opportunity for an action to be
taken. Each action required by a time window has a specified initial condition at which it
becomes appropriate and a specified close condition, before which it must be performed. This
interval is the time window associated with the action. Outcomes can be classified into the six
categories explained in Figure 2.4 (refer to section 2.7.1). These categories form the basis on

65
which TASP measures performance of experimental participants. To illustrate, consider that an
unknown track has appeared on the radar. This event opens a time window for the action –
“identify track”. This time window closes when the opportunity no longer exists, in this case,
whenever the track disappears from the radar. Once this time window closes, any action is
considered late. If an action was taken, then it fits into one of the four categories of correct action
shown in Figure 2.4 (refer to section 2.7.1). If no action is taken, it’s a miss, and if an action is
taken without an opportunity, it’s a false alarm.
In the recent discussions with, Rothrock (2005), early correct and late correct actions can
be considered as false alarms since they do not practically exist. Thus early correct (2) and late
correct (3) should be categorized and placed with false alarms (5). Figure 2.5 (refer to section
2.7.1) shows a modified version of the possible time window outcomes. In TASP, a complete list
of time windows is generated by listing all possible opportunities available to a specified role.
TASP simulation uses blackboard agents to continuously monitor each workstation for
conditions to open and close time windows.
Another distinctive feature of TASP is its ability to measure team performance metrics
such as information exchange, communications, and supportive behavior (backup and error
correction). Based on the nature of the corresponding role, each time window is categorized as
primary, backup or error correction. Primary time windows relate to tasks that a team member
performs to meet responsibilities characterizing his role. Backup time windows are those that
relate to tasks in which a team member assists another team member in achieving his primary
responsibilities. Error correction time windows provide team members with an opportunity to
rectify an inaccurately performed task.

66
The simulation has data logging capabilities that record an operator’s resource
management and problem solving skills. Seven output files are generated during each session of
experimentation. During the simulation, the simulation explicitly logs opening and closing times
of each time window, responses by team members and evolving state of the environment. These
output files record detailed information, such as mouse clicks and keyboard presses, along with
time stamps and the state of the environment at which it was executed. These data files provide
valuable resources for conducting a wide range of performance analyses on the team and its
participants. Based on the training objective, the investigator has the capability to consolidate
and associate different sources of data elements.
Team performance would be determined based on the number of objectives correctly
identified (on-time). Number of objectives that are identified correctly (early and/or late) are
considered as false alarms (Rothrock, 2005). The percentage of correctly identified objectives
(on-time) will be the measure of team performance.
4.5 Hypothesis Analysis
A multiple linear regression analysis was performed to capture and view the over all
contribution of each dimension towards complexity and performance. Instead of using partial
regression analysis to test each hypothesis, effect tests and analysis of higher order interactions
from the full multiple linear regression analysis were used for robustness and maximum error
degrees of freedom.
4.5.1 Hypothesis 1
Task-scope, task-coordination, and task-uncertainty, as dimensions of task complexity,
do not contribute in equal proportion to the team task-performance.

67
Dependent Variable : team task-performance
Independent Variable : task-scope, task-coordination, task uncertainty
Scenarios (runs) data from Table 4.7 (refer to section 4.1) were used to evaluate and test
hypothesis 1. A multiple linear regression analysis was performed to evaluate and test the
hypothesis 1 and to know the over all contribution of the three proposed task dimensions (task-
scope, task-coordination and task-uncertainty) towards task-complexity and task-performance.
Hypothesis 1 also validates whether the three task complexity dimensions were equally
contributing towards team task-complexity and task-performance or not. This is a full model
analysis and evaluates all the three main affects (scope, coordination and uncertainty) and
interactions with the maximum degrees of freedom. Detailed explanation of the effect tests and
full model analysis of task-scope, task-coordination and task-uncertainty effect on task
performance was presented in the results section.
4.5.2 Hypothesis 2
Task-scope and task-coordination, as dimensions of task complexity, do not contribute in
equal proportion to the team task-performance.
Fixed Variables : task-uncertainty (=0)
Dependent Variable : team task-performance
Independent Variable : task-scope, task-coordination
The objective of hypothesis 2 was to evaluate whether the task-scope and task-
coordination are contributing equally towards the team task-performance or not when uncertainty
is negligible. In other words it is the full model to know the over all contribution of the task-
scope and task-coordination dimensions towards task-complexity and task-performance when
task-uncertainty negligible or zero. Though partial regression analysis option could be

68
considered, it has less number of degrees of freedom to validate the task-scope and task-
coordination when uncertainty is negligible or zero. Effect tests from the full multiple linear
regression analysis evaluate all the main affects and interactions with the maximum degrees of
freedom. Thus, there is no need to specially use contrasts or partial multiple linear regression
analysis to test the hypothesis 2.
In order to evaluate the hypothesis 2 and to understand the significance of task-scope and
task-coordination, multiple linear regression was performed with task-uncertainty constant at low
level (-1). Hypothesis 2 shows whether the task-scope and task-coordination are contributing
equally towards the team task-performance or not. Detailed explanation of the effect tests and
analysis of task-scope and task-coordination effect on task performance was presented in the
results section.
4.5.3 Hypothesis 3
Difference in team task performance exists as task complexity is increased by the task-
scope (number of sub-tasks and the amount of information-processed).
Dependent Variable : team task-performance
Independent Variable : task scope
The objective of hypothesis 3 was to evaluate whether the task-scope is affecting the
team task-performance significantly as a task-dimension or not. Though partial regression
analysis option could be considered, it has less number of degrees of freedom to validate the
task-scope and also not robust. Effects tests from the full multiple linear regression analysis
evaluate all the main affects and interactions with maximum degrees of freedom. Thus there is
no need to specially use contrasts or partial regression analysis to test the hypothesis 3 on task-
69
scope. Detailed explanation of the effect tests and analysis of task-scope’s effect on task
performance was presented in the results section.
4.5.4 Hypothesis 4
Difference in team task performance exists as task complexity is increased by the task-
coordination (number of coordination information flows and interactions).
Dependent Variable : team task-performance
Independent Variable : task-coordination
The objective of hypothesis 4 was to evaluate whether the task-coordination is affecting
the team task-performance significantly as a task-dimension or not. Though partial regression
analysis option could be considered, it has less number of degrees of freedom to validate the
task-coordination and also not robust. Effects tests from the full multiple linear regression
analysis evaluate all the main affects and interactions with the maximum degrees of freedom.
Thus there is no need to specially use contrasts or partial regression analysis to test the
hypothesis 4. Detailed explanation of the effect tests and analysis of task-coordination’s effect on
task performance was presented in the results section.
4.5.5 Hypothesis 5
Difference in team task performance exists as task complexity is increased by the task-
uncertainty (number of internal, external uncertainty and random events).
Dependent Variable : team task-performance
Independent Variable : task uncertainty
The objective of hypothesis 5 was to evaluate whether the task-uncertainty is affecting
the team task-performance significantly as a task-dimension or not. Though partial regression
analysis option could be considered, it has less number of degrees of freedom to validate the

70
task-scope and also not robust. Effects tests from the full multiple linear regression analysis
evaluate all the main affects and interactions with maximum degrees of freedom. Thus there is
no need to specially use contrasts or partial regression analysis to test the hypothesis 5. Detailed
explanation of the effect tests and analysis of task-uncertainty’s effect on task performance was
presented in the results section.

71
CHAPTER 5
RESULTS AND DISCUSSION
The analysis of the data collected in the experiments is presented in this section. The
results associated with the analysis of each hypothesis are considered and discussions are
presented to investigate the effect of task-scope, task-coordination and task-uncertainty
dimensions of the team task complexity space on team performance.
5.1 Experimental Results
A full 33 factorial design was used during the experiment. A total of 54 teams completed
27 experimental scenarios (e.g., 2 teams per scenario). Summary of the task performance data
was depicted in the Table 5.1. It gives average task performance and standard deviation for each
of the 27 experimental scenarios. From Table 5.1, the average task-performance for all the teams
regardless of condition was 0.7114 (out of maximum possible 1.0) or 71.14 percent and the total
average standard deviation was 0.0581. Here the performance scale is based on the percentage
of number of successful tasks accomplished on time during the team simulation scenarios. For
some of the scenarios with combination of lower levels of scope with either coordination or
uncertainty, the performance of the two different teams was the same. Thus this explains why
some standard deviations are zero. A detailed explanation of the statistical analysis would be
presented in the following sub-sections. First, a full model analysis would be discussed before
discussing the individual hypothesis analysis.
5.1.1 Hypothesis 1: Full Model Analysis
Task scope, task-coordination, and task-uncertainty, as dimensions of task complexity, do
not contribute in equal proportion to the team task-performance.
Dependent Variable : team task-performance
Independent Variable : task-scope, task-coordination, task-uncertainty

72
Table 5.1 Summary of Team Performance Data
Team Task performance Run
Number Task scope
Task co-ordination
Task un-certainty Avg.
Performance Standard Deviation
1 -1 -1 -1 1 0 2 -1 -1 0 0.8 0 3 -1 -1 1 0.75 0.071 4 -1 0 -1 0.8 0 5 -1 0 0 0.5 0 6 -1 0 1 0.7 0 7 -1 1 -1 0.75 0.071 8 -1 1 0 0.5 0 9 -1 1 1 0.4 0.141
10 0 -1 -1 0.925 0.035 11 0 -1 0 0.7 0.071 12 0 -1 1 0.825 0.106 13 0 0 -1 0.7 0 14 0 0 0 0.825 0.106 15 0 0 1 0.675 0.035 16 0 1 -1 0.775 0.106 17 0 1 0 0.65 0.141 18 0 1 1 0.65 0.141 19 1 -1 -1 0.933 0 20 1 -1 0 0.783 0.024 21 1 -1 1 0.7 0.047 22 1 0 -1 0.883 0.024 23 1 0 0 0.533 0.094 24 1 0 1 0.7 0.047 25 1 1 -1 0.767 0.047 26 1 1 0 0.45 0.165 27 1 1 1 0.533 0.094
Overall Average Team Task Performance = 0.7114 Overall Standard Deviation of Team Task Performance = 0.0581
Number of Experiments = 27 Number of Repetitions = 2
Total Number of Experiments/Teams = 54

73
Full model with repeated runs or scenarios gave team performance data of 54 teams and
provided great scope for validating the influence of various levels of the proposed task-
complexity dimensions on task performance. A multiple linear regression analysis was
performed to validate whether all the three task-complexity dimensions conform to a linear fit
with respect to team performance. The Analysis of Variance (ANOVA) model is used to
accommodate the 3 levels of each task-complexity dimension and avoid the requirement that the
3 levels of any given task-complexity dimension be equally spaced. Analysis of Variance
(ANOVA) is also used to account variance in measurement scales and not to force linear
relationship. Multiple linear regression analysis of the full model shows that R-square fit is
0.878, which confirms that the model accounts for 88% of the variability in team performance
(See Figure 5.1 and Table 5.2). Though participant teams were given proper training and
checked for same level of prior experience, there always exists some variability between
participant team members and also among the participant teams. Similarly the experimental
testing equipment and measurements have some variability. Therefore, the remaining 12% of
the model could be attributed to variability associated with experimental testing equipment,
measurements and participants. There might also be potential other variables contributing to the
remaining 12% of the model. But accounting 88% of variability in the team performance is a
very good amount and strong enough to support the validity of this model. Analysis of variance
(See Table 5.3) also strongly supports that the model was significant (p < 0.0001). Therefore, the
model was strong and significant.
Results from the effects tests of the full model were depicted in the Table 5.4. The three-
way interaction of scope, coordination, and uncertainty was significant (p=0.019). In addition,
the two-way interaction between scope and uncertainty was found to be significant (p= 0.0282).
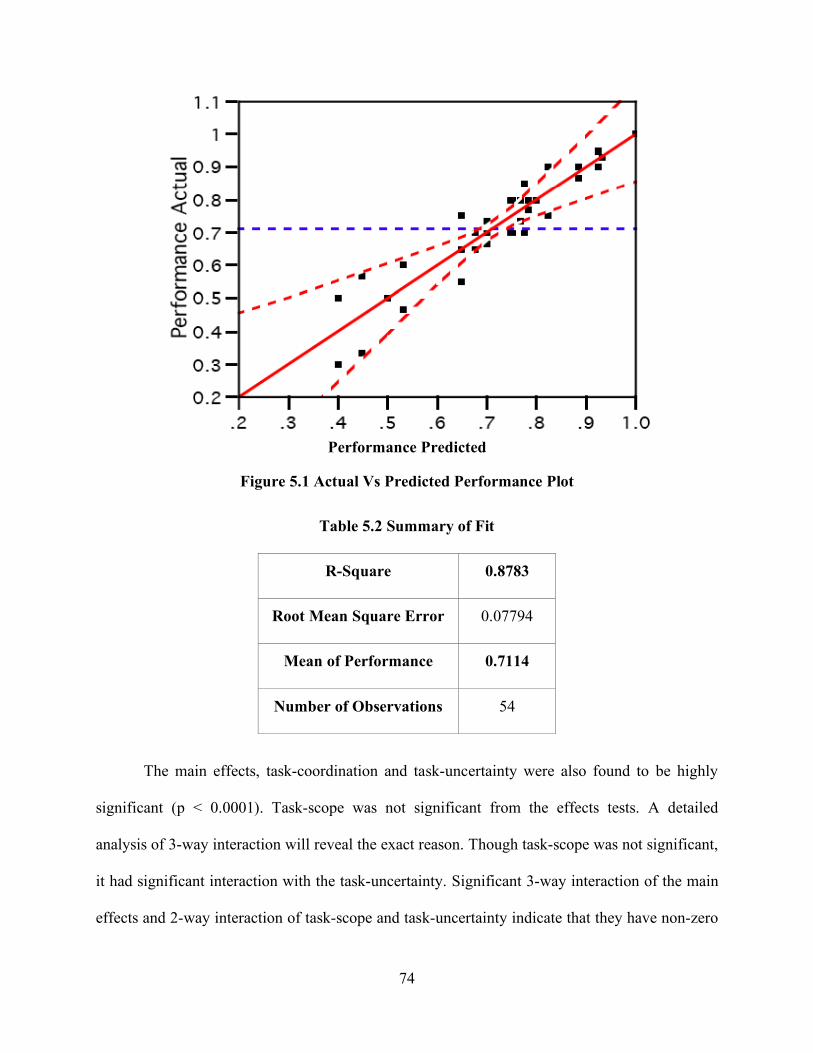
74
Performance Predicted
Figure 5.1 Actual Vs Predicted Performance Plot
Table 5.2 Summary of Fit
R-Square 0.8783
Root Mean Square Error 0.07794
Mean of Performance 0.7114
Number of Observations 54
The main effects, task-coordination and task-uncertainty were also found to be highly
significant (p < 0.0001). Task-scope was not significant from the effects tests. A detailed
analysis of 3-way interaction will reveal the exact reason. Though task-scope was not significant,
it had significant interaction with the task-uncertainty. Significant 3-way interaction of the main
effects and 2-way interaction of task-scope and task-uncertainty indicate that they have non-zero
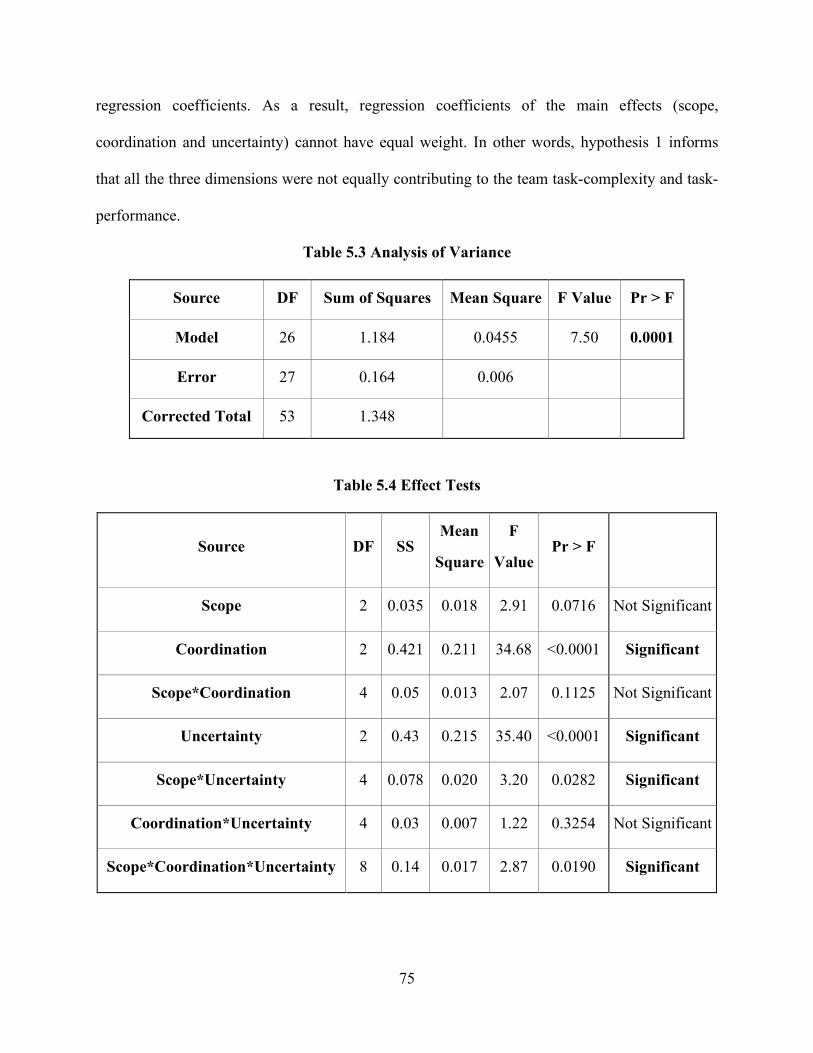
75
regression coefficients. As a result, regression coefficients of the main effects (scope,
coordination and uncertainty) cannot have equal weight. In other words, hypothesis 1 informs
that all the three dimensions were not equally contributing to the team task-complexity and task-
performance.
Table 5.3 Analysis of Variance
Source DF Sum of Squares Mean Square F Value Pr > F
Model 26 1.184 0.0455 7.50 0.0001
Error 27 0.164 0.006
Corrected Total 53 1.348
Table 5.4 Effect Tests
Source DF SS Mean
Square
F
Value Pr > F
Scope 2 0.035 0.018 2.91 0.0716 Not Significant
Coordination 2 0.421 0.211 34.68 <0.0001 Significant
Scope*Coordination 4 0.05 0.013 2.07 0.1125 Not Significant
Uncertainty 2 0.43 0.215 35.40 <0.0001 Significant
Scope*Uncertainty 4 0.078 0.020 3.20 0.0282 Significant
Coordination*Uncertainty 4 0.03 0.007 1.22 0.3254 Not Significant
Scope*Coordination*Uncertainty 8 0.14 0.017 2.87 0.0190 Significant

76
5.1.2 Analysis of 3-Way Interaction
Results from the effect tests indicate that task-coordination and task-uncertainty were
very significant. However, another main affect, task-scope was not significant. But 3-way
interaction of the main effects was significant, so a thorough analysis of 3-way interaction was
needed. Roles of task-scope, task-coordination and task-uncertainty were evaluated and studied
to know their importance at various levels.
Task-Scope Role in 3-Way Interaction: Since task-coordination and task-uncertainty
were strongly significant and their 2-way interaction was not significant, first task-scope’s role
was evaluated in this 3-way interaction analysis. Thus, it is very useful to understand how the
task-scope played a role in 3-way interaction and affecting the team performance at various
levels of complexity. The 3-way interaction is sliced by 2-way interaction between task-
coordination and task-uncertainty to understand the role of task-scope. Results from this 3-way
interaction analysis were depicted in the Table 5.5. Results indicate that task-scope was playing
significant role in the following combinations of task-coordination and task-uncertainty levels
• When task-coordination at medium (0) level and task-uncertainty medium (0) level
• When task-coordination at high (1) level and task-uncertainty medium (0) level
• When task-coordination at high (1) level and task-uncertainty high (1) level
Though task-scope came out not very significant, the three-way interaction analysis
shows that it is in fact playing a significant role to some extent.
Task-Coordination Role in 3-Way Interaction: It is also very useful to understand how
the task-coordination played a role in 3-way interaction and affecting the team performance at
various levels of complexity. The 3-way interaction is sliced by 2-way interaction between task-
scope and task-uncertainty to understand the role of task-coordination.

77
Table 5.5 Task-Scope Role in 3-Way Interaction
Scope*Coordination*Uncertainty Effect Sliced by Coordination*Uncertainty for
Performance
Coordination Uncertainty DF Sum of
Squares
Mean
Square F Value Pr > F
-1 -1 2 0.007 0.003380 0.56 0.5798 Not Significant
-1 0 2 0.0115 0.005741 0.94 0.4012 Not Significant
-1 1 2 0.016 0.007917 1.30 0.2882 Not Significant
0 -1 2 0.034 0.016852 2.77 0.0802 Not Significant
0 0 2 0.128 0.063935 10.52 0.0004 Significant
0 1 2 0.0008 0.000417 0.07 0.9339 Not Significant
1 -1 2 0.0007 0.000324 0.05 0.9482 Not Significant
1 0 2 0.043 0.021667 3.57 0.0422 Significant
1 1 2 0.063 0.031296 5.15 0.0127 Significant
Results from this 3-way interaction analysis were depicted in the Table 5.6. Results
indicate that task-coordination was playing significant role in the following combinations of
task-scope and task-uncertainty levels,
• When task-scope at low (-1) level and task-uncertainty low (-1) level
• When task-scope at low (-1) level and task-uncertainty medium (0) level
• When task-scope at low (-1) level and task-uncertainty high (1) level
• When task-scope at medium (0) level and task-uncertainty low (-1) level
• When task-scope at high (1) level and task-uncertainty medium (0) level
Though task-coordination came out very significant in the effect tests, the 3-way
interaction analysis shows that it is better than task-scope and contributing significantly in the 3-
way interaction.

78
Table 5.6 Task-Coordination Role in 3-Way Interaction
Scope*Coordination*Uncertainty Effect Sliced by Scope*Coordination for Performance
Scope Coordination DF Sum of
Squares
Mean
Square F Value Pr > F
Low (-1) Low (-1) 2 0.07 0.035 5.76 0.0082 Significant
Low (-1) Medium (0) 2 0.12 0.06 9.88 0.0006 Significant
Low (-1) High (1) 2 0.143 0.072 11.80 0.0002 Significant
Medium (0) Low (-1) 2 0.053 0.026 4.32 0.0235 Significant
Medium (0) Medium (0) 2 0.033 0.016 2.67 0.0871 Not Significant
Medium (0) High (1) 2 0.036 0.018 2.95 0.0694 Not Significant
High (1) Low (-1) 2 0.03 0.015 2.41 0.1091 Not Significant
High (1) Medium (0) 2 0.12 0.06 9.91 0.0006 Significant
High (1) High (1) 2 0.037 0.019 3.05 0.0640 Not Significant
Task-Uncertainty Role in 3-Way Interaction: It is also very useful to understand how
the task-uncertainty played a role in 3-way interaction and affecting the team performance at
various levels of complexity. The 3-way interaction is sliced by 2-way interaction between task-
scope and task-coordination to understand the role of task-uncertainty. Results from this 3-way
interaction analysis were depicted in the Table 5.7. Results indicate that the task-uncertainty was
playing highly significant role in almost all combinations of task-scope and task-coordination
levels.
The following are the combinations, where it was not significant,
• When task-scope at medium (0) level and task-coordination medium (0) level
• When task-scope at medium (0) level and task-coordination high (1) level
Task-uncertainty is highly significant from the effect tests. Now, the 3-way interaction
analysis also shows that, task-uncertainty is playing a significant role better than task-scope and
task-coordination as well as contributing to the maximum extent in the 3-way interaction.

79
Table 5.7 Task-Uncertainty Role in 3-Way Interaction
Scope*Coordination*Uncertainty Effect Sliced by Scope*Coordination for Performance
Scope Coordination DF Sum of
Squares
Mean
Square F Value Pr > F
Low (-1) Low (-1) 2 0.070 0.035 5.76 0.0082 Significant
Low (-1) Medium (0) 2 0.093 0.047 7.68 0.0023 Significant
Low (-1) High (1) 2 0.130 0.065 10.70 0.0004 Significant
Medium (0) Low (-1) 2 0.051 0.025 4.18 0.0261 Significant
Medium (0) Medium (0) 2 0.026 0.013 2.13 0.1388 Not Significant
Medium (0) High (1) 2 0.021 0.01 1.71 0.1991 Not Significant
High (1) Low (-1) 2 0.056 0.028 4.60 0.0191 Significant
High (1) Medium (0) 2 0.123 0.06 10.09 0.0005 Significant
High (1) High (1) 2 0.11 0.054 8.87 0.0011 Significant
Summary of 3-way interaction analysis,
• The results indicate that task-scope was playing significant role in the 3-way interaction
only when task-coordination and task-uncertainty both are at levels (0, 0) or (1, 0) or (1,
1). Therefore, task-scope is significant only in three higher complexity conditions.
• Task-scope was not playing significant role in the 3-way interaction and towards task-
complexity and team performance.
Thus from the analysis of 3-way interaction, it is evident that task-scope as a dimension
playing a significant role at only few higher complexity levels of coordination and uncertainty.
Though the present study and experimental results won’t strongly support validity of task-scope
as a particular dimension, there is reasonable support of its significance at higher complexity
levels.

80
5.1.3 Hypothesis 2
Task-scope and task-coordination as dimensions of task complexity will not contribute in
equal proportion to the effect on team performance.
Fixed Variables : task-uncertainty (=0)
Dependent Variable : team task-performance
Independent Variable : task scope, task-coordination
The objective of hypothesis 2 was to evaluate whether the task-scope and task-
coordination are contributing equally towards the team task-performance or not when task-
uncertainty is negligible or zero. Though partial regression analysis option was considered
earlier, it did not provide enough degrees of freedom to validate the task-scope and task-
coordination when task-uncertainty is negligible or zero. But effects tests from the full multiple
linear regression analysis evaluate all the main affects and interactions with maximum degrees of
freedom. In order to evaluate the hypothesis 2, the 3-way interaction is sliced by main effect
task-uncertainty to understand the significance of task-scope and task-coordination when task-
uncertainty is negligible or zero.
Results from this 3-way interaction analysis were depicted in the Table 5.8. Detailed
explanation and analysis of the task-scope and task-coordination affect on task-performance
were presented below.
Results from the effect tests (Refer, Table 5.4) indicate that the 2-way interaction of task-
scope and task-coordination was not significant. But results from the analysis of 3-way
interaction sliced by main effect task-uncertainty, show that 2-way interaction of task-scope and
task-coordination is significant (p < 0.0081) when task-uncertainty was negligible or zero (at -1
level). Significant 2-way interaction of task-scope and task-coordination indicates that both are

81
significant task-complexity dimensions when uncertainty is zero. 2-way interaction of task-scope
and task-coordination also indicate that it has non-zero regression coefficient. As a result,
regression coefficients of the task-scope and task-coordination cannot have equal weight. In
other words, hypothesis 2 informs that the two dimensions, scope and coordination, were not
equally contributing to the team task-complexity and task-performance.
Table 5.8 Analysis of Hypothesis 2
Scope*Coordination*Uncertainty Effect Sliced by Uncertainty for
Performance
Uncertainty DF Sum of Squares Mean Square F Value Pr > F
-1 8 0.164475 0.020559 3.38 0.0081
0 8 0.341420 0.042677 7.02 <0.0001
1 8 0.248179 0.031022 5.11 0.0006
5.1.4 Hypothesis 3
Differences in team task performance exist as task complexity is increased by the task-
scope (number of sub-tasks and the amount of information-processed).
Dependent Variable : team task-performance
Independent Variable : task scope
The objective of hypothesis 3 was to evaluate whether the task-scope is affecting the
team task-performance significantly as a task-dimension or not. Though partial regression
analysis option was considered earlier, it did not provide enough degrees of freedom to validate
the task-scope and also, it is not robust. Effects tests from the full multiple linear regression
analysis evaluate all the main affects and interactions with the maximum degrees of freedom.
Therefore, there was no need to specially use contrasts or partial regression analysis to test the
hypothesis 3.
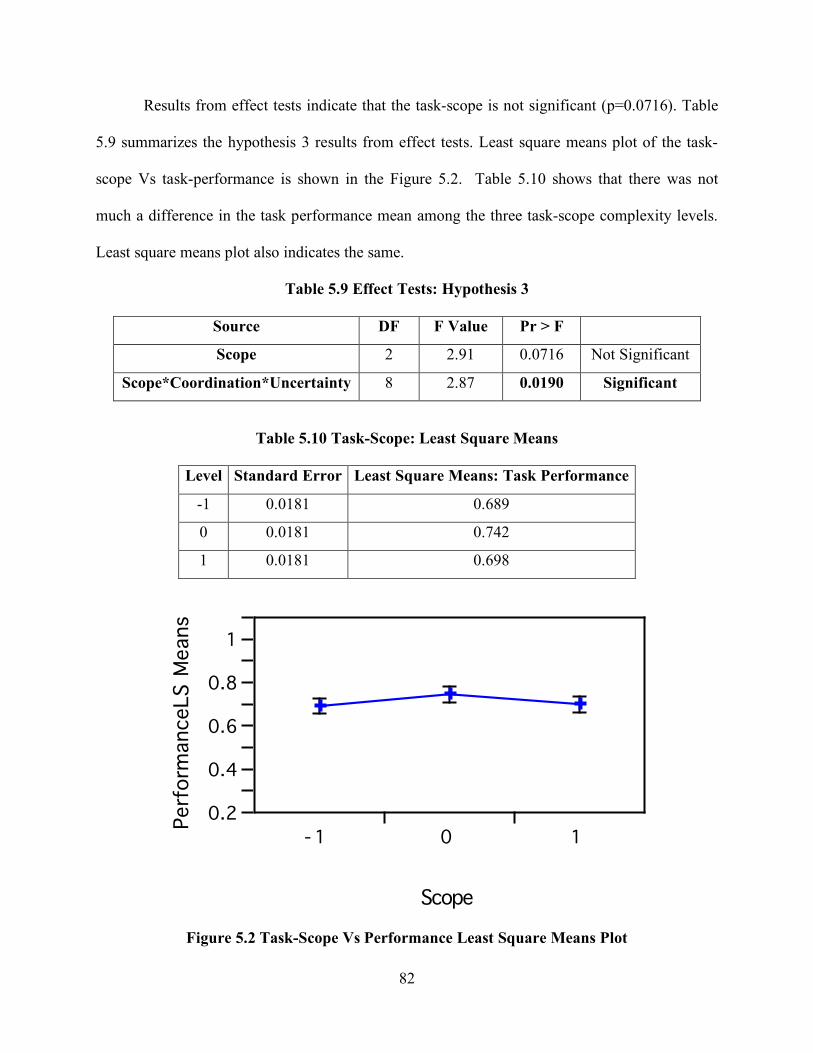
82
Results from effect tests indicate that the task-scope is not significant (p=0.0716). Table
5.9 summarizes the hypothesis 3 results from effect tests. Least square means plot of the task-
scope Vs task-performance is shown in the Figure 5.2. Table 5.10 shows that there was not
much a difference in the task performance mean among the three task-scope complexity levels.
Least square means plot also indicates the same.
Table 5.9 Effect Tests: Hypothesis 3
Source DF F Value Pr > F
Scope 2 2.91 0.0716 Not Significant
Scope*Coordination*Uncertainty 8 2.87 0.0190 Significant
Table 5.10 Task-Scope: Least Square Means
Level Standard Error Least Square Means: Task Performance -1 0.0181 0.689 0 0.0181 0.742 1 0.0181 0.698
Perf
orm
anceLS M
eans
0.2
0.4
0.6
0.8
1
- 1 0 1
Scope
Figure 5.2 Task-Scope Vs Performance Least Square Means Plot
83
Though task-scope came out insignificant from the effect tests, it was significant in
hypothesis 2 and it also had affect on performance at higher levels of task-coordination and task-
uncertainty as noted in the previous 3-way interaction analysis. Therefore, hypothesis 2 together
with 3-way interaction analysis shows that task-scope is significant when either the task-
uncertainty is zero or at the higher levels of task-coordination and uncertainty. From the above
discussion, we can conclude that task-scope is really playing a significant role although exactly
how it impacts the task as it is increased could not be teased out in this research. It appears that
while different levels of the task-scope were designed into the task, it alone has little to no affect
on performance. But it might be due to lack of physical workload in the team simulation task.
Therefore, task-scope might further be tested using a team task that has more physical
and information workload than a team simulation game. Also, further work needs to be done in
finding any other factors that could be grouped into task-scope. Appendix F shows actual SAS
code written for statistical analysis.
5.1.5 Hypothesis 4
Differences in team task performance exist as task complexity is increased by the task
coordination (number of coordination information flows and interactions).
Dependent Variable : team task-performance
Independent Variable : task-coordination
The objective of hypothesis 4 was to evaluate whether the task-coordination is affecting
the team task-performance significantly as a task-dimension or not. Though partial regression
analysis option was considered earlier, it did not provide enough degrees of freedom to validate
the task-coordination and also, it is not robust. Since effects tests from the full multiple linear

84
regression analysis evaluate all the main affects and interactions with the maximum degrees of
freedom, there was no need for contrasts or partial regression analysis to test the hypothesis 4.
Results from effect tests indicate that the task-coordination is highly significant (p <
0.0001). Table 5.11 summarizes the hypothesis 4 results from the effect tests. This provides
strong support for hypothesis 4 that task-coordination is a significant task-complexity dimension
effectively contributing to the team performance both from the effect tests as well as from the
significant 3-way interaction. Least square means plot of the task-coordination Vs task-
performance is shown in the Figure 5.3. Table 5.12 shows that there was gradual decrease in the
task performance means among the three task-coordination complexity levels. Least square
means plot also indicates the same.
Table 5.11 Effect Tests: Hypothesis 4
Source DF F Value Pr > F
Coordination 2 2.91 <0.0001 Significant
Scope*Coordination*Uncertainty 8 2.87 0.0190 Significant
Perf
orm
anceLS M
eans
0.2
0.4
0.6
0.8
1
- 1 0 1
Coordination
Figure 5.3 Task-Coordination Vs Performance Least Square Means Plot
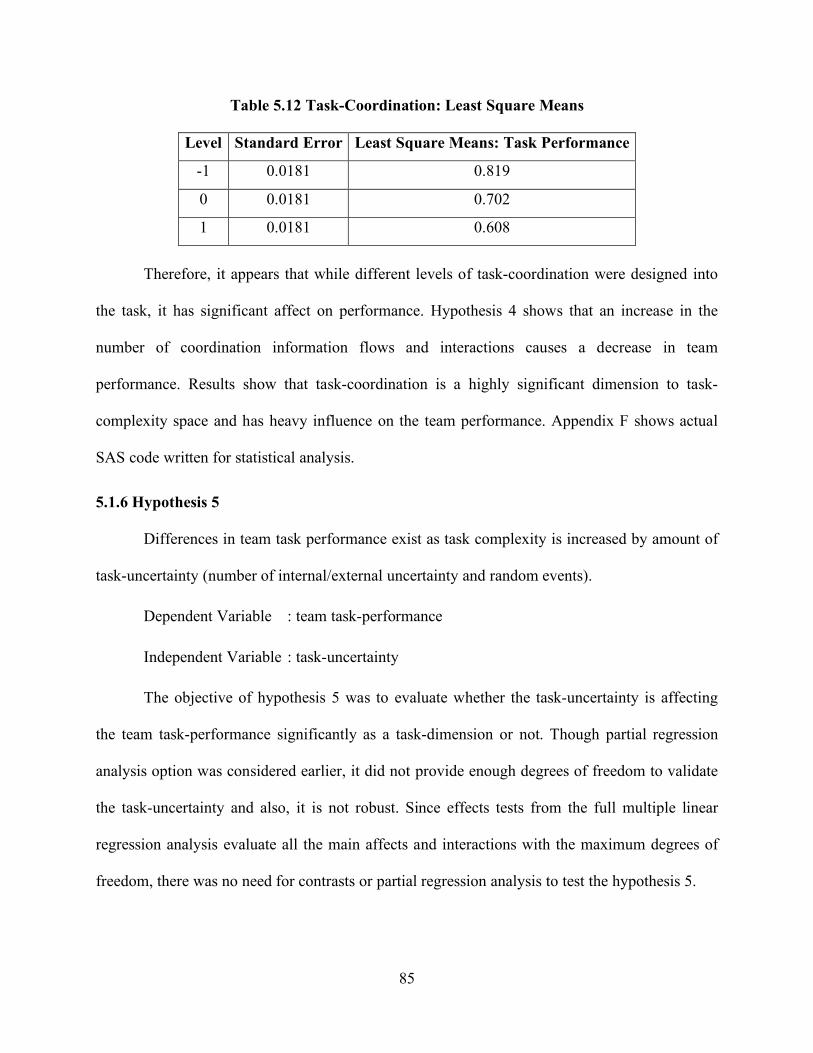
85
Table 5.12 Task-Coordination: Least Square Means
Level Standard Error Least Square Means: Task Performance -1 0.0181 0.819 0 0.0181 0.702 1 0.0181 0.608
Therefore, it appears that while different levels of task-coordination were designed into
the task, it has significant affect on performance. Hypothesis 4 shows that an increase in the
number of coordination information flows and interactions causes a decrease in team
performance. Results show that task-coordination is a highly significant dimension to task-
complexity space and has heavy influence on the team performance. Appendix F shows actual
SAS code written for statistical analysis.
5.1.6 Hypothesis 5
Differences in team task performance exist as task complexity is increased by amount of
task-uncertainty (number of internal/external uncertainty and random events).
Dependent Variable : team task-performance
Independent Variable : task-uncertainty
The objective of hypothesis 5 was to evaluate whether the task-uncertainty is affecting
the team task-performance significantly as a task-dimension or not. Though partial regression
analysis option was considered earlier, it did not provide enough degrees of freedom to validate
the task-uncertainty and also, it is not robust. Since effects tests from the full multiple linear
regression analysis evaluate all the main affects and interactions with the maximum degrees of
freedom, there was no need for contrasts or partial regression analysis to test the hypothesis 5.

86
Results from effect tests indicate that the task-uncertainty is highly significant (p <
0.0001). Table 5.13 summarizes the hypothesis 5 results from effect tests. This provides strong
support for hypothesis 5 that task-uncertainty is a significant task-complexity dimension
effectively contributing to team performance both from effect tests as well as from significant
three-way interaction.. Least square means plot of the task uncertainty Vs task performance is
shown in the Figure 5.4. Table 5.14 shows that though the medium (0) and high (1) task-
uncertainty levels have similar team performance means, there was gradual decrease in the task
performance means among the three task-uncertainty complexity levels. Least square means plot
also indicate the same.
Therefore, it appears that while different levels of task-uncertainty were designed into the
task, it has a significant effect on performance. Hypothesis 5 shows that an increase in the
uncertainty (number of random events) causes a decrease in team performance. Results show that
task-uncertainty is a highly significant dimension to task-complexity space and has heavy
influence on the team performance. Appendix F shows actual SAS code written for statistical
analysis.
Table 5.13 Effect Tests: Hypothesis 5
Source DF F Value Pr > F
Uncertainty 2 2.91 <0.0001 Significant
Scope*Coordination*Uncertainty 8 2.87 0.0190 Significant
Table 5.14 Task-Uncertainty: Least Square Means
Level Standard Error Least Square Means: Task Performance -1 0.0181 0.837 0 0.0181 0.632 1 0.0181 0.659

87
Perf
orm
anceLS M
eans
0.2
0.4
0.6
0.8
1
- 1 0 1
Uncertainty
Figure 5.4 Task-Uncertainty Vs Performance Least Square Means Plot
5.1.7 Perceived Task Work Load Vs Team Performance
As explained earlier, this research proposed a model of task-complexity based on
different task-characteristics including task-scope, task-coordination and task-uncertainty that
provide the capability to quantify different attributes that impact team performance. In other
words, team performance was studied from task-complexity perspective utilizing objective team
performance measure (Time Windows) in this model. However, most of the previous teams’
literature indicates the study and understanding of team performance from workload, a subjective
performance measure, perspective.
From Teams’ literature,
• An increase in workload (stress processes) causes a decrease in team performance due
to factors such as cognitive, physical, and temporal stress processes.
• However, team performance will decrease only after reaching a certain limit of
workload (Entin and Serfaty, 1999).
• Workload (stress processes) measure is used as subjective performance measure.

88
NASA Task Work Load Index (NASA TLX) was extensively used in teams’ literature
for gathering workload information to study team performances. Therefore, for cross validating
this model, perceived task-workload survey (NASA TLX) was performed for gathering
workload data from each participant team. After the experiment all the participant teams
completed NASA TLX forms to capture their perceived workload of the experimental task. Since
each participant teams consist of two people, an average of the two task workloads was
considered as the representation of team task workload.
Task-complexity literature shows contradictory findings about the relationship between
the task-complexity and task performance. But there is general feeling that both are negatively
correlated to each other. So, any indication of negative correlation of the workload and task-
performance supports and cross validates this model and the results of this research. Table 5.15
shows the pair-wise correlation analysis between perceived task-workload (NASA TLX) and
task-performance. Refer to Appendix H for the perceived task-complexity data tables.
Table 5.15 Pair-Wise Correlation: Work Load Vs Team Performance
Variable by Variable Pearson
Correlation (r) Count
Significant
Probability Work Load Performance -0.3203 54 0.0182 Results found a significant negative correlation (r = -0.3203, p=0.0182) between the
perceived task-workload and the task-performance, thereby validating the model from the
workload perspective. Therefore, it is evident from this correlation analysis that an increase in
the task-complexity causes a decrease in the task-performance.

89
CHAPTER 6
SUMMARY AND CONCLUSIONS
The Research conducted within this thesis was intended to develop and validate a
generalized task-complexity theory and framework by drawing on information from the
literature, previous work related to task-complexity, and the current experiment. As this research
comes to a close, it is important to reflect on the results, conclusions, why some hypotheses were
supported and while others were not. Reflection allows one to step back and understand the
importance of the research and the direction that should be taken in future research.
This chapter will first provide a brief overview of the major areas of literature. Next,
theoretical and practical implications will be drawn from the experimental results. Last, Future
work will be outlined to expand the knowledge of the engineering collaboration even further.
6.1 Reflections
6.1.1 Literature Reflection
Teams work in various work environments and domains solving complex problems.
Since teams perform tasks to solve organizations problems and accomplish the objectives. To
understand teams and tasks they perform require a broad understanding of the many team and
task factors, and good understanding of their collaboration process. Tasks, which teams perform,
are proven and considered as important moderators of team behavior and effectiveness. Since
teams engage in many different collective activities, a number of task typologies and descriptions
have been presented in the team related literature in an effort to better define and understand the
critical role of the tasks and the associated team processes. Though there were many task
typologies, the small group and team literature pointed out the importance to have a generalized
team–tasks oriented approach that conceives different teams as embedded entities in a task-space

90
developed based on the task context, task characteristics, and task-complexity. The management
and communication literature pointed out that all team tasks require better understanding among
the team members or coordination, and communication for rich interactions among the members.
Thus the team coordination and team communication are important team factors to be considered
in the generalized team–tasks oriented approach. Small group and teams literature also points out
that there is no comparison mechanism, especially quantitative comparison, of team performance
and teams working in various work environments need such mechanism for better task
distribution, communication patterns and work interfaces design. If organizations are to be
successful, we must create a generalized team theory and framework to evaluate the elements
that impact individual and team performance as well as an individual’s adaptability to
technology changes.
6.2 Implications
This research has evaluated and validated the proposed generalized team- task-
complexity model. Research yielded a significant negative correlation between task-complexity
and task-performance, supporting the notion that an increase in task-complexity causes a
decrease in team performance. The results of this research have both theoretical and practical
implications for team collaboration in complex settings.
6.2.1 Theoretical Contribution
This experiment provides a clearer understanding of the team and task factors (or
variables), grouped into three task-dimensions, which compose task-complexity and how these
affect the task performance. It thoroughly validated influence of various levels of the proposed
task-dimensions on task performance.
91
Hypothesis one, full model analysis, results support that the 3-way interaction of scope,
coordination, and uncertainty was significant. In addition, the 2-way interaction between scope
and uncertainty was found to be significant. The main effects, task-coordination and task-
uncertainty were also found to be highly significant. Task-scope was not significant from the
effects tests. Though task-scope was not significant, it had significant interaction with task-
uncertainty. Significant 3-way interaction of the main effects and 2-way interaction of task-scope
and task-uncertainty indicate that they have non-zero regression coefficients. As a result,
regression coefficients of the main effects (scope, coordination and uncertainty) cannot have
equal weight. In other words, hypothesis 1 informs that all the three dimensions were not equally
contributing to the team task-complexity and task-performance.
Hypothesis two was intended to test that task-scope and task-coordination are minimum
dimensions needed when uncertainty is negligible. Hypothesis two is drawn from the McGrath’s
(1984) definition of intellective tasks, which states that as tasks with known answers. Thus
uncertainty is either negligible or zero for intellective tasks. Results from the analysis of 3-way
interaction sliced by main effect task-uncertainty show that 2-way interaction of task-scope and
task-coordination is significant when task-uncertainty was negligible or zero (at -1 level).
Significant 2-way interaction of task-scope and task-coordination indicates that both are
significant task-complexity dimensions when uncertainty is zero. 2-way interaction of task-scope
and task-coordination also indicate that it has non-zero regression coefficient. As a result,
regression coefficients of the task-scope and task-coordination cannot have equal weight. In
other words, hypothesis 2 informs that the two dimensions, scope and coordination, were not
equally contributing to the team task-complexity and task-performance.

92
Task-scope dimension consists of two factors, number of sub-tasks and amount of
information processed. Teams that worked in less uncertainty and coordination seemed to be
quite successful irrespective of levels of task-scope. Team literature indicates that an increase in
number of tasks or amount of information processed causes more complexity. Contrary to earlier
researchers’ (Steiner, 1972; Wood, 1986; Campbell, 1988) findings, task-scope is slightly
significant at higher task-complexity levels. But its 2-way interaction with task-uncertainty as
well as 3-way interaction point out that it is still a major task dimension. Thus, hypothesis two
together with 3-way interaction analysis shows that task-scope is significant when either task-
uncertainty is zero or higher levels of task-coordination and task-uncertainty. From the above
discussion, we can conclude that task-scope is in fact playing a significant role although exactly
how it impacts the task as it is increased could not be teased out in this research. It appears that
while different levels of task-scope were designed into the task, it alone has little to no affect on
the performance. But it might be due to lack of physical workload in the selected TASP team
simulation task. Thus, task-scope might further be tested using a team task that has more
physical and information workload than a team simulation game. Though all these clearly
indicate that task-scope is significant enough, more thorough evaluation and testing might be
needed in future. Also, further work needs to be done in finding any other factors that could be
grouped into task-scope.
Hypothesis four results indicate that while different levels of task-coordination were
designed into the task, it has significant affect on performance. In other words, hypothesis four
shows that an increase in the number of coordination information flows and interactions causes a
decrease in team performance. Results show that task-coordination is highly significant
dimension to task-complexity space and has heavy influence on the team performance.
93
This research has shown that task-coordination is a highly significant dimension to task-
complexity space and has heavy influence on the team performance. In terms of coordination
needed for accomplishing team tasks, hypothesis four shows that an increase in number of
coordination information flows and interactions lead to a decrease in performance. Therefore,
hypothesis four results agree with the supporting literature (Wood, 1986; Chen and Lin, 2003).
Since the coordination needs a communication medium for information flows and interactions,
hypothesis four shows that the latest collaboration tools and groupware need to address the ways
to reduce the number of interactions and information flows to accomplish the team tasks.
Hypothesis five results supported the literature that indicates that uncertainty related to
relationship of sub-tasks, organizational external constraints, and unexpected events increases the
task complexity (Perrow, 1967; daft and Macintosh, 1981; Daft and Lengel, 1986; Wood, 1986;
Wood, 1988; Campbell, 1988; Specier, Vessey, and Valacich, 2003). Results show that task-
uncertainty is a highly significant dimension to task-complexity space and has heavy influence
on the team performance. Therefore, it appears that while different levels of task-uncertainty
were designed into the task, it has a significant effect on the performance. Hypothesis five results
show that an increase in the uncertainty (number of random events) causes a decrease in the team
performance.
In this model, team performance was studied from task-complexity perspective utilizing
objective team performance measure (Time Windows). However, most of the previous teams’
literature indicates the study and understanding of team performance from workload, a subjective
performance measure perspective. From teams’ literature, an increase in workload (stress
processes) causes a decrease in team performance due to factors such as cognitive, physical, and
temporal stress processes. However, team performance will decrease only after reaching a certain

94
limit of workload (Entin and Serfaty, 1999). Task-complexity literature shows contradictory
findings about the relationship between the task-complexity and task performance. But there is
general feeling that both are negatively correlated to each other. Therefore, any indication of
negative correlation of the workload and task-performance supports and cross validates this
model and the results of this research from workload perspective. The results from pair-wise
correlation analysis between perceived task-workload (NASA TLX) and task-performance
clearly indicated a significant negative correlation between them. Though teams’ literature shows
contradictory findings about the relationship between the task-complexity and task performance,
the findings of this research supports the general research community feeling of possible
negative correlation between them. Thus, it is clearly evident from this correlation analysis that
an increase in the task-complexity causes a decrease in the team performance.
This research was intended to develop a generalized team model from a task-complexity
perspective. The theoretical contribution of this research is a broader understanding of the human
and technology aspects of collaboration through a generalized team task-complexity approach. It
begins to clarify the task and team attributes (or factors) and their influence on people
performing collaborative tasks under various working domains. This generalized team–tasks
oriented approach conceives different teams as embedded entities in a task-space developed on
team and task attributes such as the task context, task characteristics, information processing,
coordination, communication and uncertainty. This generalized approach provides the
comparison mechanism platform, especially quantitative comparison, of team performance.
Teams working in various work environments need such quantitative comparison mechanism for
better task distribution, communication patterns and work interfaces design. If organizations are
to be successful, this generalized team theory and framework must further evaluate and validate

95
the elements that impact individual and team performance as well as an individual’s adaptability
to technology changes in various task environments and domains.
6.2.2 Practical Contributions
In additional to the theoretical contribution, the model provides a practical contribution.
This research towards generalized team task-complexity model was validated thoroughly in the
military command and control domain. What the results tell organizations is that an increase in
coordination information flows and interactions increase task-complexity and decrease team
performance. Since the coordination needs a communication medium for information flows and
interactions in today’s organizations, it has practical application in the design of latest
collaboration tools and groupware. Next generation of collaboration tools and groupware could
be designed by addressing the ways to reduce the number of coordination information flows and
interactions necessary for effectively completing tasks. Further, results related to coordination
information flows could also be extended for comparison of the complexity contributed by these
collaboration tools and testing their usefulness of improving the team performance.
Upon successfully validating this generalized team task-complexity model in various
complex task environments and domains, huge knowledge base of heuristics could be built
utilizing the information related to division of work or tasks, task allocation and task
performance. This has lot of potential application in team training, which has lot of importance
in the present day intelligent warfare and military operations such as Close-Air-Support (CAS).
As organizations enter the 21st century, the source of competitive advantage is
increasingly human resources. This may sound strange in a technological age where machines do
more and more of the work, but it is precisely technology that creates this dependence on human
resources. This is because technology is knowledge-driven. Given that the key problem in

96
division of labor is the assignment of people with certain competencies and interests to tasks,
organizations could also utilize such knowledge base for better work organization and team
building.
Additionally, caution must be exercised in the transferability of these results to real-world
tasks. The experimental tasks were designed to simulate real world tasks with an appropriate
level complexity. However, real-world tasks are likely to be far more complex and expansive
than the experimental tasks. Likewise, teams that have worked together for an extended amount
of time and developed a strong understanding and coordination may not experience the same
type of effects as the experimental groups. Therefore, the results of this research should be
matched against a particular team’s task and development to draw conclusions of its applicability
to a real-world situation.
6.2.3 Limitations of the Current Model
The generalized team task complexity model was validated in military command and
control domain only. However, it does lay strong task complexity space and framework for
understanding teams working in any complex task environment or domain. To fully validate this
generalized team task-complexity theory and model will require further empirical study in
various task environments and domains. Also task-scope has to be defined further and vigorously
tested of its validity as task complexity dimension. This research is just an initial step to
developing a comprehensive understanding of team collaboration and team performance from
task-complexity perspective.
6.3 Future Directions
No research answers all the questions and in most cases raises more questions. This
research is no different. Three main areas are of primary interest in future.

97
The first area that needs further investigation is concrete definition task-scope attributes.
Further study should look at defining the chunks (information chunks) of work into sub-tasks and
develop heuristics to assist defining them. Once a mechanism of defining the sub-tasks is
developed that framework could be useful in comparison of various team tasks.
The second area that needs further investigation is the development of a synthetic
collaborative system that would emulate certain complex work environments and would enable
the collection of team performance data for assessing hypotheses about collaboration. This
synthetic system would allow researchers to vary aspects of (a) work processes (task complexity,
distribution of tasks between operators, distribution of decisions between the operator(s),
individual vs. team planning); (b) team interaction environment (communication medium,
interaction patterns, information sharing, communication to support team awareness); and (c)
work center interfaces (individual and team elements of interfaces, information presentation
methods). Varying the environment would allow researchers to evaluate the elements that
impact individual and team performance as well as an individual’s adaptability to technology
changes.
The third area that needs further investigation is the study of the influences of certain
well-defined team inspiration factors, team size and gender factors on the team performance.
This would further make the generalized team task complexity model more comprehensive and
useful in the comparison of team performances under various work environment settings.

98
BIBLIOGRAPHY
Arrow, H., McGrath, J. E. and Berdahl, J. L. (2000). Small group as complex systems: Formation, coordination, development, and adaptation. Thousand Oaks, CA, Sage Publications, Inc.
Allen, J. F. (1984). Towards a General Theory of Action and Time. Artificial Intelligence, 23, 123-154.
Baker, D. P., and Salas, E., (1992). Principles for Measuring Teamwork Skills. Human Factors, 34(4), 469-475.
Baker, D. P., and Salas, E., (1997). Principles of Measuring Teamwork: A summary and Look toward the future. In M.T. Brannick, E.Salas, and C. Prince, (Eds.), Team Performance assessment and Measurement (pp. 331-355). Mahwah, NJ: Earlbaum.
Boeing (1999). Boeing releases results of independent mission assurance review, Boeing News Release 99-091.
Borman, W. C. (1991). Job behavior, performance and effectiveness. In M.D. Dunnette and L.M. Hough (Eds.), Handbook of industrial and organizational psychology (2nd ed., Vol. 2, pp. 271-326). Palo Alto, CA: Consulting Psychologists Press.
Brannick, M. T., and Prince, A. (1997). An Overview of Team Performance Measurement, In M.T. Brannick, E.Salas, and C. Prince, (Eds.), Team Performance assessment and Measurement. Mahwah, NJ: Earlbaum.
Brannick, M. T., Salas, E., and Prince, C. (Eds.) (1997). Team Performance Assessment and Measurement: Theory, Methods, and Applications. Mahwah, NJ: Lawrence Erlbaum.
Brannick, M. T., Prince, A., Prince, C., and Salas, E. (1995). The measurement of team process. Human Factors, 37(3) 641-651.
Brooks, A. K. (1994). Power and the production of knowledge: Collective team learning in work organizations. Human Resource Development Quarterly, 5, 213-235.
Bystrom, K. and Jarvelin, K. (1995). Task complexity affects information seeking and use. Information Processing and Management, 31, 191-213.

99
Campbell, D. J. (1988). Task complexity: A review and analysis, Academy of Management Review, Vol. 13(1), 40-52.
Campbell, D. J. (1991). Goal levels, complex tasks, and strategy development: A review and analysis, Human Performance, Vol. 4(1), 1-31.
Cannon-Bowers, J. A., and Salas, E. (1997). A framework for developing team performance measures in training, In M.T. Brannick, E.Salas, and C. Prince, (Eds.), Team Performance assessment and Measurement. Mahwah, NJ: Earlbaum.
Cannon-Bowers, J. A., Salas, E., Blickensderfer, E., and Bowers, C. A. (1998). The impact of cross training and workload on team functioning: A replication and extension of initial findings. Human Factors, 40, 92-101.
Cannon-Bowers, J. A., Tannenbaum, S. I., Salas, E., and Volpe, C. E. (1995). Defining competencies and establishing team-training requirements. In R. A. Guzzo and E. Salas (Eds.), Team effectiveness and decision making in organizations (pp. 333-380). San Francisco: Jossey-Bass.
Carey, J. M., and Kacmar, C. J. (1997). The impact of communication mode and task complexity on small groups performance and member satisfaction. Computers in Human Behavior, 13 (1), 23– 49.
Chen, S. J. and Lin, L. (2003). Decomposition of interdependent task group for concurrent engineering. Computers & Industrial Engineering, 44, 435-459.
Cohen, S. G., and Bailey, D. E. (1997). What makes teams work: Group effectiveness research from the shop floor to the executive suite. Journal of Management, 23, 239-290.
Cooke, N. J., Salas, E., Cannon-Bowers, J. A., and Stout, R. (2000). Measuring team knowledge. Human Factors, 42, 151-173.
Cooper, C. L. (1975). Theories of group processes. London: Wiley.
Daft, R. L. and Macintosh, N. B. (1981). A tentative exploration into the amount and equivocality of information processing in organizational work units, Administrative Science Quarterly, 26, 207-224.

100
Daft, R. L. and Lengel, R. H. (1986). Organizational information requirements, media richness and structural design. Management Science 32(5), 554-57.
Davis, J. H. (1980). “Group Decision and Procedural Justice,” In M. Fishbein (Ed.), Progress in Social Psychology, Vol. 1, Erlbaum, Hillsdale, NJ.
Davis, J. H., Laughlin, P. R., and Komorita, S. S. (1976). The Social Psychology of Small Groups: Cooperative and Mixed-motive Interaction, Annual Review of Psychology, 27, 501-541.
Doyle, J. (1979). Truth Maintenance System. Artificial Intelligence, 12, 231-271.
Dwyer, D. J., Fowlkes, J. E., Oser, R. L., Salas, E., and Lane, N. E. (1997). Team performance measurement in distributed environments: The TARGETs methodology. In M. T. Brannick, E. Salas, and C. Prince (Eds.), Team performance assessment and measurement: Theory, methods, and applications (pp. 137-153). Mahwah, NJ: Erlbaum.
Entin, E., and Serfaty, D. (1999). Adaptive team coordination. Human Factors, 41(2), 312-325.
Ferguson, G. A. (1956). On Transfer and Human Ability, Canadian Journal of Psychology, 10, 121-130.
Fleishman, E. A., and Zaccaro, S. J. (1992). Toward a taxonomy of team performance functions. In R. W. Swezey and E. Salas (Eds.), Teams: Their training and performance (Norwood, NJ: Ablex), 31-56.
Fowlkes, J. E., Lane, N. E., Salas, E., Franz, T., and Oser, R. (1994). Improving measurment of team performance: The TARGETS methodology. Military Psychology, 6, 47-63.
Gabbay, D. M., Hodkinson, I., and Reynolds, M. (1994). Temporal Logic: Mathematical Foundations and Computational Aspects (Vol. 1). Oxford: Oxford University Press.
Greeno, J. G. (1998). The Situativity of Knowing, Learning, and Research. American Psychologist, 53(1), 5-26.
Greeno, J. G., and Moore, J. L. (1993). Situativity and Symbols: Response to Vera and Simon. Cognitive Science, 17, 49-59.

101
Gordon, J. (1992). Work teams: How far have they come? Training, (October 1992), 59-65.
Guastello, S. J., and Guastello, D. D. (1998). Origins of coordination and team effectiveness: A perspective from game theory and nonlinear dynamics. Journal of Applied Psychology, 83, 423-437.
Guzzo R. A., and Dickson M. W. (1996). Teams in Organizations: recent research on performance and effectiveness. Annual Review of Psychology, 47, 307-338.
Hackman, J. R. (1968). Effects of Task Characteristics on Group Products. Journal of Experimental Social Psychology, 4, 162-187.
Hackman, J. R. (1969). Toward understanding the role of tasks in behavioral research. Acta Psychologica. 31, 97-128.
Hackman, J. R. (1987). The design of Work Teams. Handbook of Organizational Behavior. Eaglewood Cliffs, NJ: Prentice Hall. (Pp 315-342).
Hackman, J. R., and Morris, C. G. (1975). “Group Tasks, Group Interaction Process, and Group Performance Effectiveness: A Review and Proposed Integration,” In L. Berkowitz (Ed.) Advances in Experimental Social Psychology, Vol. 8, pp 47-99, Academic Press, New York.
Hackman, J. R., and Morris, C. G. (1978). “Group Process and Group Effectiveness: A Reappraisal,” In L. Berkowitz (Ed.), Group processes. New York: Academic Press
Hammond, J. H., Koubek, R. J. and Harvey, C. M. (2001). Distributed Collaboration for Engineering Design: A Review and Reappraisal. International Journal of Human Factors in Manufacturing. 11(1), 35-52.
Harvey, C. M. and Koubek, R. J. (2000). Cognitive, social, and environmental attributes of distributed engineering collaboration: A review and proposed model of collaboration, Human Factors and Ergonomics in Manufacturing, 10(4), 369-393.
Harvey, C. M. (1997). Toward a Model of Distributed Engineering Collaboration, Unpublished Dissertation, Purdue University.

102
Harvey, C. M. (2001). Gauging team tasks: Can one improve the process?, In Proceedings of the Summer Computer Simulation Conference 2001 (Orlando, FL), 391-396.
Hollenbeck, J. R., Ilgen, D. R., Sego, D. J., Hedlund, J., Major, D. A., and Phillips, J. (1995). The multi-level theory of team decision-making: Decision performance in teams incorporating distributed expertise. Journal of Applied Psychology, 80, 292-316.
Ilgen, D. (1999). Teams embedded in organizations: Some implications. American Psychologist, 54(2), 129-139.
Johnston, J. H., Smith-Jentsch, K. A., and Cannon-Bowers, J.A. (1997). Performance measurement tools for enhancing team decision making. In M. T. Brannick, E. Salas, and C. Prince (Eds.), Tem Performance assessment and measurement: theory, research, and applications (pp 311-330). Hillsdale, NJ: Earlbaum.
Katzenbach J. R, and Smith, D. K., (1993). The wisdom of Teams: Creating the high performance organization. Boston, MA: Harvard Business School Press.
Kent, R. N., and McGrath, J. E. (1969). Task and group characteristics as factors influencing group performance. Journal of Experimental Social Psychology, 5, 429-440.
Langan-Fox J., Code, S. and Langfield-Smith, K. (2000) Team Mental Models: Techniques, Methods and Analytic Approaches. Human Factors. 42(2), 1-30.
Laughlin, P. R. (1980). “Social Combination Processes of Cooperative, Problem-Solving Groups as Verbal Intellective Tasks,” In M. Fishbein (Ed.), Progress in Social Psychology, Vol. 1, Erlbaum, Hillsdale, NJ.
Malone, T. W. and Crowston, K. (1994). The interdisciplinary study of coordination. ACM Computing Surveys, 1994. 26(1), 87-119.
March, J. G. (1988). Decisions and Organizations. Oxford: Basil Blackwell.
March, J.G. (1991). How decisions happen in organizations, Human computer interaction, 6, 95-117.
McGrath, J. E. (1984). Groups: Interaction and performance. Englewood Cliffs, NJ: Prentice Hall.

103
McGrath, J. E. (1991). Time, interaction, and performance (TIP): A theory of groups. Small Group Research, 22, 147-174.
McGrath, J. (1997). Small group research, that once and future field: An interpretation of the past with an eye to the future. Group Dynamics: Theory, Research, and Practice, 1(1), 7-27.
McGrath, J., and Altman, I. (1966). “Small Group Research: A Synthesis and Critique of the Field”, Holt, Rinehart, and Winston, New York.
McIntyre, R. M, and Salas, E., (1995). “Measuring and managing for team performance: emerging principles from complex environments”. In Guzzo, R.A., Salas, E., and Associates “Team effectiveness and Decision making in Organizations”. Jossey-Boss: San Francisco. (Pp. 9-45).
Mintzberg, H. (1992). Structure in fives: designing effective organizations. Prentice-Hall.
Modrick, J. A. (1986). Team performance and training. In J. Zeidner (Ed.), Human productivity enhancement: Training and human factors in systems design (Vol. I). New York: Praeger.
Morgan, B. B., Jr. and Bowers, C.A. (1995). Teamwork stressors and their implications for team decision making. In R.A. Guzzo and E. Salas (Eds.), Team decision making effectiveness in organizations. New York: Josey-Bass.
Morgan, B. B., Jr., Salas, E., and Glickman, A. S. (1994). An analysis of team evolution and maturation. Journal of General Psychology, 120(3), 277-291.
Morgan, B. B., Jr., Glickman, A. S., Woodward, E. A., Blaiwes, A., and Salas, E. (1986). Measurement of team behaviors in a Navy environment (NTSC Report no. 86-014). Orlando, FL: Naval Training System Center.
NASA’s Faster, Better, Cheaper review, NASA, 1999. NASA FBC Task Final Report.
Nieva, V. F., Fleishman, E. A., and Rieck, A. M. (1978). Team dimensions: Their identity, their measurement, and their relationships. Washington, DC: ARRO

104
Orasanu, J. and Salas, E. (1993). Team decision making in complex environments. In G. Klein, J. Orasanu, and R. Calderwood (Eds.), Decision Making in Action: Models and Methods (pp. 327-345).
Perrow, C. (1967). A Framework for the Comparative Analysis of Organizations, American Sociological Review, 32, 194-208.
Pinsonneault, A., and Kraemer, K. L. (1989). The Impact of technological support on groups: An assessment of the empirical research. Decision Support Systems, 5, 197-216.
Prasad, K. and Akhilesh, K. B. (2002). Global virtual teams: What impacts their design and performance. Team Performance Management, 8(5/6), 102-112.
Roby, T. B., and Lanzatta, J. T. (1958). Considerations in the Analysis of Group Tasks. Psychological Bulletin, 55(4), 88-101.
Rothrock, L. (2001). Using time windows to evaluate operator performance. International Journal of Cognitive Ergonomics, 5(2), 95-119.
Rothrock, L. (2002). Improving the Experimental and Training Usefulness of the Georgia Tech Aegis Simulation Platform (GT-ASP): WASP User’s Manual (Final Report TCN00142DO0645). Orlando: Naval Air Warfare Center, Training Systems Division.
Rothrock, L. (2005). An informal discussion about the latest developments in the concept of the time windows.
Rothrock, L., Harvey, C. M., and Burns, J. (2005). A Theoretical Framework and Quantitative Architecture to Assess Team Task Complexity in Dynamic Environments. Theoretical Issues in Ergonomics Science, 6(2), 157-172.
Saavedra R., Early P. C., and Linn Van Dyne (1993). Complex Interdependence in Task-Performing Groups. Journal of Applied Psychology, Vol.78 (1), 61-72.
Salas, E., Prince, C., Baker, D. P., and Shrestha, L. (1995). Situational Awareness in Team Performance: Implications for Measurement and Training. Human Factors, 37(1), 123-136.

105
Shaw, M. E. (1973). Scaling Group Tasks: A Method for Dimensional Analysis, JSAS Catalog of Selected Documents in Psychology, 3, p.8.
Smith-Jentsch, K. A., Tannenbaum, S. I., and Cannon-Bowers, J. A. (1995). Tarining team leaders briefing skills. In R. J. Stout (Chair), the science and practice of enhancing teamwork in organizations. Symposium conducted at the meeting of the American Psychological Association, Atoronto , Canada.
Smith-Jentsch, K. A., Johnston, J. H., and Payne, S. C. (1998). Measuring Team-related Expertise in Complex Environments. In J.A. Cannon-Bowers and E. Salas (ed.), Making Decisions Under Stress: Implications for Individual and Team Training (Washington, D.C.: American Psychological Association), 61-87.
Speier C., Vessey I. and Valacich J. S. (2003). The effects of interruptions, task complexity, and information presentation on computer-supported decision-making performance, Decision Sciences, 34 (4), 771-79
Steiner, I. D. (1972). Group Process and Productivity. New York: Academic Press.
Stout, R. J, Salas, E., and Fowlkes, J. E. (1997). Enhancing teamwork in complex environments through team training. Group Dynamics, 1(2), 169-182.
Straus, S. and McGrath, J. (1994). Does the medium really matter? The interaction of task type and technology on group performance and member reactions. Journal of Applied Psychology, 79, 87-97.
Sunderstrom, E., De Meuse, K. P., and Futrell, D. (1990). Work Teams: Applications and Effectiveness. American Psychologist, 45(2), 120-133.
Tuckman, B. W. (1965). Developmental Sequence in Small Groups,” Psychological Bulletin, 63, 384-399.
Urban, J. M., Weaver, J. L., Bowers, C. A. and Rhodenizer, L. (1996). Effects of Workload and Structure on Team Processes and Performance: Implications for Complex Team Decision Making. Human Factors, 38(2), 300-310.
Urban, J. M., Bowers, C. A., Monday, S. D., and Morgan, B. B., Jr. (1995). Workload, team structure, and communication in team performance, Military Psycology, 7(2), 123-13.

106
Wellens, A. R. (1993). Group Situation awareness and distributed decision making from military to civilian applications. In N.J. Castellan, Jr. (Ed.), Individual and group decision-making: Current issues (pp. 267-291). Hillsdale, NJ: Erlbaum.
Wood, R. E. (1986). Task complexity: Definition of the construct, Organizational Behavior and Human Decision Processes, 37, 60-82.
Zhao, B. (1992). A structured analysis and quantitative measurement of task complexity in human-computer interaction, Unpublished Dissertation, Purdue University.

107
APPENDIX A
PARTICIPANT REQUEST POSTER

108
Study Title: Towards A Generalized Team Task-Complexity Model
Volunteer 2-person teams (Both Male or Both Female) are requested for my study on "Teams
and how they perform under various complexity levels"
Who can be participants?
• Graduate or undergraduate students with normal or corrected to normal vision
• Any one with Basic exposure of working as teams for their class projects
• Any one with Basic knowledge of playing computer/video games
Experiment Description:
• The experiment is a Military Team Simulation Game which requires ‘two' persons to play
• One of the participant acts as a Team Leader and another acts as a Team Member
• The experiment consists of a training stage and actual experimental stage
• Total duration is 2 hours
Experiment Location:
3413 CEBA Building
Contact:
Ashok Darisipudi
Email ID: [email protected]
Phone: (225) 578-5378

109
APPENDIX B
PERSONAL INFORMATION AND PRIOR EXPERIENCE QUESTIONNAIRE

110
Personal Information and Prior Experience Questionnaire
Part A: Personal Information
Participant Name: _______________
Gender: _______________
Age: _______________
Is your experiment partner:
A Friend Just A Classmate I don’t know him/her (Circle any one of them)
Did you ever worked on any projects with your experimental partner in a team?
Yes No (Circle any one of them)
Degree pursuing: Undergraduate Graduate PhD (Circle any one of them)
Year of Study: First Second Third Fourth Five or More (Circle any one of them)
Part B: Basic Exposure and Knowledge
Please circle one response that best represents your opinion to the following questions.
Do you like working in teams?
Yes No
Did you ever worked in team projects/assignments in your coursework?
Yes No
If yes, so far how many team projects you worked on?
1 - 3 4 - 6 7 - 9 10 - 12 12 or more
How much time you spend on computers and internet every week?
0 – 5 hrs 6 – 10 hrs 11 – 15 hrs 16 – 20 hrs 20 or more hrs

111
Do you play video/computer games?
Yes No
If yes, how often do you play?
Daily 2-3 times a Week Once a Week 2-3 times a Week Once a Month Rarely Ever
Did you ever play any team video/computer games?
Yes No
If yes, how often do you play?
Daily 2-3 times a Week Once a Week 2-3 times a Week Once a Month Rarely Ever

112
APPENDIX C
EXPERIMENT RULES OF ENGAGEMENT

113
Rules of Engagement/Standing Orders (in order of importance):
1. Engage aircraft (at 20 NM; hostile or assumed hostile aircraft only).
2. Assign/Illuminate aircraft (at 30 NM; hostile or assumed hostile only).
3. Maintain safety of DCA (e.g., keep DCA away from danger zones of hostile aircraft, don’t
let DCA run out of fuel, etc.).
4. Issue Level 1 warning (at 50 NM; hostile or assumed hostile only).
5. Issue Level 2 warning (at 40 NM; hostile or assumed hostile only).
6. Issue Level 3 warning (at 30 NM; hostile or assumed hostile only).
7. Keep DCA within 256 NM from ownship.
8. Keep DCA at least 20 NM away from ownship.
9. Make a primary identification of air contact (i.e., friendly, hostile, assumed hostile/friendly).
10. Make an AIR identification of air contact (i.e., strike, missile platform, AEW, etc.).
* Once an aircraft has come within 50 NM from ownship, it should be identified before it
travel an excess of 10 NM. If an aircraft “pops up” within 50 NM it should be identified before it
travels an excess of 10 NM.
Two overarching rules:
• Defend ownship and ships in battle group.
• Do not engage friendly or civilian aircraft.

114
TASP Air Track Abbreviations:
DCA: Defensive Counter Air. DCA can be
fighters or interceptors with only air-to-air
weapons
Non-military: Civilian transport aircraft
Tanker: Tanker. Tankers are refueling planes. Clutter: Radar signature of a non-platform
object such as a bird or sandstorm
Helo: Helicopter

115
Resources to aid in the identification of air tracks:
I. EWS - Sensor information about a track may be available. The AAWC may request this
directly from his/her main menu (“Sensor Status”). The AIC may request it by going through the
Backup-AAWC menu.
• This information will help you decide on the intent of the aircraft (hostile or friendly) and the
type of aircraft (DCA, strike, helo, etc.).
• Please note that certain aircraft do not have radar sensors and others may not have their radar
sensors turned on. For these aircraft, your EWS report will be negative ESM.
• Four types of radar sensors listed in the tables can either be friendly or hostile. Other types of
information must be used to make an identification.
• Please refer to the table to interpret EWS reports:
FRIENDLY SUMMARY HOSTILE SUMMARY
PLATFORM SENSOR PLATFORM SENSOR
DCA:
F-15 (Eagle)
APG-63
DCA:
MIG-25 (Foxbat A)
MIG-31 (Foxhound)
FOXFIRE
FLASHDANCE
HELO:
LAMPS III
APS-124
HELO:
KA-25
BIG BULGE
NON-MILITARY:
BOEING 727
GULF STREAM II
ARINC564
PRIMUS 40
Resources to aid in the identification of air tracks:
II. IDS - Identify Friend/Foe information about a track may be available. The AAWC may
request this directly from his/her main menu (“IFF”). The AIC may request it by going through
the Backup-AAWC menu.
• The IFF system indicates the self-identity of a craft. An IFF challenge will result in the
AAWC obtaining the self-reported friend/foe status of the challenged craft. Therefore, the
report you receive may be deceptive.
• Aircraft can emit a signal on one of the modes, on all three modes, or none of the modes.

116
• IFF information can only be queried when the track is within 150 NM of ownship.
• Aircraft that is not “squawking” (providing information) after an IFF challenge could be
identified as hostile. NOTE: Missiles do not respond to an IFF challenge (other resources
must be used to identify this type of aircraft).
• Mode 1: consists of a 2-digit military identifier of the task group.
• Mode 2: consists of a 4-digit military identifier of the specified unit. For example, an aircraft
that is emitting a mode 2: 5438 signal could be identified as a friendly strike (F/A-18). See
table below:
FRIENDLY SUMMARY HOSTILE SUMMARY
DCA: F-15 20## DCA: N/A
HELO:LAMPS III 10## HELO: KA-25 12##
• Mode 3: consists of a 3 to 4-digit military/civilian identifier for the Air Traffic Control
(ATC). In civilian cases, it is the flight number.
Resources to aid in the identification of air tracks:
III. While EWS and IFF may not be available for every track, the following are continuously
available on all tracks and can be found in the character readout box (located in the upper left-
hand corner of the screen):
Course Point of origin of the unknown track (can be determined by using the map)
Bearing Speed
Range from ownship. Altitude

117
Note:
FRIENDLY SUMMARY HOSTILE SUMMARY
PLATFORM SPEED PLATFORM SPEED
DCA:
F-15 (EAGLE)
1433 mph
DCA:
MiG-25
MiG-31
1606 mph
1305 mph
HELO:
LAMPS III
200 mph
HELO:
KA-25
115 mph
NON-MILITARY:
BOEING 727
GULFSTREAM II
600 mph
600 mph
Note:
118
APPENDIX D
CONSENT FORM
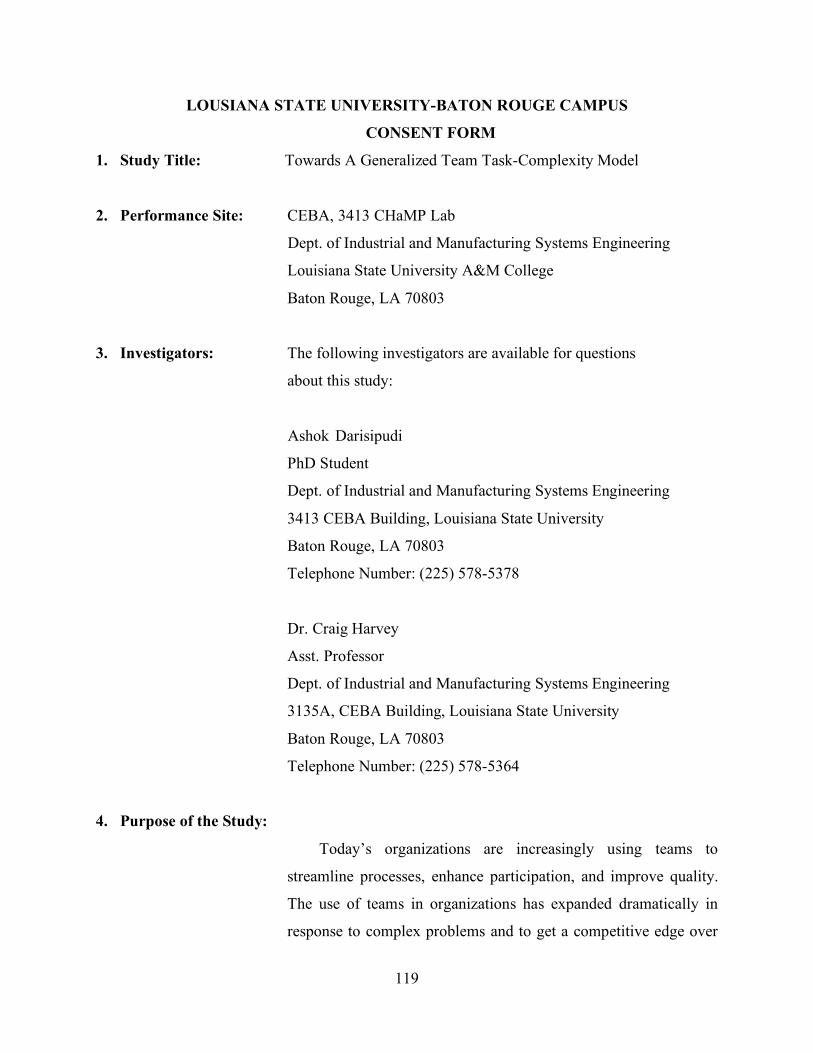
119
LOUSIANA STATE UNIVERSITY-BATON ROUGE CAMPUS
CONSENT FORM
1. Study Title: Towards A Generalized Team Task-Complexity Model
2. Performance Site: CEBA, 3413 CHaMP Lab
Dept. of Industrial and Manufacturing Systems Engineering
Louisiana State University A&M College
Baton Rouge, LA 70803
3. Investigators: The following investigators are available for questions
about this study:
Ashok Darisipudi
PhD Student
Dept. of Industrial and Manufacturing Systems Engineering
3413 CEBA Building, Louisiana State University
Baton Rouge, LA 70803
Telephone Number: (225) 578-5378
Dr. Craig Harvey
Asst. Professor
Dept. of Industrial and Manufacturing Systems Engineering
3135A, CEBA Building, Louisiana State University
Baton Rouge, LA 70803
Telephone Number: (225) 578-5364
4. Purpose of the Study:
Today’s organizations are increasingly using teams to
streamline processes, enhance participation, and improve quality.
The use of teams in organizations has expanded dramatically in
response to complex problems and to get a competitive edge over

120
the competitors. Irrespective of private or public sector
organizations, the reliance on teams and work groups is present.
With ‘teams’ comes the ‘task’ that they need to perform in order to
solve the organizational problems. Since teams engage in many
different collective activities, a number of task typologies and
descriptions have been presented in the team related literature in an
effort to better define and understand the critical role of the tasks
and the associated team processes.
This thesis proposes to define the underlying dimensions
that compose a task which contribute to complexity in a team
environment. Team literature shows that several dimensions
potentially represent task complexity. For the purpose of this
thesis, these variables are grouped into three complexity
dimensions: task-scope, task-coordination, and task-uncertainty.
These complexity dimensions are hypothesized to affect the teams’
task performance. This research focuses on how any team task can
be represented in a team task-complexity space of three
dimensions and how these dimensions affect team performance in
any task environment. Considering the practical difficulty of
experimentally testing many team-tasks from different domains, a
thorough validation of these task-dimensions is done my
experimentally testing a number of team-tasks designed within a
particular selected domain of command and control. A Java-Based
two-role team simulation known as TASP is used for testing
different task-complexity scenarios. Team performance measures
will be captured by the simulation software itself and will be
evaluated for team performance using convert software and scoring
criteria.
5. Subject Inclusion:

121
Graduate or undergraduate students with normal or
corrected to normal vision at Louisiana State University who have
basic exposure of working as teams for their class projects and
basic knowledge of playing computer/video games will participate
in study.
6. Number of subjects: 108 (54 two-member teams)
7. Study Procedures:
The experimental procedure is a two-stage procedure
comprising the training stage and experimental stage. The
participant team will be subjected to meet a minimum amount of
team performance in order to participate in the experimental stage.
This helps in fulfilling the condition of all teams of having
sufficient knowledge in performing the experimental task and
avoids the possibility of inconsistency. In the training stage, teams
consisting of two participants first complete initial data forms
(subject information, experiment consent form, and prior
experience questionnaire). Upon completion of these forms, teams
will be given the experimental task description and guidelines
packet that consists of Rules of Engagement (ROEs) and other
technical information to be remembered in order to perform TASP
simulation tasks. The participant team will undergo a 50-minute
training session, comprising of two training tasks, to acclimate
them to the TASP simulation environment. Each training task is of
20 minutes duration with a 10-minute break in between them.
Participants will be informed to come for second stage,
experimental stage, provided they meet the minimum team
performance requirement. Experimental stage consists of a quick
review and performing actual experimental task scenario of 30

122
minutes duration followed by post-experimental data collection
(team satisfaction survey and perceived task-workload survey).
8. Benefits:
There will not be any direct health, monetary or mental
benefits to the individual participant. But the results of the study
may be beneficial to the greater population as it leads to a better
understanding of how any team will perform in complex situations
and environments.
9. Risks: Participants will experience no risks greater than those
from operating a personal computer.
10. Measures to reduce
the risk:
All the simulation tasks have a maximum duration of 30
minutes only there by avoiding chances of participants feeling any
fatigue. Apart from that break periods are provided before
performing any simulation tasks.
10. Right to Refuse:
Subjects may choose not to participate or if at any time
during the study, subject feels uncomfortable with any method or
performing the requirements, formal withdrawal from the study
will commence at any time without any penalty.
11. Privacy:
If the results of present study are published, names or
identifying information of the subjects will not be included in the
publication. Subject identity will remain secret unless disclosure is
required by law. The data will be stored in a locked cabinet or

123
password-secured computer. The screening questionnaires of
rejected subjects will be destroyed.
12. Financial Information:
Subjects or volunteers and will not be compensated for
participation in this study.

124
CONSENT FORM
13. Signature:
The study procedure has been completely explained to me and all my questions have
been answered. I have understood the procedure and if I have additional questions regarding
study specifics I may direct them to investigator. If I have questions about subjects' rights or
other concerns, I can contact Robert C. Mathews, Institutional Review Board, and (225) 578-
8692. I agree to participate in the present study and acknowledge the investigator's obligation to
provide me with a signed copy of this consent form.
Signature of Subject Date

125
APPENDIX E
PERCEIVED TASK-WORKLOAD (NASA TLX)

126

127

128

129
APPENDIX F
SAS CODE FOR STATISTICAL ANALYSIS

130
dm "output;clear;log;clear";
Options LS=120 PageNo=1;
ODS Listing Close;
ODS Results Off;
ODS RTF File="Ashok.rtf";
Data Ashok;
Input Run Scope Coordination Uncertainty t1 t2 @;
Input Score @; Output;
Input Score; Output;
DataLines;
1 -1 -1 -1 10 10 1 1
2 -1 -1 0 8 8 0.8 0.8
3 -1 -1 1 7 8 0.7 0.8
4 -1 0 -1 8 8 0.8 0.8
5 -1 0 0 5 5 0.5 0.5
6 -1 0 1 7 7 0.7 0.7
7 -1 1 -1 8 7 0.8 0.7
8 -1 1 0 5 5 0.5 0.5
9 -1 1 1 5 3 0.5 0.3
10 0 -1 -1 18 19 0.9 0.95
11 0 -1 0 15 13 0.75 0.65
12 0 -1 1 18 15 0.9 0.75
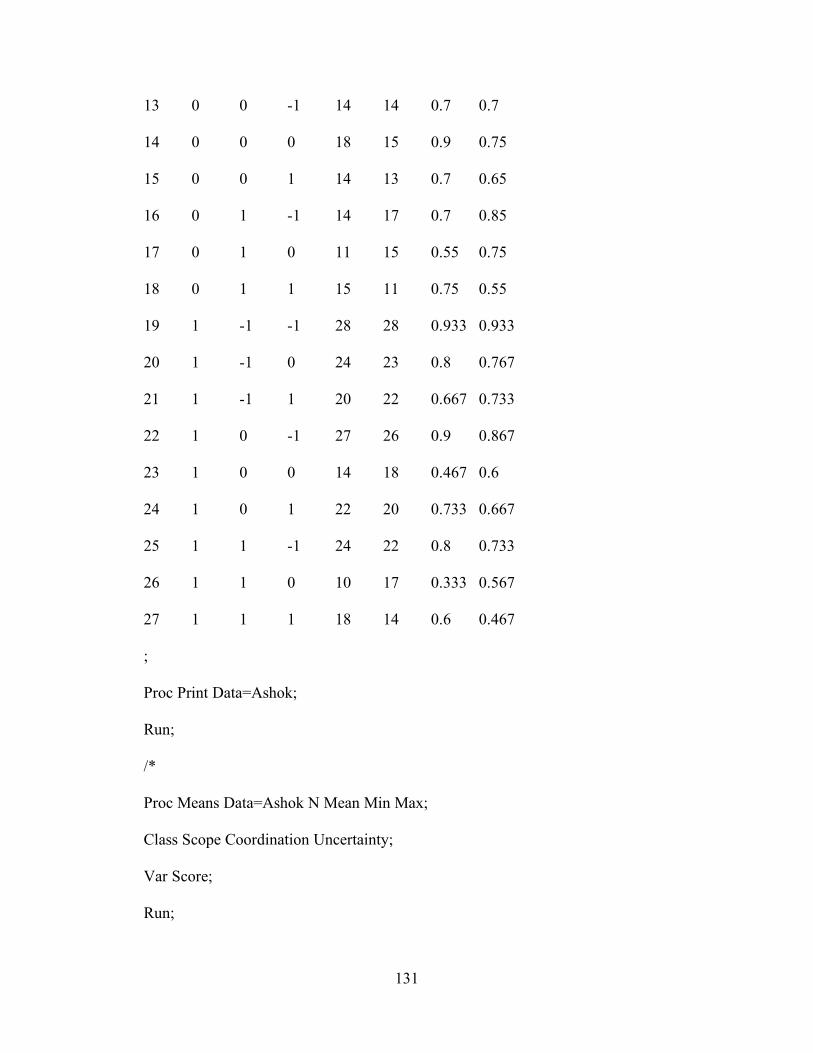
131
13 0 0 -1 14 14 0.7 0.7
14 0 0 0 18 15 0.9 0.75
15 0 0 1 14 13 0.7 0.65
16 0 1 -1 14 17 0.7 0.85
17 0 1 0 11 15 0.55 0.75
18 0 1 1 15 11 0.75 0.55
19 1 -1 -1 28 28 0.933 0.933
20 1 -1 0 24 23 0.8 0.767
21 1 -1 1 20 22 0.667 0.733
22 1 0 -1 27 26 0.9 0.867
23 1 0 0 14 18 0.467 0.6
24 1 0 1 22 20 0.733 0.667
25 1 1 -1 24 22 0.8 0.733
26 1 1 0 10 17 0.333 0.567
27 1 1 1 18 14 0.6 0.467
;
Proc Print Data=Ashok;
Run;
/*
Proc Means Data=Ashok N Mean Min Max;
Class Scope Coordination Uncertainty;
Var Score;
Run;

132
Proc Mixed Data=Ashok Method=Type3;
Class Scope Coordination Uncertainty;
Model Score = Scope | Coordination | Uncertainty / Solution;
Contrast "Scope" Scope 1 -1 0,
Scope 1 0 -1;
* LSMeans Scope*Coordination*Uncertainty /
Slice=(Scope*Coordination Scope*Uncertainty Coordination*Uncertainty
Scope Coordination Uncertainty);
* LSMeans Scope*Coordination*Uncertainty / PDiff Adjust=Tukey;
LSMeans Coordination*Uncertainty;
Run;
*/
Proc GLM Data=Ashok;
Class Scope Coordination Uncertainty;
Model Score = Scope | Coordination | Uncertainty / Solution;
* Contrast "Scope" Scope 1 -1 0,
Scope 1 0 -1;
LSMeans Scope*Coordination*Uncertainty /
Slice=(Scope*Coordination Scope*Uncertainty Coordination*Uncertainty
Scope Coordination Uncertainty);
LSMeans Scope*Coordination*Uncertainty / PDiff Adjust=Tukey;
* LSMeans Coordination*Uncertainty;

133
Run; Quit;
Proc GLM Data=Ashok;
Where Uncertainty=-1;
Class Scope Coordination ;
Model Score = Scope | Coordination / Solution;
* Contrast "Scope" Scope 1 -1 0,
Scope 1 0 -1;
LSMeans Scope*Coordination /
Slice=(Scope Coordination);
LSMeans Scope*Coordination / PDiff Adjust=Tukey;
* LSMeans Coordination*Uncertainty;
Run; Quit;
ODS RTF Close;
ODS Results On;
ODS Listing;

134
APPENDIX G
TASK PERFORMANCE DATA TABLE

135
Task Performance Data Table
Team Task performance Run
Number Task scope
Task co-ordination
Task un-certainty Repetition 1 Repetition2
1 -1 -1 -1 1 1 2 -1 -1 0 0.8 0.8 3 -1 -1 1 0.7 0.8 4 -1 0 -1 0.8 0.8 5 -1 0 0 0.5 0.5 6 -1 0 1 0.7 0.7 7 -1 1 -1 0.8 0.7 8 -1 1 0 0.5 0.5 9 -1 1 1 0.5 0.3
10 0 -1 -1 0.9 0.95 11 0 -1 0 0.75 0.65 12 0 -1 1 0.9 0.75 13 0 0 -1 0.7 0.7 14 0 0 0 0.9 0.75 15 0 0 1 0.7 0.65 16 0 1 -1 0.7 0.85 17 0 1 0 0.55 0.75 18 0 1 1 0.75 0.55 19 1 -1 -1 0.933 0.933 20 1 -1 0 0.8 0.767 21 1 -1 1 0.667 0.733 22 1 0 -1 0.9 0.867 23 1 0 0 0.467 0.6 24 1 0 1 0.733 0.667 25 1 1 -1 0.8 0.733 26 1 1 0 0.333 0.57 27 1 1 1 0.6 0.467

136
APPENDIX H
PERCEIVED WORKLOAD DATA TABLE (NASA TLX)

137
Perceived Work Load Data Table (NASA TLX)
Team1 (Run1) Team Work Load
Team2 (Run2) Team Work Load
Avg Total Team
Work Load
Run Number
Scope Coordination
Uncertainity
AAWC AIC AAWC AIC 1 -1 -1 -1 0.2 0.213 0.207 0.327 0.213 0.27 0.238 2 -1 -1 0 0.327 0.307 0.317 0.497 0.53 0.513 0.415 3 -1 -1 1 0.693 0.71 0.7017 0.42 0.47 0.445 0.573 4 -1 0 -1 0.397 0.447 0.4217 0.333 0.36 0.347 0.384 5 -1 0 0 0.64 0.677 0.658 0.313 0.403 0.3583 0.508 6 -1 0 1 0.467 0.453 0.46 0.387 0.46 0.423 0.4417 7 -1 1 -1 0.68 0.493 0.587 0.393 0.577 0.485 0.5358 8 -1 1 0 0.573 0.62 0.597 0.313 0.307 0.31 0.453 9 -1 1 1 0.567 0.65 0.608 0.413 0.48 0.447 0.5275 10 0 -1 -1 0.707 0.72 0.713 0.537 0.64 0.588 0.651 11 0 -1 0 0.377 0.487 0.4317 0.597 0.73 0.663 0.5475 12 0 -1 1 0.673 0.597 0.635 0.527 0.453 0.49 0.5625 13 0 0 -1 0.553 0.433 0.493 0.753 0.573 0.663 0.578 14 0 0 0 0.74 0.64 0.69 0.547 0.713 0.63 0.66 15 0 0 1 0.777 0.447 0.7 0.657 0.63 0.643 0.6275 16 0 1 -1 0.52 0.6 0.56 0.327 0.44 0.383 0.4717 17 0 1 0 0.69 0.617 0.653 0.673 0.61 0.6417 0.6475 18 0 1 1 0.613 0.52 0.567 0.463 0.383 0.423 0.495 19 1 -1 -1 0.467 0.477 0.4717 0.527 0.57 0.548 0.51
20 1 -1 0 0.78 0.793 0.787 0.797 0.56 0.678 0.7325 21 1 -1 1 0.533 0.47 0.5017 0.733 0.707 0.72 0.611 22 1 0 -1 0.737 0.66 0.698 0.697 0.687 0.6917 0.695 23 1 0 0 0.723 0.793 0.758 0.827 0.723 0.775 0.767 24 1 0 1 0.773 0.627 0.7 0.667 0.607 0.637 0.668 25 1 1 -1 0.483 0.527 0.505 0.64 0.773 0.707 0.6058 26 1 1 0 0.827 0.713 0.77 0.727 0.767 0.747 0.758 27 1 1 1 0.743 0.777 0.76 0.753 0.727 0.74 0.75

138
VITA
Ashok Darisipudi was born in Pithapuram, a small cultural town famous for renowned
philanthropic, film personalities and musicians in Andhra Pradesh, India. He completed his high
school education in P.R. Government High School, Kakinada. He ranked 6th among 10th grade
students who attended high schools in East Godavari County, Andhra Pradesh. He was runner-up
in state level science seminar on the issues related to world pollution and global warming, and
got many awards for extra curricular activities such as creative writing and science quiz
competitions. He ranked 1st in his high school senior class and was selected for both National and
State Merit Scholarships for his academic excellence. He graduated from Jawaharlal Nehru
technological University, Kakinada, with a Bachelor of Technology in Mechanical Engineering
degree in July 1999. He had the highest grade in his graduation class in the Department of
Mechanical Engineering. Upon graduation, he joined Clemson University in Fall 1999. There, he
received his Master of Science in Industrial Engineering degree with human factors engineering
as specialization in May 2001. With a strong desire of continuing research in human computer
interaction area, he joined the doctoral program at Wright State University in December 2001.
He transferred to LSU when his major professor Dr. Craig Harvey moved to Louisiana State
University in Fall 2002. He worked as a research and teaching assistant in Computer, Human,
and Machine Performance Laboratory and Human Factors Laboratory in the Department of
Industrial Engineering at Louisiana State University from Fall 2002 to Fall 2005. He plans to
start his postdoctoral work at Ball State University from February 2006, and is scheduled to
graduate in May 2006.