Martina Strudel Mikiko Watanabe Latina, 18 Maggio 2012 Tanzania e Camerun Note di viaggio.
Toward realizing 2oC/1.5oC target:Why deep decarbonization is required and what kinds of pathways can achieve it?
Mikiko KainumaInstitute for Global Environmental Strategies (IGES)/National Institute for Environmental Studies (NIES)
NIES
Is 1.5oC feasible?‐ Pathways of the net zero GHG emissions ‐
15 November 2016, COP22Marrakech, Morocco
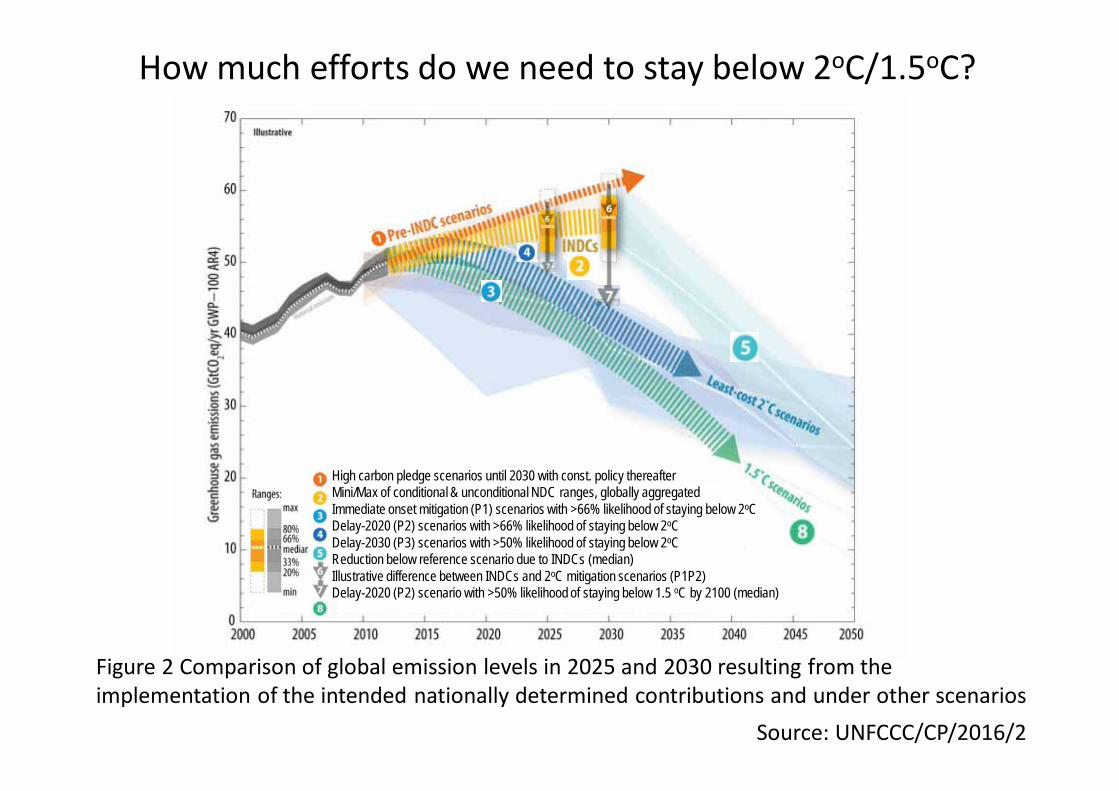
Source: UNFCCC/CP/2016/2
High carbon pledge scenarios until 2030 with const. policy thereafter Mini/Max of conditional & unconditional NDC ranges, globally aggregatedImmediate onset mitigation (P1) scenarios with >66% likelihood of staying below 2oCDelay-2020 (P2) scenarios with >66% likelihood of staying below 2oCDelay-2030 (P3) scenarios with >50% likelihood of staying below 2oCReduction below reference scenario due to INDCs (median)Illustrative difference between INDCs and 2oC mitigation scenarios (P1P2)Delay-2020 (P2) scenario with >50% likelihood of staying below 1.5 oC by 2100 (median)
Figure 2 Comparison of global emission levels in 2025 and 2030 resulting from the implementation of the intended nationally determined contributions and under other scenarios
How much efforts do we need to stay below 2oC/1.5oC?
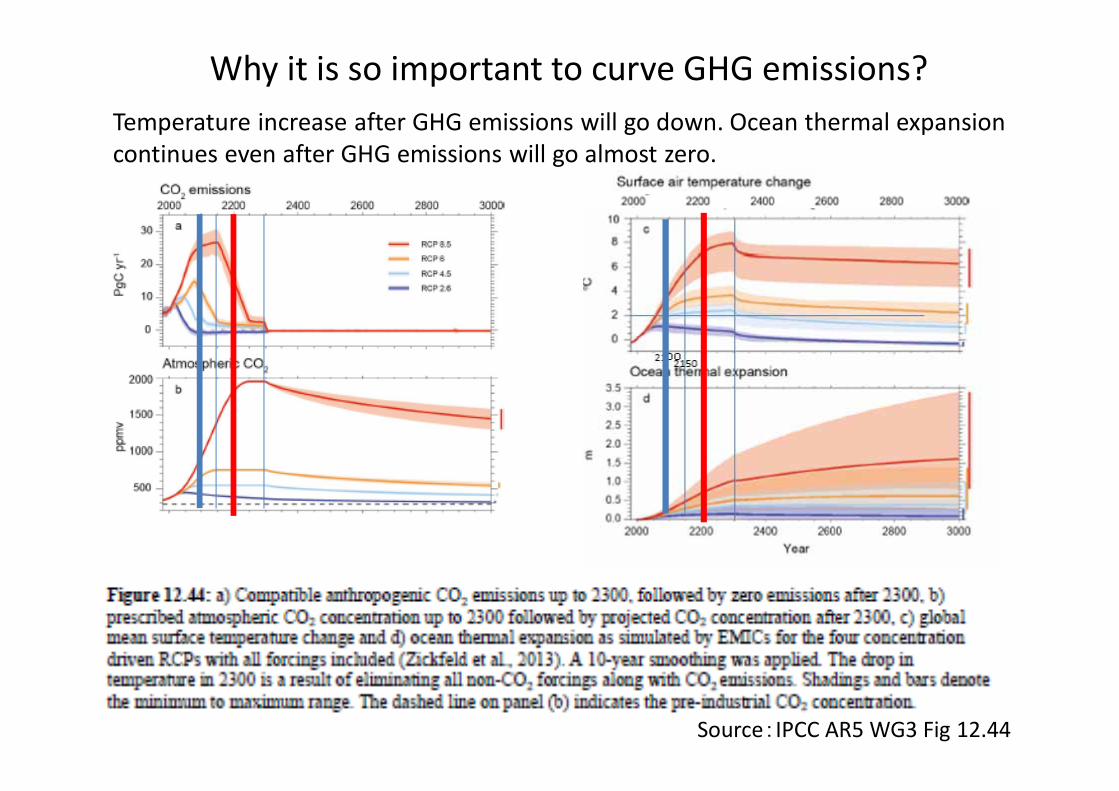
Temperature increase after GHG emissions will go down. Ocean thermal expansion continues even after GHG emissions will go almost zero.
Source:IPCC AR5 WG3 Fig 12.44
Why it is so important to curve GHG emissions?
Increase in
radiative forcing(
(W/m
2)
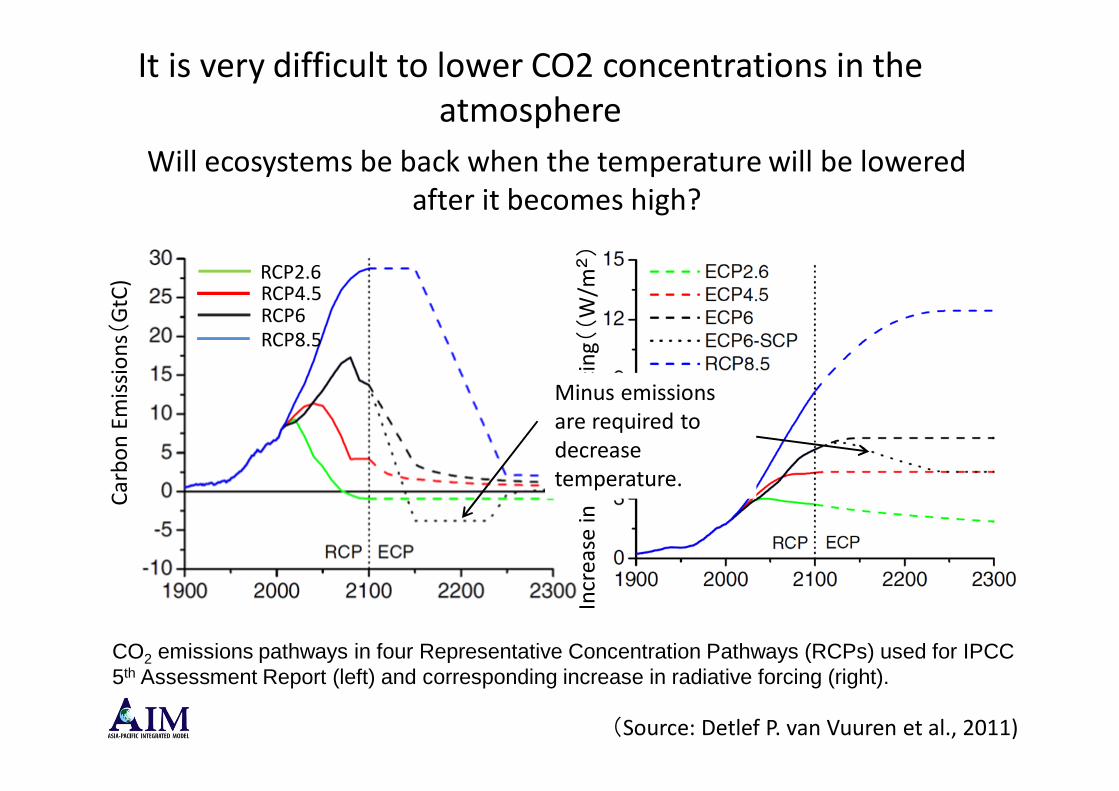
CO2 emissions pathways in four Representative Concentration Pathways (RCPs) used for IPCC 5th Assessment Report (left) and corresponding increase in radiative forcing (right).
Carbon
Emissions
(GtC)
(Source: Detlef P. van Vuuren et al., 2011)
RCP2.6RCP4.5RCP6RCP8.5
Minus emissions are required to decrease temperature.
Will ecosystems be back when the temperature will be loweredafter it becomes high?
It is very difficult to lower CO2 concentrations in the atmosphere
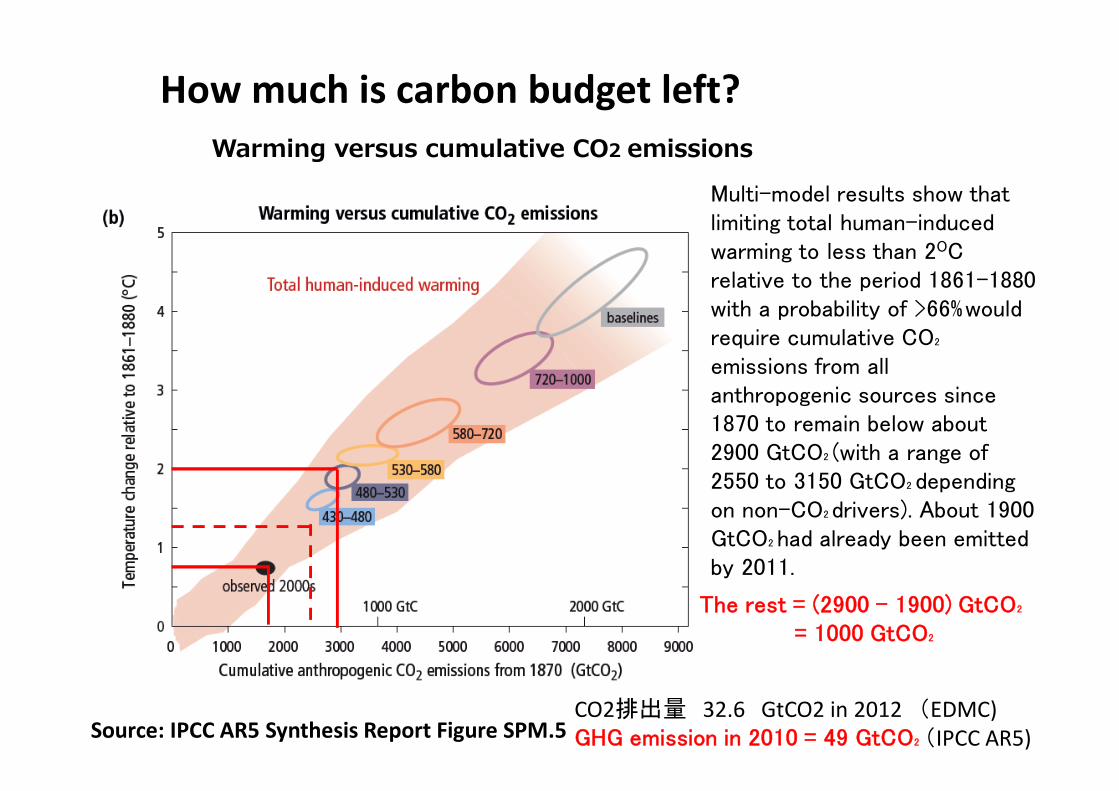
Source: IPCC AR5 Synthesis Report Figure SPM.5
Multi-model results show that limiting total human-induced warming to less than 2OC relative to the period 1861–1880 with a probability of >66%would require cumulative CO2
emissions from all anthropogenic sources since 1870 to remain below about 2900 GtCO2 (with a range of 2550 to 3150 GtCO2 depending on non-CO2 drivers). About 1900 GtCO2 had already been emitted by 2011.
Warming versus cumulative CO2 emissions
CO2排出量 32.6 GtCO2 in 2012 (EDMC)GHG emission in 2010 = 49 GtCO2 (IPCC AR5)
The rest = (2900 – 1900) GtCO2
= 1000 GtCO2
How much is carbon budget left?
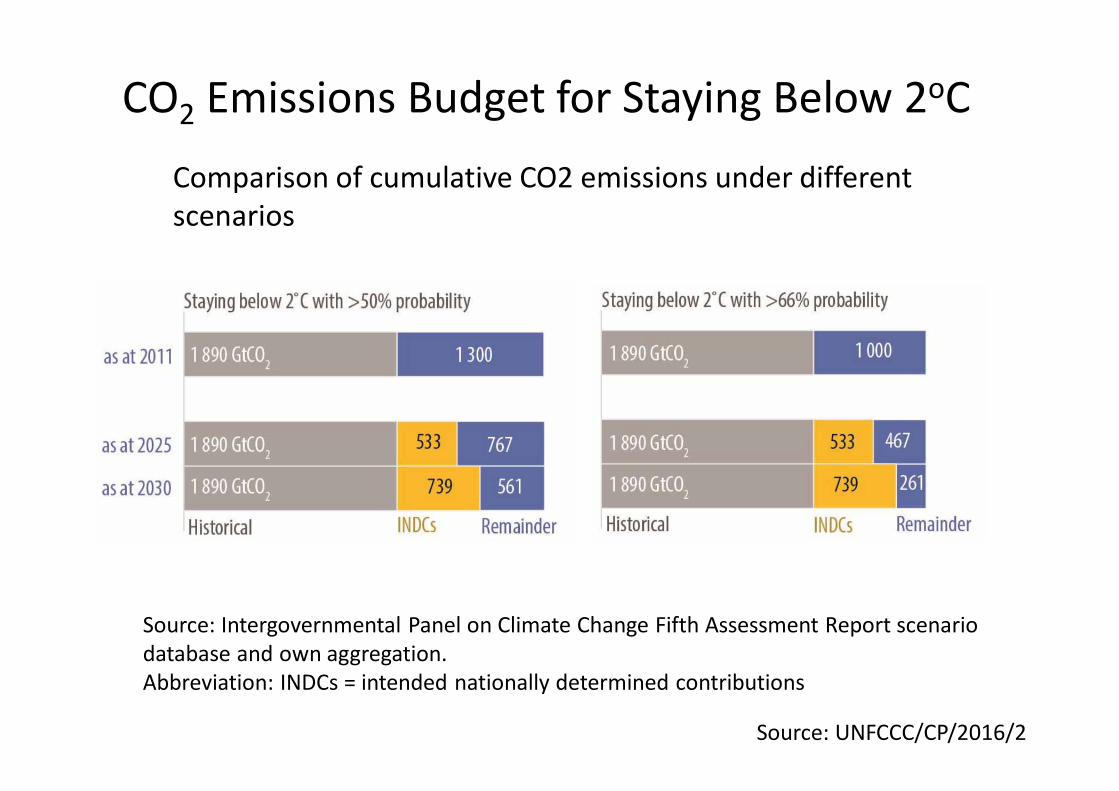
Comparison of cumulative CO2 emissions under different scenarios
Source: UNFCCC/CP/2016/2
CO2 Emissions Budget for Staying Below 2oC
Source: Intergovernmental Panel on Climate Change Fifth Assessment Report scenario database and own aggregation. Abbreviation: INDCs = intended nationally determined contributions
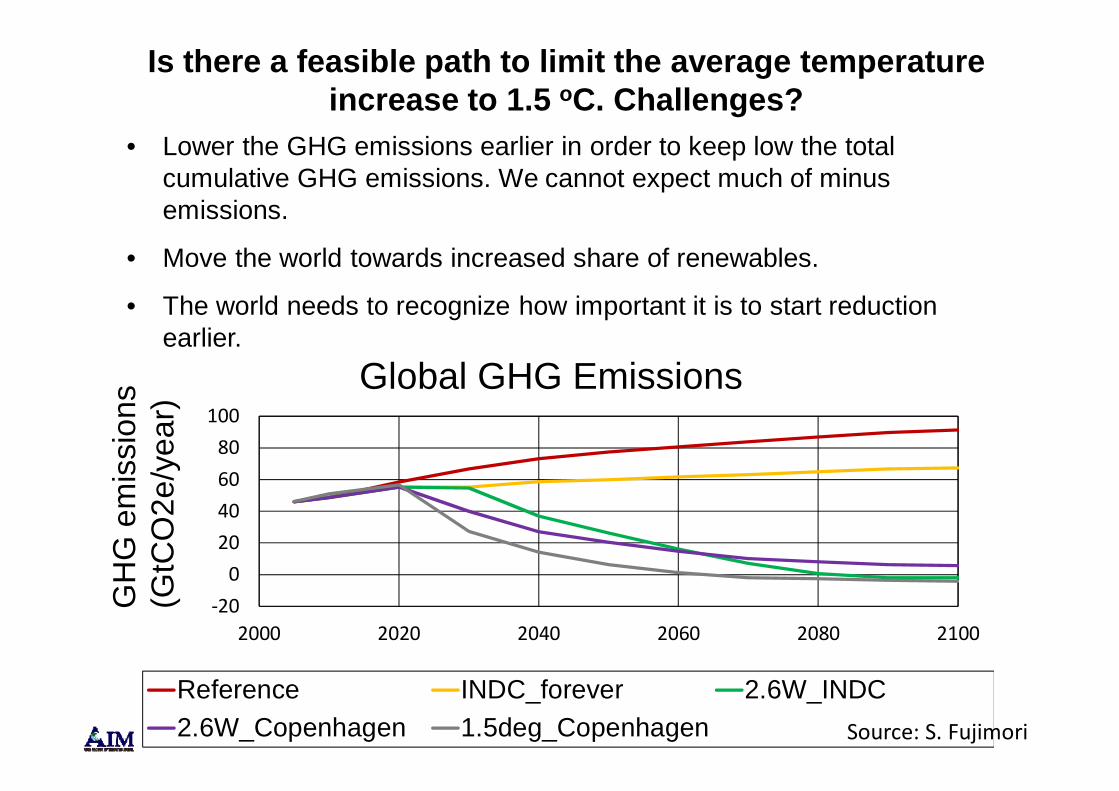
• Lower the GHG emissions earlier in order to keep low the total cumulative GHG emissions. We cannot expect much of minus emissions.
• Move the world towards increased share of renewables.
• The world needs to recognize how important it is to start reduction earlier.
‐200
20406080
100
2000 2020 2040 2060 2080 2100
Reference INDC_forever 2.6W_INDC2.6W_Copenhagen 1.5deg_Copenhagen
GH
G e
mis
sion
s (G
tCO
2e/y
ear)
Global GHG Emissions
Source: S. Fujimori
Is there a feasible path to limit the average temperature increase to 1.5 oC. Challenges?
0
200
400
600
800
1000
2005 2010 2020 2030 2040 2050 2060 2070 2080 2090 2100
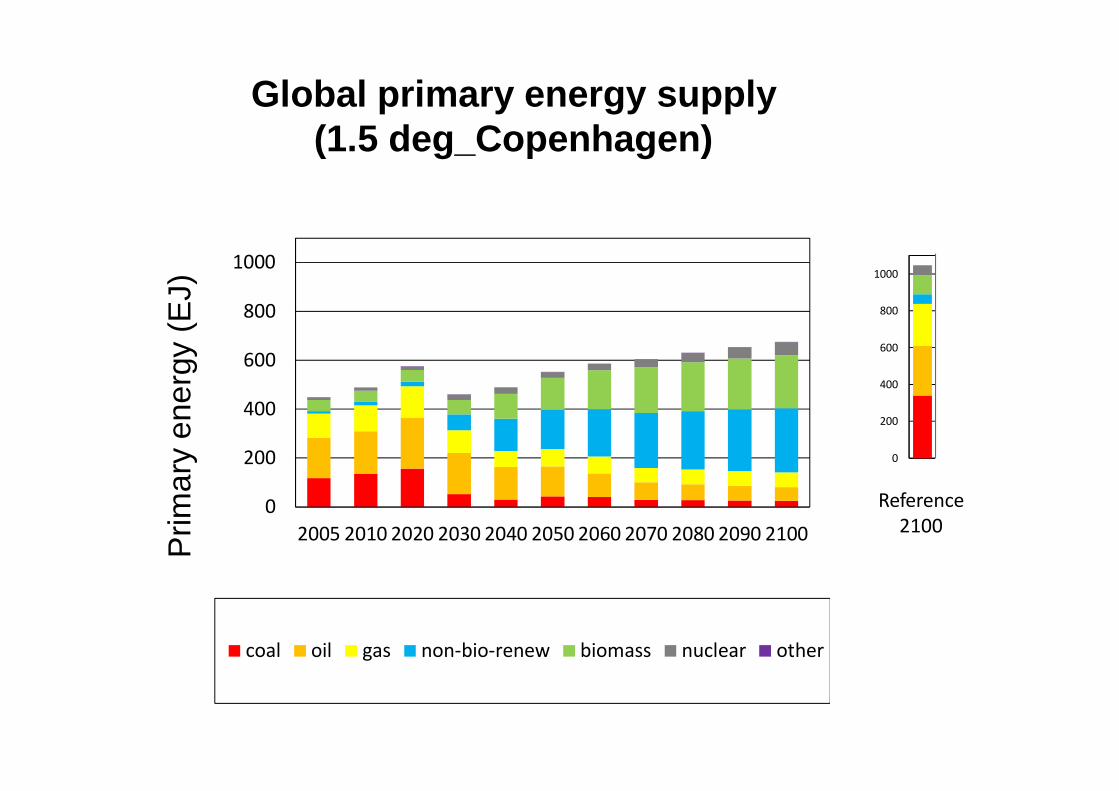
coal oil gas non‐bio‐renew biomass nuclear other
0
200
400
600
800
1000
Global primary energy supply (1.5 deg_Copenhagen)
Prim
ary
ener
gy(E
J)
Reference2100
020040060080010001200
Reference
2.6W
_INDC
1.5d
eeg_Co
…
Reference
2.6W
_INDC
1.5d
eeg_Co
…
Reference
2.6W
_INDC
1.5d
eeg_Co
…
Reference
2.6W
_INDC
1.5d
eeg_Co
…
Reference
2.6W
_INDC
1.5d
eeg_Co
…
2010 2020 2030 2050 2100
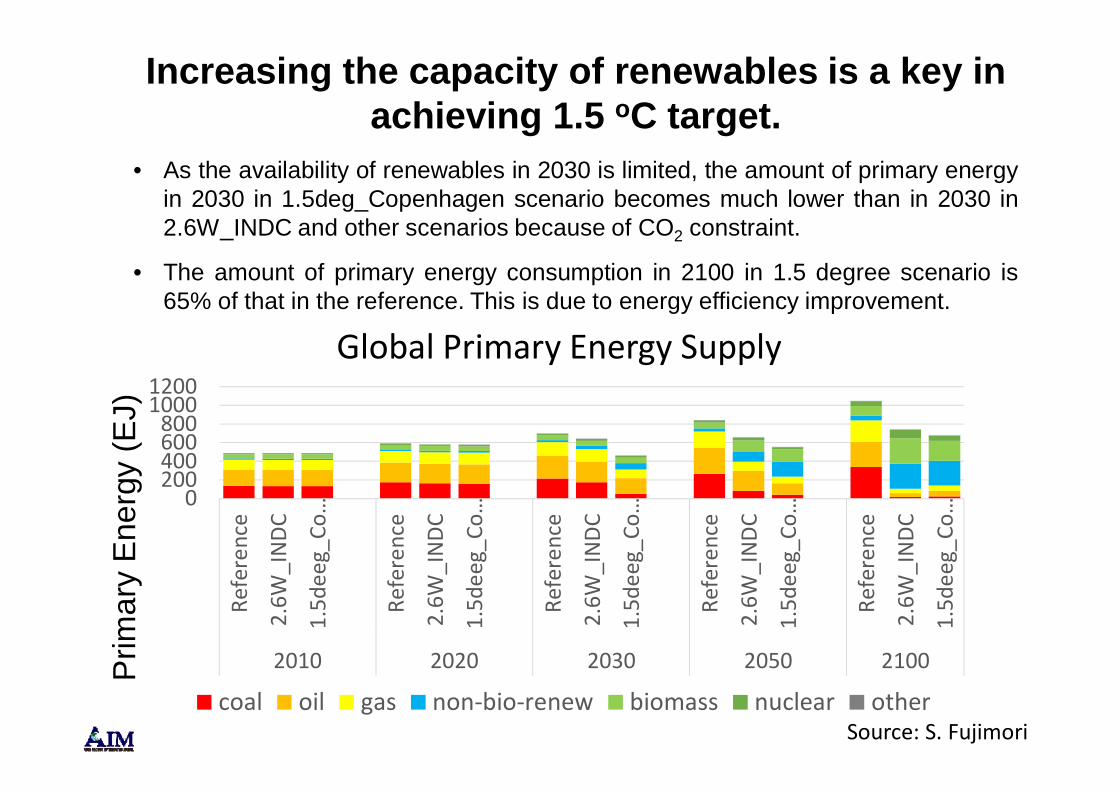
coal oil gas non‐bio‐renew biomass nuclear other
Prim
ary
Ene
rgy
(EJ)
• As the availability of renewables in 2030 is limited, the amount of primary energyin 2030 in 1.5deg_Copenhagen scenario becomes much lower than in 2030 in2.6W_INDC and other scenarios because of CO2 constraint.
• The amount of primary energy consumption in 2100 in 1.5 degree scenario is65% of that in the reference. This is due to energy efficiency improvement.
Global Primary Energy Supply
Source: S. Fujimori
Increasing the capacity of renewables is a key in achieving 1.5 oC target.
Source: Takahashi @ AIM workshophttp://www.nies.go.jp/ica-rus/en/
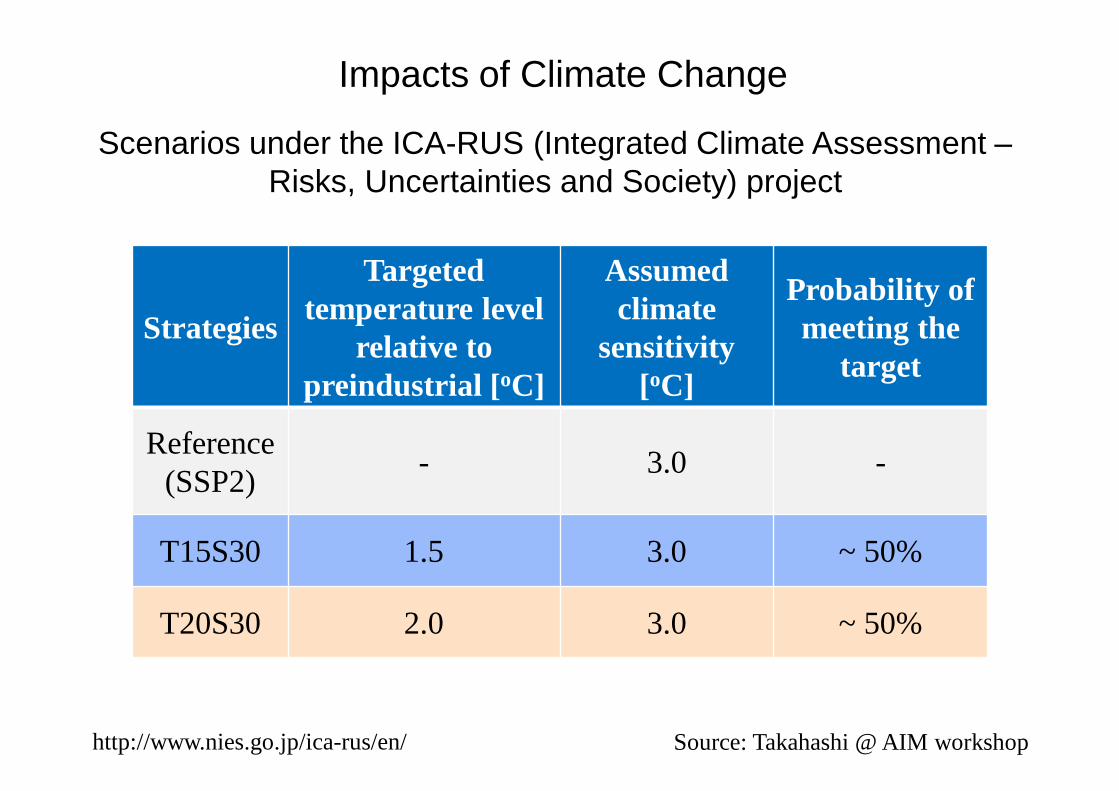
Scenarios under the ICA-RUS (Integrated Climate Assessment –Risks, Uncertainties and Society) project
Strategies
Targeted temperature level
relative to preindustrial [oC]
Assumed climate
sensitivity [oC]
Probability of meeting the
target
Reference (SSP2) - 3.0 -
T15S30 1.5 3.0 ~ 50%
T20S30 2.0 3.0 ~ 50%
Impacts of Climate Change
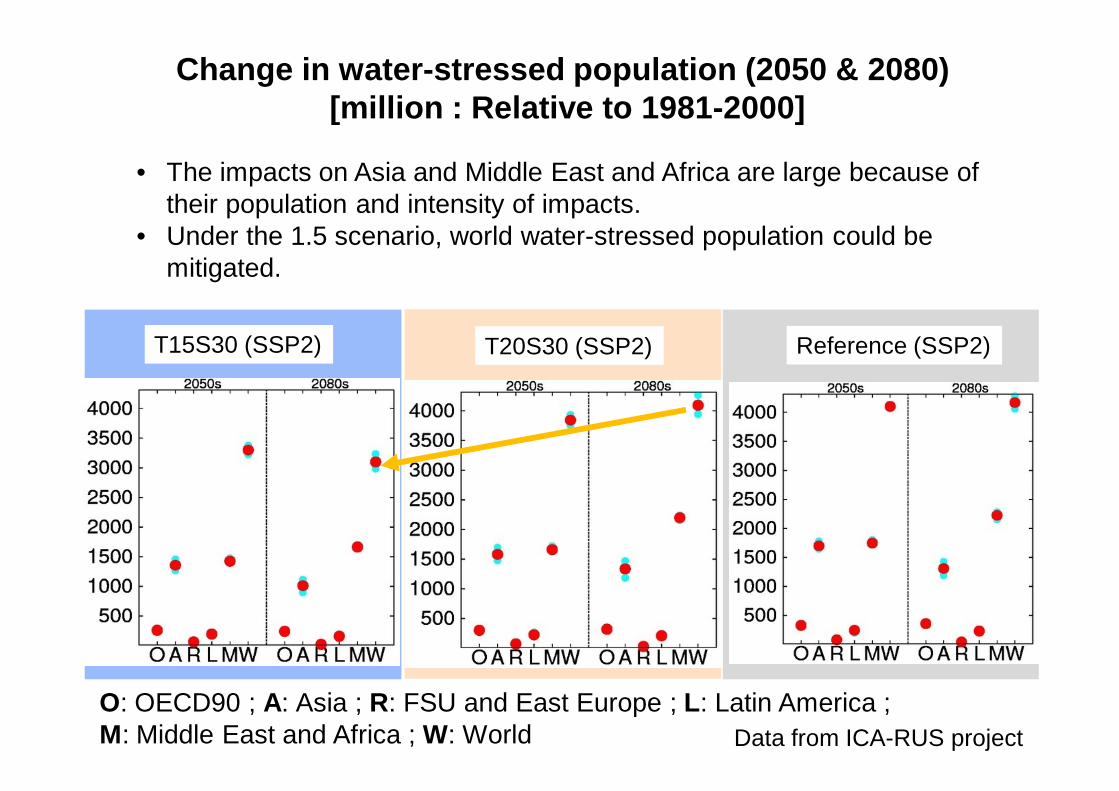
Change in water-stressed population (2050 & 2080)[million : Relative to 1981-2000]
O: OECD90 ; A: Asia ; R: FSU and East Europe ; L: Latin America ; M: Middle East and Africa ; W: World Data from ICA-RUS project
T15S30 (SSP2)
• The impacts on Asia and Middle East and Africa are large because of their population and intensity of impacts.
• Under the 1.5 scenario, world water-stressed population could be mitigated.
T20S30 (SSP2) Reference (SSP2)
T15S30 (SSP2) Reference (SSP2)T20S30 (SSP2)
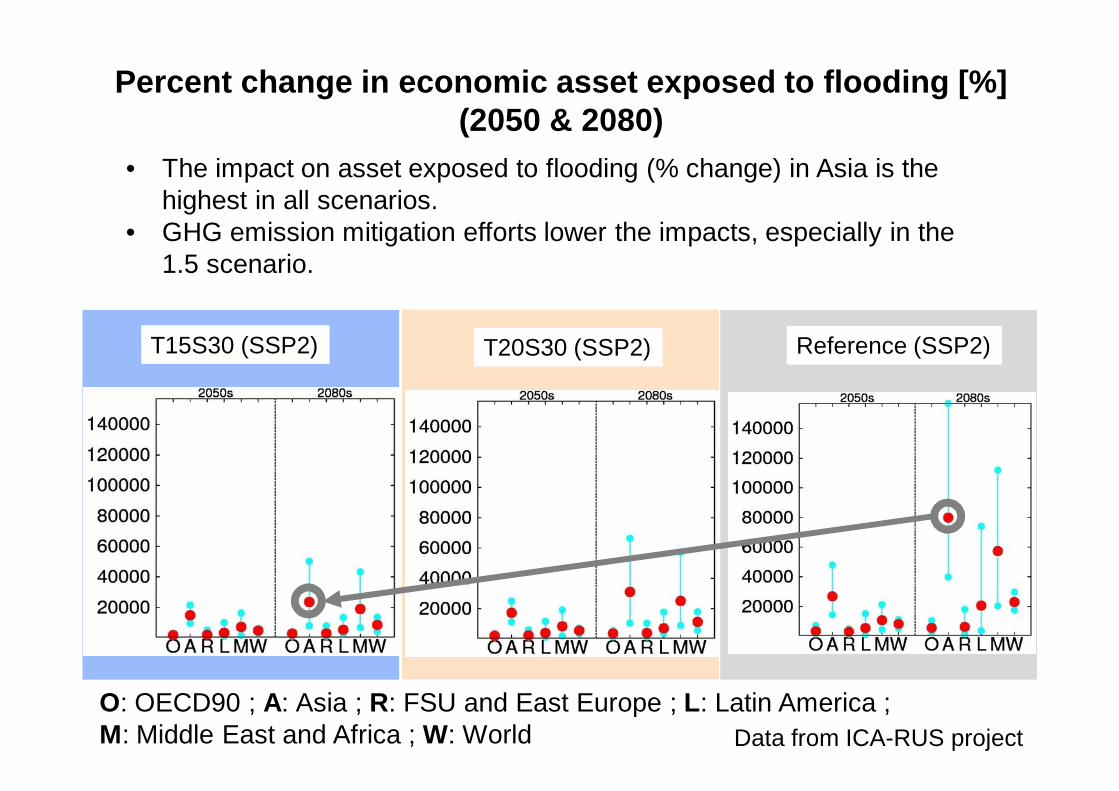
Percent change in economic asset exposed to flooding [%] (2050 & 2080)
• The impact on asset exposed to flooding (% change) in Asia is the highest in all scenarios.
• GHG emission mitigation efforts lower the impacts, especially in the 1.5 scenario.
Data from ICA-RUS project O: OECD90 ; A: Asia ; R: FSU and East Europe ; L: Latin America ; M: Middle East and Africa ; W: World
T15S30 (SSP2) T20S30 (SSP2)
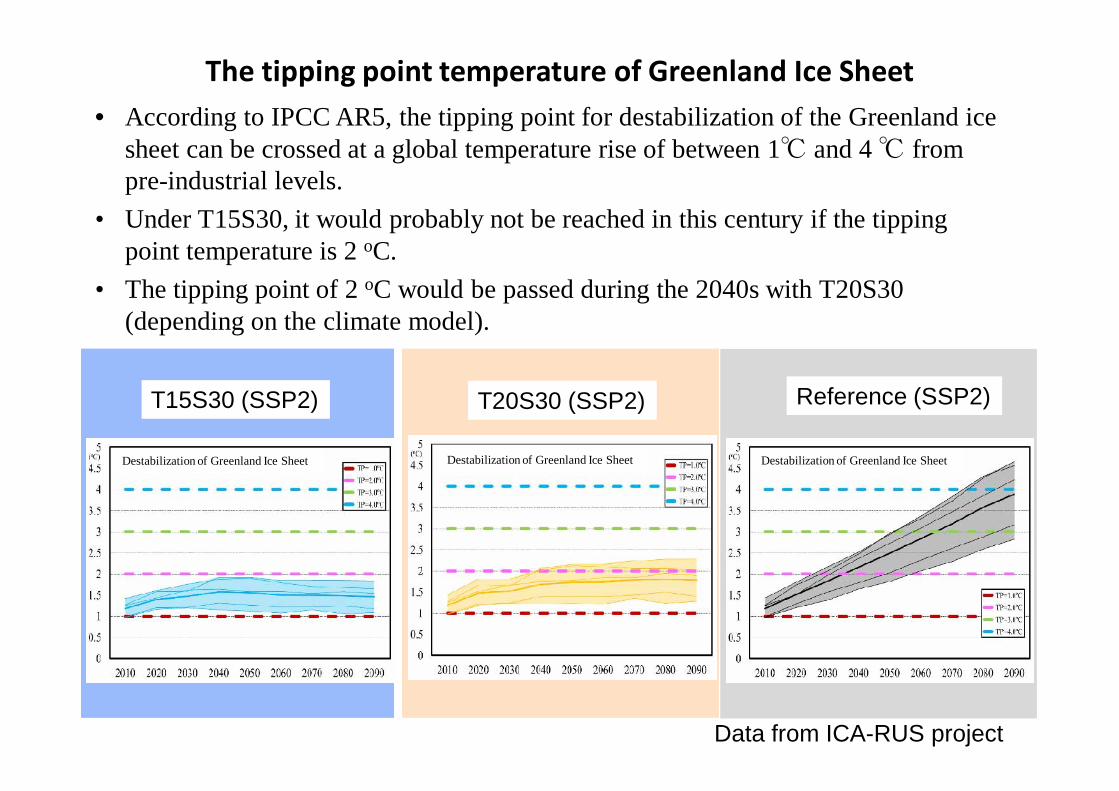
The tipping point temperature of Greenland Ice Sheet
Destabilization of Greenland Ice Sheet Destabilization of Greenland Ice Sheet Destabilization of Greenland Ice Sheet
Data from ICA-RUS project
• According to IPCC AR5, the tipping point for destabilization of the Greenland ice sheet can be crossed at a global temperature rise of between 1℃ and 4 ℃ from pre-industrial levels.
• Under T15S30, it would probably not be reached in this century if the tipping point temperature is 2 oC.
• The tipping point of 2 oC would be passed during the 2040s with T20S30 (depending on the climate model).
Reference (SSP2)
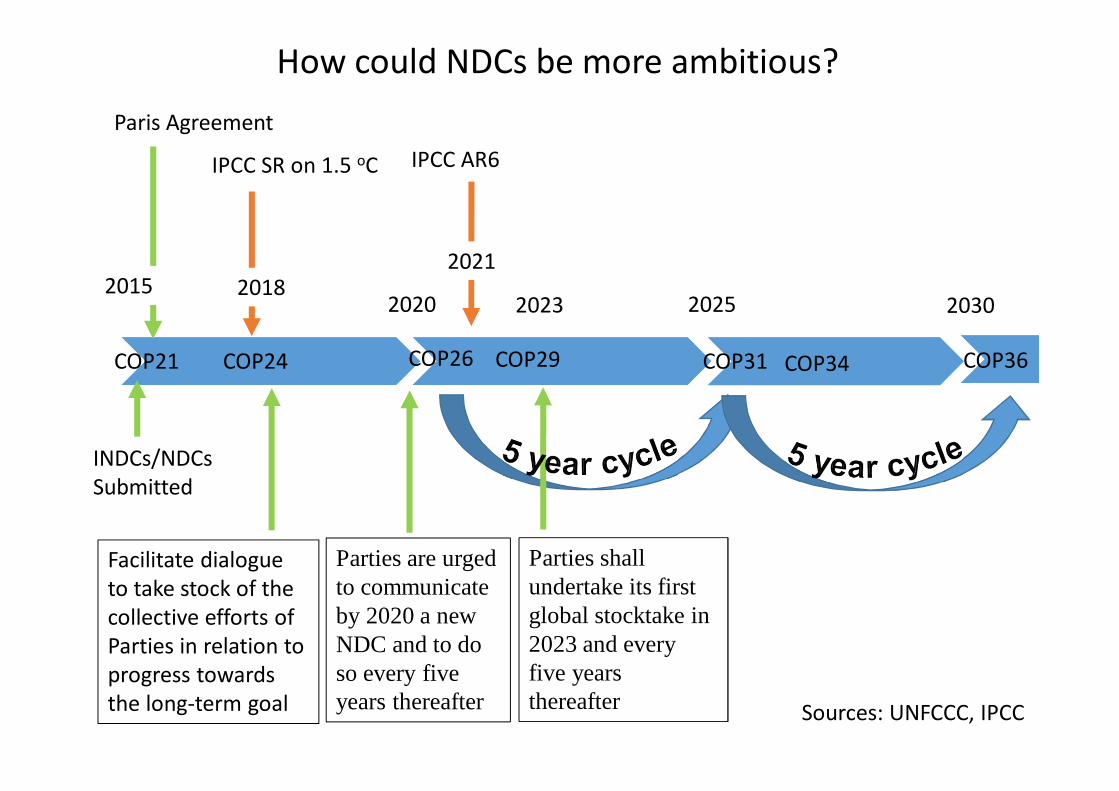
How could NDCs be more ambitious?
2020 2025 2030
IPCC AR6
2021
Paris Agreement
INDCs/NDCsSubmitted
2015
IPCC SR on 1.5 oC
2018
COP21 COP24 COP26 COP31 COP36COP29 COP34
Sources: UNFCCC, IPCC
2023
Facilitate dialogue to take stock of the collective efforts of Parties in relation to progress towards the long‐term goal
Parties are urged to communicate by 2020 a new NDC and to do so every five years thereafter
Parties shall undertake its first global stocktake in 2023 and every five years thereafter
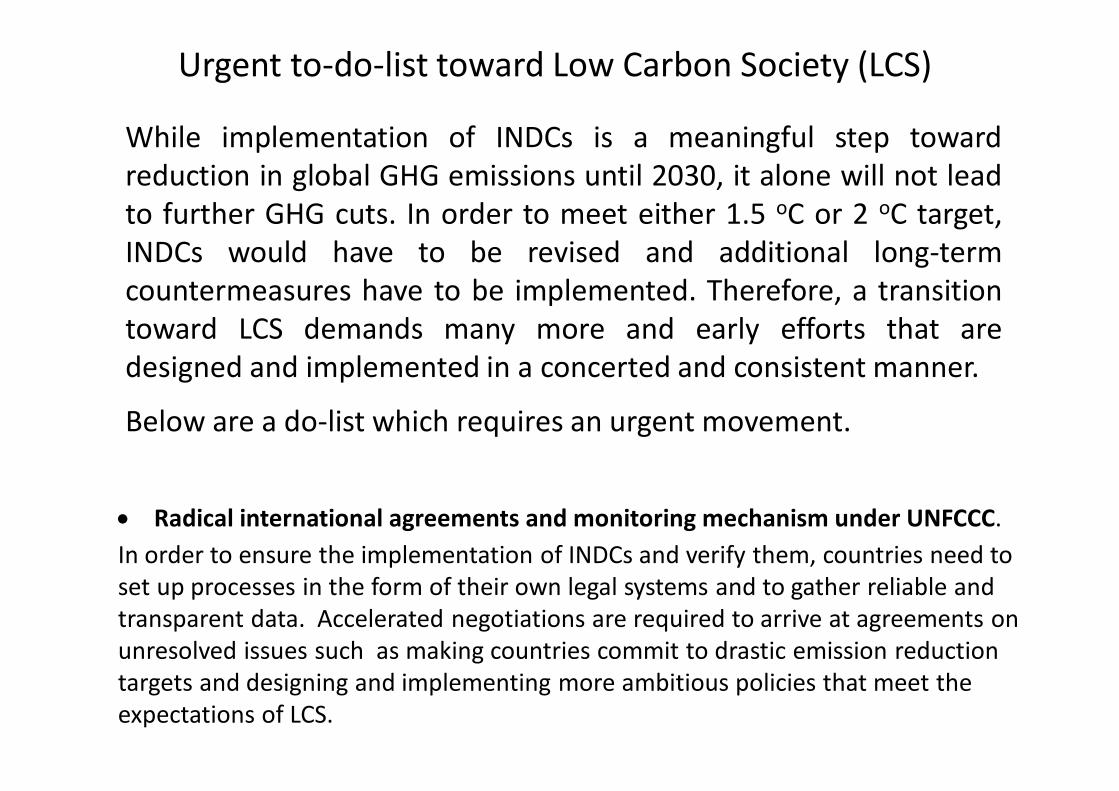
Radical international agreements and monitoring mechanism under UNFCCC. In order to ensure the implementation of INDCs and verify them, countries need to set up processes in the form of their own legal systems and to gather reliable and transparent data. Accelerated negotiations are required to arrive at agreements on unresolved issues such as making countries commit to drastic emission reduction targets and designing and implementing more ambitious policies that meet the expectations of LCS.
While implementation of INDCs is a meaningful step towardreduction in global GHG emissions until 2030, it alone will not leadto further GHG cuts. In order to meet either 1.5 oC or 2 oC target,INDCs would have to be revised and additional long‐termcountermeasures have to be implemented. Therefore, a transitiontoward LCS demands many more and early efforts that aredesigned and implemented in a concerted and consistent manner.
Below are a do‐list which requires an urgent movement.
Urgent to‐do‐list toward Low Carbon Society (LCS)
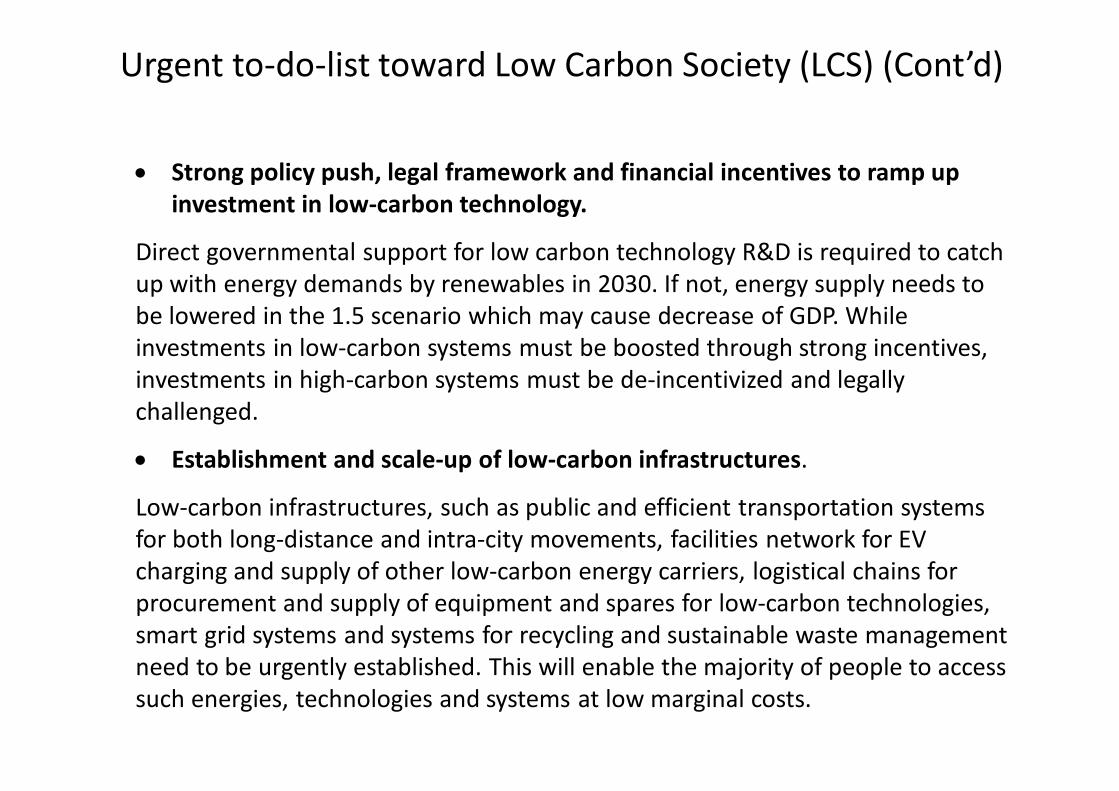
Strong policy push, legal framework and financial incentives to ramp up investment in low‐carbon technology.
Direct governmental support for low carbon technology R&D is required to catch up with energy demands by renewables in 2030. If not, energy supply needs to be lowered in the 1.5 scenario which may cause decrease of GDP. While investments in low‐carbon systems must be boosted through strong incentives, investments in high‐carbon systems must be de‐incentivized and legally challenged.
Establishment and scale‐up of low‐carbon infrastructures.
Low‐carbon infrastructures, such as public and efficient transportation systems for both long‐distance and intra‐city movements, facilities network for EV charging and supply of other low‐carbon energy carriers, logistical chains for procurement and supply of equipment and spares for low‐carbon technologies, smart grid systems and systems for recycling and sustainable waste management need to be urgently established. This will enable the majority of people to access such energies, technologies and systems at low marginal costs.
Urgent to‐do‐list toward Low Carbon Society (LCS) (Cont’d)
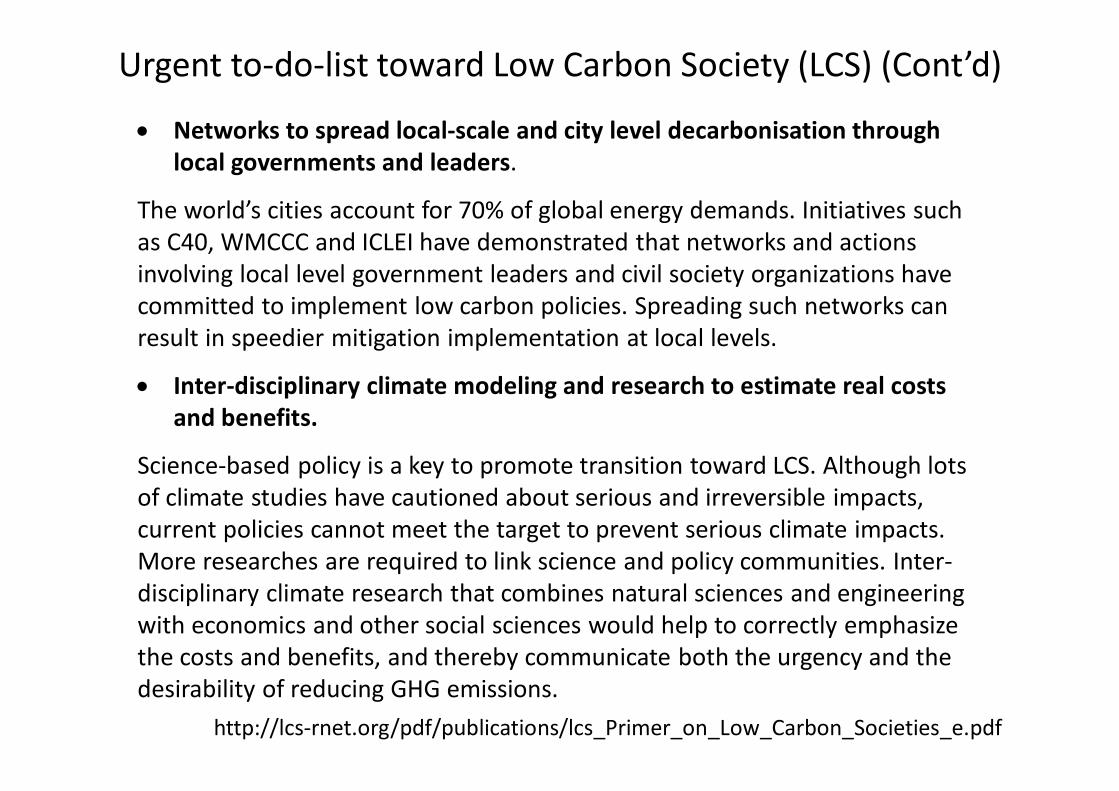
http://lcs‐rnet.org/pdf/publications/lcs_Primer_on_Low_Carbon_Societies_e.pdf
Urgent to‐do‐list toward Low Carbon Society (LCS) (Cont’d)
Networks to spread local‐scale and city level decarbonisation through local governments and leaders.
The world’s cities account for 70% of global energy demands. Initiatives such as C40, WMCCC and ICLEI have demonstrated that networks and actions involving local level government leaders and civil society organizations have committed to implement low carbon policies. Spreading such networks can result in speedier mitigation implementation at local levels.
Inter‐disciplinary climate modeling and research to estimate real costs and benefits.
Science‐based policy is a key to promote transition toward LCS. Although lots of climate studies have cautioned about serious and irreversible impacts, current policies cannot meet the target to prevent serious climate impacts. More researches are required to link science and policy communities. Inter‐disciplinary climate research that combines natural sciences and engineering with economics and other social sciences would help to correctly emphasize the costs and benefits, and thereby communicate both the urgency and the desirability of reducing GHG emissions.
Thank you for your attention!
‐Mahatma GandhiYou must be the change you wish to see in the world.
http://lcs‐rnet.org/
http://www‐iam.nies.go.jp/aim/