Toward EEG Sensing of Imagined Speech
9
J.A. Jacko (Ed.): Human-Computer Interaction, Part I, HCII 2009, LNCS 5610, pp. 40–48, 2009. © Springer-Verlag Berlin Heidelberg 2009 Toward EEG Sensing of Imagined Speech Michael D’Zmura, Siyi Deng, Tom Lappas, Samuel Thorpe, and Ramesh Srinivasan Department of Cognitive Sciences, UC Irvine, SSPB 3219, Irvine, CA 92697-5100 {mdzmura,sdeng,tlappas,sthorpe,r.srinivasan}@uci.edu Abstract. Might EEG measured while one imagines words or sentences provide enough information for one to identify what is being thought? Analysis of EEG data from an experiment in which two syllables are spoken in imagination in one of three rhythms shows that information is present in EEG alpha, beta and theta bands. Envelopes are used to compute filters matched to a particular ex- perimental condition; the filters' action on data from a particular trial lets one determine the experimental condition used for that trial with appreciably greater-than-chance performance. Informative spectral features within bands lead us to current work with EEG spectrograms. Keywords: EEG, imagined speech, covert speech, classification. 1 Introduction Dewan reported in 1967 [1] that he and several others could transmit letters of the alphabet using EEG recording; their ability to control voluntarily the amplitude of their alpha waves let them send letters using Morse code. Farwell and Donchin [2] used a second method for transmitting linguistic information by EEG; the P300 re- sponse to targets let them determine which of a sequence of displayed letters a person had in mind. Finally, Suppes and colleagues [3,4] reported that they were able to classify EEG responses to heard sentences and that there was information available through EEG concerning imagined speech. The work reported here verifies this latter result and develops it further, with the aim of using EEG brain waves to communicate imagined speech. Classification experiments show that brain-wave signatures of imagined speech lets one distinguish linguistic content, with varying degree of success. These signa- tures include differences in alpha-, beta- and theta-band activity. Our near-term goal is to use such signatures to design filters that let one distinguish linguistic elements in real time. One application is in further experiments which provide feedback to the thinker as to how recognizable a particular thought is, with the aim of training the thinker to produce brain waves which are more discernible. The focus within is on the results of a single experiment in which subjects produce in their imagination one of two syllables in one of three different rhythms. Analysis of the data using envelopes within alpha, beta and theta frequency bands, spectral fea- tures within single bands, and spectrograms in current work show that EEG provides considerable information on imagined speech in this experimental setting.
Transcript of Toward EEG Sensing of Imagined Speech

J.A. Jacko (Ed.): Human-Computer Interaction, Part I, HCII 2009, LNCS 5610, pp. 40–48, 2009. © Springer-Verlag Berlin Heidelberg 2009
Toward EEG Sensing of Imagined Speech
Michael D’Zmura, Siyi Deng, Tom Lappas, Samuel Thorpe, and Ramesh Srinivasan
Department of Cognitive Sciences, UC Irvine, SSPB 3219, Irvine, CA 92697-5100 {mdzmura,sdeng,tlappas,sthorpe,r.srinivasan}@uci.edu
Abstract. Might EEG measured while one imagines words or sentences provide enough information for one to identify what is being thought? Analysis of EEG data from an experiment in which two syllables are spoken in imagination in one of three rhythms shows that information is present in EEG alpha, beta and theta bands. Envelopes are used to compute filters matched to a particular ex-perimental condition; the filters' action on data from a particular trial lets one determine the experimental condition used for that trial with appreciably greater-than-chance performance. Informative spectral features within bands lead us to current work with EEG spectrograms.
Keywords: EEG, imagined speech, covert speech, classification.
1 Introduction
Dewan reported in 1967 [1] that he and several others could transmit letters of the alphabet using EEG recording; their ability to control voluntarily the amplitude of their alpha waves let them send letters using Morse code. Farwell and Donchin [2] used a second method for transmitting linguistic information by EEG; the P300 re-sponse to targets let them determine which of a sequence of displayed letters a person had in mind. Finally, Suppes and colleagues [3,4] reported that they were able to classify EEG responses to heard sentences and that there was information available through EEG concerning imagined speech. The work reported here verifies this latter result and develops it further, with the aim of using EEG brain waves to communicate imagined speech.
Classification experiments show that brain-wave signatures of imagined speech lets one distinguish linguistic content, with varying degree of success. These signa-tures include differences in alpha-, beta- and theta-band activity. Our near-term goal is to use such signatures to design filters that let one distinguish linguistic elements in real time. One application is in further experiments which provide feedback to the thinker as to how recognizable a particular thought is, with the aim of training the thinker to produce brain waves which are more discernible.
The focus within is on the results of a single experiment in which subjects produce in their imagination one of two syllables in one of three different rhythms. Analysis of the data using envelopes within alpha, beta and theta frequency bands, spectral fea-tures within single bands, and spectrograms in current work show that EEG provides considerable information on imagined speech in this experimental setting.

Toward EEG Sensing of Imagined Speech 41
2 Methods
Four subjects participated in an experiment with six conditions determined factorially through combination of two syllables and three rhythms (see Figure 1). A single ex-perimental session comprised 20 trials for each of the six conditions; conditions were presented in block-randomized order. Each subject participated in six such sessions for a total of 120 trials per condition. EEG was recorded using a 128 Channel Sensor Net (Electrical Geodesics) in combination with an amplifier and acquisition software (Advanced Neuro Technology). The EEG was sampled at 1024Hz and on-line aver-age referenced. Subjects were instructed to keep their eyes open in the dimly-lit re-cording room and to avoid eye and other movement during the six seconds, following the cue, during which speech was imagined without any vocalization whatsoever.
Fig. 1. Timelines for the six conditions, labeled at left, in the imagined speech experiment. Durations are indicated in eighths of a second. The syllable /ba/ was imagined in one of three different rhythms in conditions 1-3; the syllable /ku/ was imagined in conditions 4-6. The con-dition for each trial was cued during an initial period of duration 4.5 sec (12/8 sec = 1.5 sec; 3 x 1.5 sec = 4.5 sec). During this initial period, subjects heard through Stax electrostatic earphones either a spoken "ba" or a spoken "ku" followed by a train of clicks (arrows) indicating the rhythm to be reproduced. Subjects were instructed to speak in their imagination the cued sylla-ble, illustrated for condition 1 by {ba}, using the cued rhythm and tempo. Desired imagined syllable onset times reproduce the cued rhythm and are indicated by asterisks.
3 Analysis and Results
Our aims were to classify single trials offline according to condition and discern con-dition signatures needed to create online filters. EEG waveform envelopes provide encouraging results when used to classify trials according to experimental condition.

42 M. D’Zmura et al.
These envelopes were computed for each electrode in the theta (3-8Hz), alpha (8-13Hz) and beta (13-18Hz) frequency bands and used to construct matched filters. These filters work well to classify trials according to condition, yet further results with spectra lead us to explore a finer-grained analysis using spectrograms.
3.1 Matched-Filter Classification Using Envelopes
We used waveform envelopes to compute matched filters, one for each of the six conditions (see Figure 2). The inner product of each matched filter with a particular trial's envelope provides six numbers. The matched filter which gives rise to the largest inner product is the best match, and the condition to which the matched filter corresponds is declared the best guess as to the experimental condition for that trial.
Offline preprocessing steps include
• segment the EEG data to provide time-varying waveforms for each condition, electrode and trial;
• remove from further consideration 18 electrodes most sensitive to electromyog-raphic artifact: those with the lowest positions about the head and spanning loca-tions close to the eyes, low on the temple, at or below the ear, and at or below the external occipital protuberance;
• remove the mean and linear trend from each segmented waveform; • low-pass filter the detrended, segmented, waveforms to remove 60Hz line noise; • use thresholds to identify and remove from further consideration filtered wave-
forms likely contaminated with electromyographic artifact.
Alpha-, beta- and theta-band activity were computed for each electrode and trial us-
ing band-pass elliptic filters. These band-pass filtered waveforms (we[t] and bottom right plot in Fig. 2) were Hilbert-transformed to provide corresponding envelopes
(ve[t] and middle right plot). The envelopes serve as input to the matched-filter classi-fication and as data used to construct the matched filters. An electrode's average enve-lopes, found by averaging across trials for each of the six conditions, serve as matched filters with one further step: for each electrode, pseudoinvert the six conditions' aver-
age envelopes to provide six filters (Fec[t] and top right plot). The inversion of the average envelopes provides filters which return an inner product of one for the corre-sponding condition's average envelope and an inner product of zero for all other condi-tion's average envelopes. Information may be integrated across electrodes by summing the measures pe,c across electrodes and determining the maximum of the resulting six numbers. Information may be integrated across bands by weighing individual response measures for the three bands by band reliability estimates or by a voting procedure.
Classification results shown in Table 1 show that the beta band (13-18Hz) is, for all but one subject, the most informative frequency band; theta (3-8Hz) and alpha (8-13Hz) are comparable for all subjects but S1. The per-condition classification per-formance is shown for subject S2 in Fig. 3. Rows refer to a trial's actual condition, while columns refer to the condition of the matched filter for which the maximal response was obtained. Darker values indicate higher percentages of trials. These dark values describe diagonals, which indicates a match between a trial's actual condition and the condition with matched filter providing the greatest response.
Toward EEG Sensing of Imagined Speech 43
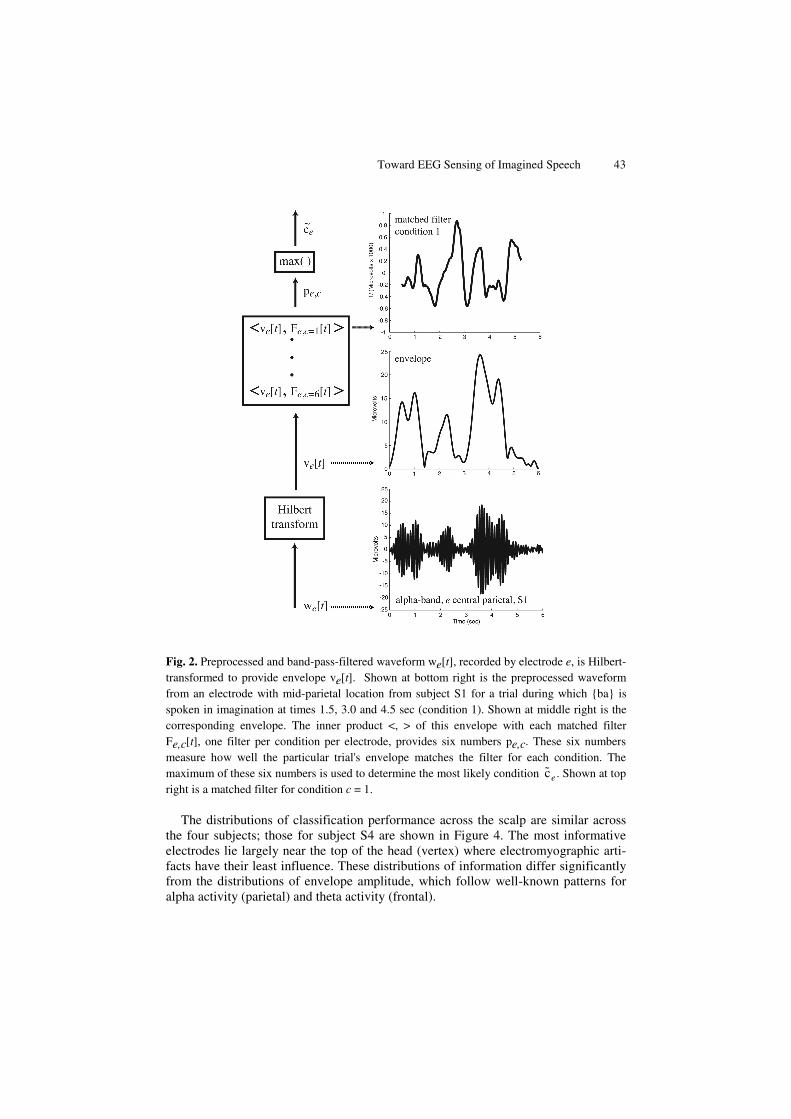
Fig. 2. Preprocessed and band-pass-filtered waveform we[t], recorded by electrode e, is Hilbert-transformed to provide envelope ve[t]. Shown at bottom right is the preprocessed waveform from an electrode with mid-parietal location from subject S1 for a trial during which {ba} is spoken in imagination at times 1.5, 3.0 and 4.5 sec (condition 1). Shown at middle right is the corresponding envelope. The inner product <, > of this envelope with each matched filter Fe,c[t], one filter per condition per electrode, provides six numbers pe,c. These six numbers measure how well the particular trial's envelope matches the filter for each condition. The maximum of these six numbers is used to determine the most likely condition ˜ c e . Shown at top right is a matched filter for condition c = 1.
The distributions of classification performance across the scalp are similar across the four subjects; those for subject S4 are shown in Figure 4. The most informative electrodes lie largely near the top of the head (vertex) where electromyographic arti-facts have their least influence. These distributions of information differ significantly from the distributions of envelope amplitude, which follow well-known patterns for alpha activity (parietal) and theta activity (frontal).

44 M. D’Zmura et al.
Table 1. Classification performance using matched filters for envelopes in three frequency bands. The fraction of correctly-classified trials (720 trials per subject, identified in the left column) is indicated. The chance performance level in this classification among six conditions is 1/6 (0.17).
alpha beta theta S1 0.38 0.80 0.63 S2 0.63 0.87 0.59 S3 0.44 0.68 0.46 S4 0.64 0.62 0.59
Fig. 3. Classification matrices for subject S2. Values along the diagonals indicate correct classi-fication, while non-white values off the diagonal indicate errors. The black gray-value in the middle panel (beta-band) for actual condition 1 and matched filter condition 1 (top left square) represents 91% of the trials; lighter shades indicate smaller values (through white indicating 0%). Perfect performance would be indicated by all off-diagonal entries set to white.
Fig. 4. Distributions of classification performance across the scalp for alpha (α), beta (β) and theta (θ) bands for subject S4. Darker values indicate the positions of electrodes providing better classification performance.
3.2 Spectral Features
Analysis of trials’ power spectral densities shows that differences in power within single frequency bands can provide information concerning trial condition. Spectral

Toward EEG Sensing of Imagined Speech 45
differences within a single band are completely invisible to the previous analysis, which grouped together activity at all frequencies within a single band.
Data for subjects S1 and S2 show that, for condition 3, there is a peak in the power spectrum in the range 5-6Hz, relative to baseline power measured at 3.5-4.5Hz. This peak is largely absent for condition 1. This difference between the average power spectra for conditions 3 and 1 is localized to electrodes with front central locations on the scalp (see Fig. 5, leftmost panels). This spectral difference alone, within the theta band, provides ~75% correct two-way classification between these two conditions. The peak and the localized spatial distribution do not exist for subjects S3 and S4 (see Fig. 5, rightmost panels).
Fig. 5. Difference between condition 3 and condition 1 theta sub-band spectral power localized primarily to electrodes with front, center locations for subjects S1 and S2; this pattern is not evident for S3 and S4
3.3 Spectrographic Analysis
The spectral data suggest several things. The first is that one would do well to repre-sent EEG data spectrographically: record power as a fine-grained function of both frequency and time. The second and third are more cautionary. There is a tremendous amount of trial-by-trial variability in EEG recordings. Adding channels, like further frequency bands of narrow range as in spectrograms, may have the effect of masking signals more effectively. Furthermore, fine subdivision of the frequency domain may reveal individual differences (as in Fig. 5), so that averages across subjects become less meaningful. These caveats notwithstanding, our current work focuses on spectro-graphic means of identifying imagined speech.
4 Discussion
The syllables /ba/ and /ku/ have little semantic content in and of themselves, so that differences in EEG records underlying classification performance are unlikely to reflect semantic contributions to imagined speech production. Furthermore, each experimental trial starts with a period during which the cue to the condition is pre-sented; cue recognition and response planning occur during the cue period and are likely absent during the following period in which EEG recording is made of imag-ined speech. The EEG recordings analyzed here concern most likely immediate as-pects of imagined speech production based on readout from working memory.

46 M. D’Zmura et al.
EEG electrodes record not only signals from brain cortex but also electromyog-raphic activity. Common sources of the latter are muscles responsible for eye and head movements and other muscles near recording electrodes, like those in the tem-ples and neck. Electrodes atop or close to such muscles are most sensitive to electro-myographic activity. The most flagrant such offenders were excluded from analysis in the work reported here. Furthermore, recordings for which EEG signals (detrended and filtered to excluded 60Hz line noise) exceeded 30 µV in absolute value were excluded from consideration. This threshold eliminated many (but not all) recordings contaminated with artifact. The most informative electrodes are those positioned on the scalp near the top of the head (Fig. 3), and this suggests that the information is due more to cortical than electromyographic activity.
Subjects were instructed to think the imagined speech without any vocal or subvo-cal activity: without moving any muscles involved in producing overt speech. This contrasts with what is the most successful method yet for recognizing speech pro-duced without any acoustic signal: surface electromyographic (SEMG) recordings from face and throat muscles. Substantial progress has been made in automatic speech recognition from surface EMG recordings of vocal tract articulators made during both spoken speech [5-10] and subvocalized speech [11-17].
Further non-acoustic methods for extracting imagined speech information potentially include magnetoencephalography (MEG) and invasive methods, like electrocorticogra-phy (ECoG), which involve implanted electrodes. While there are no published positive results yet for classification of imagined speech using MEG, its high temporal resolution and moderate spatial resolution (comparable to high-density EEG) suggest its value, as does success in classifying heard speech [18-21]. MEG is most sensitive to cortical signals from surfaces perpendicular to the scalp (in sulci) while EEG is most sensitive to signals from parallel surfaces (gyri) [22], so that the two methods are complementary. While the use of electrodes implanted in the brain is limited to small clinical populations for which these electrodes are indicated in combination with neurosurgery, it can pro-vide very useful information concerning imagined speech [23]. Functional magnetic resonance imaging (fMRI) studies have contributed significantly to our neuroscientific knowledge of language perception and production [24-27]. Yet the poor temporal reso-lution of fMRI and of functional near-infrared imaging (fNIR) make these unlikely candidates for speech recognition.
EEG is a non-invasive, non-injurious method for probing cortical activity which has a high temporal resolution, moderate spatial resolution (~2cm), a relatively low cost and which is increasingly portable. We feel that its greatest contribution as a brain-computer interface is likely to be found in circumstances where a human subject is trained to produce activity discernible by EEG [28]. Such training can reduce the variability associated with imagined speech production and also help one emphasize aspects of imagined speech which are most easily discerned by EEG. Our next step is to close the loop by providing real-time feedback concerning imagined speech signals.
Acknowledgements
We thank David Poeppel for suggesting the value of an experiment like this. This work was supported by ARO 54228-LS-MUR.

Toward EEG Sensing of Imagined Speech 47
References
1. Dewan, E.M.: Occipital alpha rhythm eye position and lens accommodation. Nature 214, 975–977 (1967)
2. Farwell, L.A., Donchin, D.: Talking off the top of your head: toward a mental prosthesis utilizing event-related brain potentials. Electroencephalogy and Clinical Neurophysiol-ogy 70, 510–523 (1988)
3. Suppes, P., Lu, Z.-L., Han, B.: Brain wave recognition of words. Proceedings of the Na-tional Academy of Science USA 94, 14965–14969 (1997)
4. Suppes, P., Han, B., Lu, Z.-L.: Brain wave recognition of sentences. Proceedings of the National Academy of Science USA 95, 15861–15866 (1998)
5. Morse, M.S., O’Brien, E.M.: Research summary of a scheme to ascertain the availability of speech information in the myoelectric signals of neck and head muscles using surface electrodes. Computers in Biology and Medicine 16, 399–410 (1986)
6. Chan, A.D.C., Englehart, K., Hudgins, B., Lovely, D.F.: Hidden Markov model classifica-tion of myoelectric signals in speech. IEEE Engineering in Medicine and Biology 21, 143–146 (2002a)
7. Chan, A.D.C., Englehart, K., Hudgins, B., Lovely, D.F.: Multiexpert automatic speech recognition using acoustic and myoelectric signals. IEEE Transactions on Biomedical En-gineering 53, 676–685 (2002b)
8. Bu, N., Tsuji, T., Arita, J., Ohga, M.: Phoneme classification for speech synthesizer using differential EMG signals between muscles. In: Proceedings of the 2005 IEEE Engineering in Medicine and Biology 27th Annual Conference, pp. 5962–5966 (2005)
9. Jou, S.-C., Maier-Hein, L., Schultz, T., Waibel, A.: Articulatory feature classification us-ing surface electromyography. In: Acoustics, Speech and Signal Processing, ICASSP 2006 Proceedings, pp. I–605–I–608 (2006)
10. Jou, S.-C., Schultz, T., Walliczek, M., Kraft, F., Waibel, A.: Towards continuous speech recognition using surface electromyography. In: Interspeech 2006 – ICSLP, pp. 573–576 (2006)
11. Jorgensen, C., Lee, D.D., Agabon, S.: Sub-auditory speech recognition based on EMG sig-nals. In: Proceedings of the International Joint Conference on Neural Networks, Portland Oregon (July 2003)
12. Betts, B.J., Jorgensen, C.: Small vocabulary recognition using surface electromyography in an acoustically harsh environment. NASA/TM-2005-213471 (2005)
13. Maier-Hein, L.: Speech recognition using surface electromyography. Diplomarbeit, Uni-versität Karlsruhe (2005)
14. Maier-Hein, L., Metze, F., Schultz, T., Waibel, A.: Session independent non-audible speech recognition using surface electromyography. In: 2005 IEEE Workshop on Auto-matic Speech Recognition and Understanding, pp. 331–336 (2005)
15. Jorgensen, C., Binsted, K.: Web browser control using EMG based sub vocal speech rec-ognition. In: Proceedings of the 38th Annual Hawaii International Conference on System Sciences (HICSS 2005), pp. 294–301 (2005)
16. Binsted, K., Jorgensen, C.: Sub-auditory speech recognition. In: HICSS (2006) 17. Walliczek, M., Kraft, F., Jou, S.-C., Schultz, T., Waibel, A.: Sub-word unit based non-
audible speech recognition using surface electromyography. In: Interspeech 2006 - ICSLP, pp. 1487–1490 (2006)
18. Numminen, J., Curio, G.: Differential effects of overt, covert and replayed speech on vowel-evoked responses of the human auditory cortex. Neuroscience Letters 272(1), 29–32 (1999)

48 M. D’Zmura et al.
19. Ahissar, E., Nagarajan, S., Ahissar, M., Protopapas, A., Mahncke, H., Merzenich, M.M.: Speech comprehension is correlated with temporal response patterns recorded from audi-tory cortex. Proceedings of the National Academy of Sciences 98, 13367–13372 (2001)
20. Houde, J.F., Nagarajan, S.S., Sekihara, K., Merzenich, M.M.: Modulation of the auditory cortex during speech: an MEG study. Journal of Cognitive Neuroscience 15, 1125–1138 (2002)
21. Luo, H., Poeppel, D.: Phase patterns of neuronal responses reliably discriminate speech in human auditory cortex. Neuron 54, 1001–1010 (2007)
22. Nunez, P.L., Srinivasan, R.: Electric Fields of the Brain: The Neurophysics of EEG, 2nd edn. Oxford University Press, New York (2006)
23. Barras, C.: Brain implant helps stroke victim speak again. New Scientist (July 2008) 24. Indefrey, P., Levelt, W.J.M.: The spatial and temporal signatures of word production com-
ponents. Cognition 92, 101–144 (2004) 25. Hickok, G., Poeppel, D.: Dorsal and ventral streams: a framework for understanding as-
pects of the functional anatomy of language. Cognition 92, 67–99 (2004) 26. Hickok, G., Poeppel, D.: The cortical organization of speech processing. Nature Reviews
Neuroscience 8, 393–402 (2007) 27. Poeppel, D., Idsardi, W.M., van Wassenhove, V.: Speech perception at the interface of
neurobiology and linguistics. Philosophical Transactions of the Royal Society B 363, 1071–1086 (2007)
28. Fetz, E.: Volitional control of neural activity: implications for brain-computer interfaces. Journal of Physiology 579, 571–579 (2007)