Toward a Sustainable Cement Industrywbcsdcement.org/pdf/battelle/final_report5.pdf · They are...
39
Transcript of Toward a Sustainable Cement Industrywbcsdcement.org/pdf/battelle/final_report5.pdf · They are...


∙ ∙ ∙ ∙ ∙ ∙ ∙ ∙ ∙ ∙ ∙ ∙
Toward a Sustainable Cement Industry Substudy 5: Key Performance Indicators March 2002
by Joseph Fiksel
with contributions from
David Spitzley and Tiffany Brunetti
∙ ∙ ∙ ∙ ∙ ∙ ∙ ∙ ∙ ∙ ∙ ∙
An Independent Study Commissioned by:

World Business Council for Sustainable Development This substudy is one of 13 research investigations conducted as part of a larger project entitled, "Toward a Sustainable Cement Industry". The project was commissioned by the World Business Council for Sustainable Development as one of a series of member-sponsored projects aimed at converting sustainable development concepts into action. The report represents the independent research efforts of Battelle Memorial Institute and their subcontractors to identify critical issues for the cement industry today, and pathways forward toward a more sustainable future. While there has been considerable interactive effort and exchange of ideas with many organizations within and outside the cement industry during this project, the opinions and views expressed here are those of Battelle and its subcontractors. Battelle Battelle endeavors to produce work of the highest quality, consistent with our contract commitments. However, because of the research nature of this work, the recipients of this report shall undertake the sole responsibility for the consequence of their use or misuse of, or inability to use, any information, data or recommendation contained in this report and understand that Battelle makes no warranty or guarantee, express or implied, including without limitation warranties of fitness for a particular purpose or merchantability, for the contents of this report. Battelle does not engage in research for advertising, sales promotion, or endorsement of our clients' interests including raising investment capital or recommending investments decisions, or other publicity purposes, or for any use in litigation. The recommendations and actions toward sustainable development contained herein are based on the results of research regarding the status and future opportunities for the cement industry as a whole. Battelle has consulted with a number of organizations and individuals within the cement industry to enhance the applicability of the results. Nothing in the recommendations or their potential supportive actions is intended to promote or lead to reduced competition within the industry.

( K E Y P E R F O R M A N C E I N D I C A T O R S )
i
Foreword Many companies around the globe are re-examining their business operations and relationships in a fundamental way. They are exploring the concept of Sustainable Development, seeking to integrate their pursuit of profitable growth with the assurance of environmental protection and quality of life for present and future generations. Based on this new perspective, some companies are beginning to make significant changes in their policies, commitments and business strategies. The study, of which this substudy is a part, represents an effort by ten major cement companies to explore how the cement industry as a whole can evolve over time to better meet the need for global sustainable development while enhancing shareholder value. The study findings include a variety of recommendations for the industry and its stakeholders to improve the sustainability of cement production. Undertaking this type of open, self-critical effort carries risks. The participating companies believe that an independent assessment of the cement industry’s current status and future opportunities will yield long-term benefits that justify the risks. The intent of the study is to share information that will help any cement company – regardless of its size, location, or current state of progress – to work constructively toward a sustainable future. The pursuit of a more sustainable cement industry requires that a number of technical, managerial, and operational issues be examined in depth. This substudy, one of 13 conducted as a part of the project, provides the basis for assessing the current status or performance and identifies areas for progress toward sustainability on a specific topic. The project report entitled Toward a Sustainable Cement Industry may be found on the project website: http://www.wbcsdcement.org.
Study Groundrules
This report was developed as part of a study managed by Battelle, and funded primarily by a group of ten cement companies designated for this collaboration as the Working Group Cement (WGC). By choice, the study boundaries were limited to activities primarily associated with cement production. Downstream activities, such as cement distribution, concrete production, and concrete products, were addressed only in a limited way. Battelle conducted this study as an independent research effort, drawing upon the knowledge and expertise of a large number of organizations and individuals both inside and outside the cement industry. The cement industry provided a large number of case studies to share practical experience. Battelle accepted the information in these case studies and in public information sources used.
The WGC companies provided supporting information and advice to assure that the report would be credible with industry audiences. To assure objectivity, a number of additional steps were taken to obtain external input and feedback. A series of six dialogues was held with stakeholder groups around the world (see Section 1.5). The World Business Council for Sustainable Development participated in all meetings and
monitored all communications between Battelle and the WGC. An Assurance Group, consisting of distinguished independent experts, reviewed both the quality
and objectivity of the study findings. External experts reviewed advanced drafts of technical substudy reports.
The geographic scope of the study was global, and the future time horizon considered was 20 years. Regional and local implementation of the study recommendations will need to be tailored to the differing states of socioeconomic and technological development.

( T O W A R D A S U S T A I N A B L E C E M E N T I N D U S T R Y )
ii
List of Acronyms EMAS Eco-Management and Audit Scheme GRI Global Reporting Initiative ISO International Organization for Standardization KPI Key Performance Indicator LCA Life Cycle Assessment NGO Non-Governmental Organization SD Sustainable Development WGC Working Group Cement (ten core cement company sponsors)

( K E Y P E R F O R M A N C E I N D I C A T O R S )
iii
Glossary Alternative Fuels Energy containing wastes used to substitute for conventional thermal energy sources. Alternative Raw Materials Cementitious materials used as substitutes for conventional cement raw materials.
Alternative Fuels and Raw Materials (AFR) Inputs to cement production derived from industrial, municipal, and agricultural waste streams.
Balanced Scorecard A performance measure based on the assumption that a company should measure not only financial performance, but also the fundamental drivers associated with financial performance, such as operational excellence, relationships with customers and stakeholders, and learning and growth.
By-Product Secondary product of an industrial process.
Cement Within the cement industry, and especially the technical domain, this term is often understood as Ordinary Portland Cement.
Clinker Decarbonized, sintered, and rapidly-cooled limestone. Clinker is an intermediate product in cement manufacturing.
Eco-efficiency Reduction in the resource intensity of production; i.e. the input of materials, natural resources and energy compared with the output; essentially, “doing more with less.”
Economic Value Added See Enterprise Value Added
Enterprise Value Added (EVA) A widely used financial indicator of the shareholder wealth or the “economic profit” created by a particular activity within an organization. In simple terms, EVA is the difference between After-Tax Operating Profit and Capital Charge. The After-Tax Operating Profit (ATOP) component is a function of revenues, operating costs and taxes while the Capital Charge (CC) is derived from the product of the invested capital and the weighted average cost of capital (WACC). The WACC is the weighted combination of the cost of debt and equity of the invested capital and is influenced by factors such as the financial structure of the company, business risk, current interest levels and investor expectations. A positive EVA is an indicator of wealth created, while a negative EVA means that the company or organization has destroyed wealth.
Fossil fuel A general term for combustible geological deposits of carbon in reduced (organic) form and of biological origin, including coal, oil, natural gas, and oil shale.
Greenhouse gases Gases in the earth’s lower atmosphere that may contribute to global warming, including the major component CO2.
Kiln Large industrial oven for producing clinker used in manufacture of cement.
Ordinary Portland Cement (OPC) Cement that consists of approximately 95 percent ground clinker and 5 percent gypsum.
Shareholder Value The economic market value that a shareholder would realize from liquidation of their equity.
Stakeholder A person or group that has an investment, share, or interest in something, as a business or industry.
Sustainable development Ability to continually meet the needs of the present without compromising the ability of future generations to meet their own needs.
Triple bottom line A business principle that measures corporate performance along three lines: economic prosperity, environmental stewardship, and social responsibility.
Waste A by-product material having no or minimal economic value derived from a process or activity.


( K E Y P E R F O R M A N C E I N D I C A T O R S )
v
Recommended KPIs Tonnes of cement per
megajoule of energy Fuel & raw material
substitution rates (%) Non-product output (kg of
waste) per tonne of cement
Net CO2 (kg) per tonne of cement
Incident rate (injury, illness) per 200,000 hours
1. Consider Stakeholder Needs
5. Set Targets
Review Company Goals and KPIs
4. Select Indicators & Metrics
TrackPerformance
2. Identify Important Aspects
3. Establish Company Goals & KPIs
CONTINUOUSIMPROVEMENT
Revise Indicators & Targets
Executive Summary Performance measurement is a critical capability for cement companies seeking to move toward Sustainable Development (SD). The objectives of this substudy were to review worldwide practices in the use of performance indicators for SD, to recommend a set of key performance indicators (KPIs) for the cement industry, and to provide a basis for cement companies to proceed with implementation of KPIs. For background purposes, Battelle interviewed selected “best practice” companies in various industries and performed literature research on SD performance measurement. We found that leading companies are striving to measure “triple bottom line” performance; however, apart from a few indicators such as energy intensity, there are no uniform standards for KPIs. Good SD performance indicators generally measure resource consumption and/or value creation over the full product life cycle, and are linked with overall strategic goals. The least developed areas are indicators of socio-economic benefits such as quality of life and community prosperity. Within the cement industry, many companies are becoming more conscious of environmental quality and social responsibility. A number of companies utilize environmental indicators as facility-level KPIs (e.g., dust emissions per tonne of cement), but the use of social indicators is rare. Some companies have introduced voluntary goals and indicators related to energy efficiency and use of alternative fuels and raw materials. While the cement industry is less advanced than some other industries in SD performance measurement, many cement companies have expressed interest in developing improved performance indicators. To this end, we recommend that they adopt a systematic process, as depicted below. Applying this process has yielded a set of recommended KPIs for the cement industry (see below), and a list of candidate SD indicators from which companies can select additional KPIs.
Cement companies face numerous challenges, both in selecting appropriate KPIs at the company level and in implementing the selected KPIs at the operational level. To facilitate internal deployment, we recommend that the KPIs for SD be clearly linked to enterprise value. Further, we recommend that cement companies collaborate with
external organizations to establish worldwide standards for SD performance metrics, thus simplifying results verification and stakeholder communication. Finally, we suggest the establishment of an independent entity to support industry benchmarking of SD performance.

( T O W A R D A S U S T A I N A B L E C E M E N T I N D U S T R Y )
vi
Table of Contents Foreword..................................................................................................................................... i List of Acronyms..........................................................................................................................ii Glossary..................................................................................................................................... iii Executive Summary ................................................................................................................... v 1. Introduction......................................................................................................................... 1 2. Summary of Current State of the Art................................................................................... 2 3. SD Performance Evaluation in the Cement Industry ........................................................... 3 4. Approach for KPI Selection................................................................................................. 5
4.1. Candidate Indicators ................................................................................................... 5 4.2. Selection Criteria......................................................................................................... 5
5. Goals and Key Performance Indicators .............................................................................. 6 6. Guidelines for Implementation ............................................................................................ 9
6.1. Process for KPI Selection ........................................................................................... 9 6.2. Use of KPIs for Decision Making............................................................................... 10 6.3. Implementation Challenges....................................................................................... 11
7. Conclusions...................................................................................................................... 12 7.1. Summary of Challenges............................................................................................ 12 7.2. Recommendations .................................................................................................... 12
8. References ....................................................................................................................... 14 Appendix A Best Practices in the Use of Key Performance Indicators for Sustainable
Development....................................................................................................................A-1 Appendix B Results of Literature Survey .................................................................................B-1 Appendix C Cement Industry Best Practices .......................................................................... C-1 List of Tables Table 5-1: Recommended Goals and KPIs................................................................................. 7 Table 5-2: Baseline Performance of the Cement Industry........................................................... 8 Table 6-1. Business Value Indicators Potentially Linked to Sustainable Development.............. 11 Table A-1. Stakeholder Concerns and Corresponding Indicators ............................................A-7 Table A-2. Cement Industry Aspects Related to Sustainable Development .............................A-8 Table A-3: Candidate Cement Industry Indicators and Metrics ..............................................A-10 List of Figures Figure 6-1: A Continuous Improvement Process for SD Performance Measurement................ 10 Figure A-1. The Performance Measurement Process..............................................................A-6

( K E Y P E R F O R M A N C E I N D I C A T O R S )
1
1. Introduction As the cement industry moves toward Sustainable Development (SD), it will be important for cement companies to develop a set of robust performance indicators that quantify their progress toward SD goals. Each cement company typically uses a specific number of “key” indicators to monitor its business performance, sometimes including indicators of environmental performance (e.g., airborne emissions per ton of production). The purpose of this substudy is to help fill gaps in the existing indicators, to encourage greater consistency of reporting among different cement companies, and to highlight some key indicators of SD that will be useful both for external communication and business case development. Specifically, the substudy objectives were to: Review the current use of performance indicators relevant to SD both within and outside the
cement industry, and identify the corresponding stakeholder interests Select a set of KPIs for the cement industry that can be used as a basis for tracking future
progress toward SD, and assess the current baseline performance. The scope of performance indicators evaluated in this substudy includes: Indicators that reflect the economic, environmental, and social dimensions of SD Both “leading” indicators that demonstrate business process improvement and “lagging”
indicators that demonstrate achievement of results. Indicators that address all stages in the life cycle of cement products, from raw material
acquisition through eventual demolition and disposal or recycling. The approach to this substudy included a survey of best practices in other industries with regard to the use of SD performance indicators. We interviewed a selected group of “best practice” companies about their use of KPIs1 and performed literature research to identify and summarize commonly used performance evaluation frameworks and examples of KPIs relevant to SD.2The results of these best practice investigations are summarized in Appendix A of this report, and selected literature references are provided in Appendix B. Appendix C illustrates how several cement companies are already implementing state-of-the-art performance measurement practices. To develop an understanding of performance evaluation practices in the cement industry, the Battelle team engaged in an information gathering effort. This effort included both written correspondence and face-to-face interviews with cement company personnel, including both WGC members and other cement companies in various countries. The information obtained from cement companies was supplemented by the results of a series of stakeholder dialogues held in Curitiba, Brazil; Bangkok, Thailand; Lisbon, Portugal; Cairo, Egypt; Washington, DC, and Brussels, Belgium.3
Based on the above information, we identified an initial candidate set of cement industry performance indicators, as well as a set of criteria for the selection of KPIs. Through application of these criteria, we recommended a selected set of KPIs for the cement industry, including suggested units of measurement (i.e., metrics). In those cases where commonly used metrics were available for these KPIs, we collected baseline data from the WGC companies and other sources to support quantification of current cement industry performance. Finally, we developed guidelines to assist cement companies in implementing an ongoing sustainability performance measurement process.

( T O W A R D A S U S T A I N A B L E C E M E N T I N D U S T R Y )
2
2. Summary of Current State of the Art Based on the literature review, the best practice investigation described in Appendix A, and Battelle’s recent experience in the field of SD performance evaluation, we developed the following observations: SD performance evaluation and reporting is a rapidly evolving management practice, and
leading companies are developing a variety of innovative approaches toward quantifying and communicating their contributions to sustainability.
While the triple bottom line is a widely used paradigm, it is by no means accepted universally. Despite the efforts of the Global Reporting Initiative, there is not yet a broadly accepted standard methodology for SD performance evaluation, and comparing performance results across companies would be difficult with the exception of a few indicators, such as energy intensity.
Leading companies are focusing on how their operations consume resources and generate value for stakeholders over the full product life cycle, and are identifying linkages between their product sustainability initiatives and overall strategic goals.
In contrast to the SD leaders, the vast majority of manufacturing firms tend to focus on conventional environmental, health and safety indicators associated with manufacturing operations, and do not address economic, environmental, and social value creation.
While societal performance evaluation has received a great deal of attention in recent years, it remains a challenging field. The main focus has been on internal stakeholders (e.g., employment conditions), and most social indicators used today are qualitative and indirect.
The most underdeveloped area is economic performance evaluation related to SD. While some companies track the internal financial benefits of SD, very few have addressed the economic benefits of SD to stakeholders.
Stakeholder dialogues show that clear commitment to transparent performance measures is a high priority for industry stakeholders, especially non-governmental organizations (NGOs).
Thus, SD performance evaluation practices will become increasingly important as environmental and societal responsibility continues to influence business strategy and decision-making. Already, global companies in the automotive, chemical, energy, food production, packaging, and other industries are using SD performance information to improve their decision-making efforts. For SD to become truly integrated into company business processes, a systematic SD performance evaluation process is essential. Trying to achieve this type of integration raises challenging organizational issues, including: How to establish appropriate company policies and performance-based incentives. How to modify existing business processes to account for SD considerations. How to capture and disseminate SD knowledge via training and information technology. How to achieve consistent practices across diverse business units.
Another fundamental challenge is how to identify appropriate performance indicators to support operational decision-making. While a number of indicators have recently been developed to measure eco-efficiency,4 little work has been done in a less tangible aspect of sustainability; namely, measuring the socio-economic impacts of products and processes. Most organizations that have published socio-economic sustainability indicators have focused upon macro-economic features for a community or a society as a whole (e.g., average per capita income). In contrast, management teams need more focused indicators that address the beneficial or adverse impacts associated with particular business decisions (e.g., jobs created or eliminated).
( K E Y P E R F O R M A N C E I N D I C A T O R S )
3
3. SD Performance Evaluation in the Cement Industry As part of the information gathering effort in support of both the Business Case and KPI substudies, Battelle obtained both written and verbal information from WGC companies regarding their performance evaluation practices. We also interviewed a number of other non-WGC cement producers, both large and small, and reviewed available environmental or sustainability reports from several cement companies. In general, the cement industry is not as advanced as leaders of other industries in the implementation of performance measurement practices related to SD. However, as shown in Appendix C, several cement companies have begun to implement state-of-the-art practices. The following summarizes our non-confidential findings regarding current cement industry practices. Major cement companies are becoming more conscious of environmental performance and
social responsibility, and continued global expansion has heightened their awareness of SD issues.
A number of cement companies have developed environmental reports or web sites that provide indicators of environmental improvements. Several of these reports discuss SD issues.
The environmental performance indicators most commonly used at the facility level are compliance-oriented, focusing on airborne emissions of regulated substances (including dust, SO2, NOx, CO, VOC, HCl, HF, metals and dioxin) or occupational health and safety. Few companies aggregate their EH&S performance above the plant level.
Some companies have introduced voluntary goals and indicators related to energy efficiency and use of alternative fuels and raw materials.
Within a global cement company, there are typically large variations in environmental performance evaluation practices for different countries and regions. However, some companies are considering global standardization of performance indicators.
Among the important constraints that cement companies need to consider are variations in national standards. For example, the U.S. has much stricter standards than Europe regarding disposition of solid waste from cement plants.
A number of cement companies have begun to adopt EMAS and/or ISO 14000 standards on a plant-by-plant basis, driven by stakeholder expectations and competitive pressures.
While many cement companies are attuned to social sustainability issues, they do not normally use performance indicators related to the societal dimension. A few have begun to use innovative indicators, such as the economic benefits to society of waste recovery (see Appendix C).
The KPIs used by cement companies are primarily related to financial or operational performance. KPIs relating to environmental, health or safety issues do exist, but generally have lower priority.
A number of barriers to implementing performance measurement practices in the cement industry were identified during the information-gathering effort. These include: Traditional focus on financial metrics for internal performance tracking. Frequent lack of uniform, company-wide performance measurement processes. Diversity of environmental requirements and metrics at the local or country level. Lack of familiarity and skepticism about social performance metrics. Constraints such as prescriptive standards that limit improvement opportunities.

( T O W A R D A S U S T A I N A B L E C E M E N T I N D U S T R Y )
4
However, it appears that there is a genuine need and interest in the cement industry for developing improved performance indicators that more accurately portray company goals and accomplishments related to the full range of SD issues, especially in the area of social contributions. The balance of this report provides a foundation for cement companies to proceed with establishment of meaningful SD performance measurement programs.
( K E Y P E R F O R M A N C E I N D I C A T O R S )
5
4. Approach for KPI Selection 4.1. Candidate Indicators Selection of KPIs is ultimately a company-specific decision. Nevertheless, this substudy has sought to develop a recommended set of KPIs that would have common applicability to most cement companies. This section describes the information sources and tools used to arrive at the recommended KPIs. We anticipate that individual companies will follow a similar procedure in selecting the specific KPIs that are suitable for their needs and priorities. The research performed for this substudy shows that numerous companies, organizations, and individuals have proposed SD indicators, as documented in Appendix A. Based upon this background information, we performed a series of steps to develop candidate indicators for the cement industry. These included: Consideration of stakeholder views and interests with regard to the cement industry. Examination of significant SD issues, or “aspects,” associated with cement company
operations. Customization of generally applicable SD indicators for use by the cement industry.
Finally, we compiled a list of candidate performance indicators and associated metrics that can be used by cement companies to select appropriate indicators for their performance measurement needs. This list is presented in Table A-3. These candidate indicators provided the basis for selection of recommended key performance indicators, as discussed below.
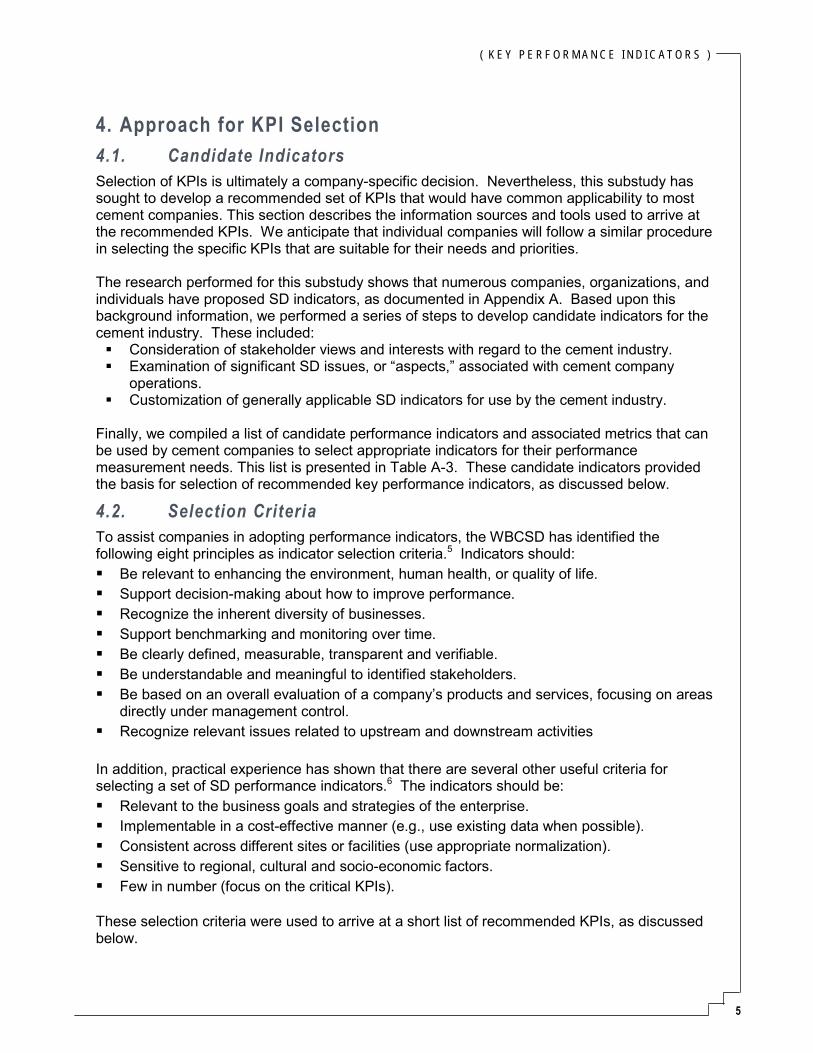
4.2. Selection Criteria To assist companies in adopting performance indicators, the WBCSD has identified the following eight principles as indicator selection criteria.5 Indicators should: Be relevant to enhancing the environment, human health, or quality of life. Support decision-making about how to improve performance. Recognize the inherent diversity of businesses. Support benchmarking and monitoring over time. Be clearly defined, measurable, transparent and verifiable. Be understandable and meaningful to identified stakeholders. Be based on an overall evaluation of a company’s products and services, focusing on areas
directly under management control. Recognize relevant issues related to upstream and downstream activities
In addition, practical experience has shown that there are several other useful criteria for selecting a set of SD performance indicators.6 The indicators should be: Relevant to the business goals and strategies of the enterprise. Implementable in a cost-effective manner (e.g., use existing data when possible). Consistent across different sites or facilities (use appropriate normalization). Sensitive to regional, cultural and socio-economic factors. Few in number (focus on the critical KPIs).
These selection criteria were used to arrive at a short list of recommended KPIs, as discussed below.

( T O W A R D A S U S T A I N A B L E C E M E N T I N D U S T R Y )
6
5. Goals and Key Performance Indicators As part of the overall study, Toward a Sustainable Cement Industry, Battelle has developed a set of sustainability goals for consideration by the cement industry that we believe are responsive to most of the stakeholder concerns identified during this study.7 Based on discussion with the ten sponsoring companies, Battelle believes that these goals are appropriate for the industry as a whole, and provide a basis for developing a strategic action plan for the future. The goals are presented in Table 1 along with corresponding key performance indicators (KPIs) whereby progress can be measured. Battelle developed the recommended KPIs, following the process described in Appendix A and utilizing the candidate list in Table A-3. We were able to identify general indicators for only five of the goals. The other goals will require further development of consensus regarding the most meaningful indicators. Several of the goals are relatively new for the cement industry – e.g., “Respect the needs of local communities” and “Support host region economies” – so that common indicators have not yet been established. We anticipate that individual cement companies will select the key performance indicators that are most appropriate for their business needs. For example, instead of tonnes of cement as a normalizing unit, some companies may prefer tonnes of cementitious material. One of the recommended KPIs that is particularly challenging to implement is “Non-product output, i.e., waste per tonne of cement.” Most cement companies measure specific waste streams that they consider important, such as airborne NOx emissions, but do not attempt to calculate the total amount of waste generated by their operations. Battelle believes that it is important for companies to move toward a system-level understanding of eco-efficiency, and that the recommended KPI encourages this type of thinking. Otherwise, reduction in one type of waste stream may simply be achieved by shifting the waste to a different medium. Non-product output is theoretically equal to the difference between total materials consumed and total cement produced, which can be deduced through a mass-balance calculation. Therefore, in addition to reducing environmental impacts, reduction in non-product output will tend to reduce the cost of material procurement. At the same time, use of this KPI at an aggregate level does not preclude companies from implementing more focused indicators that track the releases of specific substances such as NOx, heavy metals, or CO2 from individual plants. Finally, it should be noted that there is partial overlap among several of the recommended KPIs. For example, one way to reduce CO2 emissions is to reduce the use of fossil energy sources, which can in turn be accomplished through increased substitution of wastes as alternate fuels. However, each KPI represents an important goal that stands on its own, and it is satisfying for company personnel to have goals that are mutually reinforcing. If cement companies can implement initiatives that improve performance for multiple KPIs, they deserve full credit for their accomplishments.

( K E Y P E R F O R M A N C E I N D I C A T O R S )
7
Table 5-1: Recommended Goals and KPIs
Goal Indicator Conserve resources by
using less energy Tonnes of cement per MJ (quarry and plant)
Conserve resources by recycling wastes
Fuel substitution rate (%) Raw material substitution rate (%)
Reduce environmental waste streams Non-product output, i.e., waste (kg) per tonne of cement
Reduce greenhouse gas emissions Net CO2 (kg) per tonne of cement
Assure worker health and safety Incident rate (injury, work-related illness) per 200,000 hours
Reduce adverse impacts of quarrying
Potential indicators include investments in quarry restoration, overburden waste reduction, water use efficiency, biodiversity action plans, groundwater impact mitigation efforts, etc.
Respect the needs of local communities
Potential indicators include frequency of community meetings, number of hours in volunteer community service, public health initiatives, community complaints, number of advisory panels, community opinion surveys, etc.
Support host region economies
Potential indicators include job creation, local investment, technology transfer, training time, contribution to gross domestic product (GDP), external economic benefits, etc.
Create value for shareholders
Potential indicators include standard financial measures such as return on investment (ROI), return on assets (ROA), return on net assets (RONA), pre-tax earnings, etc.
For the five recommended KPIs listed in Table 5-1, Battelle worked with the WGC companies to perform a baseline assessment of the current industry status. Based on a limited sample of WGC-supplied data, together with literature-based information, we arrived at the approximate values shown in Table 5-2 for each indicator. Note that there was considerable variability in the data due to both differences in company performance and differences in boundary definition for the metrics. While these ranges hardly constitute a precise baseline, they do provide a foundation for individual companies to initiate benchmarking, stakeholder dialogue, and establishment of improvement targets.

( T O W A R D A S U S T A I N A B L E C E M E N T I N D U S T R Y )
8
Table 5-2: Baseline Performance of the Cement Industry
Indicator Approximate Value Tonnes of cement per MJ
(quarry and plant) Each tonne of ordinary portland cement consumes roughly 3000 MJ of total electrical and thermal energy
Fuel & raw material substitution rates (%)
Fuel ranges from 0 to 25% Raw material from 0 to 10%
Non-product output, i.e., waste (kg) per tonne of cement
Airborne and waterborne releases are generally known, but definitions of solid waste vary
Net CO2 (kg) per tonne of cement
Each tonne of Ordinary Portland Cement generates approximately 900 kg of net CO2 emissions*
Incident rate (injury, illness) per 200,000 hours
Ranges from 1 to 5 incidents per 200,000 hours**
Note that the above values refer to Ordinary Portland Cement, and will vary for cements with different composition * Blended or composite cements can produce significantly lower emissions of CO2 ** Incident measurement may or may not include contractors along with employees

( K E Y P E R F O R M A N C E I N D I C A T O R S )
9
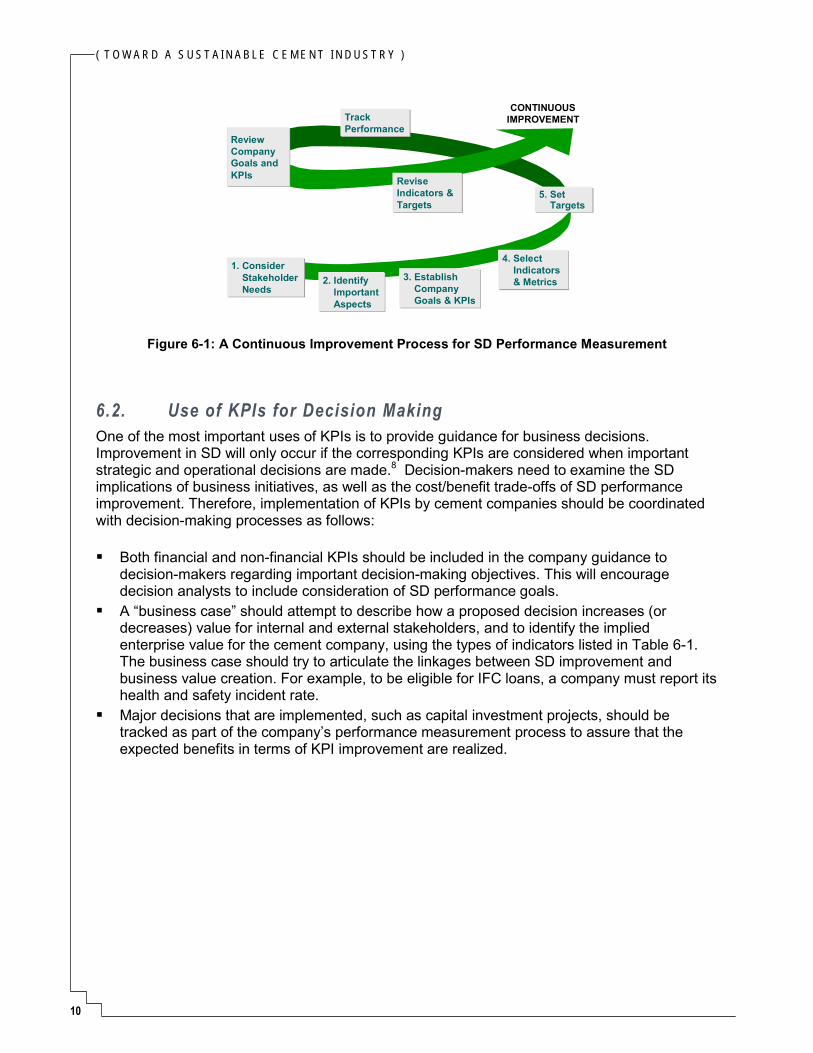
6. Guidelines for Implementation 6.1. Process for KPI Selection The goals and indicators presented in Table 1 provide an illustrative basis for cement companies to proceed with implementation of tailored SD performance measurement programs. In order to assure successful implementation, we recommend that cement companies follow a well-established process that includes the following steps, which are depicted in Figure 6-1: Step 1. Consider Stakeholder Needs. This step examines the needs and expectations of
various stakeholder groups, an essential activity for any SD improvement program. It provides a useful starting point for identifying important SD issues (often called “aspects”) and worthwhile goals. At this stage, it is useful to perform a baseline assessment of current performance for any SD-related goals that may have been established previously.
Step 2. Identify Important Aspects. This step addresses the question, “What aspects of our enterprise are most important in fulfilling our commitment to sustainability?” It involves identifying SD-related issues or aspects and selecting those that are most significant in view of stakeholder expectations, emerging issues, industry trends, and the company’s strategic goals.
Step 3. Establish Company Goals and KPIs. This step involves choosing a high-priority subset of those aspects identified in Step 2, and establishing broad goals and KPIs for performance improvement. The setting of goals is a critical part of the company and business unit strategic planning process.
Step 4. Select Performance Indicators and Metrics. This step takes the company goals and KPIs from Step 3 and determines how they will be implemented throughout the company’s operations. It includes selection of focused performance indicators and corresponding operational metrics.
Step 5. Set Targets and Track Performance. This is actually the beginning of an ongoing, continuous improvement process. Managers periodically establish specific, measurable targets that represent milestones for short and long-term SD improvements. Then they monitor performance relative to these targets, and update the targets or performance indicators as needed. Periodically, the company should re-examine its goals and KPIs in the light of changing external conditions.
Further guidance for each step in this process is provided in Appendix A, with supporting examples relevant to the cement industry.
( T O W A R D A S U S T A I N A B L E C E M E N T I N D U S T R Y )
10
Figure 6-1: A Continuous Improvement Process for SD Performance Measurement
6.2. Use of KPIs for Decision Making One of the most important uses of KPIs is to provide guidance for business decisions. Improvement in SD will only occur if the corresponding KPIs are considered when important strategic and operational decisions are made.8 Decision-makers need to examine the SD implications of business initiatives, as well as the cost/benefit trade-offs of SD performance improvement. Therefore, implementation of KPIs by cement companies should be coordinated with decision-making processes as follows: Both financial and non-financial KPIs should be included in the company guidance to
decision-makers regarding important decision-making objectives. This will encourage decision analysts to include consideration of SD performance goals.
A “business case” should attempt to describe how a proposed decision increases (or decreases) value for internal and external stakeholders, and to identify the implied enterprise value for the cement company, using the types of indicators listed in Table 6-1. The business case should try to articulate the linkages between SD improvement and business value creation. For example, to be eligible for IFC loans, a company must report its health and safety incident rate.
Major decisions that are implemented, such as capital investment projects, should be tracked as part of the company’s performance measurement process to assure that the expected benefits in terms of KPI improvement are realized.
1. Consider Stakeholder Needs
5. Set Targets
Review Company Goals and KPIs
4. Select Indicators & Metrics
TrackPerformance
2. Identify Important Aspects
3. Establish Company Goals & KPIs
CONTINUOUSIMPROVEMENT
Revise Indicators & Targets

( K E Y P E R F O R M A N C E I N D I C A T O R S )
11
Table 6-1. Business Value Indicators Potentially Linked to Sustainable Development
Efficiency Growth Asset Utilization Financial Indicators
Raw material costs Labor costs Energy costs Insurance costs Maintenance costs Regulatory penalties Liabilities
Revenue Profit Pre-tax earnings Return on investment Market share increase
Working capital Facility fixed costs Upgrade costs Equipment costs Shareholder value
added
Non-Financial Indicators
Response time Frequency of business
interruption Plant availability
Brand image Customer satisfaction Corporate reputation Ability to raise capital
Labor productivity Process availability
6.3. Implementation Challenges A number of challenges will need to be considered as the industry implements the above process: It is difficult to establish a small set of KPIs that are appropriate over a long time frame.
Depending upon how the industry evolves and stakeholder views change, different KPIs may be required to address the most important issues.
For purposes of stakeholder communication, it is important to assure that performance evaluation of publicly disclosed indicators is performed consistently in future years.
There may be insufficient information to establish a baseline for certain KPIs. Differences in operating practices and data availability among worldwide facilities will make baseline assessment challenging even for one company, let alone multiple companies.
Over time, there will inevitably be variations in performance among facilities or business units, so that specific KPIs may provide a misleading or incomplete representation of their true SD accomplishments. For example, if plant output declines due to an economic downturn, total energy use may decrease, whereas per unit energy use may actually increase.
In the long run, as SD becomes integrated into cement company operations, the distinction between SD goals and business goals should vanish. Ideally, rather than having separate KPIs that reflect SD, companies should strive to develop business KPIs that incorporate SD principles. For example, a “balanced scorecard” for a cement business might include the following elements: Financial performance – life cycle cost per tonne, including emission costs or credits Operational performance – process eco-efficiency in terms of material and energy use External relationships – customer, community and stakeholder satisfaction Learning and growth – alignment and training toward the SD vision

( T O W A R D A S U S T A I N A B L E C E M E N T I N D U S T R Y )
12
7. Conclusions 7.1. Summary of Challenges Sustainability performance measurement is a relatively new and challenging arena, and establishment of meaningful measurement programs requires significant commitment on the part of senior management. Other industry sectors such as chemicals, petroleum, electronics, and pharmaceuticals have expended considerable effort trying to develop SD performance indicators, including collaboration on the development of global standards and practices. In comparison to other industry sectors, the cement industry has been relatively slow moving, and most cement companies face considerable challenges in establishing credible programs of SD performance measurement. The first challenge that cement companies will face is how to establish a set of SD goals that are consistent with their business philosophy. While most of the WGC companies have agreed in principle with the goals in Table 5-1, we do not expect that they will all adopt the listed KPIs. It is up to each individual organization to decide which of these indicators are “key” for their circumstances. For practical reasons, some companies may use different indicators, some may have different priorities with regard to “key” indicators for their business, and some may choose not to adopt quantitative measures at all. However, to the extent that common indicators can be adopted within the industry, it will be easier for cement companies to benchmark their performance against one another and to communicate improvements to stakeholders. Assuming that cement companies are able to establish goals similar to those articulated in Table 1, they will then face the challenge of implementing these goals throughout their operations. In order to make genuine progress with respect to such goals, each company will need to establish performance indicators, targets for improvement, accountabilities, and programs of action. Appendix A suggests a process that can be followed for establishing a SD performance measurement program. However, it should be noted that implementation of such programs may require significant organizational alignment efforts to build understanding and commitment among the workforce.9 Finally, assuming that cement companies are able to implement SD performance measurement programs, they will need to decide on appropriate means for communicating their results on an ongoing basis to internal management and external stakeholders. A number of companies in other industries have invested considerable energy in developing “sustainability reports” (see discussion of Global Reporting Initiative in Appendix A). However, there are a number of alternative methods of disclosing performance results and receiving feedback from stakeholders. Each company will need to decide on an appropriate communication strategy that fulfills its business objectives.
7.2. Recommendations We recommend that each company pursue the following actions with regard to sustainability performance measurement. Develop an internal sustainability performance measurement program consistent with the
company’s stated policy and goals. The five-step approach in Appendix A provides guidance regarding how to identify key aspects and develop company-wide indicators. The program should support continuous improvement, including periodic reconsideration of what indicators should be included.

( K E Y P E R F O R M A N C E I N D I C A T O R S )
13
Work to incorporate one or more sustainability KPIs into the key company goals that typically form the basis for executive compensation.
Establish an approach to “flow down” from long-term goals to specific operational objectives for plant managers or other decision-makers. Many of the indicators in Table A-3 are suitable for application at a facility or business unit level, and can then be “rolled up” to a company level.
Consider adoption of a multi-dimensional approach (e.g., Balanced Scorecard, see Appendix A), which combines financial performance measurement with measurement of key drivers such as operational excellence, customer relationships, and organizational learning. This provides a natural framework for incorporation of sustainability goals.
Work collaboratively with other cement companies, NGOs, and interested parties to establish worldwide standards for performance indicators, in order to facilitate benchmarking and stakeholder communication. It may be advisable to charter an independent association to support industry benchmarking of SD performance.
With regard to the last point, there are several analogues, for example: In the United States, the Electric Power Research Institute has developed guidelines for
environmental performance measurement, and worked with member utility companies to help implement them.10 A number of U.S. utility companies have established an ongoing program for voluntary benchmarking of environmental, health and safety performance
In several countries, the chemical industry has established a Responsible Care® program as a focal point for environmental, health and safety benchmarking and stakeholder communication.11
At a minimum, it would be possible for cement companies to participate in an industry benchmarking exercise carried out by an external and independent body, in order to test the feasibility of the KPIs proposed in this study.12 By submitting SD performance data on a confidential basis, each company could better understand its position relative to other performers, thus motivating internal improvement and adoption of best SD practices. In addition, cement companies could strengthen their credibility with stakeholders by obtaining independent third-party verification of their SD performance results – this is an increasingly common practice among companies that produce sustainability reports.

( T O W A R D A S U S T A I N A B L E C E M E N T I N D U S T R Y )
14
8. References 1. Toward a Sustainable Cement Industry, Substudy #3: Business Case Development, Final
Report, March 2001, Appendix A. 2. Ibid, Appendix C 3. Toward a Sustainable Cement Industry, Substudies #1 and 2, Stakeholder Dialogue and
Communication, Final Report, March 2001. 4. Verfaillie, Hendrik A. and Robin Bidwell. “Measuring Eco-Efficiency: A Guide to Reporting
Company Performance,” WBCSD, June 2000. 5. Ibid 6. Fiksel, J., “Measuring Sustainability in Eco-Design,” in M. Charter & U. Tischner,
Sustainable Solutions: Developing Products and Services for the Future, Greenleaf Publishing, Fall 2000.
7. Toward a Sustainable Cement Industry, Summary Report, Battelle, March 2002. 8. Toward a Sustainable Cement Industry, Substudy #3: Business Case Development, Final
Report, March 2001. This substudy addresses the critical issue of how improvement in SD performance will contribute value to a business (e.g., generating revenue through alternative fuels).
9. Toward a Sustainable Cement Industry, Substudy #4: Company Alignment for Sustainable Development, Final Report, March 2001.
10. Electric Power Research Institute, Environmental Performance Measurement: Design, Implementation, and Review Guidance for the Utility Industry, EPRI Technical Report TR-111354, Palo Alto, CA, 1998.
11. CEFIC, “Responsible Care Status Report, Europe 2000,” Brussels, June 2001. 12. The International Cement Review offers an analogous benchmarking service for
operational performance, conducted by Whitehopleman.

( K E Y P E R F O R M A N C E I N D I C A T O R S )
A-1
Appendix A Best Practices in the Use of Key Performance Indicators for Sustainable Development SD Performance Evaluation as a Management Practice Performance evaluation has long been a standard business activity, encompassing managerial accounting, operational performance tracking, and external reporting. In this context, many companies define a small set of key performance indicators (e.g., revenue growth) that evaluate progress toward their critical business goals. More recently, environmental management system models have been developed under both the EMAS and ISO 14000 series of standards that prescribe the necessary elements for an environmental performance evaluation (EPE) system. While these standards do not attempt to mandate performance levels, they do require that senior management establish environmental performance goals and that progress toward these goals be monitored. Leading companies that have implemented EPE systems frequently include one or more environmental performance indicators (e.g., waste to product ratio) among the company KPIs, which are often linked to compensation. Evaluation of performance with respect to SD can be viewed as a natural extension of the EPE concept, with the added dimensions of economic and social performance. For purposes of this study, we use the conventional “triple bottom line” concept that distinguishes the following dimensions of performance: Environmental – resource and ecosystem preservation Economic – wealth and opportunity creation Societal – quality of life and equity assurance
Efforts to evaluate each aspect of the triple bottom line of sustainability have progressed somewhat independently, and have reached different levels of sophistication. Corporate reporting practices for these three dimensions have evolved over vastly different time frames. Corporate financial reporting has been providing information on economic performance since the beginning of the 20th century, while corporate environmental reporting has been practiced for only about a decade. Corporate social reporting was first attempted in the 1970’s, and has recently been revived. Corporate sustainability reporting, which combines elements of all three dimensions of the triple bottom line, has been attempted only in the last few years, and is still in an exploratory phase. It should be noted that these three dimensions of the triple bottom line are closely intertwined; for example, pollution prevention efforts may simultaneously result in environmental enhancement, operating cost reduction, and human health improvement. Because of this overlap, there are many cases where KPIs cannot be classified definitively into a single aspect; for example, indicators of resource productivity are linked to both environmental resource conservation and economic value creation.
Several standard-setting bodies have already proposed new standards for SD management systems that include performance evaluation processes. In keeping with these recent developments, sustainable development performance evaluation (SDPE) can be defined as:

( T O W A R D A S U S T A I N A B L E C E M E N T I N D U S T R Y )
2
Periodic review of an enterprise’s economic, environmental, and social performance to define enterprise goals and assure that these goals are being met.
Thus, SDPE is a management tool that helps an enterprise to focus on and improve its SD performance, using appropriate indicators to evaluate and communicate the enterprise’s performance relative to goals set by management. The information obtained through performance evaluation enables management to determine necessary actions to fulfill its SD policy, goals and targets, to communicate with interested parties, and to promote continuous improvement. In practice, it is important to implement SDPE in a way that reflects the intended use and audience for the performance results. Three primary uses of performance information are as follows: Internal performance monitoring to guide business process changes, profitability
enhancement and management decision-making. External reporting and communication with stakeholders in the public domain. As defined
by WBCSD, stakeholders may include employees, customers, shareholders, regulatory agencies, local communities, NGOs, and other distinct groups.
Benchmarking of performance with respect to competitors, peers, or companies in other industries.
The choice of appropriate performance indicators will usually differ depending upon which of the above uses are intended. For example, in measuring energy efficiency, cement companies may choose to focus on operational measures such as megajoules per ton for internal monitoring and benchmarking purposes, while they may choose to report to stakeholders in terms of net energy consumption per annum. In any performance evaluation system the selection of goals and targets is an important consideration. Leading companies typically establish aggressive long-term goals that “stretch” the organization (e.g., DuPont’s well-known Goal of Zero for injuries, incidents, and waste), while setting realistic intermediate targets that can be used to track incremental progress.
Performance Indicator Frameworks An SD performance indicator can be defined as any quantifiable attribute of an enterprise’s activities that characterizes the potential implications of these activities with respect to SD. It is common to distinguish between indicators (which define what is to be measured) and metrics (which define how it will be measured). Thus, an indicator might be energy consumption, and an associated metric might be BTU/ton. The following summarizes a number of conceptual frameworks that have been proposed by various organizations to facilitate selection of SD performance indicators. ISO 14031. The International Organization for Standards (ISO) has released ISO 14031, a guideline document for evaluating corporate environmental performance. It suggests a simple three-step process – Plan, Do (also called Implement), and Review. The plan step involves assessing the current situation and designing an evaluation system that will be effective for the enterprise. During implementation the plan is put into action and integrated with existing processes. Finally, the review step allows managers to collect information and improve the process. Most companies will need to customize this approach to ensure that stakeholder concerns are addressed adequately and that the system is compatible with existing company

( K E Y P E R F O R M A N C E I N D I C A T O R S )
A-3
practices. Analogous to the ISO 14031 standard, it is helpful to categorize SD indicators according to three main areas of evaluation: Management system indicators relate to internal business processes, such as pollution
prevention investments and employee training that seek to enhance SD performance results.
Operational system indicators relate to SD implications associated with the actual operation of physical plants and equipment, as well as the physical material and energy flows required for generation of products and services.
External condition indicators relate to systems outside the enterprise, both physical and socio-economic, on which the enterprise’s activities may have an impact. Although environmental conditions may not be directly linked to company activities, they often reflect important stakeholder concerns that may influence the company’s choice of performance indicators.
Global Reporting Initiative (GRI). Launched by the Coalition for Environmentally Responsible economies in 1997, the objective of the GRI is to standardize the methodology and format of corporate environmental and sustainability reporting. In June of 2000, GRI released its revised Sustainability Reporting Guidelines based on the results of pilot tests with over two-dozen industry leading companies. These revised guidelines provide background on the GRI, the principles and methodology for public reporting, and specific indicators for evaluating performance. Indicators recommended for public performance reporting by GRI are classified into 3 major headings and 22 categories as shown below, with leading indicators such as policies, organization and management systems being treated separately:
Environmental Performance o Energy o Materials o Water o Emissions, Effluents, and Waste o Transport o Suppliers o Products and Services o Land-Use/Biodiversity o Compliance
Economic Performance o Profit o Intangible Assets
o Investments o Wages and Benefits o Labor Productivity o Taxes o Community Development o Suppliers o Products and Services
Social Performance o Workplace o Human Rights o Suppliers o Products and Services
While the GRI guidelines provide excellent guidance for companies attempting to report sustainability performance publicly, they less useful for internal performance monitoring. Eco-Efficiency Framework. Originally introduced by the WBCSD, eco-efficiency has become a widespread approach to evaluating the environmental or sustainability performance of products and processes. Eco-efficiency is generally defined as the ratio of product or service value delivered to the environmental influence of product/service creation and/or consumption. (Verfaillie & Bidwell, 2000). For example, Novo Nordisk, the Danish health products company, has measured eco-efficiency as the ratio of indexed turnover in constant prices to indexed resource consumption. Similarly, General Motors, the American automotive company, has evaluated eco-efficiency in terms of number of vehicles produced per unit energy used, water used, and unit greenhouse gas emitted. This approach is useful in that it combines environmental and economic aspects into a single indicator, and the ratio tends to be positively correlated with profitability.

( T O W A R D A S U S T A I N A B L E C E M E N T I N D U S T R Y )
A-4
Eco-Compass Framework. This approach, originally developed by Dow Chemical, provides a visual method for comparing relative merits of one decision or alternative versus another (Fussler, 1997). It uses a circular array of performance indicators corresponding to different compass points, so that indicator values can be distinguished by shape or color. Using this approach, the relative strengths and weaknesses of alternative solutions with regard to SD can be viewed in a holistic manner. Although, the eco-compass approach has been applied primarily to product development decisions and product positioning, it is quite generic, and can be used to compare virtually any collection of SD indicators. Balanced Scorecard Framework. The balanced scorecard framework for performance measurement (Kaplan and Norton) is perhaps the most widely used tool for balancing financial performance indicators with other, less tangible, key success factors. This approach contends that a company should measure not only financial performance, but also the fundamental drivers associated with financial performance, such as operational excellence, relationships with customers and stakeholders, and learning and growth. Any company that has adopted the balanced scorecard approach will find it relatively straightforward to introduce SD indicators into the framework. Pressure-State-Response Model. The OECD has utilized a performance indicator framework based on the concept that human activities exert pressures on the environment, changing its state in terms of quality and stocks of natural resources, which in turn affects socio-economic well-being (Farrell and Hart). Society then responds to these changes through policies and behaviors, thus modifying the pressures caused by human activities. Although the distinction between pressures and responses is not always clear, this model can be useful for purposes of dialogue between industry and stakeholders over broad policy issues.
Lessons from Leading Practitioners Summary of Best Practices The best practices of leading companies in the area of SD performance evaluation have been documented in numerous articles and case studies. The following summarizes the useful practices that we believe to be transferable to the cement industry. Assure consistency with policy and principles. SD performance goals and indicators
should be clearly linked to company policy statements and commitments to stakeholders, providing evidence that these commitments are genuine.
Emphasize quantitative targets and metrics. Performance evaluation is viewed by both employees and external stakeholders as more meaningful, objective, and credible if the performance indicators can be expressed in quantitative terms.
Use an integrating framework. Communication of performance evaluation results is more effective and compelling if it is presented in terms of an integrating framework (such as the eco-compass or the balanced scorecard), rather than merely a list of indicators.
Identify intrinsic social value of products. Apart from the performance of their supply chain operations, companies should strive to communicate the value that their products deliver to society by satisfying basic needs such as nutrition, shelter, health, and education.
Create both aggregate and localized metrics. Even for a particular dimension of performance, such as energy use, different metrics are required for data collection at the operational level vs. aggregation at the business unit or company level.
In addition, the following four principles were presented as part of a recent survey of best practices in sustainability performance measurement (Fiksel, 2000).
( K E Y P E R F O R M A N C E I N D I C A T O R S )
A-5
1. Address the dual perspectives of resource consumption and value creation. A sustainable enterprise should strive to minimize resource consumption while maximizing value creation; in other words, “do more with less.” Here, resources are defined broadly to be natural or anthropogenic stocks that are required for the creation, use and disposition of a product or service (e.g., materials, energy, labor, and land). Value is defined as a condition, attributable to an enterprise’s activities, that benefits one or more stakeholder groups; examples of value creation include increased profitability, reduced pollution, improved nutrition, and liberation of time.
2. Include economic, environmental, and societal issues. The triple bottom line dimensions
need to be integrated and balanced in order to obtain a comprehensive understanding of sustainability from the perspective of different stakeholders. For example, a cement plant consumes economic resources (capital and operating costs), environmental resources (land, minerals and energy), and societal resources (labor). It also creates economic and social value (job creation, community development), although it may detract from environmental quality.
3. Systematically consider each stage in the product life cycle. Historically, companies
have focused their environmental performance evaluation almost exclusively on their internal manufacturing and distribution operations and have not considered the broader implications for suppliers, customers, and other stakeholders. To fully evaluate their SD performance, cement companies will need to consider how resource consumption and value creation occur throughout both the facility life cycle (construction, operation, upgrade, closure) as well as the product life cycle (quarrying, manufacturing, distribution, use, disposition, recovery).
4. Develop both leading and lagging indicators. Lagging indicators (also referred to as
outcome indicators) are measures of the results or outcomes (e.g., reduction in dust levels) that are attributable to operational improvements. While such indicators are easy to understand and are generally preferred by external stakeholders, they represent a retrospective view of performance, and do not provide managers with foresight about future performance expectations. It is important to couple lagging indicators with leading indicators (also referred to as business process indicators), which measure internal management practices that are expected to improve future performance (e.g., personnel training programs).
Process for KPI Selection Most leading companies pursue a careful, deliberate process for selection of performance indicators. Based on common practices, the following describes a process whereby cement companies can select aggregate indicators and flow them down to the business unit or facility level. The process involves the following series of five steps. The process is depicted in Figure A-1. Step 1. Consider Stakeholder Needs. This step examines the needs and expectations of
various stakeholder groups, an essential activity for any SD improvement program. It provides a useful starting point for identifying important SD aspects and worthwhile goals. At this stage, it is useful to perform a baseline assessment of current performance for any SD-related goals that may have been established previously.
Step 2. Identify Important Aspects. This step addresses the question, “What aspects of our enterprise are most important in fulfilling our commitment to sustainability?” It involves identifying SD-related aspects and selecting those that are most significant in view of

( T O W A R D A S U S T A I N A B L E C E M E N T I N D U S T R Y )
A-6
stakeholder expectations, emerging issues, industry trends, and the company’s strategic goals.
Step 3. Establish Company Goals and KPIs. This step involves choosing a high-priority subset of those aspects identified in Step 2, and establishing broad goals and KPIs for performance improvement. The setting of goals is a critical part of the company and business unit strategic planning process.
Step 4. Select Performance Indicators and Metrics. This step takes the company goals and KPIs from Step 3 and determines how they will be implemented throughout the company’s operations. It includes selection of focused performance indicators and corresponding operational metrics.
Step 5. Set Targets and Track Performance. This is actually the beginning of an ongoing, continuous improvement process. Managers periodically establish specific, measurable targets that represent milestones for short and long-term SD improvements. Then they monitor performance relative to these targets, and update the targets or performance indicators as needed. Periodically, the company should re-examine its goals and KPIs in the light of changing external conditions.
Each step is described below, with supporting examples relevant to the cement industry.
Figure A-1. The Performance Measurement Process
Step 1. Consider Stakeholder Needs An important input to selection of SD indicators comes from consideration of stakeholder perspectives. The results of the Sustainable Cement stakeholder dialogues, combined with other literature sources, suggest that various stakeholder groups will have specific concerns that can be addressed through focused communication about relevant company performance improvements. Table A-1 summarizes the typical concerns of stakeholder groups and potentially useful performance indicators.
Step 2. Identify Important Aspects According to international standards such as the ISO Environmental Performance Evaluation Guidance Document, ISO 14031, an initial step in selection of environmental performance indicators is a review of significant environmental aspects. Following this principle, Battelle conducted a SD aspect review to identify the important linkages between cement industry activities and known, perceived, or potential SD impacts. The results of this exercise are
1. Consider Stakeholder Needs
5. Set Targets
Review Company Goals and KPIs
4. Select Indicators & Metrics
TrackPerformance
2. Identify Important Aspects
3. Establish Company Goals & KPIs
CONTINUOUSIMPROVEMENT
Revise Indicators & Targets

( K E Y P E R F O R M A N C E I N D I C A T O R S )
A-7
provided in Table A-2. We organized the identification of SD aspects according to the life cycle stages of cement production – site development, quarrying, material acquisition, cement manufacturing, product storage and transport, product use, and site closure. Note that many of the aspects, such as energy consumption, are common to several life cycle stages. While the aspects listed in Table A-2 may provide a useful starting point, each company and each facility should consider what aspects are most significant for its particular situation, and should try to select a subset of these aspects that have highest strategic priority.
Table A-1. Stakeholder Concerns and Corresponding Indicators
Stakeholder Group Typical Concerns Examples of Relevant Indicators Investors, lenders, financial analysts
Rate of return Shareholder value Risk profile
Earnings per share Price/earnings ratio Volatility
Governmental officials, regulatory agencies
Compliance Model for voluntary
cooperation
Notices of violation Awards & recognition
Suppliers, value chain partners, customers
Integrity, reliability Product stewardship
Strategic partnerships Eco-labeling & other certifications
Local community residents
Corporate citizenship and community support
Commitment to economic development
Hazardous emissions
Number of community advisory panels established by cement plants
Volume of purchasing or engagement with local businesses
Percent reduction in listed emissions
Employees, labor unions
Commitment to employee rights and well-being
Health and safety practices
Percent of employees participating in self- improvement programs
Percent reduction in incident rate Religious groups, NGOs, advocacy groups, public interest groups
Human rights Environmental sensitivity Transparency of decisions
Commitment to CERES or other principles
Percent reduction in resource consumption
Engagements with NGOs Youth, women, indigenous peoples, minority groups
Commitment to equal opportunity
Access to education and training
Indigenous employment Percent of workforce holding
diplomas
Academic and research organizations
Degree of innovation Willingness to collaborate
R&D investment as percent of sales
Number of research partnerships
Step 3. Establish Company Goals and KPIs Once the company has identified a high-priority set of important SD aspects, it can proceed to establish a small number of broad goals for performance improvement. As an example, a set of five goals might be defined as follows: Use energy more efficiently Reduce waste in cement production Reduce global warming emissions Assure worker health and safety Respect the needs of local communities

( T O W A R D A S U S T A I N A B L E C E M E N T I N D U S T R Y )
A-8
These goals reflect the company’s interpretation of how it will fulfill its commitment to SD. Although they are defined in qualitative terms, they can usually be associated with quantitative indicators, which may be designated as company-wide key performance indicators (KPIs). Quantifying the goals makes them more meaningful to both employees and external stakeholders, and makes it possible to conduct a baseline assessment of the company’s current performance. Table A-3 provides a reference list of candidate performance indicators relevant to the cement industry.
Table A-2. Cement Industry Aspects Related to Sustainable Development
Cement Industry Activities
Ecological Aspects
Economic Aspects
Societal Aspects
Site Development Land use Ecosystem disruption
Livelihood disruption
Community involvement
Quarrying Energy consumption Dust Water run-off
Employment Resource
depletion
Visual aesthetics Noise & vibration
Raw Material Transport & Storage
Energy consumption Alternative raw
materials Emissions
Employment Local commerce
Traffic congestion Accident rate Accident severity
Kiln Operation Energy consumption Dust and other
emissions Solid & liquid wastes Global warming gases Water use
Employment Waste recycling Technology
transfer
Worker safety Odor Technical skill
enhancement
Cement Milling Energy consumption Dust emissions
Employment Waste recyling
Worker Safety Noise
Finished Product Storage & Transport
Energy consumption Dispatch mode Emissions
Employment Local commerce
Traffic congestion Accident rate Accident severity
Product Use Applications
Energy consumption Waste generation and
disposal or recovery
Infrastructure modernization
Technology transfer
Performance advantages
Cost of ownership
Site Closure Quarry rehabilitation Land re-development
Economic disruption
Asset recovery
Community support
General Impacts Technical assistance for environmental programs
Regional economic development
Personal income
Community health and welfare
Quality of life
Step 4. Select Performance Indicators & Metrics After the company goals and KPIs have been defined, managers at various levels in the organization must assess how their specific business activities contribute to meeting the goals. This enables selection of specific performance indicators and customized metrics that fit their operations. For example, if a company-wide goal is to reduce global warming emissions, then various operating managers must consider how they can influence the reduction of such emissions. Examples of appropriate operational indicators might include: Percent reduction in kg of CO2 released per tonne of clinker or cement (for production
facilities) Kg or tonnes of CO2 emissions avoided annually through fuel substitution (for AFR
marketing)
( K E Y P E R F O R M A N C E I N D I C A T O R S )
A-9
Net financial value of emission penalties avoided through offset trading (for finance group) Table A-3 provides a candidate list of potential operational performance indicators and associated metrics specifically developed for the cement industry. To assure fair comparisons among different operational groups, normalization of performance indicators is important. For example, tracking of emissions per tonne of cement, as opposed to absolute quantities, facilitates comparisons among facilities with different production rates. Also, it is important to maintain consistency among operational measurement schemes, in order to enable a straightforward “roll up” and reporting of the performance results. Thus, it is best to adhere to using either clinker or cement as standard units of output, although there may be good technical reasons for using one or the other. At the operational level, as mentioned in the previous section, it is important to include both leading and lagging indicators. Lagging indicators, such as emissions per tonne of cement, are measures of the results attributable to improvements in engineering or management practices. These types of indicators are directly responsive to company goals, and are meaningful to external stakeholders. However, improvements in lagging indicators are a consequence of actions taken in the past. The lag between the initiation of improvement initiatives and the realization of performance results can range from months to years. Therefore, cement industry managers should strive to also measure leading indicators that are predictive of expected improvements in the future, and to verify that the expected improvements are in fact realized. Examples of leading indicators include employee training programs, management system implementation, and stakeholder engagement efforts.
Step 5. Set Targets and Track Performance Once the KPIs and operational performance indicators have been established, performance measurement can proceed as a continuous improvement process. The process is typically driven by top management establishing broad enterprise-wide targets for performance improvement relative to the stated goals (e.g., 20% reduction in CO2 emissions by 2005). However, it is not mandatory to have aggregate targets for all company goals. Alternatively, the company may “roll up” the targets from different business units, or may simply report improvement relative to a baseline year. At the operational level, targets are typically shorter-term, e.g., annual or quarterly milestones for SD improvements. Procedures need to be established for collection of performance data, monitoring of performance relative to the targets, and aggregation of results to the business unit or company level. A single KPI at the enterprise level may translate into a variety of KPIs at the operational level, corresponding to different processes or activities within a facility. However, it is important to avoid excessive proliferation of KPIs that could overwhelm line employees. Ideally, each employee should have a single indicator, relevant to his or her job function, corresponding to each enterprise KPI. Finally, the SD performance measurement system should be periodically reviewed to determine whether the original assumptions are still valid. Stakeholder perceptions need to be re-examined, goals may need to be modified, performance indicators may need to be refined, and performance targets will inevitably need to be updated.

( T O W A R D A S U S T A I N A B L E C E M E N T I N D U S T R Y )
A-10
Table A-3: Candidate Cement Industry Indicators and Metrics Organizational Effectiveness Environmental Awards (number, list of awards) Compliance (% of facilities, average rating) Training Workshops (number/yr., % participation) Customer Satisfaction (average rating) Management Systems (% complete, % of facilities) Energy Consumption Total Energy Consumption (MJ, MJ/ton, ton/MJ))
Electricity Consumption (kWh, kWh/ton) Thermal Energy Consumption (MJ, MJ/ton)
Total Fuel Consumption (MJ, ton, MJ/ton, ton/MJ)
Alternative Fuel Consumption (MJ, ton, %) Fossil Fuel Consumption (MJ, ton)
Quarry Energy Consumption (MJ, MJ/ton gravel)Life Cycle Energy Consumption (MJ/ton cement) Heat Generated (MJ, MJ/ton) Energy Efficient Cement Formulation (% clinker) Material Consumption Total Raw Materials Use (ton, ton/ton cement) Alternative Raw Material Use (ton, %, clinker %) Recycled Materials Use (ton, ton/ton cement) Raw Material Contamination (g/ton) Quarry Extraction (ton, ton/ton cement) Impacts on Water Quarry Water Consumption (l, l/ton gravel) Non-Product Waterborne Output (kg, kg/ton) Groundwater Management Impacts (volume affected) Land Use/Biodiversity Quarry Land Use (HA, HA/ton cement, ton/HA) Land Restoration (HA) Ecosystem Biodiversity (number of species) Waste Generation Total Waste Generation (ton, ton/ton cement) Waste Recycled (ton, ton/ton cement) Waste Landfilled (ton, ton/ton cement) Waste Incinerated (ton, ton/ton cement) Total Non-Product Outputs (ton, ton/ton cement) Safety Accident Rate (incidents/200,000 working hours) Accident Severity (lost days/incident)
Atmospheric Impacts Emissions (kg, g/ton cement, ton cement/kg)
Particulates (kg, g/ton cement) Dust (kg, g/ton cement) SO2 (kg, g/ton cement) NO2 (kg, g/ton cement) CO (kg, g/ton cement) CO2 (kg, kg/ton cement)
Product Life Cycle Emissions (kg/ton cement) Air Use for Combustion (kg/ton cement) Climate Change Mitigation (%, kg) CO2 Emissions Reduction (kg, %)
CO2 Offsets (kg, g/ton cement) Suppliers and Transportation Contractor Safety (incidents/yr.) Transportation Mode (% by rail, barge, etc.) Distribution Emissions (kg, kg/ton cement) Distribution Fuel Consumption (l, l/ton cement) Packaging Material Use (kg, kg/ton cement) Economic Growth Contributions to GDP Growth ($, %) Investment in Alternative Raw Materials ($, Eu) Alternative Raw Material Purchases ($, Eu) Local or Regional Business Investments ($, Eu) Employment Job Creation (number) Absenteeism (%) Job Satisfaction (rating) Wages and Salaries ($, Eu) Expatriate Employment (%, number) Indigenous Employment (number, %) Workforce Diversity (%) Community Development Noise Level (dB(A)) Community Engagement Events (number) Community Complaints (number/yr.) Indirect Job Creation (number, $) Community Support Programs (number, $) Community Service (no. of employees, hours/yr.) Training programs (hr. per employee)
Note: Units of cement production may be tons or metric tons (tonnes) of cement or cementitious material

( K E Y P E R F O R M A N C E I N D I C A T O R S )
B-1
Appendix B Results of Literature Survey As part of the background information gathering for the Sustainable Cement Industry study, Battelle conducted a literature search to identify and summarize previous studies that characterize accepted and emerging business practices for incorporating SD into business decision-making and performance measurement. This effort was intended to support both Substudy # 3, Business Case Development, and Substudy # 5, Key Performance Indicators. Sources of information for this effort included Battelle’s in-house collection of documents, online document searches, and World Wide Web searches.
Below we briefly describe selected documents that were found to be particularly valuable for development key performance indicators. The following section contains an annotated bibliography of additional supporting documents, and a listing of all documents reviewed. Arnold, Matthew B. and Robert M. Day. “The Next Bottom Line: Making Sustainable Development Tangible,” World Resources Institute, 1998. Discusses the need for new measures of resource productivity to reward delivery of value to the customer vs. rewarding increases in throughput, investment in capital, and production. Examples are shown below.
Old Measures New Measures Volume Intensity Knowledge Intensity Volume Output Value per Volume Output Capital Investment Value per Unit Capital Invested Material Throughput Material per Customer Served Virgin Material and Energy Recovered Material and Energy Focus on Product Focus on Function
Cutter Information Corp., “Metrics Projects Show Mixed Progress,” Business and the Environment, 1999. Provides a brief review of a US National Academy of Engineering report (not released at the time) that identified the challenges associated with global reporting. Limited success was also reported by NRTEE (National Round Table on Environment and Economy). However, despite the challenges of global reporting, an effort led by the Global Futures Foundation, was launched to develop a corporate “genuine progress indicator” (GPI). The set of indicators would assess the economic, social, and ecological health of companies. The GPI is a corporate version of a tool developed by Clifford Cobb of the nonprofit “Redefining Progress” as an alternative to GNP. Farrell, Alex and Maureen Hart. “What Does Sustainability Really Mean?: The Search for Useful Indicators,” Environment, Nov. 1998. Presents two differing concepts of sustainability and discusses a variety of indicators and indicator sets that correspond to each concept. Three frameworks for sustainability indicator sets are discussed in detail: “topic of interest,” “goals of developers,” and “pressure-state-response.” Specific indicators described are those selected by the United Nations Commission on Sustainable Development and an indicator set for Fife, Scotland.

( T O W A R D A S U S T A I N A B L E C E M E N T I N D U S T R Y )
C-2
Hart, Stuart, Mark B. Milstein. “Global Sustainability and the Creative Destruction of Industries,” Sloan Management Review, Fall 1999. Suggests appropriate sustainability metrics for different types of economies:
Drivers Metrics Payoffs Consumer Economy Reducing Corporate Footprint
Pounds of materials per sale Pounds of toxics per sale Greenhouse gas emissions per sale Public acceptance level Corporate reputation
Earnings Growth Increased
EVA/SVA
Emerging Economy Avoiding Collision
Emissions per sale Water use per sale Land conserved compared to land used Percentage of assets in developing
countries Number of jobs created
Sales Growth Stock Preference
Survival Economy Meeting Basic Needs
Percentage of sales to survival economy Breadth of product availability Social investment compared to wages Small scale vs. large scale applications Community enhancing vs. community
degrading
P/E Ratio Share of New
Wealth
Lehni, Markus, “WBCSD Project on Eco-Efficiency Metrics & Reporting: State of the Play Report” Reviews current practices in sustainability measurement, including: Eco-efficiency definition and metrics
terminology Macro-economic environment metrics Company eco-efficiency metrics Product eco-efficiency metrics Sustainability metrics
Eco-efficiency metrics and corporate reporting
Eco-efficiency in financial accounting Eco-efficiency rating by investors Analysis of corporate environmental
reports Richards, Deanna J. and Thomas N. Gladwin. “Sustainability Metrics for the Business Enterprise,” Spring 1999. Discusses the evolution from “greening” to sustaining, stating the need for more clear metrics that capture and measure societal values to be integrated into decision making, along with economic and environmental metrics. The article discusses the current state of enterprise level metrics stating, “Far fewer metrics link burdens to actual impacts. Measuring impacts, industrial or otherwise, presumes that one can reliably identify causal links with specific activities”. Examples of environmental performance metrics relative to economic input or output are also included (e.g., Sony Europe calculated economic value added over the lifetime of its batteries and divided it by the sum of the non-recyclable material consumed and energy used in production). The paper discusses economic metrics, and the need to estimate uncertain future costs associated with external impacts of industrial production and consumption. Two categories of social performance indicators are also discussed – those from stakeholder response surveys and evaluation of social performance through case studies.

( K E Y P E R F O R M A N C E I N D I C A T O R S )
B-3
Verfaillie, Hendrik A. and Robin Bidwell. “Measuring Eco-Efficiency: A Guide to Reporting Company Performance,” WBCSD, June 2000. Intended to help companies report progress toward sustainable development, based on a two-year study to develop a framework for assessing and reporting eco-efficiency (across all industries). The report describes how to build an eco-efficiency profile and includes an example or “straw model”. Eco-efficiency is defined as:
Product or Service Value / Environmental Influence where product or service value indicators are measures of quantity or value of goods or services produced or provided to customers, and indicators for environmental influence in product or service creation can include measures of resource consumption and generation of waste or pollution (e.g., ODC, GWG). The final section of the report highlights the “lessons-learned” from a pilot program that included 22 WBCSD member companies (including CIMPOR).
Additional Relevant Documents
Bennett, Martin and Peter James. Sustainable Measures: Evaluation and Reporting of Environmental and Social Performance. Greenleaf Publishing, 1997.
Ditz, Daryl and Janet Ranganathan. “Measuring Up: Toward a Common Framework for Tracking Corporate Environmental Performance,” World Resources Institute, 1997. Nov. 2000.
Fiksel, J., “Measuring Sustainability in Eco-Design,” in M. Charter & U. Tischner, Sustainable Solutions: Developing Products and Services for the Future, Greenleaf Publishing, September 2000.) Global Reporting Initiative (GRI), “Sustainability Reporting Guidelines”, June, 2000.
Fussler, Claude, with Peter James, Driving Eco-Innovation: A Breakthrough Discipline for Innovation and Sustainability, Pitman, 1997.
“Green Metrics,” CERES, 1997. Nov 2000 <http://www.ceres.org/publications/index.html#green>.
Hatlestad, Luc, “Measure for Measure: Economic Value Added Theory Provides a New Way to Value Companies. Where Does High Tech Fit In?” The Red Herring Online, Nov. 2000 <http://www.herring.com/mag/issue50/meausre.html>.
June 2000 Sustainability Reporting Guidelines. Global Reporting Initiative, 2000. Nov. 2000
Kaplan, Robert S. and Norton, David P. “The Balanced Scorecard - Measures That Drive Performance,” Harvard Business Review. Jan. - Feb. 1992: 71-79.
“Measuring Environmental Performance: A Primer and Survey of Metrics in Use,” Global Environmental Management Institute, 1997. Nov 2000 <http://www.gemi.org/docs/PubTools.htm>.
SustainAbility, United Nations Environmental Programme, “The Global Reporters”, 2000. United Nations Division of Sustainable Development. “Indicators of Sustainable Development”, 1999. Note: Additional references are listed in Appendix B, Substudy #3 Interim Report.

( K E Y P E R F O R M A N C E I N D I C A T O R S )
C-1
Appendix C Cement Industry Best Practices The following examples highlight how four cement companies are pursuing best practices in SD performance measurement, similar to those described in Appendix A. These selected examples were furnished by sponsoring companies, but many other examples exist among worldwide cement producers.
CEMEX’s System of Indicators of Safety in Effective and Real Time (SISTER) SISTER (System of Indicators of Safety in Effective and Real Time) is an intranet system developed by CEMEX and unique in the cement industry. The first version was created in 1997 using the Lotus notes platform. This computer database system provides indicators and relevant health and safety facts online from every CEMEX business unit including cement plants, ready mix, and other operations. The information is available to more than 900 people including Board of Directors, Plant Managers, EHS Country Coordinators and Safety Coordinators at plant level. SISTER also provides benchmarks and education for accident prevention and allows for the sharing of experiences & preventive actions throughout all of CEMEX’s operations. In the event of an accident or near-accident in any operational unit, SISTER provides detailed reports of the accident to employees company-wide. This enables them to become aware of potential risks and to learn from accidents that happen in other locations, so they can implement appropriate preventative measures. A new capability of the SISTER system is the tracking of Corrective Actions generated from the accident investigation reports. This allows CEMEX to monitor progress and assure compliance with corrective action requirements. In addition, these records are used as a reference for accident prevention. CEMEX has found that the synergy among plants when sharing their best practices in accident prevention has been a powerful tool to improve safety performance.
Holcim – Standardizing Management Information for Business Success Holcim has invested considerable cost and effort during the past three years in defining a common, Group-wide management language, i.e., standardized costing structures and a common set of performance indicators, which are used for managing the business (“lead”) as well as for knowledge management and transfer (“learn”). The vision of this project is “To provide a true, fair and comparable picture of performance throughout the Group to enable better business decision making on Group company and Group level to sustainably improve Holcim results”. The standardized management information includes both accounting and technical information. During 1999, Holcim employees from several Group companies elaborated in a series of workshops the definitions for the management accounting systems (how to reflect processes within the systems as e.g. cost centers, types of cost, valuation principles etc.) and agreed on a common set of KPIs, mainly for the manufacturing processes. This resulted in a definition of: The business segment model, which forms the basis for the accounting and technical
definitions within the manual; Detailed rules and definitions for management accounting, The technical indicators necessary for a solid, credible and comparable base of
performance measurements that is needed for an organization to understand where the opportunities lie for improvement

( T O W A R D A S U S T A I N A B L E C E M E N T I N D U S T R Y )
C-2
A set of standardized management reports. While the performance indicators are geared to accounting and technical aspects, they include measures covering, for example, health and safety, use of alternative fuels and materials, and energy efficiency, which help Holcim to monitor and manage the Sustainable Development dimensions of its business. During 2000, most of Holcim Group companies implemented these definitions in their transaction and reporting systems. The remaining Group companies are implementing the definitions in 2001. Since January 2001, Group companies manage their business based on these new definitions. Standardization of measurement and reporting enables Holcim strategic objectives to be rolled down to Group Company and site level for consistent measurement and reporting. These reports can then be rolled back up to Group level for consolidated reporting and assessment. Thus, the results of this project enable Holcim to start new initiatives within the field of knowledge management (benchmarking, etc.). Information has become comparable throughout the Group as the Group now has a common language for knowledge sharing.
Lafarge – Establishment of Sustainability Performance Indicators and Targets In November 2001, Lafarge released a sustainability report, which included commitments to a number of sustainable development performance indicators and targets, listed below. The company’s performance will be monitored on an annual basis, and Lafarge will publicly report on its progress with the assistance of the World Wildlife Federation. The report is available at the following web site:http://www.lafarge.fr/domino/html/lafarge/barre.nsf/html/home2us?opendocument
Indicators Content Targets Environmental audits
Percentage of sites audited in the last 4 years.
100% of sites audited in 2004.
CO2 emissions
Direct CO2 emissions per tonne of cement excluding electricity.
20% reduction below 1990 levels by 2010 in CO2 emissions per tonne produced worldwide.
Energy consumption
Quantity produced for 1 tonne of oil equivalent (fuel + electricity).
Ensure that energy consumption, wherever significant, is measured in all Divisions by 2003.
Waste recovery (external sources of raw materials)
Percentage of substitute raw materials used in production.
Incorporate 10% of substitute materials in cement and 45% in gypsum by 2005.
Production of waste (internal recycling of production waste)
Quantity of waste disposed to landfill in each Division per unit produced.
Bring production of waste disposed to landfill from 1.4% to 1% in cement and from 2.2% to 1.5% in gypsum by 2005.
Rehabilitation of quarries
Percentage of quarries with a rehabilitation plan meeting Lafarge standards.
80% of quarries implementing a rehabilitation plan by 2004. Implementation of a reporting system by 2002.
Water consumption
Quantity of water consumed per unit produced.
Improve data collection on water usage by 2002.
Energy recycling
Rate (%) of alternative fuels used in the production of cement.
Set a target, by 2002, for recycling energy and using renewable energy.

( K E Y P E R F O R M A N C E I N D I C A T O R S )
C-3
Taiheiyo – Use of Environmental Accounting for EEBE (External Economic Benefits Evaluation) Since 1999, Taiheiyo has been studying the appropriate way of disclosing the costs and effects of the company's environmental conservation activities to the public. The effort includes participation in the “Environmental Accounting Study Group for Administrators” conducted by Japan’s Environment Agency. To calculate the external economic benefits in terms of reduction of social costs, Taiheiyo developed and applied its own methodology for External Economic Benefits Evaluation (EEBE) consistent with the Environment Agency Guidelines (2000 edition) announced in May 2000. In 1999, Taiheiyo's ten cement plants used 6.2 million tons of waste and by-products from other industries as alternative raw materials and fuels to produce about 24.3 million tons of cement. According to Taiheiyo’s calculations, this is equivalent to about 41.5 billion yen when converted to economic value, under the assumption that these practices reduce the burden placed on society in managing the environment and natural resources. Further details of Taiheiyo’s calculations can be found in the company’s Environment 2000 report at http://www.taiheiyo-cement.co.jp/english/index.ht