Toward a Democratic Civil Peace? Democracy, Political...
16
Toward a Democratic Civil Peace? Democracy, Political Change, and Civil War, 1816 –1992 HÅVARD HEGRE International Peace Research Institute, Oslo, and University of Oslo TANJA ELLINGSEN University of Oslo SCOTT GATES International Peace Research Institute, Oslo, and Michigan State University NILS PETTER GLEDITSCH International Peace Research Institute, Oslo, and Norwegian University of Science and Technology C oherent democracies and harshly authoritarian states have few civil wars, and intermediate regimes are the most conflict-prone. Domestic violence also seems to be associated with political change, whether toward greater democracy or greater autocracy. Is the greater violence of intermediate regimes equivalent to the finding that states in political transition experience more violence? If both level of democracy and political change are relevant, to what extent is civil violence related to each? Based on an analysis of the period 1816 –1992, we conclude that intermediate regimes are most prone to civil war, even when they have had time to stabilize from a regime change. In the long run, since intermediate regimes are less stable than autocracies, which in turn are less stable than democracies, durable democracy is the most probable end-point of the democratization process. The democratic civil peace is not only more just than the autocratic peace but also more stable. T he “third wave of democratization” (Huntington 1991; Vanhanen 2000) has raised hopes for a more peaceful world. The thesis of the demo- cratic peace suggests that the spread of democracy will promote a decline in interstate warfare (Doyle 1986; Russett 1993), at least once the unsettling effects of the transition period are overcome (Ward and Gleditsch 1998). But does democratization also lead to civil peace? Considerable research has examined how regime type or the level of democracy relates to domestic conflict. Much of it focuses on the result that semide- mocracies (regimes intermediate between a democracy and an autocracy) exhibit a higher propensity for civil conflict than either extreme. Another strand of re- search focuses on how changes in regime lead to domestic conflict. This has implications for the former finding, since semidemocracies are more prone to regime change. Indeed, is the greater propensity for violence of intermediate regimes equivalent to the finding that states in political transition experience more violence? Are the results relating civil violence to level and change, in fact, one and the same finding? Or, are both explanations relevant? That is the key issue examined in this article. We link level of democracy and regime change in an empirical analysis that uses data from 152 countries in the period 1816 –1992. We also explore the implica- tions of the direction and magnitude of political change. The statistical model we formulate overcomes some of the problems in research that is based on country-years, such as the fact that these do not constitute independent observations, as well as the possibility that the amount of civil war in the system of states fluctuates over time. Finally, our work adopts a multivariate framework with several control variables, among them socioeconomic and cultural factors, as well as spatial and temporal contagion. A separate analysis, with a more extensive set of control variables, is performed for the post–World War II period. DEMOCRACY, DEMOCRATIZATION, AND CIVIL WAR Level of Democracy and Civil War Harshly authoritarian states and institutionally consis- tent democracies experience fewer civil wars than intermediate regimes (de Nardo 1985; Francisco 1995; Muller and Weede 1990), which possess inherent con- tradictions as a result of being neither democratic nor autocratic. Semidemocracies are partly open yet some- what repressive, a combination that invites protest, rebellion, and other forms of civil violence. Repression leads to grievances that induce groups to take action, and openness allows for them to organize and engage in activities against the regime. Such institutional con- tradictions imply a level of political incoherence, which is linked to civil conflict. A number of works support the hypothesis of an inverted U-shaped curve between democracy and do- mestic violence, but most are based on a small number Håvard Hegre is a Researcher, and Scott Gates and Nils Petter Gleditsch are Research Professors at the International Peace Re- search Institute, Oslo (PRIO), Fuglehauggata 11, Oslo, Norway. Tanja Ellingsen is Research Fellow at the Department of Political Science, University of Oslo, Norway. Hegre is also affiliated with the University of Oslo, Gates with Michigan State University, and Gleditsch with the Norwegian University of Science of Technology. The authors may be contacted at [email protected]. The data and command files used in this study can be downloaded from http://www.prio.no/cwp/datasets.asp. An earlier version of this article was presented at the International Studies Association annual meeting in 1997. We thank the National Science Foundation (grant no. SBR 9810092), the Research Council of Norway, and the Development Economics Research Group at the World Bank for their support. We also thank Ada Finifter, the anonymous reviewers at the APSR, and the numerous people who made helpful comments on earlier drafts. American Political Science Review Vol. 95, No. 1 March 2001 33
Transcript of Toward a Democratic Civil Peace? Democracy, Political...

Toward a Democratic Civil Peace? Democracy, Political Change,and Civil War, 1816–1992HÅVARD HEGRE International Peace Research Institute, Oslo, and University of OsloTANJA ELLINGSEN University of OsloSCOTT GATES International Peace Research Institute, Oslo, and Michigan State UniversityNILS PETTER GLEDITSCH International Peace Research Institute, Oslo, and NorwegianUniversity of Science and Technology
Coherent democracies and harshly authoritarian states have few civil wars, and intermediate regimesare the most conflict-prone. Domestic violence also seems to be associated with political change,whether toward greater democracy or greater autocracy. Is the greater violence of intermediate
regimes equivalent to the finding that states in political transition experience more violence? If both level ofdemocracy and political change are relevant, to what extent is civil violence related to each? Based on ananalysis of the period 1816–1992, we conclude that intermediate regimes are most prone to civil war, evenwhen they have had time to stabilize from a regime change. In the long run, since intermediate regimes areless stable than autocracies, which in turn are less stable than democracies, durable democracy is the mostprobable end-point of the democratization process. The democratic civil peace is not only more just than theautocratic peace but also more stable.
The “third wave of democratization” (Huntington1991; Vanhanen 2000) has raised hopes for amore peaceful world. The thesis of the demo-
cratic peace suggests that the spread of democracy willpromote a decline in interstate warfare (Doyle 1986;Russett 1993), at least once the unsettling effects of thetransition period are overcome (Ward and Gleditsch1998). But does democratization also lead to civilpeace?
Considerable research has examined how regimetype or the level of democracy relates to domesticconflict. Much of it focuses on the result that semide-mocracies (regimes intermediate between a democracyand an autocracy) exhibit a higher propensity for civilconflict than either extreme. Another strand of re-search focuses on how changes in regime lead todomestic conflict. This has implications for the formerfinding, since semidemocracies are more prone toregime change. Indeed, is the greater propensity forviolence of intermediate regimes equivalent to thefinding that states in political transition experiencemore violence? Are the results relating civil violence tolevel and change, in fact, one and the same finding? Or,
are both explanations relevant? That is the key issueexamined in this article.
We link level of democracy and regime change in anempirical analysis that uses data from 152 countries inthe period 1816–1992. We also explore the implica-tions of the direction and magnitude of politicalchange. The statistical model we formulate overcomessome of the problems in research that is based oncountry-years, such as the fact that these do notconstitute independent observations, as well as thepossibility that the amount of civil war in the system ofstates fluctuates over time. Finally, our work adopts amultivariate framework with several control variables,among them socioeconomic and cultural factors, aswell as spatial and temporal contagion. A separateanalysis, with a more extensive set of control variables,is performed for the post–World War II period.
DEMOCRACY, DEMOCRATIZATION, ANDCIVIL WAR
Level of Democracy and Civil War
Harshly authoritarian states and institutionally consis-tent democracies experience fewer civil wars thanintermediate regimes (de Nardo 1985; Francisco 1995;Muller and Weede 1990), which possess inherent con-tradictions as a result of being neither democratic norautocratic. Semidemocracies are partly open yet some-what repressive, a combination that invites protest,rebellion, and other forms of civil violence. Repressionleads to grievances that induce groups to take action,and openness allows for them to organize and engagein activities against the regime. Such institutional con-tradictions imply a level of political incoherence, whichis linked to civil conflict.
A number of works support the hypothesis of aninverted U-shaped curve between democracy and do-mestic violence, but most are based on a small number
Håvard Hegre is a Researcher, and Scott Gates and Nils PetterGleditsch are Research Professors at the International Peace Re-search Institute, Oslo (PRIO), Fuglehauggata 11, Oslo, Norway.Tanja Ellingsen is Research Fellow at the Department of PoliticalScience, University of Oslo, Norway. Hegre is also affiliated with theUniversity of Oslo, Gates with Michigan State University, andGleditsch with the Norwegian University of Science of Technology.The authors may be contacted at [email protected].
The data and command files used in this study can be downloadedfrom http://www.prio.no/cwp/datasets.asp. An earlier version of thisarticle was presented at the International Studies Association annualmeeting in 1997. We thank the National Science Foundation (grantno. SBR 9810092), the Research Council of Norway, and theDevelopment Economics Research Group at the World Bank fortheir support. We also thank Ada Finifter, the anonymous reviewersat the APSR, and the numerous people who made helpful commentson earlier drafts.
American Political Science Review Vol. 95, No. 1 March 2001
33

of cases or a short period. For instance, Francisco(1995) examines only the former German DemocraticRepublic, Czechoslovakia, and the Palestinian Intifada.The study by Muller and Weede (1990) used datacollected by Taylor and Jodice (1983) for 1973–77.1
Ellingsen and Gleditsch (1997) confirmed the in-verted U-shaped curve for a longer period, 1973–92.Using two different measures of democracy, they foundthat open regimes experienced civil war very rarely or,in the case of First World democracies, not at all.Moreover, by far the highest frequency of conflictoccurred in semidemocracies, yielding a clearly in-verted U-shaped curve across all levels of economicdevelopment.
Political Change and Civil War
The road to democracy is complicated and can bemarked by internal violence and even collapse of thestate (Bratton and van de Walle 1996; Casper andTaylor 1996). Autocratic countries do not becomemature consolidated democracies overnight. They usu-ally go through a rocky transition, in which masspolitics mixes with authoritarian elite politics in avolatile way. Political change deconsolidates politicalinstitutions and heightens the risk of civil war, asdiscussed by a number of scholars (e.g., Sahin and Linz1995; Tarrow 1994).
In a classic argument, de Tocqueville ([1856] 1955,182) points out that “revolutions do not always comewhen things are going from bad to worse. . . . Usuallythe most dangerous time for a bad government is whenit attempts to reform itself.” Huntington (1991) findsthat political violence is frequently coupled with de-mocratization. Such changes are unlikely to occurwithout serious conflict, especially in countries withdifferent ethnic minorities (Horowitz 1993). Commu-nal groups in liberalizing autocracies have substantialopportunities for mobilization, but such states usuallylack the institutional resources to reach the kinds ofaccommodation typical of established democracy(Gurr 1993, 165). When authoritarianism collapses andis followed by ineffectual efforts to establish democ-racy, the interim period of relative anarchy is ripe forethnonational or ideological leaders who want to orga-nize rebellion.
Theoretically, consolidation can occur anywhere onthe autocracy-democracy spectrum. Those at eitherextreme can be consolidated or unconsolidated. Con-solidated autocracies exhibit self-enforcing rules andinstitutions that prevent protest and other activitiesaimed against the state. Semidemocracies also maybecome consolidated. If the central idea of an invertedU-curve describes the relationship between regimetype and civil war, however, the inconsistent andcontradictory nature of these regimes should preventthem from becoming consolidated.
Political institutions also can be deconsolidated.
Political change, whether in the form of democratiza-tion or autocratization, can create instability. The lossof legitimacy by the regime induces dissatisfied groupsto struggle against it. If the direction of change istoward autocracy, the deconsolidation of political in-stitutions also implies increasing repression (Zanger2000, 225–6). Repression by a regime without well-developed political institutions is likely to promote civilviolence (Lichbach 1987, 1995; Moore 1998).
The initial high level of uncertainty and unrestcaused by a regime change will gradually diminish asprotesters abandon their aspirations or find ways toobtain part of what they want within the new regime. Inthe case of democratization, new and more openinstitutions take root and promote a peaceful resolu-tion of domestic conflict. As time passes, these becomemore entrenched, and the likelihood of regime failuredecreases. The pattern works similarly for autocratiza-tion. As repressive institutions strengthen, the effect ofthe regime change is less destabilizing and thereforeless likely to generate political violence.
One Explanation or Two?
Compared to well-established democracies or autocra-cies, intermediate regimes have a higher hazard of civilwar, as do regimes just emerging from a politicaltransition. Are these two findings one and the same?Semidemocracies may be more prone to civil warbecause, on average, they have more recently under-gone a political change. Gurr (1974, 1500) finds thatthe average persistence of the highly coherent poli-ties—democracies and autocracies—exceeds that of“anocracies,” or polities with mixed authority patterns.Below, we corroborate this finding with newer data.The implication is that we cannot readily determinewhether a high risk of civil war is due to level ofdemocracy or regime change. The two factors unques-tionably overlap. Does the inherent inconsistency ofsemidemocracies account entirely for their greaterfrequency of civil war? Or does the youth of semide-mocracies fully explain why they are more prone toconflict? Or do both factors affect the risk of civil war?
We cannot satisfactorily answer these questionswithout including both political change and level ofdemocracy in our analyses. If both factors are relevant,we would expect to see evidence of an inverted U-curveeven when controlling for the time since regimechange. By controlling for each variable, we can assesswhether one, the other, or both are significant.
HYPOTHESES
In an attempt to distinguish between intermediateposition or change as the cause of civil conflict, we positthe following hypotheses.
HYPOTHESIS 1. Semidemocracies are more likely to ex-perience civil war than either democracies or autocra-cies.
1 Krain and Myers (1997) find that democracies are less prone to civilwar than autocracies, but they do not account for semidemocraciesand only provide a bivariate analysis.
Democracy, Political Change, and Civil War, 1816–1992 March 2001
34

HYPOTHESIS 2. Institutionally consistent democraciesand stark autocracies are equally unlikely to experiencecivil war.
HYPOTHESIS 3. Countries that have undergone a recentpolitical transition are more likely to experience civilwar than countries whose political system has remainedstable.
HYPOTHESIS 4. The two relationships described in hy-potheses 1 and 3 are both valid and reinforce eachother. Thus, the likelihood of civil war in semidemoc-racies remains higher than in other regime types, even along time after a regime change.
Hypothesis 1 reflects the inverted U-curve regardingthe relationship between level of democracy and do-mestic violence, and hypothesis 3 states that regimechange leads to a heightened risk of civil war in theshort run. Both have found support in previous work.Hypothesis 2 states that the inverted U-curve is sym-metric, as demonstrated by Muller and Weede (1990)and in contrast to Krain and Myers (1997). Hypothesis4 accounts for the possibility that hypotheses 1 and 3are complementary. A rejection of hypothesis 4 wouldmean that either hypothesis 1 or 3 is a sufficientexplanation of the probability of civil war.
RESEARCH DESIGN
The Cox Regression Model
Comparable studies in this field have made use of datasets with country-years as the unit of observation (e.g.,Auvinen 1997; Ellingsen 2000; Zanger 2000), but ifregime change causes civil war, we expect conflict tofollow shortly after regime change. The relevant timeframe ranges from a few days to a few years. To modelcivil war as a consequence of regime change, we haveto relate conflict to regime information up to the lastday before the civil war breaks out. A country-yearapproach is unsuitable for modeling swift changes,because it makes sequential events in the same yearappear to be simultaneous. Also, the Correlates of War(COW) data on civil war are coded by date, and thePolity IIId data set exactly dates regime changes to theextent possible. Such precision allows us to control forwhether a conflict represents diffusion of internationalwar or of civil war in a neighboring country.
As argued in a study of interstate war (Raknerud andHegre 1997), the country-year structure has disadvan-tages of a more statistical nature.2 Country-years donot constitute independent observations. If a civil warcontinues for some time, war data for the subsequentcountry-years will be highly dependent on the first year.Removing (censoring) country-years with continuingcivil war may ameliorate this problem. Correspond-ingly, however, consecutive years of peace in a countryare just as dependent on the first year of peace. If wecensor continuing war, we also should censor continu-
ing peace, but then nothing would remain of thecountry-year structure. If we do not censor at all, wehave a poor basis for estimating the statistical signifi-cance of the parameter estimates.
Analytical techniques for country-year data alsoassume a constant baseline probability of civil war,regardless of other variables. One could imagine thatthe amount of civil war in the interstate system fluctu-ates over time, following global political, ideological,and economic variations. If this fluctuation is corre-lated with trends in the independent variables, there isa potential problem, and to solve it Raknerud andHegre (1997) formulated an application of the Coxregression model.3 We modify their model to apply itto civil war. The main idea of Cox regression is theassumption that the hazard of civil war lc(t) for countryc can be factored into a parametric function of (time-dependent) risk factors and a nonparametric functionof time itself, the baseline hazard:
lc~t! 5 a~t! exp F Ok51
p
bkXkc~t!G (1)
a(t), the baseline hazard, is an arbitrary functionreflecting unobserved variables at the system level. Thebaseline hazard will account for any time trend in thedata. Xk
c(t) is a (possibly time-dependent) explanatoryvariable for country c; bk is the corresponding regres-sion coefficient; and p is the number of explanatoryvariables. All legitimate variables are known before t;they must be a part of the history up until immediatelybefore point t. Note that t is calendar time, the numberof days since a specific date. This differs from thecommon use of survival models, in which t is time atrisk, which in this context would be the number of dayssince the last civil war or since the country entered thestudy.
To execute an analysis with this model, we need adata file constructed in the following way. For each tw,that is, each day a civil war breaks out somewhere, wetake a “snapshot” of the international system. Weinclude the values of the explanatory variables on thatparticular day, tw, for all countries that are systemmembers and not already at war. When we do not havedata on a daily basis, such as for the ethnic heteroge-neity and development variables, we enter the value forthe year in which the event occurred.4 The Cox regres-sion model compares the country that erupted in war attw to all countries at risk of doing so. Thus, allinformation for the time between different war out-breaks is ignored (except when estimating the baselinehazard).
Using the Cox regression model, civil war may bemodeled as a function of events as recent as the daybefore the outbreak, unlike the country-year frame-work. Since all that happens between the outbreaks of
2 Raknerud and Hegre (1997) were concerned with the dyad-yearstructure, but most of their arguments apply equally to country-years.
3 A good description of the Cox (1972) model can be found inMcCullagh and Nelder 1989 and Collett 1994.4 Ideally, these variables also should have been coded on a day-to-day basis. This is not a substantial problem, however, since theirvalues usually do not change dramatically over a short time.
American Political Science Review Vol. 95, No. 1
35

war is ignored, dependence between units caused byconsecutive years of peace is not a problem. Finally,possible confounding time trends in the probability ofcivil war are handled by the nonparametric baselinehazard function.
The parameter bk can be interpreted as a relativeprobability of civil war. Assume that countries i and jhave the same values on all explanatory variablesexcept for Xk(t). Then, from equation 1, the ratiobetween the hazard of civil war of country i and countryj becomes
li~t!Dtlj~t!Dt
5 exp FbkSXki ~t! 2 Xk
j ~t!DG . (2)
Hence, we have
lnli~t!Dtlj~t!Dt
5 bkFXki ~t! 2 Xk
j ~t!G , (3)
where l(t)Dt is approximately the probability of atransition (from peace to war) in the “small” timeinterval (t, t 1 Dt). In the ratios above, the time intervalDt cancels out, and the parameter bk is the log of therelative probability (or the relative risk) between twocountries that differ by one unit on the variable Xk(t)and are otherwise identical.
Time Frame
Our core analysis with all the variables makes use ofdata for 1946 to 1992. A more limited analysis withfewer variables is carried out for the entire COWperiod, 1816–1992.
The Dependent Variable
The dependent variable is the outbreak of civil war asrecorded in the COW project (Singer and Small 1994).Civil war is defined as an internal war in which: “(a)military action was involved, (b) the national govern-ment at the time was actively involved, (c) effectiveresistance (as measured by the ratio of fatalities of theweaker to the stronger forces) occurred on both sides,and (d) at least 1,000 battle deaths resulted” (Singerand Small 1994, part 3). The COW project does notdistinguish between different conflicts within the samecountry; if a civil war breaks out while another contin-ues in a different region of the country, this is notreflected in the data set.
The criteria for coding the start of a COW civil warare potentially problematic. Coders have dated thestart to the year in which the threshold of 1,000 deathswas reached, which means that previous months oreven years of some wars would not count.5 Most warsescalate quickly from the first shots to the peak level ofseverity, but we cannot exclude the possibility thatsome commence before the regime change that wecode as the most recent. The definition of the start day
is important, because a period of low-level domesticturmoil beforehand may undermine the political sys-tem, but this is unlikely to affect a large number of civilwars.
Regime Type and Regime Change
For regime type, we use the Polity IIId data set(McLaughlin et al. 1998), which covers our spatial andtemporal domain. The democracy-autocracy indexused by Jaggers and Gurr (1995) and others is ourmeasure of Democracy: 210 5 most autocratic, 10 5most democratic. We add Democracy Squared, thesquare of this variable, to allow modeling of theU-curve relationship between level of democracy andconflict.6
To model the relationship between the time sinceregime change and the risk of civil war, we definedProximity of Regime Change as x 5 exp(2days sinceregime change/a), where a is some chosen divisor. Thisexponential function has the value 1 when the regimechange is proximate and is close to zero when thechange occurred a long time ago. It reflects the as-sumption that the effect of regime change on theprobability of civil war decreases at a constant rate.
A weakness of the Polity data set is that an on-goingcivil war or other political violence in the country maybe reflected in the coding of regime characteristics,notably in the indicators that characterize regulationand competitiveness of participation. A country withextensive political violence is unlikely to be coded as afull democracy or a full autocracy. Because there maybe an overrepresentation of political violence in theregimes coded intermediate, our results may be con-founded somewhat, since a civil war as defined in theCOW project (1,000 deaths) may have begun earlierwith a lower level of violence. We return to thisquestion in the analysis section.
The Polity III data set (Gurr, Jaggers, and Moore1989; Jaggers and Gurr 1995) codes regime changeonly annually. This makes it difficult to pinpoint achange relative to the outbreak of civil war. In PolityIIId the regime change is recorded to the exact daywhenever possible, so if one occurred in the same yearas the outbreak of a civil war, the newer data setenables us to code the regime score for the day beforethe outbreak. With these data we could also count thenumber of days since the last regime change (if any hadoccurred) for all countries for each time-point withoutbreak of civil war (tw). A regime change is definedas an alteration in an existing state greater than orequal to 2 in the democracy-autocracy index, or as thecreation of a new state.7 Because the range is 20 points,
5 We have not found precise coding criteria for war starting dates.Our source here is a personal communication from Melvin Small,June 16, 1998.
6 A square term is the simplest model of a curvilinear pattern. Wealso fitted models with democracy as a 7-category and 21-categoryvariable, as well as a model with a cubic term. All these suggestedvery similar relationships between the level of democracy and the riskof civil war. According to likelihood ratio tests, however, noneperformed better than the model reported in Table 2.7 If the country just entered or left a period of transition (coded inPolity IIId as 266, 277, or 288), the event is not coded as a regimechange, regardless of what kind of regime the country had before thetransition.
Democracy, Political Change, and Civil War, 1816–1992 March 2001
36

this definition is very inclusive, and it captures allpolitical changes that might be related to civil war.
Control Variables
Our model does not attempt to present an inclusivetheory of civil war, but level of democracy and politicalchange do not provide a complete explanation. There-fore, we identify a number of control variables—Development, Ethnic Heterogeneity, Proximity of Inde-pendence, and International War in Country—whoseomission might bias the results for the regime changevariable. The remaining control variables—Proximity ofCivil War and Neighboring Civil War—are included tomodel how the hazard of civil war depends on earlierevents in the country and the neighborhood. Withthese controls, we may assume that the units of obser-vations are conditionally independent (cf. Raknerudand Hegre 1997, 386–8).
Civil war occurs more frequently in poor, underde-veloped countries (Hauge and Ellingsen 1998). Refer-ring to modernization theory, Hibbs (1973, 21–3) re-lates the decline in internal violence to the reducedclass conflict in all affluent societies, which rendersnegotiated outcomes and conciliation more acceptableto all groups. Yet, since class conflicts increase in theearly stage of industrialization in traditionally agrariansocieties, the relationship between level of develop-ment and political violence may be curvilinear. For thepoorest countries, development may actually stimulateviolence. Hibbs does find evidence for a moderatecurvilinear pattern, as do Collier and Hoeffler (1998).
To control for the level of development, we useEnergy Consumption per Capita (measured as coal-tonequivalents). The variable is log-transformed, since weexpect the effect of a unit increase to be larger for acountry with a low level on the variable than for acountry with a high level. Log-transforming also re-duces the skewness of the variable. In addition, weenter the squared term of this variable to capture thecurvilinear pattern found by Hibbs (1973). We expectnegative estimates in both cases, which would indicatethat the risk of civil war grows with development in thepoorest countries and decreases in the more developedones. The data were taken from the COW NationalCapabilities data set (Singer and Small 1993).
Civil war seems to occur more frequently in coun-tries with a substantial population of one or moreethnic, linguistic, or religious groups (Ellingsen 2000;Vanhanen 1999). We measure Heterogeneity by (1 2s2), where s is the share of the population in the countrythat belongs to the largest group. We created indepen-dent variables for Linguistic Heterogeneity, ReligiousHeterogeneity, and Ethnic Heterogeneity based on thedata set assembled by Ellingsen (2000).
The probability of civil war also depends on thecountry’s conflict history. Hibbs (1973, 163) foundinternal war (but not collective protest) to be stronglyinfluenced by earlier internal war. We expect, however,that time heals all wounds and construct a variablealong the lines of the proximity to regime changevariable: Proximity to civil war 5 exp(2 time in days
since the last civil war ended/a). For a country that hasnever had a civil war, the variable is assigned a 0.8
War against another state may engender war within.An international war may provide an opportunity fordissident groups to attack a weakened regime, oranother country’s government may incite a revolt. Yet,international war may reduce the probability of civilwar because the population unites against a commonenemy. We remain neutral as to the direction of thisrelationship. To test it, we include a dichotomousvariable, International War in Country, which is coded 1if the country was involved in an interstate war (asdefined in the COW Interstate War data set) the daybefore the day of observation.
Likewise, civil war may spread from one country tonearby areas. The variable Civil War in NeighboringCountry has the value 1 if there was a civil war in aneighboring country the day before the day of obser-vation.
Finally, we have added the variable Proximity ofIndependence, which equals exp(2 time in days sinceday of independence/a). Political institutions in newstates are assumed to be poorly consolidated, whichmay have implications for their regime type as well asfor their modes of conflict resolution. Since the decla-ration of national independence is coded as all coun-tries’ first regime change, this variable is correlatedwith proximity of regime change, but not very highly(see Appendix A for the correlation matrix for theindependent variables). A newly independent countrymay have many changes of government that are notregime changes in the sense defined here. Anotheraspect of the unsettled character of new nations is thattheir borders (e.g., if they are inherited colonial bound-aries) may be in dispute and out of alignment withethnic or religious groupings. This could lead to inter-state war or to a war of secession, which would beclassified as a civil war in the COW data set. Weinclude this variable to distinguish between these ef-fects and the effects of regime change.
We allowed the proximity of independence, civil war,and regime change variables to have independent valuesfor a. We ran the basic model for all possible combina-tions of a range of values in this interval.9 The combina-tion of a half-life of one year for proximity of indepen-dence, sixteen years for proximity of civil war, and oneyear for proximity of regime change maximized thelikelihood function for the period 1946–92. The corre-sponding values for 1816–1992 were half a year and
8 A half-life of 16 years means a reduction of the initial effect to 1/8after 48 years and to 0.015 after 100 years. We have no COW data forconflict history before 1816. This is potentially problematic, since acivil war in 1815 could have a considerable effect on the risk ofanother in that country for most of the nineteenth century. Withoutdata for the preceding years, the country is assigned a 0 until weknow that it has experienced a civil war. The result is a systematicunderestimation of the variable as a whole, such that the temporaldependence is not fully accounted for in the first 50 years of ouranalysis. This problem is negligible after the 1860s.9 To be interpretable as dynamic effects, the half-life times wererestricted to values between 0.5 and 16 years. These values were a 5263.5 (0.5 years), a 5 526.9 (1 year), a 5 1053.9 (2 years), a 5 2107.8(4 years), a 5 4215.6 (8 years), and a 5 8431.1 (16 years).
American Political Science Review Vol. 95, No. 1
37

sixteen years.10 To ensure comparability, we employedthe set of half-life parameters that optimized the shorterperiod and applied them to the longer period as well. Ahalf-life of one year implies that the contribution to thehazard function is halved in one year, is 1/32 (or 0.03) infive years, and is 0.001 in ten years. Coding the proximityvariables for a given date requires that we know thehistory of the country for some previous years. The Politydata set goes back to 1800 and allows us to know at leastsixteen years of regime history before 1816. Since thehalf-life parameter assumes that the influence of anyregime change is reduced to a minuscule fraction of itsoriginal effect after sixteen years, the proximity of regimechange variable is adequately coded.
ANALYSIS
Level of Democracy and Political Change
We first tested whether intermediate regimes have ashorter expected duration than democracies and autoc-racies. We computed the Kaplan-Meier estimate ofmedian survival time for polities belonging to the threeregime types. The survival time is defined as the periodfrom one regime change to another. As noted earlier,regime change is defined as an alteration greater thanor equal to 2 in the democracy-autocracy index, or asthe creation of a new state. Table 1 shows that semi-democracies have a significantly shorter median sur-vival time than the other two types. On average, lesstime has passed since the last regime change in theaverage semidemocracy than in the other categories.Semidemocracies are the least stable type of regime,which corroborates the point made by Gurr (1974).
Autocracies are estimated to have a shorter medianlife than democracies, but the difference is not statis-tically significant. Gates et al. (2000) provide a muchmore elaborate and extensive investigation of the du-ration of different regime types. They find democraciesto be significantly more durable than autocracies, andboth more stable than semidemocracies. This alsoholds when controlling for development, the politicalcomposition of the neighborhood, and changes inregime transition rate over time.
We then tested hypotheses 1–4. The results arepresented in Table 2. We conducted parallel analysesof the COW civil war data for 1946–92 with allexplanatory variables, and for 1816–1992 without theethnic heterogeneity and development variables. Weonly included the days with an outbreak of civil warwhen we had data for all variables for the country thatexperienced the outbreak.11 The number of countriesand the number of outbreaks that contribute to thedifferent analyses are reported in the bottom lines ofthe tables. These figures vary with the availability ofdata for the different variables.
The negative estimate for democracy squared re-flects an inverted U-shaped relationship between de-mocracy and civil war. The estimate for the democracyvariable is virtually 0. In other words, the estimatedinverted U is symmetrical, with the apex at 0 (theintermediate regime), and regimes at the very low endof the democracy-autocracy scale are estimated to beas unlikely to experience civil war as regimes at the veryhigh end. This supports hypothesis 2: Institutionallyconsistent democracies and stark autocracies areequally unlikely to experience civil war. An intermedi-ate regime is estimated to be four times more prone tocivil war than a consistent democracy. The estimatesfor the proximity of regime change variable are posi-tive, large, and clearly significant. For both periods, theestimates show clearly that the risk of civil war is highafter a regime change. Translated into relative riskterms, the partial effect of regime change on the hazardof civil war for the 1946–92 period was estimated at3.55 times the baseline the day after the regime change,at 1.89 times the baseline after one year, and at 1.02times the baseline after six years.12
Both democracy squared and proximity of regimechange are statistically significant, which supports hy-pothesis 4: Both level of democracy (hypothesis 1) andregime change (hypothesis 3) are necessary to providea full model of the relationship between regime typeand the risk of civil war. In Figure 1, the estimated riskof civil war relative to the baseline is plotted (along thevertical axis) as a function of the level of democracy(the horizontal axis) and the time passed since thelatest regime change. The figure shows that the maxi-mum effect of intermediacy and political change areroughly equal when regarded separately. A regimechange implies both a deconsolidation and a change inlevel of democracy. The combined effect can be seen inthe figure. For instance, a shift from an old autocracyto a new semidemocracy (a move, say, from 210 to 0on democratization and from 15 to 0 on years since
10 For the long period, we obtained even higher likelihood valueswhen trying half-life times shorter than 0.5 years and longer than 16years. This was not the case for the short period.11 A complete list of the civil wars is given in Appendix B. Additionalinformation is available at our website (http://www.prio.no/cwp/datasets.asp).
12 To obtain this estimated relative hazard one year after the regimechange, we first computed the value for proximity to regime change:exp (2365 days/527) 5 exp (20.692) 5 0.50. This value wasmultiplied by b: 0.50 3 1.27 5 0.62, which is this variable’scontribution to the linear expression. The exponential of this is exp(0.62) 5 1.89, which gives the hazard relative to countries that havenot experienced a regime change in a long time but are equal in allother respects.
TABLE 1. Kaplan-Meier Estimate of theMedian Life for Different Regime Categories,1800–1992
Regime Type
MedianLife
(years)
95%Confidence
Interval NAutocracies 7.9 (6.7; 9.0) 445
Semidemocracies 5.8 (4.9; 6.6) 452
Democracies 10.0 (7.9; 12.1) 232Note: An autocracy is a polity with a score in the range 26 to 210 on thedemocracy-autocracy index. A democracy is a polity within the 6–10interval. A semidemocracy has a score in the range 25 to 5.
Democracy, Political Change, and Civil War, 1816–1992 March 2001
38

change) increases the risk of civil war almost nine times(from 0.30 to 2.68) relative to the risk before theregime change.
In a Cox regression, all parameter estimates areinterpreted relative to the baseline. The baseline haz-ard l(t) is the nonstationary probability of civil warwithin a short interval in countries for which all covari-ates equal zero, that is, countries with a democracyscore of 0 that have had no regime changes or civil warsfor the last forty years, are not involved in internationalwars and have no neighbors with civil wars, and havedevelopment 5 0. In Figure 1, the baseline case isfound at the forward end of the figure, at the pointmarked “baseline case.”
In Figure 2, the estimated baseline hazard—theprobability of an outbreak of civil war during one yearfor the baseline case—is plotted for the period 1816–
1992 (Table 2B).13 In contrast to the common use ofsurvival analysis, the time variable (the x-axis in thefigure) is calendar time. This provides a rough pictureof trends in the probability of civil war after accountingfor the explanatory variables. The increase in thebaseline hazard after World War II demonstrates thatassuming a constant baseline probability of civil war isnot tenable. As discussed by Raknerud and Hegre(1997, 388–9), statistical models that require the as-sumption of a constant baseline probability (e.g., logis-tic regression) are problematic when there are trendsboth in the explanatory variables (as evident in thelevel of democracy variable) and in the baseline prob-ability. In some cases, the problem may lead to spuri-
13 The baseline was estimated using the procedure described inCollett 1994, 95ff.
TABLE 2. Risk of Civil War by Level of Democracy and Proximity of Regime ChangeExplanatory Variables b s.e. p-value Exp(b)
A. 1946–92Proximity of regime change 1.27 0.47 0.004 3.55Democracy 20.002 0.021 0.92 1.00Democracy squared 20.012 0.0051 0.009 0.99Proximity of civil war 1.16 0.97 0.078 3.19Proximity of independence 1.51 0.97 0.060 4.55International war in country 0.86 0.59 0.075 2.36Neighboring civil war 0.097 0.33 0.38 1.10Development 20.48 0.16 0.001 0.62Development squared 20.066 0.036 0.031 0.94Ethnic heterogeneity 0.80 0.39 0.019 2.22Log-likelihoodnull model 2292.17Log-likelihoodmodel 2254.76Likelihood ratio index 0.13Number of countries 152Number of events 63
B. 1816–1992Proximity of regime change 0.98 0.37 0.004 2.68Democracy 20.010 0.019 0.29 0.99Democracy squared 20.013 0.0027 ,0.0005 0.99Proximity of civil war 1.66 0.25 ,0.0005 5.27Proximity of independence 1.86 0.68 0.003 6.41International war in country 0.24 0.42 0.28 1.28Neighboring civil war 0.27 0.27 0.16 1.31Log-likelihoodnull model 2535.69Log-likelihoodmodel 2484.82Likelihood ratio index 0.095Number of countries 169Number of events 129Note: The exponential of the parameter estimate, exp(b), is the estimated risk of civil war relative to the baseline hazard if all other explanatory variablesare zero (cf. equation 3 above). If some of the variables are nonzero, exp(b) is the hazard relative to other countries with similar values for all the otherrisk factors. The log-likelihood ratio index is computed as 1 2 (LLmodel/LLnull model) (Greene 1997, 891). For the democracy variable, the p-value refersto a two-tailed test; b Þ 0. For democracy squared, development, and development squared, b , 0 is tested. For the rest of the variables, b . 0 is tested.All estimates are in the expected direction.
American Political Science Review Vol. 95, No. 1
39

ous results. The Cox regression model employed hereavoids these problems.
Using the more precisely dated Polity IIId data helpsaddress a question raised earlier regarding the se-quence of events. Even with Polity IIId, however, thereis a danger that the events may be reversed, so that thecivil war precedes rather than follows regime change.To test to what extent the estimates for proximity ofregime change are influenced by such individual obser-vations, we ran the model reported in Table 2A usingonly outbreaks that occurred more than 60 days after anew regime. The variable was still significant, with ap-value of .035 (one-tailed test). A drop in significanceis to be expected, since we removed the five outbreakswith the highest value for proximity of regime change.Consequently, we think our results are quite robust tothe problem of a reversed sequence of events.
A reversed sequence creates another potential diffi-culty. In such cases, the values we use for the level ofdemocracy at the time of the war will be incorrect. Tomake sure that the analysis is not sensitive to this, weran the model in Table 2A for all outbreaks thatoccurred less than one year after a new regime andused the democracy score before the change. Althoughonly 18 civil wars remained in this analysis, the estimatefor democracy squared was close to significance(p 5 .065).
The Effect of the Control Variables
Some of the control variables contribute significantly tothe model. For 1946–92, the development variable andits squared term have highly significant effects on theprobability of civil war. For that period, values under25 (7 kgs coal-equivalent) are rare. Bhutan in 1946 isthe definitively least developed country, with a score of26.7. The estimated relative risk of civil war increaseswith development up to somewhere above 24 (e.g.,Paraguay or Thailand in 1950, or Mali and Uganda in1990). When the level of development passes 23(Bhutan or Haiti around 1990), the relative risk startsdecreasing, and it is halved at 20.5 (e.g., Costa Rica in1990). The industrialized countries in Europe andNorth America have values around 2 (7.4 coal-tonequivalents) on our development variable. For suchvalues, the estimated relative risk is one-eighth that ofthe most conflict-prone level of development. Thecurvilinear relationship is consistent with the findingsof Hibbs (1973).
The proximity of independence variable is significantfor the longer period, from 1816–1992. For 1946–92,the estimated p-value is .060. Ethnic heterogeneitydoes increase the probability of civil war; it is roughlytwice as high in countries where the largest ethnic
FIGURE 1. Relative Risk of Civil War as a Function of Democracy and Time since Most RecentRegime Change, 1816–1992
Note: The figure is based on the parameter estimates in Table 2B. The baseline case is an observation with democracy 5 0 and proximity of regimechange 5 0 (15 years since regime change). All risks are plotted relative to this case. For instance, an observation with democracy 5 0 and years sincemost recent regime change 5 0 is estimated to have a risk of exp(b1 exp(20/527) 1 0b2) 5 exp(b1) 5 2.68 relative to the baseline (cf. note 12).
Democracy, Political Change, and Civil War, 1816–1992 March 2001
40

group constitutes half the population as in countrieswhere it accounts for 95% of the population.14 Thisresult is significant at the .05 level. For both periods,countries with a recent civil war have a propensity forrenewed violence. For instance, exactly one year afterthe previous conflict, the country is estimated to have ahazard of civil war 1.8 times higher than the baselinefor the 1946–92 period. The parameter estimate isclearly significant, even more so in the longer than theshorter period.
We found only weak support for the idea thatcountries involved in an international war have ahigher probability of civil war ( p 5 .090 for 1946–92was the strongest estimate). This weak result reflectsthe ambiguous findings of the literature on the inter-nal-external conflict nexus (Heldt 1997; Levy 1989). An
international war may be an opportunity for dissentinggroups to rebel, but it is also a means for the govern-ment to unite the country against an external enemy.The neighboring civil war variable is even less impor-tant. We find no clear evidence for the hypothesizeddiffusion of nearby conflict. Civil war occurs morefrequently in some parts of the world than in others,but this is due to the clustering of other factors in themodel, mainly development and regime type.
Direction and Magnitude of Regime Change
We have established that the relative risk of civil war isaltered as the result of a regime change, but which typeof shift has most effect, that is, toward democratizationor autocratization? And is a large change more dan-gerous than a small one? The implications of theearlier results are not straightforward for the issue ofdirection and magnitude of regime change. Table 2demonstrates that a new regime increases the risk of
14 This figure is calculated by computing the heterogeneity index forthe cases: 1 2 0.52 5 0.0975, and 1 2 0.952 5 0.75. The risk of thefirst relative to the second is the exponential of the differencebetween the two: exp (0.79 3 (0.75 2 0.0975)) 5 1.92.
FIGURE 2. Estimated Baseline Hazard of Civil War, 1820–1992
Note: The figure plots the hazard derived during the estimation in Table 2B for the baseline case. The hazard is partly a function of the frequency of civilwars relative to number of countries that are system members, and partly of the distribution of values for the explanatory variables. The low hazard around1940 reflects the relatively low number of civil wars in that period (see Appendix B). The high hazard in the 1980s reflects a fairly high frequency of civilwars despite relatively low average values for explanatory variables that are estimated to increase the risk of civil war. The baseline is only defined fromthe first outbreak of civil war in our data set (i.e., from 1820)
American Political Science Review Vol. 95, No. 1
41
civil war when controlling for the level of democracy,but the model assumes that all types of regime changehave the same effect on the probability of conflict. Thisis not necessarily the case.
To explore this issue, we divided proximity of regimechange into five proximity variables: Small/Large De-mocratization, Small/Large Autocratization, and OtherRegime Change. A large change is defined as an in-crease or decrease of six units or more, and a smallchange as two to five units. For instance, if the mostrecent shift was toward a much lower level of democ-racy (i.e., 6 or more units on the scale), the Proximity ofLarge Autocratization variable was set to exp(2 dayssince regime change/a), and the others were set to 0.Throughout, we assume that the parameter a in theformula for the five proximity of regime change vari-ables is independent of the initial risk, such that thehalf-life of the effect on the risk of civil war is the samefor all regime change types. We also assume that theinfluence of a specific type of regime change is inde-pendent of the level of democracy before the change.15
A small degree of democratization in an autocracy isassumed to have the same effect as a small degree ofdemocratization in an intermediate regime, after wecontrol for the effect of changing from one level toanother.
Table 3 reports the results of replacing the simpleregime change variable in Table 2 with the subdividedvariable. In Table 3B, proximity of other regime changeis the only variable that is not positive and significantlylarger than zero. This is not surprising, since most ofthose “other” changes are minor or are accounted forby proximity of independence. In Table 3A, proximityof large democratization is also not significant. Of theremaining variables, large autocratization seems to beassociated with the largest change in risk of civil war,but in neither period are the four parameter estimatesfor proximity of change toward either democracy orautocracy significantly different from one another.Thus, when controlling for the regime type towardwhich the change leads, there is no significant differ-ence between the effects of democratization and auto-cratization.16 As before, the contribution of regimechange to the hazard function is greater for the shorterthan the longer period. A comparison with Table 2shows that the estimates for democracy and democracysquared remain virtually unchanged.
Because gaining independence is coded as “otherregime change,” there is a high correlation betweenthat variable and proximity of independence (cf. Ap-pendix A). The estimates for the latter are substantiallyhigher in Table 3 than in Table 2. This is a result of theseparation between the different categories of regime
change. The parameter estimates for the other controlvariables are unchanged, as is the estimate for democ-racy squared. Distinguishing the different directions ormagnitudes of regime change adds very little informa-tion to the overall model.
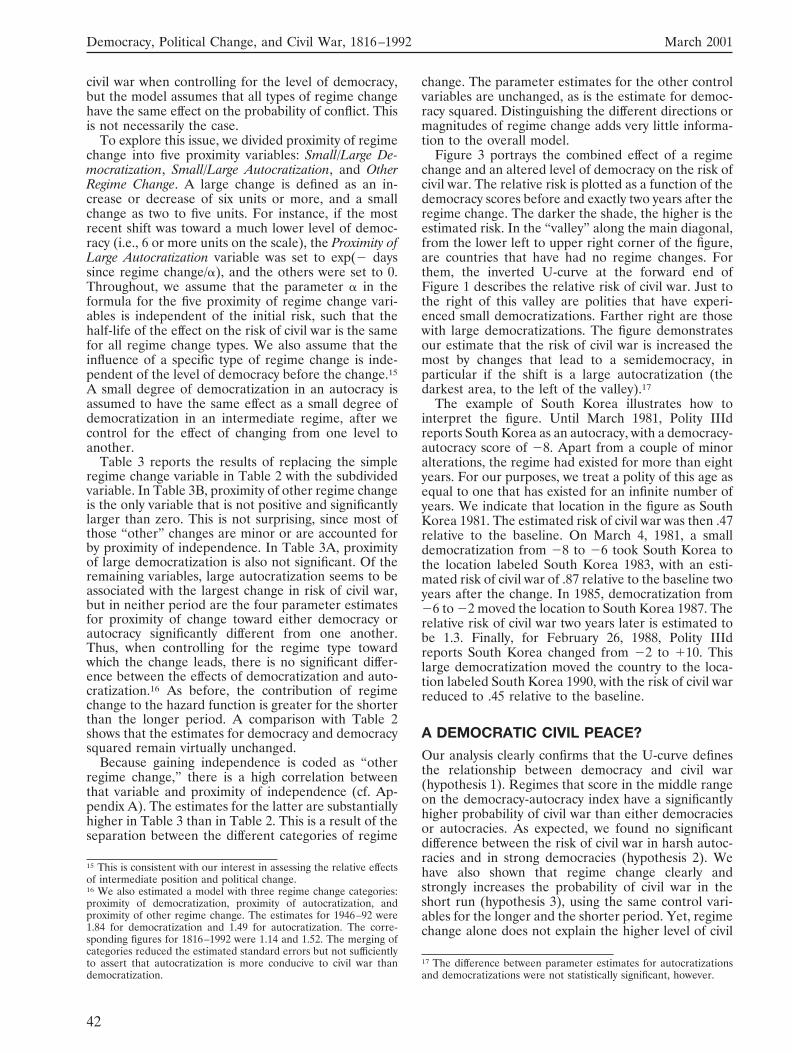
Figure 3 portrays the combined effect of a regimechange and an altered level of democracy on the risk ofcivil war. The relative risk is plotted as a function of thedemocracy scores before and exactly two years after theregime change. The darker the shade, the higher is theestimated risk. In the “valley” along the main diagonal,from the lower left to upper right corner of the figure,are countries that have had no regime changes. Forthem, the inverted U-curve at the forward end ofFigure 1 describes the relative risk of civil war. Just tothe right of this valley are polities that have experi-enced small democratizations. Farther right are thosewith large democratizations. The figure demonstratesour estimate that the risk of civil war is increased themost by changes that lead to a semidemocracy, inparticular if the shift is a large autocratization (thedarkest area, to the left of the valley).17
The example of South Korea illustrates how tointerpret the figure. Until March 1981, Polity IIIdreports South Korea as an autocracy, with a democracy-autocracy score of 28. Apart from a couple of minoralterations, the regime had existed for more than eightyears. For our purposes, we treat a polity of this age asequal to one that has existed for an infinite number ofyears. We indicate that location in the figure as SouthKorea 1981. The estimated risk of civil war was then .47relative to the baseline. On March 4, 1981, a smalldemocratization from 28 to 26 took South Korea tothe location labeled South Korea 1983, with an esti-mated risk of civil war of .87 relative to the baseline twoyears after the change. In 1985, democratization from26 to 22 moved the location to South Korea 1987. Therelative risk of civil war two years later is estimated tobe 1.3. Finally, for February 26, 1988, Polity IIIdreports South Korea changed from 22 to 110. Thislarge democratization moved the country to the loca-tion labeled South Korea 1990, with the risk of civil warreduced to .45 relative to the baseline.
A DEMOCRATIC CIVIL PEACE?
Our analysis clearly confirms that the U-curve definesthe relationship between democracy and civil war(hypothesis 1). Regimes that score in the middle rangeon the democracy-autocracy index have a significantlyhigher probability of civil war than either democraciesor autocracies. As expected, we found no significantdifference between the risk of civil war in harsh autoc-racies and in strong democracies (hypothesis 2). Wehave also shown that regime change clearly andstrongly increases the probability of civil war in theshort run (hypothesis 3), using the same control vari-ables for the longer and the shorter period. Yet, regimechange alone does not explain the higher level of civil
15 This is consistent with our interest in assessing the relative effectsof intermediate position and political change.16 We also estimated a model with three regime change categories:proximity of democratization, proximity of autocratization, andproximity of other regime change. The estimates for 1946–92 were1.84 for democratization and 1.49 for autocratization. The corre-sponding figures for 1816–1992 were 1.14 and 1.52. The merging ofcategories reduced the estimated standard errors but not sufficientlyto assert that autocratization is more conducive to civil war thandemocratization.
17 The difference between parameter estimates for autocratizationsand democratizations were not statistically significant, however.
Democracy, Political Change, and Civil War, 1816–1992 March 2001
42

war in intermediate regimes. The two factors are partlyoverlapping, yet complementary. The democracysquared variable, which models the U-curve relation-ship between level of democracy and the risk of civilwar, is clearly significant, even when controlling for thetime elapsed since the most recent regime change(which supports hypothesis 4).
The hypotheses were tested with long-term datafrom the COW project (1816–1992), controlling forproximity of independence, civil war, and internationalwar, as well as civil war in a neighboring country. They
were supported by those data and for the post–WorldWar II period (1946–92) with additional controls foreconomic development and ethnic heterogeneity. Therelationships were tested using a more appropriatestatistical model than in previous studies, with morereliable estimates for statistical significance.
The direction of change has no discernible influenceon the probability of civil war. This is not to say thatdemocratization is as conducive to conflict as autocra-tization. The short-term effects are the same, but thelong-term effects are different. As shown above and
TABLE 3. Risk of Civil War by Level of Democracy and Subdivided Proximity of Regime ChangeVariable
Explanatory Variables b s.e. p-value Exp(b)A. 1946–92Proximity of small democratization 1.54 0.67 0.011 4.66Proximity of large democratization 1.22 0.95 0.10 3.39Proximity of small autocratization 1.22 0.73 0.048 3.39Proximity of large autocratization 2.63 0.75 ,0.0005 13.9Proximity of other regime change 0.29 0.62 0.32 1.33Democracy 0.0016 0.024 0.47 1.002Democracy squared 20.012 0.0051 0.011 0.99Proximity of civil war 1.14 0.34 0.001 3.13Proximity of independence 2.52 1.06 0.009 12.4International war in country 0.85 0.53 0.11 2.35Neighboring civil war 0.16 0.33 0.31 1.18Development 20.48 0.16 0.001 0.62Development squared 20.066 0.036 0.032 0.94Ethnic heterogeneity 0.80 0.40 0.022 2.23Log-likelihoodnull model 2292.17Log-likelihoodmodel 2252.00Likelihood ratio index 0.14Number of countries 152Number of events 63
B. 1816–1992Proximity of small democratization 1.04 0.61 0.044 2.84Proximity of large democratization 1.37 0.71 0.028 3.93Proximity of small autocratization 1.44 0.57 0.006 4.21Proximity of large autocratization 1.91 0.84 0.012 6.73Proximity of other regime change 0.12 0.46 0.40 1.13Democracy 20.010 0.020 0.29 0.99Democracy squared 20.013 0.0027 ,0.0005 0.99Proximity of civil war 1.61 0.25 ,0.0005 5.00Proximity of independence 2.52 0.56 ,0.0005 12.4International war in country 0.25 0.41 0.27 1.28Neighboring civil war 0.30 0.27 0.14 1.35Log-likelihoodnull model 2535.67Log-likelihoodmodel 2482.00Likelihood ratio index 0.10Number of countries 169Number of events 129Note: See note to Table 2.
American Political Science Review Vol. 95, No. 1
43

noted by Gurr (1974), countries that have movedtoward the middle category are the most likely toexperience further regime change. Table 1 demon-strates that political stability increases as the democra-cy-autocracy scores approach both ends of the scale.Among countries that have moved toward the ends, theanalysis in Gates et al. (2000) indicates that autocraciesare somewhat less stable than democracies and aremore likely to experience further change, which ex-poses them to the more risky middle position. Themost reliable path to stable domestic peace in the longrun is to democratize as much as possible. A change inthat direction ensures the strongest ratchet effect interms of consolidating political institutions and makesit less likely that the country will slide back into a statein which it is more prone to civil war.
Eventually, then, countries are more likely to end upat the democratic end of the scale. The conflict-generating effect of democratization when movingfrom autocracy to intermediacy produces violence inthe short run only. In the long run these states, too, willattain civil peace, but if semidemocracies experience asuccession of transitions in and around the middle
zone, it will take a long time before there is a netdecrease in violence. A full assessment of the long-term effect of democratization requires a study ofwhether sequences of regime change and civil war formcertain patterns.
Does the third wave of democracy reduce the specterof violent domestic conflict? The effect of politicalchange depends heavily on the point of departure. Inthe short run, a democratizing country will have to livethrough an unsettling period of change. But if we focuson countries that are at least half-way toward completedemocracy, the prospects for domestic peace are prom-ising. There is a democratic civil peace, and it may beachieved in the short run in some countries. In the longrun most states, possibly all, may reach this condition,especially if we take into account the higher survivalrate of open societies, which are less likely to moveonce again through the doubly dangerous zone ofintermediate democracy and political change. Whiletotalitarian states may achieve a domestic peace ofsorts, which may be characterized as the peace of a zoo,a democratic civil peace is likely not only to be morejust but also more durable.
FIGURE 3. Relative Risk of Civil War as Function of Democracy Index before or after RegimeChange, 1816–1992
Note: The figure is based on the parameter estimates in Table 3B. The relative risks are calculated for a time two years after the regime change. Thevarious shadings correspond to different ranges of values along the vertical axis. The darker the shading, the higher is the estimated risk of civil war.
Democracy, Political Change, and Civil War, 1816–1992 March 2001
44

AP
PE
ND
IXA
.C
orr
elat
ion
Mat
rix
for
Exp
lana
tory
Var
iab
les,
Pea
rso
n’s
r,19
46–9
2D
ata
Dem
ocra
cyD
emoc
racy
squa
red
Pro
xim
ityof
regi
me
chan
ge
Pro
xim
ityof
smal
ld
emoc
rati-
zatio
n
Pro
xim
ityof
larg
ed
emoc
rati-
zatio
n
Pro
xim
ityof
smal
lau
tocr
ati-
zatio
n
Pro
xim
ityof
larg
eau
tocr
ati-
zatio
n
Pro
xmity
ofot
her
regi
me
chan
ge
Pro
xim
ityof
civi
lw
ar
Pro
xim
ityof
ind
epen
-d
ence
Inte
rnat
-io
nal
war
inco
untr
yN
eigh
bor
ing
civi
lwar
Dev
elop
-m
ent
Dev
elop
-m
ent
squa
red
Dem
ocra
cysq
uare
d0.
37P
roxi
mity
ofre
gim
ech
ange
20.
052
0.26
Pro
xim
ityof
smal
ld
emoc
ratiz
atio
n2
0.03
20.
180.
34P
roxi
mity
ofla
rge
dem
ocra
tizat
ion
0.16
20.
080.
332
0.03
Pro
xim
ityof
smal
lau
tocr
atiz
atio
n2
0.08
20.
120.
292
0.03
20.
03P
roxi
mity
ofla
rge
auto
crat
izat
ion
20.
112
0.06
0.23
20.
032
0.03
20.
02P
roxi
mity
ofot
her
regi
me
chan
ge2
0.06
20.
110.
682
0.07
20.
072
0.07
20.
05P
roxi
mity
ofci
vil
war
20.
142
0.23
0.08
0.04
0.02
0.12
0.04
20.
01P
roxi
mity
ofin
dep
end
ence
0.03
20.
090.
342
0.03
20.
030.
002
0.01
0.48
20.
07In
tern
atio
nalw
arin
coun
try
0.00
20.
040.
012
0.02
20.
010.
050.
022
0.01
0.09
20.
01N
eigh
bor
ing
civi
lw
ar2
0.10
20.
150.
140.
060.
050.
032
0.03
0.11
0.07
0.05
0.06
Dev
elop
men
t0.
450.
392
0.21
20.
072
0.05
20.
122
0.08
20.
122
0.22
20.
120.
012
0.14
Dev
elop
men
tsq
uare
d2
0.23
20.
090.
080.
040.
010.
100.
010.
020.
060.
102
0.01
0.03
20.
67E
thni
che
tero
gene
ity2
0.09
20.
220.
080.
050.
020.
020.
010.
050.
040.
032
0.05
0.09
20.
190.
15N
ote:
The
corr
elat
ion
mat
rixre
fers
toal
lcou
ntrie
sob
serv
edon
cefo
rea
chou
tbre
akof
civi
lwar
(n5
8,2
62
).
45

APPENDIX B. List of Civil Wars from the Correlates of War Data
COWNumber Country Event Date
DemocracyIndex
Days SinceRegimeChange
Proximity ofRegimeChange Development
EthnicHeterogeneity
329 Two Sicilies 07.02.1820 210 1,644 0.04 (Available only afterWorld War II)325 Sardinia 03.10.1821 210 1,895 0.03
230 Spain 12.01.1821 24 699 0.27640 Ottoman Empire 06.14.1826 210 3,817 0.00235 Portugal 07.01.1829 23 2,217 0.01220 France 07.25.1830 21 69 0.8870 Mexico 01.02.1832 21 366 0.50
230 Spain 07.15.1834 26 3,970 0.00100 Colombia 07.15.1840 2 3,059 0.00230 Spain 05.15.1847 22 720 0.26329 Two Sicilies 01.12.1848 210 9,790 0.00220 France 02.22.1848 21 6,490 0.00300 Austria-Hungary 03.13.1848 26 9 0.98220 France 01.01.1851 6 1,042 0.14155 Chile 09.15.1851 25 4,640 0.00135 Peru 12.21.1853 21 5,241 0.00100 Colombia 04.17.1854 2 8,083 0.00135 Peru 10.31.1856 21 6,286 0.0070 Mexico 02.15.1858 23 3,665 0.00
101 Venezuela 02.01.1859 25 6,605 0.00710 China 01.01.1860 26 21,914 0.00100 Colombia 05.15.1860 2 10,303 0.00
2 United States 04.10.1861 8 2,506 0.01160 Argentina 04.02.1863 23 3,622 0.00160 Argentina 12.15.1866 23 4,975 0.00101 Venezuela 01.11.1868 25 9,871 0.00160 Argentina 05.20.1870 23 6,227 0.00230 Spain 04.20.1872 1 401 0.47160 Argentina 09.01.1874 23 7,792 0.00
2 United States 02.01.1876 10 1,676 0.04100 Colombia 11.15.1876 8 3,463 0.00740 Japan 01.29.1877 1 3,313 0.00160 Argentina 06.15.1880 23 9,906 0.00100 Colombia 11.15.1884 8 6,385 0.00155 Chile 01.07.1891 5 920 0.17140 Brazil 02.02.1893 23 1,174 0.11140 Brazil 09.06.1893 23 1,390 0.07135 Peru 10.15.1894 2 3,059 0.00140 Brazil 10.01.1896 23 823 0.21100 Colombia 09.01.1899 23 4,775 0.00165 Uruguay 01.01.1904 23 8,034 0.00365 Russia 01.22.1905 210 32,528 0.00360 Rumania 03.15.1907 26 2,448 0.01600 Morocco 08.01.1907 26 22,126 0.0070 Mexico 11.20.1910 29 10,945 0.00
600 Morocco 01.15.1911 26 23,389 0.00150 Paraguay 07.15.1911 23 2,570 0.01710 China 10.11.1911 26 17,998 0.00710 China 07.12.1913 2 488 0.40365 Russia/USSR 12.09.1917 21 44 0.92375 Finland 01.28.1918 8 53 0.90310 Hungary 03.25.1919 27 3 0.9991 Honduras 02.09.1924 5 1,318 0.08
700 Afghanistan 03.15.1924 26 1,680 0.04710 China 07.01.1926 25 4,443 0.0070 Mexico 08.31.1926 23 791 0.22
700 Afghanistan 11.10.1928 26 3,381 0.00710 China 03.01.1929 25 5,417 0.00710 China 11.15.1930 25 6,041 0.0092 El Salvador 01.22.1932 29 50 0.91
230 Spain 10.04.1934 7 1,029 0.14230 Spain 07.18.1936 7 1,682 0.04710 China 02.28.1947 25 64 0.89150 Paraguay 03.07.1947 29 2,577 0.01 24.08 0.1494 Costa Rica 03.12.1948 10 10,320 0.00 21.56 0.04
775 Burma 09.15.1948 8 255 0.62 24.28 0.48100 Colombia 09.15.1949 25 524 0.37 21.58 0.71850 Indonesia 05.31.1950 3 155 0.75 22.71 0.82
Democracy, Political Change, and Civil War, 1816–1992 March 2001
46

APPENDIX B. (Continued)
COWNumber Country Event Date
DemocracyIndex
Days SinceRegimeChange
Proximity ofRegimeChange Development
EthnicHeterogeneity
840 Philippines 09.01.1950 5 62 0.89 22.29 0.04145 Bolivia 04.09.1952 25 5,805 0.00 22.09 0.86850 Indonesia 09.20.1953 0 1,131 0.12 22.36 0.8290 Guatemala 06.08.1954 2 1,275 0.09 21.62 0.69
160 Argentina 06.15.1955 29 2,382 0.01 0.03 0.15850 Indonesia 12.15.1956 0 2,313 0.01 21.93 0.82660 Lebanon 05.09.1958 2 4,268 0.00 20.62 0.1440 Cuba 06.15.1958 29 1,095 0.13 20.23 0.47
645 Iraq 03.06.1959 25 234 0.64 20.70 0.45817 Vietnam, Rep. of 01.01.1960 23 1,528 0.06 22.94 0.24812 Laos 10.15.1960 21 288 0.58 24.02 0.66615 Algeria 07.28.1962 28 25 0.95 21.44 0.00678 Yemen Arab Rep. 11.15.1962 0 56 0.90 24.79 0.19625 Sudan 10.01.1963 27 1,778 0.03 22.76 0.76517 Rwanda 11.15.1963 25 501 0.39 24.29 0.1942 Dominican Republic 04.25.1965 23 480 0.40 21.58 0.47
90 Guatemala 10.01.1966 3 208 0.67 21.57 0.68710 China 01.15.1967 29 259 0.61 21.49 0.12475 Nigeria 07.06.1967 27 536 0.36 22.61 0.65775 Burma 01.01.1968 27 1,645 0.04 22.84 0.48663 Jordan 09.17.1970 29 4,935 0.00 21.08 0.0490 Guatemala 11.15.1970 1 258 0.61 21.36 0.68
770 Pakistan 03.25.1971 3 2,272 0.01 21.85780 Sri Lanka 04.06.1971 8 313 0.55 22.13 0.50516 Burundi 04.30.1972 27 1,978 0.02 24.79 0.29840 Philippines 10.01.1972 29 7 0.99 21.27 0.04552 Zimbabwe 12.28.1972 4 2,553 0.01 20.32 0.10770 Pakistan 01.23.1973 3 2,942 0.00 21.81660 Lebanon 04.13.1975 5 1,699 0.04 20.02 0.1490 Guatemala 03.12.1978 25 6 0.99 21.46 0.68
700 Afghanistan 06.01.1978 27 1,779 0.03 22.79 0.75630 Iran 09.03.1978 210 8,582 0.00 0.24 0.7193 Nicaragua 10.01.1978 28 15,460 0.00 20.84 0.51
811 Kampuchea 01.08.1979 27 1,013 0.15 26.06 0.1592 El Salvador 07.01.1979 26 860 0.20 21.34 0.19
541 Mozambique 10.21.1979 28 1,579 0.05 22.27 0.31475 Nigeria 12.18.1980 7 443 0.43 21.98 0.63630 Iran 06.06.1981 26 855 0.20 20.06 0.71135 Peru 03.04.1982 7 583 0.33 20.49 0.7593 Nicaragua 03.18.1982 25 378 0.49 21.28 0.52
520 Somalia 04.21.1982 27 4,564 0.00 22.27 0.19775 Burma 02.01.1983 28 945 0.17 22.76 0.48780 Sri Lanka 07.25.1983 3 214 0.67 21.95 0.45625 Sudan 11.17.1983 27 4,418 0.00 22.49 0.74475 Nigeria 02.02.1984 27 32 0.94 21.52 0.63100 Colombia 03.15.1984 8 3,507 0.00 20.20 0.71750 India 01.01.1985 8 2,741 0.01 21.38 0.48645 Iraq 01.01.1985 29 1,995 0.02 20.41 0.45680 Yemen Peoples Rep. 01.13.1986 28 2,573 0.01 0.26780 Sri Lanka 09.01.1987 3 1,713 0.04 22.08 0.45516 Burundi 08.18.1988 27 7,932 0.00 24.02 0.29450 Liberia 12.01.1989 26 1,976 0.02 22.00 0.10360 Rumania 12.21.1989 28 4,712 0.00 1.50 0.23517 Rwanda 09.30.1990 27 6,295 0.00 23.51 0.19365 USSR 04.30.1991 0 321 0.54 1.91 0.73345 Yugoslavia/Serbia 05.01.1991 21 465 0.41 0.55 0.87640 Turkey 07.10.1991 10 607 0.32 0.05 0.26516 Burundi 11.23.1991 24 68 0.88 23.82 0.29372 Georgia 12.25.1991 2 260 0.61 0.00 0.51702 Tajikistan 05.01.1992 3 235 0.64 0.00 0.58540 Angola 10.28.1992 26 602 0.32 22.40 0.86
American Political Science Review Vol. 95, No. 1
47

REFERENCESAuvinen, Juha. 1997. “Political Conflict in Less Developed Coun-
tries, 1981–89.” Journal of Peace Research 34 (2): 177–95.Bratton, Michael, and Nicholas van de Walle. 1996. Democratic
Experiments in Africa: Regime Transitions in Comparative Perspec-tive. Cambridge: Cambridge University Press.
Casper, Gretchen, and Michelle M. Taylor. 1996. Negotiating Democ-racy: Transitions from Authoritarian Rule. Pittsburgh, PA: Univer-sity of Pittsburgh Press.
Collett, D. 1994. Modeling Survival Data in Medical Research. Lon-don: Chapman & Hall.
Collier, Paul, and Anke Hoeffler. 1998. “On Economic Causes ofCivil War.” Oxford Economic Papers 50 (4): 563–73.
Cox, David R. 1972. “Regression Models and Life Tables (withDiscussion).” Journal of the Royal Statistical Society, B 74: 187–220.
de Nardo, James. 1985. Power in Numbers. Princeton, NJ: PrincetonUniversity Press.
Doyle, Michael W. 1986. “Liberalism and World Politics.” AmericanPolitical Science Review 80 (December): 1151–69.
Ellingsen, Tanja. 2000. “Colorful Community or Ethnic Witches’Brew? Multiethnicity and Domestic Conflict During and After theCold War.” Journal of Conflict Resolution 44 (2): 228–49.
Ellingsen, Tanja, and Nils Petter Gleditsch. 1997. “Democracy andArmed Conflict in the Third World.” In Causes of Conflict in ThirdWorld Countries, ed. Ketil Volden and Dan Smith. Oslo: North-South Coalition and International Peace Research Institute, Oslo.Pp. 69–81.
Francisco, Ronald A. 1995. “The Relationship between Coercionand Protest: An Empirical Evaluation in Three Coercive States.”Journal of Conflict Resolution 39 (2): 263–82.
Gates, Scott, Håvard Hegre, Mark P. Jones, and Håvard Strand.2000. “Institutional Inconsistency and Political Instability: Persis-tence and Change in Political Systems Revisited, 1800–1998.”Presented at the annual meeting of American Political ScienceAssociation, Washington, DC.
Greene, William H. 1997. Econometric Analysis, 3d. ed. UpperSaddle River, NJ: Prentice-Hall.
Gurr, Ted Robert. 1974. “Persistence and Change in PoliticalSystems, 1800–1971.” American Political Science Review 68 (De-cember): 1482–504.
Gurr, Ted Robert. 1993. “Why Minorities Rebel: A Global Analysisof Communal Mobilization and Conflict Since 1945.” InternationalPolitical Science Review 14 (2): 161–201.
Gurr, Ted Robert, Keith Jaggers, and Will H. Moore. 1989. Polity IICodebook. Boulder, CO: University of Colorado. http://www.colorado.edu/IBS/GAD/spacetime/data/Polity.html.
Hauge, Wenche, and Tanja Ellingsen. 1998. “Beyond EnvironmentalScarcity: Causal Pathways to Conflict.” Journal of Peace Research35 (3): 299–317.
Heldt, Birger. 1997. “The Dependent Variable of the Domestic-External Conflict Relationship: Anecdotes, Theories and System-atic Studies.” Journal of Peace Research 34 (1): 101–6.
Hibbs, Douglas A. 1973. Mass Political Violence. A Cross-NationalCausal Analysis. New York: Wiley.
Horowitz, Donald L. 1993. “Democracy in Divided Societies.”Journal of Democracy 4 (4): 18–38.
Huntington, Samuel P. 1991. The Third Wave: Democratization in theLate Twentieth Century. Norman, OK, and London: University ofOklahoma Press.
Jaggers, Keith, and Ted Robert Gurr. 1995. “Transitions to Democ-racy: Tracking Democracy’s Third Wave with the Polity III Data.”Journal of Peace Research 32 (4): 469–82.
Krain, Matthew, and Marissa Edson Myers. 1997. “Democracy andCivil War: A Note on the Democratic Peace Proposition.” Inter-national Interactions 23 (1): 109–18.
Levy, Jack S. 1989. “The Diversionary Theory of War: A Critique.”In Handbook of War Studies, ed. Manus I. Midlarsky. Ann Arbor,MI: University of Michigan Press. Pp. 259–88.
Lichbach, Mark Irving. 1987. “Deterrence or Escalation? The Puzzleof Aggregate Studies of Repression and Dissent.” Journal ofConflict Resolution 31 (2): 266–97.
Lichbach, Mark Irving. 1995. The Rebel’s Dilemma. Ann Arbor, MI:University of Michigan Press.
McCullagh, Peter, and John A. Nelder. 1989. Generalized LinearModels, 2d ed. London: Chapman & Hall.
McLaughlin, Sara, Scott Gates, Håvard Hegre, Ranveig Gissinger,and Nils Petter Gleditsch. 1998. “Timing the Changes in PoliticalStructures: A New Polity Database.” Journal of Conflict Resolution42 (2): 231–42.
Moore, Will H. 1998. “Repression and Dissent: Substitution, Con-text, and Timing.” American Journal of Political Science 42 (3):851–73.
Muller, Edward N., and Erich Weede. 1990. “Cross-National Vari-ations in Political Violence: A Rational Action Approach.” Journalof Conflict Resolution 34 (4): 624–51.
Raknerud, Arvid, and Håvard Hegre. 1997. “The Hazard of War:Reassessing the Evidence for the Democratic Peace.” Journal ofPeace Research 34 (4): 385–404.
Russett, Bruce M. 1993. Grasping the Democratic Peace. Principles fora Post–Cold War World. Princeton, NJ: Princeton University Press.
Sahin, Yossi, and Juan J. Linz. 1995. Between States: Interim Govern-ments and Democratic Transitions. Cambridge: Cambridge Univer-sity Press.
Singer, J. David, and Melvin Small. 1993. National Material Capabil-ities Data, 1816–1985 [computer file] (Study #9903). Ann Arbor,MI: J. David Singer, University of Michigan, and Detroit, MI:Melvin Small, Wayne State University [producers], 1990. AnnArbor, MI: Inter-university Consortium for Political and SocialResearch [distributor], 1993.
Singer, J. David, and Melvin Small. 1994. Correlates of War Project:International and Civil War Data, 1816–1992 [computer file] (Study#9905). Ann Arbor, MI: J. David Singer and Melvin Small[producers], 1993. Ann Arbor, MI: Inter-university Consortium forPolitical and Social Research [distributor], 1994.
Tarrow, Sidney. 1994. Power in Movement: Social Movements, Col-lective Action and Politics. Cambridge, MA: Cambridge UniversityPress.
Taylor, Charles Lewis, and David A. Jodice. 1983. World Handbookof Political and Social Indicators, 3d ed. New Haven, CT: YaleUniversity Press.
Tocqueville, Alexis de. [1856] 1955. The Old Regime and the FrenchRevolution. New York: Doubleday.
Vanhanen, Tatu. 1999. “Domestic Ethnic Conflict and Ethnic Nep-otism.” Journal of Peace Research 36 (1): 55–79.
Vanhanen, Tatu. 2000. “A New Dataset for Measuring Democracy,1810–1998.” Journal of Peace Research 37 (2): 251–65.
Ward, Michael D., and Kristian S. Gleditsch. 1998. “Democratizingfor Peace.” American Political Science Review 92 (March): 51–62.
Zanger, Sabine C. 2000. “A Global Analysis of the Effect of PoliticalRegime Changes on Life Integrity Violations, 1977–93.” Journal ofPeace Research 37 (2): 213–33.
Democracy, Political Change, and Civil War, 1816–1992 March 2001
48