TOURISM TO VICTORIA’S...Regional Tourism Satellite Accounts Tourism is a valuable contributor to...
16
THE ECONOMIC CONTRIBUTION OF TOURISM TO VICTORIA’S REGIONS 2017-18 Results from the 2017-18 Regional Tourism Satellite Accounts, published by Tourism Research Australia Report produced by the Tourism, Events and Visitor Economy (TEVE) Research Unit Department of Jobs, Precincts and Regions Victorian Government Released December 2019
Transcript of TOURISM TO VICTORIA’S...Regional Tourism Satellite Accounts Tourism is a valuable contributor to...

THE ECONOMIC CONTRIBUTION OF TOURISM TO VICTORIA’S REGIONS 2017-18
Results from the 2017-18 Regional Tourism Satellite Accounts, published by Tourism Research Australia
Report produced by the Tourism, Events and Visitor Economy
(TEVE) Research Unit
Department of Jobs, Precincts and Regions
Victorian Government
Released December 2019

Regional Tourism Satellite Accounts
Tourism is a valuable contributor to Victoria's regional economies. In regional Victoria, tourism was worth $8.1 billion to the economy (in GRP) and generated employment of 92,400 people in 2017-18. Tourism was worth a total of $16.7 billion to Melbourne (in GRP) and generated employment of 130,000 people (directly and indirectly).
HOW DO I READ THIS TABLE?• In 2017-18, direct tourism GRP in Melbourne was worth $8.7 billion (↑ 8.4% compared to 2016-17). This was 2.6%
of the region’s total direct GRP.• Indirect tourism GRP was worth an extra $8.0 billion to Melbourne’s economy• So, in 2017-18, tourism (both direct and indirect) was worth $16.7 billion to Melbourne’s economy.
Source: Tourism Research Australia’s Regional TSA model 2017-18
What is tourism consumption? • The total value of goods and services consumed by domestic and international
visitors in Australia
What is direct contribution? • Money spent directly in the tourism industry – without a tourism industry this money
wouldn’t be generated, or these people wouldn’t be employed.
What is indirect contribution? • The flow-on effect of the tourism industry. In Melbourne, every dollar spent in the
tourism industry created additional value elsewhere in the economy.
Why do we use GVA? • GVA allows easier comparisons across industries. GVA is equal to GDP/GRP minus
taxes. 2
Victoria’s Regions – Summary Results 2017-18
2017-18 Change on 2016-17
2017-18 Change on 2016-17
Tourism GVA ($M)
Direct 8,068 8.4% 3,686 6.8%Indirect 6,969 8.2% 3,540 5.5%Total tourism GVA 15,037 8.3% 7,225 6.1%Total region GVA 312,916 4.8% 88,379 4.0%Tourism's direct share of region GVA 2.6% 0.1% pts 4.2% 0.1% pts
Tourism GRP ($M)
Direct 8,681 8.4% 4,040 6.8%Indirect 8,047 7.3% 4,092 4.7%Total tourism GRP 16,729 7.9% 8,132 5.7%Total region GRP 335,693 5.3% 94,811 4.5%Tourism's direct share of region GRP 2.6% 0.1% pts 4.3% 0.1% pts
Direct 86.4 6.1% 69.5 4.7%Indirect 43.6 8.4% 22.9 5.9%Total tourism employment 130.0 6.8% 92.4 5.0%Total region employment 2,334.1 2.8% 917.1 2.8%Tourism's direct share of region employment 3.7% 0.1% pts 7.6% 0.1% pts
Melbourne Regional Victoria
Tourism Employment (‘000 persons)

Figure 2. Share of Direct Regional Tourism GVA • In 2017-18, the non-metropolitan regions with the
greatest proportion of direct GVA attributable tointernational overnight visitors to Victoria wereGeelong and the Bellarine (27%), Yarra Valley and theDandenong Ranges (22%) and Mornington Peninsula(20%).
• In 2017-18, the non-metropolitan regions with thegreatest proportion of direct GVA attributable todomestic (overnight and daytrip) visitors to and withinVictoria were Phillip Island (93%), Victoria’s HighCountry (93%), Daylesford and Macedon Ranges (90%)and the Grampians (89%).
• Overall, 85 per cent of regional Victoria’s direct tourismGVA was attributable to domestic visitors and 15 percent to international overnight visitors.
• Forty-three per cent (43%) of Melbourne’s directtourism GVA was attributable to international overnightvisitors and 57 per cent to domestic visitors.
Figure 1. Share of Regional Consumption by Visitor Segment
Almost half (46%) of tourism consumption in Melbourneduring 2017-18 was by international overnight visitors tothe state, while these visitors accounted for only six percent of tourism consumption in regional Victoria.
3
Figure 3. Industry Share of Direct Tourism GVA –Victoria’s Top 5 Sectors*
Intrastate overnight visitors travelling within Victoriaaccounted for more than half (52%) of tourismconsumption in regional Victoria during 2017-18, butaccounted for only ten per cent of tourism consumptionin Melbourne.
* Note: see ‘Appendix B – Notes’ for aggregated industry sector definitions
Consumption
Gross Value Added (GVA)
2017-18 Regional Tourism Satellite Accounts
• The five industry sectors that made the highesteconomic contribution to Victoria are noted in figure 3.
• Accommodation was the top contributing sector inVictoria at $2.2 billion, or 19 per cent of the state’sdirect tourism GVA.
• In regional Victoria, food services made the highestcontribution to direct tourism GVA, at $838 million or23 per cent of direct GVA.
• In Melbourne, transport (20%) and accommodation(19%) made the greatest contribution to direct tourismGVA (worth $1.6 billion and $1.5 billion respectively).
$9,278 M (46%)
$822 M(6%)
$10,100 M (31%)
$6,396 M (32%)
$1,877 M (14%)
$8,272 M (25%)
$1,960 M(10%)
$6,791 M (52%)
$8,750 M (26%)
$2,333 M(12%)
$3,576 M (27%)
$5,909 M (18%)
0% 10% 20% 30% 40% 50% 60% 70% 80% 90% 100%
Melbourne
RegionalVictoria
Victoria
International overnight Interstate Overnight Intrastate Overnight Daytrips
$33.0b
$13.1b
$20.0b
90%
73%
86%
84%
89%
86%
57%
80%
87%
93%
93%
78%
85%
66%
10%
27%
14%
16%
11%
14%
43%
20%
13%
7%
7%
22%
15%
34%
0% 20% 40% 60% 80% 100%
Daylesford and the Macedon Ranges
Geelong and the Bellarine
Gippsland
Goldfields
Grampians
Great Ocean Road
Melbourne
Mornington Peninsula
Murray
Phillip Island
Victoria's High Country
Yarra Valley and Dandenong Ranges
Regional Victoria
Total Victoria
Domestic International overnight19%
18%
16%
14%
12%
18%
15%
23%
7%
16%
19%
20%
12%
17%
11%
0% 5% 10% 15% 20% 25%
Accommodation
Transport
Food Services
Education and training
Retail Trade
Victoria Regional Victoria Melbourne

Direct Employment by Region
• Phillip Island is the tourism region with thegreatest reliance on tourism. For Phillip Island,tourism represents 17.6 per cent of direct GRP,17.3 per cent of direct GVA and 26.3 per cent ofdirect employment in the region.
• Victoria’s High Country is the tourism region withthe second highest reliance on tourism, withtourism representing 11.0 per cent of direct GRP,10.9 per cent of direct GVA and 18.8 per cent ofdirect employment in the region.
• Melbourne is the region least reliant on tourism,with tourism representing 2.6 per cent of directGRP, 2.6 per cent of direct GVA and 3.7 per centof direct employment.
In 2017-18, the non-metropolitan regions thatcontributed the most (number of employed persons)to Victoria’s direct tourism employment were:
o Murray (9,900 jobs or 6.3 per cent of directtourism employment).
o Great Ocean Road (8,700 jobs or 5.6 per centof direct tourism employment).
o Mornington Peninsula (7,900 jobs or 5.0 percent of direct tourism employment).
o Victoria’s High Country (7,800 jobs or 5.0 percent of direct tourism employment).
• Melbourne contributed 55.4 per cent of thestate’s direct tourism employment, or 86,400jobs.
• Regional Victoria contributed 44.6 per cent of thestate’s direct tourism employment, or 69,500jobs.
4
Direct GRP by Region
The non-metropolitan regions that contributed themost ($ volume) to Victoria’s direct tourism GRPwere:
o Murray ($534 million or 4.2 per cent of directtourism GRP).
o Great Ocean Road ($513 million or 4.0 percent of direct tourism GRP).
o Mornington Peninsula ($501 million or 3.9 percent of direct tourism GRP).
• Melbourne contributed 68.2 per cent of the state’sdirect tourism GRP, or $8.7 billion.
• Regional Victoria contributed 31.8 per cent of thestate’s direct tourism GRP, or $4.0 billion.
Significance of Tourism to Victoria's Regions
Regional Contribution to Tourism GrossRegional Product (GRP) in Victoria
Regional Contribution to Tourism Employment
Direct Share of the Regional Economy (ranked by GRP share)
2017-18 Regional Tourism Satellite Accounts
Tourism Region GRP GVA Jobs
1 Phillip Island 17.6% 17.3% 26.3%
2 Victoria's High Country 11.0% 10.9% 18.8%
3 Great Ocean Road 7.4% 7.3% 13.0%
4 Daylesford and the Macedon Ranges 5.1% 5.0% 11.3%
5 Mornington Peninsula 4.4% 4.3% 6.9%
6 Yarra Valley and Dandenong Ranges 3.5% 3.4% 5.7%
7 Murray 3.5% 3.5% 6.6%
8 Gippsland 3.2% 3.1% 6.3%
9 Geelong and the Bellarine 3.1% 3.0% 5.1%
10 Grampians 3.1% 3.1% 7.1%
11 Goldfields 3.1% 3.0% 5.2%
12 Melbourne 2.6% 2.6% 3.7%
Regional Victoria 4.3% 4.2% 7.6%
Total Victoria 3.0% 2.9% 4.8%
Rank # Region GRP ($M)GRP share of Victoria (%)
1 Melbourne 8,681 68.2%2 Murray 534 4.2%3 Great Ocean Road 513 4.0%4 Mornington Peninsula 501 3.9%5 Victoria's High Country 445 3.5%6 Goldfields 425 3.3%7 Geelong and the Bellarine 415 3.3%8 Gippsland 403 3.2%9 Yarra Valley and Dandenong Ranges 329 2.6%10 Phillip Island 200 1.6%11 Daylesford and the Macedon Ranges 143 1.1%12 Grampians 131 1.0%
Regional Victoria (total) 4,040 31.8%Victoria (total) 12,721 100.0%
Rank # RegionJobs
(000s)Jobs share of
VIC (%)
1 Melbourne 86.4 55.4%
2 Murray 9.9 6.3%
3 Great Ocean Road 8.7 5.6%
4 Mornington Peninsula 7.9 5.0%
5 Victoria's High Country 7.8 5.0%
6 Gippsland 6.9 4.5%
7 Goldfields 6.9 4.4%
8 Geelong and the Bellarine 6.2 4.0%
9 Yarra Valley and Dandenong Ranges 5.6 3.6%
10 Daylesford and the Macedon Ranges 3.5 2.2%
11 Phillip Island 3.2 2.1%
12 Grampians 3.0 1.9%
Regional Victoria (total) 69.5 44.6%
Victoria (total) 155.9 100.0%

43575446
Part-time
Full-time
Direct Tourism Employment – Full-time/Part-time
Melbourne
5
The proportion of full-time jobs was highest inMelbourne (54% of direct tourism jobs), reflectingthe high concentration of tourism consumption inthe education and transport sectors.
In regional Victoria, 43 per cent of tourism employees were infull-time jobs and 57 per cent in part-time employment. Thehigh proportion of part-time employment reflects strongtourism consumption in traditional sectors such as food,accommodation and retail, which have a higher demand forpart-time workers.
Direct Tourism Employment by Industry
• Cafes, restaurants and take-away food services contributed the most to direct tourism employment in Victoria in 2017-18, with a 21.8 per cent share of direct tourism employment in Melbourne and a 35.7 per cent share in regional Victoria.
• Melbourne’s other top industry contributors to direct tourism employment included retail trade (16.0%), education and training (15.0%) and accommodation (11.3%).
• Regional Victoria’s other top industry contributors to direct tourism employment included retail trade (15.6%), accommodation (14.7%), and clubs, pubs, taverns and bars (6.8%).
2017-18 Regional Tourism Satellite Accounts
Regional Victoria
Part-time
Full-time
Full-Time('000)
Part-Time('000)
Total('000) Share (%)
Cafes, restaurants and takeaway food services 6.6 12.2 18.8 21.8%Retail trade 6.4 7.4 13.8 16.0%Education and training 7.6 5.4 13.0 15.0%Accommodation 5.6 4.2 9.7 11.3%Air, water and other transport 4.6 1.6 6.3 7.3%Travel agency and tour operator services 4.4 1.5 5.9 6.9%Other sports and recreation services 2.0 2.5 4.4 5.1%Clubs, pubs, taverns and bars 1.8 2.2 4.0 4.7%Road transport and transport equipment rental 3.0 0.8 3.8 4.4%All other industries 2.2 0.9 3.0 3.5%Cultural services 1.4 1.1 2.4 2.8%Casinos and other gambling services 0.5 0.3 0.8 0.9%Rail transport 0.3 0.0 0.3 0.4%Direct tourism employment 46.3 40.1 86.4 100.0%
Full-Time('000)
Part-Time('000)
Total('000) Share (%)
Cafes, restaurants and takeaway food services 7.7 17.1 24.8 35.7%Retail trade 4.3 6.5 10.8 15.6%Accommodation 4.8 5.4 10.2 14.7%Clubs, pubs, taverns and bars 1.9 2.8 4.7 6.8%Education and training 2.2 1.7 3.9 5.6%Travel agency and tour operator services 2.0 1.3 3.4 4.8%Other sports and recreation services 1.4 1.7 3.2 4.5%Air, water and other transport 1.7 0.8 2.5 3.6%Road transport and transport equipment rental 1.7 0.6 2.2 3.2%All other industries 1.1 0.7 1.8 2.5%Cultural services 1.0 0.8 1.8 2.5%Casinos and other gambling services 0.1 0.1 0.2 0.2%Rail transport 0.1 0.0 0.1 0.1%Direct tourism employment 29.9 39.6 69.5 100.0%
Regional Victoria
Industry
Melbourne
Industry
Figure 4.

Appendix A – Victoria’s Tourism Regions
6
Appendix B – Notes
Methodology
The Regional Tourism Satellite Account (RTSA) estimates of the value of tourism to Victoria’s tourism regions wereproduced by Tourism Research Australia.
Tourism Satellite Accounts (TSAs) are used to estimate the contribution of tourism to a region by combining thecontributions of the various goods and services that make up the industry. The regional, state and national directestimates are based on an internationally recognised and standardised framework (although this RTSAmethodology has been extended to determine the indirect impact of cross region trade flows).
There are a number of steps required to calculate the tourism industry’s contribution to regional Victorianeconomies. To start, a regional tourism consumption bundle is derived from TRA visitor survey data and adjusted toremove any price effects that are not directly attributed to the seller of the good or service (e.g. taxes, transportmargins, pre-manufactured inputs, etc). The direct and indirect contributions of tourism are estimated by usingregional input-output multiplier tables, derived from Australian Bureau of Statistics data.
Revisions to time-series dataRevisions to the time-series have generated estimates which are different to the results produced in previous yearsand are not comparable to the previous series. This version takes into account a number of revisions in the sourcedata and the underlying methodology. Key revisions in this issue includes the following:• Changes to ABS National Accounts data. • Changes to Regional expenditure data (REX) by TRA.• Updated data for total employment and population in the regions from 2011 to 2016 using the latest census data.• Building tourism regions using SA2 rather than LGAs, which is a better fit with the official definitions. • Updated model parameters reflecting structural changes to the economy as measured by the Australian Bureau
of Statistics (ABS) national accounts. This ‘re-benchmarking’ process is conducted every three years, as part of the national, state and regional tourism satellite accounting. Under the re-benchmarking process, the key multipliers have been updated from the 2012-13 Australian Bureau of Statistics (ABS) Input-Output (I-O) tables, to the 2016-17 I-O models, consistent with the recent update to the national TSA model (to note: the multipliers describe the relationship between: tourism consumption and output, tourism output and direct gross value added, tourism output and indirect gross value added).
• More information can be found on the TRA website: https://www.tra.gov.au/Research/Economics-and-the-tourism-industry/economic-reports
2017-18 Regional Tourism Satellite Accounts

7
• All results in this model have been calibrated back against the 2017-18 state TSA data for Victoria to ensureconsistency, as for other jurisdictions. Historical data has been generated back to 2008-09 using the samemethodology to assess performance over time and ensure like-for-like comparisons.
• It is therefore important that these results are not compared to previously released regional TSA estimates. Resultsshould also not be compared to alternative studies that are not based on the same methodology.
• Due to rounding effects, there may be small discrepancies when comparing outputs from the RTSA with the STSA, orin calculating totals from summing components of the RTSA.
2017-18 Regional Tourism Satellite Accounts
Data smoothing of estimates for smaller regionsUnderpinning these RSTA estimates are spend data from the International Visitor Survey (IVS) and National VisitorSurvey (NVS). As some tourism regions do receive lower levels of visitation, the spend data from the IVS and NVS is verylimited, making RTSA estimates less reliable. The lack of reliable data for these regions means:• economic and employment measures will be subject to more variability from year to year• variability in these measures is more likely due to limitations in the data rather than any change in visitation to the
region• the underlying growth trend is more difficult to identify.
A way of addressing these issues is to smooth the data using a simple and consistent approach. For example, the smoothed GVA estimate for 2017–18 would be the average of the original estimates for GVA for 2015–16, 2016–17 and 2017–18.
Victoria’s tourism sub-regions affected by smoothing include Wimmera, Western Grampians, Macedon, Spa country, Central Highlands, Upper Yarra, Murray East.
For more detailed information on the data smoothing approach please visit the TRA website: https://www.tra.gov.au/Research/Economics-and-the-tourism-industry/economic-reports
More InformationFor more detail on the Regional Tourism Satellite Accounts 2017-18, published by Tourism Research Australia, refer toreports and excel data files at this link:https://www.tra.gov.au/Research/Economics-and-the-tourism-industry/economic-reports
For further information on the methodology and key concepts for the Victorian Regional Tourism Satellite Accounts2017-18, please refer to the Regional Tourism Satellite Account User Guide at this link:http://www.business.vic.gov.au/tourism-industry-resources/research/economic-significance
For more detail on the State Tourism Satellite Accounts 2017-18, published by Tourism Research Australia, refer to thefull report:https://www.tra.gov.au/research/view-all-publications/all-publications/economic-reports/state-tourism-satellite-accounts-2017-18
For further information on the ABS published tourism region boundaries, refer to the ABS website:http://www.abs.gov.au/AUSSTATS/[email protected]/Lookup/9503.0.55.001Main+Features12016?OpenDocument

8
Definitions
Direct contribution of tourism: The contribution generated by transactions between the visitor and producer for agood or service that involves a direct physical or economic relationship.
Indirect contribution of tourism: The subsequent flow-on effects created by the requirement for inputs from thoseindustries supplying goods and services to visitors. For example, this might include the fresh produce supplied to ahotel and the electricity used.
Tourism gross regional product (GRP): Tourism GRP (the equivalent to Gross State Product (GSP) but at a regionallevel) is tourism GVA plus net taxes on products that are attributable to the tourism industry. As such GRP will generallyhave a higher value than GVA. Tourism GRP is a satellite accounting concept that enables direct comparison with thewidely recognised national accounting aggregate, gross domestic product (or in this case gross regional product).
Tourism gross value added (GVA): Considered the most accurate measure of the contribution of the industry to theeconomy. It includes the total labour income and capital revenue received by the industry and the net taxes thatgovernment received from the production. This measure is directly comparable with the value added of ‘conventional’industries such as mining and manufacturing and can also be used for comparisons across countries.
Tourism employment: Refers to the persons employed in tourism-related industries. Those are industries that wouldeither cease to exist in their present form, or would be significantly affected if tourism were to cease.
Tourism consumption: The total value of goods and services consumed by domestic and international visitors in aregion. It includes imputed non-market transactions such as estimated rental value of accommodation in self-ownedholiday homes; cost to households of food and alcohol in hosting visiting friends and relatives;
Tourism output: The total value of goods and services produced in Australia to satisfy visitor consumption. It ismeasured in basic prices, so it excludes net taxes on tourism products.
Tourism Industry Sectors for GVA: Tourism characteristic industries are defined as those that would either cease toexist in their present form or be significantly affected if tourism were to cease. In the Australian TSA, for an industry tobe a country-specific tourism characteristic industry, at least 25 per cent of its output must be consumed by visitors.Tourism connected industries are those industries not classified as characteristic that have products that areconsumed by visitors in volumes that are significant (e.g. Education and training).There are 17 different tourism-related industries that make up tourism, 15 of which have been grouped into tourismindustry sectors, as displayed in the table below.
2017-18 Regional Tourism Satellite Accounts
Tourism Industry Sector Tourism Characteristic Industry Tourism Connected Industry
Accommodation AccommodationOwnership of dwellings
Food services Cafes, restaurants and takeaway food servicesClubs, pubs restaurants and taverns
Transport Rail transportTaxi transportOther road transportAir, water and other transportMotor vehicle hiring
Education and training Education and training
Retail trade Automotive fuel retailingOther retail trade
Recreational activities Cultural servicesCasino and gambling servicesOther sports and recreation services
Other tourism industries
Travel agency and tour operator services
All other industries

9
Appendix C – Detailed RTSA estimatesKey Indicators Of Tourism’s Total Contribution To Victoria’s Tourism Regions 2017-18
Source Regional TSA model 2017-18, Tourism Research Australia, Canberra, December 2019 .
2017-18 Regional Tourism Satellite Accounts
GRP GVA Employment
Tourism Region ($M)
Share of economy (%) ($M)
Share of economy (%) ('000)
Share of economy (%)
Direct tourism contributionMelbourne 8,681$ 2.6% 8,068$ 2.6% 86.4 3.7%Daylesford and the Macedon Ranges 143$ 5.1% 131$ 5.0% 3.5 11.3%Geelong and the Bellarine 415$ 3.1% 377$ 3.0% 6.2 5.1%Gippsland 403$ 3.2% 369$ 3.1% 6.9 6.3%Goldfields 425$ 3.1% 384$ 3.0% 6.9 5.2%Grampians 131$ 3.1% 121$ 3.1% 3.0 7.1%Great Ocean Road 513$ 7.4% 469$ 7.3% 8.7 13.0%Mornington Peninsula 501$ 4.4% 452$ 4.3% 7.9 6.9%Murray 534$ 3.5% 490$ 3.5% 9.9 6.6%Phillip Island 200$ 17.6% 183$ 17.3% 3.2 26.3%Victoria's High Country 445$ 11.0% 412$ 10.9% 7.8 18.8%Yarra Valley and Dandenong Ranges 329$ 3.5% 296$ 3.4% 5.6 5.7%Regional Victoria $ 4,040 4.3% $ 3,686 4.2% 69.5 7.6%Victoria 12,721$ 3.0% 11,754$ 2.9% 155.9 4.8%Indirect tourism contribution Melbourne 8,047$ 2.4% 6,969$ 2.2% 43.6 1.9%Daylesford and the Macedon Ranges 140$ 5.0% 121$ 4.6% 0.8 2.5%Geelong and the Bellarine 403$ 3.0% 349$ 2.8% 2.3 1.9%Gippsland 410$ 3.3% 355$ 3.0% 2.3 2.1%Goldfields 454$ 3.3% 393$ 3.0% 2.5 1.9%Grampians 136$ 3.2% 118$ 3.0% 0.8 1.8%Great Ocean Road 547$ 7.9% 473$ 7.4% 3.1 4.6%Mornington Peninsula 510$ 4.5% 442$ 4.2% 2.8 2.5%Murray 556$ 3.6% 481$ 3.4% 3.1 2.1%Phillip Island 195$ 17.1% 168$ 15.9% 1.1 8.7%Victoria's High Country 459$ 11.4% 397$ 10.5% 2.6 6.2%Yarra Valley and Dandenong Ranges 281$ 3.0% 243$ 2.8% 1.6 1.6%Regional Victoria 4,092$ 4.3% 3,540$ 4.0% 22.9 2.5%Victoria (internal contribution only)1 12,139$ 2.8% 10,509$ 2.6% 66.5 2.0%Rest of Australia 1,771$ NA 1,531$ NA 9.7 NAVictoria (reported STSA estimates)2 13,910$ 3.2% 12,039$ 3.0% 76.1 2.3%Total tourism contributionMelbourne 16,729$ 5.0% 15,037$ 4.8% 130.0 5.6%Daylesford and the Macedon Ranges 283$ 10.1% 252$ 9.6% 4.2 13.8%Geelong and the Bellarine 819$ 6.1% 726$ 5.8% 8.5 7.0%Gippsland 813$ 6.5% 723$ 6.2% 9.2 8.4%Goldfields 880$ 6.3% 777$ 6.0% 9.4 7.1%Grampians 267$ 6.3% 239$ 6.1% 3.7 8.9%Great Ocean Road 1,059$ 15.4% 942$ 14.7% 11.8 17.6%Mornington Peninsula 1,011$ 8.9% 894$ 8.4% 10.7 9.4%Murray 1,090$ 7.2% 971$ 6.8% 13.0 8.7%Phillip Island 395$ 34.7% 352$ 33.1% 4.3 35.0%Victoria's High Country 905$ 22.4% 809$ 21.5% 10.4 24.9%Yarra Valley and Dandenong Ranges 610$ 6.6% 540$ 6.2% 7.2 7.3%Regional Victoria 8,132$ 8.6% 7,225$ 8.2% 92.4 10.1%Victoria (internal contribution only)1 24,861$ 5.8% 22,263$ 5.5% 222.4 6.8%Rest of Australia 1,771$ NA 1,531$ NA 9.7 NAVictoria (reported STSA estimates)2 26,632$ 6.2% 23,793$ 5.9% 232.1 7.1%
Notes on the data1 A small portion of the indirect contribution of tourism is allocated to the ‘rest of Australia’ where the economic benefits of visitorspend in Victoria flow to other states and territories (eg. where a tourism business in Victoria uses interstate suppliers). The larger,remaining portion of the indirect contribution of tourism represents the economic benefits to and within Victoria.2 These estimates may differ from the previously published data in the 2017-18 State Tourism Satellite Accounts and 2016-17 RegionalTourism Satellite Accounts, by Tourism Research Australia.- Back cast estimates from 2008-09 to 2017-18 in the table above are based on the same methodology and are comparable. - AAG –Average Annual Growth

10
Victoria’s tourism regions 2008-09 to 2017-18 - GRP ($millions)
2017-18 Regional Tourism Satellite Accounts
Source Regional TSA model 2017-18, Tourism Research Australia, Canberra, December 2019 .
2008-09 2009-10 2010-11 2011-12 2012-13 2013-14 2014-15 2015-16 2016-17 2017-18 AAG*
2012-13 to 2017-18
% Change 2016-17 vs
2017-18
%Direct tourism contributionMelbourne 4,995 5,004 5,366 5,796 6,018 6,304 6,755 7,440 8,007 8,681 7.6% 8.4%Daylesford and the Macedon Ranges 84 93 95 94 96 101 109 119 131 143 8.3% 9.4%Geelong and the Bellarine 262 284 261 277 290 305 338 366 400 415 7.5% 3.7%Gippsland 269 292 321 303 361 369 361 360 402 403 2.2% 0.2%Goldfields 272 265 299 322 335 357 366 357 407 425 4.9% 4.5%Grampians 80 79 87 88 97 100 108 109 121 131 6.3% 8.6%Great Ocean Road 357 338 344 364 350 407 414 421 485 513 7.9% 5.7%Mornington Peninsula 268 285 303 293 325 323 369 402 449 501 9.0% 11.5%Murray 342 369 369 369 431 438 459 453 492 534 4.4% 8.5%Phillip Island 154 155 146 163 200 183 164 195 212 200 0.0% -5.5%Victoria's High Country 265 267 291 289 292 272 348 343 360 445 8.8% 23.7%Yarra Valley and Dandenong Ranges 204 212 240 224 241 280 254 293 324 329 6.4% 1.6%Regional Victoria 2,559 2,639 2,756 2,787 3,018 3,135 3,290 3,418 3,783 4,040 6.0% 6.8%Victoria 7,553 7,643 8,123 8,582 9,036 9,439 10,044 10,858 11,791 12,721 7.1% 7.9%Indirect tourism contribution Melbourne 4,885 5,071 5,287 5,799 5,894 6,038 6,311 6,864 7,498 8,047 6.4% 7.3%Daylesford and the Macedon Ranges 88 95 96 96 96 101 105 115 127 140 7.7% 9.7%Geelong and the Bellarine 278 319 279 295 300 311 337 360 406 403 6.1% -0.6%Gippsland 296 334 361 336 398 400 376 368 426 410 0.6% -3.8%Goldfields 308 313 344 375 382 389 401 381 441 454 3.5% 3.1%Grampians 87 86 93 95 102 105 113 114 126 136 6.0% 8.0%Great Ocean Road 411 399 399 419 392 451 441 450 525 547 6.9% 4.0%Mornington Peninsula 280 314 324 312 343 335 372 406 463 510 8.3% 10.1%Murray 378 425 415 408 477 476 485 468 516 556 3.1% 7.9%Phillip Island 166 173 155 175 217 189 157 191 215 195 -2.2% -9.5%Victoria's High Country 288 300 319 315 309 277 353 344 369 459 8.3% 24.4%Yarra Valley and Dandenong Ranges 186 200 227 210 217 260 218 261 291 281 5.3% -3.6%Regional Victoria 2,764 2,958 3,012 3,038 3,231 3,292 3,358 3,459 3,907 4,092 4.8% 4.7%Victoria (internal contribution only)1 7,650 8,028 8,299 8,837 9,126 9,330 9,669 10,324 11,405 12,139 5.9% 6.4%Rest of Australia 1,120 1,174 1,204 1,285 1,337 1,366 1,416 1,504 1,671 1,771 5.8% 6.0%Victoria (reported STSA estimates)2 8,770 9,202 9,503 10,121 10,462 10,696 11,085 11,828 13,076 13,910 5.9% 6.4%Total tourism contributionMelbourne 9,880 10,075 10,653 11,595 11,912 12,342 13,066 14,304 15,505 16,729 7.0% 7.9%Daylesford and the Macedon Ranges 172 188 191 191 193 202 214 234 258 283 8.0% 9.5%Geelong and the Bellarine 540 603 540 572 589 617 675 726 806 819 6.8% 1.5%Gippsland 565 626 682 638 758 769 737 729 828 813 1.4% -1.8%Goldfields 580 579 643 697 717 745 767 738 848 880 4.2% 3.7%Grampians 166 165 181 184 199 204 222 223 247 267 6.1% 8.3%Great Ocean Road 768 737 742 783 742 858 855 872 1,010 1,059 7.4% 4.8%Mornington Peninsula 548 599 627 605 668 658 741 808 913 1,011 8.6% 10.8%Murray 720 794 784 778 908 914 944 921 1,008 1,090 3.7% 8.2%Phillip Island 320 328 302 338 417 372 321 386 427 395 -1.1% -7.5%Victoria's High Country 553 567 609 604 601 549 701 687 730 905 8.5% 24.0%Yarra Valley and Dandenong Ranges 391 412 468 435 458 540 472 553 615 610 5.9% -0.8%Regional Victoria 5,323 5,597 5,768 5,824 6,249 6,427 6,648 6,878 7,690 8,132 5.4% 5.7%Victoria (internal contribution only)1 15,203 15,671 16,421 17,419 18,162 18,769 19,714 21,182 23,196 24,861 6.5% 7.2%Rest of Australia 1,120 1,174 1,204 1,285 1,337 1,366 1,416 1,504 1,671 1,771 5.8% 6.0%Victoria (reported STSA estimates)2 16,323 16,845 17,626 18,704 19,498 20,135 21,129 22,686 24,867 26,632 6.4% 7.1%
Tourism Gross Regional Product
Tourism Region $ millions - basic prices % p.a.
Notes on the data1 A small portion of the indirect contribution of tourism is allocated to the ‘rest of Australia’ where the economic benefits of visitorspend in Victoria flow to other states and territories (eg. where a tourism business in Victoria uses interstate suppliers). The larger,remaining portion of the indirect contribution of tourism represents the economic benefits to and within Victoria.2 These estimates may differ from the previously published data in the 2017-18 State Tourism Satellite Accounts and 2016-17 RegionalTourism Satellite Accounts, by Tourism Research Australia.- Back cast estimates from 2008-09 to 2017-18 in the table above are based on the same methodology and are comparable. - AAG –Average Annual Growth

11
Victoria’s tourism regions 2008-09 to 2017-18 - GRP Share of Economy (%)
2017-18 Regional Tourism Satellite Accounts
Source Regional TSA model 2017-18, Tourism Research Australia, Canberra, December 2019 .
2008-09 2009-10 2010-11 2011-12 2012-13 2013-14 2014-15 2015-16 2016-17 2017-18 Change
2012-13 to 2017-18
Change 2016-17 vs
2017-18
Direct tourism contributionMelbourne 2.2% 2.1% 2.1% 2.2% 2.3% 2.3% 2.3% 2.5% 2.5% 2.6% 0.3% 0.1%Daylesford and the Macedon Ranges 4.4% 4.6% 4.3% 4.2% 4.1% 4.3% 4.3% 4.7% 4.9% 5.1% 1.0% 0.3%Geelong and the Bellarine 2.9% 3.0% 2.6% 2.6% 2.7% 2.7% 2.9% 3.0% 3.2% 3.1% 0.4% 0.0%Gippsland 3.1% 3.2% 3.2% 3.0% 3.4% 3.5% 3.2% 3.2% 3.4% 3.2% -0.2% -0.2%Goldfields 2.8% 2.6% 2.8% 2.9% 3.0% 3.0% 3.0% 2.8% 3.1% 3.1% 0.1% 0.0%Grampians 2.7% 2.6% 2.5% 2.5% 2.7% 2.8% 2.8% 2.9% 3.0% 3.1% 0.4% 0.1%Great Ocean Road 7.6% 6.7% 6.3% 6.5% 6.0% 6.9% 6.7% 6.8% 7.3% 7.4% 1.4% 0.1%Mornington Peninsula 3.5% 3.5% 3.5% 3.3% 3.5% 3.4% 3.7% 3.9% 4.1% 4.4% 0.9% 0.3%Murray 3.3% 3.3% 3.1% 3.0% 3.4% 3.4% 3.4% 3.3% 3.4% 3.5% 0.1% 0.1%Phillip Island 20.3% 19.2% 16.9% 18.1% 21.4% 19.1% 16.2% 18.9% 19.3% 17.6% -3.8% -1.7%Victoria's High Country 9.6% 9.0% 9.1% 8.7% 8.6% 7.9% 9.6% 9.4% 9.3% 11.0% 2.4% 1.7%Yarra Valley and Dandenong Ranges 3.3% 3.2% 3.4% 3.0% 3.1% 3.6% 3.1% 3.5% 3.6% 3.5% 0.4% -0.1%Regional Victoria 4.0% 3.9% 3.7% 3.7% 3.8% 3.9% 3.9% 4.0% 4.2% 4.3% 0.4% 0.1%Victoria 2.6% 2.5% 2.5% 2.6% 2.6% 2.6% 2.7% 2.8% 2.9% 3.0% 0.3% 0.1%Indirect tourism contribution Melbourne 2.2% 2.2% 2.1% 2.2% 2.2% 2.2% 2.2% 2.3% 2.4% 2.4% 0.2% 0.0%Daylesford and the Macedon Ranges 4.6% 4.7% 4.4% 4.3% 4.1% 4.2% 4.2% 4.5% 4.7% 5.0% 0.8% 0.3%Geelong and the Bellarine 3.1% 3.4% 2.8% 2.8% 2.8% 2.8% 2.9% 3.0% 3.2% 3.0% 0.2% -0.2%Gippsland 3.4% 3.6% 3.6% 3.3% 3.8% 3.8% 3.4% 3.2% 3.6% 3.3% -0.5% -0.3%Goldfields 3.2% 3.1% 3.2% 3.4% 3.4% 3.3% 3.3% 3.0% 3.3% 3.3% -0.1% -0.1%Grampians 3.0% 2.8% 2.7% 2.7% 2.8% 2.9% 2.9% 3.0% 3.1% 3.2% 0.4% 0.1%Great Ocean Road 8.7% 8.0% 7.3% 7.4% 6.7% 7.7% 7.1% 7.3% 7.9% 7.9% 1.2% 0.0%Mornington Peninsula 3.7% 3.9% 3.8% 3.5% 3.7% 3.5% 3.7% 3.9% 4.3% 4.5% 0.8% 0.2%Murray 3.6% 3.8% 3.5% 3.3% 3.7% 3.7% 3.6% 3.4% 3.5% 3.6% -0.1% 0.1%Phillip Island 21.8% 21.4% 17.9% 19.4% 23.2% 19.7% 15.6% 18.6% 19.6% 17.1% -6.0% -2.5%Victoria's High Country 10.4% 10.2% 10.0% 9.6% 9.0% 8.0% 9.7% 9.4% 9.5% 11.4% 2.3% 1.9%Yarra Valley and Dandenong Ranges 3.0% 3.0% 3.2% 2.8% 2.8% 3.3% 2.6% 3.1% 3.2% 3.0% 0.2% -0.2%Regional Victoria 4.3% 4.3% 4.1% 4.0% 4.1% 4.1% 4.0% 4.0% 4.3% 4.3% 0.2% 0.0%Victoria (internal contribution only)1 2.7% 2.7% 2.6% 2.6% 2.6% 2.6% 2.6% 2.7% 2.8% 2.8% 0.2% 0.0%Rest of Australia NA NA NA NA NA NA NA NA NA NA 0.0% 0.0%Victoria (reported STSA estimates)2 3.0% 3.0% 2.9% 3.0% 3.0% 3.0% 3.0% 3.1% 3.2% 3.2% 0.2% 0.0%Total tourism contributionMelbourne 4.4% 4.3% 4.3% 4.5% 4.5% 4.4% 4.5% 4.7% 4.9% 5.0% 0.5% 0.1%Daylesford and the Macedon Ranges 9.0% 9.3% 8.7% 8.4% 8.3% 8.5% 8.5% 9.2% 9.6% 10.1% 1.8% 0.5%Geelong and the Bellarine 6.0% 6.4% 5.4% 5.5% 5.5% 5.6% 5.8% 6.0% 6.4% 6.1% 0.7% -0.2%Gippsland 6.5% 6.8% 6.8% 6.3% 7.2% 7.3% 6.6% 6.4% 6.9% 6.5% -0.7% -0.5%Goldfields 6.0% 5.8% 5.9% 6.3% 6.3% 6.4% 6.3% 5.8% 6.4% 6.3% 0.0% -0.1%Grampians 5.7% 5.3% 5.3% 5.2% 5.5% 5.7% 5.8% 5.9% 6.1% 6.3% 0.9% 0.3%Great Ocean Road 16.3% 14.7% 13.6% 13.9% 12.7% 14.6% 13.7% 14.1% 15.2% 15.4% 2.7% 0.2%Mornington Peninsula 7.2% 7.4% 7.3% 6.8% 7.3% 6.9% 7.4% 7.8% 8.4% 8.9% 1.6% 0.5%Murray 6.9% 7.2% 6.6% 6.3% 7.1% 7.1% 6.9% 6.7% 6.9% 7.2% 0.1% 0.2%Phillip Island 42.1% 40.5% 34.7% 37.5% 44.5% 38.8% 31.9% 37.5% 38.9% 34.7% -9.8% -4.2%Victoria's High Country 19.9% 19.2% 19.1% 18.3% 17.6% 15.8% 19.3% 18.8% 18.8% 22.4% 4.8% 3.6%Yarra Valley and Dandenong Ranges 6.2% 6.2% 6.6% 5.9% 6.0% 6.9% 5.7% 6.5% 6.8% 6.6% 0.6% -0.3%Regional Victoria 8.2% 8.2% 7.8% 7.7% 8.0% 8.0% 7.9% 8.0% 8.5% 8.6% 0.6% 0.1%Victoria (internal contribution only)1 5.3% 5.2% 5.1% 5.2% 5.3% 5.3% 5.3% 5.5% 5.7% 5.8% 0.5% 0.1%Rest of Australia NA NA NA NA NA NA NA NA NA NA 0.0% 0.0%Victoria (reported STSA estimates)2 5.7% 5.6% 5.4% 5.6% 5.7% 5.6% 5.7% 5.9% 6.1% 6.2% 0.5% 0.1%
Tourism Gross Regional Product
Tourism Region % Share of Economy % pts
Notes on the data1 A small portion of the indirect contribution of tourism is allocated to the ‘rest of Australia’ where the economic benefits of visitorspend in Victoria flow to other states and territories (eg. where a tourism business in Victoria uses interstate suppliers). The larger,remaining portion of the indirect contribution of tourism represents the economic benefits to and within Victoria.2 These estimates may differ from the previously published data in the 2017-18 State Tourism Satellite Accounts and 2016-17 RegionalTourism Satellite Accounts, by Tourism Research Australia.- Back cast estimates from 2008-09 to 2017-18 in the table above are based on the same methodology and are comparable. - AAG –Average Annual Growth

12
Victoria’s tourism regions 2008-09 to 2017-18 – GVA ($millions)
2017-18 Regional Tourism Satellite Accounts
Source Regional TSA model 2017-18, Tourism Research Australia, Canberra, December 2019 .
2008-09 2009-10 2010-11 2011-12 2012-13 2013-14 2014-15 2015-16 2016-17 2017-18 AAG*
2012-13 to 2017-18
% Change 2016-17 vs
2017-18
%
Direct tourism contributionMelbourne 4,575 4,585 4,945 5,202 5,569 5,841 6,251 6,907 7,441 8,068 7.7% 8.4%Daylesford and the Macedon Ranges 78 86 87 88 90 95 100 110 120 131 7.9% 9.1%Geelong and the Bellarine 239 261 238 265 266 281 310 335 364 377 7.2% 3.7%Gippsland 247 271 293 295 333 340 331 330 366 369 2.0% 0.7%Goldfields 248 242 274 306 307 326 334 325 370 384 4.6% 3.8%Grampians 75 74 81 83 92 94 101 101 111 121 5.7% 8.7%Great Ocean Road 331 318 317 363 325 377 383 385 446 469 7.6% 5.3%Mornington Peninsula 247 262 277 284 299 296 336 366 405 452 8.6% 11.7%Murray 316 343 340 359 401 405 424 418 454 490 4.1% 7.9%Phillip Island 143 144 135 167 184 169 151 179 194 183 -0.1% -5.3%Victoria's High Country 248 250 270 288 273 253 325 319 333 412 8.6% 23.8%Yarra Valley and Dandenong Ranges 185 192 218 207 221 256 229 263 290 296 6.0% 2.2%Regional Victoria 2,357 2,443 2,531 2,705 2,790 2,892 3,024 3,131 3,452 3,686 5.7% 6.8%Victoria 6,932 7,028 7,475 7,907 8,360 8,733 9,275 10,038 10,893 11,754 7.1% 7.9%Indirect tourism contribution Melbourne 4,193 4,282 4,528 4,848 5,014 5,200 5,485 5,989 6,442 6,969 6.8% 8.2%Daylesford and the Macedon Ranges 75 81 82 81 82 86 91 100 110 121 8.1% 9.6%Geelong and the Bellarine 239 269 239 247 255 268 292 314 349 349 6.5% 0.2%Gippsland 254 281 309 280 338 344 326 321 366 355 1.0% -3.0%Goldfields 264 265 294 314 325 335 348 332 378 393 3.9% 3.9%Grampians 74 73 80 81 86 89 98 99 109 118 6.4% 7.8%Great Ocean Road 353 336 341 350 333 388 383 393 451 473 7.3% 4.9%Mornington Peninsula 240 265 278 261 291 288 323 354 398 442 8.7% 11.0%Murray 324 359 355 341 405 409 421 408 443 481 3.5% 8.6%Phillip Island 142 146 133 146 185 162 137 167 185 168 -1.8% -8.8%Victoria's High Country 247 253 273 263 262 238 307 300 317 397 8.7% 25.3%Yarra Valley and Dandenong Ranges 160 169 194 176 184 223 189 227 251 243 5.7% -3.0%Regional Victoria 2,370 2,498 2,577 2,541 2,746 2,831 2,914 3,014 3,356 3,540 5.2% 5.5%Victoria (internal contribution only)1 6,563 6,780 7,104 7,388 7,760 8,030 8,399 9,003 9,798 10,509 6.3% 7.3%Rest of Australia 960 989 1,030 1,072 1,135 1,175 1,228 1,310 1,433 1,531 6.2% 6.8%Victoria (reported STSA estimates)2 7,523 7,769 8,134 8,461 8,895 9,205 9,627 10,313 11,231 12,039 6.2% 7.2%Total tourism contributionMelbourne 8,767 8,867 9,472 10,049 10,583 11,041 11,736 12,897 13,882 15,037 7.3% 8.3%Daylesford and the Macedon Ranges 153 167 169 170 171 180 191 210 230 252 8.0% 9.4%Geelong and the Bellarine 478 530 477 512 521 549 603 649 712 726 6.9% 2.0%Gippsland 500 553 602 575 671 684 657 651 732 723 1.5% -1.2%Goldfields 512 507 568 619 631 661 682 657 748 777 4.2% 3.8%Grampians 148 147 161 164 178 183 198 199 220 239 6.1% 8.3%Great Ocean Road 684 654 658 713 658 765 766 778 897 942 7.4% 5.1%Mornington Peninsula 487 527 554 545 591 584 659 720 803 894 8.6% 11.4%Murray 640 702 695 700 806 814 844 826 897 971 3.8% 8.3%Phillip Island 285 290 267 313 369 331 288 345 378 352 -1.0% -7.0%Victoria's High Country 495 503 543 551 535 491 631 619 650 809 8.6% 24.5%Yarra Valley and Dandenong Ranges 345 362 413 383 405 479 418 490 540 540 5.9% -0.2%Regional Victoria 4,727 4,941 5,107 5,246 5,537 5,723 5,938 6,145 6,808 7,225 5.5% 6.1%Victoria (internal contribution only)1 13,494 13,808 14,580 15,295 16,120 16,763 17,674 19,041 20,691 22,263 6.7% 7.6%Rest of Australia 960 989 1,030 1,072 1,135 1,175 1,228 1,310 1,433 1,531 6.2% 6.8%Victoria (reported STSA estimates)2 14,454 14,797 15,609 16,367 17,255 17,938 18,902 20,351 22,124 23,793 6.6% 7.5%
Tourism Gross Value Added
Tourism Region $ millions - basic prices % p.a.
Notes on the data1 A small portion of the indirect contribution of tourism is allocated to the ‘rest of Australia’ where the economic benefits of visitorspend in Victoria flow to other states and territories (eg. where a tourism business in Victoria uses interstate suppliers). The larger,remaining portion of the indirect contribution of tourism represents the economic benefits to and within Victoria.2 These estimates may differ from the previously published data in the 2017-18 State Tourism Satellite Accounts and 2016-17 RegionalTourism Satellite Accounts, by Tourism Research Australia.- Back cast estimates from 2008-09 to 2017-18 in the table above are based on the same methodology and are comparable. - AAG –Average Annual Growth
13
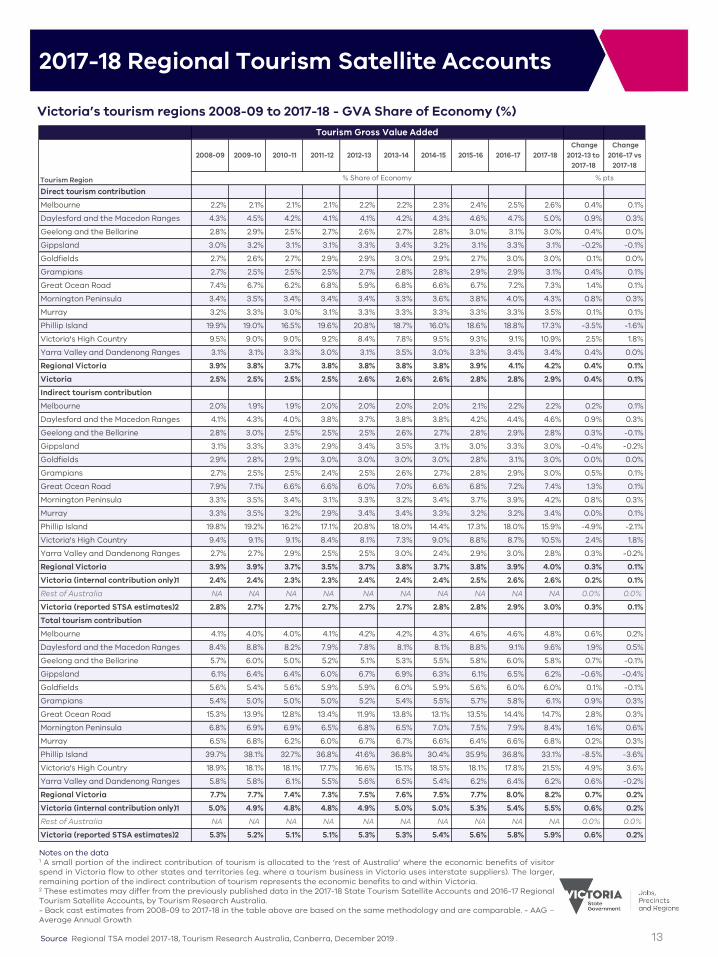
Victoria’s tourism regions 2008-09 to 2017-18 - GVA Share of Economy (%)
2017-18 Regional Tourism Satellite Accounts
Source Regional TSA model 2017-18, Tourism Research Australia, Canberra, December 2019 .
Notes on the data1 A small portion of the indirect contribution of tourism is allocated to the ‘rest of Australia’ where the economic benefits of visitorspend in Victoria flow to other states and territories (eg. where a tourism business in Victoria uses interstate suppliers). The larger,remaining portion of the indirect contribution of tourism represents the economic benefits to and within Victoria.2 These estimates may differ from the previously published data in the 2017-18 State Tourism Satellite Accounts and 2016-17 RegionalTourism Satellite Accounts, by Tourism Research Australia.- Back cast estimates from 2008-09 to 2017-18 in the table above are based on the same methodology and are comparable. - AAG –Average Annual Growth
2008-09 2009-10 2010-11 2011-12 2012-13 2013-14 2014-15 2015-16 2016-17 2017-18 Change
2012-13 to 2017-18
Change 2016-17 vs
2017-18
Direct tourism contributionMelbourne 2.2% 2.1% 2.1% 2.1% 2.2% 2.2% 2.3% 2.4% 2.5% 2.6% 0.4% 0.1%Daylesford and the Macedon Ranges 4.3% 4.5% 4.2% 4.1% 4.1% 4.2% 4.3% 4.6% 4.7% 5.0% 0.9% 0.3%Geelong and the Bellarine 2.8% 2.9% 2.5% 2.7% 2.6% 2.7% 2.8% 3.0% 3.1% 3.0% 0.4% 0.0%Gippsland 3.0% 3.2% 3.1% 3.1% 3.3% 3.4% 3.2% 3.1% 3.3% 3.1% -0.2% -0.1%Goldfields 2.7% 2.6% 2.7% 2.9% 2.9% 3.0% 2.9% 2.7% 3.0% 3.0% 0.1% 0.0%Grampians 2.7% 2.5% 2.5% 2.5% 2.7% 2.8% 2.8% 2.9% 2.9% 3.1% 0.4% 0.1%Great Ocean Road 7.4% 6.7% 6.2% 6.8% 5.9% 6.8% 6.6% 6.7% 7.2% 7.3% 1.4% 0.1%Mornington Peninsula 3.4% 3.5% 3.4% 3.4% 3.4% 3.3% 3.6% 3.8% 4.0% 4.3% 0.8% 0.3%Murray 3.2% 3.3% 3.0% 3.1% 3.3% 3.3% 3.3% 3.3% 3.3% 3.5% 0.1% 0.1%Phillip Island 19.9% 19.0% 16.5% 19.6% 20.8% 18.7% 16.0% 18.6% 18.8% 17.3% -3.5% -1.6%Victoria's High Country 9.5% 9.0% 9.0% 9.2% 8.4% 7.8% 9.5% 9.3% 9.1% 10.9% 2.5% 1.8%Yarra Valley and Dandenong Ranges 3.1% 3.1% 3.3% 3.0% 3.1% 3.5% 3.0% 3.3% 3.4% 3.4% 0.4% 0.0%Regional Victoria 3.9% 3.8% 3.7% 3.8% 3.8% 3.8% 3.8% 3.9% 4.1% 4.2% 0.4% 0.1%Victoria 2.5% 2.5% 2.5% 2.5% 2.6% 2.6% 2.6% 2.8% 2.8% 2.9% 0.4% 0.1%Indirect tourism contribution Melbourne 2.0% 1.9% 1.9% 2.0% 2.0% 2.0% 2.0% 2.1% 2.2% 2.2% 0.2% 0.1%Daylesford and the Macedon Ranges 4.1% 4.3% 4.0% 3.8% 3.7% 3.8% 3.8% 4.2% 4.4% 4.6% 0.9% 0.3%Geelong and the Bellarine 2.8% 3.0% 2.5% 2.5% 2.5% 2.6% 2.7% 2.8% 2.9% 2.8% 0.3% -0.1%Gippsland 3.1% 3.3% 3.3% 2.9% 3.4% 3.5% 3.1% 3.0% 3.3% 3.0% -0.4% -0.2%Goldfields 2.9% 2.8% 2.9% 3.0% 3.0% 3.0% 3.0% 2.8% 3.1% 3.0% 0.0% 0.0%Grampians 2.7% 2.5% 2.5% 2.4% 2.5% 2.6% 2.7% 2.8% 2.9% 3.0% 0.5% 0.1%Great Ocean Road 7.9% 7.1% 6.6% 6.6% 6.0% 7.0% 6.6% 6.8% 7.2% 7.4% 1.3% 0.1%Mornington Peninsula 3.3% 3.5% 3.4% 3.1% 3.3% 3.2% 3.4% 3.7% 3.9% 4.2% 0.8% 0.3%Murray 3.3% 3.5% 3.2% 2.9% 3.4% 3.4% 3.3% 3.2% 3.2% 3.4% 0.0% 0.1%Phillip Island 19.8% 19.2% 16.2% 17.1% 20.8% 18.0% 14.4% 17.3% 18.0% 15.9% -4.9% -2.1%Victoria's High Country 9.4% 9.1% 9.1% 8.4% 8.1% 7.3% 9.0% 8.8% 8.7% 10.5% 2.4% 1.8%Yarra Valley and Dandenong Ranges 2.7% 2.7% 2.9% 2.5% 2.5% 3.0% 2.4% 2.9% 3.0% 2.8% 0.3% -0.2%Regional Victoria 3.9% 3.9% 3.7% 3.5% 3.7% 3.8% 3.7% 3.8% 3.9% 4.0% 0.3% 0.1%Victoria (internal contribution only)1 2.4% 2.4% 2.3% 2.3% 2.4% 2.4% 2.4% 2.5% 2.6% 2.6% 0.2% 0.1%Rest of Australia NA NA NA NA NA NA NA NA NA NA 0.0% 0.0%Victoria (reported STSA estimates)2 2.8% 2.7% 2.7% 2.7% 2.7% 2.7% 2.8% 2.8% 2.9% 3.0% 0.3% 0.1%Total tourism contributionMelbourne 4.1% 4.0% 4.0% 4.1% 4.2% 4.2% 4.3% 4.6% 4.6% 4.8% 0.6% 0.2%Daylesford and the Macedon Ranges 8.4% 8.8% 8.2% 7.9% 7.8% 8.1% 8.1% 8.8% 9.1% 9.6% 1.9% 0.5%Geelong and the Bellarine 5.7% 6.0% 5.0% 5.2% 5.1% 5.3% 5.5% 5.8% 6.0% 5.8% 0.7% -0.1%Gippsland 6.1% 6.4% 6.4% 6.0% 6.7% 6.9% 6.3% 6.1% 6.5% 6.2% -0.6% -0.4%Goldfields 5.6% 5.4% 5.6% 5.9% 5.9% 6.0% 5.9% 5.6% 6.0% 6.0% 0.1% -0.1%Grampians 5.4% 5.0% 5.0% 5.0% 5.2% 5.4% 5.5% 5.7% 5.8% 6.1% 0.9% 0.3%Great Ocean Road 15.3% 13.9% 12.8% 13.4% 11.9% 13.8% 13.1% 13.5% 14.4% 14.7% 2.8% 0.3%Mornington Peninsula 6.8% 6.9% 6.9% 6.5% 6.8% 6.5% 7.0% 7.5% 7.9% 8.4% 1.6% 0.6%Murray 6.5% 6.8% 6.2% 6.0% 6.7% 6.7% 6.6% 6.4% 6.6% 6.8% 0.2% 0.3%Phillip Island 39.7% 38.1% 32.7% 36.8% 41.6% 36.8% 30.4% 35.9% 36.8% 33.1% -8.5% -3.6%Victoria's High Country 18.9% 18.1% 18.1% 17.7% 16.6% 15.1% 18.5% 18.1% 17.8% 21.5% 4.9% 3.6%Yarra Valley and Dandenong Ranges 5.8% 5.8% 6.1% 5.5% 5.6% 6.5% 5.4% 6.2% 6.4% 6.2% 0.6% -0.2%Regional Victoria 7.7% 7.7% 7.4% 7.3% 7.5% 7.6% 7.5% 7.7% 8.0% 8.2% 0.7% 0.2%Victoria (internal contribution only)1 5.0% 4.9% 4.8% 4.8% 4.9% 5.0% 5.0% 5.3% 5.4% 5.5% 0.6% 0.2%Rest of Australia NA NA NA NA NA NA NA NA NA NA 0.0% 0.0%Victoria (reported STSA estimates)2 5.3% 5.2% 5.1% 5.1% 5.3% 5.3% 5.4% 5.6% 5.8% 5.9% 0.6% 0.2%
Tourism Gross Value Added
Tourism Region % Share of Economy % pts

14
Victoria’s tourism regions 2008-09 to 2017-18 - Employment (000s)
2017-18 Regional Tourism Satellite Accounts
Source Regional TSA model 2017-18, Tourism Research Australia, Canberra, December 2019 .
2008-09 2009-10 2010-11 2011-12 2012-13 2013-14 2014-15 2015-16 2016-17 2017-18 AAG*
2012-13 to 2017-18
% Change 2016-17 vs
2017-18
%
Direct tourism contributionMelbourne 60.6 60.0 63.3 65.7 65.2 66.7 72.2 76.6 81.5 86.4 5.8% 6.1%Daylesford and the Macedon Ranges 2.4 2.6 2.6 2.6 2.5 2.5 2.7 2.9 3.2 3.5 6.5% 7.9%Geelong and the Bellarine 4.6 5.1 4.7 4.7 4.7 4.7 5.4 5.6 6.2 6.2 5.8% 0.3%Gippsland 5.5 6.1 6.7 5.9 6.8 6.6 6.6 6.4 7.1 6.9 0.4% -2.2%Goldfields 5.1 5.0 5.6 5.8 5.7 5.8 6.2 5.9 6.6 6.9 3.7% 3.2%Grampians 2.1 2.0 2.2 2.2 2.3 2.3 2.5 2.5 2.8 3.0 5.0% 7.1%Great Ocean Road 7.1 6.7 6.9 6.9 6.4 7.1 7.3 7.3 8.4 8.7 6.4% 3.3%Mornington Peninsula 4.9 5.2 5.6 5.1 5.4 5.3 6.1 6.5 7.2 7.9 7.6% 8.7%Murray 7.4 8.0 8.0 7.5 8.5 8.3 8.9 8.5 9.2 9.9 3.1% 7.5%Phillip Island 2.9 3.0 2.8 3.0 3.5 3.0 2.7 3.2 3.5 3.2 -1.9% -9.2%Victoria's High Country 5.5 5.6 6.0 5.6 5.4 4.9 6.3 6.1 6.5 7.8 7.6% 21.1%Yarra Valley and Dandenong Ranges 4.1 4.2 4.8 4.3 4.4 4.9 4.6 5.2 5.7 5.6 5.1% -1.1%Regional Victoria 51.6 53.6 55.8 53.6 55.6 55.5 59.3 60.2 66.4 69.5 4.5% 4.7%Victoria 112.2 113.6 119.2 119.3 120.9 122.2 131.5 136.8 147.9 155.9 5.2% 5.4%Indirect tourism contribution Melbourne 26.3 26.4 28.3 30.2 31.1 32.3 34.2 37.5 40.2 43.6 7.0% 8.4%Daylesford and the Macedon Ranges 0.5 0.5 0.5 0.5 0.5 0.5 0.6 0.6 0.7 0.8 8.3% 9.9%Geelong and the Bellarine 1.5 1.7 1.6 1.6 1.6 1.7 1.9 2.1 2.3 2.3 6.7% 0.3%Gippsland 1.6 1.8 2.0 1.8 2.1 2.2 2.1 2.1 2.3 2.3 1.3% -2.7%Goldfields 1.7 1.7 1.9 2.0 2.1 2.1 2.2 2.1 2.4 2.5 4.2% 4.1%Grampians 0.5 0.5 0.5 0.5 0.6 0.6 0.6 0.6 0.7 0.8 6.5% 8.1%Great Ocean Road 2.3 2.2 2.2 2.3 2.2 2.5 2.5 2.6 2.9 3.1 7.5% 5.1%Mornington Peninsula 1.5 1.7 1.8 1.7 1.9 1.8 2.1 2.3 2.6 2.8 8.9% 11.5%Murray 2.1 2.3 2.3 2.2 2.6 2.6 2.7 2.6 2.9 3.1 3.8% 9.1%Phillip Island 0.9 0.9 0.8 0.9 1.2 1.0 0.9 1.1 1.2 1.1 -1.6% -8.7%Victoria's High Country 1.6 1.6 1.8 1.7 1.7 1.5 2.0 1.9 2.0 2.6 9.1% 26.1%Yarra Valley and Dandenong Ranges 1.0 1.1 1.2 1.1 1.2 1.4 1.2 1.5 1.6 1.6 6.0% -2.6%Regional Victoria 15.2 15.8 16.6 16.3 17.5 18.1 18.7 19.5 21.6 22.9 5.5% 5.9%Victoria (internal contribution only)1 41.4 42.3 44.9 46.5 48.6 50.5 53.0 57.0 61.8 66.5 6.5% 7.5%Rest of Australia 6.1 6.2 6.5 6.8 7.1 7.4 7.8 8.3 9.1 9.7 6.4% 7.0%Victoria (reported STSA estimates)2 47.5 48.5 51.4 53.2 55.7 57.9 60.7 65.3 70.9 76.1 6.5% 7.4%Total tourism contributionMelbourne 86.9 86.5 91.7 95.9 96.3 99.1 106.5 114.1 121.7 130.0 6.2% 6.8%Daylesford and the Macedon Ranges 2.8 3.1 3.1 3.1 3.0 3.1 3.2 3.6 3.9 4.2 6.9% 8.3%Geelong and the Bellarine 6.2 6.8 6.2 6.3 6.3 6.5 7.3 7.7 8.4 8.5 6.1% 0.3%Gippsland 7.1 7.8 8.7 7.6 8.9 8.8 8.6 8.4 9.4 9.2 0.6% -2.3%Goldfields 6.7 6.7 7.5 7.8 7.8 7.9 8.5 8.1 9.1 9.4 3.8% 3.5%Grampians 2.6 2.5 2.7 2.7 2.9 2.9 3.1 3.1 3.5 3.7 5.3% 7.3%Great Ocean Road 9.4 8.9 9.2 9.2 8.5 9.6 9.8 9.9 11.3 11.8 6.7% 3.8%Mornington Peninsula 6.4 6.9 7.3 6.8 7.3 7.1 8.2 8.8 9.8 10.7 8.0% 9.5%Murray 9.5 10.3 10.3 9.7 11.1 10.9 11.6 11.1 12.0 13.0 3.3% 7.9%Phillip Island 3.8 3.9 3.6 3.9 4.7 4.0 3.5 4.2 4.7 4.3 -1.8% -9.0%Victoria's High Country 7.1 7.2 7.8 7.3 7.1 6.4 8.3 8.0 8.5 10.4 7.9% 22.3%Yarra Valley and Dandenong Ranges 5.1 5.3 6.0 5.5 5.6 6.4 5.8 6.7 7.3 7.2 5.3% -1.4%Regional Victoria 66.8 69.4 72.4 69.9 73.2 73.6 78.0 79.6 88.0 92.4 4.8% 5.0%Victoria (internal contribution only)1 153.7 155.8 164.1 165.8 169.5 172.6 184.5 193.8 209.7 222.4 5.6% 6.0%Rest of Australia 6.1 6.2 6.5 6.8 7.1 7.4 7.8 8.3 9.1 9.7 6.4% 7.0%Victoria (reported STSA estimates)2 159.7 162.0 170.6 172.5 176.6 180.0 192.3 202.1 218.7 232.1 5.6% 6.1%
Tourism Employment
Tourism Region Employed Persons (000s) % p.a.
Notes on the data1 A small portion of the indirect contribution of tourism is allocated to the ‘rest of Australia’ where the economic benefits of visitorspend in Victoria flow to other states and territories (eg. where a tourism business in Victoria uses interstate suppliers). The larger,remaining portion of the indirect contribution of tourism represents the economic benefits to and within Victoria.2 These estimates may differ from the previously published data in the 2017-18 State Tourism Satellite Accounts and 2016-17 RegionalTourism Satellite Accounts, by Tourism Research Australia.- Back cast estimates from 2008-09 to 2017-18 in the table above are based on the same methodology and are comparable. - AAG –Average Annual Growth

15
Victoria’s tourism regions 2008-09 to 2017-18 - Employment Share of Economy (%)
Source Regional TSA model 2017-18, Tourism Research Australia, Canberra, December 2019 .
2017-18 Regional Tourism Satellite Accounts
2008-09 2009-10 2010-11 2011-12 2012-13 2013-14 2014-15 2015-16 2016-17 2017-18 Change
2012-13 to 2017-18
Change 2016-17 vs
2017-18
Direct tourism contributionMelbourne 3.2% 3.1% 3.2% 3.3% 3.2% 3.2% 3.4% 3.5% 3.6% 3.7% 0.5% 0.1%Daylesford and the Macedon Ranges 9.5% 10.0% 9.9% 9.7% 9.4% 9.3% 9.6% 10.2% 10.8% 11.3% 1.9% 0.5%Geelong and the Bellarine 4.7% 5.0% 4.5% 4.4% 4.4% 4.4% 4.8% 4.9% 5.2% 5.1% 0.7% -0.1%Gippsland 6.2% 6.6% 7.1% 6.2% 7.1% 6.8% 6.6% 6.2% 6.7% 6.3% -0.8% -0.3%Goldfields 4.7% 4.6% 5.0% 5.1% 5.0% 5.0% 5.2% 4.8% 5.2% 5.2% 0.2% 0.0%Grampians 6.1% 5.7% 6.1% 6.0% 6.3% 6.2% 6.5% 6.3% 6.8% 7.1% 0.8% 0.3%Great Ocean Road 13.1% 12.1% 12.1% 11.9% 10.8% 11.9% 12.0% 11.8% 12.9% 13.0% 2.1% 0.1%Mornington Peninsula 5.3% 5.5% 5.7% 5.2% 5.5% 5.2% 5.9% 6.1% 6.5% 6.9% 1.5% 0.4%Murray 6.1% 6.5% 6.2% 5.8% 6.5% 6.3% 6.6% 6.1% 6.3% 6.6% 0.1% 0.3%Phillip Island 29.6% 29.3% 26.5% 28.1% 32.9% 27.8% 24.1% 27.8% 29.7% 26.3% -6.7% -3.5%Victoria's High Country 16.2% 16.0% 16.8% 15.6% 14.9% 13.1% 16.7% 15.6% 15.9% 18.8% 3.9% 2.8%Yarra Valley and Dandenong Ranges 5.1% 5.2% 5.6% 5.1% 5.1% 5.7% 5.2% 5.7% 5.9% 5.7% 0.6% -0.2%Regional Victoria 6.9% 7.0% 7.1% 6.7% 6.9% 6.8% 7.1% 7.0% 7.4% 7.6% 0.7% 0.1%Victoria 4.2% 4.2% 4.3% 4.2% 4.2% 4.2% 4.4% 4.5% 4.7% 4.8% 0.6% 0.1%Indirect tourism contribution Melbourne 1.4% 1.4% 1.4% 1.5% 1.5% 1.6% 1.6% 1.7% 1.8% 1.9% 0.3% 0.1%Daylesford and the Macedon Ranges 1.9% 2.0% 2.0% 1.9% 1.9% 2.0% 2.0% 2.2% 2.3% 2.5% 0.6% 0.2%Geelong and the Bellarine 1.6% 1.7% 1.5% 1.5% 1.5% 1.6% 1.7% 1.8% 1.9% 1.9% 0.3% 0.0%Gippsland 1.8% 1.9% 2.1% 1.9% 2.2% 2.2% 2.1% 2.0% 2.2% 2.1% -0.1% -0.1%Goldfields 1.6% 1.5% 1.7% 1.8% 1.8% 1.8% 1.9% 1.7% 1.9% 1.9% 0.1% 0.0%Grampians 1.4% 1.3% 1.4% 1.4% 1.5% 1.5% 1.6% 1.6% 1.7% 1.8% 0.3% 0.1%Great Ocean Road 4.2% 3.9% 3.9% 3.9% 3.7% 4.3% 4.1% 4.1% 4.5% 4.6% 1.0% 0.1%Mornington Peninsula 1.7% 1.8% 1.8% 1.7% 1.9% 1.8% 2.0% 2.2% 2.3% 2.5% 0.6% 0.2%Murray 1.7% 1.8% 1.8% 1.7% 2.0% 2.0% 2.0% 1.9% 2.0% 2.1% 0.1% 0.1%Phillip Island 9.0% 8.9% 8.0% 8.7% 10.8% 9.4% 7.7% 9.2% 9.8% 8.7% -2.1% -1.1%Victoria's High Country 4.6% 4.6% 4.9% 4.7% 4.6% 4.1% 5.2% 5.0% 5.0% 6.2% 1.6% 1.1%Yarra Valley and Dandenong Ranges 1.3% 1.3% 1.5% 1.3% 1.4% 1.6% 1.3% 1.6% 1.7% 1.6% 0.2% -0.1%Regional Victoria 2.0% 2.1% 2.1% 2.1% 2.2% 2.2% 2.2% 2.3% 2.4% 2.5% 0.3% 0.1%Victoria (internal contribution only)1 1.6% 1.6% 1.6% 1.6% 1.7% 1.8% 1.8% 1.9% 2.0% 2.0% 0.3% 0.1%Rest of Australia NA NA NA NA NA NA NA NA NA NA 0.0% 0.0%Victoria (reported STSA estimates)2 1.8% 1.8% 1.8% 1.9% 2.0% 2.0% 2.1% 2.1% 2.2% 2.3% 0.4% 0.1%Total tourism contributionMelbourne 4.6% 4.4% 4.6% 4.7% 4.7% 4.8% 5.0% 5.2% 5.4% 5.6% 0.9% 0.2%Daylesford and the Macedon Ranges 11.3% 12.0% 11.9% 11.7% 11.3% 11.3% 11.6% 12.4% 13.1% 13.8% 2.5% 0.7%Geelong and the Bellarine 6.2% 6.7% 5.9% 6.0% 5.9% 6.0% 6.6% 6.8% 7.1% 7.0% 1.0% -0.2%Gippsland 8.0% 8.6% 9.2% 8.1% 9.3% 9.1% 8.7% 8.2% 8.9% 8.4% -0.9% -0.4%Goldfields 6.3% 6.1% 6.6% 6.8% 6.8% 6.8% 7.1% 6.6% 7.1% 7.1% 0.4% 0.0%Grampians 7.5% 7.1% 7.5% 7.4% 7.8% 7.7% 8.1% 8.0% 8.5% 8.9% 1.1% 0.4%Great Ocean Road 17.3% 15.9% 15.9% 15.8% 14.5% 16.2% 16.1% 15.9% 17.4% 17.6% 3.1% 0.2%Mornington Peninsula 6.9% 7.3% 7.5% 6.9% 7.3% 7.1% 7.9% 8.3% 8.9% 9.4% 2.1% 0.6%Murray 7.8% 8.3% 8.0% 7.6% 8.5% 8.3% 8.6% 8.0% 8.3% 8.7% 0.2% 0.4%Phillip Island 38.6% 38.2% 34.5% 36.8% 43.7% 37.2% 31.9% 37.1% 39.6% 35.0% -8.7% -4.6%Victoria's High Country 20.8% 20.6% 21.7% 20.3% 19.4% 17.2% 21.9% 20.5% 20.9% 24.9% 5.5% 4.0%Yarra Valley and Dandenong Ranges 6.4% 6.5% 7.1% 6.4% 6.4% 7.3% 6.5% 7.3% 7.6% 7.3% 0.9% -0.3%Regional Victoria 8.9% 9.1% 9.2% 8.8% 9.1% 9.0% 9.3% 9.3% 9.9% 10.1% 1.0% 0.2%Victoria (internal contribution only)1 5.8% 5.7% 5.9% 5.9% 5.9% 6.0% 6.2% 6.4% 6.6% 6.8% 0.9% 0.2%Rest of Australia NA NA NA NA NA NA NA NA NA NA 0.0% 0.0%Victoria (reported STSA estimates)2 6.0% 6.0% 6.1% 6.1% 6.2% 6.2% 6.5% 6.6% 6.9% 7.1% 0.9% 0.2%
Tourism Employment
Tourism Region % Share of Economy % pts
Notes on the data1 A small portion of the indirect contribution of tourism is allocated to the ‘rest of Australia’ where the economic benefits of visitorspend in Victoria flow to other states and territories (eg. where a tourism business in Victoria uses interstate suppliers). The larger,remaining portion of the indirect contribution of tourism represents the economic benefits to and within Victoria.2 These estimates may differ from the previously published data in the 2017-18 State Tourism Satellite Accounts and 2016-17 RegionalTourism Satellite Accounts, by Tourism Research Australia.- Back cast estimates from 2008-09 to 2017-18 in the table above are based on the same methodology and are comparable. - AAG –Average Annual Growth

Report produced by the Tourism, Events and Visitor Economy (TEVE) Research Unit
Department of Jobs, Precincts and RegionsVictorian Government
Report published in December 2019
Data is considered correct at the time of publishing. Due care is taken in the production of this report, however DJPR accepts no responsibility for use of this information.
Please contact: [email protected] with any queries.