TOURISM SECTOR PERFORMANCE · China (S$1,993 million), Indonesia (S$1,490 million) and India (S$817...
7
Q2 2019 Report TOURISM SECTOR PERFORMANCE
Transcript of TOURISM SECTOR PERFORMANCE · China (S$1,993 million), Indonesia (S$1,490 million) and India (S$817...

Q2 2019 Report
TOURISMSECTORPERFORMANCE

EXECUTIVE SUMMARYIn the first half of 2019, International Visitor Arrivals (IVA) increased 1.3 per cent over the same period last year to reach 9.3 million visitors.
Tourism Receipts (TR) reached $13.1 billion, a decline of 3.0 per cent compared to the same period last year. This was due to lower expenditures across some components including Accommodation, Food & Beverage and Sightseeing, Entertainment and Gaming (SEG) even though Shopping and Other TR Components grew.
Gazetted hotel room revenue was estimated at $1.9 billion for 1H2019, a year-on-year growth of 1.7 per cent. Average
Occupancy Rate (AOR) and Average Room Rate (ARR) held steady at 85 per cent and S$215 respectively, while Revenue Per Available Room (RevPAR) declined slightly by 0.9 per cent to reach S$183.
In the second quarter of 2019 (Q2), IVA grew 1.7 per cent year-on-year to reach 4.6 million visitors. TR declined a 1.3 per cent over the same period last year to reach $6.5 billion. Gazetted hotel room revenue for Q2 2019 held steady at an estimated S$1.0 billion.
[Note: International visitor arrivals statistics up to Aug 2019 is now available here.]
NOTE TO EDITORSThis quarterly report provides a summary of key statistics on tourism receipts, international visitor arrivals and gazetted hotels. The analysis in this report is based on data from a variety of sources, including Disembarkation/Embarkation cards, the Overseas Visitors Survey (OVS) and the monthly hotel returns from gazetted hotels. Data derived from the OVS are subject to sampling error. Users are advised to exercise discretion when drawing any conclusions or inferences, or taking any action, based on the data. Data is correct as at the time of publishing.
Download Monthly International Visitor Arrivals and Hotel statistics: https://www.stb.gov.sg/content/stb/en/statistics-and-market-insights/tourism-statistics/international-visitorarrivals.html
2
TOURISM SECTORPERFORMANCE2019
Q2
QUARTER TWO 2019 HIGHLIGHTS
TOURISMRECEIPTS
S$6.5 billion
year-on-year to reach
TR in Q2 2019 declined by
-1.3%
INTERNATIONALVISITOR ARRIVALS
year-on-year to reach
4.6 million
+1.7%
IVA in Q2 2019 increased by
S$1.0 billion
year-on-year to reach
HOTELINDUSTRY
-0.1%
Gazetted hotel room revenue in Q2 2019 held steady at

Source: Disembarkation/Embarkation Cards and Overseas Visitors Survey- Sightseeing, Entertainment & Gaming includes entrance fees to attractions and nightspots, expenditure on day-tours, leisure events as well as entertainment at the Integrated Resorts.- Other TR components include expenditure on airfares on Singapore-based carriers, port taxes, local transportation, as well as expenditure by business, medical, education and transfer/ transit visitors.
OTHER TR COMPONENTS
S$1,786m
ACCOMMODATION
S$1,309m -13%
S$586m -3%
0%
SIGHTSEEING, ENTERTAINMENT & GAMING
S$1,443m -1%
SHOPPING
S$1,386m +11%
3
Tourism Receipts (TR) for the second quarter (Q2 2019) was estimated at S$6.5 billion, a 1.3 per cent decline over the same period last year. There was an increase in Shopping expenditure (+11%) while declines were observed for
Accommodation (-13%), Food & Beverage (-3%) and Sightseeing, Entertainment & Gaming (-1%). Other TR Components (0%) held steady in the same period.
1 All Tourism Receipts estimates are correct as of October 2019.
TOURISM RECEIPTS BY MAJOR COMPONENTS1
TOURISM RECEIPTS: S$6.5 BILLION (-1.3% VS Q2 2018)All percentage changes are vs same period in 2018
QUARTER TWO 2019 PERFORMANCE
21%
20%
9%
22%
27%
% Share
3
TOURISM RECEIPTS
FOOD & BEVERAGE
TOURISM SECTORPERFORMANCE2019
Q2

Expenditure is estimated from Overseas Visitors Survey.Other TR components include expenditure on airfares on Singapore-based carriers, port taxes, local transportation, as well as expenditure by business, medical, education and transfer/transit visitors.
* Sightseeing, Entertainment & Gaming has been excluded in the country analysis due to commercial sensitivity of information.
QUARTER TWO 2019 PERFORMANCE
Excluding expenditure on Sightseeing, Entertainment & Gaming (SEG), China (S$897 million), Indonesia (S$757 million) and India (S$478 million) were the top three TR generating markets in Q2 2019, contributing to 42 per cent of TR (excluding SEG).Among the top 10 TR markets, Vietnam, Philippines and USA registered the highest absolute year-on-year growth in TR (excluding SEG).
TOURISM RECEIPTS BY MAJOR COMPONENTS, TOP 10 MARKETSTOURISM RECEIPTS* :S$5.1 BILLION (-1.4% VS Q2 2018)
VA % Change
vs Q2 2018
TR % Change
vs Q2 20182019 TR*
(S$ million)
+2%
+7%
-4%
-6%
+3%
+15%
+7%
+12%
-3%
0%
-7%
-1%
-10%
-3%
-16%
0%
+1%
+12%
+6%
+19%
-7%
+7%
Overall
China
Indonesia
India
Australia
Japan
Philippines
USA
Vietnam
Malaysia
Thailand
5,067
897
757
478
299
231
204
190
184
174
152
0% 10% 20% 30% 40% 50% 60% 70% 80% 90% 100%
SHOPPING ACCOMMODATION FOOD & BEVERAGE OTHER TR COMPONENTS
p
p
q
q
p
p
p
p
q
q
q
q
q
q
p
p
p
p
q
p
27% 26% 12% 35%
51%
33%
14%
12%
15%
21%
11%
31%
25%
31%
16%
37%
31%
36%
32%
39%
19%
20%
28%
8%
14%
13%
9%
18%
15%
9%
12%
13%
43%
36%
44%
40%
29%
36%
41%
43%
27%
17% 6% 26%
4
TOURISM RECEIPTS
INDONESIA
S$757 million
1 CHINA
S$897 million
2
INDIA
S$478 million3
TOURISM SECTORPERFORMANCE2019
Q2
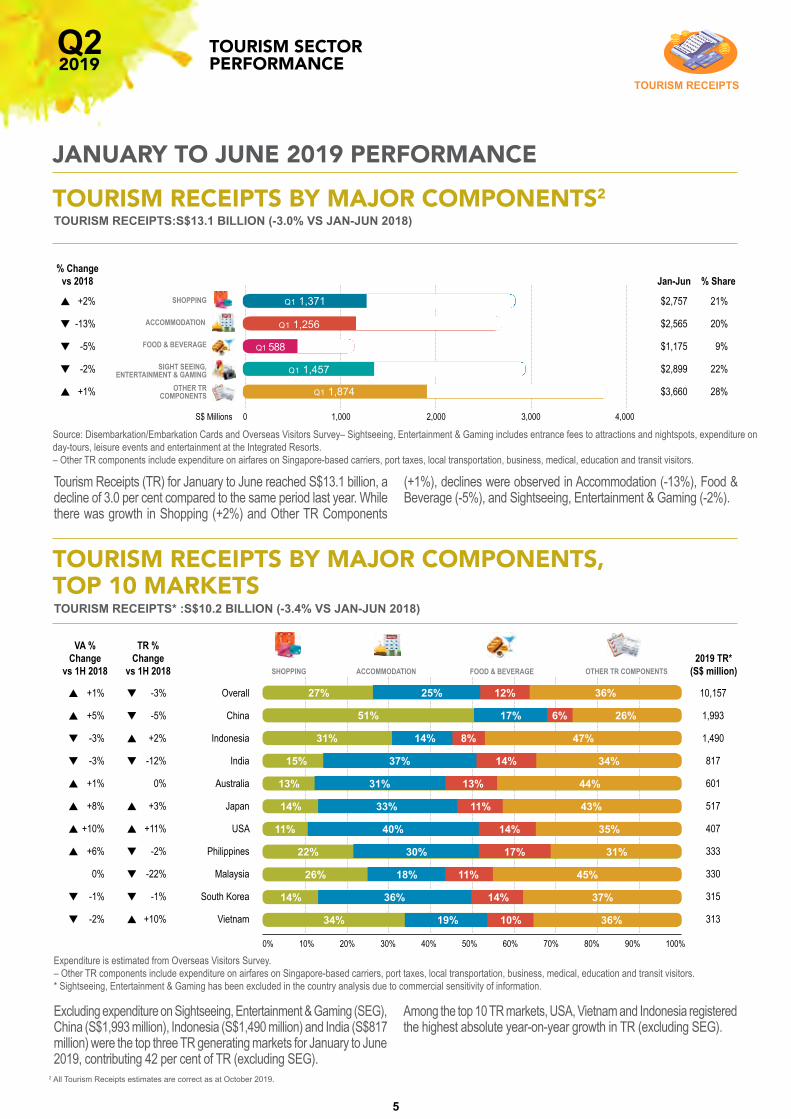
Tourism Receipts (TR) for January to June reached S$13.1 billion, a decline of 3.0 per cent compared to the same period last year. While there was growth in Shopping (+2%) and Other TR Components
(+1%), declines were observed in Accommodation (-13%), Food & Beverage (-5%), and Sightseeing, Entertainment & Gaming (-2%).
Excluding expenditure on Sightseeing, Entertainment & Gaming (SEG), China (S$1,993 million), Indonesia (S$1,490 million) and India (S$817 million) were the top three TR generating markets for January to June 2019, contributing 42 per cent of TR (excluding SEG).
Among the top 10 TR markets, USA, Vietnam and Indonesia registered the highest absolute year-on-year growth in TR (excluding SEG).
Expenditure is estimated from Overseas Visitors Survey.– Other TR components include expenditure on airfares on Singapore-based carriers, port taxes, local transportation, business, medical, education and transit visitors.* Sightseeing, Entertainment & Gaming has been excluded in the country analysis due to commercial sensitivity of information.
2 All Tourism Receipts estimates are correct as at October 2019.
TOURISM RECEIPTS BY MAJOR COMPONENTS, TOP 10 MARKETSTOURISM RECEIPTS* :S$10.2 BILLION (-3.4% VS JAN-JUN 2018)
JANUARY TO JUNE 2019 PERFORMANCE
TOURISM RECEIPTS BY MAJOR COMPONENTS2
TOURISM RECEIPTS:S$13.1 BILLION (-3.0% VS JAN-JUN 2018)
% Changevs 2018
+2%
-13%
-5%
-2%
+1%
p
q
q
q
p
VA % Change
vs 1H 2018
TR % Change
vs 1H 20182019 TR*
(S$ million)
+1%
+5%
-3%
-3%
+1%
+8%
+10%
+6%
0%
-1%
-2%
-3%
-5%
+2%
-12%
0%
+3%
+11%
-2%
-22%
-1%
+10%
Overall
China
Indonesia
India
Australia
Japan
USA
Philippines
Malaysia
South Korea
Vietnam
10,157
1,993
1,490
817
601
517
407
333
330
315
313
0% 10% 20% 30% 40% 50% 60% 70% 80% 90% 100%
SHOPPING ACCOMMODATION FOOD & BEVERAGE OTHER TR COMPONENTS
p
p
q
q
p
p
p
p
q
q
q
q
p
q
p
p
q
q
q
p
27% 25% 12% 36%
51%
31%
15%
13%
14%
11%
22%
26%
14%
34%
14%
37%
31%
33%
40%
30%
18%
36%
19%
8%
14%
13%
11%
14%
17%
11%
14%
10%
47%
34%
44%
43%
35%
31%
45%
37%
36%
17% 6% 26%
Source: Disembarkation/Embarkation Cards and Overseas Visitors Survey– Sightseeing, Entertainment & Gaming includes entrance fees to attractions and nightspots, expenditure on day-tours, leisure events and entertainment at the Integrated Resorts.– Other TR components include expenditure on airfares on Singapore-based carriers, port taxes, local transportation, business, medical, education and transit visitors.
Jan-Jun % Share
21%
20%
9%
22%
28%
$2,757
$2,565
$1,175
$2,899
$3,660
S$ Millions 0 1,000 2,000 3,000 4,000
Q1 1,371 Q2 1,386
Q1 1,256 Q2 1,309
Q1 1,457 Q2 1,443
Q1 1,874 Q2 1,786
Q1 588 Q2 586
SHOPPING
ACCOMMODATION
FOOD & BEVERAGE
SIGHT SEEING, ENTERTAINMENT & GAMING
OTHER TR COMPONENTS
5
TOURISM RECEIPTS
TOURISM SECTORPERFORMANCE2019
Q2

INTERNATIONALVISITOR ARRIVALS
China (1.8 million), Indonesia (1.5 million), India (0.7 million), Malaysia (0.6 million) and Australia (0.5 million) were Singapore’s top five international visitor-generating markets in 2019. These markets accounted for 56 per cent of total IVA in January to June 2019.
China (+5%), USA (+10%) and Japan (+8%) registered the largest absolute year-on-year growth.
% Change vs Q2 2018
+6%
+8%
+10%
+5%
-1%
-2%
-7%
+2%
-2%
+15%
+1%
Philippines
Japan
USA
UK
South Korea
Vietnam
Thailand
Hong Kong SAR
Taiwan
Germany
Others
0 500 1,000 1,500‘000s
p
p
p
p
q
q
q
p
q
p
p
IVA, TOP 15 MARKETS
CHINAp+5% 1,812,000INDONESIAq-3% 1,492,000INDIAq-3% 747,000MALAYSIA
0% 587,000AUSTRALIAp+1% 538,000
Source: Disembarkation/Embarkation Cards
1
2
3
4
5
6
7
8
9
10
11
12
13
14
15
16
408
401
361
312
311
285
252
228
207
203
1,178
JAN-JUN 2019: 9.3 MILLION (+1.3% VS JAN-JUN 2018)
6
JANUARY TO JUNE 2019 PERFORMANCE
INTERNATIONAL VISITOR ARRIVALS (IVA)JAN-JUN 2019: 9.3 MILLION (+1.3% VS JAN-JUN 2018), VISITOR DAYS: 31.7 MILLION DAYS (+2.5%)
Singapore’s international visitor arrivals (IVA) stood at 9.3 million for January to June 2019, a 1.3 per cent year-on-year growth.
IVA 2018 (’000s) IVA 2019 (’000s)
TOURISM SECTORPERFORMANCE2019
Q2
1,584
1,5441,471
1,5451,565
1,597
1,4881,551
1,492
1,499
1,563
1,625

HOTEL INDUSTRY
Gazetted hotel room revenue for Q2 2019 held steady at an estimated S$1.0 billion. Average Occupancy Rate (AOR4)held steady at 85 per cent while Average Room Rate (ARR5)
declined by 1.0 per cent to reach $211. Revenue per Available Room (RevPAR6) declined by 1.0 per cent year-on-year to S$178 in Q2 2019.
HOTEL INDUSTRY3
S$ % % %pts S$ %
Overall 211 q -1.0 85 0.0 178 q -1.0
Luxury 434 p +0.1 86 p +0.8 373 p +1.0
Upscale 255 q -0.8 82 q -0.8 209 q -1.7
Mid-tier 165 q -0.5 87 p +1.1 143 p +0.8
Economy 105 q -1.2 82 q -1.3 86 q -2.8
Average Room Rate (ARR)
ARR, AOR and RevPAR, Q2 2019
Average Occupancy Rate (AOR) Revenue Per Available Room (RevPAR)
QUARTER TWO 2019 PERFORMANCE
S$ % % %pts S$ %
Overall 215 q -0.8 85 q -0.2 183 q -0.9
Luxury 443 p +0.1 87 p +0.8 386 p +1.0
Upscale 258 q -1.3 84 q -0.9 217 q -2.4
Mid-tier 166 q -1.0 87 p +0.9 145 0.0
Economy 105 p +0.4 82 q -1.4 85 q -1.3
Average Room Rate (ARR)
ARR, AOR and RevPAR, JANUARY – JUNE 2019
Average Occupancy Rate (AOR) Revenue Per Available Room (RevPAR)
Gazetted hotel room revenue for January to June 2019 was estimated at S$1.9 billion, a 1.7 per cent growth over the same period last year. AOR held steady at 85 per cent while ARR
declined marginally by 0.8 per cent to reach $215. RevPAR declined slightly by 0.9 per cent to reach $183.
JANUARY TO JUNE 2019 PERFORMANCE
7
TOURISM SECTORPERFORMANCE2019
Q2
7
+65 6736 6622 +65 6736 9423 stb.gov.sgTourism Court 1 Orchard Spring Lane Singapore 247729
NOTE: The hotel tiering system is a reference system developed by the Singapore Tourism Board (STB) to categorise the different hotels in Singapore into tiers based on a combination of factors that include average room rates, location and product characteristics.
Figures for the hotel industry are preliminary estimates, based on returns as at 26 Jun 2019. The current hotel tiers published are based on the hotels’ performance in 2017. The response rate across the tiers may vary.
Luxury – Includes hotels in the luxury segment and are predominantly in prime locations and/or in historical buildings
Upscale – Includes hotels in the upscale segment and are generally in prime locations or hotels with boutique positioning in prime or distinctive locations
Mid-Tier – Includes hotels in the mid-tier segment and are primarily located in prime commercial zones or immediately outlying areas
Economy – Includes hotels in the budget segment and are generally located in outlying areas
3 Hotel figures are accurate as at 16 October 20194 Standard AOR = [Gross lettings (Room Nights) / Available room nights] x 1005 Standard ARR = [Total room revenue / Gross lettings] x 1006 RevPAR = AOR x ARR


![· 0219m 079 11000 4 2553 1. 1 (f] 2553-2555) uu 9,770 2553 1,490 2,000 2554 ånåmnu 7,770 2554 2554 Ltlut.u å1UQU 6,000](https://static.fdocuments.net/doc/165x107/5ea24fa1b93c620b101232be/0219m-079-11000-4-2553-1-1-f-2553-2555-uu-9770-2553-1490-2000-2554-nmnu.jpg)