TOURISM NEW ZEALAND€¦ · · 2015-05-13chairman’s report greg muir 2 tourism new zealand...
62
ANNUAL REPORT 2007–2008 TOURISM NEW ZEALAND G25
Transcript of TOURISM NEW ZEALAND€¦ · · 2015-05-13chairman’s report greg muir 2 tourism new zealand...

ANNUAL REPORT 2007–2008TOURISM NEW ZEALAND
G25

‘Youngest Country’New Zealand is ‘The Youngest Country on Earth’, the last habitable
land mass to be settled by human kind. This is the basis of Tourism New Zealand’s refreshed international marketing
campaign which launched in August 2007.
www.tourismnewzealand.com

G25
CONTENTS 2007–2008
Chairman’s Report 02
Chief Executive’s Report 04
About Tourism New Zealand 07
Management at Tourism New Zealand 08
Governance at Tourism New Zealand 09
Board Members 11
Statement of Service Performance 12Overview 12Marketing of New Zealand as a Visitor Destination: 13 Campaign 14 Channel 23 Capability 26
Management Statements 28
Financials 31Statement of Responsibility 31Statement of Financial Performance 32Statement of Financial Position 33Statement of Changes in Equity 33Statement of Cash Flows 34
Notes to the Financial Statements 35
Note 1 Statement of accounting policies 35Note 2 Crown Revenue 38Note 3 Other Revenue 38Note 4 Foreign Exchange Gains 38Note 5 Other Expenses 38Note 6 Foreign exchange losses 40Note 7 Total Expenditure of Parent 40Note 8 Subsidiary Companies 40Note 9 Associate Company 42Note 10 Cash 42Note 11 Receivables 43Note 12 Derivative financial instruments 44Note 13 Property plant and equipment 44Note 14 Accommodation bonds 46Note 15 Creditors and other payables 46Note 16 Employee entitlements 46Note 17 Provisions 46Note 18 Reconciliation of surplus (deficit) to net cash from operating activities 47Note 19 Contingent liabilities and contingent assets 47Note 20 Income tax 48Note 21 Management of risk 48Note 22 Significant accounting judgements, estimates and assumptions 48Note 23 Capital management 48Note 24 Categories of financial assets and liabilities 49Note 25 Capital commitments 49Note 26 Operating commitments 49Note 27 Related party transactions 50Note 28 Financial instrument risks 52Note 29 Remuneration of employees 52Note 30 Remuneration of directors of parent 53Note 31 Explanation of transition to NZ IFRS 54
Five-Year Financial Summary of Parent 57 Audit Report 58
Presented to the House of Representatives pursuant to Section 150 of the Crown of Entities Act 2004.

CHAIRMAN’S REPORTGREG MUIR
TOURISM NEW ZEALAND ANNUAL REPORT 2007–20082

This is my first annual report since taking over as Chairman of Tourism New Zealand and I am looking forward to playing a part in the development of one of New Zealand’s biggest industries.
The past year has provided another set of milestones for Tourism New Zealand. However, tough global economic conditions and factors like increased competition from other destinations mean that Tourism New Zealand and the tourism industry were faced with a far more challenging environment.
Global FactorsSince the last annual report the world’s economic situation has changed fundamentally, something which will undoubtedly affect the tourism industry. As easy access to cheap credit is reduced and concern over financial security increases, spending on discretionary activities, such as travel, will inevitably be impacted.
The recent economic upheaval came on top of a year of fuel price rises, which had forced up the cost of airline tickets and added, or increased, surcharges on many flights.
Airlines are also looking more closely at the viability of routes, with a number of longhaul airlines reducing their flight schedules to New Zealand.
Seat and route cut backs inevitably reduce the options for potential visitors to get to New Zealand and force airline ticket prices up; both factors make New Zealand a less competitive destination in many markets.
While visitor numbers from the UK, USA, Japan and Korea had started to show the impact of the above factors, others markets had been holding up well.
During 2008, China became New Zealand’s fourth-largest market for international visitors, overtaking
Japan. Better air links between Canada and New Zealand helped promote growth in visitor numbers.
New Zealand’s biggest market for arrivals, Australia, continued to grow and will be the backbone of the industry for the coming year.
India remains a relatively small market for New Zealand, providing only 23,328 visitors in the year to June 2008. However, they are visitors who tend to visit during the quieter months of April, May and June, making them valuable to the tourism industry here.
Tourism New ZealandTourism New Zealand’s response to these changing market dynamics has been to review spending in all its major markets and to refocus its efforts and budgets on those regions where it feels it is likely to stimulate growth.
Despite more difficult conditions, New Zealand international visitor arrivals from our key markets increased slightly in the 2007/2008 financial year and overall visitor expenditure was up 4.7% compared to the previous year.
Tourism New Zealand also continued to innovate to find new ways to boost visitor numbers.
In August 2007, Tourism New Zealand unveiled a refreshed 100% Pure New Zealand campaign to the industry and to the public focusing on New Zealand as the ‘Youngest Country on Earth’.
The campaign was launched after a thorough review of the 100% Pure New Zealand campaign.
The decision was made that the 100% Pure New Zealand brand continued to prove its worth in international markets and remains a single, strong international brand that positions New Zealand well overseas. However, behind the campaign a great deal more work was done to change the strategic direction of how Tourism New Zealand reaches potential visitors.
Tourism New Zealand has shifted its focus to reaching people through the screens they use in everyday life. This means more work developing Tourism New Zealand’s trade and consumer websites.
Campaign and promotion work takes in the internet, blog sites, social networking sites. Advertisements have shown on screens in tube stations, railway stations, office entryways, shopping centres and
city billboards. This is alongside more
traditional screens like cinema and
television advertising.
However, Tourism New Zealand’s work
extends beyond its campaign work. There
is a continued focus on taking consumer
awareness of New Zealand as a holiday
destination and turning that interest into
holidays booked, tickets bought and
activities and accommodation paid for.
Overseas, that work starts when Tourism
New Zealand works with key trade
partners to develop and improve the
holiday and travel itineraries on offer. By
training product development managers
and front line staff, Tourism New Zealand
can influence those in the driving seat
selling New Zealand offshore.
By working with subsidiary partners,
Qualmark and i-SITE New Zealand,
Tourism New Zealand also strives to
improve the quality of visitors’ time here.
During the year, the number of Qualmark
licence-holders increased to over 2,100. In
May, the Qualmark environmental
accreditation programme was launched to
the industry and media at the TRENZ
conference in Rotorua.
Thank YouI would like to thank the Tourism Minister
Damien O’Connor, Tourism New Zealand’s
Chief Executive George Hickton and the
dedicated team at Tourism New Zealand
for the work and energy they put into
promoting New Zealand. I would also like
to thank our partners in Government, at
both national and local levels, and
the tourism industry for the support they
provide in ongoing funding, project
support, media hosting and with the many
other events that arise during the year.
I would particularly like to thank
outgoing director Kathy Guy and Chairman
Wally Stone and acknowledge their
contributions to the Tourism New Zealand
board. Wally has been Chairman since
1999 and his efforts mean I am inheriting
a vibrant, world-class tourism organisation.
On that note, I am pleased to be able to
present Tourism New Zealand’s annual
report for 2007/08.
Greg Muir Chairman, Tourism New Zealand
GREG MUIR CHAIRMAN TOURISM NEW ZEALAND
report for 2007/08.
Greg Muir
TOURISM NEW ZEALAND ANNUAL REPORT 2007–2008 3

GEORGE HICKTON
CHIEF EXECUTIVE’S REPORT
Highlights 2007/2008There is no doubt that last year was a
year of change, achievements and
challenges for Tourism New Zealand.
In one year, we launched the refreshed
global campaign, led a project to install a
giant inflatable rugby ball under the Eiffel
Tower in Paris, took a slice of
New Zealand life to Japan and helped the
world find out more about our culture and
country by hosting and promoting events
in New Zealand like Matariki and World
Environment Day.
All that was aside from the work the
organisation does every day promoting
New Zealand as a holiday destination.
That work resulted in hosting hundreds of
international media, thousands of training
sessions given to overseas travel sellers
and product managers and millions of
visits to our websites.
This work is all underpinned by Tourism New Zealand’s strategy to find more channels and more ways to tell potential visitors about the experience they can have when they get here.
We continue to look for innovative ways to promote our fantastic scenery and our people, but also to tell the stories that link the two.
As part of that strategy, Tourism New Zealand has moved to become a producer of content, rather than just a buyer of advertising space.
Being a producer allows us to tailor content to the screens people are using all the time to gather and share information – whether it be the internet, television or cinema screens, electronic billboards, i-Pods, large outdoor screens or the inside of a giant rugby ball.
However, recent events have also served as reminder that the New Zealand’s
New Zealand’s Giant Rugby
Ball venue is officially
opened in the heart of Paris.
GEORGE HICKTON CHIEF EXECUTIVE TOURISM NEW ZEALAND
TOURISM NEW ZEALAND ANNUAL REPORT 2007–20084

multi-billion dollar tourism industry
cannot be taken for granted.
Overall, tourist arrivals and spending
increased in the last financial year,
though deteriorating international
economic conditions in many of our
source markets combined to hold growth
at below Tourism New Zealand’s target
levels in some areas.
As with all businesses experiencing
change, Tourism New Zealand reviewed
our major markets and budget as a result
of these global changes.
Japan continues to be extremely
important to New Zealand, but further
investment in campaign work was felt
unlikely to yield much improvement in
arrival figures. Accordingly, our focus
there is now on working with the
Japanese travel trade on product
development focusing on the quality of
yield. Korea is in a similar position.
The UK and USA markets remain very
important for New Zealand. Because
of concerns about softening arrival
numbers, we felt it was timely to
conduct new research in those
markets to better understand current
consumer perceptions of New Zealand
as a destination.
That work has resulted in a new
campaign for the UK, which was
launched in September 2008. It is hoped
that the campaign will slow what will
inevitably be a declining market given the
current conditions. Research was also
concluded and evaluated in the US.
China, Australia and Canada have shown
good capacity for growth and we believe
this may continue given the right level of
investment in campaign work. In the case
of China, investment continues to
improve the quality of holidays for
Chinese group tour visitors.
Overall, last year was one of the most
exciting years for Tourism New Zealand
and one of its busiest.
Sadly, the economic turmoil overseas
will inevitably make the coming year a
far more challenging one for Tourism
New Zealand and the New Zealand
tourism industry.
AdvertisingOne of the biggest events in Tourism
New Zealand’s calendar for the year was
the launch of a new global campaign with
a focus on New Zealand as ‘The Youngest
Country on Earth’.
The campaign captures the youth of the
country, the vibrancy of our people and
allows us to promote New Zealand as a
place to experience life as it should be.
After being unveiled to the industry and
media in New Zealand in August, the
Youngest Country campaign was rolled
out around the world, showing for the first
time in the growing Chinese market, as
well as in the UK, USA, Australia, Japan,
Germany and Canada.
Alongside that, the successful ‘What’s On’
campaign, which supports the 100%
Pure New Zealand campaign in Australia,
completed its second year in the market.
The campaign has been successful in
improving seasonal performance out of
Australia in the traditionally slower holiday
months of spring, winter and autumn.
The campaign’s flexibility was
demonstrated in the fast turn-around of a
one-off television advertisement that went
to air in Sydney during APEC.
EventsTourism New Zealand has a long history
of using events as a platform to promote
New Zealand.
Sometimes the events are onshore, like
the Michael Hill New Zealand Golf Open,
Matariki and the Montana World of
WearableArt Awards.
Offshore events during the year included
the installation of a giant inflatable rugby
ball under the Eiffel Tower in France
during the last stages of the Rugby World
Cup and the New Zealand Paradise
Week, which promoted New Zealand’s
food and wine, music, fashion, culture
and the latest tourism activities to
Japanese visitors.
The benefit of using events with high
public and media awareness are clear
when you look at the results.
During the two weeks the Rugby Ball
Venue was in place in Paris, over 24,000
people queued to enter the ball and
experience a stunning audio-visual
display. However, almost 138 million
people were exposed to the ball and
New Zealand messages through media
coverage online, in newspapers and on
television and radio.
In Japan, over 17,000 visitors attended
The New Zealand Paradise Week and
internet traffic to Tourism New Zealand’s
consumer website hit a record two-year
high during the festival period.
Throughout both of these major offshore events, Tourism New Zealand received support and input from a number of Government agencies including the Department of Labour, Ministry for Culture and Heritage, Ministry for Foreign Affairs and Trade and New Zealand Trade and Enterprise.
OnlineOur online team had another busy year keeping up with the demands of potential visitors seeking high-quality, well-presented and easy-to-access information about New Zealand.
As a result of behind the scenes work, the travel trade can now load travel deals and special offers directly to newzealand.com. Tourism New Zealand also began syndicating content to other sites, for example Tourism Auckland.
The entry pages for the Chinese, Korean and German sites were revamped and the Australian page was constantly refreshed to reflect the ‘What’s On’ campaign as it rolled out in spring, autumn and winter.
On top of that, the team managed to squeeze in the launch of the Front Row Rugby Club, which aims to build an online community in the run up to New Zealand hosting the Rugby World Cup 2011, and to create a new ‘Great Walks’ subsection in English, German and Korean, promoting the nine great walks of New Zealand.
International Media ProgrammeThe International Media programme continues to be a highly effective way of using international media to reach visitors in our target markets.
During the year the team, together with local Regional Tourism Organisations and operators, hosted 524 media from 15 countries. The resulting media coverage reached almost a billion people in our target markets.
As well as traditional media visits, the international media team has developed an opinion leaders’ programme.
In keeping with the organisation’s strategy to use screens, the programme targets high-profile, influential people who can promote the New Zealand experience through a variety of media outlets, and can talk with our target audiences either online or in person.
The international media team hosted six opinion leaders during the year from the
TOURISM NEW ZEALAND ANNUAL REPORT 2007–2008 5

UK, USA, Japan, and China. Highlights
from the programme include:
British TV presenter and adventurer
Ben Fogle, who visited in February
2008, did a range of outdoor adventure
and cultural experiences. The
video diaries of his trip were broadcast
on Tourism New Zealand’s channel on
YouTube, as well as on newzealand.com
and the Daily Telegraph website.
Popular Japanese stage and screen
actress Beverley Maeda visited
New Zealand to promote walking
tours accompanied by a media contingent
from a documentary crew, a magazine
and two websites.
In May, Chinese media mogul Wang
Zhongjun and leading actor Deng
Chau visited New Zealand to learn about
New Zealand’s film industry and luxury
experiences. A series of articles was
posted on leading Chinese internet site
sina.com, which has 100 million users.
One article alone about Mr Wang’s bungy
jump was viewed by 24 million unique
users in the first 12 hours.
Corporate CommunicationsTourism New Zealand continues to invest
heavily in talking to the tourism industry
and other stakeholders; they are our
partners in developing a world-class
tourism industry and improving visitor
satisfaction.
Tourism New Zealand’s staff regularly
present at conferences and seminars
around the country providing an
international perspective on the
tourism industry.
We also continued to produce a quarterly
newsletter, Regional Rap, which is sent
out to around 1,500 people, and the
bi-monthly Tourism News which reaches
6,300 people.
Travel TradeSome of the most valuable work done to
promote New Zealand is done when our
staff work directly with overseas travel
companies developing and selling
holidays to New Zealand.
During the year, Tourism New Zealand ran
an International Marketing Alliance (IMA)
roadshow in the USA. The trip involved
taking local representatives to meet key
US travel sellers, airlines and advertising
and public relations specialists to gain a
better understanding of the opportunities
and challenges in that market.
Product workshops focused on itinerary
development and new product
opportunities to help sell New Zealand.
These workshops were held in Singapore,
Malaysia, Thailand, Taiwan, Hong Kong,
Korea, mainland China and the UK.
Trade training continued with over
21,000 international travel sellers and
product planners trained throughout
the year. Training took place via
seminars, conferences, roadshows and
familiarisation trips. Live online training
via the internet has also been trialled in
Canada this year with great success.
During the year a major review and
overhaul of Tourism New Zealand’s trade
website was undertaken. The improved
site will be easier to use, has improved
functionality and provides more targeted
information for travel sellers.
Delivering Quality Tourism New Zealand continues to be
involved in efforts to monitor and improve
visitor satisfaction and the quality of visits
to New Zealand. Tourism New Zealand
does that through our majority-owned
subsidiary Qualmark, which now boasts
over 2,000 registered operators.
The scheme took a major step forward
this year when the accreditation process
expanded to cover environmental
sustainability.
Qualmark-accredited operators now
have to reach minimum environmental
standards as part of their Qualmark
accreditation, but those with more
developed environmental systems
can aim for higher gold, silver and
bronze rankings.
The system was introduced as a result
of the industry’s commitment to
sustainability through the New Zealand
Tourism Strategy.
Tourism New Zealand continued to
work with the i-SITE visitor network,
which delivered information and advice
to over 930,000 international visitors
during the year.
A nationwide booking system, introduced
last year, has bedded down and is helping
to improve the speed and quality of
information given by front-line i-SITE staff.
In November 2007, Tourism New Zealand
took over the management of
New Zealand’s Approved Destination
Status (ADS) agreement with the Chinese
Government.
Problems had been experienced with
low-quality tours and, as China is now one
of New Zealand’s fastest-growing markets,
we feel it is important to improve the
quality of ADS group tours.
Finally, I would like to thank Tourism
New Zealand’s staff and our trade
partners, both here and abroad, for the
effort they put in to promoting
New Zealand as a visitor destination for
the benefit of all New Zealanders.
George HicktonChief Executive, Tourism New Zealand
New Zealand’s culture
and people draw visitors
to our country
TOURISM NEW ZEALAND ANNUAL REPORT 2007–20086

ABOUT TOURISM NEW ZEALANDTourism New Zealand was created with the role of marketing New Zealand as a visitor destination overseas for the long-term benefit of New Zealand.
It is an exciting and challenging job in a fast-moving industry both in New Zealand and overseas.
In 2007, 903 million tourists travelled worldwide and spent US$856 (NZ$1,309) billion.
New Zealand sees just a tiny proportion of that huge international tourism market. In the year to June 2008, almost 2.5 million international visitors arrived in New Zealand and spent almost $6.2 billion dollars (excluding airfare receipts).
To keep New Zealand in the spotlight among potential visitors, and to send those who come here home happy, Tourism New Zealand works in three main areas – Campaign, Channel and Capability.
The campaign area is probably the most recognisable aspect of Tourism New Zealand’s work because the results of that work often carries the 100% Pure New Zealand brand through television commercials or other promotional activities. Less obvious, but highly successful, is Tourism New Zealand’s International Media Programme, which promotes New Zealand through hosting international media.
The organisation’s Channel work is designed to convert a potential visitor’s desire to travel to New Zealand into actually making the trip. Much of this work is done through Tourism New Zealand’s 11 offshore offices, where staff work with the travel trade developing new ideas for itineraries, promote new products and train front-line sales staff so they know more about New Zealand and can sell it more effectively.
Ensuring visitors go home happy and tell others to visit is one of the most important marketing tools New Zealand has and
that forms the basis of Tourism New Zealand’s Capability work.
To find out what visitors think about their time here and their satisfaction levels, Tourism New Zealand has an ongoing research programme.
The organisation also works with subsidiary organisations Qualmark and i-SITE New Zealand to ensure people are getting good information and access to good quality accommodation, activities and transport.
Tourism New Zealand also takes a leadership stance in areas like environmental best practice. During the year, the organisation contributed to the development of the New Zealand Tourism Strategy to 2015 which cited environmental enhancement and protection as a key goal for the Tourism Industry.
Tourism New Zealand has also joined the Govt3 programme to monitor and improve its own environmental performance.
former all black tana umaga
captains the front row rugby
club, an online community
of fans being welcomed to
new zealand for the rugby
world cup in oii.TOURISM NEW ZEALAND ANNUAL REPORT 2007–2008 7

Tourism New Zealand continually reviews the markets in which it operates and the extent to which it is involved in those markets. Tourism New Zealand currently has 11 offshore offices.
Management of offshore activity is achieved through a regional structure whereby six regional managers report directly to the General Manager Operations, Tim Hunter. Currently regional managers are located in London, Los Angeles, Shanghai, Tokyo, Sydney and Mumbai.
Exposure to fluctuations in foreign currency exchange rates on normal operating activities in these countries is achieved through the use of foreign exchange instruments. Tourism New Zealand does not use financial instruments for speculative purposes.
The board is kept appraised of offshore activity at each board meeting through a report by the General Manager Operations detailing activity by market.
MANAGEMENT AT TOURISM NEW ZEALAND
Keith Thomas, General Manager Corporate Services Keith is responsible for information technology, finance and the human resources aspects of the organisation.
Catherine Bates, General Manager Consumer MarketingCatherine is responsible for managing, leading and contributing to the attainment of Tourism New Zealand’s marketing vision. She works with her team to develop and implement integrated creative and marketing communications plans to deliver Tourism New Zealand’s marketing activities.
Jane Dent, General Manager International Public RelationsJane’s role is to guide the organisation’s overall public relations efforts to reflect the message of the global brand campaign. Tourism New Zealand achieves PR in its key markets through events, both offshore and onshore, public relations activity and the International Media Programme (IMP).
Cas Carter, General Manager CommunicationsCas is responsible for Tourism New Zealand’s internal and external communication. Responsibilities include liaising with stakeholders such as the tourism industry, government, media and other stakeholders on tourism industry activities and issues.
Tim Hunter, General Manager OperationsTim manages Tourism New Zealand’s international operations. This involves coordinating project planning for international markets, supporting international trade development work, managing the overseas travel industry and online training programmes and coordinating trade networking events and consumer shows.
David Wilks, General Manger Tourism DevelopmentDavid is responsible for supporting the promise of New Zealand as a high-quality destination. This is achieved through Tourism New Zealand’s subsidiary commitments, the i-SITE Visitor Information Network and Qualmark, and broader destination management initiatives. David is also executive manager of i-SITE New Zealand and chair of Qualmark.
He is also responsible for ensuring that Tourism New Zealand naturally expresses the values of our unique cultural identity.
Simon Douglas, Manager Corporate Strategy and PlanningSimon is responsible for government liaison and the preparation of strategic documents, including Tourism New Zealand’s Statement of Intent and annual Output Agreement with the Minister of Tourism. He also manages Tourism New Zealand’s funding relationships with government.
THE TOURISM NEW ZEALAND EXECUTIVE TEAM
As a sponsor of the montana world of
wearablearttm awards since ooi, Tourism
New Zealand has helped build the profile
of this premiere art event internationally
TOURISM NEW ZEALAND ANNUAL REPORT 2007–20088

GOVERNANCE AT TOURISM NEW ZEALANDThe New Zealand Tourism Board (trading as Tourism New Zealand) was established on 1 November 1991, as a Crown Entity under the provisions of the New Zealand Tourism Board Act 1991. As a Crown Entity, Tourism New Zealand is expected to comply with the appropriate provisions of the Crown Entities Act 2004.
The board of directors of Tourism
New Zealand, including the position of
Chairman, is appointed by the Minister of
Tourism. A profile of the current directors
of Tourism New Zealand is shown on
page 11. All directors receive formal
letters of appointment from the Minister
of Tourism setting out their duties, terms
and conditions of appointment and the
expectations of their role.
By virtue of the appointments made by
the Minister of Tourism, the board has
a wide range of skills in the tourism
industry and the wider commercial
environment. This provides for a
well-balanced board which enables it to
deal with the issues arising from the role
it plays in marketing New Zealand as a
visitor destination.
Tourism New Zealand introduces each
new director to the organisation through
an induction process involving time spent
with each member of the Executive and
his or her respective team. Directors are
also encouraged, where appropriate, to
attend tourism-related events such as
TRENZ, the annual Tourism Conference
and the Inbound Tour Operators Council
Conference.
The board has six scheduled meetings
a year including a two-day meeting in
December to review the organisation’s
ongoing strategic direction. As a result of
the strategic meeting, the organisation’s
goals are set and the formal business
planning process commenced. Additional
board meetings are scheduled as required.
Under Section 92 of the Crown Entities
Act 2004, the board must ensure that
the organisation acts in a manner
consistent with the Statement of Intent
and Output Agreement it has negotiated
with the Crown.
Tourism New Zealand is required to
report quarterly on its performance
against these documents. The reports
form the basis of discussion and review
by the board at regular meetings timed
to coincide with the required reporting
deadlines.
Unless specifically directed by the
Minister of Tourism, the board is the
overall and final body responsible for
all decision-making within Tourism
New Zealand.
abc
Outgoing Chairman Wally stone
talking to delegates at the PATA
ceo challenge on new zealand
tourism initiatives on confronting
climate change
TOURISM NEW ZEALAND ANNUAL REPORT 2007–2008 9
There is a direct relationship between the Minister of Tourism and the Chairman of the board. The Chairman has regular meetings with the Minister to discuss progress and issues facing the tourism industry.
As well as this regular communication and engagement with its shareholding Minister, Tourism New Zealand is aware of the need to engage with the wider community to promote an understanding of tourism development and associated issues. Tourism New Zealand achieves this through regular meetings with various industry groups, regional seminars run throughout the year as well as number of external publications, such as Tourism News.
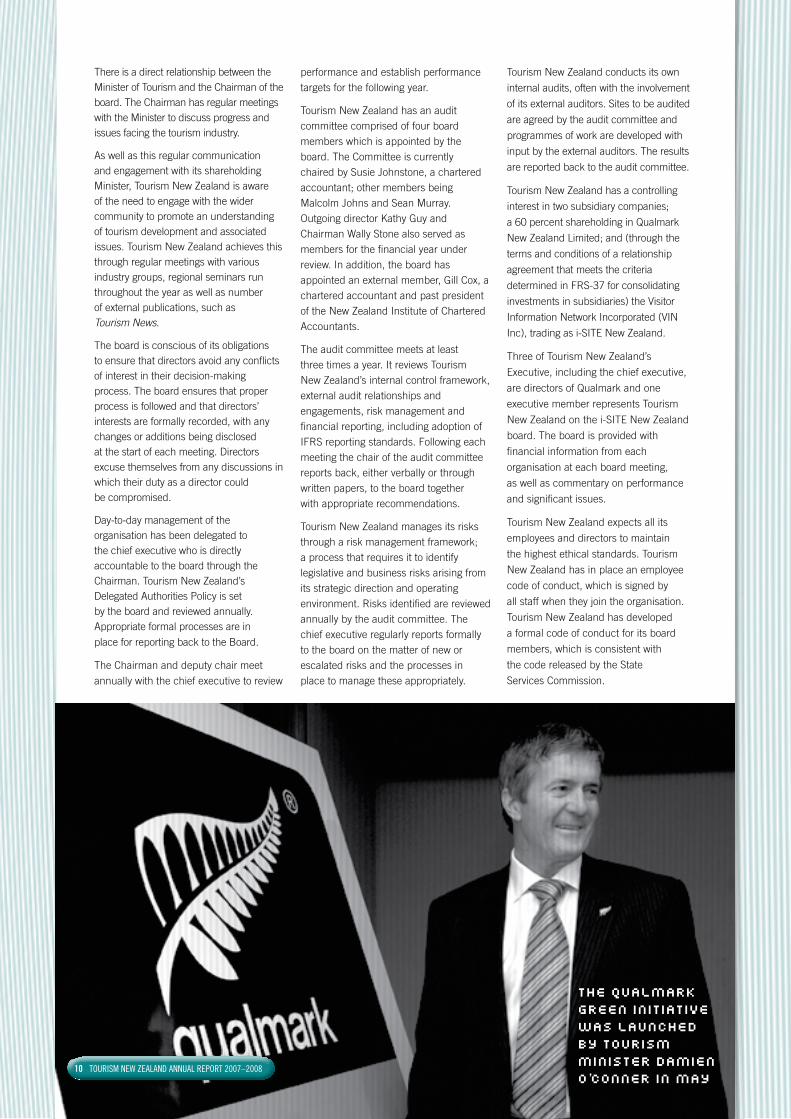
The board is conscious of its obligations to ensure that directors avoid any conflicts of interest in their decision-making process. The board ensures that proper process is followed and that directors’ interests are formally recorded, with any changes or additions being disclosed at the start of each meeting. Directors excuse themselves from any discussions in which their duty as a director could be compromised.
Day-to-day management of the organisation has been delegated to the chief executive who is directly accountable to the board through the Chairman. Tourism New Zealand’s Delegated Authorities Policy is set by the board and reviewed annually. Appropriate formal processes are in
place for reporting back to the Board.
The Chairman and deputy chair meet
annually with the chief executive to review
performance and establish performance targets for the following year.
Tourism New Zealand has an audit committee comprised of four board members which is appointed by the board. The Committee is currently chaired by Susie Johnstone, a chartered accountant; other members being Malcolm Johns and Sean Murray. Outgoing director Kathy Guy and Chairman Wally Stone also served as members for the financial year under review. In addition, the board has appointed an external member, Gill Cox, a chartered accountant and past president of the New Zealand Institute of Chartered Accountants.
The audit committee meets at least three times a year. It reviews Tourism New Zealand’s internal control framework, external audit relationships and engagements, risk management and financial reporting, including adoption of IFRS reporting standards. Following each meeting the chair of the audit committee reports back, either verbally or through written papers, to the board together with appropriate recommendations.
Tourism New Zealand manages its risks through a risk management framework; a process that requires it to identify legislative and business risks arising from its strategic direction and operating environment. Risks identified are reviewed annually by the audit committee. The chief executive regularly reports formally to the board on the matter of new or escalated risks and the processes in place to manage these appropriately.
Tourism New Zealand conducts its own
internal audits, often with the involvement
of its external auditors. Sites to be audited
are agreed by the audit committee and
programmes of work are developed with
input by the external auditors. The results
are reported back to the audit committee.
Tourism New Zealand has a controlling
interest in two subsidiary companies;
a 60 percent shareholding in Qualmark
New Zealand Limited; and (through the
terms and conditions of a relationship
agreement that meets the criteria
determined in FRS-37 for consolidating
investments in subsidiaries) the Visitor
Information Network Incorporated (VIN
Inc), trading as i-SITE New Zealand.
Three of Tourism New Zealand’s
Executive, including the chief executive,
are directors of Qualmark and one
executive member represents Tourism
New Zealand on the i-SITE New Zealand
board. The board is provided with
financial information from each
organisation at each board meeting,
as well as commentary on performance
and significant issues.
Tourism New Zealand expects all its
employees and directors to maintain
the highest ethical standards. Tourism
New Zealand has in place an employee
code of conduct, which is signed by
all staff when they join the organisation.
Tourism New Zealand has developed
a formal code of conduct for its board
members, which is consistent with
the code released by the State
Services Commission.
The qualmark
green initiative
was launched
by tourism
minister Damien
O’Conner in mayTOURISM NEW ZEALAND ANNUAL REPORT 2007–200810

BOARD MEMBERS
Greg MuirChairmanGreg was appointed Chairman of the New Zealand Tourism Board in July 2008. He is currently executive Chairman of Pumpkin Patch.
Before that, Greg was chief executive officer of The Warehouse Group Ltd and has held senior management roles with TNT Australia Pty Ltd, Enerco New Zealand Ltd and Lion Nathan Ltd. Greg is also currently Chairman of Hanover Group Limited, Pioneer Capital Management Ltd, the Blues S14 Franchise and a director of the Auckland Rugby Union.
Susie JohnstoneDeputy ChairSusie is a director of the chartered accountancy firm Shand Thomson. She is currently the deputy chair of Otago District Health Board and the Southland District Health Board, a board member of the New Zealand Blood Service and a member of the Otago Polytechnic Council. She has also held governance roles on the boards of Telford Rural Polytechnic, the New Zealand Hockey Federation and the Institute of Chartered Accountants.
Paul BinghamDirectorPaul is managing director of Black Cat Group. He is also Chairman of Christchurch and Canterbury Tourism, a past member of the Tourism Research Council New Zealand and the Banks Peninsula Tourism and Economic Development Board. Paul has recently been appointed to the board of Air New Zealand. He has previously held positions with Tourism Holdings Ltd and Air New Zealand.
Sean MurrayDirectorSean has been a director on the board of Tourism New Zealand since 2003 and before that had been the Chairman of the Tourism Research Council.
Currently an independent consultant, he was previously Group General Manager Commercial with Tourism Holdings Ltd. His principal background is in strategic planning, change management (including acquisition and divestment), financial and operational performance, relationship management and brand marketing.
John BarrettDirectorJohn is managing director of Kapiti Island Alive & Kapiti Nature Lodge, a family eco-tourism operation based on Kapiti Island.
John is also currently Chairman of both the New Zealand Tourism Council and the Wellington Regional Tourism organisation, Te Ara a Maui. He also sits on the Board of Aviation Tourism & Travel Training Organisation (ATTTO) and a number of non-tourism related organisations.
Kay MckelvieDirectorKay has been chair of Waitemata District Health Board since 2001 and is also chair of Quotable Value and the State Housing Appeal Authority and a director of the Crown Health Financing Agency. She is a qualified lawyer with a Masters in Business Administration from Auckland University.
Malcolm JohnsDirectorMalcolm is chief executive of Intercity Holdings Limited, parent company of Intercity Coachlines, Newmans Coach Lines, Great Sights New Zealand, Fullers Bay of Islands, Kings Dolphin Cruises and Eco Tours. Malcolm has extensive commercial experience in international tourism and transport businesses having held senior management and governance roles at Discover Canada Holidays, Jasons Travel Media, Tourism Holdings, Mount Cook Group and Hyatt International Hotels and Resorts.
Glenys CoughlanDirectorGlenys, MA and MBA, is chief executive of NBPR (public relations) and Dazzle Events – both part of the Acumen Group in which she is a co-owner and director.
Glenys has over 20 years experience in the tourism industry including four years as chief executive of the Tourism Industry Association and eight years in senior management with Air New Zealand. She is a longstanding director of Te Papa, chair of Positively Wellington Tourism, a director of the Wellington Regional Economic Development Agency and a trustee of the PATA New Zealand Trust.
Henry van AschDirectorHenry joined the board of Tourism New Zealand in September 2008. A co-founder of AJ Hackett Bungy, Henry has been a director of Bungy New Zealand Ltd since 1997. Henry oversees ownership and operation of the Bungy New Zealand Group (which includes AJ Hackett Bungy and Auckland Bungy & Bridge Climb) along with his latest ventures the High Plains Wine Co and The Winehouse & Kitchen Restaurant.
Note: Chairman Wally Stone retired from the board on 30 June 2008 Director Kathy Guy resigned from the board on 14 August 2008 TOURISM NEW ZEALAND ANNUAL REPORT 2007–2008 11

STATEMENT OF SERVICE PERFORMANCE
Overview This report covers The New Zealand Tourism Board’s (trading as Tourism New Zealand) service performance for the year ending 30 June 2008 against the objectives set out in the 2007/08 Statement of Intent.
Tourism New Zealand’s resource allocation decisions were based on the extent to which each proposed activity would contribute towards its objectives and the delivery of outputs contained in the 2007/08 Statement of Intent.
Tourism New Zealand’s Output Agreement for 2007/08, agreed with the Minister of Tourism, contains more detailed performance measures.
This Statement of Service Performance includes reporting against priorities in the Statement of Intent (SOI) and against the additional performance measures contained in the Output Agreement.
TOURISM NEW ZEALAND ANNUAL REPORT 2007–200812
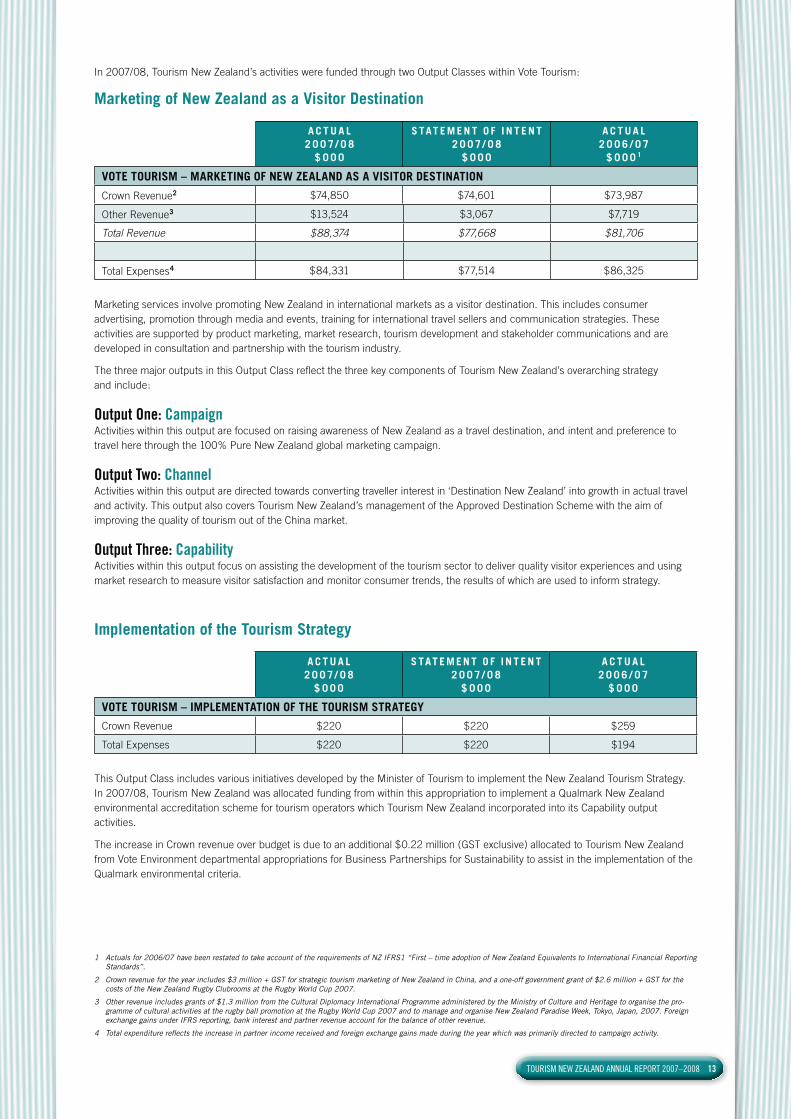
In 2007/08, Tourism New Zealand’s activities were funded through two Output Classes within Vote Tourism:
Marketing of New Zealand as a Visitor Destination
A C T U A L 2 0 0 7 / 0 8
$ 0 0 0
S TAT E M E N T O F I N T E N T 2 0 0 7 / 0 8
$ 0 0 0
A C T U A L 2 0 0 6 / 0 7
$ 0 0 0 1
VOTE TOURISM – MARKETING OF NEW ZEALAND AS A VISITOR DESTINATION
Crown Revenue2 $74,850 $74,601 $73,987
Other Revenue3 $13,524 $3,067 $7,719
Total Revenue $88,374 $77,668 $81,706
Total Expenses4 $84,331 $77,514 $86,325
Marketing services involve promoting New Zealand in international markets as a visitor destination. This includes consumer advertising, promotion through media and events, training for international travel sellers and communication strategies. These activities are supported by product marketing, market research, tourism development and stakeholder communications and are developed in consultation and partnership with the tourism industry.
The three major outputs in this Output Class reflect the three key components of Tourism New Zealand’s overarching strategy and include:
Output One: Campaign Activities within this output are focused on raising awareness of New Zealand as a travel destination, and intent and preference to travel here through the 100% Pure New Zealand global marketing campaign.
Output Two: Channel Activities within this output are directed towards converting traveller interest in ‘Destination New Zealand’ into growth in actual travel and activity. This output also covers Tourism New Zealand’s management of the Approved Destination Scheme with the aim of improving the quality of tourism out of the China market.
Output Three: Capability Activities within this output focus on assisting the development of the tourism sector to deliver quality visitor experiences and using market research to measure visitor satisfaction and monitor consumer trends, the results of which are used to inform strategy.
Implementation of the Tourism Strategy
A C T U A L 2 0 0 7 / 0 8
$ 0 0 0
S TAT E M E N T O F I N T E N T 2 0 0 7 / 0 8
$ 0 0 0
A C T U A L 2 0 0 6 / 0 7
$ 0 0 0
VOTE TOURISM – IMPLEMENTATION OF THE TOURISM STRATEGY
Crown Revenue $220 $220 $259
Total Expenses $220 $220 $194
This Output Class includes various initiatives developed by the Minister of Tourism to implement the New Zealand Tourism Strategy. In 2007/08, Tourism New Zealand was allocated funding from within this appropriation to implement a Qualmark New Zealand environmental accreditation scheme for tourism operators which Tourism New Zealand incorporated into its Capability output activities.
The increase in Crown revenue over budget is due to an additional $0.22 million (GST exclusive) allocated to Tourism New Zealand from Vote Environment departmental appropriations for Business Partnerships for Sustainability to assist in the implementation of the Qualmark environmental criteria.
1 Actuals for 2006/07 have been restated to take account of the requirements of NZ IFRS1 “First – time adoption of New Zealand Equivalents to International Financial Reporting Standards”.
2 Crown revenue for the year includes $3 million + GST for strategic tourism marketing of New Zealand in China, and a one-off government grant of $2.6 million + GST for the costs of the New Zealand Rugby Clubrooms at the Rugby World Cup 2007.
3 Other revenue includes grants of $1.3 million from the Cultural Diplomacy International Programme administered by the Ministry of Culture and Heritage to organise the pro-gramme of cultural activities at the rugby ball promotion at the Rugby World Cup 2007 and to manage and organise New Zealand Paradise Week, Tokyo, Japan, 2007. Foreign exchange gains under IFRS reporting, bank interest and partner revenue account for the balance of other revenue.
4 Total expenditure reflects the increase in partner income received and foreign exchange gains made during the year which was primarily directed to campaign activity.
TOURISM NEW ZEALAND ANNUAL REPORT 2007–2008 13

MARKETING OF NEW ZEALAND AS A VISITOR DESTINATION:
The Tourism New Zealand global marketing campaign, 100% Pure New Zealand, seeks to establish New Zealand as a ‘top of mind’ destination for travellers seeking authentic experiences that connect directly with our land and its people. The campaign promotes the core essence of the New Zealand experience, showing visitors how they can interact with our culture and natural environment.
The campaign is targeted at potential travellers whose expectations match what New Zealand has to offer. These people travel regularly, participate in a wide range of tourism experiences, actively participate in a natural environment, are environmentally and culturally aware, seek authentic and new experiences and want to share them with others. Tourism New Zealand refers to these visitors as the ‘Interactive Traveller®’.
Prompted Awareness of New Zealand as a Travel Destination MeasureMaintain prompted awareness levels for New Zealand as a travel destination expressed in percentage terms in the following markets: Australia, the UK, USA, Japan, China, South Korea and Germany. Trend data will be provided quarterly.
Q15 Q 2 6 Q 3 7 Q 4 8 S TAT U S
Interactive Travellers (ITs) Achieved
Australia9 54% 55% 53% 55%
UK 29% 26% 30% 30%
USA 16% 17% 21% 17%
Japan 13% 14% 28% 22%
China 30% 30% 40% 45%
South Korea 16% 19% 33% 24%
Germany 13% 16% 25% 23%
Non-Interactive Travellers (Non-ITs)
Australia 48% 50% 54% 52%
Long Haul Travel Intenders (LHTIs)
UK 28% 23% 27% 27%
USA 16% 13% 18% 15%
Japan 12% 13% 25% 20%
China 26% 30% 36% 39%
South Korea 14% 15% 28% 22%
Germany 12% 13% 23% 20%
5 Time series for this data is April-June 2007.
6 Time series for this data is October-December 2007.
7 Time series for this data is January-March 2008.
8 Time series for this data is April-June 2008.
9 Data for Australia will compare all holiday travellers and Interactive Travellers. Data for remaining markets compare Long Haul Travel Intenders (LHTIs) and Interactive Travellers.
TOURISM NEW ZEALAND ANNUAL REPORT 2007–200814

Prompted Awareness Levels of the 100% Pure New Zealand Campaign MeasureReport on prompted awareness levels for the 100% Pure Campaign in percentage terms in the following markets: Australia, the UK, USA, Japan, China, South Korea and Germany. Trend data will be reported quarterly.
Q15 Q 2 6 Q 3 7 Q 4 8 S TAT U S
Interactive Travellers (ITs) Achieved
Australia9 52% 47% 55% 54%
UK 24% 26% 31% 30%
USA 21% 21% 11% 13%
Japan 13% 15% 11% 13%
China 28% 22% 28% 41%
South Korea 20% 19% 16% 16%
Germany 35% 43% 22% 18%
Non-Interactive Travellers (Non-ITs)
Australia 39% 40% 52% 36%
Long Haul Travel Intenders (LHTIs)
UK 25% 23% 27% 28%
USA 17% 18% 8% 10%
Japan 11% 14% 8% 10%
China 21% 23% 25% 30%
South Korea 22% 19% 12% 12%
Germany 32% 34% 18% 20%
New Zealand’s Ranking as a Preferred Holiday DestinationMeasureNew Zealand remains in the top five preferred holiday destinations with Interactive Travellers in Australia and the UK. Trend data will be provided quarterly.
Q15 Q 2 6 Q 3 7 Q 4 8 S TAT U S
% Ranking % Ranking % Ranking % Ranking
Australia 29 1st 27 2nd 27 2nd 29 1st Achieved
UK 21 3rd 17 6th = with Canada
20 6th 21 5th Achieved
CommentAt YE June 2008, New Zealand remains in the top five preferred holiday destinations with Interactive Travellers from Australia and the UK.
In Australia
the what’s
on campaign
adds another
level to the
ioo% pure
new zealand
message
AWARENESS CAMPAIGN
TOURISM NEW ZEALAND ANNUAL REPORT 2007–2008 15

MeasureImprove New Zealand’s ranking as a preferred holiday destination with Interactive Travellers in specified destinations – USA, Japan, China, South Korea and Germany. Trend data will be reported quarterly.
Q15 Q 2 6 Q 3 7 Q 4 8 S TAT U S
% Ranking % Ranking % Ranking % Ranking
USA 1210th = with
Japan11
11th = with Brazil, Greece
and Egypt18 6th 11
12th = with Germany
Not Achieved
Japan 18 7th 234th = with Canada
17 6th 215th = with Canada
Achieved
China 19 5th 207th = with Hong Kong
23 6th 246th = with
FranceNot
Achieved
South Korea
167th = with England
1310th = with
Bali23
4th = with USA and
Switzerland24 5th Achieved
Germany 21 3rd 22 3rd 1411th = with
Canada18
3rd = with Australia,
Greece and Spain
Partially Achieved
Intention to Travel to New ZealandMeasureReport on intention to travel to New Zealand expressed in percentage terms for the following markets – Australia, UK, USA, Japan, China, South Korea and Germany. Trend data will be provided quarterly.
Q15 Q 2 6 Q 3 7 Q 4 8 S TAT U S
Interactive Travellers (ITs) Achieved
Australia9 7% 11% 7% 8%
UK 4% 3% 7% 5%
USA 3% 2% 5% 2%
Japan 5% 7% 4% 7%
China 8% 8% 9% 8%
South Korea 2% 3% 9% 7%
Germany 3% 5% 4% 6%
Non-Interactive Travellers (Non-ITs)
Australia 7% 9% 10% 7%
Long-Haul Travel Intenders (LHTIs)
UK 3% 2% 6% 5%
USA 2% 2% 4% 2%
Japan 4% 5% 5% 6%
China 7% 7% 5% 7%
South Korea 3% 4% 9% 7%
Germany 4% 4% 3% 5%
CommentInteractive Traveller intention to travel to New Zealand remained slightly higher or stable across most markets when compared to Non-Interactive Travellers (Australia) and Long Haul Travel Intenders (other markets).
9 Data for Australia will compare all holiday travellers and Interactive Travellers. Data for remaining markets compare Long Haul Travel Intenders (LHTIs) and Interactive Travellers.
TOURISM NEW ZEALAND ANNUAL REPORT 2007–200816

Conversion RatioMeasureImprove the conversion ratio between awareness, preference and intention – and actual holiday arrivals for specified markets (Australia, the UK and USA), to be reported annually.
Result S TAT U S
Australia Conversion Ratio: 34% of this group (Interactive Travellers that were aware of New Zealand advertising) also had a preference to visit New Zealand (compared to 37% in 2006/07).
Conversion ratio: 31% of this group (Interactive Travellers who had a preference to travel to New Zealand) also intended to visit (compared to 29% in 2006/07).
change from YE 2007.
Partially Achieved
UK Conversion Ratio: 27% of this group (Interactive Travellers that were aware of New Zealand advertising) also had a preference to visit New Zealand (compared to 38% in 2006/07).
Conversion ratio: 25% of this group (Interactive Travellers who had a preference to travel to New Zealand) also intended to visit (compared to 33% in 2006/07).
change from YE 2007.
Not Achieved
USA Conversion Ratio: 32% of this group (Interactive Travellers that were aware of New Zealand advertising) also had a preference to visit New Zealand (compared to 31% in 2006/07).
Conversion ratio: 23% of this group (Interactive Travellers who had a preference to travel to New Zealand) also intended to visit (compared to 30% in 2006/07).
change from YE 2007.
Partially Achieved
Holiday Arrivals from Main MarketsMeasureProvide quarterly trend data for holiday arrivals from main markets including Australia, the UK, USA, Japan, Korea, China and Germany.
Result Y E J U N E 2 0 0 7 Y E J U N E 2 0 0 8 % C H A N G E S TAT U S
TOTAL HOLIDAY ARRIVALS 1,213,288 1,209,241 -0.3% Achieved
Australia 357,673 382,880 7.0%
UK 154,520 146,737 -5.0%
Germany 41,380 41,721 0.8%
USA 134,736 132,972 -1.3%
Canada 26,844 30,455 13.5%
Japan 99,375 88,714 -10.7%
Korea 78,092 58,835 -24.7%
China 68,262 79,184 16.0%
CommentFor YE June 2008, total holiday arrivals were down by 0.3% compared with the YE June 2007. Trend data was provided quarterly.
TOURISM NEW ZEALAND ANNUAL REPORT 2007–2008 17

Campaign Reach and ImpactMeasureReport bi-annually on the reach, frequency and impressions achieved through brand advertising in Australia, the USA, the UK and Japan.
C O U N T R Y M E D I A POTENTIAL AUDIENCE
J U LY- D E C 2 0 0 7 A C T U A L J A N - J U N E 2 0 0 8 A C T U A L
Japan Reach %
Freq. Impressions Reach %
Freq. Impressions
Newspaper and Free paper
6,515,350 30.50% 1.6 N/A10 N/A
Web Banner 117,420,316 125,897,587
Web Microsite (pageview)
184,209 N/A
C O U N T R Y M E D I A POTENTIAL AUDIENCE
J U LY- D E C 2 0 0 7 A C T U A L J A N - J U N E 2 0 0 8 A C T U A L
USA11 Reach %
Freq. Impressions Reach %
Freq. Impressions
Local TV
(Los Angeles)6,116,300 22% 1.4 1,976,000 47.3% 2.2 6,361,000
Local TV (San Francisco)
2,669,200 20% 1.2 649,000 47.2% 2.1 2,642,000
Local TV
(San Diego)1,058,200 N/A N/A N/A 47.3% 2.1 1,069,000
Online* 35,974,000 31% 1.4 65,570,660 54.6% 2.1 196,100,972
Search N/A 5% N/A128,902
clicksN/A N/A
231,189 clicks
Cinema N/A N/A N/A N/A N/A N/A 3,912,611
10 N/A = No Activity
11 USA Local TV Target Audience: Adults 25-49 (Nielsen/Scarborough/IMS). Online Audience: Adults 25-49 w/ $75K+ (2008 comScore Networks, Inc. (Time Period: Winter/Spring of 2008)) *Does not include – Admob, Dedicated Media.
DID YOU KNOW?
Tourism New ZealanD's
consumer websitE, www.newzealand.coM, receives in the region
of oo,ooo visits
a month
TOURISM NEW ZEALAND ANNUAL REPORT 2007–200818
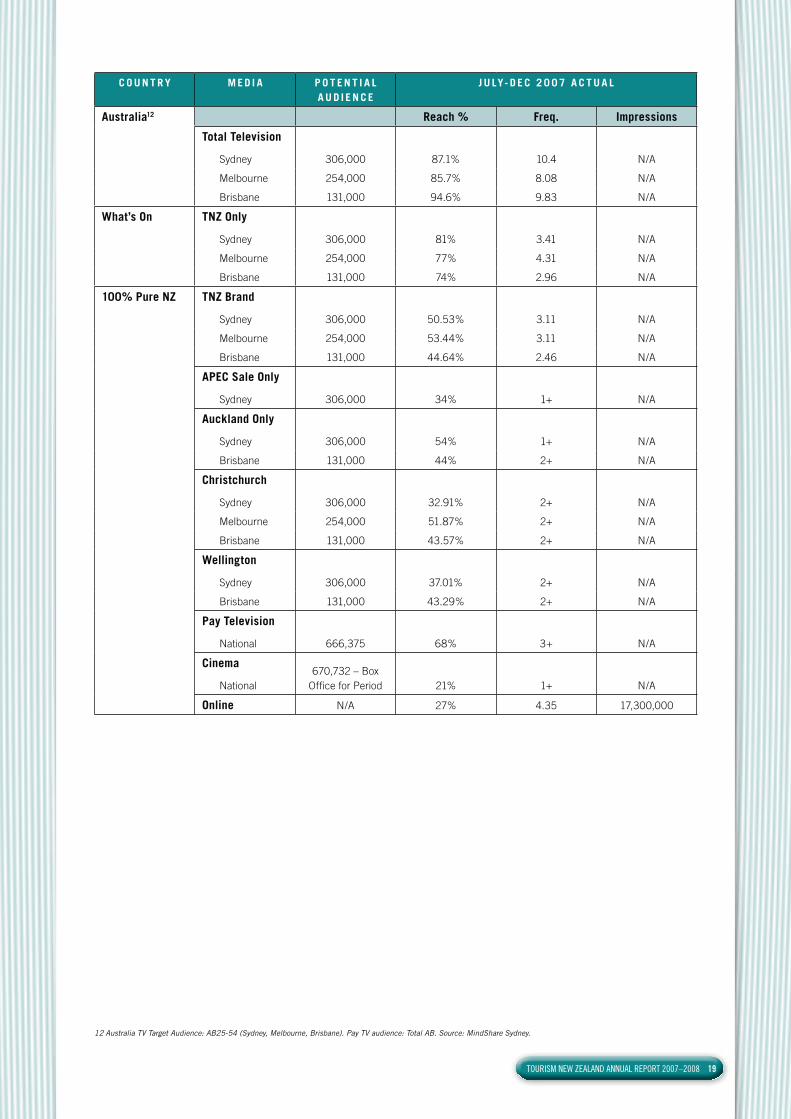
C O U N T R Y M E D I A P O T E N T I A L A U D I E N C E
J U LY- D E C 2 0 0 7 A C T U A L
Australia12 Reach % Freq. Impressions
Total Television
Sydney 306,000 87.1% 10.4 N/A
Melbourne 254,000 85.7% 8.08 N/A
Brisbane 131,000 94.6% 9.83 N/A
What’s On TNZ Only
Sydney 306,000 81% 3.41 N/A
Melbourne 254,000 77% 4.31 N/A
Brisbane 131,000 74% 2.96 N/A
100% Pure NZ TNZ Brand
Sydney 306,000 50.53% 3.11 N/A
Melbourne 254,000 53.44% 3.11 N/A
Brisbane 131,000 44.64% 2.46 N/A
APEC Sale Only
Sydney 306,000 34% 1+ N/A
Auckland Only
Sydney 306,000 54% 1+ N/A
Brisbane 131,000 44% 2+ N/A
Christchurch
Sydney 306,000 32.91% 2+ N/A
Melbourne 254,000 51.87% 2+ N/A
Brisbane 131,000 43.57% 2+ N/A
Wellington
Sydney 306,000 37.01% 2+ N/A
Brisbane 131,000 43.29% 2+ N/A
Pay Television
National 666,375 68% 3+ N/A
Cinema
National670,732 – Box
Office for Period 21% 1+ N/A
Online N/A 27% 4.35 17,300,000
12 Australia TV Target Audience: AB25-54 (Sydney, Melbourne, Brisbane). Pay TV audience: Total AB. Source: MindShare Sydney.
TOURISM NEW ZEALAND ANNUAL REPORT 2007–2008 19

C O U N T R Y M E D I A P O T E N T I A L A U D I E N C E
J A N - J U N E 2 0 0 8 A C T U A L
Australia12 Reach % Freq. Projections (000s) /
Impressions
Total Television
Sydney 612,000 91.6% 9.88 6,427
Melbourne 448,000 90.49% 8.87 3,473
Brisbane 258,000 95.83% 9.51 2,353
What’s On TNZ Only
Sydney 612,000 91.6% 9.88 6,427
Melbourne 448,000 90.49% 8.87 3,473
Brisbane 258,000 95.83% 9.51 2,353
100% Pure NZ TNZ Brand
Sydney N/A N/A N/A N/A
Melbourne N/A N/A N/A N/A
Brisbane N/A N/A N/A N/A
Christchurch
Sydney 602,000 55% 2.29 762
Melbourne 473,000 67% 2.67 795
Brisbane 300,000 62% 2.69 430
Christchurch Pay Television 236,000 8.25% 1+ N/A
Wellington
Sydney 607,000 55% 2.04 680
Melbourne 440,000 51.53% 2.15 505
Brisbane N/A N/A N/A N/A
Wellington Pay Television 124,000 5.09% 1+ N/A
Pay Television
National 408,000 13.07% 1+ N/A
Cinema
National450,000 – Box
Office for Period 9.4% 1+ N/A
Online N/A 49% 4.6324.5 million impressions
DID YOU KNOW?
australia is
new zealand's
biggest market for
international visitors
with almost one
million arrivals
every year
TOURISM NEW ZEALAND ANNUAL REPORT 2007–200820

COUNTRY M E D I A P O T E N T I A L A U D I E N C E
J U LY- D E C 2 0 0 7 A C T U A L J A N - J U N E 2 0 0 8 A C T U A L
Reach %
Freq. Impressions Reach %
Freq. Impressions
UK TV 23,700,000 38% 2.3 21,112,000 42.3% 2.7 24,089,000
Cinema 23,700,000 5.8% 1.6 2,507,934 N/A N/A N/A
OOH DEPS N/A N/A N/A N/A N/A N/A 2,150,232
OOH Transvision
N/A N/A N/A N/A 10% 3.5 N/A
OOH Sidetrack
N/A N/A N/A N/A N/A N/A 441,666
Online Ben Fogle
N/A N/A N/A N/A N/A 2.81 1,670,739
Online Brand Phase 2
N/A N/A N/A N/A N/A 2.57 9,625,872
Online Rambling
N/A N/A N/A N/A N/A 4.08 8,280,265
Online Brand Phase 1
N/A N/A N/A 34,513,121 N/A N/A N/A
Online Partners
N/A N/A N/A N/A N/A 2.59 4,232,854
Public Relations and International Media ProgrammeMeasureReport quarterly on the size of circulation/audience reached through articles and items broadcast by media representatives hosted by Tourism New Zealand13.
Result S TAT U S
A total circulation/audience of 998,481,269 was reached during the year (comprising a print circulation of 103,245,326; broadcast audience of 686,637,606; and online audience of 208,598,337).
Achieved
MeasureReport quarterly on the number of international media visits hosted in New Zealand and highlights.
Result S TAT U S
A total of 524 media were hosted during 2007/08. Achieved
Share of VoiceMeasureReport in Q3 on Tourism New Zealand’s share of voice in the four key markets of Australia, UK, USA and Japan, expressed as a trend since 2003.
Result S TAT U S
A report on Tourism New Zealand’s share of voice in the four key markets of Australia, UK, USA and Japan was provided in Quarter Three. Tourism New Zealand’s share of voice 2007 (based on Competitive Ranking Charts 2007 by MindShare) were:
Achieved
Australia 12%
UK 3%
USA 0.5%
Japan 4%
13 TNZ has limited and in most cases no control over when articles or items are published or broadcast by those international media hosted. TNZ will report on the audience or circulation for those items that have been published or broadcast during each quarter.
TOURISM NEW ZEALAND ANNUAL REPORT 2007–2008 21

New Zealand’s Share of Voice in Key Markets (2003-2007)
EventsMeasureEvents used to leverage off the global brand campaign.
Result S TAT U S
Tourism New Zealand supported eight events during the year.
Events supported through Tourism New Zealand only:
Montana World of WearableArt Awards – Wellington, New Zealand Giant Rugby Ball, Rugby World Cup – Paris, France New Zealand Paradise Week – Roppongi Hills, Tokyo, Japan World Environment Day – Wellington, New Zealand Matariki – Wellington, Northland, New Zealand.
Events supported through New Zealand Major Events Funds where Tourism New Zealand was the lead agency:
Michael Hill New Zealand Golf Open – Queenstown, New Zealand New Zealand Air Games – Central Otago/Wanaka, New Zealand American Express Queenstown Winter Festival.
A full evaluation report was provided on two major events: New Zealand Paradise Week 2007 and Rugby World Cup 2007 – the New Zealand Rugby Clubrooms.
Achieved
Market Evaluation MeasureComplete, in partnership with the Ministry, the first of the scheduled evaluations, as per agreed evaluation plan (30 June 2008). For 2007/2008, an Australian market evaluation will be completed by Tourism New Zealand in partnership with the Ministry (with the methodology and process to be agreed between TNZ and the Ministry) and the results reported to the Minister of Tourism by 30 June 2008. This evaluation will include an assessment of the effectiveness of TNZ’s objectives for this market.
Result S TAT U S
During the year, Tourism New Zealand provided the Ministry with data to complete the first of the scheduled market evaluations. The report back to the Minister has been deferred to later in the 2008 calendar year with agreement from the Ministry.
Deferred
The total cost of delivering outputs under the Campaign category is $48,228 million.
AUSTRALIA
JAPAN
UK
USA
16.00%
14.00%
12.00%
10.00%
8.00%
6.00%
4.00%
2.00%
0.00%
2002
/200
3
2003
/200
4
2004
/200
5
2006
2007
14 Data for 2002/03-2004/05 sourced from Mitchell Media; data for 2006-2007 based on Competitive Ranking Charts provided by MindShare.
TOURISM NEW ZEALAND ANNUAL REPORT 2007–200822
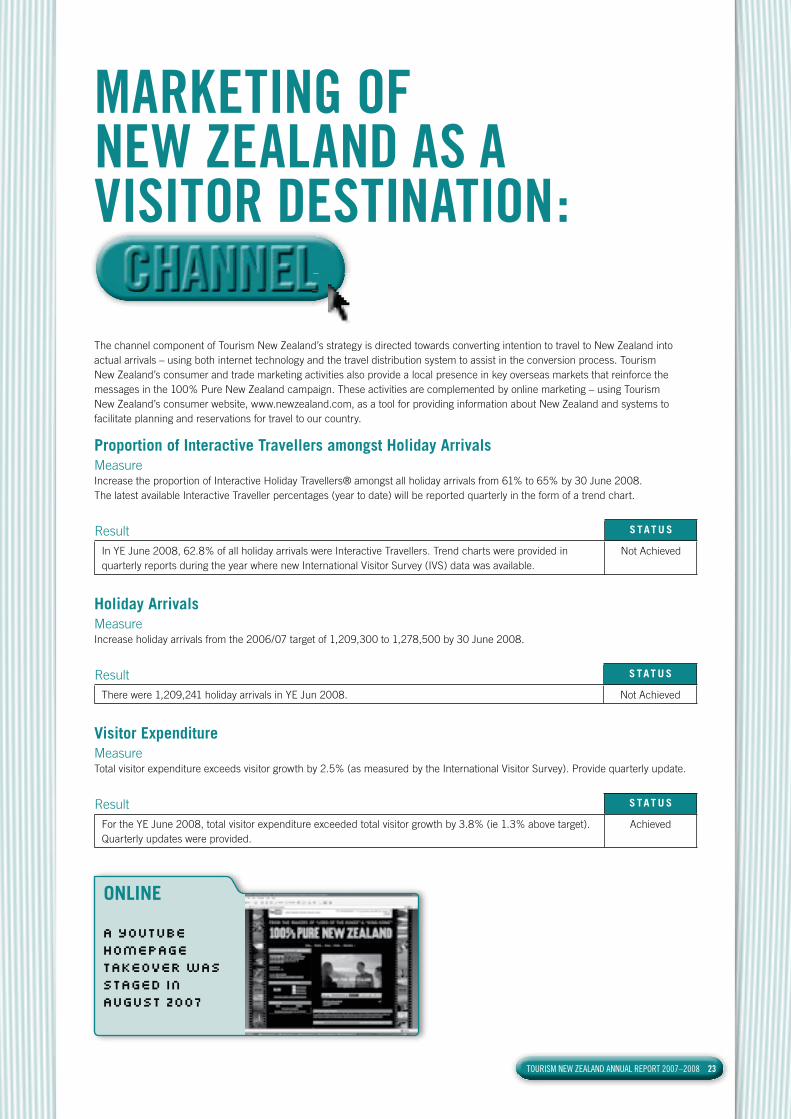
The channel component of Tourism New Zealand’s strategy is directed towards converting intention to travel to New Zealand into actual arrivals – using both internet technology and the travel distribution system to assist in the conversion process. Tourism New Zealand’s consumer and trade marketing activities also provide a local presence in key overseas markets that reinforce the messages in the 100% Pure New Zealand campaign. These activities are complemented by online marketing – using Tourism New Zealand’s consumer website, www.newzealand.com, as a tool for providing information about New Zealand and systems to facilitate planning and reservations for travel to our country.
Proportion of Interactive Travellers amongst Holiday Arrivals MeasureIncrease the proportion of Interactive Holiday Travellers® amongst all holiday arrivals from 61% to 65% by 30 June 2008. The latest available Interactive Traveller percentages (year to date) will be reported quarterly in the form of a trend chart.
Result S TAT U S
In YE June 2008, 62.8% of all holiday arrivals were Interactive Travellers. Trend charts were provided in quarterly reports during the year where new International Visitor Survey (IVS) data was available.
Not Achieved
Holiday Arrivals MeasureIncrease holiday arrivals from the 2006/07 target of 1,209,300 to 1,278,500 by 30 June 2008.
Result S TAT U S
There were 1,209,241 holiday arrivals in YE Jun 2008. Not Achieved
Visitor Expenditure MeasureTotal visitor expenditure exceeds visitor growth by 2.5% (as measured by the International Visitor Survey). Provide quarterly update.
Result S TAT U S
For the YE June 2008, total visitor expenditure exceeded total visitor growth by 3.8% (ie 1.3% above target). Quarterly updates were provided.
Achieved
A youtube
homepage
takeover was
staged in
august
ONLINE
TOURISM NEW ZEALAND ANNUAL REPORT 2007–2008 23
MARKETING OF NEW ZEALAND AS A VISITOR DESTINATION:

Consumer Website MeasureIncrease the average number of unique users of the www.newzealand.com tourism home page per month. Trend data will be provided on a quarterly basis.
Result S TAT U S
The average number of unique users of the www.newzealand.com tourism home page per month was 509,769 (up from a monthly average of 337,258 in 2006/07). Traffic was significantly higher in the April-June 2008 quarter which was largely due to new campaign activity in the China market. Trend data was provided on a quarterly basis.
Achieved
MeasureMaintain satisfaction levels for www.newzealand.com by visitors to New Zealand at or above 90% by 30 June 2008.
Result S TAT U S
For 2007/08, satisfaction with www.newzealand.com averaged 7.7 (all visitors) and 7.8 (Interactive Travellers) which is rated on a ten point scale – ten being extremely satisfied. For 2006/07, the equivalent scores were 7.8 (all visitors) and 7.9 (Interactive Travellers). This result has been collected as part of the Visitor Experience Monitor project since 2006/07, and prior to that it was taken from the www.newzealand.com Popup Survey. Therefore it is not possible to compare results before and after 2006/07.
Not Achieved
Trade Marketing StrategyMeasureReport on the effectiveness of the Trade Marketing Strategy which is focused on the performance of selected wholesalers and the quality of their representation of the New Zealand tourism product.
ResultQuarterly reports were provided on the effectiveness of Tourism New Zealand’s Trade Marketing Strategy, which is an ongoing initiative designed to identify the operators in each market who Tourism New Zealand can work with effectively to sell destination New Zealand. Implementation of the Strategy progressed well during the year. Key results are provided: S TAT U S
North America – This year conversion-focused partnership work has been undertaken with 12 partners including Air New Zealand and Qantas to promote travel in April, May and August. Canada trade partners are seeing stronger awareness of New Zealand due to the 100% Pure campaign and this is resulting in business growth.
Achieved
Australia – Approximately 20 key companies and trade partners have been focused on in the Australian market this year. All have been contributors at various times to the ‘What’s On’ campaign, providing travel deals to support the campaign.
UK/Europe – There has been significant improvement to New Zealand representation in sellers’ programmes over the past 12 months due to the International Marketing Alliance (Regional Tourism Organisation groupings) project process. Improvements have been seen in the depth of product sold in existing regions, the addition of new regions sold and improvements in the way New Zealand programmes are presented in brochures and on websites.
Japan – The key partners who have applied the guidance and development from Tourism New Zealand in the last year are now experiencing good growth from the changes that they have implemented. Those partners who have not shown as much willingness to adapt to the changing market needs are now struggling in the challenging market environment.
China – With the 100% Pure campaign being launched in China this year and focused key partner trade activity, the interest in selling New Zealand is high. Significant focus has been applied to developing deeper New Zealand knowledge both at a product and frontline level and this will be ongoing into the next financial year.
India – The brochures of Tourism New Zealand’s key partners have seen significant improvement compared to the rest of the market. Their business has also seen growth in terms of value and length of stay.
TOURISM NEW ZEALAND ANNUAL REPORT 2007–200824

Trade TrainingMeasureProvide a quarterly report on the number of international travel sellers and product planners engaged with through trade training seminars and conferences, roadshows, online training modules and familiarisation visits.
Result S TAT U S
Quarterly reports were provided on the number of international travel sellers and product planners Tourism New Zealand engaged with during the year through its trade training programme.
In total, 21,356 international travel sellers and product planners undertook training during the year via trade training seminars and conferences, roadshows, online training modules and familiarisation visits.
Achieved
MeasureInternational travel seller and product planner satisfaction with Tourism New Zealand’s trade training activities (target: at or above 90%).
Result S TAT U S
Average international travel seller and product planner satisfaction with Tourism New Zealand’s trade training activities was 95% for the year.
Achieved
MeasureThe number of online training modules completed by 30 June 2008.
Result S TAT U S
A total of 11,227 online trade training modules were completed in 2007/08 (exceeding the planned target of 10,000).
Achieved
Tourism WebsitesMeasureProvide quarterly update on development work undertaken on the Japanese and Korean tourism websites.
Result S TAT U S
During the year, the consumer website was fully translated into Japanese and Korean with all ongoing changes to the English site now carried through to the Japanese and Korean sites.
Achieved
MeasureProvide a quarterly update on progress made towards upgrading the Chinese tourism website (with the upgraded site to be completed by 31 January 2008).
Result S TAT U S
Quarterly updates were provided during the year on progress towards upgrading the Chinese tourism website. During the year, the simplified Chinese consumer website was fully translated, including Qualmark-rated operator listings. All ongoing changes to the English site are carried through to the Chinese site.
Achieved
Approved Destination Status (ADS) Monitoring Unit EstablishmentMeasureProvide a quarterly update on the establishment of an ADS monitoring unit in New Zealand.
Result S TAT U S
Quarterly updates were provided on the establishment of an ADS monitoring unit in New Zealand. During the year, Tourism New Zealand’s China Monitoring Unit completed a first round of ADS reviews, established systems to monitor compliance with the Code by ADS-approved tour operators, carried out investigations on identified breaches of the Code, and established relationships with ADS approved tour operators as well as key government and non-government agencies relevant to the Unit’s operations.
Achieved
The total cost of delivering outputs under the Channel category is $16,622 million.
TOURISM NEW ZEALAND ANNUAL REPORT 2007–2008 25

New Zealand will always be a niche player in world tourism given our geographic distance from most main markets and the comparatively high cost to travel here. For this reason, Tourism New Zealand’s goal behind its capability strategy is to focus on ensuring New Zealand provides a quality experience for visitors. This ensures visitor satisfaction levels and word-of-mouth promotion of New Zealand as a destination remains high.
Key activities within this output are market research, communication with the industry and other key stakeholders, providing support for the Qualmark quality assurance scheme and visitor information services provided by i-SITE New Zealand.
New Zealand as a Holiday Destination MeasureAt least 80% of Interactive Travellers® are very likely to recommend New Zealand as a holiday destination by 30 June 2008.
Result S TAT U S
In 2007/08, 85% of Interactive Travellers were very likely to recommend New Zealand as a holiday destination.
Achieved
Corporate CommunicationsMeasureProvide a quarterly report on the number of user sessions for www.tourismnewzealand.com
Result S TAT U S
Quarterly reports were provided on the number of user sessions for www.tourismnewzealand.com. Tourism New Zealand’s corporate website attracted a total of 212,885 user sessions during the 2007/08 year.
Achieved
MeasureProvide a quarterly report on the number of stakeholder publications (Tourism News, Regional Rap) and face-to-face engagement with the industry undertaken by Tourism New Zealand.
Result S TAT U S
Quarterly reports were provided on the number of stakeholder publications and face-to-face engagements with the industry undertaken by Tourism New Zealand during the year.
Stakeholder publications:
Tourism News: 27,000 copies of Tourism News were distributed during the year.
Regional Rap: 5,904 copies of Regional Rap were sent to readers over the year.
Face-to-face engagements with the industry over the year totalled 5,826.
Achieved
TOURISM NEW ZEALAND ANNUAL REPORT 2007–200826
MARKETING OF NEW ZEALAND AS A VISITOR DESTINATION:

Subsidiary CommitmentsMeasureIncrease the number of Qualmark licence holders from 1,900 to 2,100 by 30 June 2008.
Result S TAT U S
There are 2,154 licence holders as at 30 June 2008. Achieved
MeasureMaintain the attrition rate of Qualmark licence holders below 5% as at 30 June 2008.
Result S TAT U S
The attrition rate of Qualmark licence holders was maintained below 5% during the year. Achieved
MeasureReport quarterly on progress made on the development and implementation of Qualmark’s environmental accreditation programme (with additional environmental criteria to be included in Qualmark assessments from January 2008).
Result S TAT U S
Quarterly reports were provided on progress made on the development and implementation of Qualmark’s environmental accreditation programme. The programme was launched at TRENZ in May 2008.
Achieved
MeasureA total of 44 i-SITE centres are assessed and required to meet the Qualmark-based i-SITE membership standards by 30 June 2008, to ensure network standards are maintained.
Result S TAT U S
A total of 42 i-SITE centres were assessed during the year and met the requirements of the Qualmark-based i-SITE membership standards. Assessment of the Hamilton i-SITE was rescheduled from June to July 2008 due to unforeseen circumstances and the Stewart Island i-SITE was unable to be assessed as work required for the accreditation process was still to be completed at year-end.
Substantially Achieved
MeasureA total of 44 i-SITE centres are mystery shopped to assess and improve the quality of customer service levels by 30 June 2008.
Result S TAT U S
All 44 of the scheduled i-SITE centres were mystery shopped by 30 June 2008 and reports subsequently distributed to i-SITE managers.
Achieved
The total cost of delivering outputs under the Capability category is $19,701 million.
DESTINATIONNEW ZEALAND
new zealand's
i-site visitor
centres provide
higH-quality
information to
over oo,ooo
international
visitors
annually
TOURISM NEW ZEALAND ANNUAL REPORT 2007–2008 27

Impact of Tourism New Zealand Outputs on International Visitor Arrivals and Expenditure
The number of visitors to New Zealand and the amount they spend is dependent on many variables. These include:
and the efforts of other National Tourism Offices
affecting travel and expenditure decisions
routes and ticket pricing
in countries of origin.
International visitor arrivals for the year ending 30 June 2008 were 2.48 million, a 0.9% increase over the previous year. International visitor expenditure (sourced from the revised International Visitor Survey excluding airfare receipts) for the year ended 30 June 2008 was $6,177 million, representing a 4.7% increase over the previous year.
While it is not possible to determine the extent to which Tourism New Zealand’s outputs directly impacted on visitor numbers and spend for the year given the range and complexity of externalities involved, Tourism New Zealand’s delivery of outputs in 2007/08, and in previous years, will have contributed to the year’s growth in visitor arrivals and expenditure through:
destination through continued delivery of the 100% Pure New Zealand campaign in key international markets
for New Zealand as a holiday destination and making it easy for them to plan and book their travel through online tools
destination New Zealand in order to convert visitor interest into actual travel
including insights into the needs and preferences of international consumers, to better inform their activities
New Zealand’s commitments to Qualmark Limited and i-SITE New Zealand) to ensure the New Zealand tourism industry delivers a quality system which maintains visitor satisfaction at a high level and encourages positive word-of-mouth about the New Zealand experience.
Equal Employment Opportunities (EEO)Under Section 151 (1)(g) of the Crown Entities Act 2004, Tourism New Zealand is required to provide information about compliance with obligations to be a good employer (including our Equal Employment Opportunities Programme).
Women continue to be well represented at all levels in the organisation. Tourism New Zealand recognises the need for the greater involvement of , and continues to promote this through the implementation of our Development Strategy and Graduate Development Programme.
MANAGEMENT STATEMENTS
TOURISM NEW ZEALAND ANNUAL REPORT 2007–200828

Tourism New Zealand Workplace Profile as at 30 June 2008
E X E C U T I V E M A N A G E M E N T
D I R E C T R E P O R T S T O E X E C U T I V E M A N A G E R S O R
S TA F F W I T H R E S P O N S I B I L I T Y
F O R S P E C I F I C O U T P U T A R E A S
O T H E R M A N A G E R S W I T H S TA F F
R E S P O N S I B I L I T Y ( 4 T H T I E R )
P R O F E S S I O N A L A N D S U P P O R T
S TA F F
NZ European
Male Female
38% 50%
30% 48%
19% 38%
6% 42%
Male Female
9%
3% 2%
Pacific Peoples
Male Female
2%
Asian (inc South Asian)
Male Female
4%
6% 25%
6% 27%
Other
Male Female
12% 9% 6% 6%
12%
Percentage of Group of Total Organisation
7%
20%
14%
59%
Leadership, Accountability and CultureTourism New Zealand is committed to being a good employer and, as such, to managing and leading all staff fairly and properly in all aspects of their employment. Our Executive Team and broader management group is committed to demonstrating leadership and accountability in all areas of EEO, and from an EEO perspective, this means a commitment to and activity in the following areas:
Recruitment, Selection and InductionOur recruitment and selection procedure has been developed to ensure that all prospective employees are given the opportunity to participate equally in the recruitment process. Interview questions are drawn from a carefully designed question bank which contains questions designed to ensure that the selected applicant’s skills and abilities are the best fit with the position and organisation. This includes appropriate support for and Pacific peoples and people with English as a second language during the recruitment and selection process.
We are now in the second year of running our three-day ‘Welcome to Tourism New Zealand’ programme. This programme runs between three and four times each year and is led by a member of our Executive Team. Each programme includes a cultural component, which explores the significance of aspects of tikanga for our organisation, and includes mihi and waiata training.
Tourism New Zealand has continued with an active Graduate Recruitment programme and we have recruited a total of five graduates. Four of these continue to be employed by Tourism New Zealand in a variety of roles, and one has left Tourism
New Zealand and is now employed by a Regional Tourism Organisation.
TOURISM NEW ZEALAND ANNUAL REPORT 2007–2008 29

Employee Development, Promotion and ExitTourism New Zealand has an active management and leadership development programme. This includes an annual leadership development programme for those identified with potential for leadership and management development. Participants are nominated by their managers on the basis of performance and potential.
Other training and development needs are identified on an individual basis and are agreed between the manager and employee. Development programmes are selected based on individual development needs.
Te Wiki o Te Reo and Matariki are also actively supported by Tourism New Zealand with a planned programme to provide additional skills training and learning opportunities.
Tourism New Zealand has also continued to build on our earlier programme of work designed to develop and grow our organisational capability in tikanga . For the year ending June 2008, it is great to see that our Development Strategy has, through its implementation, become a critical, multidimensional part of our organisation. As discussed, our Welcome Programme includes a significant cultural element, and this enables Tourism New Zealand to deliver on part of our international marketing promise around the cultural element of the New Zealand experience as our staff have a sound understanding of tikanga and this in infused throughout the organisation.
Flexibility and Work DesignTourism New Zealand has an active programme of supporting flexible working arrangements and job design. We continue to:
accommodate child care needs;
Remuneration, Recognition and ConditionsThe annual salary review and internal promotions are based on individual skills and experience, and recognise performance regardless of ethnicity, gender or physical ability.
Individuals identified as not meeting the requirements of their role are provided with support, training and development where required to assist them to achieve success in their role.
Harassment and Bullying PreventionTourism New Zealand has a very strictly adhered to policy and procedure for dealing with work place harassment and bullying. In the 12 months, there have been no reported allegations relating to harassment and/or bullying.
Safe and Healthy EnvironmentTourism New Zealand has a good and safe working environment and we have published and well-understood policies which have actively encouraged staff involvement. Additional support for people, particularly those with disabilities, has over the last 12 months included specialist work place assessments and the provision of special equipment to ensure that employees are able to contribute effectively in all aspects of their working life.
TOURISM NEW ZEALAND ANNUAL REPORT 2007–200830

FINANCIAL STATEMENTS
Statement of Responsibility
In terms of the Crown Entities Act 2004, the Board is responsible for the preparation of the New Zealand Tourism Board’s financial statements and statement of service performance, and for the judgments made in them.
The Board of New Zealand Tourism Board has the responsibility for establishing, and has established, a system of internal control designed to provide reasonable assurance as to the integrity and reliability of financial reporting.
In the Board’s opinion, these financial statements and statement of service performance fairly reflect the financial position and operation of the New Zealand Tourism Board Group for the year ended 30 June 2008.
The Board of Directors of New Zealand Tourism Board and Group authorised these financial statements for issue on 31 October 2008.
Signed on behalf of the Board of Directors:
G. Muir S. Johnstone Chair Deputy Chair 31 October 2008 31 October 2008
TOURISM NEW ZEALAND ANNUAL REPORT 2007–2008 31
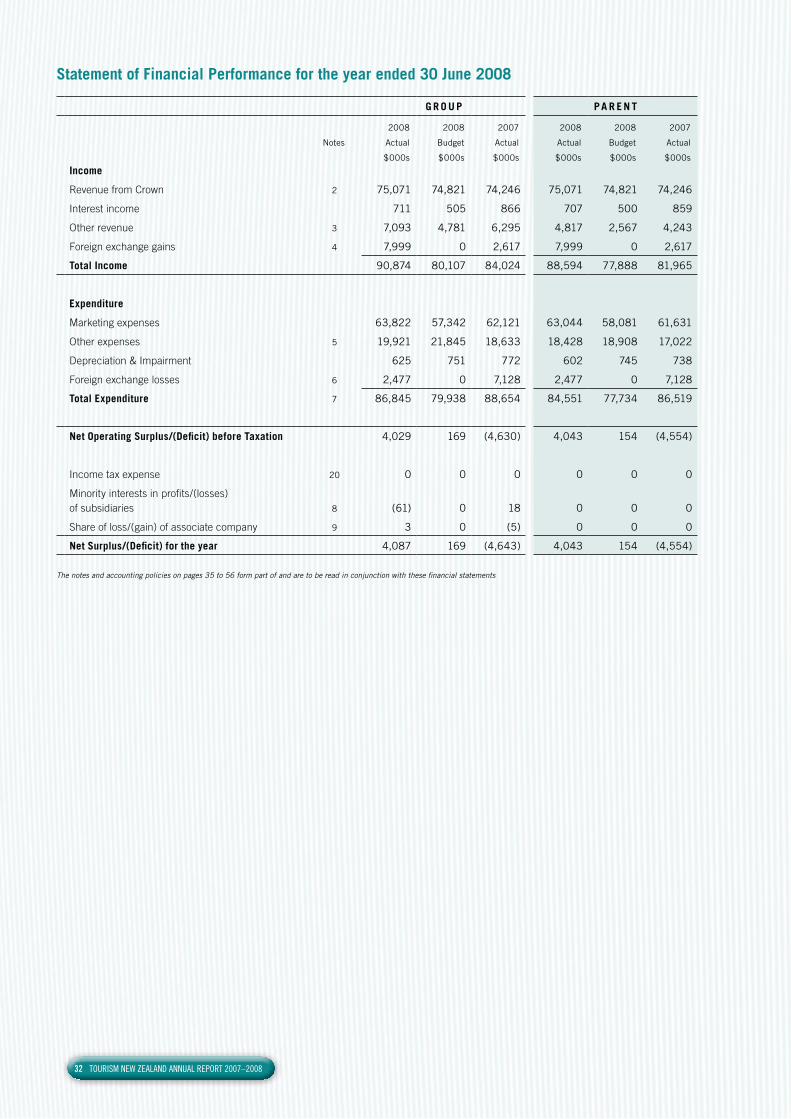
Statement of Financial Performance for the year ended 30 June 2008
G R O U P PA R E N T
2008 2008 2007 2008 2008 2007
Notes Actual Budget Actual Actual Budget Actual
$000s $000s $000s $000s $000s $000s
Income
Revenue from Crown 2 75,071 74,821 74,246 75,071 74,821 74,246
Interest income 711 505 866 707 500 859
Other revenue 3 7,093 4,781 6,295 4,817 2,567 4,243
Foreign exchange gains 4 7,999 0 2,617 7,999 0 2,617
Total Income 90,874 80,107 84,024 88,594 77,888 81,965
Expenditure
Marketing expenses 63,822 57,342 62,121 63,044 58,081 61,631
Other expenses 5 19,921 21,845 18,633 18,428 18,908 17,022
Depreciation & Impairment 625 751 772 602 745 738
Foreign exchange losses 6 2,477 0 7,128 2,477 0 7,128
Total Expenditure 7 86,845 79,938 88,654 84,551 77,734 86,519
Net Operating Surplus/(Deficit) before Taxation 4,029 169 (4,630) 4,043 154 (4,554)
Income tax expense 20 0 0 0 0 0 0
Minority interests in profits/(losses) of subsidiaries 8 (61) 0 18 0 0 0
Share of loss/(gain) of associate company 9 3 0 (5) 0 0 0
Net Surplus/(Deficit) for the year 4,087 169 (4,643) 4,043 154 (4,554)
The notes and accounting policies on pages 35 to 56 form part of and are to be read in conjunction with these financial statements
TOURISM NEW ZEALAND ANNUAL REPORT 2007–200832

Statement of Financial Position as at 30 June 2008
G R O U P PA R E N T
2008 2008 2007 2008 2008 2007
Notes Actual Budget Actual Actual Budget Actual
$000s $000s $000s $000s $000s $000s
Current Assets
Cash 10 5,200 2,951 3,435 5,077 2,809 3,272
Receivables 11 1,324 640 1,193 1,286 600 1,135
Prepayments & other current assets 1,029 320 2,891 1,018 300 2,884
Derivative financial instruments 12 1,514 0 0 1,514 0 0
9,067 3,911 7,519 8,895 3,709 7,291
Non-current Assets
Property plant and equipment 13 2,165 1,839 1,616 1,943 1,826 1,609
Investment in associate 9 7 5 10 0 0 0
Accommodation bonds 14 343 335 275 343 335 275
2,515 2,179 1,901 2,286 2,161 1,884
Total Assets 11,582 6,090 9,420 11,181 5,870 9,175
Current Liabilities
Creditors and other payables 15 4,613 3,135 4,204 4,203 2,935 3,954
Employee entitlements 16 927 785 777 891 760 754
Provisions 17 303 0 220 303 0 220
Derivative financial instruments 12 20 0 2,526 20 0 2,526
5,863 3,920 7,727 5,417 3,695 7,454
Total Liabilities 5,863 3,920 7,727 5,417 3,695 7,454
Net Assets 5,719 2,170 1,693 5,764 2,175 1,721
Equity
Shareholder's equity 1,805 1,805 1,805 1,805 1,805 1,805
Retained earnings 3,864 365 (223) 3,959 370 (84)
Minority interests 8 50 0 111 0 0 0
Total Equity 5,719 2,170 1,693 5,764 2,175 1,721
Statement of Changes in Equity for the year ended 30 June 2008
G R O U P PA R E N T
2008 2008 2007 2008 2008 2007
Notes Actual Budget Actual Actual Budget Actual
$000s $000s $000s $000s $000s $000s
Balance at 1 July 1,693 2,001 6,318 1,721 2,021 6,275
Movement in minority interest (61) 0 18 0 0 0
Net surplus/(deficit) for the year 4,087 169 (4,643) 4,043 154 (4,554)
Balance at 30 June 5,719 2,170 1,693 5,764 2,175 1,721
The notes and accounting policies on pages 35 to 56 form part of and are to be read in conjunction with these financial statements
TOURISM NEW ZEALAND ANNUAL REPORT 2007–2008 33

Statement of Cash Flows for the year ended 30 June 2008
G R O U P PA R E N T
2008 2008 2007 2008 2008 2007
Notes Actual Budget Actual Actual Budget Actual
$000s $000s $000s $000s $000s $000s
Cash flows from operating activities
Crown revenue 75,071 74,821 74,246 75,071 74,821 74,246
Interest received 687 502 870 683 500 863
Other revenue 6,695 4,640 2,028 4,392 2,450 3,895
Payments to suppliers and employees (79,545) (78,302) (78,466) (77,468) (76,132) (80,298)
Goods and services tax (net) 274 0 (86) 306 0 (100)
Net cash from operating activities 18 3,182 1,661 (1,408) 2,984 1,639 (1,394)
Cash flows from investing activities
Sale of property plant and equipment 30 0 9 30 0 9
Repayment of accommodation bonds 10 0 13 10 0 13
Purchase of property plant and equipment (1,551) (840) (683) (1,313) (830) (681)
Payments for accommodation bonds (55) 0 (29) (55) 0 (29)
Net cash outflow from investing activities (1,566) (840) (690) (1,328) (830) (688)
Net increase/(decrease) in cash held 1,616 821 (2,098) 1,656 809 (2,082)
Effects of exchange rate on foreign currency balances 149 0 (732) 149 0 (732)
Opening cash brought forward 3,435 2,130 6,265 3,272 2,000 6,086
Cash at end of year 10 5,200 2,951 3,435 5,077 2,809 3,272
The notes and accounting policies on pages 35 to 56 form part of and are to be read in conjunction with these financial statements
TOURISM NEW ZEALAND ANNUAL REPORT 2007–200834

Notes to the Financial Statements for the year ended 30 June 2008
Note 1 Statement of accounting policies for the year ended 30 June 2008
(a) Basis of preparation Tourism New Zealand is a Crown entity as defined by the Crown Entities Act 2004 and is domiciled in New Zealand. As such, Tourism New Zealand’s ultimate parent is the New Zealand Crown.
Tourism New Zealand’s financial statements have been prepared in accordance with New Zealand generally accepted accounting practice and the requirements of the Crown Entities Act 2004. The financial statements have been prepared on a historical cost basis modified by the revaluation of certain assets and liabilities as identified in this statement of accounting policies.
For the purposes of financial reporting, Tourism New Zealand is classified as a Public Benefit Entity.
(b) Statement of compliance The financial statements have been prepared in accordance with New Zealand equivalents to International Financial Reporting Standards (NZ IFRS) and other applicable Financial Reporting Standards as appropriate for public benefit entities.
This is the first set of financial statements prepared based on NZ IFRS and comparatives for the year ended 30 June 2007 have been restated accordingly. Reconciliations of equity at 1 July 2006 and 30 June 2007 and surplus/deficit for the year ended 30 June 2007 under NZ IFRS to the balances reported in the 30 June 2007 financial statements are detailed in Note 31.
The financial statements are presented in New Zealand dollars and all values are rounded to the nearest thousand dollars ($000). The functional currency is New Zealand dollars.
Standards, amendments and interpretations issued but not yet effective that have not been early adopted and which are relevant to Tourism New Zealand include:
Presentation of Financial Statements is effective for reporting periods beginning on or after 1 January 2009. The revised standard requires information in financial statements to be aggregated on the basis of shared characteristics and introduces a statement of comprehensive income. The statement of comprehensive income will enable readers to analyse changes in equity resulting from non-owner changes separately from transactions with the Crown in its capacity as “owner”. The revised standard gives Tourism New Zealand the option of presenting items of income and expense and components of other comprehensive income either in a single statement of comprehensive income with subtotals, or in two separate statements (a separate income statement followed by a statement of comprehensive income). Tourism New Zealand intends to adopt this standard for the year ending 30 June 2010, and is yet to decide whether it will prepare a single statement of comprehensive income or a separate income statement followed by a statement of comprehensive income.
Inventories. In November 2007 the New Zealand Accounting Standards Review Board approved an amendment to NZ IAS 2 Inventories, which requires public benefit entities to measure inventory held for distribution at cost, adjusted when applicable for any loss of service potential. Application of the amendment is mandatory for reporting periods beginning on or after 1 January 2008.
Tourism New Zealand will adopt the amended standard for the year ending 30 June 2009 and expects the impact of adopting the new standard to be minimal.
(c) Basis of consolidation The consolidated financial statements comprise the financial statements of New Zealand Tourism Board trading as Tourism New Zealand and its subsidiaries as at 30 June each year (the Group).
Subsidiaries are combined using the purchase method of combination. The financial statements of subsidiaries are prepared for the same reporting period as the parent company, using consistent accounting policies.
Adjustments are made to bring into line any dissimilar accounting policies that may exist.
All intercompany balances and transactions, including unrealised profits arising from intra-group transactions, have been eliminated in full. Unrealised losses are eliminated unless costs cannot be recovered.
Subsidiaries are consolidated from the date on which control is transferred to the Group and cease to be consolidated from the date on which control is transferred out of the Group.
Where there is loss of control of a subsidiary, the consolidated financial statements include the results for the part of the reporting period during which Tourism New Zealand has control.
Business combinations that occurred prior to the date of transition to NZ IFRS have not been restated retrospectively.
(d) Investment in associate The Group’s investment in associates is accounted for under the equity method of accounting in the consolidated financial statements.
An associate is an entity in which the Group has significant influence and which is not a subsidiary nor a joint venture.
The annual financial statements of the associate are used by the Group to apply the equity method. The reporting dates of the associate and the Group are identical and both use consistent accounting policies.
The investment in the associate is carried in the balance sheet at cost plus post-acquisition changes in the Group’s share of net assets of the associate, less any impairment in value. The consolidated income statement reflects the Group’s share of the results of operations of the associate.
Where there has been a change recognised directly in the associate’s equity, the Group recognises its share of any changes and discloses this, when applicable in the consolidated statement of changes in equity.
(e) Foreign currency Where transactions in foreign currencies have been covered by forward exchange contracts, the rates in those contracts are used to convert the transactions to New Zealand Currency. Otherwise, transactions are recorded in the functional currency at the exchange rates ruling at the date of the transaction.
TOURISM NEW ZEALAND ANNUAL REPORT 2007–2008 35

Monetary assets and liabilities denominated in foreign currencies are translated at the rate of exchange ruling at the balance sheet date.
Exchange gains and losses are recognised in the Statement of Financial Performance.
Non-monetary items that are measured in terms of historical cost in a foreign currency are translated using the exchange rate as at the date of the initial transaction.
(f) Property, plant and equipment Plant and equipment is stated at cost less accumulated depreciation and any impairment in value.
Depreciation is calculated on a straight-line basis over the estimated useful life of the asset as follows:
Office equipment 5 years Motor vehicles 4 – 5 years Furniture and fittings 5 – 8 years Computer equipment 3 years Leasehold improvements Up to term of the lease
Realised gains and losses arising from the disposal of property, plant and equipment are recognised in the Statement of Financial Performance in the period in which the transaction occurs.
Impairment The carrying values of plant and equipment are reviewed for impairment when events or changes in circumstances indicate the carrying value may not be recoverable.
If any such indication exists and where the carrying values exceed the estimated recoverable amount, the assets are written down to their recoverable amount. Losses resulting from impairment are reported in the Statement of Financial Performance.
(g) Intangible assets Intangible assets are recorded at cost at acquisition. Where there is no active market for these assets, or they are determined to hold no future economic benefit, they are written off in the year of acquisition. Tourism New Zealand has no intangible assets with a finite life.
Research and development costs are expensed as incurred.
(h) Inventories Inventories are valued at the lower of cost and net realisable value.
(i) Trade and other receivables Trade receivables are recognised and carried at original invoice amount less an allowance for any uncollectible amounts.
An estimate for doubtful debts is made when collection of the full amount is no longer probable. Bad debts are written off when identified.
(j) Cash and cash equivalents Cash and short-term deposits in the Statement of Financial Position comprise cash at bank and in hand and short-term deposits with an original maturity of three months or less.
For the purposes of the Statement of Cash Flows, cash and cash equivalents consist of cash and cash equivalents as defined above.
(k) Provisions Provisions are recognised when the Group has a present obligation (legal or constructive) as a result of a past event, and it is probable that an outflow of resources embodying economic benefits will be required to settle the obligation and a reliable estimate can be made of the amount of the obligation.
Where the Group expects some or all of a provision to be reimbursed, for example under an insurance contract, the
reimbursement is recognised as a separate asset but only when the reimbursement is virtually certain. The expense relating to any provision is presented in the Statement of Financial Performance net of any reimbursement.
If the effect of the time value of money is material, provisions are determined by discounting the expected future cash flows at a rate that reflects current market assessments of the time value of money and, where appropriate, the risks specific to the liability.
Where discounting is used, the increase in the provision due to the passage of time is recognised as a finance cost.
(l) Leases The determination of whether an arrangement is or contains a lease is based on the substance of the arrangement and requires an assessment of whether the fulfilment of the arrangement is dependent on the use of a specific asset or assets and the arrangement conveys a right to use the asset.
Leases where the lessor retains substantially all the risks and benefits of ownership of the asset are classified as operating leases. Operating lease payments are recognised as an expense in the Statement of Financial Performance on a straight-line basis over the lease term.
The Group does not enter into Finance leases.
(m) Revenue Revenue is recognised to the extent that it is probable that the economic benefits will flow to the Group and the revenue can be reliably measured. The following specific recognition criteria must also be met before revenue is recognised:
Grants received from the CrownGrants received from the Crown are recognised as revenue on receipt.
Sale of goods and service Revenue from the supply of goods and services is recognised when the significant risks and rewards of ownership of the goods have passed to the buyer and can be measured reliably. Risks and rewards are considered passed to the buyer at the time of delivery of the goods to the customer.
Revenue from the supply of services is recognised on a straight line basis over the specified period for the service unless an alternative method better represents the stage of completion of the transaction.
Interest Interest revenue is recognised as interest accrues using the effective interest method. This is a method of calculating the amortised cost of a financial asset and allocating the interest income over the relevant period using the effective interest rate, which is the rate that exactly discounts estimated future cash receipts through the expected life of the financial asset to the net carrying amount of the financial asset.
(n) Income tax Tourism New Zealand is exempt from income tax under the New Zealand Tourism Board Act 1991. Tourism New Zealand’s subsidiaries are subject to income tax.
Current tax assets and liabilities for the current and prior periods are measured at the amount expected to be recovered from or paid to the taxation authorities based on the current period’s taxable income. The tax rates and tax laws used to compute the amount are those that are enacted or substantively enacted by the Statement of Financial Position date.
Deferred income tax is provided on all temporary differences at the Statement of Financial Position date between the tax bases of assets and liabilities and their carrying amounts for financial reporting purposes.
TOURISM NEW ZEALAND ANNUAL REPORT 2007–200836
Deferred income tax liabilities are recognised for all taxable temporary differences except:
recognition of goodwill or of an asset or liability in a transaction that is not a business combination and that, at the time of the transaction, affects neither the accounting profit nor taxable profit or loss; or
investments in subsidiaries, associates or interests in joint ventures, and the timing of the reversal of the temporary difference can be controlled and it is probable that the temporary difference will not reverse in the foreseeable future.
Deferred income tax assets are recognised for all deductible temporary differences, carry-forward of unused tax credits and unused tax losses, to the extent that it is probable that taxable profit will be available against which the deductible temporary differences and the carry-forward of unused tax credits and unused tax losses can be utilised, except:
temporary difference arises from the initial recognition of an asset or liability in a transaction that is not a business combination and, at the time of the transaction, affects neither the accounting profit nor taxable profit or loss; or
investments in subsidiaries, associates or interests in joint ventures, in which case a deferred tax asset is only recognised to the extent that it is probable that the temporary difference will reverse in the foreseeable future and taxable profit will be available against which the temporary difference can be utilised.
The carrying amount of deferred income tax assets is reviewed at each Statement of Financial Position date and reduced to the extent that it is no longer probable that sufficient taxable profit will be available to allow all or part of the deferred income tax asset to be utilised.
Unrecognised deferred income tax assets are reassessed at each Statement of Financial Position date and are recognised to the extent that it has become probable that future taxable profit will allow the deferred tax asset to be recovered.
Deferred income tax assets and liabilities are measured at the tax rates that are expected to apply to the year when the asset is realised or the liability is settled, based on tax rates (and tax laws) that have been enacted or substantively enacted at the Statement of Financial Position date.
Deferred tax assets and deferred tax liabilities are offset only if a legally enforceable right exists to set off current tax assets against current tax liabilities and the deferred tax assets and liabilities relate to the same taxable entity and the same taxation authority.
(o) Other taxes Revenues, expenses and assets are recognised net of the amount of GST except:
is not recoverable from the taxation authority, in which case the GST is recognised as part of the cost of acquisition of the asset or as part of the expense item as applicable; and
included.
The net amount of GST recoverable from, or payable to, the taxation authority is included as part of receivables or payables in the Statement of Financial Position.
Cash flows are included in the Statement of Cash Flows on a gross basis and the GST component of cash flows arising from investing and financing activities, which is recoverable from, or payable to, the taxation authority are classified as operating cash flows.
Commitments and contingencies are disclosed net of the amount of GST recoverable from, or payable to, the taxation authority.
(p) Financial instrumentsTourism New Zealand uses derivative financial instruments such as foreign currency contracts to manage its exposure to foreign exchange risk arising from its operational activities. Tourism New Zealand does not hold or issue these financial instruments for trading purposes. Tourism New Zealand has not adopted hedge accounting.
Derivatives are initially recognised at fair value on the date a derivative contract is entered into and are subsequently remeasured to their fair value at each balance date. Movements in the fair value of derivative financial instruments are recognised in the Statement of Financial Performance.
Foreign exchange gains and losses resulting from the settlement of derivative financial instruments and from the translation at year end exchange rates of monetary assets and liabilities denominated in foreign currencies are recognised in the Statement of Financial Performance.
Cash and cash equivalents include cash on hand, cash in transit, bank accounts and deposits with a maturity of no more than three months from date of acquisition
The fair value of forward exchange contracts is calculated by reference to current forward exchange rates for contracts with similar maturity profiles.
(q) Employee BenefitsPension Liabilities. Obligations for contributions to defined contribution retirement plans are recognised in the Statement of Financial Performance as they fall due.
Other Employee Entitlements. Employee entitlements to salaries and wages, annual leave, long service leave, retiring leave and other similar benefits are recognised in the Statement of Financial Performance when they accrue to employees. Employee entitlements to be settled within 12 months are reported at the amount expected to be paid. The liability for long-term employee entitlements is reported as the present value of the estimated future cash flows.
Termination Benefits. Termination benefits are recognised in the Statement of Financial Performance only where there is a demonstrable commitment to either terminate employment prior to normal retirement date or to provide such benefits as a result of an offer to encourage voluntary redundancy. Termination benefits settled within 12 months are reported at the amount expected to be paid, otherwise they are reported as the present value of the estimated future cash flows.
(r) Contingent Assets and Contingent LiabilitiesContingent assets and contingent liabilities are recorded in the Notes to the Financial Statements at the point at which the contingency is evident. Contingent liabilities are disclosed if the possibility that they will crystallise is not remote. Contingent assets are disclosed if it is probable that the benefits will be realised.
(s) Segment Reporting Tourism New Zealand’s primary function is to market New Zealand as a tourism destination. To achieve this, Tourism New Zealand maintains offices in a number of overseas countries. However, all Tourism New Zealand’s activities are co-ordinated from New Zealand.
TOURISM NEW ZEALAND ANNUAL REPORT 2007–2008 37
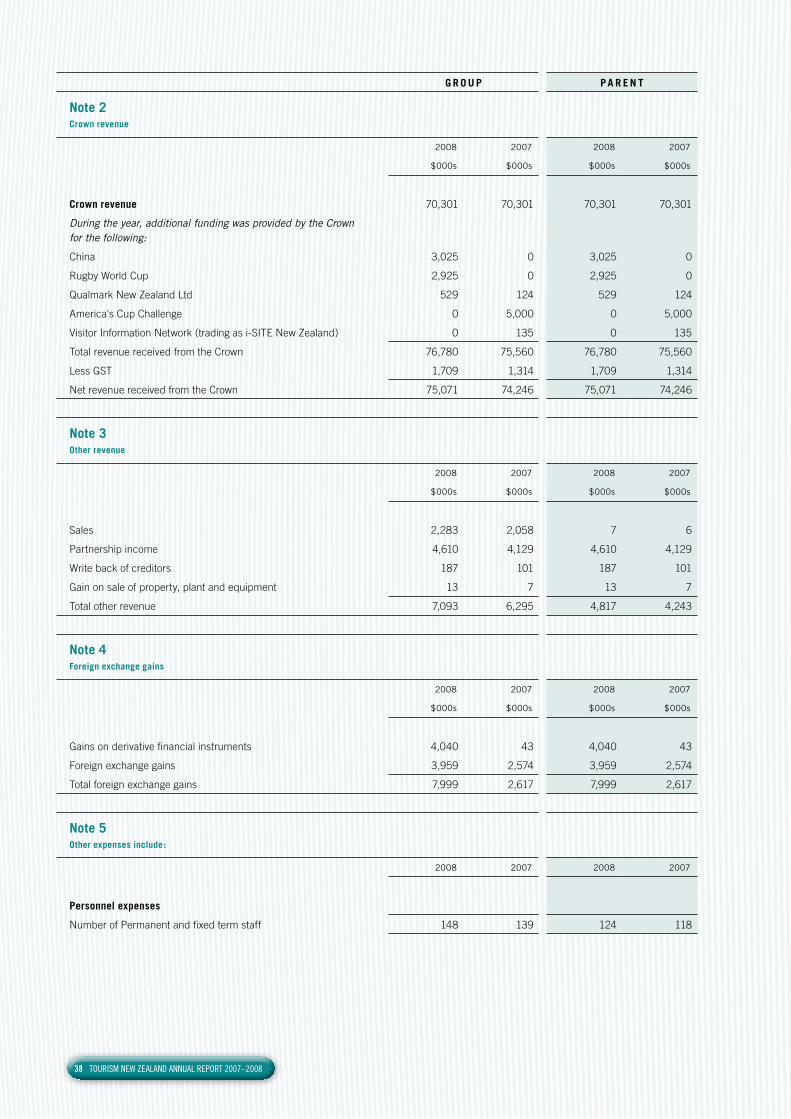
G R O U P PA R E N T
Note 2 Crown revenue
2008 2007 2008 2007
$000s $000s $000s $000s
Crown revenue 70,301 70,301 70,301 70,301
During the year, additional funding was provided by the Crown for the following:
China 3,025 0 3,025 0
Rugby World Cup 2,925 0 2,925 0
Qualmark New Zealand Ltd 529 124 529 124
America's Cup Challenge 0 5,000 0 5,000
Visitor Information Network (trading as i-SITE New Zealand) 0 135 0 135
Total revenue received from the Crown 76,780 75,560 76,780 75,560
Less GST 1,709 1,314 1,709 1,314
Net revenue received from the Crown 75,071 74,246 75,071 74,246
Note 3Other revenue
2008 2007 2008 2007
$000s $000s $000s $000s
Sales 2,283 2,058 7 6
Partnership income 4,610 4,129 4,610 4,129
Write back of creditors 187 101 187 101
Gain on sale of property, plant and equipment 13 7 13 7
Total other revenue 7,093 6,295 4,817 4,243
Note 4Foreign exchange gains
2008 2007 2008 2007
$000s $000s $000s $000s
Gains on derivative financial instruments 4,040 43 4,040 43
Foreign exchange gains 3,959 2,574 3,959 2,574
Total foreign exchange gains 7,999 2,617 7,999 2,617
Note 5Other expenses include:
2008 2007 2008 2007
Personnel expenses
Number of Permanent and fixed term staff 148 139 124 118
TOURISM NEW ZEALAND ANNUAL REPORT 2007–200838
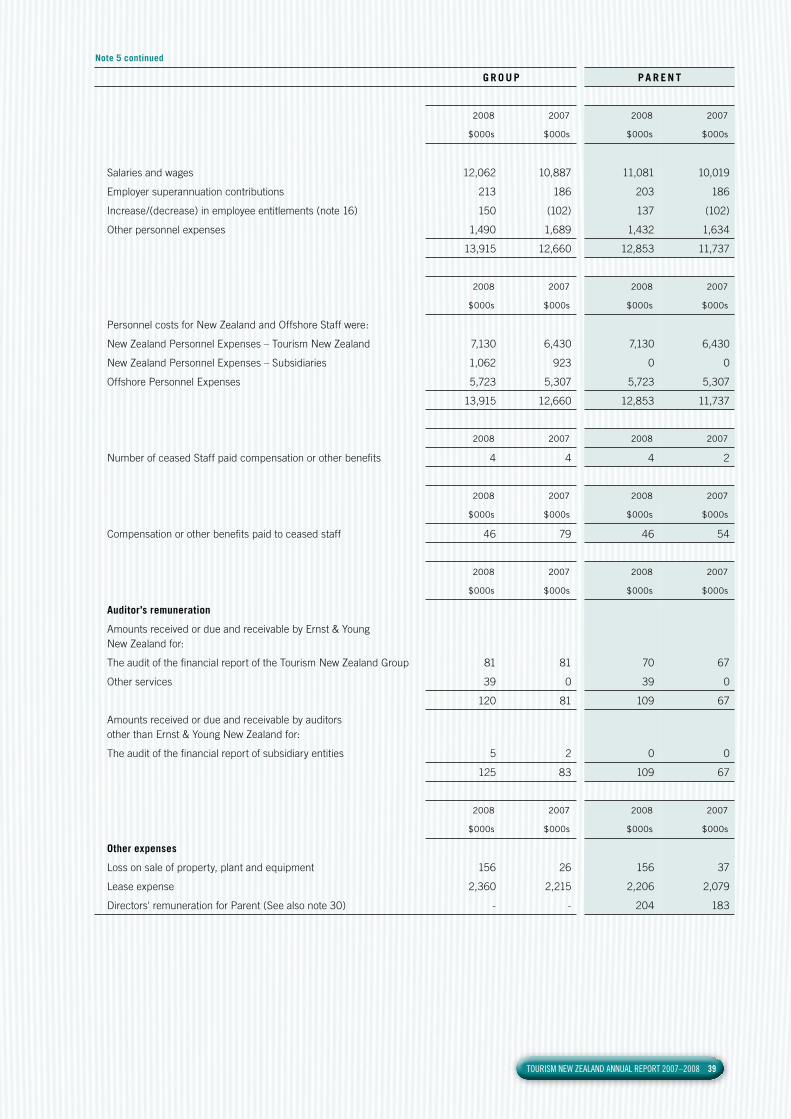
G R O U P PA R E N T
2008 2007 2008 2007
$000s $000s $000s $000s
Salaries and wages 12,062 10,887 11,081 10,019
Employer superannuation contributions 213 186 203 186
Increase/(decrease) in employee entitlements (note 16) 150 (102) 137 (102)
Other personnel expenses 1,490 1,689 1,432 1,634
13,915 12,660 12,853 11,737
2008 2007 2008 2007
$000s $000s $000s $000s
Personnel costs for New Zealand and Offshore Staff were:
New Zealand Personnel Expenses – Tourism New Zealand 7,130 6,430 7,130 6,430
New Zealand Personnel Expenses – Subsidiaries 1,062 923 0 0
Offshore Personnel Expenses 5,723 5,307 5,723 5,307
13,915 12,660 12,853 11,737
2008 2007 2008 2007
Number of ceased Staff paid compensation or other benefits 4 4 4 2
2008 2007 2008 2007
$000s $000s $000s $000s
Compensation or other benefits paid to ceased staff 46 79 46 54
2008 2007 2008 2007
$000s $000s $000s $000s
Auditor’s remuneration
Amounts received or due and receivable by Ernst & Young New Zealand for:
The audit of the financial report of the Tourism New Zealand Group 81 81 70 67
Other services 39 0 39 0
120 81 109 67
Amounts received or due and receivable by auditors other than Ernst & Young New Zealand for:
The audit of the financial report of subsidiary entities 5 2 0 0
125 83 109 67
2008 2007 2008 2007
$000s $000s $000s $000s
Other expenses
Loss on sale of property, plant and equipment 156 26 156 37
Lease expense 2,360 2,215 2,206 2,079
Directors' remuneration for Parent (See also note 30) - - 204 183
Note 5 continued
TOURISM NEW ZEALAND ANNUAL REPORT 2007–2008 39
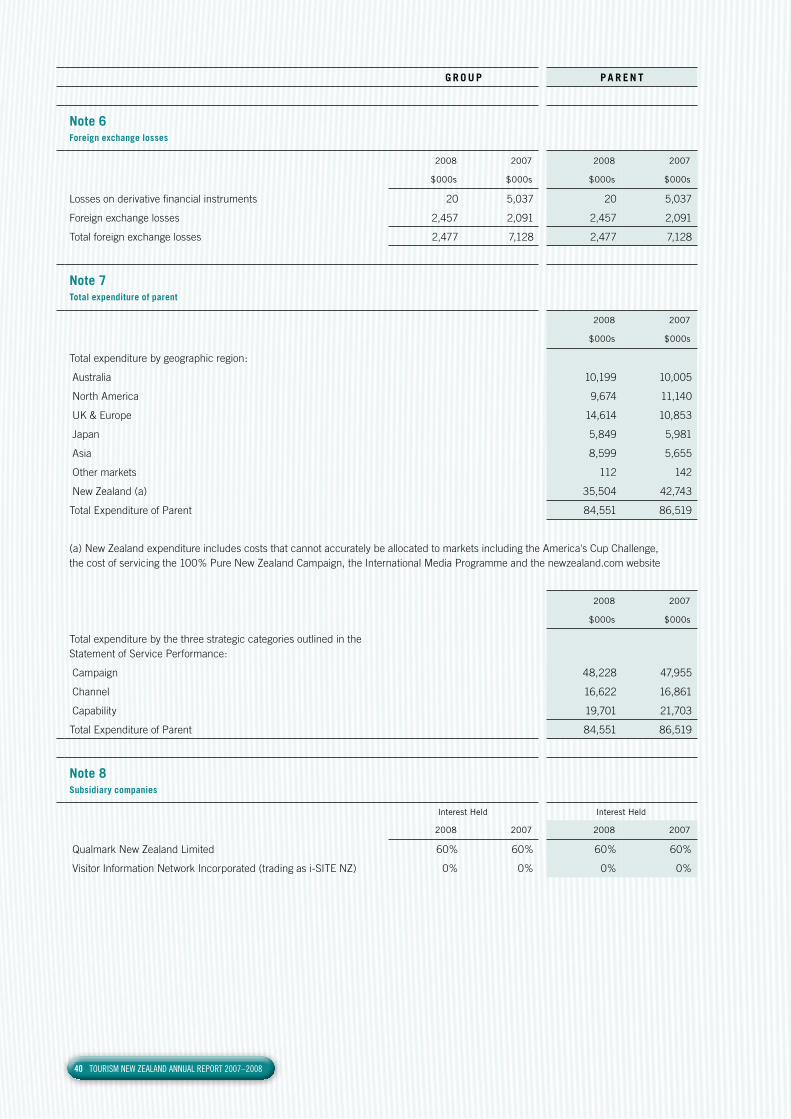
G R O U P PA R E N T
Note 6Foreign exchange losses
2008 2007 2008 2007
$000s $000s $000s $000s
Losses on derivative financial instruments 20 5,037 20 5,037
Foreign exchange losses 2,457 2,091 2,457 2,091
Total foreign exchange losses 2,477 7,128 2,477 7,128
Note 7Total expenditure of parent
2008 2007
$000s $000s
Total expenditure by geographic region:
Australia 10,199 10,005
North America 9,674 11,140
UK & Europe 14,614 10,853
Japan 5,849 5,981
Asia 8,599 5,655
Other markets 112 142
New Zealand (a) 35,504 42,743
Total Expenditure of Parent 84,551 86,519
(a) New Zealand expenditure includes costs that cannot accurately be allocated to markets including the America's Cup Challenge, the cost of servicing the 100% Pure New Zealand Campaign, the International Media Programme and the newzealand.com website
2008 2007
$000s $000s
Total expenditure by the three strategic categories outlined in the Statement of Service Performance:
Campaign 48,228 47,955
Channel 16,622 16,861
Capability 19,701 21,703
Total Expenditure of Parent 84,551 86,519
Note 8Subsidiary companies
Interest Held Interest Held
2008 2007 2008 2007
Qualmark New Zealand Limited 60% 60% 60% 60%
Visitor Information Network Incorporated (trading as i-SITE NZ) 0% 0% 0% 0%
TOURISM NEW ZEALAND ANNUAL REPORT 2007–200840

G R O U P PA R E N T
The financial year-end of both subsidiaries is 30 June.
Tourism New Zealand has a 60% shareholding in Qualmark New Zealand Limited with the other 40% held by the New Zealand Automobile Association. Tourism New Zealand has control of Visitor Information Network Incorporated (VIN Inc), trading as i-SITE New Zealand, effective 21 August 2002.
Qualmark New Zealand Limited is New Zealand Tourism’s official quality agency. It is a government – private sector partnership between Tourism New Zealand and New Zealand Automobile Association. Qualmark licenses professional and trustworthy New Zealand tourism businesses to use the Qualmark® – tourism’s official quality mark – to help international and domestic travellers select places to stay, things to do and ways to get around.
Qualmark’s core activities are based around determining the eligibility of businesses to enter the licensing system. This is achieved by way of assessment, promoting and working with Qualmark® licensees and working closely with other organisations and sectors within the tourism industry. By doing so, quality standards are raised and New Zealand tourism businesses improved based on best-practice.
The assets, liabilities, revenue and deficit/surplus of Qualmark New Zealand which are included in the financial statements are as follows:
2008 2007 2008 2007
$000s $000s $000s $000s
Current assets 80 78 - -
Non-current assets 222 7 - -
302 85 - -
Current liabilities 404 234 - -
Non-current liabilities 0 0 - -
404 234 - -
Net assets (102) (149) - -
Revenue 2,990 2,446 - -
Surplus/(deficit) 47 (94) - -
Tourism New Zealand and i-SITE New Zealand have a relationship agreement that recognises the importance of having an effective and high quality network of visitor information centres, dedicated to delivering free, comprehensive and objective information. The terms and conditions of the relationship agreement mean that Tourism New Zealand meets the criteria determined in NZ IFRS 3 for consolidating investments in subsidiaries.
The i-SITE brand creates a distinctive look, which distinguishes the official network from other information centres. The i-SITE Visitor Centres provide on-the-ground information to ensure the visitor experience is as enjoyable as possible.
The assets, liabilities, revenue and deficit/surplus of Visitor Information Network Incorporated which are included in the financial statements are as follows:
2008 2007 2008 2007
$000s $000s $000s $000s
Current assets 120 164 - -
Non-current assets 0 0 - -
120 164 - -
Current liabilities 70 53 - -
Non-current liabilities 0 0 - -
70 53 - -
Net assets 50 111 - -
Revenue 841 0 - -
(Deficit)/surplus (61) 17 - -
Note 8 continued
TOURISM NEW ZEALAND ANNUAL REPORT 2007–2008 41

G R O U P PA R E N T
Note 9Associate company
2008 2007 2008 2007
$000s $000s $000s $000s
The New Zealand Way Limited 7 10 - -
The financial year-end of The New Zealand Way Limited is 30 June.
Tourism New Zealand has a 50% shareholding in The New Zealand Way Limited. This company is the operating entity of a joint venture between Tourism New Zealand and New Zealand Trade & Enterprise.
The New Zealand Way Brand provides marketing opportunities to those companies which meet quality and environmental standards. The Brand is promoted as a mark of outstanding quality, superior service and unique New Zealand characteristics.
There were no impairment losses relating to the investment in associate and no capital commitments or other commitments relating to the associate.
The following table illustrates summarised information of the investment in The New Zealand Way Limited:
2008 2007 2008 2007
$000s $000s $000s $000s
Share of associate's balance sheet:
Current assets 10 13 - -
Current liabilities 3 3 - -
Net assets 7 10 - -
Share of associate’s revenue and (deficit)/surplus:
Revenue 0 15 - -
(Deficit)/surplus (3) 5 - -
Carrying amount at beginning of year 10 5 - -
Carrying amount at end of year 7 10 - -
Note 10Cash
2008 2007 2008 2007
$000s $000s $000s $000s
Cash Holdings:
Cash at bank and in hand 1,488 1,194 1,365 1,076
Call accounts – foreign currencies 2,265 1,911 2,265 1,911
Call accounts – New Zealand dollar 1,447 330 1,447 285
5,200 3,435 5,077 3,272
Cash at bank and in hand generally earns interest at floating rates based on daily bank deposit rates.
Call account deposits are made depending on the immediate cash requirements of the Group, and earn interest at the respective money market call rates.
Cash Holdings by Currency:
New Zealand Dollar 2,181 574 2,058 411
United States Dollar 336 158 336 158
British Pound 677 1,238 677 1,238
TOURISM NEW ZEALAND ANNUAL REPORT 2007–200842

G R O U P PA R E N T
Australian Dollar 287 685 287 685
European Euro 359 57 359 57
Japanese Yen 210 179 210 179
Singapore Dollar 707 141 707 141
Canadian Dollar 203 88 203 88
Indian Rupee 171 171 171 171
Other Asian Currencies 69 144 69 144
5,200 3,435 5,077 3,272
Cash Holdings by Bank:
HSBC Bank 3,020 2,793 2,986 2,766
National Bank of New Zealand 736 243 736 243
Bank of New Zealand 1,253 207 1,164 71
Deutsche Bank 91 39 91 39
Tokyo Mitsubishi 100 153 100 153
5,200 3,435 5,077 3,272
The fair value of cash and cash equivalents is $5,200,000 (2007: $3.435,000).
Note 11Receivables
2008 2007 2008 2007
$000s $000s $000s $000s
Receivables 1,331 1,200 1,289 1,138
Less: Provision for impairment (7) (7) (3) (3)
1,324 1,193 1,286 1,135
Trade receivables are non-interest bearing and are generally on 50-day terms. The carrying value of receivables approximates their fair value. As at 30 June 2008 and 2007, all overdue receivables have been assessed for impairment and appropriate provisions applied, as detailed below:
PA R E N T
2008 2007
Gross Impairment Net Gross Impairment Net
$000s $000s $000s $000s $000s $000s
Not past due 1,219 0 1,219 1,039 0 1,039
Past due 1 – 30 days 1 0 1 78 0 78
Past due 31 – 60 days 55 0 55 0 0 0
Past due 61 – 90 days 2 0 2 0 0 0
Past due > 91 days 12 (3) 9 21 (3) 18
1,289 (3) 1,286 1,138 (3) 1,135
G R O U P
2008 2007
Gross Impairment Net Gross Impairment Net
$000s $000s $000s $000s $000s $000s
Not past due 1,215 0 1,215 1,089 0 1,089
Past due 1 – 30 days 27 0 27 82 0 82
Past due 31 – 60 days 56 0 56 0 0 0
Past due 61 – 90 days 19 0 19 6 0 6
Past due > 91 days 14 (7) 7 23 (7) 16
1,331 (7) 1,324 1,200 (7) 1,193
Note 10 continued
TOURISM NEW ZEALAND ANNUAL REPORT 2007–2008 43

G R O U P PA R E N T
The provision for impairment has been calculated based on expected losses determined by an analysis of losses in previous periods and a review of specific debtors.
Receivables for the Group include GST/VAT refunds comprising 46% (57% in 2007) of total receivables as follows:
2008 2007 2008 2007
$000s $000s $000s $000s
GST Refund due from NZ Inland Revenue Department 536 604 523 604
GST Refund due from Australian Taxation Office 32 24 32 24
VAT Refund due from UK Customs & Excise 38 56 38 56
606 684 593 684
Note 12Derivative financial instruments
Tourism New Zealand uses foreign exchange instruments in order to manage its exposure to fluctuations in foreign currency exchange rates on normal operating activities. The instruments are matched with anticipated future cash flows in foreign currencies. Tourism New Zealand does not use financial instruments for speculative purposes. At balance date Tourism New Zealand had 36 (2007: 48) foreign exchange contracts maturing at various dates over the next 12 months. The contracts are designated as held for trading financial instruments with fair value gains or losses recognised in the Statement of Financial Performance.
Foreign currency forward exchange contracts:
2008 2007 2008 2007
$000s $000s $000s $000s
Foreign exchange contracts at 30th June – Sell Value 35,800 34,450 35,800 34,450
Fair value Derivatives in Gain 1,514 0 1,514 0
Fair value Derivatives in Loss (20) (2,526) (20) (2,526)
Foreign exchange contracts at 30th June 37,294 31,924 37,294 31,924
Foreign exchange contracts by currency:
United States Dollar 12,303 9,638 12,303 9,638
British Pound 8,044 6,398 8,044 6,398
Australian Dollar 9,959 7,932 9,959 7,932
European Euro 2,156 2,487 2,156 2,487
Japanese Yen 2,842 3,516 2,842 3,516
Canadian Dollar 1,990 0 1,990 0
Singapore Dollar 0 1,319 0 1,319
Hong Kong Dollar 0 384 0 384
Thai Baht 0 250 0 250
37,294 31,924 37,294 31,924
Note 13Property plant and equipment
2008 2007 2008 2007
$000s $000s $000s $000s
All property plant and equipment
At cost 5,843 5,772 5,419 5,586
Accumulated depreciation (3,678) (4,156) (3,476) (3,977)
Net carrying amount of furniture and fittings 2,165 1,616 1,943 1,609
Note 11 continued
TOURISM NEW ZEALAND ANNUAL REPORT 2007–200844
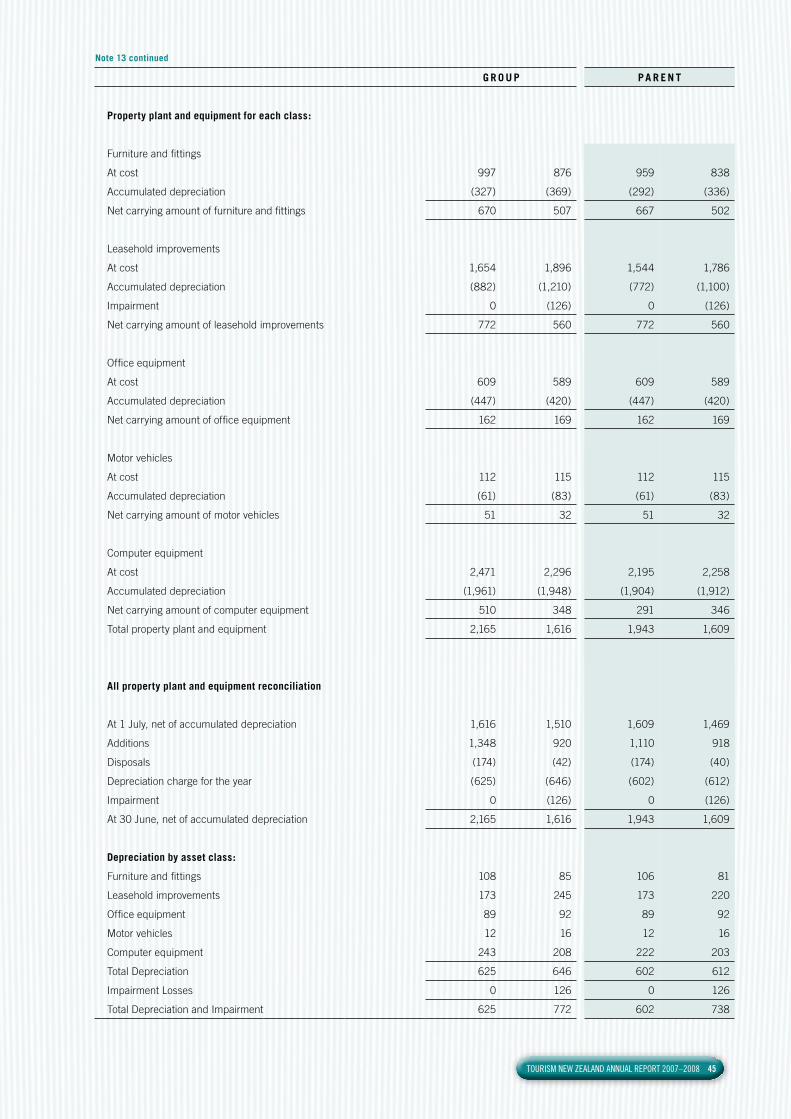
G R O U P PA R E N T
Property plant and equipment for each class:
Furniture and fittings
At cost 997 876 959 838
Accumulated depreciation (327) (369) (292) (336)
Net carrying amount of furniture and fittings 670 507 667 502
Leasehold improvements
At cost 1,654 1,896 1,544 1,786
Accumulated depreciation (882) (1,210) (772) (1,100)
Impairment 0 (126) 0 (126)
Net carrying amount of leasehold improvements 772 560 772 560
Office equipment
At cost 609 589 609 589
Accumulated depreciation (447) (420) (447) (420)
Net carrying amount of office equipment 162 169 162 169
Motor vehicles
At cost 112 115 112 115
Accumulated depreciation (61) (83) (61) (83)
Net carrying amount of motor vehicles 51 32 51 32
Computer equipment
At cost 2,471 2,296 2,195 2,258
Accumulated depreciation (1,961) (1,948) (1,904) (1,912)
Net carrying amount of computer equipment 510 348 291 346
Total property plant and equipment 2,165 1,616 1,943 1,609
All property plant and equipment reconciliation
At 1 July, net of accumulated depreciation 1,616 1,510 1,609 1,469
Additions 1,348 920 1,110 918
Disposals (174) (42) (174) (40)
Depreciation charge for the year (625) (646) (602) (612)
Impairment 0 (126) 0 (126)
At 30 June, net of accumulated depreciation 2,165 1,616 1,943 1,609
Depreciation by asset class:
Furniture and fittings 108 85 106 81
Leasehold improvements 173 245 173 220
Office equipment 89 92 89 92
Motor vehicles 12 16 12 16
Computer equipment 243 208 222 203
Total Depreciation 625 646 602 612
Impairment Losses 0 126 0 126
Total Depreciation and Impairment 625 772 602 738
Note 13 continued
TOURISM NEW ZEALAND ANNUAL REPORT 2007–2008 45

G R O U P PA R E N T
Note 14Accommodation bonds
Accommodation bonds are refundable deposits or key money paid for the lease of office and housing premises.
2008 2007 2008 2007
$000s $000s $000s $000s
UK & Europe 9 9 9 9
Japan 155 128 155 128
Asia 179 138 179 138
343 275 343 275
Note 15Creditors and other payables
Payables are non-interest bearing and are normally settled on 30-day terms, therefore the carrying value of creditors and other payables approximates their fair value.
2008 2007 2008 2007
$000s $000s $000s $000s
Creditors 1,426 1,870 1,301 1,846
Income in advance 335 78 310 54
Accrued expenses 2,852 2,256 2,592 2,054
4,613 4,204 4,203 3,954
Note 16Employee entitlements
2008 2007 2008 2007
$000s $000s $000s $000s
Annual Leave 430 370 394 347
Retirement Leave 437 354 437 354
Long Service Leave 58 51 58 51
Sick Leave 2 2 2 2
927 777 891 754
Note 17Provisions
Tourism New Zealand has a number of potential future restoration costs relating to make good clauses on office rental leases. The provision recognises the present value of expected future payments for amounts in relation to make good. The provision relates to seven Tourism New Zealand offices and is expected to be incurred over the next 12 years.
2008 2007 2008 2007
$000s $000s $000s $000s
Provisions are represented by:
Lease make-good 303 220 303 220
Total Provisions 303 220 303 220
TOURISM NEW ZEALAND ANNUAL REPORT 2007–200846

G R O U P PA R E N T
2008 2008 2008 2007
Lease make-good
Lease make-good
Lease make-good
Lease make-good
Movements for provisions are as follows: $000s $000s $000s $000s
Balance at 1 July 220 320 220 320
Additional provisions made 165 0 165 0
Amounts used (82) (100) (82) (100)
Unused amounts reversed 0 0 0 0
Discount unwind 0 0 0 0
Balance at 30 June 303 220 303 220
Note 18Reconciliation of surplus (deficit) to net cash from operating activities
2008 2007 2008 2007
$000s $000s $000s $000s
Net operating surplus (deficit) 4,029 (4,630) 4,043 (4,554)
Add/(less) non-cash items
Depreciation and impairment 624 772 602 738
Net (gains) on derivative financial instruments (4,040) 5,037 (4,040) 5,037
Net losses on derivative financial instruments 20 (43) 20 (43)
Net foreign exchange (gains)/losses (149) 732 (149) 732
Total non-cash items (3,545) 6,498 (3,567) 6,464
Add/(less) items classified as investing or financing activities
Net Loss/(Gain) on disposal of assets 143 32 143 30
Net Loss/(Gain) on foreign currency accommodation bonds (23) 82 (23) 82
Total items classified as investing or financing activities 120 114 120 112
Add/(less) movements in working capital items
Debtors and other receivables (150) (276) (151) (253)
Prepayments 1,869 (2,275) 1,866 (2,289)
Payables & accruals 626 (638) 453 (672)
Provisions 83 (100) 83 (100)
Employee entitlements 150 (101) 137 (102)
Net movements in working capital items 2,578 (3,390) 2,388 (3,416)
Net cash from operating activities 3,182 (1,408) 2,984 (1,394)
Note 19Contingent liabilities and contingent assets
There are no known contingencies for the Group or Parent as at 30 June 2008 (2007: Nil).
Note 17 continued
TOURISM NEW ZEALAND ANNUAL REPORT 2007–2008 47

Note 20Income tax
Tourism New Zealand is exempt from income tax under the New Zealand Tourism Board Act 1991. Tourism New Zealand’s subsidiaries are subject to income tax. The Group has tax losses unrecognised that can be used to offset future assessable income of $129,407 (2007: $246,445)
Note 21Management of risk
Tourism New Zealand has developed a risk management framework and has undertaken a full risk assessment of its business. Management is required to sign off on a half yearly basis that no new exposures have arisen and that existing risks are being properly managed. Written policies and procedures exist covering those aspects of business which have the potential to generate risk for Tourism New Zealand. Adherence to these policies minimises potential risk to Tourism New Zealand. Employees are required as part of employment contracts to adhere to Tourism New Zealand policies and procedures.
Tourism New Zealand carries comprehensive insurance covering all normal business risks including Public Liability. Tourism New Zealand has purchased insurance to provide Directors and Officers Liability, Employers Liability and Professional Indemnity cover for Board members and employees. Tourism New Zealand also provides cover for its staff for off shore travel. Insured values are reviewed annually and adjusted to reflect changes in business operations.
Note 22Significant accounting judgements, estimates and assumptions
The preparation of the financial statements requires management to make judgements, estimates and assumptions that affect the reported amounts in the financial statements. Management continually evaluates its judgements and estimates in relation to assets, liabilities, contingent liabilities, revenue and expenses. These judgements and estimates are based on historical experience and other factors that are reasonable under the circumstances and form the basis for the carrying values of assets and liabilities. Actual results may differ from these estimates under different assumptions and conditions.
Management has identified the following critical accounting policy for which significant judgements, estimates and assumptions have been made.
Make good provision
A provision has been made for a number of potential future restoration costs relating to make good clauses on seven office rental leases. The calculation of this provision requires assumptions such as the extent, if any, that Landlords will enforce the make good clauses in the leases and building and demolition cost estimates. These uncertainties may result in future actual expenditure differing from the amounts currently provided. The provision recognised for each lease is periodically reviewed and updated based on the facts and circumstances available at the time. Changes to the estimated future costs for make good are recognised in the balance sheet by adjusting both the expense or asset and provision. The related carrying amounts are disclosed in note 17.
Note 23Capital management
Tourism New Zealand’s capital is its equity, which comprises accumulated funds and other reserves. Equity is represented by net assets.
Tourism New Zealand is subject to the financial management and accountability provisions of the Crown Entities Act 2004, which impose restrictions in relation to borrowings, acquisition of securities, issuing guarantees and indemnities and the use of derivatives.
Tourism New Zealand manages its equity as a by-product of prudently managing revenues, expenses, assets, liabilities, investments and general financial dealings to ensure that Tourism New Zealand effectively achieves its objectives and purpose, whilst remaining a going concern.
TOURISM NEW ZEALAND ANNUAL REPORT 2007–200848
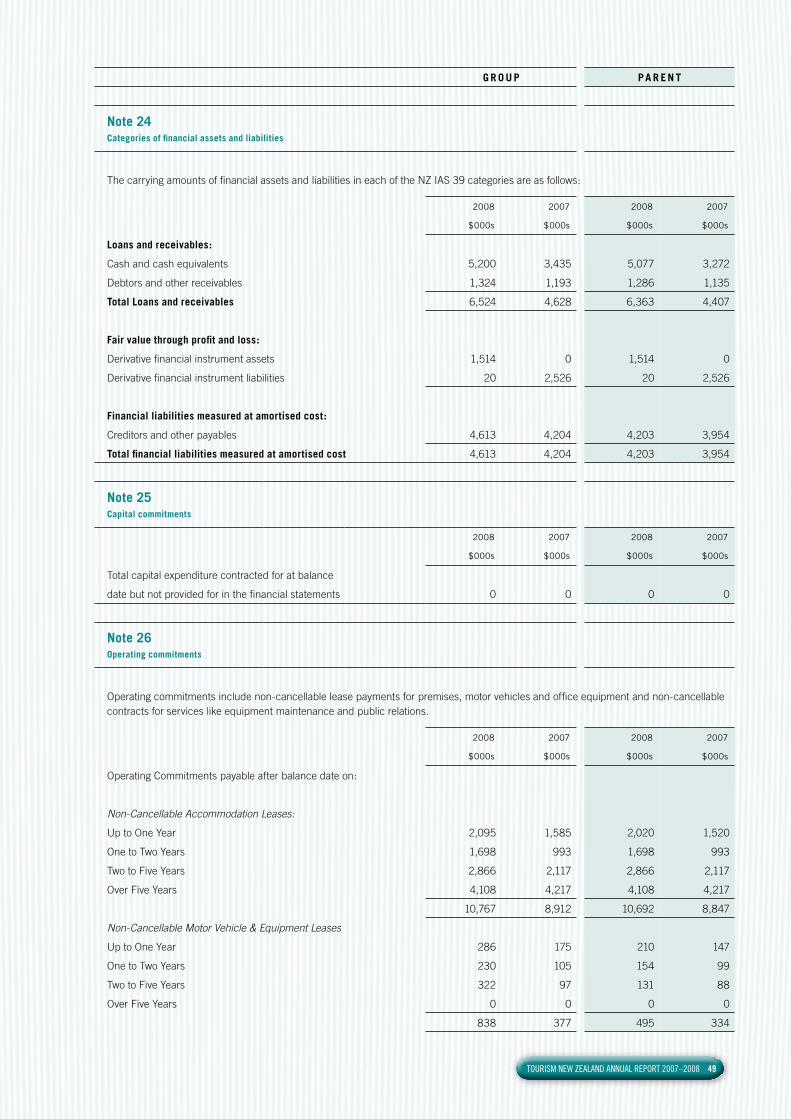
G R O U P PA R E N T
Note 24Categories of financial assets and liabilities
The carrying amounts of financial assets and liabilities in each of the NZ IAS 39 categories are as follows:
2008 2007 2008 2007
$000s $000s $000s $000s
Loans and receivables:
Cash and cash equivalents 5,200 3,435 5,077 3,272
Debtors and other receivables 1,324 1,193 1,286 1,135
Total Loans and receivables 6,524 4,628 6,363 4,407
Fair value through profit and loss:
Derivative financial instrument assets 1,514 0 1,514 0
Derivative financial instrument liabilities 20 2,526 20 2,526
Financial liabilities measured at amortised cost:
Creditors and other payables 4,613 4,204 4,203 3,954
Total financial liabilities measured at amortised cost 4,613 4,204 4,203 3,954
Note 25Capital commitments
2008 2007 2008 2007
$000s $000s $000s $000s
Total capital expenditure contracted for at balance
date but not provided for in the financial statements 0 0 0 0
Note 26Operating commitments
Operating commitments include non-cancellable lease payments for premises, motor vehicles and office equipment and non-cancellable contracts for services like equipment maintenance and public relations.
2008 2007 2008 2007
$000s $000s $000s $000s
Operating Commitments payable after balance date on:
Non-Cancellable Accommodation Leases:
Up to One Year 2,095 1,585 2,020 1,520
One to Two Years 1,698 993 1,698 993
Two to Five Years 2,866 2,117 2,866 2,117
Over Five Years 4,108 4,217 4,108 4,217
10,767 8,912 10,692 8,847
Non-Cancellable Motor Vehicle & Equipment Leases
Up to One Year 286 175 210 147
One to Two Years 230 105 154 99
Two to Five Years 322 97 131 88
Over Five Years 0 0 0 0
838 377 495 334
TOURISM NEW ZEALAND ANNUAL REPORT 2007–2008 49

G R O U P PA R E N T
Non-Cancellable Contracts for Goods & Services
Up to One Year 107 105 107 105
One to Two Years 0 0 0 0
Two to Five Years 0 0 0 0
Over Five Years 0 0 0 0
107 105 107 105
Total Commitments 11,712 9,394 11,294 9,286
Note 27Related party transactions
Tourism New Zealand is a wholly owned entity of the Crown which has the ability to significantly influence its role. The Crown is Tourism New Zealand’s major source of revenue.
Tourism New Zealand enters into transactions with government departments, state-owned enterprises and other Crown entities. Those transactions that occur within a normal supplier or client relationship on terms and conditions no more or less favourable than those which it is reasonable to expect Tourism New Zealand would have adopted if dealing with that entity at arm’s length in the same circumstances have not been disclosed as related party transactions.
Tourism New Zealand also enters into transactions with its subsidiaries and associate. These transactions occur within a normal supplier or client relationship on terms and conditions no more or less favourable than those which it is reasonable to expect Tourism New Zealand would have adopted if dealing with that entity at arm’s length. The following table provides the total amount of transactions that were entered into with these related parties.
Transaction value year ended 30 June
Balance outstanding year ended 30 June
2008 2007 2008 2007
$000s $000s $000s $000s
Related Party and Transaction
Subsidiary – Qualmark New Zealand Limited:
Shareholder income provided by Tourism New Zealand 1,046 716 0 0
Purchases from Tourism New Zealand 52 53 28 14
Subsidiary – Visitor Information Network Inc:
Shareholder income provided by Tourism New Zealand 500 250 0 0
Sales to Tourism New Zealand 0 6 0 0
Purchases from Tourism New Zealand 5 11 0 0
Associate – The New Zealand Way Limited:
Shareholder income provided by Tourism New Zealand 0 15 0 0
Tourism New Zealand also enters into transactions with Directors and entities over which they have control or significant influence. These transactions occur within a normal supplier or client relationship on terms and conditions no more or less favourable than those which it is reasonable to expect Tourism New Zealand would have adopted if dealing with that entity at arm's length. The following table provides the total amount of transactions that were entered into with these related parties.
Note 26 continued
TOURISM NEW ZEALAND ANNUAL REPORT 2007–200850
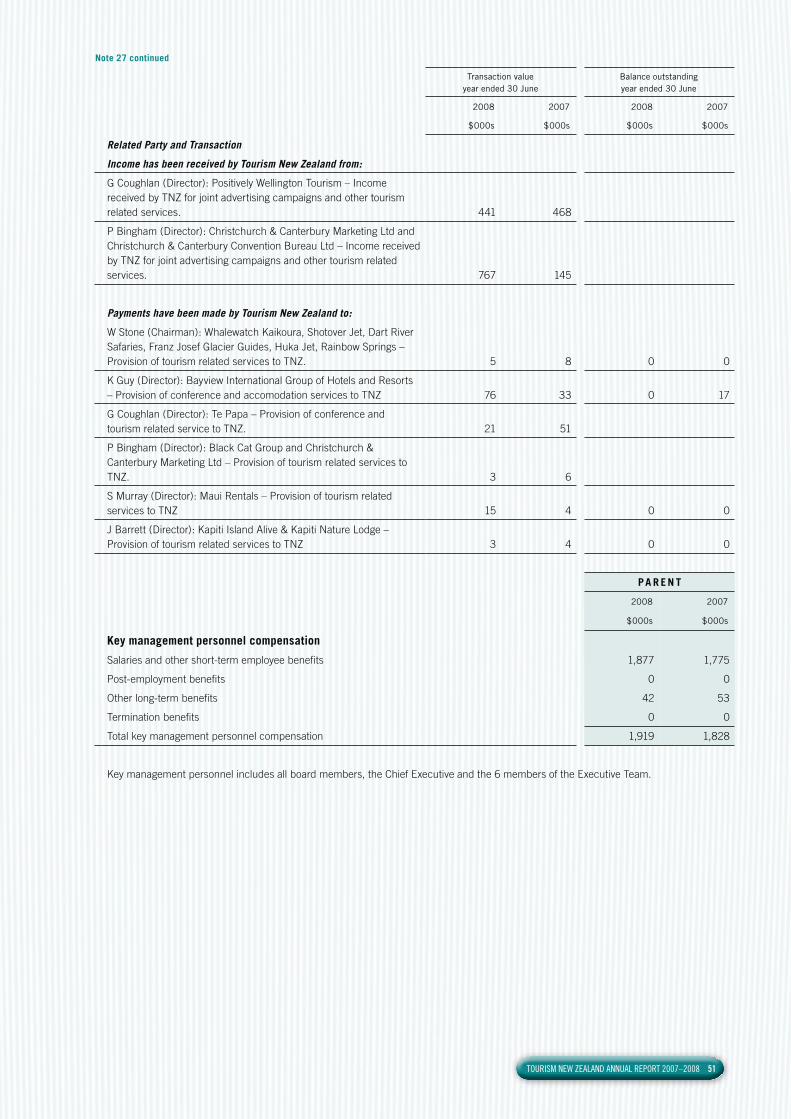
Note 27 continued
Transaction value year ended 30 June
Balance outstanding year ended 30 June
2008 2007 2008 2007
$000s $000s $000s $000s
Related Party and Transaction
Income has been received by Tourism New Zealand from:
G Coughlan (Director): Positively Wellington Tourism – Income received by TNZ for joint advertising campaigns and other tourism related services. 441 468
P Bingham (Director): Christchurch & Canterbury Marketing Ltd and Christchurch & Canterbury Convention Bureau Ltd – Income received by TNZ for joint advertising campaigns and other tourism related services. 767 145
Payments have been made by Tourism New Zealand to:
W Stone (Chairman): Whalewatch Kaikoura, Shotover Jet, Dart River Safaries, Franz Josef Glacier Guides, Huka Jet, Rainbow Springs – Provision of tourism related services to TNZ. 5 8 0 0
K Guy (Director): Bayview International Group of Hotels and Resorts – Provision of conference and accomodation services to TNZ 76 33 0 17
G Coughlan (Director): Te Papa – Provision of conference and tourism related service to TNZ. 21 51
P Bingham (Director): Black Cat Group and Christchurch & Canterbury Marketing Ltd – Provision of tourism related services to TNZ. 3 6
S Murray (Director): Maui Rentals – Provision of tourism related services to TNZ 15 4 0 0
J Barrett (Director): Kapiti Island Alive & Kapiti Nature Lodge – Provision of tourism related services to TNZ 3 4 0 0
PA R E N T
2008 2007
$000s $000s
Key management personnel compensation
Salaries and other short-term employee benefits 1,877 1,775
Post-employment benefits 0 0
Other long-term benefits 42 53
Termination benefits 0 0
Total key management personnel compensation 1,919 1,828
Key management personnel includes all board members, the Chief Executive and the 6 members of the Executive Team.
TOURISM NEW ZEALAND ANNUAL REPORT 2007–2008 51

Note 28Financial instrument risks
Tourism New Zealand’s activities expose it to a variety of financial instrument risks, including market risk, credit risk and liquidity risk. Tourism New Zealand has a series of policies to manage the risks associated with financial instruments and seeks to minimise exposure from financial instruments. These policies do not allow any transactions that are speculative in nature.
Market RiskFair value interest rate risk – Fair value interest rate risk is the risk that the value of a financial instrument will fluctuate due to changes in market rates. Tourism New Zealand has no exposure to fair value interest rate risk as all bank deposits are held at call rates.
Currency risk – Currency risk is the risk that the fair value or future cash flows of a financial instrument will fluctuate due to changes in foreign exchange rates.
As a result of significant operations around the world, Tourism New Zealand is required to enter into transactions denominated in foreign currencies. As a result of these activities, exposure to currency risk arises.
It is Tourism New Zealand's policy to manage foreign currency risks arising from contractual commitments and liabilities by entering into foreign exchange forward contracts to cover the foreign currency exposure.
Currency risk sensitivity analysis – Tourism New Zealand is subject to volatility in financial performance associated with foreign currency rates, especially when recognising fair value movements associated with forward foreign exchange contracts. As at 30 June 2008, if the NZ Dollar had weakened/strengthened by 5% against the basket of foreign currencies used by Tourism New Zealand with all other variables held constant, the surplus would have been:
This movement is attributable to foreign exchange gains/losses on translation of forward foreign exchange contracts and excludes other foreign currency denominated assets and liabilities which would have had a less significant effect on the surplus.
Credit riskCredit risk is the risk that a third party will default on its obligations to Tourism New Zealand, causing Tourism New Zealand to incur a loss.
Tourism New Zealand has no significant concentrations of credit risk, as it has a small number of credit customers and only places funds with registered banks. With respect to foreign exchange instruments, Tourism New Zealand reduces its risk by limiting the counter parties to major trading banks and does not expect to incur any significant losses as a result of non performance by these counter parties.
Tourism New Zealand's maximum credit exposure for each class of financial instrument is represented by the total carrying amount of cash (note 10), net debtors (note 11) and derivative financial instruments (note 12). There is no collateral held as security against these financial instruments, including those instruments that are overdue or impaired.
Liquidity riskLiquidity risk is the risk that Tourism New Zealand will encounter difficulty raising liquid funds to meet commitments as they fall due.
Tourism New Zealand has no significant concentrations of liquidity risk. Tourism New Zealand annually agrees a funding schedule with the Crown which matches the estimated timing of its commitments and close out of market positions.
Note 29Remuneration of employees
During 2007/2008 32 (2007: 33) employees received remuneration and benefits which exceeded $100,000 per annum as follows:
PA R E N T
$ 2008 2007
100,000 - 109,999 7 7
110,000 - 119,999 5 4
120,000 - 129,999 3 3
130,000 - 139,999 2 4
140,000 - 149,999 2 1
150,000 - 159,999 1 1
160,000 - 169,999 1 1
170,000 - 179,999 0 2
180,000 - 189,999 1 1
190,000 - 199,999 0 1
TOURISM NEW ZEALAND ANNUAL REPORT 2007–200852

Note 29 continued
PA R E N T
200,000 - 209,999 2 1
220,000 - 229,999 0 2
240,000 - 249,999 2 2
250,000 - 259,999 1 0
260,000 - 269,999 1 0
280,000 - 289,999 1 1
290,000 - 299,999 0 1
300,000 - 309,999 2 0
380,000 - 389,999 0 1
390,000 - 399,999 1 0
32 33
Average remuneration of above employees $170,514 $164,341
Note: A number of Tourism New Zealand employees are based offshore and are paid in local currency at appropriate remuneration levels within the respective countries. This remuneration has been translated at the exchange rates of forward exchange contracts used to cover this expenditure.
Note 30Remuneration of directors of parent
2008 2007
$000s $000s
Board members earned the following fees during the year:
W Stone (Chair) 39 35
S Johnstone (Deputy Chair) 25 18
P Bingham 20 18
K Guy 20 18
S Murray 20 18
G Coughlan 20 8
K McKelvie 20 8
J Barrett 20 8
M Johns 20 0
P Stubbs 0 22
M Boyd 0 10
K Johnston 0 10
M Tamaki 0 10
204 183
Changes in Directors: W Stone retired on 30 June 2008. G Muir was appointed Chairman on 15 July 2008. K Guy resigned as a Director on 14 August 2008. Henry van Asch was appointed a Director on 1 September 2008.
TOURISM NEW ZEALAND ANNUAL REPORT 2007–2008 53

Note 31Explanation of transition to NZ IFRS
The New Zealand Accounting Standards Review Board announced on 19 December 2002 that New Zealand International Financial Reporting Standards (NZ IFRS) will apply for reporting periods commencing on or after 1 January 2007. These are Tourism New Zealand’s first financial statements to be prepared in accordance with NZ IFRS. Tourism New Zealand’s transition date is 1 July 2006 and the opening NZ IFRS balance sheet has been prepared as at that date. Tourism New Zealand’s adoption date is 1 July 2007.
Transition from existing NZ GAAP to NZ IFRS has been made in accordance with NZ IFRS 1 "First-time Adoption of New Zealand Equivalents to International Financial Reporting Standards." Comparative information has been restated to conform with the requirements of NZ IFRS.
Reconciliation of equity
The following table shows the changes in equity, resulting from the transition from previous NZ GAAP to NZ IFRS as at 1 July 2006 and 30 June 2007:
Note 1 July 2006 Group 30 June 2007 Group
Previous NZ GAAP
Effect on Transition
to NZ IFRS NZ IFRSPrevious
NZ GAAP
Effect on Transition
to NZ IFRS NZ IFRS
$000s $000s $000s $000s $000s $000s
Current Assets
Cash 6,265 0 6,265 3,435 0 3,435
Receivables 913 0 913 1,193 0 1,193
Prepayments & other current assets a 299 320 619 2,726 165 2,891
Derivative financial instruments b 0 2,512 2,512 0 0 0
7,477 2,832 10,309 7,354 165 7,519
Non-current Assets
Property plant and equipment 1,510 0 1,510 1,616 0 1,616
Investment in associate 5 0 5 10 0 10
Accommodation bonds 340 0 340 275 0 275
1,855 0 1,855 1,901 0 1,901
Total Assets 9,332 2,832 12,164 9,255 165 9,420
Current Liabilities
Creditors and other payables 4,603 0 4,603 4,204 0 4,204
Employee entitlements c 380 500 880 370 407 777
Provisions a 0 320 320 0 220 220
Derivative financial instruments b 0 43 43 0 2,526 2,526
4,983 863 5,846 4,574 3,153 7,727
Total Liabilities 4,983 863 5,846 4,574 3,153 7,727
Net Assets 4,349 1,969 6,318 4,681 (2,988) 1,693
Equity
Shareholder's equity 1,805 0 1,805 1,805 0 1,805
Retained earnings 2,451 1,969 4,420 2,765 (2,988) (223)
Minority interests 93 0 93 111 0 111
Total Equity 4,349 1,969 6,318 4,681 (2,988) 1,693
TOURISM NEW ZEALAND ANNUAL REPORT 2007–200854

a. Lease Make Good Provision
Tourism New Zealand has a number of potential future restoration costs relating to make good clauses on office rental leases. A liability provision and an asset lease for these costs were not recognised under NZ GAAP. NZ IFRS requires Tourism New Zealand to recognise the present value of expected future payments for amounts in relation to make good. The asset lease is amortised over the expected term of the lease. The provision relates to seven Tourism New Zealand offices and are expected to be incurred over the next 12 years.
b. Derivative financial instruments Financial derivatives were not recognised in the statement of financial position under previous NZ GAAP. NZ IFRS requires financial derivatives to be recognised in the statement of financial position at their fair value.
c. Employee entitlements Retirement, long service and sick leave were not recognised as a liability under previous NZ GAAP. NZ IFRS requires Tourism New Zealand to recognise employees retirement, long service and sick leave. Retirement and long service leave obligations are calculated based on a number of assumptions including the discount rate and the salary inflation factor. The amount of unused employees sick leave entitlement that can be carried forward at balance date is recognised to the extent that Tourism New Zealand anticipates it will be used by staff to cover future absences.
Reconciliation of surplus for the year ending 30 June 2007
The following table shows the changes in the Tourism New Zealand surplus, resulting from the transition from previous NZ GAAP to NZ IFRS for the year ending 30 June 2007:
NotePrevious NZ
GAAP
Effect on Transition to
NZ IFRS NZ IFRS
$000s $000s $000s
Income
Revenue from Crown 74,246 0 74,246
Interest income 866 0 866
Other revenue 6,295 0 6,295
Net foreign exchange gains a 2,574 43 2,617
Total Income 83,981 43 84,024
Expenditure
Marketing expenses 62,121 0 62,121
Other expenses b, c 18,670 (37) 18,633
Depreciation & Impairment 772 0 772
Net foreign exchange losses d 2,091 5,037 7,128
Total Expenditure 83,654 5,000 88,654
Net Operating Surplus/(Deficit) before Taxation 327 (4,957) (4,630)
Income tax expense 0 0 0
Minority interests in profits/(losses) of subsidiaries 18 0 18
Share of loss/(gain) of associate company (5) 0 (5)
Net Surplus/(Deficit) for the year 314 (4,957) (4,643)
Note 31 continued
TOURISM NEW ZEALAND ANNUAL REPORT 2007–2008 55

a. Gains – Net gain on derivative financial instruments
This represents fair value movements associated with forward foreign exchange contracts, which are required to be recognised in the statement of financial performance. Under previous NZ GAAP unrecognised gains on forward exchange contracts were deferred (off balance sheet) and were subsequently recognised as an adjustment to the recognition value of the relevant assets.
b. Other expenses – long service, retirement and sick leave This represents the increase in the long service leave, retirement leave and sick leave provisions which were not recognised under previous NZ GAAP
c. Other expenses – Lease asset and make good provision This represents the increase in the lease asset and make good provision together with depreciation of the lease asset which were not recognised under previous NZ GAAP
d. Other expenses – Net loss on derivative financial instruments
This represents fair value movements associated with forward foreign exchange contracts, which are required to be recognised in the statement of financial performance. Under previous NZ GAAP unrecognised losses on forward exchange contracts were deferred (off balance sheet) and were subsequently recognised as an adjustment to the recognition value of the relevant assets.
Explanation of material adjustments to the statements of cash flows
There are no material differences between the cash flow statement presented under NZ IFRS and the cash flow statement presented under previous NZ GAAP.
Note 31 continued
TOURISM NEW ZEALAND ANNUAL REPORT 2007–200856

Five Year Financial Summary for Parent
Statement of Financial Position
2004 2005 2006 2007 2008
Actual Actual Actual Actual Actual
$000s $000s $000s $000s $000s
Current Assets
Cash 4,062 6,673 6,086 3,272 5,077
Receivables 655 1,133 882 1,135 1,286
Prepayments & other current assets 684 600 275 2,884 1,018
Derivative financial instruments - - - 0 1,514
5,401 8,406 7,243 7,291 8,895
Non-current Assets
Property plant and equipment 1,725 1,223 1,469 1,609 1,943
Accommodation bonds 298 228 340 275 343
2,023 1,451 1,809 1,884 2,286
Total Assets 7,424 9,857 9,052 9,175 11,181
Current Liabilities
Creditors and other payables 2,499 4,614 4,389 3,954 4,203
Provisions 626 0 0 220 303
Employee entitlements 371 333 357 754 891
Derivative financial instruments - - - 2,526 20
3,496 4,947 4,746 7,454 5,417
Total Liabilities 3,496 4,947 4,746 7,454 5,417
Net Assets 3,928 4,910 4,306 1,721 5,764
Equity
Shareholder's equity 1,805 1,805 1,805 1,805 1,805
Retained earnings 2,123 3,105 2,501 (84) 3,959
Total Equity 3,928 4,910 4,306 1,721 5,764
Statement of Financial Performance
2004 2005 2006 2007 2008
Actual Actual Actual Actual Actual
$000s $000s $000s $000s $000s
Revenue
Government grants 60,230 69,754 79,358 74,246 75,071
Interest 419 627 745 859 707
Other revenue 310 289 474 4,243 4,817
Foreign exchange gains - - - 2,617 7,999
60,959 70,670 80,577 81,965 88,594
Expenditure
Marketing expenses 47,498 52,213 63,202 61,631 63,044
Other expenses 15,841 16,808 17,427 17,022 18,428
Depreciation & Impairment 714 667 552 738 602
Foreign exchange losses - - - 7,128 2,477
64,053 69,688 81,181 86,519 84,551
Net Operating Surplus/(Deficit) (3,094) 982 (604) (4,554) 4,043
The 2008 financial year was Tourism New Zealand’s first set of financial statements to be prepared in accordance with New Zealand International Financial Reporting Standards (NZ IFRS.) The comparative figures for 2007 have been restated accordingly to NZ IFRS. Note however that the comparatives figures from 2004 to 2006 in the above table have not been restated to NZ IFRS.
TOURISM NEW ZEALAND ANNUAL REPORT 2007–2008 57
AUDIT REPORTTO THE READERS OF NEW ZEALAND TOURISM BOARD AND GROUP’S FINANCIAL STATEMENTS AND STATEMENT OF SERVICE PERFORMANCE FOR THE YEAR ENDED 30 JUNE 2008
The Auditor-General is the auditor of the New Zealand Tourism Board (the
Board) and group. The Auditor-General has appointed me, Grant Taylor,
using the staff and resources of Ernst and Young, to carry out the audit on
his behalf. The audit covers the financial statements and statement of
service performance included in the annual report of the Board and group
for the year ended 30 June 2008.
Unqualified OpinionIn our opinion:
– The financial statements of the Board and group on pages 32 to 56:
– comply with generally accepted accounting practice in
New Zealand;
– give a true and fair view of:
– the Board and group’s financial position as at 30 June 2008;
and
– the results of operations and cash flows for the year ended
on that date.
– The statement of service performance of the Board and group on
pages 12 to 27:
– complies with generally accepted accounting practice in
New Zealand; and
– gives a true and fair view of, for each class of outputs:
– standards of delivery performance achieved, as compared
with the forecast standards outlined in the statement of
forecast service performance adopted at the start of the
financial year; and
– actual revenue earned and output expenses incurred, as
compared with the forecast revenues and output expenses
outlined in the statement of forecast service performance
adopted at the start of the financial year.
– Based on our examination the Board and group kept proper
accounting records.
The audit was completed on 31 October 2008, and is the date at which
our opinion is expressed.
The basis of our opinion is explained below. In addition, we outline the
responsibilities of the Board of Directors and the Auditor, and explain our
independence.
Basis of OpinionWe carried out the audit in accordance with the Auditor-General’s Auditing
Standards, which incorporate the New Zealand Auditing Standards.
We planned and performed the audit to obtain all the information and
explanations we considered necessary in order to obtain reasonable
assurance that the financial statements and statement of service performance
did not have material misstatements, whether caused by fraud or error.
Material misstatements are differences or omissions of amounts and
disclosures that would affect a reader’s overall understanding of the
financial statements and statement of service performance. If we had
found material misstatements that were not corrected, we would have
referred to them in our opinion.
The audit involved performing procedures to test the information presented
in the financial statements and statement of service performance.
We assessed the results of those procedures in forming our opinion.
Audit procedures generally include:
- determining whether significant financial and management controls
are working and can be relied on to produce complete and accurate
data;
- verifying samples of transactions and account balances;
- performing analyses to identify anomalies in the reported data;
- reviewing significant estimates and judgements made by the Board of
Directors;
- confirming year-end balances;
- determining whether accounting policies are appropriate and
consistently applied; and
- determining whether all financial statement and statement of service
performance disclosures are adequate.
We did not examine every transaction, nor do we guarantee complete
accuracy of the financial statements and statement of service
performance.
We evaluated the overall adequacy of the presentation of information in
the financial statements and statement of service performance. We
obtained all the information and explanations we required to support our
opinion above.
Responsibilities of the Board of Directors and the AuditorThe Board of Directors is responsible for preparing the financial
statements and statement of service performance in accordance with
generally accepted accounting practice in New Zealand. The financial
statements must give a true and fair view of the financial position of the
Board and group as at 30 June 2008 and the results of operations and
cash flows for the year ended on that date. The statement of service
performance must give a true and fair view of, for each class of outputs,
the Board and group’s standards of delivery performance achieved and
revenue earned and expenses incurred, as compared with the forecast
standards, revenue and expenses adopted at the start of the financial
year. The Board of Director’s responsibilities arise from the Crown Entities
Act 2004 and the New Zealand Tourism Board Act 1991.
We are responsible for expressing an independent opinion on the financial
statements and statement of service performance and reporting that
opinion to you. This responsibility arises from section 15 of the Public
Audit Act 2001 and the Crown Entities Act 2004.
IndependenceWhen carrying out the audit we followed the independence requirements
of the Auditor-General, which incorporate the independence requirements
of the Institute of Chartered Accountants of New Zealand.
Other than the audit, we have no relationship with or interests in the
Board or any of its subsidiaries.
Grant Taylor Ernst & Young
On behalf of the Auditor-General
Wellington, New Zealand
Grant Taylor
TOURISM NEW ZEALAND ANNUAL REPORT 2007–200858

visit www.tourismnewzealand.com

Tourism New Zealand Manaakitanga Aotearoa, PO Box 95, Level 22, 157 Lambton Quay, Wellington, New ZealandTel : +64 4 462 8000 www.tourismnewzealand.com www.newzealand.com
TouTourisi m Nm Newew ZeaZe lannd Md Manaan akikitanga g AotA eare oa,a POP BoBox 9x 95, 5 Leve el l 22,22 157 Lambambtono Qu Quay,, WeW llillingtngton,o NeNew ZeZealanandTel : + 64 4 44 462 62 8008000 ww www.tw. ourourismnewnewzeaealanla d.cd om om w www.newnewzeaalanl d.cd. omm
This Annual Report has been printed on 100% recycled paper, made up of 30% pre-consumer printer and converting waste and 70% post-consumer
waste from old milk cartons. The recycled pulp is processed chlorine free (PCF) and has been sourced from an ISO14001 certified mill.


