Tourism leakage of accommodation in Bali
383
HAL Id: tel-02453449 https://tel.archives-ouvertes.fr/tel-02453449 Submitted on 23 Jan 2020 HAL is a multi-disciplinary open access archive for the deposit and dissemination of sci- entific research documents, whether they are pub- lished or not. The documents may come from teaching and research institutions in France or abroad, or from public or private research centers. L’archive ouverte pluridisciplinaire HAL, est destinée au dépôt et à la diffusion de documents scientifiques de niveau recherche, publiés ou non, émanant des établissements d’enseignement et de recherche français ou étrangers, des laboratoires publics ou privés. Tourism leakage of accommodation in Bali I Gusti Ayu Oka Suryawardani To cite this version: I Gusti Ayu Oka Suryawardani. Tourism leakage of accommodation in Bali. Business administration. Université Panthéon-Sorbonne - Paris I, 2015. English. NNT: 2015PA010071. tel-02453449
Transcript of Tourism leakage of accommodation in Bali

HAL Id: tel-02453449https://tel.archives-ouvertes.fr/tel-02453449
Submitted on 23 Jan 2020
HAL is a multi-disciplinary open accessarchive for the deposit and dissemination of sci-entific research documents, whether they are pub-lished or not. The documents may come fromteaching and research institutions in France orabroad, or from public or private research centers.
L’archive ouverte pluridisciplinaire HAL, estdestinée au dépôt et à la diffusion de documentsscientifiques de niveau recherche, publiés ou non,émanant des établissements d’enseignement et derecherche français ou étrangers, des laboratoirespublics ou privés.
Tourism leakage of accommodation in BaliI Gusti Ayu Oka Suryawardani
To cite this version:I Gusti Ayu Oka Suryawardani. Tourism leakage of accommodation in Bali. Business administration.Université Panthéon-Sorbonne - Paris I, 2015. English. �NNT : 2015PA010071�. �tel-02453449�

DISSERTATION
TOURISM LEAKAGE FROM THE ACCOMMODATION
IN BALI
I GUSTI AYU OKA SURYAWARDANI
INDONESIAN-FRENCH DOUBLE DOCTORATE DEGREE IN TOURISM
UDAYANA UNIVERSITY, DENPASAR UNIVERSITÉ PARIS 1 PANTHÉON - SORBONNE
2015
i
DECLARATION OF ORIGINALITY
The work presented in this dissertation is, to the best of my knowledge and belief,
original except as acknowledgement in the text. I hereby declare that I have not
submitted this material either in whole or in part of a degree at this University or any
other institution
Denpasar, April 29, 2015
I Gusti Ayu Oka Suryawardani

ii
ABSTRACT
TOURISM LEAKAGE OF ACCOMMODATION IN BALI
Tourism has become the leading economic sector in Bali Province of Indonesia. However, the economic impacts of tourism have not been convinced to be fully beneficial for Balinese community. One of the reasons is tourism leakage that occurs when the industry imports both products and services to support tourism industry in Bali. So far, the amount of tourism leakage in Bali has not been calculated yet. Therefore, there is a need to ascertain the current amount of leakage in Bali tourism.
The objectives of the study are: (i) to calculate the amount of tourism leakage from accommodation sector in Bali at micro (industrial) level; (ii) to calculate the amount of tourism leakage from accommodation sector in Bali at macro (regional) level; (iii) to evaluate the impacts of government subsidies and import reduction by accommodation sector on tourism leakage, job opportunity and income distribution; (iv) to evaluate the perception and preference of foreign tourists on imported and local products as well as the willingness of foreign tourists to spend their money to benefit of Balinese people; (v) to evaluate the points of view of hotel managers related to imported and local products as well as their willingness in reducing the use of imported product and (vi) to develop strategie in minimizing tourism leakage in accommodation in Bali.
Research was designed through quantitative and qualitative approaches. Data was collected by using survey method at four main tourist destinations in Bali, namely: Kuta, Nusa Dua, Sanur and Ubud. There were 79 hotels selected based upon probability proportional to size sampling method which consists of three clusters namely 1,2,3 Star-rated, 4&5 Star-rated either chain and non-chain and Non Star-rated hotels. The number of respondents was 600 foreign tourists were selected as respondents. Calculation of tourism leakage on micro analysis was undertaken by using a method developed by Unluonen, et. al. (2011), meanwhile, on macro analysis was carried out by using a method proposed by Thorbecke (1988) which was based on the Social Accounting Matrix (SAM) of Bali 2010. Perception and preference of foreign tourists on imported and local products were analyzed by using JMP program, meanwhile, Interpretative Structural Modelling (ISM) was undertaken to develope strategies.
The results show that based on the micro analysis, the highest tourism leakage of accommodation sector in Bali is at 4&5 Star-rated chain hotels (51.0 %), followed by 4&5 Star-rated non-chain hotels (22.7 %), 1,2&3 Star-rated hotels (12.0 %), Non-star rated hotels (8.8 %), and with the average leakage of 18.8 %. Based on macro analysis, tourism leakage of accommodation sector in Bali are as follow: (i) Leakage of Non Star-rated hotels is 2.0 %; (ii) Leakage of 1,2&3 Star-rated hotels is 15.7 %; (iii) Leakage of 4&5 Star-rated non-chain hotels is 7.1 %, (iv) Leakage of 4&5 Star-rated chain hotels is 55.3%; and (v) Average leakage of all types of accommodation is 19.5%. Foreign tourists significantly look for local products and are willing to spend their money for Balinese people. Hotel managers are willing to use local product as long as local products are available to substitute the imported products. Strategies for minimization tourism leakage are optimizing the potential of local products, develop agriculture and livestock; reduce the use of imported products for tourists, improve quality of local products and human resources, empower community, urge government to develop and implement supporting policies in minimizing tourism leakage, establish policy on restriction of foreign investment on accommodation in Bali, improve the role of Ministry of Foreign Affairs, Ministry of Industry, Ministry of Trade and Ministry of Tourism and Creative Economy. 7 Ps of marketing mix on service: product, price, place, promotion, people, process and physical evidence need to be implemented in order to support sustainable tourism in Bali
Key words: tourism income, tourism leakage, accommodation sector, Bali.
iii
SUMMARY
Tourism has been a driving force of economic development in Bali
Province and has become the leading economic sector in Bali’s economy.
However, the economic impact of tourism development has not been convinced to
be fully beneficial for Balinese community. There is a phenomenon that tourists’
expenditures have not been totally become tourism income of Bali’s economy due
to some incomes leak out the destination, called tourism leakage, in the form of
payment for imported products and services, payment of wages for foreign
employees, and profit transfer to foreign owners. Leakage could be defined as
losses from the national income flows which have been generated during the
transition from the local/national consumption income cycle to the spending chain
(Bull, 1991). So that, there is a need to ascertain the current amount of leakage on
accommodation occurred in Bali tourism.
The objectives of the study are: (i) to calculate the amount of tourism
leakage from accommodation sector in Bali at micro (industrial) level; (ii) to
calculate the amount of tourism leakage from accommodation sector in Bali at
macro (regional) level; (iii) to evaluate the impacts of government subsidies and
import reduction by accommodation sector on tourism leakage, job opportunity
and income distribution; (iv) to evaluate the perception and preference of foreign
tourists on imported and local products as well as the willingness of foreign
tourists to spend their money to benefit of Balinese people; (v) to evaluate the
points of view of hotel managers related to imported and local products as well as
their willingness in reducing the use of imported products and giving the priority
iv
on local products; and (vi) to develop a strategy in minimizing tourism leakage in
accommodation sector in Bali.
Research is designed through quantitative and qualitative approaches.
Quantitative analysis was undertaken in order: (i) to calculate tourism leakage by
using micro and macro analysis; (i) to calculate tourism leakage by using micro
and macro analysis (ii) to analyze perception and preference of foreign tourists on
imported and local products; and (iii) to assess the willingness of foreign tourists
to spend their money for the benefit of Balinese people. Calculation of tourism
leakage through micro analysis was undertaken at industrial level (hotels),
meanwhile macro analysis was undertaken to calculate tourism leakage at macro
(regional) level. Qualitative analysis was undertaken in order: (i) to evaluate hotel
managers’ points of view regarding the use of imported and local products, and
their willingness in reducing imported products; and (ii) to develop strategy in
minimizing tourism leakage based on Interpretative Structural Modeling (ISM).
Calculation of tourism leakage on micro analysis was undertaken by using
a method that was developed by Unluonen et. al. (2011). Data were collected by
a survey at four main tourist destinations in Bali, namely: Kuta, Nusa Dua, Sanur
and Ubud. There were 79 hotels selected as sampling hotels. Sampling was
undertaken based upon a probability proportional to size sampling method. Three
clusters of accommodation were chosen, namely: (i) 1,2&3 Star-rated hotels; (ii)
4&5 Star-rated chain hotels, and 4&5 Star-rated non-chain hotels; and (iii) Non-
star rated hotels. Meanwhile, calculation of tourism leakage on macro analysis
was undertaken by using a method proposed by Thorbecke (1988). Calculation
v
was based on the Social Accounting Matrix (SAM) Bali 2010 and other related
data.
Perception and preference of foreign tourists on imported and local
products as well as assessment of the willingness of foreign tourists to spend their
money for the benefit of Balinese people were analyzed by using JMP (John’s
Macintosh Project), a software program from SAS Company. Moreover, analysis
of significance of variables is supported by Likert scale on seven scale categories.
The results show that:
1) Based on the micro analysis, tourism leakage of accommodation sector in Bali
are as follow: (i) Leakage of Non-star rated hotels is 8.8 %; (ii) Leakage of
1,2&3 Star-rated hotels is 12.0 %; (iii) Leakage of 4&5 Star-rated non-chain
hotels is 22.7 %; (iv) Leakage of 4&5 Star-rated chain hotels is 51.0 %; and
(v) Average leakage of all types of accommodation is 18.8 %.
2) Based on macro analysis, tourism leakage of accommodation sector in Bali
are as follow: (i) Leakage of Non-star-rated hotels is 2.0 %; (ii) Leakage of
1,2&3 Star-rated hotels is 15.7 %; (iii) Leakage of 4&5 Star-rated non-chain
hotels is 7.1 %; (iv) Leakage of 4&5 Star-rated chain hotels is 55.3%; and
(v) Average leakage of all types of accommodation is 19.5%.
Central, provincial and local government play an important role in
minimizing tourism leakage, increasing job opportunity and increasing income
distribution through policies on giving subsidies. Involvement of accommodation
sector was also crucial through minimizing the use of imported products and
services, and the utilization of foreign employees. The optimum result was found
vi
through a simulation by using a scenario (simulation-5), in which the government
gave subsidies about 40% to Non Star-rated hotel and about 18.5% to 1,2&3 Star-
rated hotels. At the same time, accommodation sector also reduced import about
25% on 1,2&3 Star-rated hotels and about 30% on 4&5 Star-rated chain hotels.
This simulation-5 resulted in: (i) Decreasing the average leakage by 12.0 % (from
19.5 % to 7.5 %), (ii) Increasing job opportunity by14.8%, and (iii) Increasing
income of low class of people in urban area by 0.26%.
The results show that the average score of perception of foreign tourists on
perceived quality of local products was higher than imported products, in which
the average score of local products is 5.59 out of 7 scale (categorized well) while
imported products is 5.24 (categorized good). Most of foreign tourists (76.8%)
preferred local products. Regarding relationship between preference of foreign
tourists and their perception on the quality of local products, the statistical results
show that there are perfect positive relationships between tourists’ preference and
their perceived quality of local products. These findings demonstrate that foreign
tourists significantly look for local products that are available in Bali.
Different points of view are found between foreign tourists and hotel
managers regarding local products. Hotel managers thought that foreign tourists
preferred imported products. The reason of hotel managers in choosing imported
products is that the quality of imported products is better than local products.
Meanwhile statistical results indicate that foreign tourists significantly look for
local products. There is a need to encourage hotel managers to change their
perception and attitude about local and imported products. The results of this
vii
study support the above idea, in which most of hotel managers are willing to
reduce the use of imported products and giving the priority to local products as
long as quality and continuity of local products are available in order to substitute
the imported products. The less imported products consumed by foreign tourists,
therefore tourism leakage will also decrease.
Strategy of minimization of tourism leakage in accommodation sector in
Bali is developed based upon the results of Interpretative Structural Modeling
(ISM). There are six groups of strategy proposed according to six elements of
minimization program for tourism leakage in accommodation sector. Each
strategy is composed based on the key elements resulted from ISM. Some of
important strategies are: (i) to optimize the potential of local products; (ii) to
develop agriculture, livestock, fisheries and handicraft industry; (iii) to empower
community; (iv) to reduce the use of imported products for tourists; (v) to urge
government to develop and implement supporting policies in order to minimize
leakage; (vi) to establish International Trade Policy that reduces import and
increases export of local products; (vii) to facilitate public-private partnership on
investment in tourism; and (viii) to improve the role of Ministry of Foreign
Affairs in promoting Bali tourism worldwide and to encourage tourists to
consume local products.
Marketing strategy to minimize tourism leakage in Bali can be undertaken
based on the 7 Ps of marketing mix on service and hospitality approach namely
product, price, place, promotion, people, process and physical evidence in order to
support sustainable tourism in Bali. Process of delivering products and services to
viii
the consumers and participation of people/participants are really important in
order to minimize tourism leakage of Bali tourism, including participation of
people in developing tourism products, supported by reasonable price, appropriate
promotion tools, availability of local transportations in the spots destination which
have lower impact on the environment and physical evidence of the products and
service offered to the appropriate target market. The final purpose is to achieve
sustainable tourism through ensure the quality, continuity and balance between
the needs of tourism, protection of the environment and prosperity for the local
community, which means that the economic benefit of tourism should not only for
the companies concerned but also for the local communities as the host.
It is concluded that tourism leakage needs to be minimized. Quality of
products and human resources are crucial to be addressed in order to minimize
tourism leakage. By giving more benefits from tourism to the community, it
means that quality of life of community will improve, quality of environment will
be maintained and improved, and therefore better quality experiences for tourists
will be.

ix
TABLE OF CONTENTS Page DECLARATION OF ORIGINALITY ...................................................... i ABSTRACT ............................................................................................... ii SUMMARY ............................................................................................... iii TABLE OF CONTENTS ........................................................................... ix LIST OF TABLES ..................................................................................... xv LIST OF FIGURES ................................................................................... xviii LIST OF SYMBOLS ................................................................................. xx LIST OF APPENDICES ............................................................................ xxi
PART I INTRODUCTION, LITERATURE REVIEW, AND RESEARCH FRAMEWORK AND CONCEPT 1
CHAPTER I INTRODUCTION ..................................................................................... 2 1.1 Background ....................................................................................... 2 1.2 Problem Formulation ........................................................................ 15 1.3 Research Objectives .......................................................................... 16 1.4 Research Benefits ............................................................................. 17
CHAPTER II LITERATURE REVIEW ........................................................................ 18 2.1 Introduction ....................................................................................... 18 2.2 National Income in Open Economy ................................................. 19 2.3 The SAM as an Accounting System and Conceptual Framework .... 22 2.4 Systems Thinking ............................................................................. 27 2.5 The Importance of Tourism Multiplier Effects in Increasing Income and Job Opportunity ............................................................ 30 2.6 Previous Studies Related to Leakage in Tourism ............................. 37 2.7 Minimizing Leakages for Optimizing Tourism Benefits................... 45 2.8 Previous Studies Related to Perception and Preference ................... 48 2.9 The Role of Marketing in Sustainable Tourism Development ........ 50 2.10 Conclusion ....................................................................................... 63
CHAPTER III RESEARCH FRAMEWORK AND CONCEPT .................................. 64 3.1 Introduction ....................................................................................... 64 3.2 Framework of the Study ................................................................... 64 3.3 Concepts ........................................................................................... 66 3.3.1 Sustainable Tourism ............................................................. 66 3.3.2 Tourism Leakages . ................................................................ 68 3.3.3 Structure of Social Accounting Matrix (SAM) of Bali 2010 . 70
x
3.3.4 Accommodation in Tourism ................................................. 71 3.3.5 Stakeholders in Tourism ....................................................... 75 3.3.6 The Complexity of Consumer Behaviour in Travelling ....... 76 3.3.7 Determinants of Tourist Satisfaction on Destination ............ 79 3.3.7.1 Perception and Preference ............................................. 79 3.3.7.2 Motivation ...................................................................... 82 3.3.7.3 Familiarity ...................................................................... 84 3.3.7.4 Expectation .................................................................... 85 3.3.8 Interpretative Structural Modeling (ISM) ............................. 86 3.4 Hypotheses ........................................................................................ 88 3.5 Conclusion ........................................................................................ 89
PART II RESEARCH METHODS, RESULTS AND DISCUSSION 90 CHAPTER IV RESEARCH METHODS ........................................................................ 91 4.1 Introduction ....................................................................................... 91 4.2 Micro Analysis in Calculating Tourism Leakage in Accommodation Sector ................................................................................................ 93 4.2.1 Research Location and Period Time of Research ................. 93 4.2.2 Sample Design ...................................................................... 93 4.2.3 Scope of the Study ................................................................ 94 4.2.4 Method of Data Analysis ...................................................... 95 4.2.5 Variables of Micro Analysis ................................................. 97 4.2.6 Research Instruments ............................................................ 100 4.2.7 Limitation of the Micro Analysis Model .............................. 100 4.3 Macro Analysis in Calculating Tourism Leakage in Accommodation Sectors ............................................................................................... 101 4.3.1 Research Location and Time Period of Research ................. 101 4.3.2 Data and Source of Data ....................................................... 101 4.3.2.1 Data ................................................................................ 101 4.3.2.2 Sources of Data .............................................................. 103 4.3.3 Identification of Variables ..................................................... 103 4.3.4 Method of Data Analysis ...................................................... 109 4.3.5 Limitation of Social Accounting Matrix ............................... 112 4.3.6 Social Accounting Matrix Hotel in Bali .............................. 112 4.3.7 Tourism Leakage Calculation Based on Macro Analysis ..... 113 4.3.7.1 Account of Receipt and Expenditure of Hotels in Bali . 113 4.3.7.2 Account of Productions of Hotel in Bali ....................... 114 4.4 Impact of Government Subsidies and Import Reduction by Tourism Industry on Tourism Leakage, Job Opportunity Distribution and Income Distribution ................................................ 115 4.4.1 Multiplier Analysis of Social Accounting Matrix ................ 115 4.4.2 Analysis of Policy Scenarios ................................................ 117
xi
4.5 Perception and Preference of Foreign Tourists Regarding Imported and Local Products and Willingness to Spend Money for Balinese People ............................................................................................... 118 4.5.1 Research Location and Research Period ............................... 118 4.5.2 Sample Design of Foreign Visitors ....................................... 118 4.5.3 Scope of the Study ................................................................ 118 4.5.4 Identification of Variables .................................................... 119 4.5.5 Method of Data Analysis ...................................................... 121 4.5.5.1 Analysing of Perception ................................................ 121 4.5.5.2 Reasons for Using Seven Point Scale ............................ 123 4.5.5.3 Preference ...................................................................... 124 4.5.5.4 Data Analysis ................................................................. 124 4.5.6 Validity and Reliability ......................................................... 125 4.5.7 Research Instruments ............................................................ 126 4.6 Point of View of Hotel Managers ................................................... 127 4.6.1 Research Location and Period of Research .......................... 127 4.6.2 Sample Design ...................................................................... 127 4.6.3 Identification of Variables .................................................... 128 4.6.4 Method of Data Analysis ...................................................... 128 4.7 Interpretative Structural Modeling (ISM) ......................................... 129 4.7.1 Determining Experts ............................................................. 129 4.7.2 Constructing Elements .......................................................... 130 4.7.3 Limitations of Interpretative Structural Modeling ................ 133 4.7.4 Conclusion ............................................................................ 133
CHAPTER V RESULTS .................................................................................................. 134 5.1 Results of Micro Analysis of Tourism Leakage on Accommodation Sector ................................................................................................ 134 5.1.1 Introduction ........................................................................... 134 5.1.2 Characteristics of the Sampling Hotels ................................. 134 5.1.3 Description of Imported Products Used by Hotels ............... 138 5.1.4 Annual Revenue of the Sampling Hotels ............................. 141 5.1.5 Tourism Leakage of the Sampling Hotels ............................ 143 5.1.5.1 Sources of Tourism Leakage ......................................... 143 5.1.5.2 Calculation of Revenue and Leakage of the Sampling Hotels ............................................................................. 144 5.1.5.3 Average Tourism Leakage of the Sampling Hotels ....... 146 5.1.5.4 The Sequence of the Sources of Tourism Leakage ....... 148 5.1.6 Conclusion ............................................................................ 151 5.2 Result of Macro Analysis of Tourism Leakage on Accommodation Sector ................................................................................................ 152 5.2.1 Introduction ........................................................................... 152 5.2.2 Description of Account for Each Type of Hotel ................... 152 5.2.2.1 Receipt-Expenditure Account and Production Account of Non-star Rated Hotels ............................................... 152

xii
a. Receipt-Expenditure Account of Non-star Rated Hotels ... 152 b. Production Account of Non-star Rated Hotels ................... 154 5.2.2.2 Receipt-Expenditure Account and Production Account of 1,2&3 Star-rated Hotels ............................................. 156 a. Receipt-Expenditure Account of 1,2&3 Star-rated Hotels . 156 b. Production Account of 1,2&3 Star-rated Hotels ................. 157 5.2.2.3 Receipt-Expenditure Account and Production Account of 4&5 Star-rated Non-Chain Hotels ............................. 158 a. Receipt-Expenditure Account of 4&5 Star-rated Non-Chain Hotels .................................................................................. 158 b. Production Account of 4&5 Star-rated Non-Chain Hotels .. 160 5.2.2.4 Receipt-Expenditure Account and Production Account of 4&5 Star-rated Chain Hotels ..................................... 161 a. Receipt-Expenditure Account of 4&5 Star-rated Chain Hotels ................................................................................. 161 b. Production Account of 4&5 Star-rated Chain Hotels ......... 163 5.2.3 Calculation of Tourism Leakage from Accommodation Sector in Bali Based on Macro Analysis .............................. 164 5.2.4 Conclusion ............................................................................ 168 5.3 Impact of Government Subsidies and Import Reduction by Accommodation Sector on Tourism Leakage, Job Opportunity and Income Distribution .......................................................................... 170 5.3.1 Introduction ........................................................................... 170 5.3.2 Simulations ........................................................................... 171 a. Impacts on Tourism Leakage .................................................. 173 b. Impact on Job Opportunity ...................................................... 173 c. Impact on Income Distribution ............................................... 175 5.3.3 The Simulation Results with the Optimum and the Worst Impacts ................................................................................. 178 a. Simulation with Optimum Impact ........................................... 178 b. Simulation with the Worst Impact .......................................... 179 5.3.4 Conclusion ............................................................................ 181 5.4 Perception and Preference of Foreign Tourists regarding Imported and Local Products ........................................................................... 182 5.4.1 Introduction ........................................................................... 182 5.4.2 Characteristics of Foreign Tourists who Visited Bali ........... 182 5.4.2.1 Country of Origin ........................................................... 182 5.4.2.2 Code of Citizenship ........................................................ 183 5.4.2.3 Sex ................................................................................. 184 5.4.2.4 Age ................................................................................. 185 5.4.2.5 Occupation ..................................................................... 185 5.4.2.6 Place of Stay .................................................................. 186 5.4.2.7 Type of Accommodation ............................................... 187 5.4.2.8 Length of Stay ................................................................ 188 5.4.3 Opinion, Expectation and Satisfaction of Respondents ........ 189 5.4.3.1 Opinion of Accommodation Services ............................ 189
xiii
5.4.3.2 Opinion of Restaurants Services .................................... 190 5.4.3.3 Expectation Level regarding the Whole Trip in Bali ..... 191 5.4.3.4 Emotional Experience .................................................... 192 5.4.3.5 Level of Satisfaction with the Whole Trip in Bali ......... 193 5.4.3.6 Level of Agreement on Spending Money to Benefit Balinese People .............................................................. 195 5.4.4 Perception of Foreign Tourists regarding Imported and Local Products ...................................................................... 196 5.4.5 Preference of Foreign Tourists and Evaluation of Local Products ................................................................................ 199 5.4.5.1 Preference of Foreign Tourists for Local Products ........ 199 5.4.5.2 Evaluation of Perceived Quality of Local Products and Preference by Foreign Tourists ....................................... 200 5.4.6 Analysis of Relationships between Variables ........................ 201 5.4.6.1 Relationship between Familiarity and Satisfaction ....... 201 5.4.6.2 Relationship between Familiarity and Benefit for Balinese .......................................................................... 203 5.4.6.3 Relationship between Familiarity and Perception of Quality ........................................................................... 204 5.4.6.3.1 Relationship between Familiarity and Perceptions on Quality of Services ............................................ 204 5.4.6.3.2 Relationship between Familiarity and Perceptions on Quality of Products ............................................. 205 5.4.6.4 Relationship between Familiarity and Motivation ........ 206 5.4.6.5 Relationships between Motivation, Satisfaction, Perception of Quality of Services and Benefit for Balinese .......................................................................... 207 5.4.6.6 Relationship between Perception of Quality of Products and Benefit for Balinese ................................................. 208 5.5 Point of View of Hotel Managers ................................................... 210 5.5.1 Introduction ........................................................................... 210 5.5.2 Reasons in Choosing Imported Products .............................. 210 5.5.3 Point of View of Hotel Managers on Local Products ........... 212 5.5.4 Point of View of Hotel Managers on Cause and Impact of Leakage in Tourism Industry ................................................. 214 5.5.5 Willingness in Reducing Imported Products and Giving the Priority on Local Products .................................................... 214 5.5.6 Conclusion ............................................................................ 215 5.6 Minimization of Tourism Leakage in Accommodation Sector in Bali ............................................................................................... 217 5.6.1 Program Goals for Minimization of Tourism Leakage ........ 217 5.6.2 Program Needs for Minimization of Tourism Leakage ........ 220 5.6.3 Affected sectors for Minimization of Tourism Leakage ...... 224 5.6.4 Program Constraints for Minimization of Tourism Leakage 227

xiv
5.6.5 Possible Changes in the Program for Minimization of Tourism Leakage .................................................................. 230 5.6.6 Involvement of Agencies in the Program for Minimization of Tourism Leakage .............................................................. 233
CHAPTER VI DISCUSSION ........................................................................................... 237 6.1 Introduction ....................................................................................... 237 6.2 Micro and Macro Analysis of Tourism Leakage in Accommodation Sector ................................................................................................ 238 6.3 Impact of Government Subsidies and Import Reduction by Accommodation Sector on Tourism Leakage, Job Opportunity and Income Distribution ................................................................... 243 6.4 Perception and Preference of Foreign Tourists on Imported and Local Products ........................................................................... 246 6.5 Relationships Between Variables ..................................................... 248 6.5.1 Relationships between Variables of Familiarity and Variables of Satisfaction ....................................................... 248 6.5.2 Relationships of Some Variables with Variable Benefit for Balinese People ..................................................................... 250 6.6 Points of View of Hotel Managers and Willingness in Reducing Tourism Leakage .............................................................................. 253 6.7 Strategy of Minimization of Tourism Leakage at Accommodation Sector ................................................................................................ 259 6.8 Marketing Strategy to Minimize Tourism Leakage in Bali .............. 266 6.9 Novelty .............................................................................................. 290 6.10 Conclusion ........................................................................................ 290
PART III CONCLUSION AND SUGGESTION 292 CHAPTER VII CONCLUSION AND SUGGESTION ................................................... 293 7.1 Conclusion ........................................................................................ 293 7.2 Suggestion for Future Research ......................................................... 298 REFERENCES ........................................................................................ 300 APPENDICES .......................................................................................... 318
xv
LIST OF TABLES
Page
4.1 Determination of Sample Size ..................................................... 94
4.2 Summary of Indicators and Variables Related to Cause of Leakages ...................................................................................... 98
4.3 Scheme of Social Accounting Matrix (SAM) .............................. 110
4.4 Receipt-Expenditure Account of Hotel in Bali ............................ 114
4.5 Productions Account for Hotels in Bali ....................................... 115
4.6 Variables of Familiarity, Satisfaction, Motivation and Perception, and Benefits for Balinese .......................................... 121
4.7 Scale, Interval and Level of Interpretation .................................. 122
4.8 Elements and Contextual Relationship between Elements in Minimizing Tourism Leakage in Accommodation Sector in Bali 131
5.1.1 Number of Hotels Selected as Sample ......................................... 135
5.1.2 The Average Number of Rooms, Room Occupancies, Length of Stay and Room Rates in Year 2012 ............................................. 137
5.1.3 Ownership and Management System of the Sampling Hotels ..... 137
5.1.4 The Average of Indonesian and Foreign Employees of the Sampling Hotels ........................................................................... 138
5.1.5 Imported Products in the Sampling Hotels .................................. 140
5.1.6 Average of Annual Expenditure per Hotel for Imported Products by the Sampling Hotels ................................................. 141
5.1.7 Annual Revenue of the Sampling Hotels in Year 2012 ............... 142
5.1.8 Average Tourism Leakage of the Sampling Hotels ..................... 147
5.1.9 The Sequence of the Sources of Tourism Leakage in the Sampling Hotels ........................................................................... 149
5.1.10 The Amount of Leakage from Each Source for Each Type of Accommodation In Bali ........................................................... 150
5.2.1 Receipt-Expenditure Account of Non-star rated Hotels in 2012 . 153
5.2.2 Production Account of Non-star rated Hotels in 2012 ................. 155
5.2.3 Receipt-Expenditure Account of 1,2&3 Star-rated Hotels in 2012 .......................................................................................... 157
5.2.4 Production Account of 1,2&3 Star-rated Hotels in 2012 ............. 158
xvi
5.2.5 Receipt-Expenditure Account of 4&5 Star-rated Non-Chain Hotels in 2012 .............................................................................. 160
5.2.6 Production Account of 4&5 Star-rated Non-Chain Hotels in 2012 .......................................................................................... 161
5.2.7 Receipt-Expenditure Account of 4&5 Star-rated Chain Hotels in 2012 ......................................................................................... 163
5.2.8 Production Account of 4&5 Star-rated Chain Hotels in 2012 ...... 164
5.2.9 Percentage of Tourism Leakage of Bali Tourism on Accommodations Sector in 2012 ................................................. 167
5.3.1 Scenario of Government Subsidies and Import Reduction by Accommodation Sector of Bali for the First Simulation ............. 172
5.3.2 Impact of Simulation-1 on Production Activities and Leakage in Accommodation Sector of Bali Tourism ..................................... 172
5.3.3 Comparison of Tourism Leakage in Accommodation Sector of Bali Tourism between Before and After the First Simulation . 173
5.3.4 Impact of First Simulation on Job Opportunity in Accommodation Sector of Bali Tourism ..................................... 174
5.3.5 Impact of First Simulation in Increasing Job Opportunity in Accommodation Sector of Bali Tourism ..................................... 174
5.3.6 Impact of First Simulation on Income Distribution of Household in Bali ........................................................................ 175
5.3.7 Impact of Simulation-1 on Wages/Salaries of Labour on Accommodation Sector of Bali Tourism ..................................... 176
5.3.8 Recapitulation of Results of Simulations using Scenarios of Government Subsidies and Import Reduction of Bali Tourism . 177
5.3.9 Scenario of Government Subsidies and Import Reduction by Accommodation Sector of Bali Tourism for the Fifth Simulation 178
5.3.10 Comparison of Tourism Leakage in Accommodation Sector of Bali Tourism between Before and After the Fifth Simulation 178
5.3.11 Impact of Fifth Simulation on Job Opportunity in Accommodation Sector of Bali Tourism ..................................... 179
5.3.12 Scenario of Government Subsidies and Import Reduction by Accommodation Sector of Bali Tourism for the Sixth Simulation 180
5.3.13 Comparison of Tourism Leakage in Accommodation Sector of Bali Tourism between Before and After the Sixth Simulation 180
5.3.14 Impact of Sixth Simulation on Job Opportunity in Accommodation Sector of Bali Tourism ..................................... 180
xvii
5.4.1 Average Length of Stay ............................................................... 188
5.4.2 Opinion of Accommodation Services .......................................... 190
5.4.3 Opinion of Restaurants Services .................................................. 191
5.4.4 Expectation Level on the Whole Trip in Bali .............................. 192
5.4.5 Emotional Level ........................................................................... 193
5.4.6 Foreign Tourists’ Level of Satisfaction with the Whole Trip in
Bali ............................................................................................... 194
5.4.7 Agreement on Spending Money of Foreign Tourists for Balinese People in Priority ......................................................................... 195
5.4.8 Average Scores for Perceptions on Imported and Local Products 197
5.4.9 Statistical Results of Foreign Tourists’ Preference for Local Products ........................................................................................ 201
5.4.10 Relationship between Familiarity and Benefit for Balinese ........ 203
5.4.11 Relationship between Familiarity and Perception of Quality of Products ........................................................................................ 206
5.4.12 Relationship between Familiarity and Motivation ....................... 207
5.4.13 Relationship between Perceptions on Quality of Products and Benefit for Balinese ..................................................................... 209
5.6.1 Contextual Relationship of Each Sub-element within the Element ........................................................................................ 217
5.6.2 Reachability Matrix of Program Goals for Minimization of Tourism Leakage ......................................................................... 219
5.6.3 Reachability Matrix of Program Needs for Minimization of Tourism Leakage ......................................................................... 222
5.6.4 Reachability Matrix of Affected sectors for Minimization of Tourism Leakage ......................................................................... 225
5.6.5 Reachability Matrix of Program Constraints for Minimization of Tourism Leakage ..................................................................... 228
5.6.6 Reachability Matrix of Possible Changes for Minimization of Tourism Leakage ......................................................................... 231
5.6.7 Reachability Matrix of Involvement of Agencies in the Minimization Strategy of Tourism Leakage ................................ 235
6.1 Tourism Leakage in Accommodation Sector in Bali ................... 238
xviii
LIST OF FIGURES
Page
1.1. Contribution of Agriculture and Trade, Hotel & Restaurant on GDP of Bali Province 1969-2012 ................................................. 3
1.2. Numbers of Foreign Tourist Direct Arrivals in Bali 1970-2012 . 5
1.3. Number of Rooms Available in Bali in 2002-2012 ..................... 7
1.4. Three Coins of Triple Bottom Line by Elkington (1997:89) ....... 10
1.5. Gini Ratio of Bali 1997-2012 ...................................................... 13
2.1. Flow Diagram of Social Accounting Matrix Transactions .......... 24
2.2. Diagram of Direct Effects, Indirect Effects, Induced Effects and Job Opportunity in Tourism Sector .............................................. 31
3.1. Framework of Study .................................................................... 65
3.2. Effect of Tourism: Direct, Indirect and Induced Effects ............. 70
5.1. Average Tourism Leakage of the Sampling Hotels ..................... 147
5.4.1. Percentage of Respondent based on Country of Origin ............... 183
5.4.2. Percentage of Respondent based on Citizenship ......................... 184
5.4.3. Percentage of Respondents based on Sex .................................... 184
5.4.4. Percentage of Respondents based on Age Group ........................ 185
5.4.5. Percentage of Respondents based on Occupation ........................ 186
5.4.6. Percentage of Respondents based on Place of Stay ..................... 186
5.4.7. Percentage of Respondents based on Type of Accommodation .. 188
5.4.8. Opinions, Expectations and Satisfaction of Foreign Tourists ...... 196
5.4.9. Average Score for Perceptions on Imported Products ................. 198
5.4.10. Average Score for Perceptions on Local Products ...................... 199
5.4.11. Percentage of Respondents who Preferred Local Products ......... 200
5.4.12. Relationships between Familiarity and Satisfaction .................... 202
5.4.13. Relationships between Familiarity and Perceptions on Quality, and Motivation .............................................................................. 204
5.4.14. Relationship between Satisfaction, Perception of Quality of Services and Benefit for Balinese ................................................ 208
5.6.1. Relationships between Driver Power and Dependence of Sub-elements of Program Goals for Minimization of Tourism Leakage ........................................................................................ 220
xix
5.6.2. Structural Hierarchy of Sub-elements of Program Goals for Minimization of Tourism Leakage .............................................. 220
5.6.3. Relationships between Driver Power and Dependence of Sub-elements of Program Needs for Minimization of Tourism Leakage ........................................................................................ 223
5.6.4. Structural Hierarchy of Sub-elements of Program Needs for Minimization of Tourism Leakage .............................................. 223
5.6.5. Relationships between Driver Power and Dependence of Sub-elements of Affected Sectors for Minimization of Tourism Leakage ........................................................................................ 226
5.6.6. Structural Hierarchy of Sub-elements of Affected Sectors for Minimization of Tourism Leakage .............................................. 226
5.6.7. Relationships between Driver Power and Dependence of Sub-elements of Program Constraints for Minimization of Tourism Leakage ......................................................................... 229
5.6.8. Structural Hierarchy of Sub-elements of Program Constraints For Minimization of Tourism Leakage ........................................ 230
5.6.9. Relationships between Driver Power and Dependence of Sub- elements of Possible Changes for Minimization of Tourism Leakage ........................................................................................ 232
5.6.10. Structural Hierarchy of Sub-elements of Possible Changes for Minimization of Tourism Leakage .............................................. 233
5.6.11. Relationship between Driver Power and Dependence of Sub- elements of Involvement of Agencies in the Minimization Strategy of Tourism Leakage ....................................................... 236
5.6.12. Structural Hierarchy of Sub-elements of Involvement of Agencies in the Minimization Strategy of Tourism Leakage ...... 236
6.1. Relationships between Variables ................................................. 250
6.2. Model for Minimization of Tourism Leakage on Accommodation Sector ................................................................ 262
6.3. Seven Ps of Marketing Mix in Services and Hospitality ............. 267
xx
LIST OF SYMBOLS ∑ means sum of ( ) means in bracket ≤ means less than ≥ means more than = means equal to ≠ means not equal to + means plus
- means minus × means multiply : means devided by % means percentage F1 means Country of residence F2 means Large code of residence F3 means Periodicity viciting Bali F4 means Visit more than 5 times
S1 means Satisfaction of accommodation and restaurants’ services in Bali S2 means Satisfaction of the whole trips S3 means Satisfaction on the level of emotion during visiting Bali S4 means Satisfaction on the level of expectation M1 means Reason for coming (Visit Friend and Relatives/VFR) M2 means Main Purpose M3 means Activities P1 means accommodation P2 means restaurant P3 means imported meat P4 means local meat P5 means imported fisheries P6 means local fisheries P7 means imported dairy products P8 means local dairy products P9 means imported fruits P10 means local fruits P11 means imported vegetables P12 means local vegetables P13 means imported beverages P14 means local beverages P15 means building style P16 means furniture P17 means room decoration P18 means architecture B means Benefit for Balinese

xxi
LIST OF APPENDICES
Page
2.1. The Basic Social Accounting Matrix ........................................... 318
2.2. Social Accounting Matrix (Matrix_11x11) of Bali 2010 ............ 319
3.1. Research Locations ...................................................................... 322
4.1. Questionnaire Related to Imported Products used in the Hotels and Point of Views of Hotel Managers ........................................ 323
4.2. Questionnaire for Foreign Tourists .............................................. 329
4.3. Social Accounting Matrix of Hotel of Bali 2010 (Matrix_31x31) (Million Rph) ...................................................... 334
4.4. ISM Questionnaire ....................................................................... 335
4.5. List of Respondents for Interpretative Structural Modeling (ISM) 351
4.6. Flow Diagram for Preparing ISM Model ..................................... 352
5.1. Recapitulation of Calculation of Leakage of Non Star-rated Hotels ........................................................................................... 353
5.2. Recapitulation of Calculation of Leakage of 1,2,3 Star-rated Hotels ........................................................................................... 354
5.3. Recapitulation of Calculation of Leakage of 4,5 Star-rated Non-chain Hotels ......................................................................... 355
5.4. Recapitulation of Calculation of Leakage of 4,5 Star-rated Chain Hotels ................................................................................. 356
5.5. Social Accounting Matrix of Hotel of Bali 2010 (Matrix_108x108) ........................................................................ 357
5.6. Result of Validity Test of 600 Foreign Tourists .......................... 384
6. Coaching for Fieldworkers .......................................................... 385
7. Interview with Head of Bali Government Tourism Office (Ida Bagus Kade Subhiksu) ......................................................... 386
8. Survey for Foreign Tourists at Four Main Destinations Area in Bali Sanur, Kuta, Nusa Dua, Ubud ........................................... 387

1
PART I
INTRODUCTION LITERATURE REVIEW
RESEARCH FRAMEWORK AND CONCEPT
2
CHAPTER I INTRODUCTION
1.1 Background
Bali has been known as one of the most popular tourist destinations in
the world due to its cultural activities and natural scenery. Tourism has now
become a driving force in the economic development of Bali Province and has
become the leading economic sector in Bali‟s economy. As Bali‟s economy has
been developed mostly through tourism, the development of the tourism sector
in Bali has resulted in an economic shift away from the agricultural sector to the
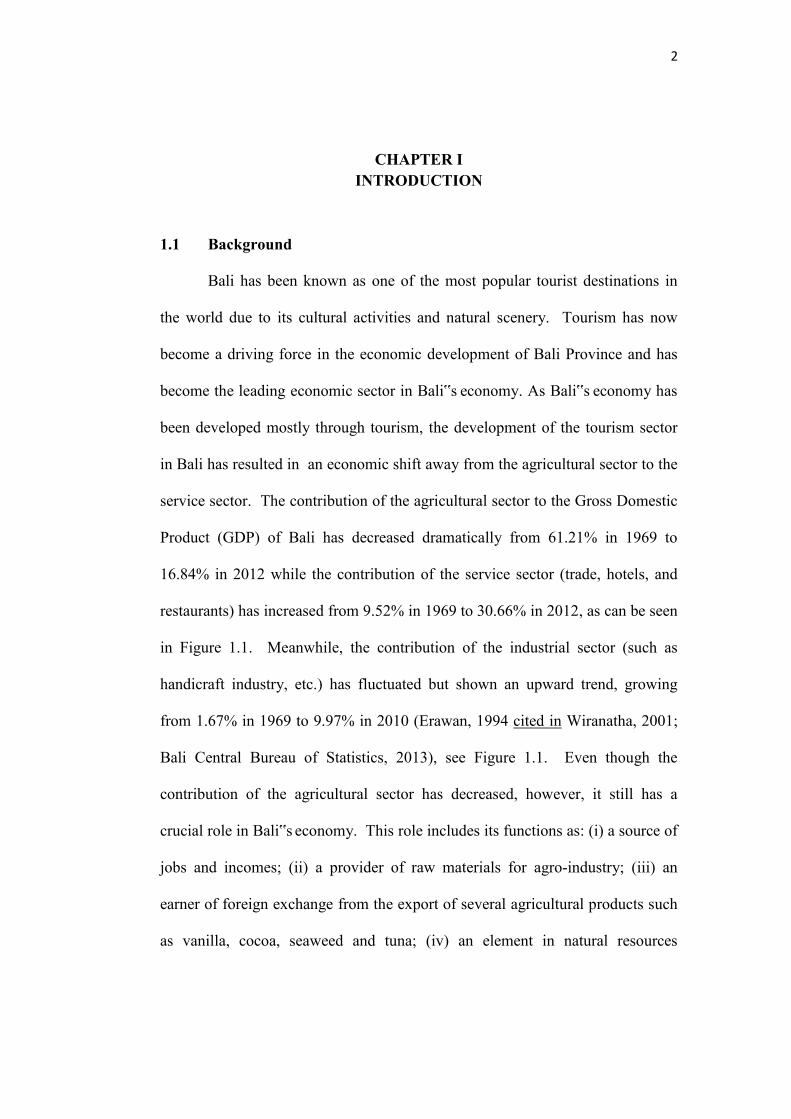
service sector. The contribution of the agricultural sector to the Gross Domestic
Product (GDP) of Bali has decreased dramatically from 61.21% in 1969 to
16.84% in 2012 while the contribution of the service sector (trade, hotels, and
restaurants) has increased from 9.52% in 1969 to 30.66% in 2012, as can be seen
in Figure 1.1. Meanwhile, the contribution of the industrial sector (such as
handicraft industry, etc.) has fluctuated but shown an upward trend, growing
from 1.67% in 1969 to 9.97% in 2010 (Erawan, 1994 cited in Wiranatha, 2001;
Bali Central Bureau of Statistics, 2013), see Figure 1.1. Even though the
contribution of the agricultural sector has decreased, however, it still has a
crucial role in Bali‟s economy. This role includes its functions as: (i) a source of
jobs and incomes; (ii) a provider of raw materials for agro-industry; (iii) an
earner of foreign exchange from the export of several agricultural products such
as vanilla, cocoa, seaweed and tuna; (iv) an element in natural resources
4
tourist direct arrivals increased slightly after the tragedy, i.e. to 1,458,309
tourists in 2004. However, the second Bali bombing in 2005 also led to a drop
in the number of foreign tourist direct arrivals, which fell to 1,260,317 in 2006.
The Bali bombs had the greatest impact on international tourists visiting Bali if
compared to other crises in the history of tourism in Bali (Putra and Hitchcock,
2006). Efforts were undertaken by the government to persuade foreign tourists
to visit Bali after the second Bali bombing tragedy. This program, called the
“Bali Recovery Program”, was undertaken in 2006 through collaboration
between the Ministry of Culture and Tourism and the Bali Tourism Board.
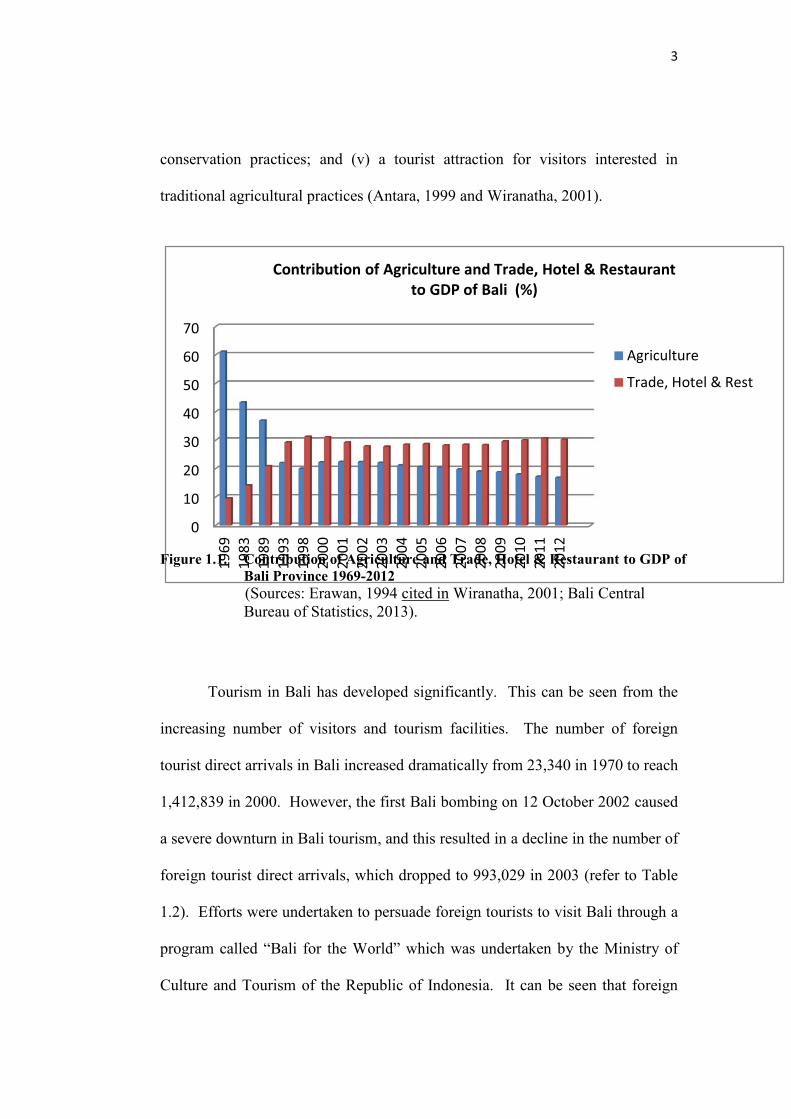
Gradual increases in foreign tourist direct arrivals were reported in the following
years and by 2012 the number had reached about 2,892,019. During the period
from 2007 up to 2012, the average growth rate in foreign tourist direct arrivals to
Bali was 14.7 % per year (Bali Government Tourism Office, 2011). The
development of foreign tourist direct arrivals in Bali between 1970-2012 is
presented in Figure 1.2.
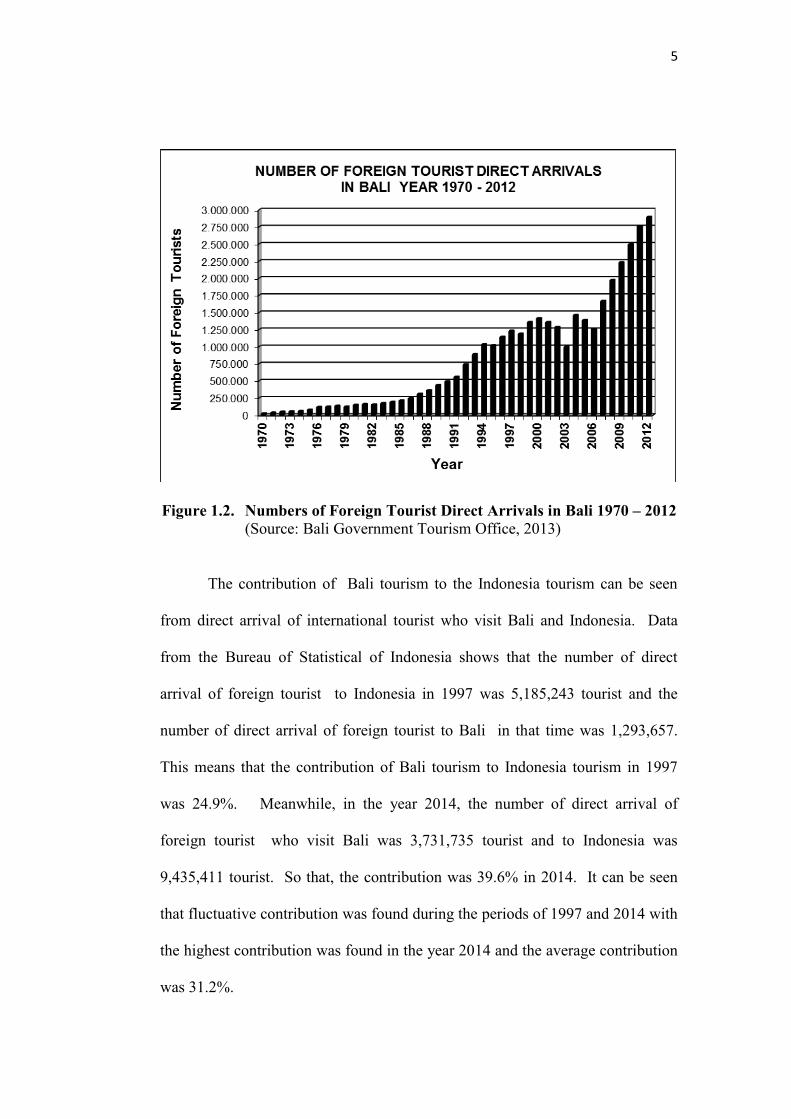

6
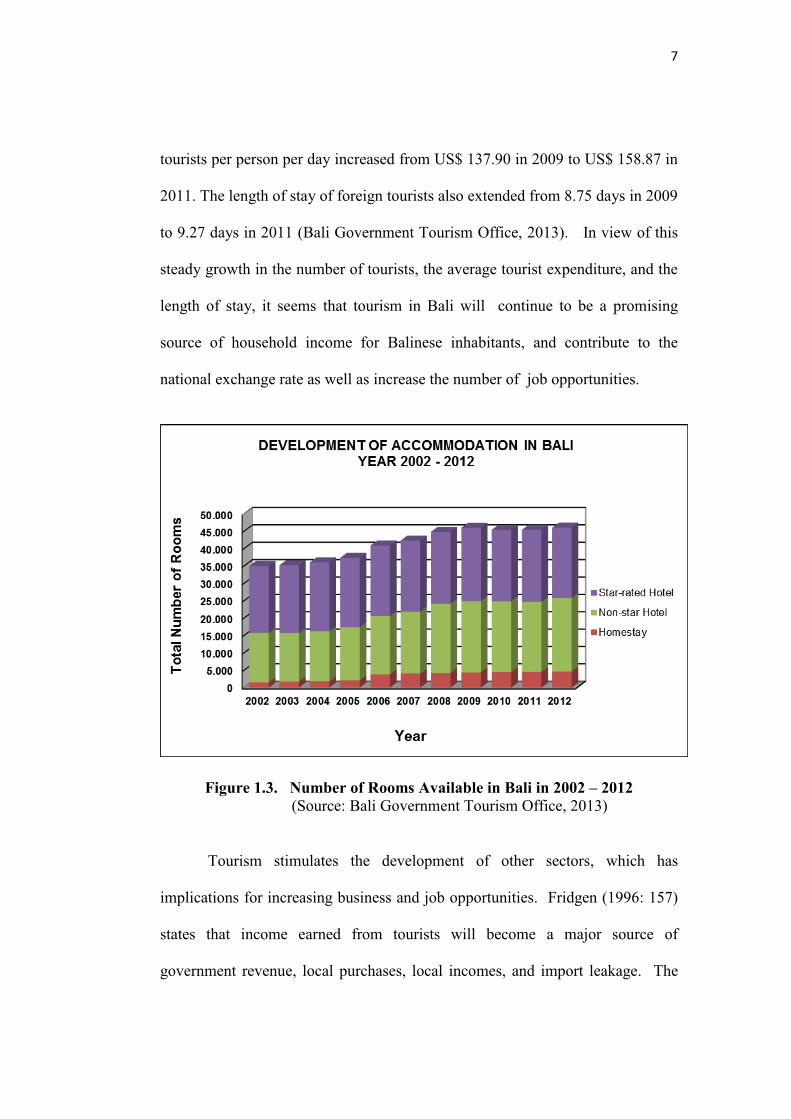
As a world-class tourist destination, Bali is supported by the availability
of infrastructures, including an international airport which provides international
access to Bali, and main roads which provide easy access to various tourism
facilities and attractions within the region. Data provided by the Bali
Government Tourism Office (2013) show that there were 2,212 units of
accommodation with a total of 46,025 rooms registered in Bali in 2012. These
included 156 star-rated hotels (20,269 rooms), 1,031 non star-rated hotels
(21,114 rooms), and 1,025 homestays (4,642 rooms). This growth in registered
accommodations in Bali during the period of 2002-2012 is shown in Figure 1.3.
However, the figures provided by the Bali Hotel and Restaurant Association
(PHRI Bali) differ. They listed a total of 3,346 units of accommodation (62,407
rooms) in Bali in 2011, consisting of 165 star-rated hotels (22,161 rooms),
1,371 non star-rated hotels (28,585 rooms), 1,760 homestays (9,282 rooms), 15
condotels (1,793 rooms), and 35 rental houses (586 rooms). It could be that
more accommodation is available in Bali than the above numbers indicate as
there are also many more accommodations which are unregistered or operate
illegally.
In 2008, there was a world economic crisis. However it did not have an
obvious effect on the arrival of foreign tourists in Bali. This can be seen from
the number of foreign tourists visiting Bali, which increased dramatically from
1,968,892 in 2008 to 2,2892,019 in 2012, a rise of about 923,127 during 2008-
2012 (see Figure 1.2). In addition, the average tourist expenditure and length of
stay also increased during this period. The average expenditure of foreign
8
amount of local income generated per unit of visitor expenditure will become a
multiplier for Bali‟s economy through backward and forward linkages. Data
from the Bali Central Bureau of Statistics (2011) show that the lowest multiplier
effect from the hotel and restaurant sub-sector was contributed by the
agricultural and industrial sectors. Backward linkage of Bali tourism performed
the second highest after that of the industrial sector, at 1.71, and forward linkage
performed the highest amount at 1.87. Backward linkage of 1.71 means that
every one dollar of tourist spending generates 1.71 dollars in local income
through backward linkage, i.e. impact on related industries. In this situation,
outputs of related industries (such as agricultural products, fishery products,
livestock products, handicrafts, etc.) are used as input by the tourism industry in
order to fulfill demand from tourists. Thus, every one dollar of tourist spending
will generate 1.71 dollars income for these other related industries. Meanwhile,
forward linkage of 1.87 means that every one dollar of tourist spending will
generate 1.87 dollars in local income through forward linkage, i.e. other
industries which use the output of tourism industries as input to their industries.
This means that output of the tourism industry is supplied to other industries. For
example, accommodation in tourism is used as an input by travel agents. Travel
agents offer accommodation to tourists in order to gain profits. In this situation,
forward linkage of 1.87 means that every one dollar of tourist spending will
generate 1.87 dollars income for travel agents. According to Mill and Morison
(2009), if output from backward linkage is supplied to the tourism industry from
imported products, then the income generated from tourism will leak out of the

9
country. Similarly, if the industries which use the output of tourism as input
belong to foreigners, then the income from tourism will also leak out of the
country.
The government of Bali faces the problem of how to maintain the
sustainable development of tourism. The concept of “sustainable tourism”
derives from the concept of "sustainable development" which has been widely
adopted since its appearance in „Our Common Future‟ (WCED, 1987).
Sustainable development is defined as:
" … development that meets the needs of the present without compromising the
ability of future generations to meet their own needs"… (WCED, 1987:68).
It contains two key concepts:
The concept of 'needs', in particular the essential needs of the world's poor,
to which overriding priority should be given; and
The idea of limitations imposed by “the state of technology” and “social
organization on the environment's ability” to meet present and future needs
( http://www.un-documents.net/our-common-future.pdf).
Elkington (1997) defines sustainable development in terms of a Triple Bottom
Line (TBL) that stipulates that development be environmentally sound,
economically feasible and socially equitable (see Figure 1.4). The TBL was
later expanded and articulated in his book entitled “Cannibals with Forks: The
Triple Bottom Line of 21st Century Business” (Elkington, 1997).
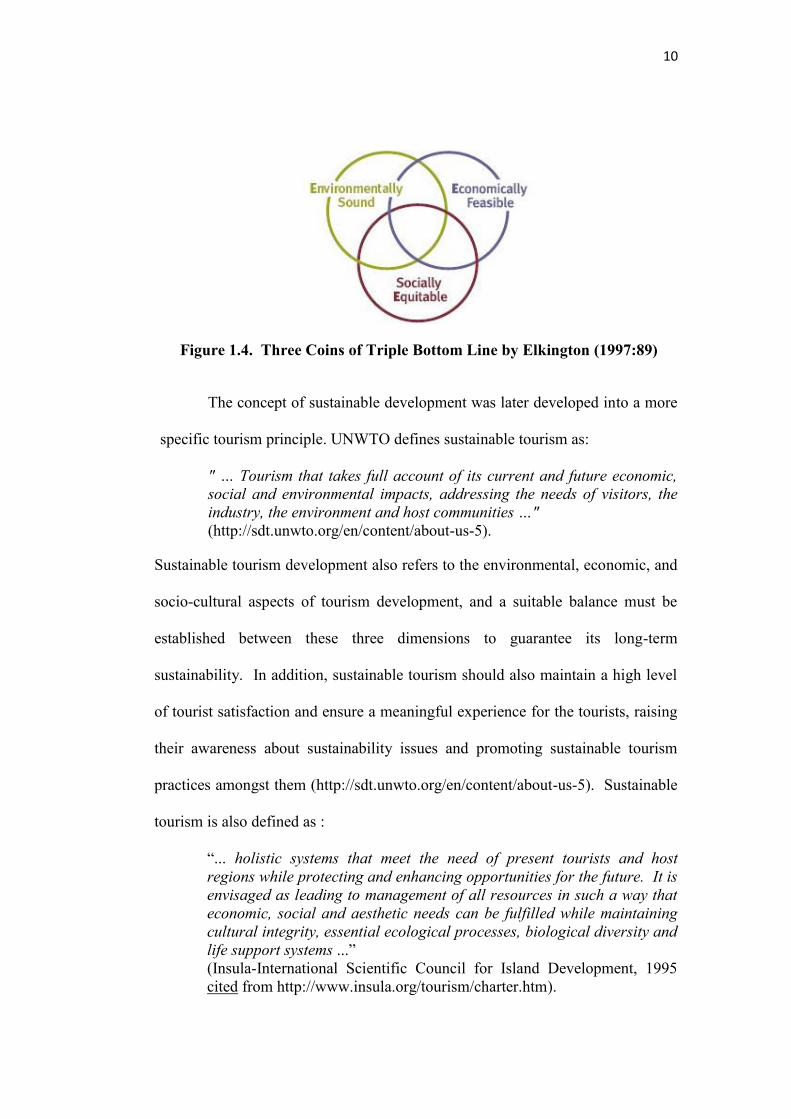
10
Figure 1.4. Three Coins of Triple Bottom Line by Elkington (1997:89)
The concept of sustainable development was later developed into a more
specific tourism principle. UNWTO defines sustainable tourism as:
" … Tourism that takes full account of its current and future economic,
social and environmental impacts, addressing the needs of visitors, the
industry, the environment and host communities …"
(http://sdt.unwto.org/en/content/about-us-5).
Sustainable tourism development also refers to the environmental, economic, and
socio-cultural aspects of tourism development, and a suitable balance must be
established between these three dimensions to guarantee its long-term
sustainability. In addition, sustainable tourism should also maintain a high level
of tourist satisfaction and ensure a meaningful experience for the tourists, raising
their awareness about sustainability issues and promoting sustainable tourism
practices amongst them (http://sdt.unwto.org/en/content/about-us-5). Sustainable
tourism is also defined as :
“... holistic systems that meet the need of present tourists and host
regions while protecting and enhancing opportunities for the future. It is
envisaged as leading to management of all resources in such a way that
economic, social and aesthetic needs can be fulfilled while maintaining
cultural integrity, essential ecological processes, biological diversity and
life support systems ...” (Insula-International Scientific Council for Island Development, 1995 cited from http://www.insula.org/tourism/charter.htm).
11
Furthermore, Elkington (1997) stated that “Triple Bottom Line” means
expanding the traditional reporting framework to take into account both
ecological and social performance to enhance economic performance. All of
those three elements should be coherent with each other, to ensure quality,
continuity and balance between the needs of tourism, protection of the
environment and prosperity for the local community, which means that the
economic benefit of tourism should be beneficial not only for the companies
concerned but also for the local communities as the host. The business entity
should be used as a vehicle for coordinating stakeholders‟ interests, instead of
maximizing shareholder (owner) profit, so that it can achieve quality, continuity
and balance. Good quality, sustainable tourism provides a quality experience for
the visitor, while improving the quality of life of the host communities and
protecting the quality of the environment. As regards continuity, sustainable
tourism ensures the continuity of the natural resources upon which it is based and
the continuity of the culture of the host community with satisfying experiences
for visitors. Balanced, sustainable tourism balances the needs of the tourism
industry, the natural environment and the local communities. Sustainable tourism
emphasizes mutual goals and cooperation among visitors, host communities and
destination, in contrast to more traditional approaches to tourism which
emphasize their diverse and conflicting needs (WTO, 2007;
http://www.kennuncorked.com/sustainable_defined.html#triple).
Even though tourism has brought about development for Bali‟s economy
for many years, the economic impacts of tourism development have not been
12
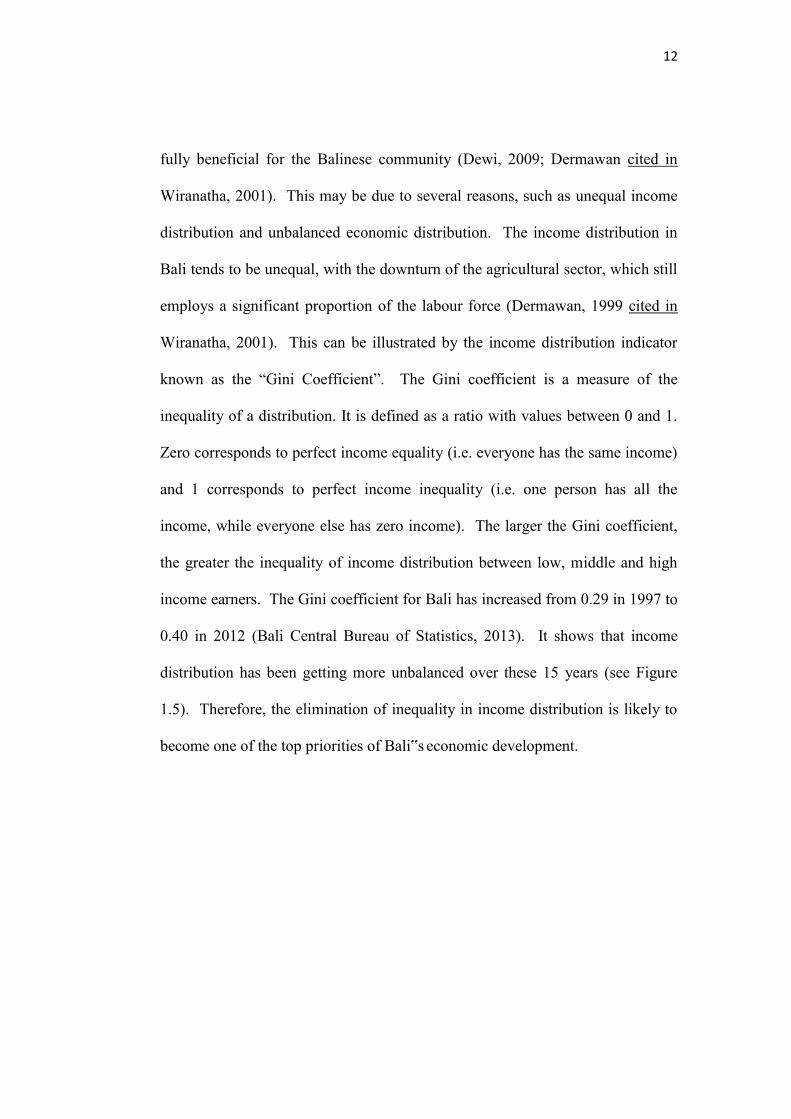
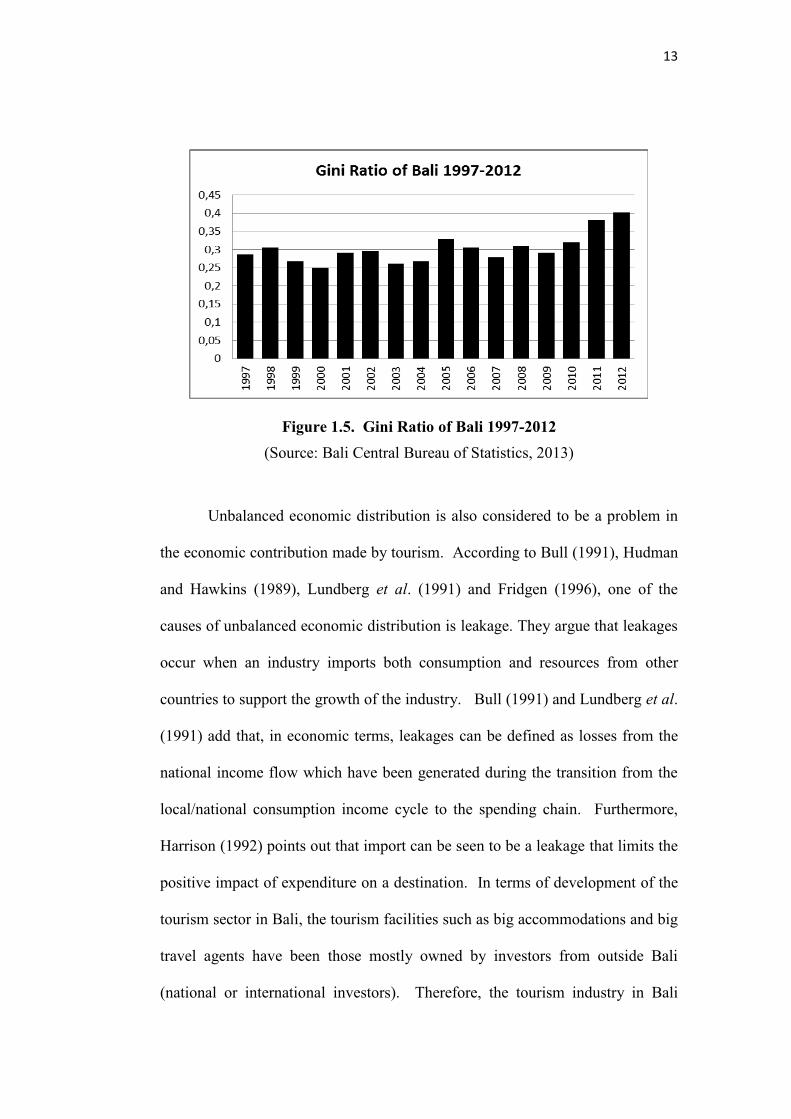
fully beneficial for the Balinese community (Dewi, 2009; Dermawan cited in
Wiranatha, 2001). This may be due to several reasons, such as unequal income
distribution and unbalanced economic distribution. The income distribution in
Bali tends to be unequal, with the downturn of the agricultural sector, which still
employs a significant proportion of the labour force (Dermawan, 1999 cited in
Wiranatha, 2001). This can be illustrated by the income distribution indicator
known as the “Gini Coefficient”. The Gini coefficient is a measure of the
inequality of a distribution. It is defined as a ratio with values between 0 and 1.
Zero corresponds to perfect income equality (i.e. everyone has the same income)
and 1 corresponds to perfect income inequality (i.e. one person has all the
income, while everyone else has zero income). The larger the Gini coefficient,
the greater the inequality of income distribution between low, middle and high
income earners. The Gini coefficient for Bali has increased from 0.29 in 1997 to
0.40 in 2012 (Bali Central Bureau of Statistics, 2013). It shows that income
distribution has been getting more unbalanced over these 15 years (see Figure
1.5). Therefore, the elimination of inequality in income distribution is likely to
become one of the top priorities of Bali‟s economic development.

14
seems to be most beneficial to the investors and their small number of
employees, as most tourists‟ expenditure is on accommodation, food and
beverages, and tourism transport. In these cases, the economic benefit from
tourism is likely to go mainly outside Bali or to other countries, with a small
proportion trickling down to the local Balinese community (Dermawan, 1999
cited in Wiranatha, 2001). It can be seen from the Rest of the World account of
Bali Province in 2010, that it was about 879.74 billion rupiah in deficit (Bali
Central Bureau of Statistics, 2011).
This unbalanced economic distribution as shown by the Gini coefficient
of 0.41 in 2012 (refer to Figure 1.5) means that the goal of sustainable tourism
development has not been achieved as the economic benefits of tourism have not
been received by the host community fairly. As leakage is one factor causing
unbalanced economic distribution of tourism benefits to the local community,
there is a need to ascertain the current amount of leakage occurring in Bali‟s
tourism.
A study by Rodenburg (1980) is the only reference about import leakage
from tourism in Bali. The import leakage was estimated to be about 40% for
international standard hotels, and 20% for small economy standard hotels. The
import leakage from international standard hotels was estimated from the Nusa
Dua Project in 1977, but that from small economy standard hotels was estimated
using assumption. There has not yet been any research about tourism leakage in
the tourist accommodation sector that has used a combination analysis of micro
(industrial) level and macro (regional) level. The focus of the analysis in this
15
research was on the accommodation sector because the highest percentage of
expenditure by foreign tourists in Bali is on accommodation, i.e. 40.5% (Bali
Government Tourism Office, 2011).
Regarding the above issues, there is a need to undertake a study to
widely improve knowledge related to research approaches, concepts and
research methods in tourism leakage both at macro (provincial) level and micro
(industrial) level, especially with regard to the accommodation sector. The study
at the industrial level (accommodation sector) also needs to be supported by an
analysis of the perceptions of hotel owners/management in order to ascertain
their points of view on how to minimize the leakages. The results of this
research are expected to be useful by leading to better understanding, awareness,
and responsibility and gaining positive responses from government and
stakeholders that can improve the economic impacts of tourism in order to
achieve sustainable tourism in Bali.
1.2 Problem Formulation
Based on the issues of the economic benefits of tourism to Bali‟s
economy as outlined above, the following research problems can be formulated
related to the leakage of Bali‟s tourism revenue at macro and micro levels.
1) What is the amount of tourism leakage from Bali‟s accommodation
sector at the micro (industrial) level?
2) What is the amount of tourism leakage from Bali‟s accommodation
sector at the macro (provincial) level?
16
3) What are the impacts of government subsidies and import reduction by
the accommodation sector on tourism leakage, job opportunities and
income distribution?
4) What are the perceptions and preferences of foreign tourists regarding
imported and local products, and how willing are they to spend their
money to benefit the Balinese people?
5) What are the points of view of hotel managers related to imported and
local products, and how willing are they to reduce the use of imported
products and give priority to local products?
6) What efforts could be made to minimize tourism leakage from the
accommodation sector in Bali?
1.3 Research Objectives
The general objective of this study is to evaluate tourism leakage from
Bali at micro and macro levels in order to develop general recommendations to
produce a theoretical concept and an applicable framework that can be used to
ascertain the real impact of tourism on the economy of Bali. The measurement
of leakage at the micro level is undertaken to describe leakage from the
accommodation sector (industrial level), while the measurement of leakage at
the macro level is undertaken to explain leakage from the accommodation sector
at the regional (provincial) level. Specifically the objectives of the study are:
1) To calculate the amount of tourism leakage from the accommodation
sector in Bali at micro (industrial) level.

17
2) To calculate the amount of tourism leakage from the accommodation
sector in Bali at macro (provincial) level.
3) To evaluate the impacts of government subsidies and import reduction by
the accommodation sector on tourism leakage, job opportunities and
income distribution.
4) To evaluate the perceptions and preferences of foreign tourists on
imported and local products as well as the willingness of foreign tourists
to spend their money to benefit the Balinese people.
5) To evaluate the points of view of hotel managers related to imported and
local products as well as their willingness to reduce the use of imported
products and give priority to local products.
6) To develop a strategy to minimize tourism leakage in the accommodation
sector in Bali.
1.4 Research Benefits
This research is beneficial in terms of both theory and practice.
Theoretically, it improves knowledge related to research approaches, concepts
and methods of estimating tourism leakage especially in the accommodation
sector. Practically, the research results can be used by policy makers in order to
formulate regional policy and generate strategies, as well as to control the
expansion of the tourism industry in order to improve regional economic
development through increasing job opportunities, understanding and awareness
of the causes of leakage and minimizing tourism leakage through a systems
approach in order to improve the economic benefits to the Balinese community.
18
CHAPTER II
LITERATURE REVIEW
2.1 Introduction
Chapter II focuses on a review of the literature regarding the objectives of
this research. It begins with a discussion of the national income in an open
economy, explaining the importance of export and import in generating national
income. It then discusses how the Social Accounting Matrix (SAM) can be
applied to calculate tourism leakage. The next section explains the importance of
systems theory in developing strategies from different perspectives in order to
minimize tourism leakage. This is followed by a discussion of multiplier effects,
whereby money spent by tourists in Bali generates incomes through several
―rounds‖. Previous studies related to leakage in tourism are then reviewed to
explain the ways in which the development of tourism creates both positive and
negative impacts. The positive impacts result in increasing income and job
opportunity in a tourist destination. However, these positive impacts are
hampered by weaknesses such as tourism leakage. This leads on to a discussion
of efforts at minimizing tourism leakage described in previous studies. These are
reviewed as a source of information for generating strategy. Lastly, previous
studies of various groups‘ perceptions and preferences in relation to tourism
leakage are reviewed, followed by a discussion of ways of minimizing leakages so
as to optimize tourism benefits. This chapter ends with a brief conclusion.
19
2.2 National Income in an Open Economy
There are two types of economy, namely an open economy and a closed
economy. According to Krugman & Obstfeld (2006) and Lane (1999) an open
economy is an economy that has interactions in trade or finance with other
countries; meanwhile, a closed economy is an economy that has no interactions in
trade or finance with other countries. In a closed economy there is no export or
import. Hence, domestic investment must equalize domestic saving at all times.
In an open economy, on the other hand, domestic investment can be greater or less
than national saving. The difference between saving and domestic investment
determines the current account imbalance for an open economy, with a current
account surplus indicating that some national saving is being invested abroad,
while a deficit implies net capital inflows from abroad which are financing
domestic investment.
Gross National Product (GNP) is defined as the value of all final goods
and services produced by a nation‘s factors of production in a given time period.
It represents the total net value of all goods and services produced within a nation
over a specified period of time, representing the sum of wages, profits, rents,
interest, and pension payments to residents of the nation (Krugman & Obstfeld,
2006; and Lane, 1999). National income decomposition in a closed economy is
expressed as:
Y = C + I + G
while national income decomposition in an open economy is expressed as:
Y = C + I + G + X - M
20
where: Y = National income C = Consumption I = Investment G = Government expenditure X = Export M = Import X-M = net export (export minus import).
This identity can be rewritten as:
Y – T = C + I + G – T + X – M where: T = Tax
Y – T – C + T – G = I + X – M
Sp Sg
Krugman & Obstfeld (2006) state that:
letting Y – T – C = Sp, and
T – G = Sg,
this equation can be rewritten as
(Sp + Sg) = I + X – M
(Sp + Sg) – I = X – M
Since total saving for this economy is S = Sp + Sg, thus:
S – I = X – M, or
S + M = I + X
where: Sp is private saving, and Sg is government saving
According to Krugman & Obstfeld (2006), an economy‘s current account is
defined as the ―difference between exports and imports of goods and services‖
Hence, the current account is:
X - M = Current Account (CA) CA = S - I
21
Krugman & Obstfeld (2006) and Lane (1999) stipulate that the requirement for
balance in an open economy is that:
the value of (S+M) is equal to (I+X). Thus: S + M = I + X
It can be seen from the above explanation that the two variables, namely
import (M) and export (X), are really important in generating national income and
trade balance in a country (Krugman & Obstfeld, 2006 and Lane, 1999). This
means that cross-country differences in export and import affect the real per capita
income levels. It also means that an increase in export results in an increase in
national income, while an increase in import brings about a decrease in national
income. Krugman & Obstfeld (2006), Lane (1999) and Zhang (2004) said that
when a country‘s import exceeds its export (I>E), this means that country has a
―deficit‖ current account. Meanwhile, a country‘s current account is in ―surplus‖
when the value of its exports exceeds that of its imports (E>I).
Regarding tourism, export is generated from payments made by foreign
tourists for using accommodation and restaurant services and buying handicrafts,
etc. However, if most of these are imported products, foreign services and include
the use of foreign employees in tourism, this situation means there is actually an
increase in import, which can lead to a decrease in national income. The
development of tourism is therefore hampered by a high percentage of tourism
leakage generated from the use of imported products, services and the use of
foreign employees in operating hotels (Krugman & Obstfeld, 2006; Lane, 1999
and Zhang, 2004).
22
2.3 The SAM as an Accounting System and Conceptual Framework
According to Thorbecke (1988), the genesis of the Social Accounting
Matrix (SAM) goes back to Richard Stones‘ pioneering work on social accounts.
Subsequently Pyatt and Thorbecke (1976) cited in Thorbecke (1988) formalized
the SAM and showed how it could be used as a conceptual and modular
framework for policy and planning purposes. As a data framework, the SAM is a
comprehensive and disaggregated picture of the socioeconomic system during a
given year. It provides a classification and organizational scheme for the data
useful for analysts and policymakers. A SAM is a comprehensive accounting
framework that shows the circular flow of income in an economy and captures the
transactions between a number of variables. A SAM represents all of the
transactions between different factors of production, institutions (households,
companies and government), and production activities within an economy with
respect to the rest of the world (Thorbecke, 1988). As a single entry accounting
system, a SAM is represented in the form of a square matrix with rows and
columns, in which each account has its own row and column. Receipts (revenues)
are recorded in rows and payments (expenditures) are listed in columns. The sum
of all expenditures by a given account (or subaccount) must be equal to the total
sum of receipts or income for the corresponding account. In another words, the
row sums must be equal to the column sums of the corresponding account
(Thorbecke, 1988; Thorbecke, 2000).
A SAM can be regarded as an extension of input-output (I-O) tables
(Thorbecke, 1988), a widely used framework to provide detailed information on
23
the flow of goods and services, as well as on the structure of production costs. In
this matrix, final consumption expenditure, capital formation and trade are shown
by product or industry of origin, and intermediate consumption both by product or
industry of origin and destination. Income generation is shown by the value
added (Huseyin, 1996; Keuning et. al., 2010, Thorbecke, 1988; Thorbecke,
2000). The factors of production included in the SAM are male and female
labour, and capital, including mixed-income of the self-employed. Furthermore,
institutions consist of households, companies, and government. The data for a
SAM come from input-output tables, national income statistics, and household
income and expenditure statistics and other related sources of data. Therefore, a
SAM is broader than an input-output table and typical national account, showing
more detail about all kinds of transactions within an economy (Thorbecke, 1988).
Thorbecke (2000) has drawn up a basic SAM for six distinct accounts (see
Appendix 2.1). It can be seen that it incorporates all the major transactions within
a socio-economic system. Meanwhile, Figure 2.1 reproduces all of the
transformations appearing in Appendix 2.1 interpreted more broadly as
representing flows (over time) which have to be explained by structural or
behavioral relationships (Thorbecke, 2000).
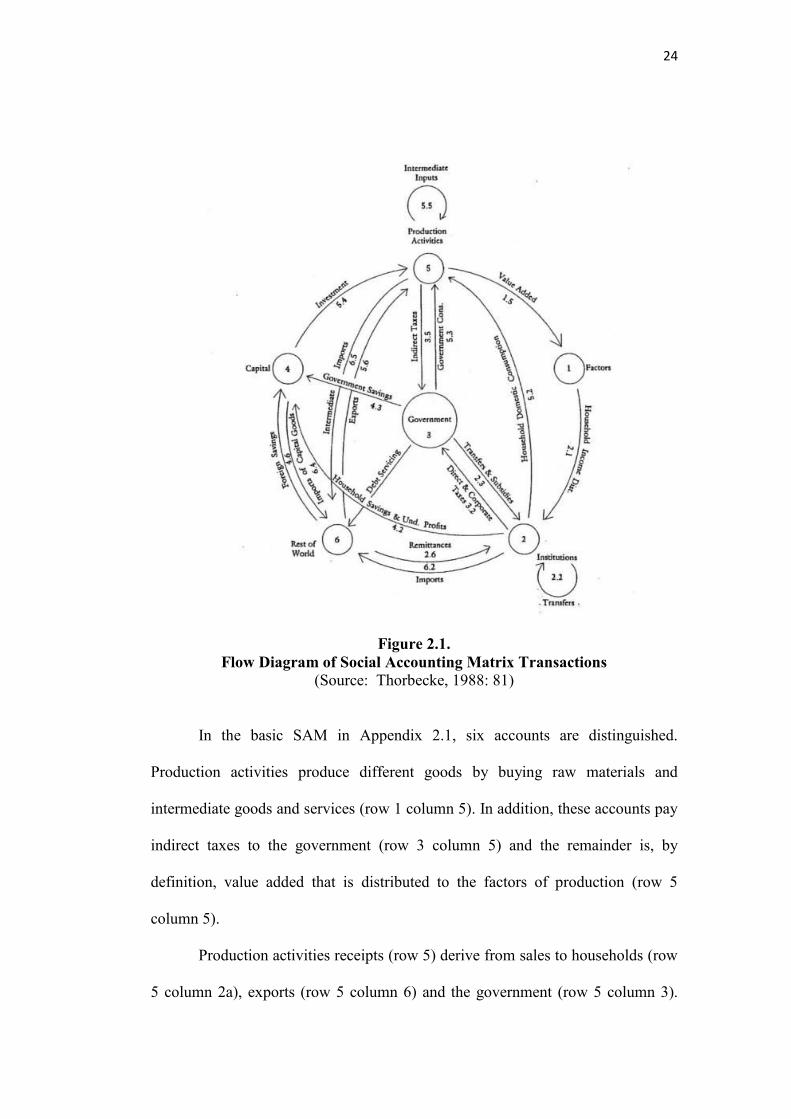
24
Figure 2.1. Flow Diagram of Social Accounting Matrix Transactions
(Source: Thorbecke, 1988: 81) In the basic SAM in Appendix 2.1, six accounts are distinguished.
Production activities produce different goods by buying raw materials and
intermediate goods and services (row 1 column 5). In addition, these accounts pay
indirect taxes to the government (row 3 column 5) and the remainder is, by
definition, value added that is distributed to the factors of production (row 5
column 5).
Production activities receipts (row 5) derive from sales to households (row
5 column 2a), exports (row 5 column 6) and the government (row 5 column 3).
25
In the present formulation of the SAM no distinction is made between production
activities and commodities. It is assumed that a production activity is equivalent
to a corresponding commodity. In some instances, the SAM format distinguishes
between production activities and commodity accounts. This would be the case
when a given production activity produces different commodities, so that these
two sets of accounts would require different sectoral breakdowns. For this reason,
many SAMs include both production activities and commodities accounts. When
commodity accounts appear in a SAM they can best be seen as representing a
region‘s or nation‘s product markets. They receive income (recorded in row 1
column Total) from the sale of their services to production activities (row 1
column 5) in the form of wages, rent and net factor income received from abroad
(row column 6) or from other regions (corresponding to the value added generated
by the production activities). In turn, these revenues are distributed (column 1) to
households as labor incomes (row 2a column 2a) and to companies as distributed
profits (row 2a column 2b). Institutions include households, companies and the
government. From row 2a, it can be seen that households receive factor income
(wages and other labor income, rent, interest and profits) (row 2a column 2a),
income from companies (row 2a column 2b) as well as transfers from government
(row 2a column 3) and from the rest of the nation and world (e.g. remittances)
(row2a column 6).
Households‘ expenditures (in column 2a) consist of consumption of goods
from the local region (row 5 column 2a), from other regions and from abroad (row
6 column 2a), and income taxes, with residual savings transferred to the capital
26
account (row 3 column 2a). Companies (2b) receive profits and transfers from
domestic companies (row 2b column 3) and spend on taxes and transfers, with
their residual savings channeled into their capital account (row 4 column 2b).
The government account (3) is distinct from administrative public
activities included in the production activities account. These public services
(such as education) buy intermediate goods, pay wages and deliver public and
administrative services. The government account allocates its current expenditures
on buying the services provided by the production activities account (row 5
column 3). Other government expenditures (column 3) are transfers and subsidies
to households (row 2a column 3) and companies (row 2b column 3) and the
remaining savings are transferred to the capital account (row 4 column 3). On the
income side, the government receives tax revenues from a variety of sources and
current transfers from abroad (row 3).
The fifth account is the combined capital account. On the income side
(row 4) it collects savings from households, companies, the government as well as
foreign savings and, in turn, channels these aggregate savings into investment
(column 4). Finally, transactions between domestic residents, and foreign
residents, respectively, are recorded in the Rest of the World Accounts (column
6). These transactions include, on the receipt side, households‘ consumption
expenditures on imported final goods (row 6 column 5) as well as imports of
capital goods and raw materials (row 6 column 4). The economy receives income
from the rest of the world (column 6) from exports, and factor and nonfactor
income earnings. The difference between total foreign exchange receipts and
27
imports is by definition net capital received from abroad or the rest of the nation
and extra regional and foreign savings (Thorbecke, 2000).
The SAM framework can also be used as a conceptual framework and as a
basis for modeling. In this case, the generating mechanisms influencing the flows
(see Figure 2.1) have to be spelled out explicitly and quantitatively. The first
question to address in a SAM-based framework is which accounts should be
considered exogenous and which endogenous. The government, the rest of the
world and the capital accounts are considered as exogenous, and the factors,
institutions, and production activities accounts are considered as endogenous.
The primary income distribution is determined through the triangular
interrelationship namely: production activities, factors of production and
households. In Figure 2.1, interrelationship appears as the value added flow
(denoted by arrow 1.5) from production activities to factor incomes; from the
latter to household income distribution (arrow 2.1) which yields, ultimately, the
household domestic consumption pattern (arrow 5.2). While the primary income
distribution is by far the most important determinant of incomes received by the
various socioeconomic groups, a secondary income distribution may work
through the family, village, or, more important, through the state in the form of
transfers and subsidies (arrow 2.3) and taxes (arrow 3.2) (Thorbecke, 2000).
2.4 Systems Thinking
Systems thinking is a holistic way of thinking where the system refers to
interconnected elements that form the whole (Bloom, 2009). This holistic
approach embraces complexity through the properties of the whole and related
28
properties that is only present at the level of the whole. It can thus be said that
systems thinking is a way of interpreting the interconnected elements in relation to
the whole. Moreover, Hendry (2013) explains that systems thinking focuses on
how the thing being studied interacts with the other constituents of the system. A
set of elements interact to produce behavior of which it is a part. This means that
instead of isolating smaller parts of the system being studied, systems thinking
works by expanding its view to take into account larger numbers of interactions as
an issue is being studied. This results in sometimes strikingly different
conclusions than those generated by traditional forms of analysis, especially when
what is being studied is dynamically complex or has a great deal of feedback from
other sources, internal or external.
Senge (1994) pointed out that the character of systems thinking makes it
extremely effective in addressing the most difficult types of problems to solve:
those that involve complex issues, depend a great deal on the past or on the
actions of others, and are characterised by ineffective coordination. The patterns
in the ways a system‘s components work together is examined when a systems
thinking approach is used. He defines systems thinking as a framework for seeing
interrelationship rather than linear cause-effect chains, and for seeing patterns of
change rather than static snapshots. In summary, Waldman (2007) states that
there are three main characteristics of systems thinking, namely: (i) systems
thinking is a framework for seeing wholes; (ii) systems thinking is based on
interrelationship; and (iii) systems thinking emphasizes long term analysis.
29
Moreover, systems thinking provides tools and techniques that unravel
complexity, making the full pattern clearer because it assists in seeing the
structure that underlies a complex situation. This helps us both to describe
dynamic relationships, and to understand the complexity that influences the
behaviour of systems (Seiler & Kowalsky, 2011). By understanding a complex
situation through identifying a clearer pattern, we can see how proposed
interventions will change the patterns effectively, which results in finding possible
solutions to the problems.
In the context of organization, Wolstenholme (2000) argues that systems
thinking embraces complexity, improves understanding and also helps to build
pictures of the whole organization from different perspectives. He notes that
system thinking views the organization as a web of interrelated systems with no
one system being more fundamental than another. He also concludes that there
are two main focuses of systems thinking, namely to examine situations in context
and to see how they are interconnected with one another. Moreover, he points
out that whenever there are problems within the organization, the systems thinker
sees them as arising from underlying structures rather than from individual
mistakes.
According to Eriyatno (2012), the systems thinking process has three
characteristics, i.e. (i) goal oriented, meaning that the systems thinking process
leads to a positive outlook and builds creativity to achieve innovative solutions in
order to reach the goal; (ii) holistic, meaning that it is a comprehensive paradigm
of thinking based on the idea of the system as a whole, which considers the
30
importance of interrelationships among system components; (iii) effective,
meaning that it places the priority on scientific processes, either conceptual or
physical, and that the results of the process can be implemented. In summary,
systems thinking provides a key insight for the management of complex systems.
In addition, Seiler & Kowalsky (2011) argue that systems thinking is not the first
choice of individuals because humans want the easiest and quickest resolution.
However, systems thinking reduces uncertainties and establishes clear
performance indicators.
2.5 The Importance of Tourism Multiplier Effects in Increasing Income and Job Opportunity
Tourists make an initial round of expenditure in the destination. This
expenditure is received as income by tour operators, hotel operators, restaurants
and other tourism businesses. It is called ―direct effects‖. In the second round of
expenditures, the tourism businesses use some of the money to purchase goods,
pay for wages and salaries and other expenses. The income for the third round
may be spent or saved. It is called ―indirect effects‖. The money paid for goods
in the third round may be spent on raw materials in production processes, such as
seeds, fertilizers, etc., which lead to the creation of job opportunities. It is called
―induced effects‖. This process continues until the additional incomes generated
by the new round of transactions becomes zero. Indirect and induced effects are
called ―secondary multiplier effects‖ (Hughes, 1994; Mill and Morrison, 2009).
In Figure 2.2, Antara (1999) illustrates how through the multiplier effects, tourism
expenditures have been a driving force in Bali‘s economy. This then stimulates
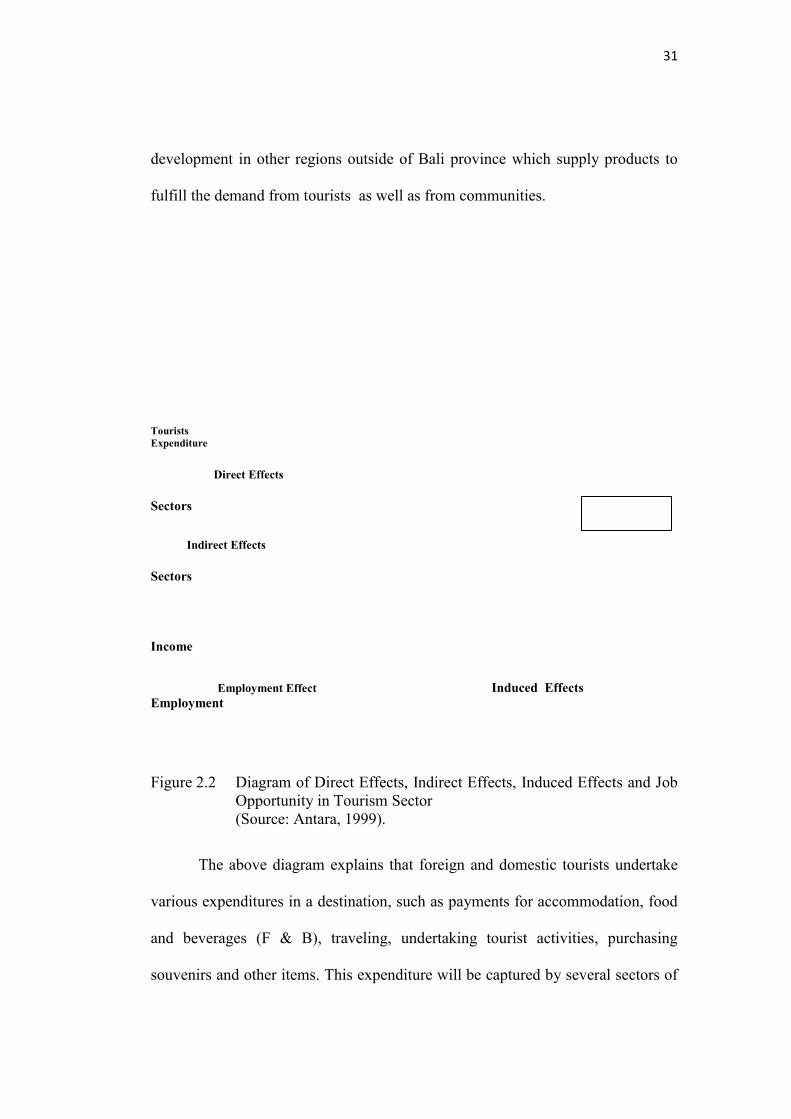
31
development in other regions outside of Bali province which supply products to
fulfill the demand from tourists as well as from communities.
Tourists Expenditure
Direct Effects
Sectors
Indirect Effects Sectors
Income
Employment Effect Induced Effects Employment
Figure 2.2 Diagram of Direct Effects, Indirect Effects, Induced Effects and Job
Opportunity in Tourism Sector (Source: Antara, 1999).
The above diagram explains that foreign and domestic tourists undertake
various expenditures in a destination, such as payments for accommodation, food
and beverages (F & B), traveling, undertaking tourist activities, purchasing
souvenirs and other items. This expenditure will be captured by several sectors of
Craft Industry
Forestry
TOURISTS
Accommodation (rooms)
Food & Bvrg Trips Art Handicraft
Hotels services
Manufacturing Transport Entertainment
Communication Agriculture
Comm business Farmers
Automotive Industry
Tourist Expenditure in Destination
Automotive business
labour labour Workshop in automotive
bussiness

32
the economy, so it becomes income of the economy. This is called the ―direct
effects‖ of tourist expenditures. However, increase in income of the economy
will increase the demand for inputs derived from the output of other economic
sectors such as agriculture, industry, handicraft, transportation, etc. Moreover,
increase in the output from production sectors leads to an increase in payments for
the factors of production used in the production process, thereby increasing the
income of households and companies. This is called ―indirect effects‖.
Furthermore, an increase in a household‘s income will encourage an increase in
consumption which, in turn, will encourage the generation of other income and
expand job opportunities. This is called ―induced effects‖. Indirect effects and
induced effects are called ―secondary effects‖. Multiplier effects are calculated
from the sum of direct effects and secondary effects. Thus, tourism expenditures
do not only increase the income but also increase the job opportunities.
Moreover, tourism expenditures also lead to an increase in the demand for various
types of goods and services produced by economic sectors that are directly or
indirectly related to tourism. The production of these goods and services will
create and expand employment in Bali or even beyond Bali. For example, it
increases job opportunities in the communication industry, agricultural industry,
automotive industry, etc. So, through the multiplier effects, tourism expenditures
in Bali have been a driving force for economic development in Bali.
Development of Bali‘s economy also contributes to the development of other
regions outside Bali.
33
Mill and Morrison (2009) say that the benefits of tourism fall into three
categories, namely: i) increasing income, ii) increasing job opportunity, and (iii)
increasing foreign exchange earnings.
(i) Increasing Income
Income from tourism expenditures is created through several rounds
(direct, indirect and induced effects) as outlined above. Besides the rounds
created by tourism expenditures, tourism may also create significant local tax
revenues. The tax revenues generated from the tourism sector will then stimulate
development of the infrastructure. Tourism can encourage local government to
invest in providing better water and sewage systems, roads, electricity, telephone
and public transport systems, all of which may help to improve the lives of local
residents.
(ii) Increasing Job Opportunity
A major argument for encouraging tourism development is that it provides
many job opportunities. Tourism creates primary or direct employment
opportunities in accommodation, restaurant, attraction, transportation, and
sightseeing operations. Indirect employment is also created in construction,
agriculture and manufacturing. The amount of indirect or secondary employment
depends upon the extent to which tourism is integrated with the rest of the local
economy. The more integration and diversification occurs, the more indirect
employment will be generated (Hughes, 1994). He added that tourism is
considered to be more labour intensive than other industries. The degree of labour
34
intensity can be measured in terms of the cost per job created or the
employment/output ratio. The employment/output ratio is the number of workers
employed by the contribution of tourism to the national income.
Mill and Morrison (2009) point out that although research conclusions are
not unanimous, the cost per job created in tourism has been found to be no less
than in other economic sectors. A major reason is because tourism is also capital
intensive. The heavy costs of providing necessary infrastructure and building
structures drastically increase the cost of creating jobs. Fridgen (1996) explains
that in the early stages of tourism development, the cost per job created is likely to
be high due to the capital costs required. Similarly, the capital/output ratio is high
because of the low volume of visitors in the early stages of tourism development.
He added that as the destination country develops and as more visitors are
attracted, the capital/output ratio declines. The cost per job created is reduced due
to the experience and organization of those in the destination. In addition,
(Hughes, 1994) says that as tourism increases, physical development takes place
in facilities that require less investment than the construction of international-level
hotels and resorts. Jobs are therefore created at lower average cost. In the third
stage of tourism development, however, the average cost per job created may
increase due to higher land prices and the increased engineering costs incurred
due to the necessity of using sites that are more difficult to develop. Moreover,
as tourism increases, more infrastructures (roads, electricity and sewerage
services, etc.) may be necessary as the tourism plant becomes more spread out
35
geographically. The increasing demand for infrastructure may be caused by the
larger numbers of visitors in the destination area.
Fridgen (1996) argues that the cost per job created depends upon the type
of facility constructed. The cost is greater for a luxury hotel than for a smaller,
more modest property. However, he says that a luxury hotel offers more job
opportunities per room and higher employment/output ratios than smaller
properties, although the larger properties are more inclined to use imported labor,
especially for managerial positions. Moreover, he stated that the key to
maximizing the economic and job returns is to use materials and personnel
indigenous to the destination area while maintaining standards of quality
acceptable to visitors.
Frechtling (1994) reports that tourism has been criticized as an employer.
Tourism is a highly seasonal business in many destination areas. To ensure a
balance between market demand and staff requirements, tourism businesses tend
to adopt one of two strategies. Employees are either laid off during the low
season, or additional employees are imported from other regions during the high
season. According to Frechtling (1994), with the first approach, tourism cannot
provide a meaningful job to a local resident. Meanwhile, with the second
approach, there is an increased need for housing for employees who spend most of
their wages outside of the destination area. Thus, jobs and income are lost to the
local area, meaning that leakage happens. Lastly, Fridgen (1996) and Mill and
Morrison (2009) point out that because tourism relies so heavily upon people for
delivering a service, it is difficult to achieve increased productivity. The national
36
output may be difficult to improve if tourism becomes a dominant part of the
economy, particularly if the host destination lacks a strong industrial sector, where
productivity gains are easier to obtain.
(iii) Increasing Foreign Exchange Earnings
Many countries have embraced tourism as a way of increasing foreign
exchange earnings to produce the investment necessary to finance growth in other
economic sectors, particularly in manufacturing. Some countries have required
visitors to bring in a certain amount of foreign currency for each day of their stay
and do not allow them to take it out of the country at the end of their vacation
(Mill and Morrison, 2009).
However, Fridgen (1996) argues that there is a danger of overstating the
foreign exchange earnings generated by tourism unless the value of goods and
services that must be imported is known. The amount of spending money that
leaks from the destination‘s economy must be subtracted from foreign exchange
earnings in order to determine the true impact. Fridgen (1996) gives an example
from Australia, where there has been considerable debate about the true economic
impact of the growing number of Japanese travelers, especially to places such as
Sydney, the Gold Coast, and Far North Queensland. He argues that although the
Japanese spend the most per capita of all international groups within Australia,
many of the services they purchase are owned by Japanese companies, including
package tours, hotels and resorts, duty-free shops and attractions such as cruise
operations. In other words, he says, it is perceived that there is a large leakage
factor to the Japanese economy from Japanese expenditure in Australia.
37
According to Fridgen (1996) and Mill and Morrison (2009), exchange earnings
will be reduced as an impacts of leakage. In other words, the extent to which a
destination can minimize leakage will determine the size of the foreign exchange
earnings. Even though tourism brings about economic development, its negative
impacts cause many problems, one of which is leakage (Fridgen, 1996; Kennedy,
1993; and Lejarraga and Walkenhorst, 2010).
2.6 Previous Studies Related to Leakage in Tourism
Leakages have long been known as one of the negative economic impacts
of tourism (Bull, 1991; Hudman and Hawkins, 1989; Lundberg, et. al., 1991; and
Mill and Morrison, 2009). Leakage occurs when the industry imports both
consumption and resources from other countries to support the growth of its own
industry. In economic terms, leakage could be defined as losses from the national
income flow which have been generated during the transition from the
local/national consumption income cycle to the spending chain (Bull, 1991).
UNEP (2010) states that the direct income for a destination area from tourism is
the amount of tourist expenditure that remains locally after taxes, profits, and
wages are paid outside the area and after imports are purchased.
Meanwhile, Hudman and Hawkins (1989) define leakage as: (i) import of
goods and services for consumption or investment in tourism; (ii) payments for
foreign tour operators and agencies; (iii) payment to foreigners for management
contract and royalties; (iv) profits which are paid to foreign stakeholders; (v)
interest paid for external credits in the tourism sector; (vi) exchange costs for
tourism investment; (vii) expenditure on advertising in international marketing

38
and promotion; (viii) commissions paid to foreign banks, credit card companies
and agencies used by tourists; (ix) savings of foreign employees; (x) overseas
education and training costs of tourism employees; (xi) savings of employers,
employees, and entrepreneurs; and (xii) taxes paid to government. There are also
other ‗invisible‘ leakages, such as the physical effects of tourism, the depletion or
destruction of a country‘s infrastructure, natural habitats, environments and
historical as well as cultural heritage, which all have a leakage effect on tourism
receipts (Smith and Jenner, 1992).
Similar arguments are also supported by Mill and Morrison (2009). The
extent to which a destination can minimize leakage will determine the size of
foreign exchange earnings. They say that leakage occurs from at least six factors:
1) First, imported goods and services that must be purchased to satisfy the needs
of visitors. The costs of imported foods must be deducted from earnings. Local
manufacturing or handicraft industries may also import part of their raw
materials to produce goods for visitors. This is also a cost that has to be
subtracted from the foreign exchange earnings from souvenir sales and the
sales of other local products.
2) Second, imported goods and materials for infrastructure and buildings that are
required for tourism development. The use of materials indigenous to the host
destination not only reduces import costs but also adds a distinctive look to the
local architecture and building interiors.
3) Third, payments to foreign factors of production. Commission has to be paid
to overseas tour operators and travel agents. If foreign capital is invested in
39
the country‘s tourism, interest payments, rent and profit may have to be paid to
those outside the country. The amount of local ownership and control is
crucial in this regard. Foreign-owned chain hotels will often be staffed,
stocked and furnished by people, food, furnishings, fixtures and equipment
from the home country.
4) Fourth, expenditures for promotion, public relations/publicity and similar
services that are undertaken abroad. The cost of maintaining a National
Tourism Office (NTO) in a foreign country can be substantial and needs to be
set against the foreign exchange earnings from that country.
5) Fifth, there are several ways that transfer pricing can reduce foreign exchange
earnings. If visitors make purchases in the country of origin for services to be
delivered at the destination, the payments for these services will need to be
transferred, thus incurring transfer fees. If a tourism company is multinational,
payments may be recorded in the country of visitor origin rather than in the
destination country, thereby reducing profits and taxes in the destination
country. Moreover, purchases by a foreign-owned hotel within the host
country may be made from a foreign-owned subsidiary at inflated rates to
reduce the taxable income in the destination country. The use of credit cards
and traveler‘s cheques means that local banks are not able to participate in the
exchange rate.
6) Sixth, foreign exchange earnings will decrease when the import content for
tourism is very high, especially for small countries and island nations. Some
small-island nations may have import contents for tourism of over 50 percent.

40
A study by Lejarraga and Walkenhorst (2010) found that countries should
seek to maximize the linkage and minimize the leakage of the tourism economy
because maximizing linkages would lead to many benefits. Furthermore,
minimizing leakages would imply that the tourism economy will become self-
sufficient to fulfill visitors‘ needs.
A study entitled ―The calculation approach for leakages of international
tourism receipts: the Turkish case‖ was undertaken by Unluonen, et. al. (2011).
The study was based upon the Tourism Satellite Accounts (TSA), Input-Output
Tables (IOTs) and data from the State Institute of Statistics (SIS) in Turkey over a
five year period. It was found that the proportion of tourism income leakage in
1996 in Turkey was about 38.5%, the proportion of import leakage in
international tourism income was 10.3%, and the proportion of delayed leakages
in international tourism income was 28.2%. In addition, Unluonen, et. al. (2011)
say that savings delay the transformation of new economic values into investment.
Moreover, they agree that although taxes decrease the economic impact of new
dollars, they can be spent later. Finally, they pointed out that when savings and
taxes are compared, import inputs were the most important leakage items, because
import includes expenditures that flow out from the local or national economy.
Estimation of tourism leakage has also been reported by UNEP. In
Thailand, tourism leakage was estimated at about 70%. It means that much of the
money spent by tourists ended up leaving Thailand via foreign-owned tour
operators, airlines, hotels, imported drinks and food, etc. Estimations for other
third world countries were found to range from 80% in the Caribbean to 40% in
41
India. The average import-related leakage for most developing countries was
between 40% and 50% of gross tourism earnings for small economies, and
between 10% and 20% for most advanced and diversified economies (cited in
UNEP),(http://www.unep.fr/scp/tourism/sustain/impacts/economic/negative.htm).
UNWTO (2011) has estimated that on average 55% of gross tourism
revenue received by developing countries leaks out, but in some cases leakage has
reached as high as 90%. As reported by Ryan (1991), only a third of the total
tourism revenue of US$3.3 billion in Caribbean countries in 1979 stayed in the
region. In the island of St. Lucia in the Caribbean, 58% of food and 82% of meat
consumed by tourists were imported. In Fiji, just 20% of tourist revenue was
retained in its economy in the same year. Meanwhile, Dwyer and Forsyth (1994)
estimated that the gross revenue from a package tour accruing to foreign owners
of facilities in Australia was about 44% of total tourist expenditures.
According to Meyer (2007), leakage tends to be highest when the local
destination economy is weak and lacks the quantity and quality of inputs required
by the tourism industry. He said that the prevailing trend in many developing
countries is to depend heavily on imports. Therefore, attempts have been made to
reduce leakage by developing stronger links between tourism and other sectors in
the local economy. He added that government policy needs to concentrate on
strengthening the economic linkages between tourism and agriculture to support
import substitution.
Although it is argued that the tourism industry is well positioned to create
high direct, indirect and induced economic impact, several authors have reported

42
that the multiplier effects of tourism are often considerably less than expected due
to high investment costs (a high dependency on foreign capital, skill, and
management personnel, as well as import) (Pavaskar, 1987). Karagiannes (2004)
cited in Meyer (2007) supports this argument that the import content and the size
of the tourism multipliers are inversely related, so countries with high leakage rate
tend to end up with small multipliers and relatively insignificant effects from
tourist spending. He said that there were several reasons for this. First, small
economies, in particular small island developing states, tend to rely strongly on
imports, because they do not have the capacity to produce the goods and services
that are required to meet the demands of the industry. Larger states, on the other
hand, that do not often face these resource constraints, can develop stronger inter-
sectoral linkages between tourism and the rest of the domestic economy. Second,
many developing countries that do not have well-developed domestic industries,
develop stronger inter-sectoral linkages within the economy, which provides the
platform for the efficient distribution of goods and services, and allows domestic
industries to try to compete successfully with their overseas business partners
(Karagiannes, 2004 cited in Meyer, 2007).
Lundberg, et. al. (1991) concluded that leaks out of the destination
economy depend in large part on how the tourist receipts are re-spent within the
economy. The more receipts are re-spent within the local economy, the smaller
the leakage and the higher the multiplier will be. For developing countries at their
initial stage of tourism development, financial, structural and operational supports
from foreign countries are indispensable. Therefore, tourism leakage is thus
43
unavoidable. Rapid tourism development in a developing country is often
accompanied by a drastic rise in leakage.
Davidson (1993) defines tourism leakage as tourism profits drained away
from the local economy to other countries. In reality, tourism profits are rarely
kept in a local economy for over a year. If deposited into local banks as savings,
they will be lent to other spenders or investors shortly and re-circulated in the
economy. Furthermore, he defines a wider range of tourism leakage by pointing
out four common forms of leakage:
(i) The construction materials for tourism infrastructures are imported from
other countries;
(ii) The profits from tourism operation leak abroad to the owners of tourist
facilities;
(iii) Imports of food, drink, and manufactured goods to meet the demand of
inflexible tourists; and
(iv) Wages paid to foreign workers and not spent in the local economy.
The definition of tourism leakage proposed by Davidson (1993) implies
that tourism leakage is associated with three types of activities in tourism
development: (i) Financing activity, such as profits reaped by foreign owners and
repatriated to foreign countries; (ii) Construction activity, such as imports of
building materials for the construction of tourism infrastructures; and (iii)
Operating activity, such as imports of food, drink, and foreign labour to facilitate
tourism transactions. Based on the activities involved in international tourism,
tourism leakage can be classified into three categories (Davidson, 1993):

44
(i) Structural leakage that occurs due to the imports of construction materials
and technologies in establishing tourism infrastructures.
(ii) Operational leakage caused by imports of foreign goods, services, and
managerial skills necessary for the daily operation of the tourism industry.
It is noted that much of the tourism revenue leaks out of developing
countries in the form of imports and salaries for skilled foreign workers
who occupy managerial and technical positions in the industry.
(iii) Financial leakage. This is the return to foreign capital providers in the
form of profits, dividends, and interests repatriated to capital originating
countries. Foreign capital providers can be tourism venture owners,
partners, stockholders, and creditors.
Harrison (1992) agrees with Davidson‘s finding that financial leakage
refers to profits repatriation as capital leakage. The impact of the financial leakage
on a developing country can be greater than that of the other two categories of
leakage. Structural and operational leakages may be short-term if imports are
foreign commodities. In contrast, financial leakage can have a long-lasting impact
on the local economy because the returns to foreign capital providers are
repetitive at constant intervals—monthly, quarterly, or annually - and over a much
longer time. If foreign capital is provided in the form of equity financing, the
leakage can be permanent. The amount of financial tourism leakage can be
significant.
45
2.7 Minimizing Leakages in order to Optimize Tourism Benefits
It is crucially important to reduce leakage in order to increase the
economic benefits of tourism in a destination, because leakage leads to a decrease
in the multiplier effects of tourism, as Unluonen, et. al. (2011) say as follows:
“ …Leakage is convinced as one cause of unbalanced economic distributions and
to limit the positive impacts of tourists’ expenditures on a destination. Increase
in leakage results in decrease in multiplier effects that reflect the amount of
income generated by a unit tourist spending and show the capacity of the tourism
industry to create income. The success in minimizing leakage will increase
economic development in a destination...”(Unluonen, et. al., 2011)
Furthermore, Dwyer and Forsyth (1994) say that a tourism multiplier is a ratio
measuring the triple effects of tourist spending on the local economy. A higher
multiplier suggests a greater augmentative impact of tourist expenditure on he
local economy. Bull (1991) observed tourism multipliers ranging from 2.5 (in
Canada) to 0.8 (in the Bahamas). He found that large diversified economies tend
to have large multipliers, while developing countries and small island states tend
to have smaller multipliers because of considerable leakages. Furthermore, Kim
and Jamal (2007) reported that tourism income multipliers were 1.96 (in Turkey)
and 0.39 (in Western Samoa). The tourism leakage weakens the tourism
multiplier. Lundberg, et. al. (1991) also stated a similar point of view, is that a
decrease in multiplier leads to a decrease in tourism benefit in economic
development.
To gain economic benefits from tourism, according to a study by Zheng
(2011), successful tourism development minimized three types of tourism leakage,
namely financial, structural and operational leakage. Meanwhile, a study done by
Lacher and Nepal (2010) found that the diversity of the levels of leakage in three
46
different villages indicated that by using proper strategies the villages can reduce
economic leakage, increase local economic development, distribute tourism
income throughout the region and turn more local residents into stakeholders in
the tourism industry. Lacher and Nepal (2010) say that:
“ … leakage can be reduced in a number of different ways, and that villages
attempting to implement a strategy should focus on creating a strategy that suits
their unique conditions …” (Lacher and Nepal, 2010:94).
Moreover, Lacher and Nepal (2010) has also found that by using precise
strategies based on the authenticity of a destination, economic leakage can be
reduced, economic development improved, distribution balanced in all sectors,
and community participation in tourism development improved. A similar
argument is put forward by Ashley, et. al. (2006) as cited below:
“….making tourism more suitable can create stronger linkage with the local economy,
increasing local development potential, particularly purchasing directly from local
business, recruiting and training local unskilled and semi-skilled staff, entering into
neighbourhood partnerships to make the local social environment a better place to live,
work and visit for all as well as the ability to improve the local natural environment
within its areas of direct and indirect influence …” (Ashley, et. al., 2006:421).
Mill and Morrison (2009) also suggest strategies for minimizing leakage,
as follows:
1) Encourage the use of local products as substitutes for imported ones.
The reason for imported products entering a destination is the incapability of
that destination to produce products which fulfill the standard of quality
required by tourists. The role of government is important in encouraging the
use of local products, while research and development is needed in order to
improve product quality.

47
2) Increase export performance in primary industry
This is crucial, especially for industries such as art and handicraft production.
It can be done though providing subsidies, such as by giving special low
interest loans to the craftsman.
3) Implement an incentive program to develop infrastructure using traditional
architectural concepts and to encourage the use of local and indigenous goods
and materials.
4) Undertake effective and efficient negotiations with multinational companies
dealing with travel agencies and tour operators.
5) Reduce the use of imported food, goods and materials and encourage tourists
to enjoy the traditional and unique characteristics of a destination, including
its foods and beverages, its architecture and interior design.
6) Encourage cultural tourism so that tourists come to a destination with the
purpose of understanding its authentic cultural concepts.
7) Promote appreciation of local products.
The effective use of local employees is certain to reduce leakage, say
Hemmati and Koehler (2000, cited in Zheng, 2011). They also observe that the
capabilities of local employees are generally low in terms of education, work
experience and the ability to communicate. Therefore, the tourism industry uses
educated employees for special positions in management. The majority of
employees in their study were local employees with a really low level of work
experience and receiving a salary under the minimum standard, whereas overseas
48
employees had a better rate of salary as a result of their better education, work
experience and excellent ability to communicate.
It seems that leakage in Bali tourism is also significant with some portion
of tourism expenditures estimated to leak outside Bali. As an example, substantial
profits have been transferred overseas or to regions outside Bali because many of
the owners of tourism accommodations are either foreigners or Indonesians living
outside Bali .
2.8 Previous Studies Related to Perceptions and Preferences
A study by Davis (2003) on Traveler Perceptions of a Destination found
that in the summer season visitors had a different orientation regarding outdoor
activities, consumption patterns and preferences. Some visitors were more
interested in physical activities, preferring outdoor attractions such as beaches,
landscape, cultural attractions and city entertainment. Other groups of visitors
tended to focus on environment sense and the softness of culture. It can be seen
from this research that actions taken as a result of preferences and choices are an
expression of the visitors‘ perceptions.
Haemon (1999) stated that a study on costumer preferences must be
focused on an integrated framework and understanding of the consumer‘s decision
making process, especially as regards customer value as this is an important
variable that needs to be focused on due to its effect on services quality and
customer satisfaction and vice versa. He added that service quality can be a
mediator between perceptions and a customer‘s satisfaction.
49
Andriotis (2005) carried out his study on ―Community Groups'
Perceptions and Preferences for Tourism Development: Evidence from Crete‖.
The results showed that the community‘s support and choices are really important.
Three groups expressed a high degree of positivity toward tourism and tourism
development, although there were some differences in their agreement regarding
the types of tourists, facilities, and actions which are considered beneficial for the
island.
Goodrich (1978) found that preferences for (choice of) tourist destinations
are largely dependent on the favorableness of a person‘s perceptions of those
destinations. The more favorable the perception is, the greater the likelihood of
choice becomes. He said that there are three main implications of his study, two
are marketing-related and one is methodological. The first marketing implication
for tourism marketers is that they should always try to develop favorable images
of their respective tourist areas in order to enhance tourists‘ choice of (preference
for) those areas as imaginative destinations. These images can be developed
through advertising of the unique and diverse tourism facilities of a given area or
through development of these and other tourist attracting facilities. The second
marketing implication is that the diagnosis of a destination‘s strengths and
weaknesses with regard to relevant tourism attributes is helpful in making specific
changes, additions, or modifications in the tourism facilities of that destination
and also in its marketing support.
Badaruddin and Mageswari (2010) conducted a study on Perception of
Domestic Tourist on Tourism Products in Penang Island. It was found that

50
tourism image is a direct antecedent of perceived quality, satisfaction and tourist
behaviour. Perceived quality has a positive influence on satisfaction which
determines the domestic tourists‘ behavior.
2.9 The Role of Marketing in Sustainable Tourism Development
Marketing orientation still dominates today‘s marketing activities that
marketers determine customers‘ needs and wants, and develop products and
segmentation strategies accordingly. For many years, the definition of marketing
was:
“ ...the process of planning and executing the conception, pricing,
promotion, and distribution of ideas, goods, and services to create
exchanges that satisfy individual and organizational objectives..” (American Marketing Organization, 2004). Since the last 30 years, attempts for a more social approach have emerged.
While previous definitions, philosophies, and applications have been confusing,
the need to recognize society at large, customer relationships, and extended
marketing activities resulted in revising definition of marketing as:
“ ... Marketing is an organizational function and a set of processes for
creating, communicating, and delivering value to customers and for
managing customer relationships in ways that benefit the organization and
its stakeholders ... (Keefe, 2004). The final definition focuses on more broad beneficiaries of marketing, and
an extension of marketing activities from designing the marketing mix towards
more relationship management and the focus on values. However, collaboration
with customers and partners has not been practicing (Jamrozy, 2007). He
proposed an alternative model which attempts to understand and structurally

51
differentiate alternative views on marketing, and, based on an integrated macro-
marketing perspective, called Sustainable Tourism Marketing Management
(STMM) which is focused on marketing from a production and sales orientation
towards a more consumer-oriented marketing approach that is societal, causal,
environmental, green, relationship, quality of life, and sustainable marketing
approaches. Societal marketing develop as an extension of the production,
selling, and consumer orientation, considering not only consumer satisfaction but
also expanding it towards ―society‘s well being‖ and defines as :
... the obligation of marketing organizations to do no harm to the social
environment and, wherever possible, to use their skills and resources to
enhance that environment...” (Kotler and Armstrong, 1990).
The social responsibility of the marketer to do no harm, and to enhance the social
environment.
Societal Marketing. In tourism, several research studies explore social
marketing as societal marketing approach. Bright (2000) examines the role of
social marketing in leisure and recreation, questioning if social marketing
primarily influences the acceptance of a social idea or if it is marketing of tourism
an application of commercial marketing techniques in a public environment,
arguing that individual and social well being should be the driver for marketing
activities. Dinan and Sargeant (2000) point out how a promotional campaign
provides behavioral codes for tourism and therefore encourages behavior that
benefits society at large. The author draws the relationship to sustainable tourism,
while specific segments can be targeted, behavioral change accomplished, and the
environment is more likely to stay protected. In addition, Wearing and Archer

52
(2000) and King et al. (2000) examine marketing planning frameworks for
sensitive areas. Beyond environmental protection, they argue for integrated
planning and marketing control by the park and community, emphasizing the
network of actors in the tourism system. Moreover, Wheeler (1993) examines the
potential conflict of accountability and social responsibility of tourism marketers
in local government. Her case study stressed the ethical dilemmas among
organizational goals, individual goals and marketing professional goals, should
the marketer engage in environmental, traditional or social marketing. Even
though most destination or state tourism agencies work as non-profit agencies,
their accountability is measured in economic impact, employment, and visitor
statistics. All these studies address the importance of social responsibility, and the
interaction of environmental and economic accountability for all social groups.
Beyond the ―no harm‖ approach, societal tourism marketing can actively
communicate tourism‘s benefits to society and promote understanding of social
equity and issues through tourism.
Economical Marketing. The economic-marketing approach considers
natural, social, and cultural environments externalities. Most of the planning,
development and implementation strategies in tourism marketing follow the
economic paradigm. Tourism is perceived as an economic activity rather than a
living system. Examples include finding effective segmentation strategies,
measuring accountability for advertising expenses and maximizing satisfaction
and tourists‘ expenditures. Relationship marketing strategy creates closer and
more personal company/consumer relationships, but also strives for more loyal

53
and therefore more consuming customers. While economically communities can
certainly be a goal in tourism, it is suggested that a shift in paradigm to integrate
social and environmental goals (Jamrozy, 2007).
Environmental marketing. The American Marketing Association does not
specifically define environmental marketing, but it establishes that environmental
impact analysis is the assessment of the impact of a strategy or the decision on the
environment, especially the ecological consequences of the strategy or decision.
This statement emphasizes the responsibility of the marketer to do no harm
environmentally. However, environmental, green, ecological, and sustainable
marketing efforts go beyond a resource protection approach and additionally focus
on environmentally safe products and production, recycling and reuse. Marketing
of tourism challenge of sustainable marketing to be accepted, because it involves a
different way of looking at marketing, its objectives, and its strategies that goes
beyond societal marketing (Kilbourne, 1998; Peattie, 1999). In addition, Jamrozy
(2007 give his argument that tourism supports the environmental marketing
relates to product development and protection, when the local tourism industry is
dependent on its natural resources for developing experiences an activities.
Environmental marketing is also practiced when the hospitality and attraction
industries favor recycling, energy savings, and other environmentally conscious
activities. Environmental marketing can go a step further when creating a new
environmental consciousness that promotes preservation and conservation in the
future. A variation of environmental marketing is the ―green‖ marketing concept,
however, green marketing also presents a consumer-oriented strategy. In this case,
54
it makes economic sense to target the green consumer who has a need for green
products. Often, ecotourism marketing is adopting this approach, specifically
when marketing to the exclusive ecotourist. Ecolabeling then establishes the
branding practice within the economic marketing paradigm. In numerous cases,
managers use ecotourism and sustainable tourism interchangeably due to their
emphases on environmental protection. However, while the focus of ecotourism
lies within natural resource protection, experiences, and education in the natural
environment (including cultural resources), sustainability refers to more inclusive
issues (social equity, economic viability, and environmental protection) as well as
diversified resources (Jamrozy, 2007; Kilbourne, 1998 and Peattie, 1999).
Sustainable Tourism Marketing. Sustainable Tourism Marketing Model
(STMM) proposed by Jamrozy (2007) reflects to the sustainable development
principles based on the Brundtland Report (WCED, 1987). The key to achieving
moral implications are environmental health, economic viability, and social
equity. While tourism management has adopted the concept of sustainability, the
traditional consumer marketing perspective is still based on a classic economic
paradigm, in which maximizing profits is the goal of most means. The represents
the three dimensions of sustainability, economic viability, social equity and
environmental protection. The model does not require a complete balance of
objectives, but relies on the ecological living system theory, and the imperative
that do not destroy the system‘s potential for change, adaptability, and creativity.
Representing the social equity principle, the societal marketing approach often
considers impacts of tourism on the host community and favors socially
55
responsible actions. Often non profit agencies would promote societal goal, for
example, to provide benefits to all residents in a destination community.
Environment, in addition, promote healthy connected environments, based on
protecting the natural and cultural resources. Marketing would not promote the
use of resources, but preservation and pro-environmental behaviors. The ultimate
goal would be to promote an understanding that human beings are part of this
interrelated living system.
The sustainable marketing orientation does not satisfy the needs and wants
of individuals but strives to sustain living systems and benefits are not profit
oriented but save the energy and diversity, and competition is replaced by
dynamically balance. The paradigm shift suggests moving the objectives of
tourism marketing from offering satisfying and profitable tourism experiences
towards sustaining living systems. The community is a living system for residents
and visitors, tourism experiences enhance the quality of life for the residents,
communicate diversity and differences in life style and environment, and
contribute to the understanding and appreciation between visitors and hosts. The
fundamental shift is to market tourism not as a leisure product but as an
experience that enhances quality of life, not just for the individual participants, but
for living systems such as human including guests and the hosts. The tourism
system is not limited to demand and supply but a system of synergetic
components. Tourism experiences do not add to the quality of life but are part of
living system communities.
56
Green tourism marketing suggests that there is a shift in tourism marketing
paradigm from economic profit priorities toward sustainability. The sustainability
approach adopts a holistic, integrated view of marketing, considering social
equity, environmental protection, and economic viability. The paradigm shift
naturally occurs by tracing the evolution of marketing approaches from
production, sales, and a consumer orientation toward marketing alternatives such
as societal, green, responsible, and relationship marketing (Jamrozy, 2007).
Green tourism marketing model integrates tourism into a larger holistic context
and focuses on quality of life for all stakeholders in the system. Towards
sustainable tourism in Bali, it is important to implement the seven Ps of the
marketing mix in the tourism industry in Bali, namely tourism product, price,
promotion, place, people/participation, process and physical evidence through
integrated green tourism marketing. It will results in not only tourist‘s satisfaction
but also expanding it towards society‘s well being.
Indicator of Sustainability of Marketing Mix
In sociocultural term, how does the marketing mix element demonstrate
respect for the sociocultural authenticity of host communities, conserve their built
and living cultural heritage and traditional values, and contribute to inter-cultural
understanding and tolerance. In environmental term, how does the marketing mix
element make optimal use of environmental resources, maintain essential
ecological processes and help to conserve natural heritage and biodiversity?
Meanwhile, in economic: How does the marketing mix elements ensure othe
viable of the long-term economic operations; provide long-terms socioeconomic
57
benefits to all stakeholders that are fairly distributed, including stable employment
and income-earning opportunities and social services to host communities; and
contribute to poverty alleviation. The elements of the marketing mix are captured
in the core values of the organisation, reflecting the nature of its relationships with
key stakeholders, such as suppliers, consumers, employees, host communities and
the environment. These relationships signal the degree of the organisation‘s
sustainability orientation.
Marketing mix in tourism and hospitality consist of seven Ps which is
accommodated as the expansion of the marketing mix of products developed by
Kotler (1991) that originally consists of 4 (four) Ps namely product, price,
promotion and distribution. Three additional elements of Ps proposed by Reid,
et al. (2010) was added which consists of people, process and physical evidence as
the marketing mix of service and hospitality (Reid, et al., 2010).
Product is anything that can be offered to a market to satisfy wants or
needs (Kotler & Keller, 2006). In tourism, the destination might be the product,
made up of private and public goods, or it might be the industry element, such as
an attraction, accommodation service or tour operator. The marketer‘s level of
control over the public element of the product will more limited relative to the
private element. The host community may form part of the tourism product and
impose some obligation on the tourism manager to work to ensure its
collaboration rather than confrontation.
Price is the money charged for the product‘s consumption; it can influence
demand and is therefore important in managing capacity use by helping to balance

58
load and is also a key positioning factor, influencing how the product, or brand, is
thought of by the consumer relative to the competition (Kotler & Keller,
2006).While premium prices might be attained by niche sustainable tourism
products, price rarely captures the full cost of the product‘s negative externalities.
Gȍssling et. al., (2009) give an example on airlines that invite passengers to
voluntarily offset the carbon produced by their travel by adding to the price of
their original ticket, but low subscription rates for such offset programmes
essentially mean that the cost to the physical environment is not paid in full.
Promotion is the means by which firms attempt to inform, persuade, and
remind consumers, directly or indirectly about the products and brands that they
sell (Kotler & Keller). Marketing communications also represent the brand‘s voice
and allow it to build relationships with customers (Kotler & Keller, 2006). Belz
and Peattie suggest a dual focus for sustainability marketing communications: to
communicate with the consumer about the sustainability solutions the company
provides through its products, and to communicate with the consumer and other
stakeholders about the company as a whole. A third focus, however, is the mode
of promotion; while attention is paid to reducing environmental and sociocultural
impacts in some areas of the organisation‘s operations, the means by which this is
communicated to key audiences. Belz and Peattie (2009) give an example: the
lengthy, full-colour brochures that appears wiithout sustainability considerations.
A recent increase in online communications and interactive sales promotions,
while growth in the use of social media is also assisting relationship building.

59
Place, formally marketing channels, is the range of independent
organizations involved in the process of making a product or service available for
use or consumption (Kotler & Keller, 2006). In the context of tourism, these
organisations add value along the value chain from origin to destination and
include the firms and organisations that make up the industry element of Lieper‘s
(1979) tourism system, such as destination marketing organisations, retail travel
agencies, tour wholesalers, transportation providers, accommodation providers
and attractions. As noted already, these organisations might, in producing
consumer value, also add ecological or sociocultural harm.
People (residents) and participants (tourists) include all human actors
who play a part in service delivery and thus influence the buyer‘s perceptions:
namely the firm‘s personnel, the customer, and other customers in the service
environment. Collaborative efforts need to be improved the physical and social
environments (Zeithaml, et. al., 2006). Langeard et. al., (1981) highlight the role
of human resource management and the notion of the customer mix as key sukses
in the service offering. The concept of the customer mix, important for managing
service performance outcomes for different consumers with varying needs and
wants who are simultaneously present in a service delivery environment, such as a
hotel or destination. The view of customers as co-producers of the tourism
service (Booms & Bitner, 1981) highlights the need for tourism consumers, as
with employees, to be carefully selected, educated and managed. Marketing
traditionally undertakes these customer-management roles through targeting
appropriate consumer segments and communicating the organisation‘s
60
expectations through various marketing communications techniques. Although the
term People is now commonly used in Services Marketing literatures, we prefer to
use Booms and Bitner‘s (1981) original term, Participants, in order to distinguish
customers and employees from the oft-used People to refer to the broader
communities, or society at large, of the triple bottom line.
Process describes how the service is assembled, the actual procedures,
mechanisms, and flow of activities by which the service is delivered (Zeithaml, et.
al., 2006, p. 27). In the tourism context, process might describe such activities as
follows: a move away from paper-based to digital booking and account
management systems; production of alternative energy forms, such as solar or
wind; management of the supply chain for food and beverages, and labour; the use
of low-carbon emission transportation modes, such as hybrid- or electric-engine
vehicles, for moving visitors to, within and from a destination; and having
effective use-minimisation and recycling systems in place, particularly in
environmentally precarious locations, such as islands, and protected areas.
Physical evidence consists of the environment in which the service is
delivered and where the firm and customer interact, and any tangible components
that facilitate performance or communication of the service‖ (Zeithaml, et. al.,
2006, p. 27). The important role of this element on both employees and consumers
is highlighted in the concept of the service which has multiple functions,
including providing employees and customers to move within, deliver and
consume the service performance efficiently, respectively, and importantly to
communicate with customers. In terms of sustainability, this communication
61
might involve the organisation‘s sustainability values, policies and procedures and
what is expected of the customer, particularly as a co-producer of the service
experience.
The Nature of Country of Origin
Country of origin is one of the most important factors affecting
competitive market. Studies show that country of origin is one of the factors that
most concerned by marketers as indicator of quality and respect of its impact on
consumer purchase intention (Ghazali, et. al., 2008); Lin, & C.S Chen, 2006 and
Roth & Diamantopoulos, 2009). Although there are many parameters considered
by consumers when decide to buy something, such as brand, colour and design,
some researchers cannot ignore country of origin as an extrinsic factors in
evaluating products. Country of origin is closely linked to country image. The
earliest definition of country image comes from the pioneer, who defined it as the
picture, the reputation, the stereotype that businessmen and consumers attach to
products of a specific country. This image is created by such variables as
representative products, national characteristics, economic and political
background, history and traditions. Roth & Diamantopoulos (2009) reveal that
country of origin is overall perception of consumers form of the products from a
particular country, based on their prior perceptions of the country‘s production
and marketing strengths and weaknesses. Country of Origin is usually abbreviated
as ―COO‖, which refers to the country that manufactures, designs or assembles a
product or brand with which it is associated, meanwhile Geographical Origin
express overall perception of consumers about product from a particular (i)

62
consumer group, (ii) industry representatif, or (iii) island representatif (Lee & Lee,
2009). There are various factors that have an impact on country of origin cues
like product knowledge and country image. It has become a significant
phenomenon in consumer behaviour studies. Availability of heterogeneous food
product has been convinced that marketers need to understand customer‘
experience on attributes. According to Akerlof (1990) food labeling is viewed as
a critical mechanism to help ensure consumers to correctly match with products,
enable producers to adapt production to meet consumer demands and
expectations. Product labels is an important determinant to facilitate the resolution
of market failures associated with the supply of high-quality goods. One
particular category of labels that has recently received extensive attention among
trade representatives are "geographical origin" labels. Informing consumers of the
origin of food products via labeling is motivated by the recognition that
geography is often correlated with a product's overall quality or, in the stronger
case, geography may even be a determinant of a product's ultimate realized
quality (Lee & Lee, 2009).
Loureiro and McCluskey (2000) also reveal that Country of origin has
been identified an important cue that might be used by global marketers to
influence consumers‘ evaluation of the brand which effect on consumer‘
perceptions and purchase intention. The quality of agricultural products, consumer
groups, industry representatives, and domestic and trade representatives have
increasingly considered the potential role of geographical origin labels as
consumer information and marketing tools.
63
2.10 Conclusion
This chapter has reviewed some of the relevant literature on previous
studies by a number of experts, includng the role of marketing in sustainable
tourism development, indicator of sustainability of marketing mix and the nature
of country of origin. All of the above explanations will be useful in estimating
tourism leakage and generating a strategy to minimize tourism leakage in Bali.

64
64
CHAPTER III
RESEARCH FRAMEWORK AND CONCEPT
3.1 Introduction
This chapter discusses the research framework and concept of this study.
It begins with a discussion of the framework, followed by an examination of the
concepts used to support the analyses. The concepts used in this study include
sustainable tourism, tourism leakage, structure of SAM, accommodation in
tourism, perception and preference, and Interpretative Structural Modeling (ISM).
This is then followed by a list of the hypotheses tested during this research. This
chapter ends with a brief conclusion.
3.2 Framework of the Study
Tourism leakage has been found to cause a reduction in the tourism
benefits at a destination. Several experts say that an increase in leakage results in
a decrease in tourism multiplier effects (Bull, 1991; Mill and Morison, 2009).
Calculation of the percentage of leakage from tourist accommodation needs to be
undertaken in order to understand how tourists‟ expenditures could benefit Bali‟s
economy. The perceptions of foreign tourists in Bali also need to be assessed in
order to find out what exactly it is that foreign tourists need, whether they prefer
imported products or local products, as well as to assess their willingness to
contribute to the Balinese people by spending their money on local products. It is
also of vital importance to know the perceptions of hotel managers in order to get
their points of view regarding their exact preferences on products to be served to

66
3.3 Concepts
Based on the problem formulations and the objectives of the study, various
concepts were examined. In order to clarify the model and variables used for
calculating and evaluating tourism leakages in the accommodation sector in Bali,
definitions and terminologies related to the concept are explained as follow.
3.3.1 Sustainable Tourism
Sustainable tourism is defined by the World Trade Organization (1996) as:
“ ... holistic systems that meet the need of present tourists and host regions
while protecting and enhancing opportunities for the future as leading in
managing all of resources in such a way that economic, social and aesthetic
needs can be fulfilled while maintaining cultural integrity, essential
ecological processes, biological diversity and life support system...” (WTO,
1996: p.127).
The concept of sustainable tourism was formulated in order to follow up the
concept of sustainable development. The issues of sustainable development have
been widely acknowledged since its appearance in „Our Common Future‟
(WCED, 1987). Sustainable development is defined as:
" … development that meets the needs of the present without compromising
the ability of future generations to meet their own needs. The concept of
'needs' in particular the essential needs of the world's poor, to which
overriding priority should be given, and the idea of “limitations” imposed by
the state of technology and social organization on the environment's ability to
meet present and future needs...” (WCED, 1987). Sustainable development has been expressed as an adaptive process of change in
which the exploitation of resources, the direction of investment and the orientation
of technological development changes are made to meet the needs of present and
future generations for a better life. Moffat (1993) cited in Wiranatha and Dalem
(2010) summarizes components of sustainability as maintaining ecological
67
integrity and diversity, meeting basic human needs, keeping options open for the
future, reducing injustice and increasing self-determination. In terms of tourism
development, the concept of sustainable development, so called sustainable
tourism, could include three main aspects, namely: sustainability, education and
local participation. The aspect of sustainability should cover four ideas, namely it
should be environmentally friendly, socially responsible, culturally acceptable and
economically viable.
“Environmentally friendly” means to avoid or minimize the environmental
impact of tourist activities.
“Socially responsible” refers to the ability of the community to absorb input for
short or long periods of time, and to continue functioning either without the
creation of social disharmony as a result of these inputs or by adapting its
functions and relationships, so that the disharmony created can be alleviated or
mitigated.
“Culturally acceptable” refers to the ability of people to retain or adapt
elements of their culture which distinguish them from other people. Cultural
impacts are more easily seen over the long term and are therefore more
difficult to measure.
“Economically viable” refers to a level of economic gain from the activity
sufficient either to cover the cost any special measures taken to cater for the
tourist and to mitigate the effects of the tourist‟s presence or to offer an income
appropriate to the inconvenience caused to the local community visited -
without violating any other conditions - or both.

68
Sustainable tourism includes education for both tourists and hosts.
Education for tourists means to provide enlightenment to the tourists concerning
the cultural ways and norms of those people whom they are visiting. On the other
hand, education for hosts means to give training to the „hosts‟ so they are better
able to cater for the wishes of the tourists who visit them. Finally, sustainability
could be more comprehensive with local participation. Thus the hosts can obtain
direct benefits from tourists who visit their area (Martopo and Michelle, 1995
cited in Wiranatha and Dalem, 2010).
3.3.2 Tourism Leakage
In economic terms, leakage could be defined as losses from the national
income flows which have been generated during the transition from the
local/national consumption income cycle to the spending chain (Bull, 1991).
According to the United Nations Environmental Program (UNEP, 2010), there are
two main ways that leakage occurs namely import leakage and export leakage.
Import leakage occurs when tourists demand standards of equipment, food, and
other products that cannot be supplied by the host country, especially in less-
developed countries. Food and drinks must often be imported, since local
products cannot fulfill the standards set by the hotel, or the host country does not
have a supplying industry. Much of the income from tourist expenditures leaves
the country again to pay for these imports. Moreover, export leakage arises when
overseas investors who finance the resorts and hotels take their profits back to
their country of origin (www.unep.fr/scp/tourism/sustain/impacts/economic
/negative.htm).
69
Tourism leakage, in its general meaning, is the part of the tourist
expenditure that leaks out of the economy of the host country. McIntosh and
Goeldner (1995) define tourism leakage as a combination of imports and savings.
According to their definition, imports constitute tourism leakage because tourism
revenue is spent outside of the local economy to purchase imported goods and
services. On the other hand, earnings generated from tourism, if saved and not
loaned to other spenders within a year, are also regarded as leakage because they
will not further stimulate the local economy. However, Smith and Jenner (1992)
argue that tourism leakage occurs not only because of imports of capital goods
and consumables for the tourism industry but also because of debt interest and
equity profits repatriated to foreign countries by foreign individuals or companies.
Lejarraga and Walkenhorst (2010) state that tourism brings about several
impacts on the destination, namely primary (direct) and secondary (indirect and
induced) impacts (Figure 3.2). Direct impacts accumulate from initial tourist
spending in the tourism industry, such as on hotel accommodations, transportation
and entertainment. Indirect impacts are generated through purchases of goods and
services from non-tourist sectors of the local economy, such as food and
beverages, equipment, furniture and merchandise. Induced effects are attributable
to the increased income of wage-earners related to the tourism economy, such as
waiters, tour operators and construction workers, who in turn buy goods and
services in the general economy.
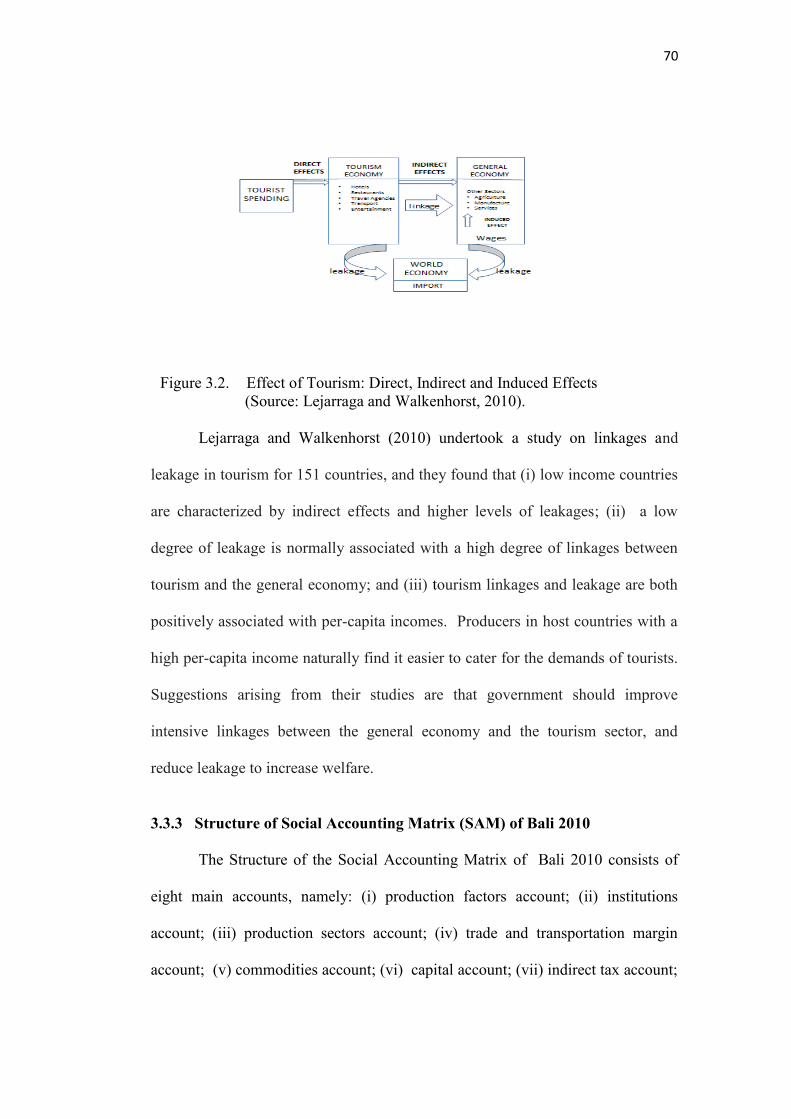
70
Figure 3.2. Effect of Tourism: Direct, Indirect and Induced Effects (Source: Lejarraga and Walkenhorst, 2010).
Lejarraga and Walkenhorst (2010) undertook a study on linkages and
leakage in tourism for 151 countries, and they found that (i) low income countries
are characterized by indirect effects and higher levels of leakages; (ii) a low
degree of leakage is normally associated with a high degree of linkages between
tourism and the general economy; and (iii) tourism linkages and leakage are both
positively associated with per-capita incomes. Producers in host countries with a
high per-capita income naturally find it easier to cater for the demands of tourists.
Suggestions arising from their studies are that government should improve
intensive linkages between the general economy and the tourism sector, and
reduce leakage to increase welfare.
3.3.3 Structure of Social Accounting Matrix (SAM) of Bali 2010
The Structure of the Social Accounting Matrix of Bali 2010 consists of
eight main accounts, namely: (i) production factors account; (ii) institutions
account; (iii) production sectors account; (iv) trade and transportation margin
account; (v) commodities account; (vi) capital account; (vii) indirect tax account;
71
and (viii) the foreign (Rest of the World) account. These main accounts are
extended into 63 accounts, namely: (i) 9 production factors accounts, comprising
8 labour accounts and one non labour account; (ii) 12 institution accounts,
comprising 10 household accounts, one companies account and one government
account; (iii) 19 production sectors accounts; (iv) one trade and transportation
margin ; (v) 19 commodity accounts; and (v) 3 exogenous accounts, comprising
one capital account, one indirect tax account and one foreign (Rest of the World)
account. The complete Social Accounting Matrix (SAM) Account of Bali 2010
which consists of 63 accounts can be seen in Appendix 2.2.
3.3.4 Accommodation in Tourism
Hospitality is the general term associated with both hotels and restaurants.
The term accommodation industry refers specifically to the lodging or hotel
industry, while the food and beverages industry refers to the catering industry.
These industries encompass a variety of facilities and are a dynamic part of the
global travel and tourism industry. Everywhere the traveler goes, a place to eat and
a place to stay are necessities. The accommodation industry represents a wide
range of lodging facilities from luxurious resorts to modest bed and breakfast
establishments. This range of facilities reflects the different needs and preferences
of travelers and market dynamics (WTO, 1997).
Classification of Accommodation
Accommodation can be classified into various categories, illustrating the
diversity of the industry. The wide array of available room types and amenities is
72
the reflection of an industry that must respond to various consumer needs,
including the social and business needs, of the travel market. Any attempt to
establish a uniform classification system faces the problem of differing types of
accommodations around the world. In 1962, The International Union of Official
Travel Organizations, a forerunner of the World Tourism Organization, attempted
to establish a globally uniform hotel classification system. Various attempts have
been made, but the obstacles to a uniform classification system include variations
in definitions, facilities, service standards, management and cultural influences on
service which can differ dramatically from country to country (Gee, 1994). While
many of the definitions used are similar in a global tourism market place, there are
differences among countries between commercial and official classifications
(WTO, 1997).
a. Hotels
The term “hotel” has assumed a generic meaning around the world
applying to a wide range of property types. According to WTO (1997), there is no
one way to classify the different types of hotels. In some countries, the key to the
property‟s type is based on its amenities identified by the descriptor preceeding
the word “hotel”. In general, these descriptors identify the target markets that the
property aims to attract such as airport hotel, convention hotel, commercial hotel,
luxury hotel, budget or economy hotel and resort hotel.
WTO (1997) added that hotels differ by amenities and the levels of service
offered. At the lowest level, budget motels tend to focus on cost-conscious
travelers as their target market. The overall goal of these establishments is to keep

73
costs down and pass the operational savings on to the customer. The limited
amenities offered vary from chain to chain, each attempting to establish a price-
value relationship in the consumers‟ minds.
b. Resort Properties and Time Shares
According to WTO (1997), resorts are found worldwide, wherever people
gather for activities as diverse as golf, tennis, spas, skiing, or a combination of
similar recreational activities. Because the resort guest is typically a longer stay
client, resort properties generally offer more activities and extended amenities
than urban hotels. Although many resort properties are surf-and-sun destinations,
resorts today are becoming more specialized (WTO, 1997: 74).
Time shares, like resorts, tend to be located in popular tourist destinations.
Time shares basically are individually owned “hotel room interval” which allow
the owner to access generally upscale accommodations for a usually fixed period
of time each year. The attraction of time share accommodations is that they tend
to be more apartment style and may be a part of a hotel, resort, or condominium.
The arrangement is a permanent one unless the ownership share in the property is
disposed of. Increasingly, the properties are managed by specialized management
companies including several major international hotel management organizations
such as Marriott, Hilton Hotel Corporation and Disney (Travel and Tourism
Intelligence, 1997 cited in WTO, 1997).
c. The Casino/Destination Properties
The Casino/Destination Properties has long been recognized as a
specialized property with gaming as the central activity. The concept has been
74
well-known as accommodations which offer casinos, golf course, a jungle theme
park or other entertainment attractions as part of the large resort complex. These
properties function to a large degree as self-contained destinations which attempt
to keep the guest, including family members, at the property as much as possible.
To accomplish this, the resorts include extensive amenities and generally some
types of theme park which are part of the property. Although gaming remains
central, the extended amenities serve to capture more of the tourist expenditures
from all members of the family unit (WTO, 1997).
d. Bed and Breakfast
WTO (1997) said that bed and breakfast (B and B) runs the scale from
luxury to economy-type accommodations. The business of B and B becomes
more highly organized with many of the properties joining international
reservations systems. Other modest establishments which offer breakfast and
sometimes light meals include hotels and pensions which are often family-run
operations.
According to the Indonesian Law on Tourism, No. 14 / 2009,
accommodation businesses are part of the tourism industry. In Article no. 14.1
(f), it is stated that accommodation services include hotels, villas, motels, caravans
and any other type of accommodation intended for tourism. In this study, the
accommodation sectors in Bali which were chosen for sampling are classified
into: (i) non-star rated hotels; (ii) 1,2&3 star-rated hotels; (iii) 4&5 star-rated non-
chain hotels; and (iv) 4&5 star-rated chain hotels.
75
3.3.5 Stakeholders in Tourism
Tourists view a tourist destination as a whole that is composed of different
elements. It is a complex phenomenon and involves different parties which can
be viewed as stakeholders. The Stakeholder approach began in organizational
management and ethics. It was proposed by Freeman (1984) who suggested that
an organization is characterised by its relationship with various groups and
individuals. Freeman (1984) defined a stakeholder as:
“ ... Any group or individual who can affect or is affected by the achievement of
the organization’s objectives ...” (Freeman, 1984: p.46).
In tourism, Freeman (1984) states, stakeholders consist of tourists,
government, community, owners of the accommodations or services in tourism
industries, associations of tourism industries and experts who have experience in
the development of tourism. According to Donaldson & Preston (1995) and
Mitchell et. al. (1997), the above definition presents a very broad understanding of
a stakeholder and it allows almost anyone to be considered a stakeholder.
Freeman‟s definition has been narrowed by Clarkson (1995) who describes
stakeholders as “risk-bearers”. He argues that “without the element of risk there is
no stake”. Under these definitions however, stakeholders may include: persons,
groups, neighbours, organisations, institutions, societies and even the natural
environment (Mitchell et al., 1997).
Clarkson (1995) divided stakeholders into two groups: (i) primary
stakeholders i.e. those stakeholders without whose continuing participation the
organisation cannot survive as a going concern and (ii) secondary stakeholders i.e.
76
those stakeholders who influence or affect, or are influenced or affected by the
organization, but are not engaged in transactions with the organisation and are not
essential for its survival. Involvement of stakeholders is really important.
Clarkson (1995) found that failure to retain the participation of even a single
primary stakeholder group will result in the failure of that corporate system.
Freeman (1984) says that community participation is required in the
sustainable tourism development process. Mitchell et. al. (1997) suggest that
community participation is the very foundation of the sustainability paradigm.
However, community participation in tourism developmment can be a challenge
for decision makers, because community members may have a variety of
perceptions, attitudes and beliefs about tourism development. The community
may not speak with one unified voice, as the members may have different levels
of economic dependence on tourism or varying degrees of attachment to the
surrounding environments and culture.
3.3.6 The Complexity of Consumer Behaviour in Travelling
Tourist plays an important role in increasing the popularity of a
destination. Tourist behavior in choosing a destination has a significant
relationship to perception of tourists to destination (Goodrich, 1978; Solomon,
1999; Andriotis, 2005). Mechanisms in forming interaction between tourists and
destinations play an important role in creating a relationship between tourists and
destinations.
Study by Davis (2003) found that in the summer, visitors have a different
orientation in the tour. Some visitors concerned with physical attraction, prefer

77
outdoor sensations such as beach, landscape, cultural attractions and
entertainment. Other groups tend to focus on exploring the environment and
culture. It is suggested in his study that the process of innovation in the tourism
industry should be focused on better mechanisms to manage a destination. Oh
(1999) evaluates the service quality, customer satisfaction and loyaltas, that the
holistic management model must be applied in destination management.
Understanding the consumer decision making process which focuses on customer
value as a variable that is very important because of its strength rests on the
perception and selection on quality customer service and customer satisfaction. It
also said that the quality of service can be a mediator between perception and
customer choice.
Andriotis (2005) conducted a study on the perceptions and preferences of
the community in the development of tourism to boost local economies. The goal
is to determine whether the entrepreneur in the field of tourism and the local
population has a positive dependence on tourism development. Benchmarks used
in these studies is to use public perception as a guide in the development of future
tourism. The results showed that the perceptions and preferences of the public in
the area of tourism to boost the economy is really important. Three groups
expressed their perceptions exist at high levels positively to the development of
tourism, although there are some differences in their agreements relating to the
type and origin of tourists, facilities, and management models that are considered
beneficial to the area.
78
Goodrich (1978) conducted a study on the relationship between
perceptions and preferences on a destination. Studies demonstrate how the choice
of a tourist destination depends on the perception of the fun of these destinations.
The results showed that the higher the score, the higher the perception of choice
for the destination. The implication of this study is associated with the marketing
of a destination, where stakeholders (stakeholders) should seek to develop a
positive image of a destination in order to improve the tourist choice of areas that
became a tourist destination. Another implication is that the diagnosis of strengths
and weaknesses on attributes relevant tourism is very helpful in making changes
specifically related to the facilities and services in a destination.
Lin et al. (2012) say that recreation is an activity that is very interested in
their spare time to improve the quality of life. In modern society, sports is very
important to improve the experience of the different cultures and lifestyles as a
form of appreciation for the economic prosperity and progress in the field of
technology. Factors that affect tourist arrivals to a destination is a traveler motif,
features a destination, distance to destination and tourist perceptions of a
destination. Study on the relationship between consumer behavior to marketing an
amusement park in Taiwan concluded that consumer behavior has a positive
correlation to the perception of tourists in the marketing mix (marketing mix) at
the amusement park. Evaluation before making a visit to have a positive
relationship to the price. The relationship the highest found in the price (price) and
place (place). Among the demographic variables, sex (gender) have a significant
impact on consumer choice based on security, comfort and price level. Age and
79
area of residence has a significant relationship to consumer choice on pricing
strategies and marketing activities. This study suggests that attention to market
segments based on age, sex and area of residence, because it will affect consumer
behavior after carrying out payment transactions on the perceived quality of
service.
3.3.7 Determinants of Tourist Satisfaction on Destination 3.3.7.1 Perception and Preference
Perceptions and preferences are widely used in social research, especially
in consumer behavior, such as the study by Solomon (1999) which says that
perception is one of the psychological factors that are closely related to the
sensory system that plays an important role in influencing decision-making. This
response is an important part of the emotional aspects of the interaction of
consumers towards products. Moreover, Solomon (1999) defined perception as:
“....a process that occurs in the mind of consumer where the sensation is
selected, organized and intepreted while preference is a further expression
of the perception which is expressed in an action based on choice and
consumer interest. Action will be taken after going through a long process
in the minds of consumers...” Solomon (1999:43)
Meanwhile, Waite and Hawker (2009) define perception as:
“ ... ability to see, hear or be aware of something that express a particular
understanding as a process of perceiving…” (Waite and Hawker, 2009: 26).
Solomon (1999) adds that factors influence preference of consumers is consumer
insight about products or services, income, tastes or interests of consumers,
culture, and previous experience in consuming products and services. This
opinion is supported by Kim and Jamal (2007) which states that the perception is

80
the process by which a person chooses, organize and interpret information to
create a picture of what is seen and felt. Solomon (1999) explains that barrier to
receive marketing messages occur as a result of the limitations of brain to process
information, so that consumers are very selective about what they watch.
Perception has a very close relationship with the sensory system, whereby
external stimuli or sensory inputs can be received on a number of channels. The
inputs picked up by our five senses constitute the raw data that begin the
perceptual process. These responses are an important part of hedonic
consumption and the emotional aspects of consumers‟ interactions with a product.
The unique sensory quality of a product can play an important role in helping it to
stand out from the competition, especially if the brand creates unique associations
with that sensation.
Solomon (1999) points out that barriers to receiving marketing messages
arise as a result of the limitations in the brain‟s ability to process information, so
that consumers are very selective about what they pay attention to. The process of
perceptual selection means that people tend to be stimulated by only a small
portion of the stimuli to which they are exposed. Consumers practise a form of
“psychic economy”, picking and choosing among stimuli to avoid being
overwhelmed. In addition, they also practise “perceptional vigilance”, meaning
that they are more likely to be aware of stimuli that are related to their current
needs. The flip side of perceptual vigilance is “perceptual defense”. This means
that people see what they want to see and don‟t see what they don‟t want to see.
81
If a stimulus is threatening to us in some way, we may not process it or may
distort its meaning so that it becomes more acceptable.
Reisinger (2009) states that the degree to which consumers continue to
notice stimulus over time is known as “adaptation.” He says that the process of
adaptation occurs when consumers no longer pay attention to a stimulus because it
is so familiar. A consumer can become habituated and require increasingly
stronger “doses” of a stimulus for it to be noticed. Several factors can lead to
adaptation, namely intensity, duration, discrimination, exposure and relevance.
“Intensity” means that less intense stimuli are less likely to be noticed. “Duration”
refers to the length of exposure to the stimulus; stimuli that require a relatively
lengthy exposure time in order to be processed tend to habituate because they
require a long attention span. “Discrimination” relates to simple stimuli that tend
to habituate because they do not require attention to detail. “Exposure” refers to
the frequency of exposure; frequently encountered stimuli tend to habituate as the
rate of exposure increases.
Furthermore, Kim and Jamal (2007) state that perception is the process by
which an individual selects, organizes and interprets information to create a
meaningful picture of the world. Perception is one of the social and psychological
factors which, together with other factors such as personality, learning, motives
and attitudes, play an important role in influencing a person‟s travel decisions.
Preference represents a person‟s/customer‟s choices, their interests, likes
or dislikes. Action will be taken after a long process in the customer‟s mind.
Several factors have an effect on a customer‟s choices, such as income, taste,
82
culture, and previous experience. In addition, Solomon (1999) states that
preference is strongly affected by the customer‟s point of view, previous
experiences, culture, and income.
In this study, these concepts of perception are used to assess how the
perceptions of hotel owners/management are related to their points of view
regarding reduction in the use of imported goods and services as well as foreign
employees in their hotels. Furthermore, those concepts are also adapted to obtain
tourists‟ opinions about certain imported goods.
3.3.7.2 Motivation
Despite sharing equal degrees of satisfaction, tourists with different
personal features can report heterogeneous behaviour in terms of their loyalty to a
destination (Mittal and Kamakura, 2001). Motivation is defined as “ ... reasons
for acting or behaving in a particular way toward attaining a goal ...” (Khan,
1991). As a basic psychological feature, motivation stimulates an organism to act
towards a desired goal, controls and sustains a certain goal. It can be considered
as a driving force which psychologically reinforces an action toward a desired
goal (Bashar, 2010). Motivation is an internal factor that leads people to choose
and pursue certain goals and experiences (Higgins et al., 2003). Meanwhile,
motivation provides suggestions for increasing level of desire to learn effectively
includes interest, attention, relevance, confidence and satisfaction (Allesi and
Trollip, 1991). Regarding this study, motivation related to reasons to visit Bali as
a destination, which consists of vacation, visiting friends and relatives (VFR),
83
office task, MICE (Meeting, Incentive, Conference and Exhibition), business,
religious, education /research, health/beauty, and sport.
Motivations form the basis of the travel decision process and therefore
should also be considered when analysing destination loyalty intentions. Beerli
and Martín (2004) propose that “motivation is the need that drives an individual to
act in a certain way to achieve the desired satisfaction” (Beerli and Martín,
2004:626). Motivations can be intrinsic (push) or extrinsic (pull). Push
motivations correspond to a tourist‟s desire and emotional frame of mind. Pull
motivations represent the attributes of the destination to be visited. Yoon and
Uysal (2005) take tourist satisfaction to be a mediator variable between
motivations (pull and push) and destination loyalty. The effect of socio-
demographic variables in the tourist decision process is also an issue which has
received some attention. Some studies propose that age and level of education
influence the choice of destination (Woodside and Lysonski, 1989; Weaver et. al.,
1994; Zimmer et. al., 1995). Font (2000) shows that age, educational level,
nationality and occupation represent factors of motivation to travel.
Oliver (1999) states that loyalty is a construct that can be conceptualised
by several perspectives. Homburg and Giering (2001) measure the construct
“future behavioural intention” by using two indicators: the intention of repurchase
and the intention to provide positive recommendations. In tourism research,
similar approach is adopted and tourist loyalty intention is represented in terms of
the intention to revisit the destination and the willingness to recommend it to
friends and relatives (Oppermann, 2000; Bigné, et. al., 2001; Chen and Gursoy,

84
2001; Cai, et. al., 2003; Nininen, et. al., 2004; Petrick, 2001). Therefore, two
indicators, “revisiting intention” and “willingness to recommend” are used as
measures of destination loyalty intention.
3.3.7.3 Familiarity
Familiarity is a quality or condition for being familiar which is classified
into spatial proximity and expertise of the country (Bashar, 2010). Spatial
proximity describes proximity to an area, while country expertise is the
accumulation of a person‟s experience of the quality of a destination. In this
study, familiarity is related to the satisfaction of tourists during their visit in Bali.
It was based on “country of residence” (F1) which covers five continents namely
Europe, America, Australia, Africa, and Asia, while “large code of residence“
(F2) denotes the residential areas where they live, namely: Old Europe, North
Europe, East Europe, South Europe, USA, South America, Africa and Saudi
Arabia, Australia, Asia and Indonesia . Meanwhile, country expertise is the
accumulation of experience of the quality of a destination (Bashar, 2010). In this
study, it is measured in terms of „periodicity‟ in visiting Bali (F3) and “visit more
than 5 times” (F4). All of the above variables influence people‟s travel choices
(Reisinger, 2009). The emotional experience of foreign tourists is one of the
indicators which can be used to assess their level of satisfaction during their visit.
Previous experience influences people‟s decision to revisit a destination (Mill and
Morrison, 2009). This kind of experience was also assessed in this research.
85
3.3.7.4 Expectation
Expectantion is a cognitive process of motivation which based on the idea
that people believe there are relationships between the effort they have made, the
performance they achieve and the rewards they receive from their effort and
performance. People will be motivated if they believe that strong effort will lead
to good performance and good performance will lead to desired rewards
(Lunenborg, 2011). Expectancy theory is based on four assumptions (Pinder,
1987). The first assumption is that people join organizations with expectations
about their needs, motivations, and past experiences. These influence how
individuals react to the organization or activities. The second assumption is that an
individual‟s behavior is a result of conscious choice which means that people are
free to choose those behaviors suggested by their own expectancy calculations.
The third assumption is that people want different things from the organization
(experience, good salary, job security, advancement, and challenge), and the
fourth assumption is that people will choose among alternatives to optimize
outcomes for them personally. The expectancy theory based on these assumptions
has three key elements, namely expectancy, instrumentality, and valence. A
person is motivated to the degree that he or she believes that effort will lead to
acceptable performance. Performance will be rewarded and the value of the
rewards is highly positive (Pinder, 1987). In this chapter, expectation relates to
fulfilment of foreign tourists expectations regarding the whole trips in Bali.
86
3.3.8 Interpretative Structural Modeling (ISM)
Interpretative Structural Modeling (ISM) is one of the soft system
modeling that can be used in generating a model which are compossed by
complex issues and unclear elements to become a comprehensive sistematic and
structured model. Attri and Sharma (2013) define Interpretative Structural
Modeling (ISM) as:
“ ... a process aimed at assisting the human being to better understand
what someone believes and to recognize clearly what someone does not
know ...” (2013: 4).
As a well-established methodology through identifying relationships
among specific items and as an interactive learning process, ISM can also be used
in generating strategic planning, designing the process, financial decision making,
human resources, competitive analysis, ect. (Chidambaranathan, et.al., 2009).
ISM methodology suggests the use of expert opinions based on the various
management techniques such as brain storming in developing the contextual
relationship among a number of variables. So that, respondents involved in the
ISM program are experts who have capabilities and should thoroughly understand
the problems and identifying the nature of contextual relationships among the
various factors.
Stages in undertaking the ISM program are as follow (Attri and Sharma,
2013):
1. Identify the variables which are relevant to the problem or issue, and then
extends with a group problem-solving technique. In this stage, a contextually
relevant relationship is developed.

87
2. Generate a structural self-interaction matrix (SSIM) based on pairwise
comparison of variables. The SSIM is converted into a reachability matrix
(RM) and generate the structural model.
3. Identify the key factors that drive the system in various categories. Based on
their driver power and dependence power, the factors have been classified into
four categories, i.e. autonomous factors, linkage factors, dependent and
independent factors.
Details of the key factors are as follow:
a. Autonomous factors. These factors have weak driver power (DP) and weak
dependence power. They are relatively disconnected from the system, have
few links and may be very strong.
b. Linkage factors: These factors have strong driver power and strong
dependence power. These factors are unstable in any action and will have an
effect to the others.
c. Dependent factors. These factors have weak driver power but strong
dependence power.
d. Independent factors. These factors have strong driver power but weak
dependence power. A factor which has a very strong driver power called
the „key factor‟ falls into the category of independent or linkage factors.
Previous studies use the ISM approach is the study by Saxena et. al. (1990)
which identified the key variables using direct and indirect interrelationships
amongst the variables and presented the results of the application of ISM
88
methodology to the case of “Energy conservation in the Indian cement industry”.
The results of his study was generate a model to save the energy through energy
conservation.
Another study was undertaken by Qureshi et. al. (2007) which applied the
ISM approach to develop a model of key variables of logistics in outsourcing
relationships between shippers and logistics service providers and to study their
influence on the productivity and competitiveness of the shipper company. The
results indicate that ISM approach is very useful method in developing the model
in order to improve efficiency and productivity of logistic service providers.
3.4 Hypotheses
Based on the problem formulations, the following hypotheses have been
developed:
1) Tourism leakage exists in all types of accommodation in Bali.
2) Government subsidies and import reduction by the accommodation sector
have impacts on tourism leakage, job opportunities and income distribution.
3) Foreign tourists have a positive perception of local products.
4) Foreign tourists show a significant preference for local products.
5) Foreign tourists are willing to spend their money to benefit Balinese people.
6) There is a willingness on the part of hotel managers to reduce the use of
imported products and give the priority to local products.
7) By setting up an appropriate strategy, tourism leakage in the accommodation
sector can be minimized.

89
3.5 Conclusion
This chapter discusses how the framework of this study is generated and
supported by the concepts used in this study. It also identifies the variables that
are related to the concepts. Finally, it lists the hypotheses that relate to the
research problems.

90
PART II
RESEARCH METHODS, RESULTS AND DISCUSSION
91
CHAPTER IV
RESEARCH METHOD
4.1 Introduction
This research is designed using both quantitative and qualitative
approaches. Quantitative analyses were undertaken: (i) to calculate the amount of
tourism leakage from the accommodation sector in Bali at micro (industrial)
level; (ii) to calculate the amount of tourism leakage from the accommodation
sector in Bali at macro (provincial) level; (iii) to evaluate the possible impact of
government subsidies and import reduction by the accommodation sector on
tourism leakage, job opportunity and income distribution; and (iv) to evaluate the
perceptions and preferences of foreign tourists regarding imported and local
products as well as their willingness to spend their money to benefit Balinese
people. Qualitative analyses were undertaken: (i) to evaluate hotel managers‟
points of view regarding the use of imported and local products and their
willingness to reduce the purchase of imported products; and (ii) to develop a
strategy for minimizing tourism leakage based on Interpretative Structural
Modeling (ISM).
This chapter is organised into eight sections, namely:
(i) Section 1: introduction to this chapter.
(ii) Section 2 discusses how the micro analysis was conducted. It includes
information on the research locations and types of accommodation used in
this study, the time required for conducting the survey, the method of
92
sampling used to select hotels, the variables used in calculating tourism
leakage, as well as the formulae used in the micro analysis.
(iii) Section 3 discusses how the macro analysis was undertaken, the sources of
data used, and the formulae used in the macro analysis. This section also
explains the circular flow of tourist expenditure based on the Social
Accounting Matrix (SAM) of Bali Province 2010. How to calculate
tourism leakage based on the macro analysis is also discussed in this part.
(iv) Section 4 discusses how government subsidies together with the
participation of the tourism industry could reduce leakage, increase job
opportunity and improve income distribution, as calculated through the
use of simulations.
(v) Section 5 describes how foreign tourists‟ perceptions and preferences were
assessed, regarding imported and local products as well as the extent to
which they agreed that the money they spent was beneficial for Balinese
people.
(vi) Section 6 discusses how the research on hotel managers‟ points of view
was conducted. This investigated their views on imported and local
products as well as their willingness to reduce the use of imported products
and pay more attention to using local products in their hotels.
(vii) Section 7 discusses how Interpretative Structural Modeling (ISM) can be
designed to develop a strategy for minimizing tourism leakage in Bali.
(viii) This chapter ends with a brief conclusion.

93
4.2 Micro Analysis in Calculating Tourism Leakage from the Accommodation Sector
4.2.1 Research Location and Period of Research
Research for the micro analysis was undertaken at four main tourism
destinations in Bali Province, i.e. Kuta, Nusa Dua, Sanur and Ubud during the
period of April to June 2013. The locations for this research were selected
purposively on the basis that the above destinations are the main tourist
destinations in Bali (see Appendix 3.1).
4.2.2 Sample Design
The sample for this micro analysis was designed to calculate tourism
leakage from the accommodation sector as well as to obtain hotel managers‟
points of view regarding the use of imported and local products. The Probability
Proportional to Size (PPS) sampling method proposed by Kish (1965: 234) and
Yamane (1973) was applied in this research. Probability Proportional to Size
(PPS) is a sampling procedure under which the probability of a unit being
selected is proportional to the size of the ultimate unit. All units in the population
have the same probability of selection irrespective of the size of their cluster
(Kish,1965: 234; and Yamane, 1973).
Three clusters of accommodation were chosen, namely: (i) 1,2&3 Star-
rated hotels; (ii) 4&5 Star-rated hotels, both chain hotels and non-chain hotels;
and (iii) Non-star rated hotels. The formula proposed by Kish (1965: 234) and
Yamane (1973) is:
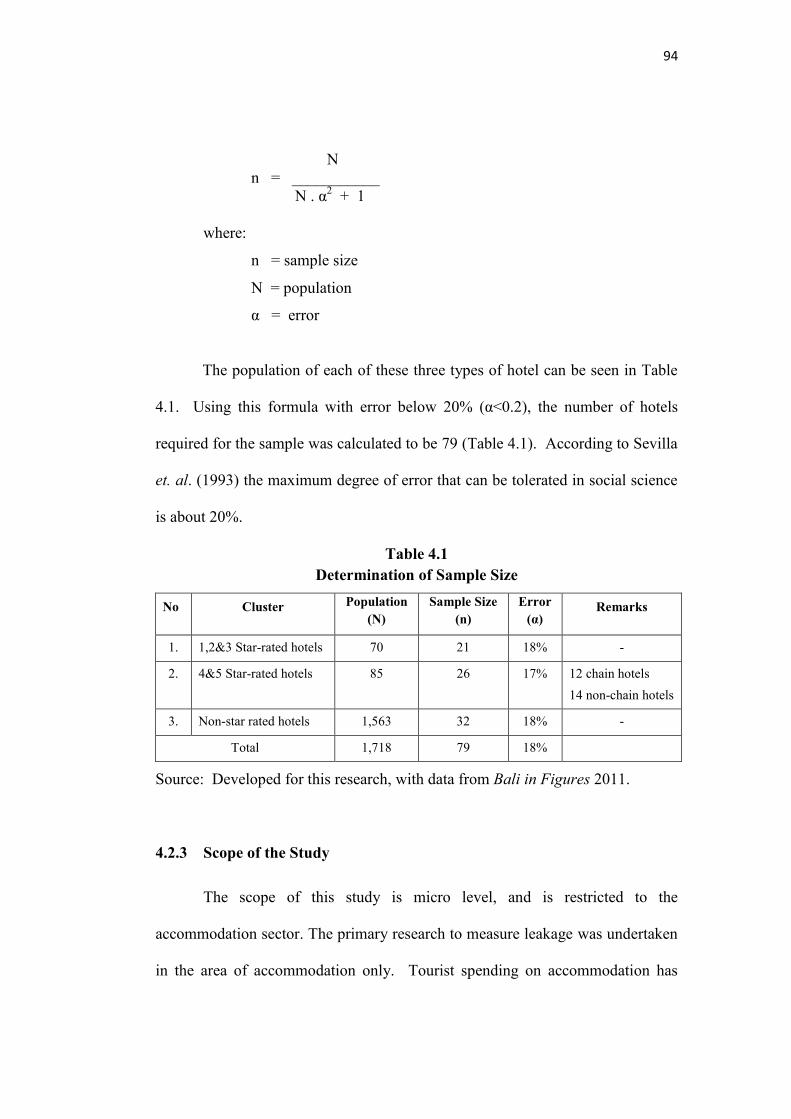
94
N n = ___________
N . α2 + 1 where:
n = sample size
N = population
α = error
The population of each of these three types of hotel can be seen in Table
4.1. Using this formula with error below 20% (α<0.2), the number of hotels
required for the sample was calculated to be 79 (Table 4.1). According to Sevilla
et. al. (1993) the maximum degree of error that can be tolerated in social science
is about 20%.
Table 4.1
Determination of Sample Size
No Cluster Population (N)
Sample Size (n)
Error (α)
Remarks
1. 1,2&3 Star-rated hotels 70 21 18% -
2. 4&5 Star-rated hotels 85 26 17% 12 chain hotels
14 non-chain hotels
3. Non-star rated hotels 1,563 32 18% -
Total 1,718 79 18%
Source: Developed for this research, with data from Bali in Figures 2011.
4.2.3 Scope of the Study
The scope of this study is micro level, and is restricted to the
accommodation sector. The primary research to measure leakage was undertaken
in the area of accommodation only. Tourist spending on accommodation has
95
been considered to be the highest in comparison to the other subsectors of
tourism. About 40.5% of foreign tourist spending and about 35.9% of domestic
tourist spending were received as payment for accommodation (Bali Government
Tourism Office, 2011).
4.2.4 Method of Data Analysis
The method for calculating tourism leakage was constructed based on the
model developed by Unluonen, et. al. (2011), but it was modified to calculate
tourism leakage from the accommodation sector only. The operational equations
are outlined as follow:
n
L = ∑ Li i=1
where:
L = total leakage
Li = the leakage items in a group i.
n = 3, where L1 is the import leakage group, L2 is the delayed leakage group, and
L3 is the invisible leakage group.
In this study, the delayed leakage (L2) and the invisible leakage (L3 ) are not
calculated. The import leakage group (L1) is the only form of leakage that is
examined in this study, using the following equation:
v
L1 = ∑ L1k
k = 1
where :
The number of import leakage items (v) was 8

96
and :
L11 = Total payments for the import of goods and services for
consumption and investment made by the accommodation sector.
L12 = Total payments of earnings transferred abroad, for licenses,
technology transfers, royalties, patents, etc. in the
accommodation sector.
L13 = Total percentage payments to foreign banks for credit card
transactions made by foreigners.
L14 = Total savings of foreign employees in the accommodation sector
and the money they send abroad.
L15 = Interest payments on credit provided from abroad
L16 = Total payment abroad for training personnel needed by the
accommodation sector
L17 = Payments for international marketing and promotion by the
public sector
L18 = Payments for international marketing and promotion by the
accommodation sector
Assumptions of the model by Unluonen, et. al. (2011) are as follow:
(i) All imported goods and services that are tourist-related are used in the
country of import,
(ii) The saving tendency of expatriates is equal to the saving tendency of
citizens,

97
(iii) Regardless of why and by whom they are done, all marketing and
promotion activities make some contribution to the tourism demand in the
country, and
(iv) The demand generated from one unit of import input is equal for both
tourists and residents.
4.2.5 Variables of Micro Analysis
Basically, the variables in this study consist of imported products, foreign
employees, foreign services, and hotel incomes. All of the variables are outlined
below:
(i) Imported products were classified into imported foods, imported beverages,
imported equipment (utensils) and other imported goods and materials
related to design, furniture and decoration used in the hotel.
(ii) Foreign employees is the number of foreigners who work in the
accommodation sector as well as their wages and salaries (payment for
foreign employees).
(iii) Foreign services include any fees related to the operation of hotels
undertaken overseas, such as services abroad, and payments for foreign
productions, overseas education and training costs for hotel employees.
Details of the variables related to the cause of leakage that are used in this study
are listed in Table 4.2.

98
Table 4.2
Summary of Indicators and Variables Related to Cause of Leakages
No Indicators Variables (unit/year) 1 Imported foods a. Imported meat (beef, chicken, pork, lamb).
b. Imported fisheries (fish, prawns, lobsters, octopus, and squid).
c. Imported processed food
2 Imported beverages a. Imported dairy products (fresh milk, yoghurt), and juice.
b. Imported wine, beer and other alcoholic drinks.
3 Imported fruits and vegetables a. Imported varieties of fruits b. Imported varieties of vegetables
4 Imported utensils
a. Imported household utensils (stoves, pans, frying pans, mixers, blenders, cookers, microwave ovens)
b. Imported plates, glasses, cups, cutlery, and mugs.
5 Imported goods and materials a. Imported furniture (beds, tables, desks, chairs, shelves, wardrobes).
b. Imported furnishing accessories.
6 Services abroad a. Promotion and advertising: Indirect Promotion and advertisement through Media Channels (Television, broadcasting) Direct promotion through visiting some countries.
b. Public Relations, publicity payments, foreigner operational payments
7 Payments for foreign productions.
a. Transfer payment of commission to travel agents and tour operators.
b. Import payment. c. Payment of Government tax on imported goods
and services. d. Exchange cost for tourism investment. e. Interest payment for external credits in the tourism
sector.
8 Payment for foreign employees a. Number of foreign employees b. Total payments for foreign employees c. Transfer payments for foreign employees
9 Savings of foreign employees a. Amount of money saved abroad
10 Education abroad and training costs of tourism employees
a. The number of staff trained overseas b. Payment for overseas training staff
Sources: Hudman and Hawkin (1989); Lacer and Nepal (2010); Mill and Morrison (2009);
Unluonen, et. al. (2011); and Zheng (2011).
(iv) Another variable was the income received by hotels. A hotel‟s income was
defined as all of the revenue received by the hotel, including income from
payment for the rooms, income from the hotel restaurant, laundry and other
services supplied by the hotel.

99
The total revenue of a hotel was calculated based on the following formula:
n
Y = ∑Yi
1
Y = Y1 + Y2 + Y3 where:
Y = Annual revenue of an hotel
Y1 = Revenue from rooms
Y2 = Revenue from selling food and beverages
Y3 = Revenue from other sources (laundry, spa, telephone, internet, business
centre, etc.)
Revenue from rooms = Room nights sold x Room rate (Rupiah/day)
Room nights sold = Average occupancy rate (%) x number of rooms x
number of days in a year
All of the above imported products, foreign employees and foreign
services as well as the hotels‟ revenues are calculated for all types of
accommodation, namely: (i) Non-star rated hotels; (ii) 1, 2 & 3 Star-rated hotels;
(iii) 4 & 5 Star-rated non-chain hotels; and (iv) 4 & 5 Star-rated chain hotels.
The percentage of tourism leakage of one hotel can be calculated as the total
amount of imported products and services divided by the total revenue of the
hotel, using the equation below.
Percentage of leakage = Total Leakage x 100%
Total Revenue

100
4.2.6 Research Instruments
A survey was undertaken in order to collect data and information from
hotels. Questionnaires and guided interviews were used during the survey. Open
ended questions were also asked in order to obtain the information needed. The
full questionnaire related to imported products used in the hotels and the points of
view of hotel managers can be seen in Appendix 4.1.
The survey involved several steps. The first step was to send a letter to the
hotels in the sample regarding data collection. The second step was to give the
questionnaire to the hotel‟s management to complete. Open ended questions
were included in this survey. The third step was a meeting between researcher or
field assistant and the hotels‟ management to check whether the data and other
information were adequate or not.
It was a difficult and complicated survey as some hotel managers felt
unhappy because most of the data and information requested were strictly
confidential. However, when the researcher gave assurances that the identity of
the hotel would not be mentioned in the survey results, most of the hotels agreed
to take part. Nevertheless, several hotels did refuse to give any data or
information, so the researcher kept trying other hotels in order to make up the
target number for the hotel sample.
4.2.7 Limitations of the Micro Analysis Model
The main limitation of the model used in this study is that delayed
leakage and invisible leakage were excluded due to difficulties in obtaining data
101
related to delayed leakage (taxes, and savings of entrepreneurs and employees)
and calculating the invisible leakage (physical negative impacts of tourism,
destruction of the country‟s infrastructure, natural habitats, environments and
historical as well as cultural heritage). Another limitation in calculating leakage
in this study is that information on foreign employees‟ savings and the amount of
money they send abroad could not be obtained. This was because the hotels did
not know about foreign employees‟ savings as this kind of data was highly
confidential and personal Therefore, the above variables were excluded from the
model. Even though these variables were not included in the model, it did not
significantly affect the result (the percentage of tourism leakage), as almost all
primary expenses of foreign employees were covered by their company, such as
housing, transports, and meals.
4.3 Macro Analysis in Calculating Tourism Leakage in the Accommodation Sector
4.3.1 Research Location and Period of Research
Research for the macro analysis was undertaken in Bali Province during
the period April - October 2013. The locations for this research were selected
purposively on the basis that Bali as a tourist destination is one province.
4.3.2 Data and Sources of Data
4.3.2.1 Data
The type of data used in this research was quantitative data. Quantitative
data is countable data which can be calculated. The following data was collected:
102
1. Social Accounting Matrix (SAM) of Bali Province 2010.
2. Sectoral value added i.e. wages, profit, indirect tax of Bali Province 2010.
3. Sectoral final demand of Bali Province 2010, such as government
consumption, expenditure, investment and export.
4. Household expenditure of Bali Province.
5. Sectoral number of labour of Bali Province 2010.
6. Allocation of labour income and capital of Bali government to households.
7. Allocation of transfer income between households.
8. Allocation of transfer incomes between accommodations.
9. Allocation of income transferred from household to government outside the
province/overseas and vice versa.
10. Allocation of income transferred from accommodation sector to government
outside of Bali province/overseas and vice versa.
11. Allocation of household savings.
12. Allocation of income of production factors, especially capital to companies
and outside of Bali province.
13. Allocation of income transferred outside of Bali province.
14. Other related data which were collected through primary research on all
types of accommodation were data on: imported foods, imported beverages,
imported utensils and equipment, and other imported raw materials that have
been used in the operation of hotels, foreign payments such as commission
for travel agents, payment for foreign employees, services abroad such as
promotion, public relations, profit transfer as well as management fees.

103
4.3.2.2 Sources of Data
In the macro analysis, calculation of tourism leakage from the
accommodation sector in Bali was based on secondary data from the Bali Central
Bureau of Statistics. The basic data used to generate the SAM for Hotels was
taken from the Social Accounting Matrix (SAM) of Bali Province 2010. This
data was disaggregated to create a 31 x 31 SAM Matrix describing four types of
accommodations, namely Non-star rated hotels; 1,2&3 Star-rated hotels; 4&5
Star-rated non-chain hotels and 4&5 Star-rated chain hotels. Other related data
were obtained from the SUSENAS (Survey Sosial Ekonomi Nasional) National
Socio-Economic Survey for 2010, the SAKERNAS (Survey Angkatan Kerja
National) National Labour Force Survey for 2010, Indikator Ekonomi Indonesia
or Economic Indicators for Indonesia 2010, the STKIR (Survey Khusus
Tabungan Investasi Rumah Tangga) Special Survey on Household Investments
and Savings for 2010, and the SKIO (Survey Khusus Input-Output) Special
Survey on Input-Output for 2010.
4.3.3 Identification of Variables
The variables identified for use in the macro analysis are outlined below:
1) Tourism Revenue
Tourism revenue is income generated from tourists‟ expenditure. Tourism
has become one of the major players in the international economy and
represents the main income sources for many developing countries (Mill and
Morison, 2009).
104
2) Tourist expenditure
Tourist expenditure is the total consumption expenditure made by a visitor or
on behalf of a visitor for and during his/her trip and stay at a destination
(Mill and Morison, 2009).
3) Gross national product (GNP).
The Gross National Product (GNP) is the value of all final goods and
services produced by a nation‟s factors of production in a given time period.
It represents the total net value of all goods and services produced within a
nation over a specified period of time, representing the sum of wages,
profits, rents, interest, and pension payments to residents of the nation
(Krugman & Obstfeld, 2006).
4) Factors of production
Factors of production are the resources required for generating goods or
services, generally classified into four major groups: land (including all
natural resources), labor (including all human resources), capital (including
all man-made resources), and enterprise (which brings all the previous
resources together for production) (Thorbecke, 1988).
5) Income Distribution
Income distribution is the distribution of wages earned across a company,
industry, or country. Income distribution is how a nation‟s total Gross
Domestic Product (GDP) is distributed amongst its population, which can be
illustrated by the income distribution indicator known as the “Gini
coefficient”. The Gini coefficient is a measure of inequality of a distribution.
105
It is defined as a ratio between 0 and 1. Zero means perfect income equality
and 1 means perfect income inequality. A larger Gini coefficient means a
greater inequality in the income distribution of earners.
6) Job Opportunity
Job Opportunity is the chance to get a job. Travel and tourism represent
important economic activities that contribute to regional economies and
provide a source of both entrepreneurial and household income.
7) Household classifications
According to Bali‟s Central Bureau of Statistics (2011), households are
grouped into:
a. Agricultural labour in rural areas.
b. Businessmen who own land in rural areas.
c. Agricultural labour in urban areas.
d. Businessmen who own land in urban areas.
e. Low income households in rural areas.
f. Non labour force in rural areas.
g. High income households in rural areas.
h. Low income households in urban areas.
i. Non labour force in urban areas.
j. High income households in urban areas.
106
The accounts used in the SAM Hotel of Bali 2012 were as follows:
1) Production Factors Account
This account explains the interaction between the supply and demand of
production factors. It provides data related to receipts in the rows and
payments in the columns. Factors of production are workers (labour),
physical capital (like factories and equipment), natural resources and other
factors that are used to produce goods and services. In the Social
Accounting Matrix (SAM) for Bali 2010, there are two types of production
factor accounts namely labour and non labour (capital). The source of
income for the labour account is payment from wages and salaries from
production factor of labour, while the source of income for the non labour
account was payment from capital invested in economic activities.
2) Institutions Account
The institutions account shows transactions of three accounts i.e. households
account, companies account and government account as well as transactions
to other accounts. The sources of income for institutions are income from
factors of production (labour and/or non-labour), income from institutions
(i.e. households, companies and government) as well as from abroad
(international transactions). All of the income from labour will be received
by households. Meanwhile, income from capital will be received by
institutions that use capital in their economic activities. This income earned
from capital will, in turn, be a source of payments made to institutions, i.e.
households, companies and government (as tax paid to government).
107
Moreover, subsidies are also taken into account, which have the opposite
function in transactions compared to taxes, as they are given by the
government to certain institutions such as households or communities
(Thorbecke, 1988).
3) Production Sectors Account
This account represents the balance in transactions between receipts and
expenditures incurred during the process of producing either goods or
services. The rows explain the income structure while the columns represent
allocations for using various outputs from the production sectors. The
commodities used are distinguished into domestic and imported commodities
that have been used as intermediate input or as final demand by households,
government or industries (Thorbecke,1988).
4) Current Account
The current account is part of the balance of payments that records a
country‟s net exports, net income on investments, and net transfers. It is
defined as the sum of the balance of trade (goods and services exports less
imports), net income from abroad and net current transfers. It expresses the
difference between a nation‟s savings and its investment. The current
account is an important indicator of an economy's health. A positive current
account balance indicates that the nation is a net lender to the rest of the
world, while a negative current account balance indicates that it is a net
borrower from the rest of the world. In other words, current account „deficit‟
108
means that imports exceed exports. Meanwhile, current account „surplus‟
indicates that exports exceed imports. A nation‟s current account balance is
influenced by numerous factors, such as trade policies, exchange rate,
competitiveness, inflation rate and others. An increase in exports results in
increasing the current account surplus (Krugman & Obstfeld, 2006).
5) Capital Account
The capital account is an account stating the amount of funds and assets
invested in a business by the owners. In terms of economics, the capital
account is part of the balance of payments recording a nation's outflow and
inflow of financial securities. Capital account surplus indicates an
imbalance in a nation's balance of payments in which payments received by
the country for selling domestic assets exceed payments made by the country
for purchasing foreign assets. In other words, investment by the domestic
economy in foreign assets is greater than foreign investment in domestic
assets. A capital account surplus contributes to surplus in the balance of
payments. The term Capital has several meanings and it is used in many
business contexts. In general, capital is accumulated assets or ownership.
More specifically, capital is the amount of cash and other assets owned by a
business. These business assets include accounts receivable, equipment, and
land/buildings of the business. Capital can also represent the accumulated
wealth of a business, represented by its assets less its liabilities (Krugman &
Obstfeld, 2006).
109
6) Other Accounts
The trade and transportation margin account describes the price difference
between producers and consumers. This was excluded in this research as all
of the margins were included in each transaction.
7) The Indirect tax netto account describes indirect tax minus subsidies. On the
one hand this explains government receipts, while on the other it explains the
tax paid by producers on the selling price of their products.
8) The Rest of the World Account comprises accounts to capture the range of
transactions that take place between domestic and international entities.
9) Receipts and Expenditures Account
This account describes the balance of circular flow of receipts and
expenditures accounts in the accommodation sectors in Bali tourism.
10) Hotel Production Account
This account describes the balance of circular flow in the production process
in the accommodation sectors in Bali‟s tourism.
4.3.4 Method of Data Analysis
According to Thorbecke (1988) cited in Nursetyohadi (2009), the SAM
model consists of four basic accounts, namely: (i) production factors, (ii)
institutions, (iii) production sectors, and (iv) other accounts or Rest of The
World. The first three accounts are called endogenous accounts while the last
account is called an exogenous account (Thorbecke, 1988). This is shown in
Table 4.3.

110
Table 4.3 Scheme of Social Accounting Matrix (SAM)
Expenditure
Receipt
Endogenous Account Exogenous Account
Total Factors of
Production Institutions Production
Sectors 1 2 3 4 5
Endo genous Account
Factors of Production
1
T11
0
T12
0
T13
Allocation of value-added to production factors
X14
Revenue of production factors from overseas
Y1
Factorial distribution of revenue
Institutions
2
T21
Allocation ofrevenue to the institution
T22
Transferbetween institution
T23
0
X24
Transfer from overseas
Y2
Distribution ofinstitutional revenue
Production Sectors
3
T31
0
T32
Domestic demand
T33
Intermediate
goods
X34
Export and investment
Y3
Total output on production sectors
Exogenous
Account
4
T41
Allocation of revenue to overseas (Leakage)
T42
Saving
T43
Import and tax
X44
Other transfers
Y4
Total revenue from other accounts
Total
5
Y’1
Sum of expen-diture from production factors
Y’2
Sum of expenditure from institutions
Y’3
Total input
Y’4
Sum of other expenditures
Source: Thorbecke (1988)
Table 4.3 shows how the Social Accounting Matrix (SAM) illustrates the
interrelationships between sectors, such as income distribution and the impact of
Consumption, Investment and Export-Import on regional income and job
opportunities. From Table 4.3 the following matrix equation can be formulated:
Y = T + X . . . . . . . . . . . . . . . . . (1)

111
where :
Y = national/regional income
T = endogenous income
X = exogenous income Income distribution of endogenous and exogenous accounts can be
formulated as follows:
Y1 = T13 + X14 . . . . . . . . . . . . . . . . . . . (2)
Y2 = T21 + T22 + X24 . . . . . . . . . . . . . . . . (3)
Y3 = T32 + T33 + X34 . . . . . . . . . . . . . . . . (4)
Y4 = T41 + T42 + T43 + X44 . . . . . . . . . . . . . (5)
Equation (2) shows factorial income distribution, while equation (3) shows
institutional income distribution, equation (4) shows total output of production
factors, and equation (5) shows other total income (exogenous).
Meanwhile, expenditure distribution of endogenous and exogenous
accounts can be formulated as follows:
Y‟1 = T21 + T41 . . . . . . . . . . . . . . . . . . . (6)
Y‟2 = T22 + T32 + T42 . . . . . . . . . . . . . . . . (7)
Y‟3 = T13 + T33 + T43 . . . . . . . . . . . . . . . . (8)
Y‟4 = X14 + X24 + X34 + X44 . . . . . . . . (9)
Equation (6) shows the total expenditure of production factors, while
equation (7) shows total expenditure of institutions, equation (8) shows total

112
input consumption by production sectors, and equation (9) shows other total
consumption (exogenous).
4.3.5 Limitations of the Social Accounting Matrix
The Social Accounting Matrix (SAM) model has a number of limitations
and makes several assumptions. The assumptions are: (i) all of the products
produced by each sector are consumed during a certain period; (ii) the input-
output relationships in the production activities are linear or constant returns to
scale; (iii) there is no substitution between production factors that have been used
in the production process; (iv) a group of products is not produced at the same
time by two or more companies; (v) prices remain constant; and (vi) the economy
is in an equilibrium condition (Thorbecke,1988).
4.3.6 Social Accounting Matrix for Hotels in Bali
The SAM for Hotels in Bali was developed in this research based on the
SAM Bali 2010 through the analysis of endogenous and exogenous accounts. The
three endogenous accounts are: production factors, institutions and production
sectors. The institutions account is subdivided into households, companies and
government accounts. In this research, the “companies” are providers of tourist
accommodation, which are classified into four types of accommodation, namely
Non-star rated hotels; 1,2&3 Star-rated hotels, 4&5 Star-rated non-chain hotels,
and 4&5 Star-rated chain hotels. The analysis of institutional income distribution
focuses on the total income of each type of accommodation . Meanwhile, the

113
exogenous account consists of the supply of commodities from the hotel and non-
hotel accounts, capital account, current tax account and Rest of the World
Account. Total receipts or revenues are described in rows, and total expenditures
in columns. It is easier to understand that the total receipts shown in the rows are
used for some activities in the columns. In a SAM account, a balance is made in
every transaction between rows and columns. The SAM for Hotels in Bali 2010
was developed in this research in the form of a SAM Matrix_31 x 31. It can be
seen in Appendix 4.3.
4.3.7 Tourism Leakage Calculation Based on Macro Analysis
Before calculating the amount of leakage in Bali‟s tourism, discussion is
focused on analysing the transactions between the receipts account and
expenditures account for each type of accommodation. This is followed by an
analysis of the production account for each type of accommodation. Calculation
of tourism leakage is based on the above accounts.
4.3.7.1 Account of Receipts and Expenditures of Hotels in Bali
The hotel receipts and expenditures accounts describe the balance of
circular flow between the receipts and expenditures accounts of each type of
accommodation. Transactions on the receipts side show the income of each hotel.
These transactions consist of: (i) Payment of production factors from labour; (ii)
Payment of production factors from non labour; (iii) Transfer from households;
(iv) Transfer between companies; (v) Transfer from government as payment of
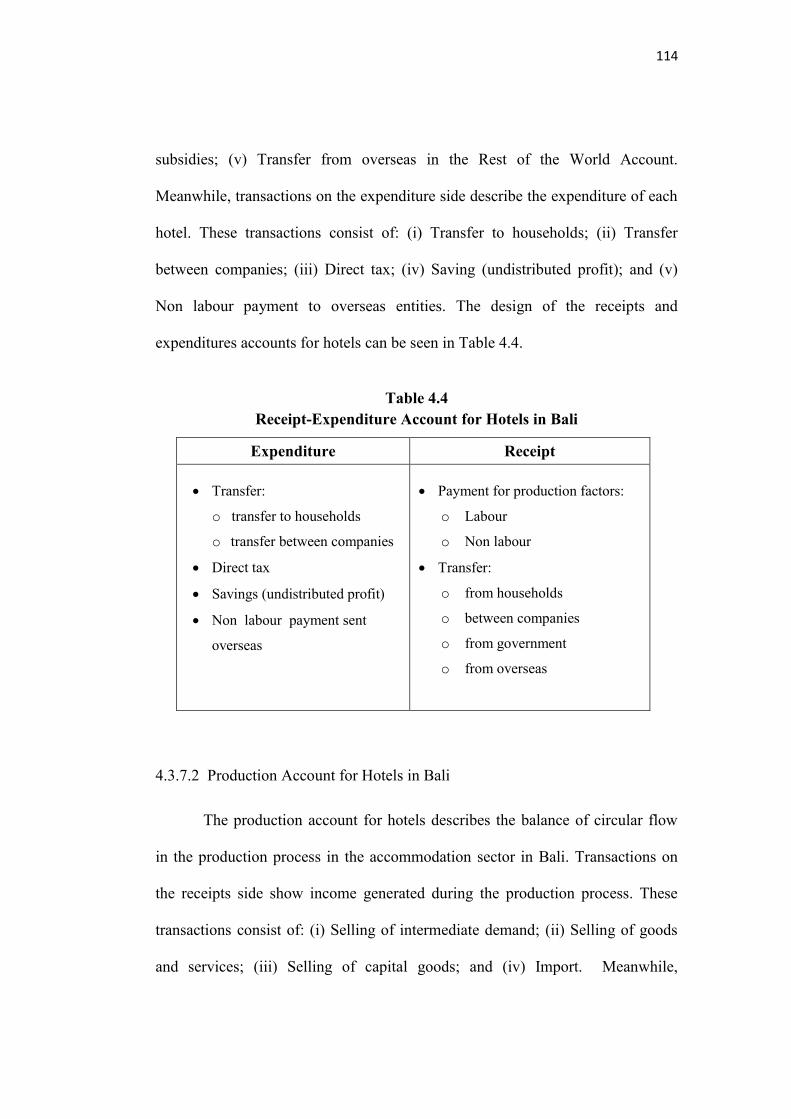
114
subsidies; (v) Transfer from overseas in the Rest of the World Account.
Meanwhile, transactions on the expenditure side describe the expenditure of each
hotel. These transactions consist of: (i) Transfer to households; (ii) Transfer
between companies; (iii) Direct tax; (iv) Saving (undistributed profit); and (v)
Non labour payment to overseas entities. The design of the receipts and
expenditures accounts for hotels can be seen in Table 4.4.
Table 4.4 Receipt-Expenditure Account for Hotels in Bali
Expenditure Receipt
Transfer:
o transfer to households
o transfer between companies
Direct tax
Savings (undistributed profit)
Non labour payment sent
overseas
Payment for production factors:
o Labour
o Non labour
Transfer:
o from households
o between companies
o from government
o from overseas
4.3.7.2 Production Account for Hotels in Bali
The production account for hotels describes the balance of circular flow
in the production process in the accommodation sector in Bali. Transactions on
the receipts side show income generated during the production process. These
transactions consist of: (i) Selling of intermediate demand; (ii) Selling of goods
and services; (iii) Selling of capital goods; and (iv) Import. Meanwhile,
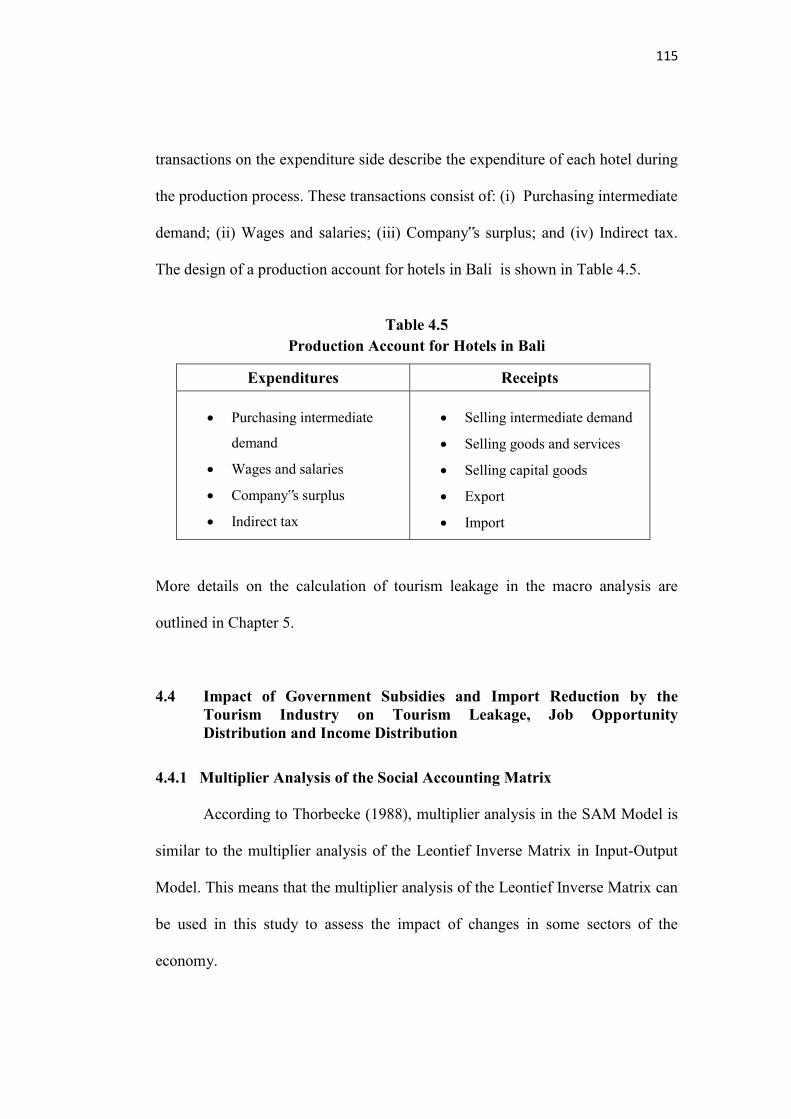
115
transactions on the expenditure side describe the expenditure of each hotel during
the production process. These transactions consist of: (i) Purchasing intermediate
demand; (ii) Wages and salaries; (iii) Company‟s surplus; and (iv) Indirect tax.
The design of a production account for hotels in Bali is shown in Table 4.5.
Table 4.5 Production Account for Hotels in Bali
Expenditures Receipts
Purchasing intermediate
demand
Wages and salaries
Company‟s surplus
Indirect tax
Selling intermediate demand
Selling goods and services
Selling capital goods
Export
Import
More details on the calculation of tourism leakage in the macro analysis are
outlined in Chapter 5.
4.4 Impact of Government Subsidies and Import Reduction by the
Tourism Industry on Tourism Leakage, Job Opportunity Distribution and Income Distribution
4.4.1 Multiplier Analysis of the Social Accounting Matrix
According to Thorbecke (1988), multiplier analysis in the SAM Model is
similar to the multiplier analysis of the Leontief Inverse Matrix in Input-Output
Model. This means that the multiplier analysis of the Leontief Inverse Matrix can
be used in this study to assess the impact of changes in some sectors of the
economy.
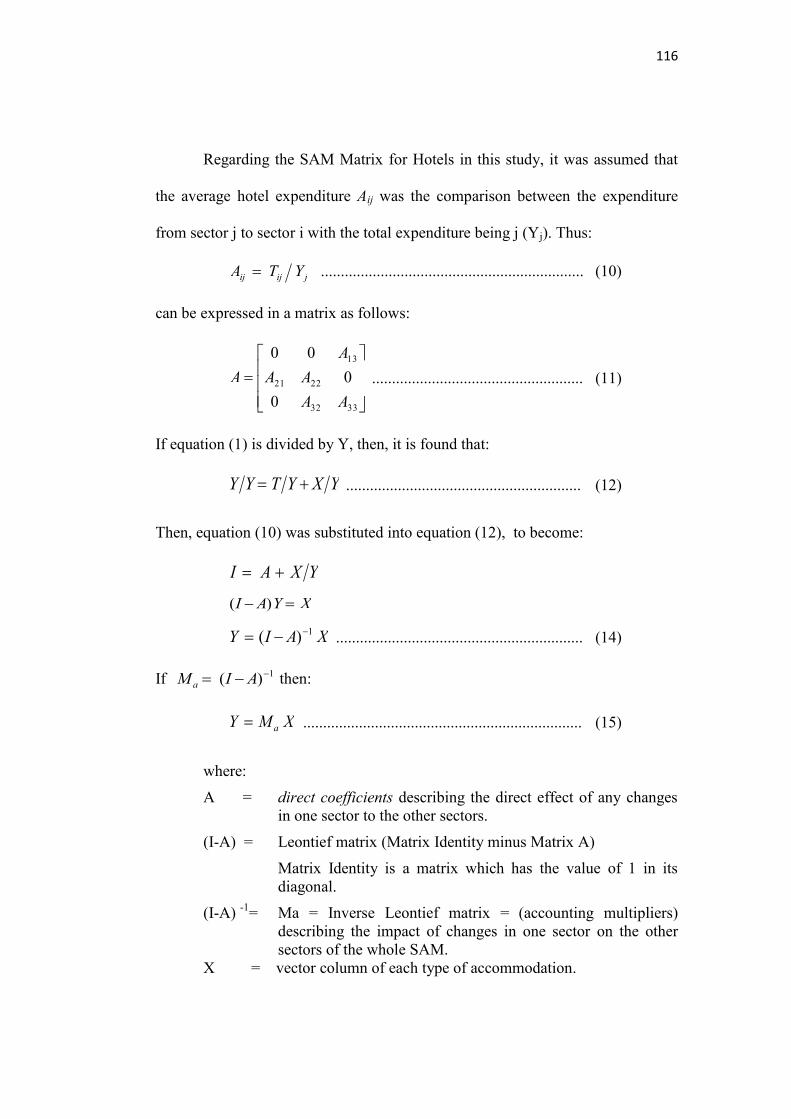
116
Regarding the SAM Matrix for Hotels in this study, it was assumed that
the average hotel expenditure Aij was the comparison between the expenditure
from sector j to sector i with the total expenditure being j (Yj). Thus:
jijij YTA .................................................................. (10)
can be expressed in a matrix as follows:
3332
2221
13
0
0
00
AA
AA
A
A ..................................................... (11)
If equation (1) is divided by Y, then, it is found that:
YXYTYY ........................................................... (12)
Then, equation (10) was substituted into equation (12), to become:
YXAI
XYAI )(
XAIY 1)( .............................................................. (14)
If 1)( AIM a then:
XMY a ...................................................................... (15)
where:
A = direct coefficients describing the direct effect of any changes in one sector to the other sectors.
(I-A) = Leontief matrix (Matrix Identity minus Matrix A)
Matrix Identity is a matrix which has the value of 1 in its diagonal.
(I-A) -1= Ma = Inverse Leontief matrix = (accounting multipliers) describing the impact of changes in one sector on the other sectors of the whole SAM.
X = vector column of each type of accommodation.

117
4.4.2 Analysis of Policy Scenarios
Regarding this study, matrix SAM_31x31 was expanded to Matrix
SAM_108 x 108 in order to assess the impact of changes in one or more sectors
on the other sectors. In this case, the purpose was to assess the impact of
government subsidies and of import reduction by tourism industries on several
aspects of the economy, such as tourism leakage, job opportunity and income
distribution. This was done through conducting a number of simulations, based
on the steps outlined below:
(i) Calculate the input coefficient of each sector Aij by dividing Tij by Yj (the
endogenous value of each cell was divided by the total amount).
(ii) Undertake the same calculation for each cell of Matrix 108x108 in order to
generate Matrix A
(iii) Matrix (I – A) or matrix Identity minus Matrix A.
(iv) Work out the Inverse Leontief matrix or (I-A) -1
(v) Multiply each cell of the Leontief matrix of SAM_108x108 by the vector
column for each type of accommodation, namely Non-star rated hotels;
1,2&3 Star-rated hotels; 4&5 Star-rated non-chain hotels, and 4&5 Star-rated
chain hotels.
(vi) By simulating different combinations of government subsidies and import
reduction by the tourism industry, the impact of each combination was
assessed. Details of the simulation results are outlined in Chapter 5.

118
4.5 Perceptions and Preferences of Foreign Tourists Regarding Imported
and Local Products and Willingness to Spend Money for Balinese People
4.5.1 Research Location and Period of Research
A survey on foreign tourists was undertaken during the period of April to
June 2013 in four main destinations in Bali, i.e. Kuta, Nusa Dua, Sanur and
Ubud. The locations for this research were selected purposively on the basis that
the above destinations are the main tourist destinations in Bali.
4.5.2 Design of Foreign Visitors Sample
The Accidental sampling technique (Zikmund, 1997) was chosen to select
a sample of foreign tourists visiting Bali. The population size was taken to be the
number of foreign tourists who visited Bali in year 2011, which was about 2.6
million. Using the calculation method proposed by Kish (1965: 234) and
Yamane (1973) with an error of 5% (α=0.05), the number of respondents was set
at 600. Respondents were interviewed based on a questionnaire. The
questionnaire for foreign tourists is shown in Appendix 4.2.
4.5.3 Scope of the Study
This study focused mainly on the perceptions and preferences of foreign
tourists regarding imported and local products. This included their perceptions on
whether or not they needed to have imported foods and beverages like those they
consumed in their own countries. An assessment was also made of their
willingness to participate in the development of Bali‟s tourism by asking them to
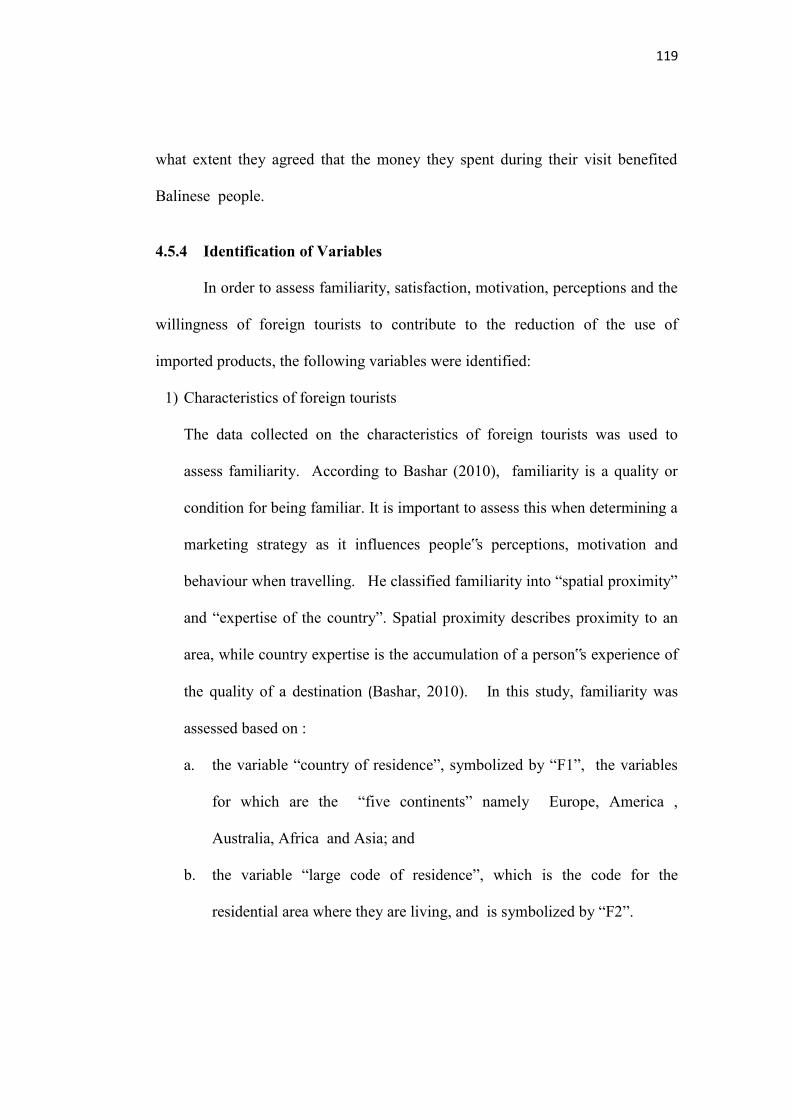
119
what extent they agreed that the money they spent during their visit benefited
Balinese people.
4.5.4 Identification of Variables
In order to assess familiarity, satisfaction, motivation, perceptions and the
willingness of foreign tourists to contribute to the reduction of the use of
imported products, the following variables were identified:
1) Characteristics of foreign tourists
The data collected on the characteristics of foreign tourists was used to
assess familiarity. According to Bashar (2010), familiarity is a quality or
condition for being familiar. It is important to assess this when determining a
marketing strategy as it influences people‟s perceptions, motivation and
behaviour when travelling. He classified familiarity into “spatial proximity”
and “expertise of the country”. Spatial proximity describes proximity to an
area, while country expertise is the accumulation of a person‟s experience of
the quality of a destination (Bashar, 2010). In this study, familiarity was
assessed based on :
a. the variable “country of residence”, symbolized by “F1”, the variables
for which are the “five continents” namely Europe, America ,
Australia, Africa and Asia; and
b. the variable “large code of residence”, which is the code for the
residential area where they are living, and is symbolized by “F2”.
120
Meanwhile, “country expertise” was classified by:
a. the variable „periodicity‟ in visiting Bali (F3), and
b. the variable “visit more than 5 times” (F4).
2) The variable “satisfaction” (S) was classified into four types, i.e.:
a. Satisfaction with accommodation and restaurant services in Bali (S1),
b. Satisfaction with the whole trip (S2),
c. Satisfaction with level of emotion during visit (S3), and
d. Satisfaction related to level of expectation (S4).
3) The variable “motivation” was classified into three types:
a. Reasons for coming (Visit Friends and Relatives/VFR) (M1),
b. Main purpose (M2), and
c. Activities (M3).
4) The variable “perceptions” was classified into perceptions regarding services
(P1, P2) and perceptions regarding products (P3 – P18).
5) Willingness to spend money for the benefit of Balinese people (B).
6) Preference of foreign tourists regarding imported and local products.
All of the above variables are presented in Table 4.6.
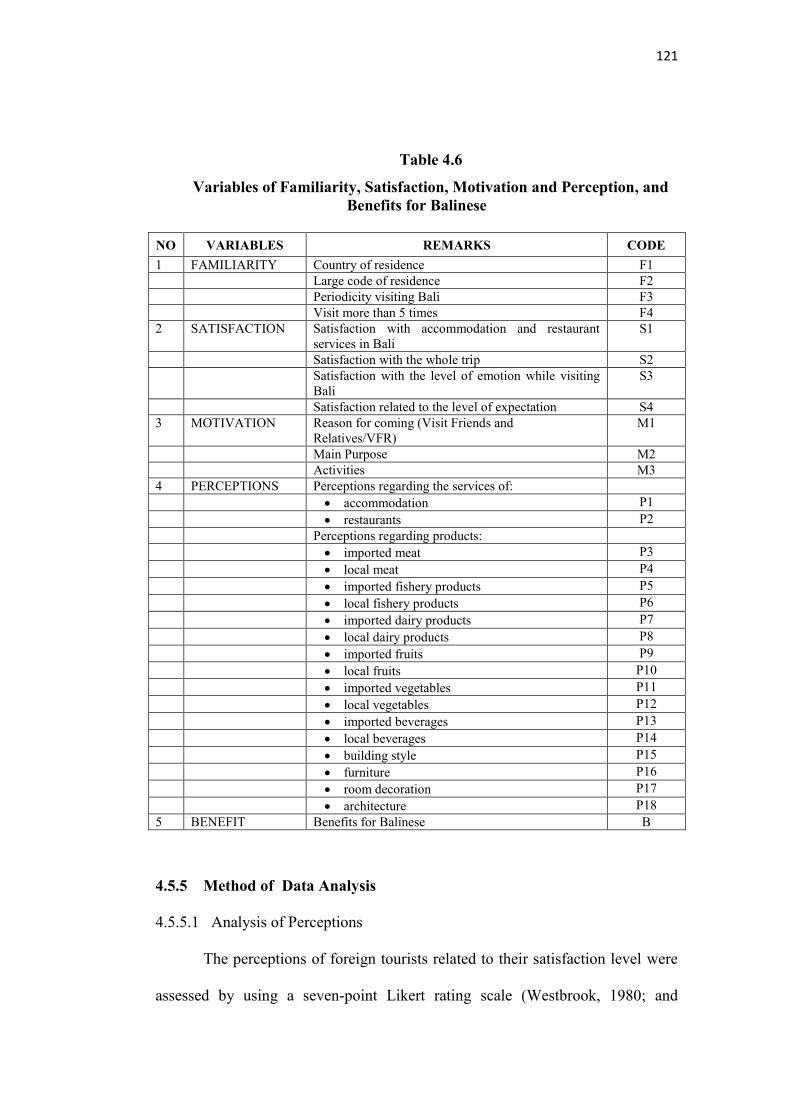
121
Table 4.6
Variables of Familiarity, Satisfaction, Motivation and Perception, and Benefits for Balinese
NO VARIABLES REMARKS CODE
1 FAMILIARITY Country of residence F1
Large code of residence F2
Periodicity visiting Bali F3
Visit more than 5 times F4
2 SATISFACTION Satisfaction with accommodation and restaurant services in Bali
S1
Satisfaction with the whole trip S2
Satisfaction with the level of emotion while visiting Bali
S3
Satisfaction related to the level of expectation S4
3 MOTIVATION Reason for coming (Visit Friends and Relatives/VFR)
M1
Main Purpose M2
Activities M3
4 PERCEPTIONS Perceptions regarding the services of:
accommodation P1
restaurants P2
Perceptions regarding products:
imported meat P3
local meat P4
imported fishery products P5
local fishery products P6
imported dairy products P7
local dairy products P8
imported fruits P9
local fruits P10
imported vegetables P11
local vegetables P12
imported beverages P13
local beverages P14
building style P15
furniture P16
room decoration P17
architecture P18
5 BENEFIT Benefits for Balinese B
4.5.5 Method of Data Analysis
4.5.5.1 Analysis of Perceptions
The perceptions of foreign tourists related to their satisfaction level were
assessed by using a seven-point Likert rating scale (Westbrook, 1980; and

122
Colman, et. al., 1997). The range of intervals of the seven points on the scale
was counted based on the formula proposed by Likert (1965) in Westbrook
(1980) as follows:
n-1 7 - 1 Interval = _____ = ______ = 0.857
n 7 where: n = number of points on the scale
So, the interval score was grouped and interpreted as in Table 4.7.
Table 4.7 Scale, Interval and Level of Interpretation
Scale Interval Score Level of Interpretation
1 1.00 – 1.86 Extremely poor
2 1.87 – 2.72 Very poor
3 2.73 – 3.58 Poor
4 3.59 – 4.44 Fair
5 4.45 – 5.30 Good
6 5.31 – 6.15 Very good
7 6.16 – 7.00 Extremely good
a. To assess the level of satisfaction, the levels of rating are: (1) Extremely
Dissatisfied, (2) Dissatisfied, (3) Slightly Dissatisfied, (4) Mixed between
Dissatisfied and Satisfied, (5) Slightly Satisfied, (6) Satisfied, and (7)
Extremely Satisfied. An alternative rating scale could also be possible, such
as: (1) Extremely Disagree, (2) Disagree, (3) Slightly Disagree, (4) Uncertain,
(5) Slightly Agree, (6) Agree, and (7) Extremely Agree.
b. To assess the feeling of tourists regarding their visit, the levels of rating are:
(1) Terrible, (2) Unhappy, (3) Mostly Dissatisfied, (4) Mixed between
dissatisfied and satisfied , (5) Mostly Satisfied, (6) Pleased, and (7) Delighted.

123
c. To assess foreign tourists‟ thinking about their visit and emotional experience,
the levels of rating are: (1) Very displeased, (2) Displeased, (3) Slightly
displeased, (4) Mixed between displeased and pleased, (5) Slightly pleased,
(6) Pleased, and (7) Very pleased.
d. To assess foreign tourists‟ perceptions regarding the services of
accommodation and restaurants, the levels of rating are: (1) Extremely poor,
(2) Very poor, (3) Poor, (4) Fair, (5) Good, (6) Very good, and (7) Extremely
good.
e. To assess foreign tourists‟ agreement over whether they spent their money in
Bali to benefit the Balinese, the levels of rating are: (1) Extremely disagree,
(2) Disagree, (3) Slightly disagree, (4) Mixed between disagree and agree, (5)
Slightly agree, (6) Agree, and (7) Extremely agree.
4.5.5.2 Reasons for Using Seven Point Scale
The reason for using seven-point scales was to obtain a more detailed and
optimal response from respondents. A number of studies have been conducted to
examine the effects of different numbers of response categories on the reliability
and validity of rating scales and the response patterns (Cicchetti, et al., 1985;
Schutz & Rucker, 1975 in Colman et. al., 1997). According to Bearden, et.al.
(1993) cited in Colman et. al. (1997), in contemporary psychometric practice, the
majority of rating scales, Likert scales, and other attitude and opinion measures
contain either five or seven response categories. Colman et. al.,1997 said that
Symonds (1924) was the first to suggest that reliability is optimized with seven
response categories, and other early investigations tended to agree. Colman et.
124
al., 1997 added that in an influential review article, Miller (1956) argued that the
human mind has a span of absolute judgment that can distinguish about seven
distinct categories, a span of immediate memory for about seven items, and a
span of attention that can encompass about six objects at a time, which suggested
that any increase in the number of response categories beyond six or seven might
be futile. Furthermore, according to Neumann (1994) odd numbers of response
categories have generally been preferred because they allow the middle category
to be interpreted as a neutral point, and more recent research has tended to
reinforce the general preference for 5-point or 7-point scales. The above
arguments allow the researcher to use a scale of seven response categories in
order to achieve an optimum level of reliability reliability.
4.5.5.3 Preference
Preference is a further action of perception of a visitor‟s mind, so visitors
are asked questions based on their choices, likes or dislikes related to imported
products and local products (Solomon, 1999). To analyze the preferences of
foreign tourists for imported or local products, two choices were offered:
imported products and local products. The relationships between foreign
tourists‟ preferences and their evaluation of local products was also analyzed
using JMP software.
4.5.5.4 Data Analysis
JMP software (SAS Company) Version-10 was used in analyzing
perceptions, preferences and the relationships between variables. JMP is the

125
abbreviation for John‟s Macintosh Project developed by John Sall and others at
SAS Institute in the late 1980s as an interactive statistical visualization and
discovery tool. According to Sall, the JMP name also conveys “the idea of a
lively product that jumped responsively to the user‟s wishes” (Okerson, 2011).
4.5.6 Validity and Reliability
Validity and reliability tests were undertaken to examine the truth of data.
The validity test is used to examine accuracy and credibility of the results
(Sevilla et. al., 1993; Simamora, 2004; and Zikmund, 1997). Product moment
correlation (rxy) was calculated (r-value) and compared with the r-table. If the
r-value > r-table, this means that the measurement of variables is valid (Sevilla
et.al., 1993; Simamora 2004; and Zikmund, 1997). In this research, there were
33 questions regarding foreign tourists‟ perceptions regarding imported and local
products, which were examined through responses from 600 foreign tourists.
With the level of significance of 5%, the critical value was 0.08 (Appendix 4.1).
The product moment correlation formula (rxy) can be seen below (Sevilla et.al.,
1993; Simamora, 2004; and Zigmund, 1997).
rxy 2222 )()(
))((
YYnXXn
YXXYn
Remarks:
rxy = product moment correlation
N = number of sample
X = value Y = total value of questionnaire for each respondent
126
The reliability test is used to examine the stability and consistency of
responses given by respondents. Consistency means that the approaches made by
the researcher are consistent if the same approaches are also made by other
researchers for different research projects (Sevilla et. al., 1993; Simamora, 2004;
and Zikmund, 1997). The Alpha Cronbach formula was used to examine the
reliability of data. Instruments are reliable if the value of alpha Cronbach > 0.6
by using the formula below (Simamora, 2004: 77).
2
2
11
t
b
ik
kr
Remarks:
ri = reliability k = number of questions Σσb
2 = number of variance σt
2 = total variance In this research, validity and reliability tests were undertaken by using computer
program SPSS 11.5 for Windows.
4.5.7 Research Instruments
Research was undertaken by involving 12 field assistants at four main
tourism destinations of Bali i.e., Kuta, Nusa Dua, Sanur and Ubud. Research
preparation was carried out based on the following steps:
1) Explaining the questionnaires to all field assistants in order to make sure that
all of them understood about the data and information needed.
2) Exploratory research was undertaken on foreign tourists in the first three days
of research. The sample size for the exploratory research was 5% from total

127
respondents. The sample size was 600 respondents, so the sample size for the
exploratory research was 30 respondents.
3) Results of the exploratory research were analyzed in order to check whether
the method of data collection was correct in accordance with the research
objectives.
a) Checking of transcripts to minimize error.
b) Making sure that data and information were not ambiguous, by using
codes, comparing data with its code, and making notes related to the data
code.
c) In order to avoid language barriers, field assistants needed to be good at
English. Twelve students from the English Department of the Faculty of
Letters of Udayana University were selected as field assistants.
4.6 Points of View of Hotel Managers
4.6.1 Research Location and Period of Research
The research location for obtaining the views of hotel managers was the
same as that for the micro analysis, which was undertaken in four main tourism
destinations in Bali i.e. Kuta, Nusa Dua, Sanur and Ubud during the period of
April-June 2013.
4.6.2 Sample Design
The hotel sample in this research was the same as for the micro analysis
(see point 4.2.2), using the Probability Proportional to Size (PPS) sampling
128
method proposed by Kish (1965: 234) and Yamane (1973). The sample
consisted of 79 hotels (see Table 4.1). Three clusters of accommodation were
chosen namely (i) 1, 2 & 3 Star-rated hotels; (ii) 4 & 5 Star-rated chain and non-
chain hotels, and (iii) Non-star rated hotels.
4.6.3 Identification of Variables
As a qualitative analysis, the variables which needed to be assessed
regarding hotel managers‟ points of view were as follows:
1) Reasons for Choosing Imported Products
2) Points of View of Hotel Managers regarding Local Products
3) Points of View of Hotel Managers regarding the Causes and Impacts of
Leakage in the Tourism Industry
4) Willingness to reduce imported products and give priority to local
products.
4.6.4 Method of Data Analysis
Qualitative analysis was carried out on hotel managers‟ reasons for
choosing imported products, their views on local products, their views on the
cause and impact of tourism leakage as well as their willingness to reduce
imported products and give priority to local products. Research instruments in
this part were the same as the research instruments used in the micro analysis as
the data and information obtained were in the same questionnaire (see Appendix
4.1). However, more detailed discussion was involved in this part as the nature
129
of qualitative research required the researcher to be active in discussion based on
open ended questions.
4.7 Interpretative Structural Modeling (ISM)
4.7.1 Determining Experts
A strategy for minimizing tourism leakage in the accommodation sector
in Bali was developed based on Interpretative Structural Modeling (ISM). ISM is
an interactive learning process involving inter-relationships between variables
through the use of experts‟ ideas, opinions and experience, utilising brain-
storming management techniques to develop the contextual relationship among
the variables. For this purpose, experts should be well conversant with the
problem under consideration. ISM can be used to qualitatively gain individual
cognitive structures. (Attri and Sharma, 2013).
Regarding this study, experts were selected purposively who understand
the contextual relationship between variables regarding strategy for the
minimization of tourism leakage in the accommodation sector in Bali. The
experts included government officials, stakeholders in tourism and the
community representative. According to Attri and Sharma (2013) and Reza et.
al. (2010), there is no requirement regarding the number of respondents (experts)
involved in this model as long as: (i) the researcher is convinced that the number
of experts chosen is capable of analysing the contextual relationship between the
variables; and (ii) the experts are capable of communicating a holistic sense of
the elements and their relations which define system structure. The number of
130
experts selected for this study was 9 experts from the Government of Bali
Province, tourism stakeholders, community representative and academia. By
analyzing inter-relationships between variables, a strategy for minimizing
tourism leakage was developed.
4.7.2 Constructing Elements
Saxena (1990) used nine elements in his research on assessing the impact
of indirect relationships on energy conservation. In the present research, six of
the nine elements are used to develop a strategy to minimize tourism leakage
from accommodation in Bali. The reason for using six elements was that these
were related to the research topic. The six elements are as follow:
1. Program goals (G)
2. Program needs (N)
3. Affected community (T)
4. Program constraints (C)
5. Possible changes in the program (M)
6. Involvement of agencies in the policy (A)
Each element consisted of sub-elements which have contextual relationships with
each other in accordance with the strategy to minimize tourism leakage in the
accommodation sector in Bali. The contextual relationships between these
elements are outlined in Table 4.8.

131
Table 4.8 Elements and Contextual Relationship between Elements
In Minimizing Tourism Leakage in Accommodation Sector in Bali
Elements Contextual Relationship 1. Program goals (Gi) Gi contribute in achieving Gj
2. Program needs (Ni) Ni supports Nj
3. Affected sectors (Ti) Ti its role influences Tj
4. Program constraints (Ci) Ci causes Cj
5. Possible changes in the program (Mi) Mi results in Mj
6. Involvement of agencies in program (Ai) Ai its role supports Aj
ij = 1,2,3 ... (i,j ≤ 10)
The initial process begins with an assessment of the contextual
relationship between each sub element on each element through brain-storming
with the experts. In conducting ISM research, experts must give their opinion
regarding the level of contextual relationship between sub-elements by filling in a
matrix of the contextual relationship with the appropriate letter: V, A, X or O.
These four letters are used to denote the direction of a relationship between two
factors (i and j), as follows:
1. V for the relation from factor i to factor j (i.e., factor i will influence factor j )
2. A for the relation from factor j to factor i (i.e., factor i will be influenced by
factor j).
3. X for a two-way relationship (i.e., factors i and j will influence each other)
4. for no relation between the factors (i.e., factors i and j are unrelated).
Based on the contextual relationships, the SSIM (Structural Self-Interaction
Matrix) is developed (Attri, et. al., 2013 and Reza et. al., 2010). The various
steps involved in ISM modeling are as follows:
1. Identify the elements which are relevant to the problem. This could be done
by a survey or group problem solving technique.
132
2. Establish a contextual relationship between elements with respect to which
pairs of elements would be examined. These contextual relationships
between elements were developed using a questionnaire. The questionnaire
is presented in Appendix 4.4, and the list of respondents can be seen in
Appendix 4.5.
3. Develop a structural self-interaction matrix (SSIM) of elements, based on
experts‟ opinion by using the questionnaire. This matrix indicates the pair-
wise relationship among elements of the system.
4. Develop a reachability matrix from the SSIM.
5. Partition the reachability matrix into different levels.
6. Convert the reachability matrix into conical form.
7. Draw a digraph based on the relationship given in the reachability matrix
and remove indirect links.
8. Transitive links.
9. Convert the resultant directed graphs (digraph) into an ISM-based model by
replacing element nodes with the statements.
10. Review the model to check for conceptual inconsistency and make the
necessary modifications.
The various steps involved in the ISM technique are illustrated in Appendix 4.6.
All steps 4 to 10 were undertaken by using the computer program “Ever Vision”
Software, dDSS Ver. 1.0.01, developed by Roni Wijaya.

133
4.7.3 Limitations of Interpretative Structural Modeling
According to (Attri and Sharma, 2013), there may be many variables to a
problem or issue. An increase in the number of variables to a problem or issue
will increase the complexity of the ISM methodology. Therefore, we can only
consider a limited number of variables in the development of a better ISM model.
Other variables which are least affecting a problem or issue may not be taken into
account in the development of the ISM model.
4.7.4 Conclusion
Some research methods were developed in this chapter in order to address
the objectives of this study, and help the researcher to understand the research
problems in more detail. In addition, by undertaking research on consumer
research on foreign tourists, it can help the researcher to understand what exactly
is needed by foreign tourists during their visit in Bali. By combining the results
regarding hotel managers‟ points of view, a strategy can be developed based on
ISM. This strategy will be useful for the long term development of tourism in
Bali.
134
CHAPTER V
RESULTS
5.1 Results of Micro Analysis of Tourism Leakage on Accommodation Sector
5.1.1 Introduction In this part, calculation of tourism leakage on accommodation sector in
Bali is undertaken in a micro analysis by using a method that was developed by
Unluonen et. al. (2011). Data was collected by a survey that was undertaken in
four main tourist destinations in Bali, namely: Kuta, Nusa Dua, Sanur and Ubud.
There were 79 hotels selected as sampling hotels. Sampling was undertaken
based upon a probability purposive to size sampling method. Description of
characteristics of the sampling hotels is explained in this part. Ownership and
management system applied in the hotels was also outlined in this part. Moreover,
description of imported products, services and foreign labour used by hotels were
discussed, as well as the sources of leakage at the hotels. Annual revenue of the
sampling hotels and other expenses are analysed in this section, as well as the
amount of tourism leakage on accommodation sector. Finally, this section will be
closed by conclusion.
5.1.2 Characteristics of the Sampling Hotels
Sample was selected based on a proportional purposive to size sampling
method (Kish, 1965; Yamane, 1973), involving three clusters of accommodation,
namely: (i) 1,2&3 Star-rated hotels, (ii) 4&5 Star-rated hotels either chain or non-
chain hotels, and (iii) Non-star rated hotels. There were 79 of hotels randomly

135
selected at the four main tourist destinations in Bali, namely: Kuta, Nusa Dua,
Sanur and Ubud. The sample size was exceeded the planned sample size in order
to reduce error (less than 20% of error), i.e. 21 samples of 1,2&3 Star-rated hotels
(18% of error), 12 samples of 4&5 Star-rated chain hotels and 14 samples of 4&5
Star-rated non-chain hotels (17% of error), and 32 hotels of Non-star rated hotels
(18% of error) (see Table 5.1.1).
Table 5.1.1 Number of Hotels Selected as Sample
No Cluster Population
(N) Sample Size
(n) Error
(α) Remarks
1. 1,2&3 Star-rated hotels 70 21 18% -
2. 4&5 Star-rated hotels 85 26 17% 12 chain hotels
14 non-chain hotels
3. Non-star rated hotels 1,563 32 18% -
Total 1,718 79 18%
As shown in Table 5.1.1, all of the sample sizes had an error below 20%. These
sample sizes fulfilled the requirements of accepted maximum error, i.e. 20%
(Sevilla et. al., 1993).
Locations of sampling hotels for the 4&5 Star-rated chain hotels were
mostly in the area of BTDC (Bali Tourism Development Corporation) at Nusa
Dua area, meanwhile for the 4&5 Star-rated non-chain hotels were mostly located
in Sanur and Kuta, and some of them were located in Ubud and Nusa Dua area.
On the other hand, 1,2&3 Star-rated hotels and Non-star hotels were spread out in
the area of Sanur, Kuta, and Ubud.
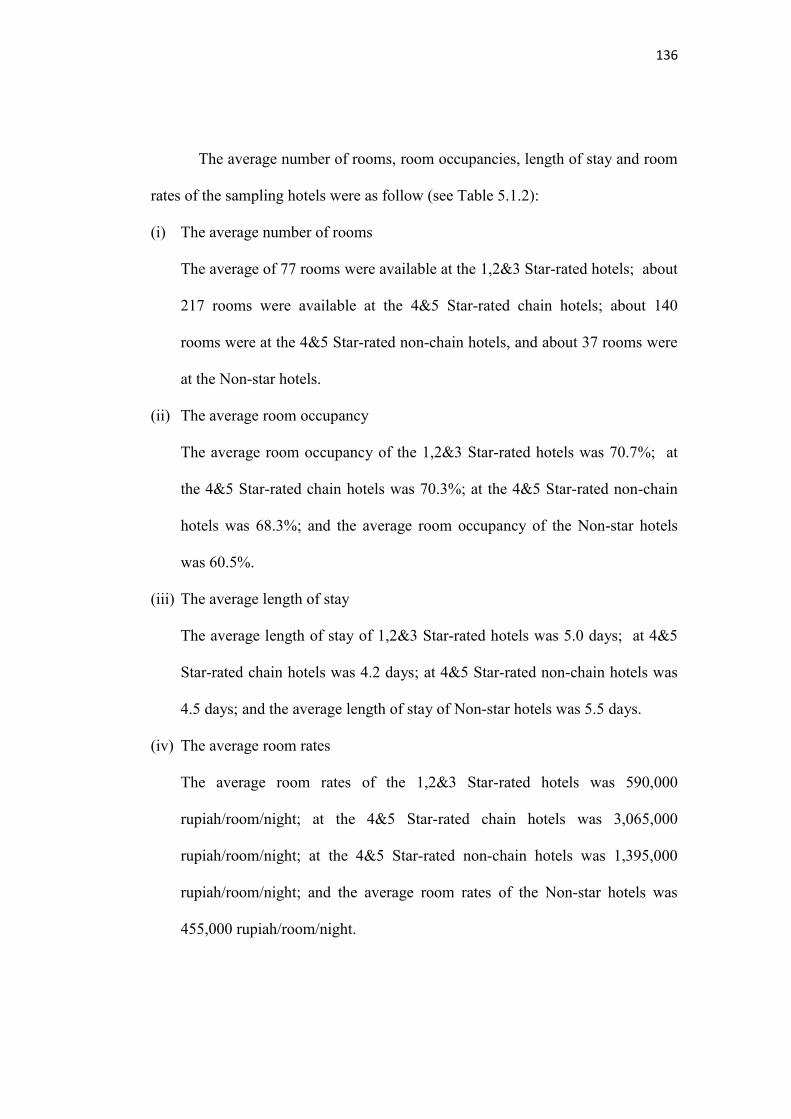
136
The average number of rooms, room occupancies, length of stay and room
rates of the sampling hotels were as follow (see Table 5.1.2):
(i) The average number of rooms
The average of 77 rooms were available at the 1,2&3 Star-rated hotels; about
217 rooms were available at the 4&5 Star-rated chain hotels; about 140
rooms were at the 4&5 Star-rated non-chain hotels, and about 37 rooms were
at the Non-star hotels.
(ii) The average room occupancy
The average room occupancy of the 1,2&3 Star-rated hotels was 70.7%; at
the 4&5 Star-rated chain hotels was 70.3%; at the 4&5 Star-rated non-chain
hotels was 68.3%; and the average room occupancy of the Non-star hotels
was 60.5%.
(iii) The average length of stay
The average length of stay of 1,2&3 Star-rated hotels was 5.0 days; at 4&5
Star-rated chain hotels was 4.2 days; at 4&5 Star-rated non-chain hotels was
4.5 days; and the average length of stay of Non-star hotels was 5.5 days.
(iv) The average room rates
The average room rates of the 1,2&3 Star-rated hotels was 590,000
rupiah/room/night; at the 4&5 Star-rated chain hotels was 3,065,000
rupiah/room/night; at the 4&5 Star-rated non-chain hotels was 1,395,000
rupiah/room/night; and the average room rates of the Non-star hotels was
455,000 rupiah/room/night.
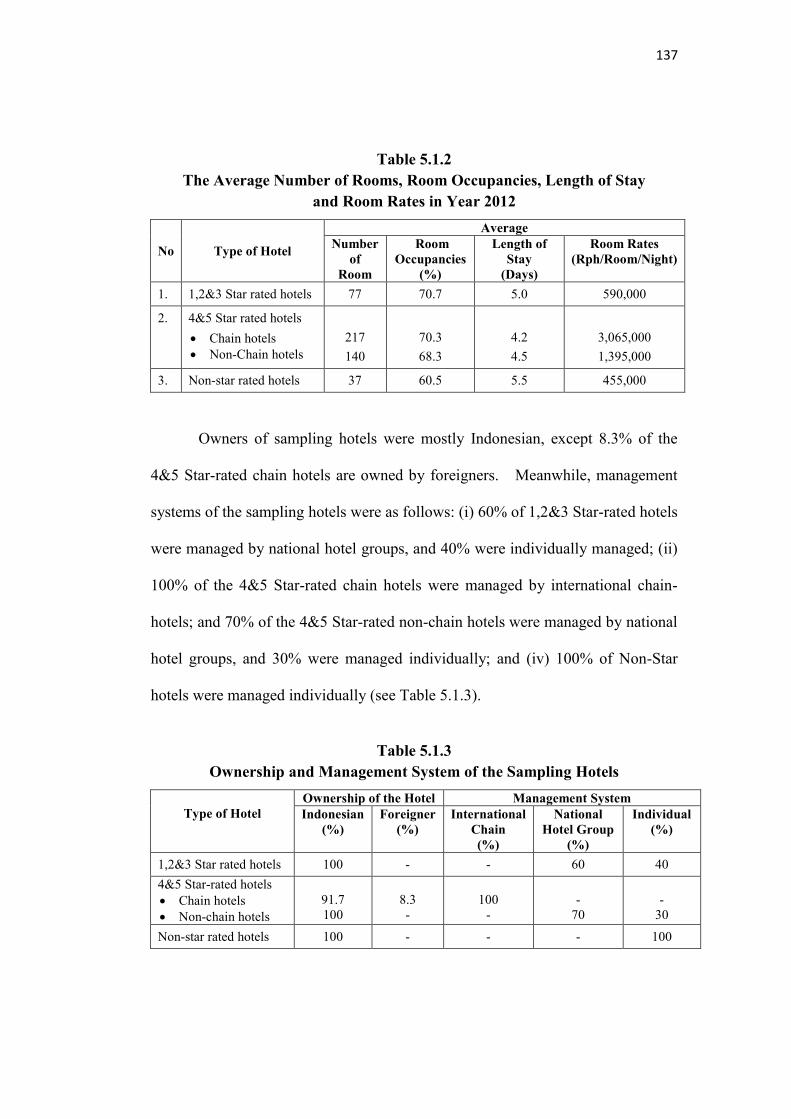
137
Table 5.1.2 The Average Number of Rooms, Room Occupancies, Length of Stay
and Room Rates in Year 2012
No Type of Hotel
Average Number
of Room
Room Occupancies
(%)
Length of Stay
(Days)
Room Rates (Rph/Room/Night)
1. 1,2&3 Star rated hotels 77 70.7 5.0 590,000
2. 4&5 Star rated hotels
Chain hotels
Non-Chain hotels
217
140
70.3
68.3
4.2
4.5
3,065,000
1,395,000
3. Non-star rated hotels 37 60.5 5.5 455,000
Owners of sampling hotels were mostly Indonesian, except 8.3% of the
4&5 Star-rated chain hotels are owned by foreigners. Meanwhile, management
systems of the sampling hotels were as follows: (i) 60% of 1,2&3 Star-rated hotels
were managed by national hotel groups, and 40% were individually managed; (ii)
100% of the 4&5 Star-rated chain hotels were managed by international chain-
hotels; and 70% of the 4&5 Star-rated non-chain hotels were managed by national
hotel groups, and 30% were managed individually; and (iv) 100% of Non-Star
hotels were managed individually (see Table 5.1.3).
Table 5.1.3 Ownership and Management System of the Sampling Hotels
Type of Hotel
Ownership of the Hotel Management System Indonesian
(%) Foreigner
(%) International
Chain (%)
National Hotel Group
(%)
Individual (%)
1,2&3 Star rated hotels 100 - - 60 40
4&5 Star-rated hotels
Chain hotels
Non-chain hotels
91.7 100
8.3 -
100
-
-
70
-
30
Non-star rated hotels 100 - - - 100

138
Employees at the sampling hotels were mostly Indonesian, except several
foreigners worked at the Star-rated hotels. The detail information of the
employees at the sampling hotels was as follows: (i) the average number of
employees in each 1,2&3 Star-rated hotels were 89 Indonesian (99.84 %) and 0.14
foreigners (0.16%); (ii) the average number of employees in each 4&5 Star-rated
chain hotels were 355 Indonesians (98.36%) and 6 foreigners (1.64%); at each
4&5 Star-rated non-chain hotels were 227 Indonesian (99.69 %) and 0.71
foreigners (0.31%); and (iii) the average number of employees in each Non-Star
hotels was 37 persons (100% Indonesians) (see Table 5.1.4).
Table 5.1.4 The Average of Indonesian and Foreign Employees of the Sampling Hotels
Type of Hotel
Employees Indonesian Foreigner
Persons (%) Persons (%)
1,2&3 Star-rated hotels 89 99.84 0.14 0.16
4&5 Star-rated hotels
Chain hotels
Non-chain hotels
355
227
98.36
99.69
6.00
0.71
1.64
0.31
Non-star rated hotels 37 100 - -
5.1.3 Description of Imported Products Used by Hotels
Variety and amount of imported products were different among types of
hotels (see Table 5.1.5). In all types of hotels, the highest variety and amount of
imported products were bought by 4&5 Star-rated chain hotel. It was followed by
4&5 Star-rated non-chain hotels and 1,2&3 Star-rated hotels. The lowest variety
and amount of imported products were bought by Non Star-rated hotel. Types of
139
products that were imported by Star-rated hotels were foods, beverages and dairy
products, fruits and vegetables, and utensils and equipment. On the other hand,
Non-star rated hotels imported foods, beverages and dairy products only.
In term of imported foods, beef was the most imported meat by all types of
sampling hotels, followed by lamb and salmon. Even though all types of Star-
rated hotels imported meats, but some kinds of meats such as chicken, pork, and
duck were supplied locally. All fisheries products such as fish, prawn, lobster,
crab, squid, shell, and scallop were also supplied locally, except salmon. Some
other foodstuffs were also imported by most Star-rated hotels, such as cheese,
butter, olive oil, mayonnaise, pasta, spaghetti, tomato paste, sundried tomato,
tabasco, origano, asparagus, fettuccini, mozzarella, sunflower seed, oats, almond,
cherries, berlotti bean and tortilla flour. The Non star-rated hotels only imported
beef and lamb.
Various fruits and vegetables were also imported by all Star-rated hotels.
The imported fruits and vegetables included apples, red and green grapes,
oranges, lettuce, baby romaine, and celery. However, Non-star rated hotels did
not import fruits and vegetables. They bought local fruits and vegetables because
they preferred local fruits and vegetables to serve their guests.
Types of imported alcoholic beverages in all Star-rated hotels were
dominated by wine, liquor, tequila, absolut vodka and civas regal. Meanwhile, in
Non-star rated hotels, imported beverages were dominated by wine and only small
amount of other alcoholic beverages. In addition, dairy products were also mostly
imported by all types of Star-rated hotels. Moreover, several types of imported

140
cutleries, utensils, and other equipment were imported by all types of Star-rated
hotels. However, this kind of products was not imported by Non Star-rated hotels.
Table 5.1.5 Imported Products in the Sampling Hotels
Type of Hotels
Imported Products
Foods Beverages and Dairy Products
Fruits and Vegetables
Utensils &
Equipment’s
1,2&3 Star-rated hotels √ √ √ √
4&5Star-rated hotels
Chain hotels
Non-chain hotels
√
√
√
√
√
√
√
√
Non-star rated hotels √ √ X X
The amount of imported products bought by all type of hotels could be
seen from the amount of expenditure by each type of hotels, as follow (See Table
5.1.6):
(i) 4&5 Star-rated chain hotels. The average of annual expenditure per hotel
for foods was 60,449,912,377 rupiah; for beverages and dairy products
was 215,905,143,409 rupiah; for fruits and vegetables was 1,648,298,590
rupiah; and for utensils and equipment was 1,521,407,622 rupiah.
(ii) 4&5 Star-rated non-chain hotels. The average of annual expenditure per
hotel for foods was 1,061,941,074 rupiah; for beverages and dairy
products was 11,824,311,429 rupiah; for fruits and vegetables was
89,472,114 rupiah; and for utensils and equipment was 54,804,143 rupiah.
(iii) Non-star rated hotels. The average of annual expenditure per hotel for
foods was 54,960,125 rupiah; and for beverages and dairy products was
287,433,883 rupiah.
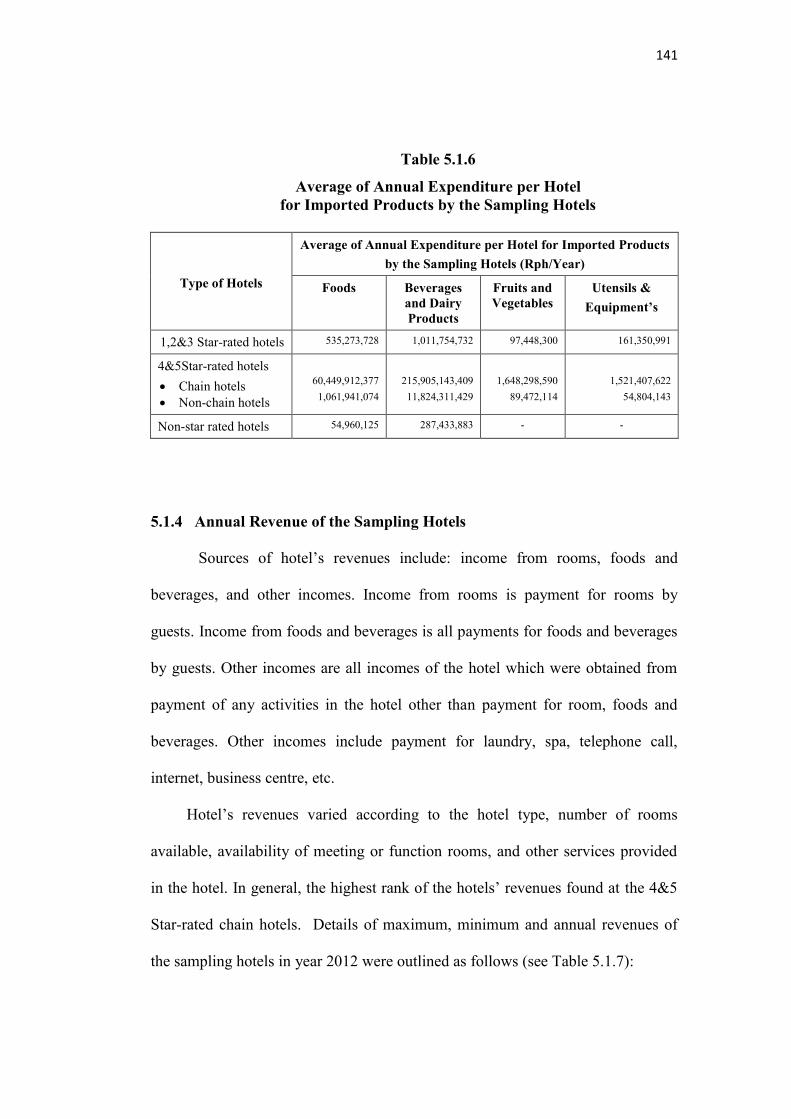
141
Table 5.1.6
Average of Annual Expenditure per Hotel for Imported Products by the Sampling Hotels
Type of Hotels
Average of Annual Expenditure per Hotel for Imported Products
by the Sampling Hotels (Rph/Year)
Foods Beverages and Dairy Products
Fruits and Vegetables
Utensils &
Equipment’s
1,2&3 Star-rated hotels 535,273,728 1,011,754,732 97,448,300 161,350,991
4&5Star-rated hotels
Chain hotels
Non-chain hotels
60,449,912,377
1,061,941,074
215,905,143,409
11,824,311,429
1,648,298,590
89,472,114
1,521,407,622
54,804,143
Non-star rated hotels 54,960,125 287,433,883 - -
5.1.4 Annual Revenue of the Sampling Hotels
Sources of hotel’s revenues include: income from rooms, foods and
beverages, and other incomes. Income from rooms is payment for rooms by
guests. Income from foods and beverages is all payments for foods and beverages
by guests. Other incomes are all incomes of the hotel which were obtained from
payment of any activities in the hotel other than payment for room, foods and
beverages. Other incomes include payment for laundry, spa, telephone call,
internet, business centre, etc.
Hotel’s revenues varied according to the hotel type, number of rooms
available, availability of meeting or function rooms, and other services provided
in the hotel. In general, the highest rank of the hotels’ revenues found at the 4&5
Star-rated chain hotels. Details of maximum, minimum and annual revenues of
the sampling hotels in year 2012 were outlined as follows (see Table 5.1.7):
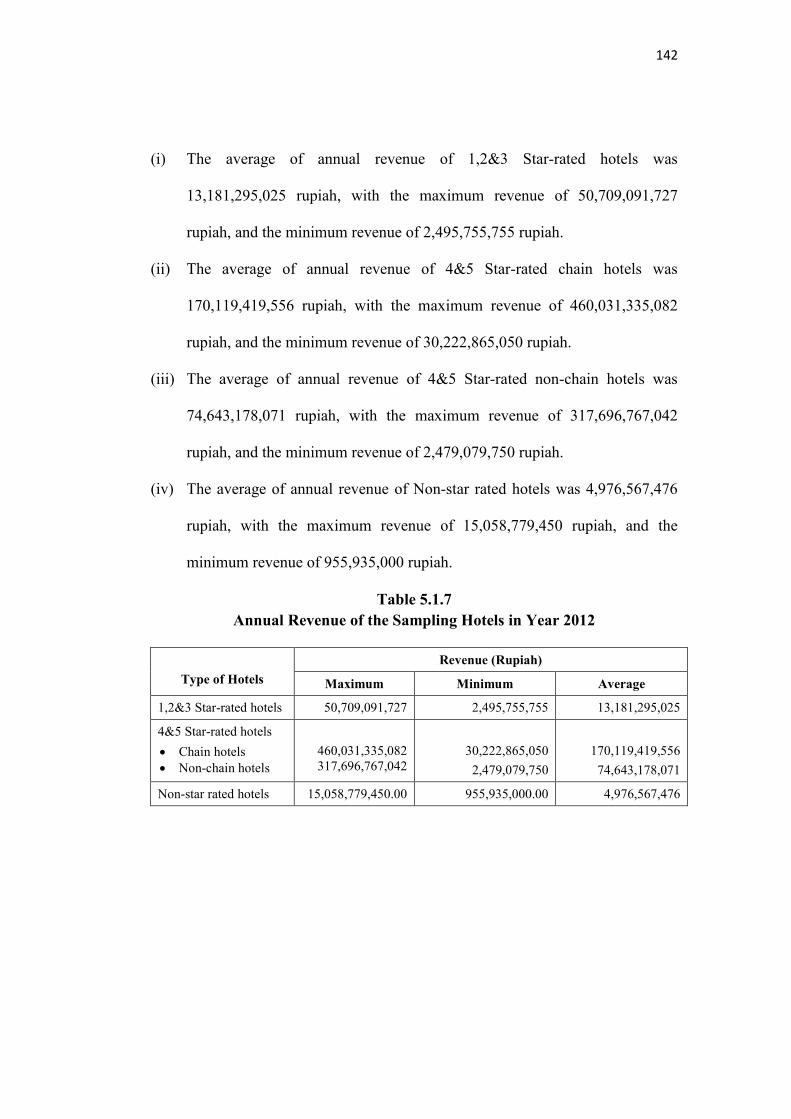
142
(i) The average of annual revenue of 1,2&3 Star-rated hotels was
13,181,295,025 rupiah, with the maximum revenue of 50,709,091,727
rupiah, and the minimum revenue of 2,495,755,755 rupiah.
(ii) The average of annual revenue of 4&5 Star-rated chain hotels was
170,119,419,556 rupiah, with the maximum revenue of 460,031,335,082
rupiah, and the minimum revenue of 30,222,865,050 rupiah.
(iii) The average of annual revenue of 4&5 Star-rated non-chain hotels was
74,643,178,071 rupiah, with the maximum revenue of 317,696,767,042
rupiah, and the minimum revenue of 2,479,079,750 rupiah.
(iv) The average of annual revenue of Non-star rated hotels was 4,976,567,476
rupiah, with the maximum revenue of 15,058,779,450 rupiah, and the
minimum revenue of 955,935,000 rupiah.
Table 5.1.7 Annual Revenue of the Sampling Hotels in Year 2012
Type of Hotels
Revenue (Rupiah)
Maximum Minimum Average
1,2&3 Star-rated hotels 50,709,091,727 2,495,755,755 13,181,295,025
4&5 Star-rated hotels
Chain hotels
Non-chain hotels
460,031,335,082 317,696,767,042
30,222,865,050
2,479,079,750
170,119,419,556
74,643,178,071
Non-star rated hotels 15,058,779,450.00 955,935,000.00 4,976,567,476
143
5.1.5 Tourism Leakage of the Sampling Hotels
5.1.5.1 Sources of Tourism Leakage
Accommodation is one of the main sources of leakage in tourism industry.
Percentage of leakage will depend on the amount of import components that were
consumed by hotels. According to Platullo (1996), high levels of tourism leakage
in modern tourism development emerge from tour package in tourism, such as
accommodation, meals, airline and ground transportation.
In general, the sources of leakage of the sampling hotels were as follows:
(i) Imported foods, i.e. all imported foods that were used by hotels to serve
their guests.
(ii) Imported beverages, i.e. all imported beverages that were used in hotels to
serve their guests.
(iii) Imported of fruit and vegetables, i.e. all imported fruit and vegetables that
were used in hotels to serve their guests.
(iv) Imported utensils and equipment, i.e. all imported utensils and equipment
that were used in hotels.
(v) Overseas marketing or education, i.e. all overseas activities that were
undertaken by hotel’s personnel to improve the ability of staffs and/or to
improve the performance of hotels. These activities include promotion and
other marketing activities as well as training for staffs and hotel
management that was done outside the country.
(vi) Payment for foreign employees, i.e. payment for foreign employees.
144
(vii) Payment for booking fees, i.e. payment for booking fees that was paid to
overseas travel agents.
(viii) Payment for online fees, i.e. payment for online agent in overseas.
(ix) Management fee, i.e. payment for the international chain hotel management
system.
(x) Profit transfer for foreign owners, i.e. profit which was transferred to
owners in overseas.
5.1.5.2 Calculation of Revenue and Leakage of the Sampling Hotels Revenue of a hotel can be calculated as below: n
Y = ∑Yi
1
Y = Y1 + Y2 + Y3 . . . . . . . . . . . . . . . . . . (1) where:
Y = Annual revenue of a sampling hotel
Y1 = Revenue from rooms
Y2 = Revenue from selling foods and beverages
Y3 = Revenue from others (laundry, spa, telephone, internet, business centre, etc.)
Based on the sources of revenue, an example of calculation for annual
revenue of a sampling hotel is as follow:
Type of hotel : 4&5 Star-rated chain hotel
Code of sampling hotel : 3
Calculation of the annual revenue of this hotel included:
(i) Revenue from rooms (Y1) = Rph 213,952,596,624
(ii) Revenue from selling foods and beverages (Y2) = Rph 76,411,641,651
(iii) Revenue from others: laundry, spa, etc. (Y3) = Rph 15,282,328,330
The annual revenue of this hotel was = Y1+ Y2 + Y3 = Rph 305,646,566,605

145
Tourism leakage of a hotel can be calculated as below: n L = ∑Li
1
L = L1 + L2 + L3 + L4 . . . + L10 . . . . . . . . . . . . . . . . (2)
where:
L = Annual tourism leakage of a sampling hotel
L1 = Payment for imported foods
L2 = Payment for imported beverages
L3 = Payment for imported fruit and vegetables
L4 = Payment for imported utensils and equipment
L5 = Payment for overseas marketing or training
L6 = Payment for foreign employees
L7 = Payment for booking fees
L8 = Payment for online fees
L9 = Payment for management fees
L10 = Profit transfer for foreign owners
Based on the sources of tourism leakage, an example of calculation for
annual leakage of a sampling hotel is as follow:
Type of hotel : 4&5 Star-rated chain hotel
Code of sampling hotel : 3
Calculation of the annual leakage of this hotel included:
(i) Payment for imported foods (L1) = Rph 12,582,810,648
(ii) Payment for imported beverages (L2) = Rph 120,610,800,000
(iii) Payment for imported fruit and vegetables (L3) = Rph 112,512,000
(iv) Payment for imported utensils and equipment (L4) = Rph 104,800,000
(v) Payment for overseas marketing or training (L5) = Rph 3,000,000,000
(vi) Payment for foreign employees (L6) = Rph 1,500,000,000
(vii) Payment for booking fee (L7) = Rph 530,904,290
(viii) Payment for online fee (L8) = Rph 5,990,672,705
(ix) Payment for management fee (L9) = Rph 6,112,931,332
(x) Profit transfer for foreign owners (L10) = Rph 0
The annual leakage of this hotel was = Y1+ … + Y10 = Rph 150,545,430,975
146
Therefore, percentage of leakage of one hotel can be calculated as below: Percentage of leakage = Total Leakage x 100% . . . . . . . . (3) Total Revenue
Based on the calculation of revenue and leakage outlined above, the percentage of
tourism leakage of the sampling hotel was:
Percentage of Leakage = Total Leakage x 100% Total Revenue = Rph 150,545,430,975 x 100% Rph 305,646,566,605 = 49.25 %
More details of the calculation of revenue and leakage of all sampling hotels are
shown in Appendix 5.1, 5.2, 5.3, and 5.4.
5.1.5.3 Average Tourism Leakage of the Sampling Hotels
Based on the calculations of revenue and leakage of all sampling hotels
that are shown in the Appendix 5.1, 5.2, 5.3, and 5.4, the average tourism leakage
of the sampling hotels were as follows:
(i) the average leakage of the 1,2&3 Star-rated hotels was 12.0 %;
(ii) the average leakage of the 4&5 Star-rated chain hotels was 51.0 %;
(iii) the average leakage of the 4&5 Star-rated non-chain hotels was 22.7 %; and
(iv) the average leakage of the Non-star rated hotels was 8.8 % (see Table 5.1.8
and Figure 5.1).
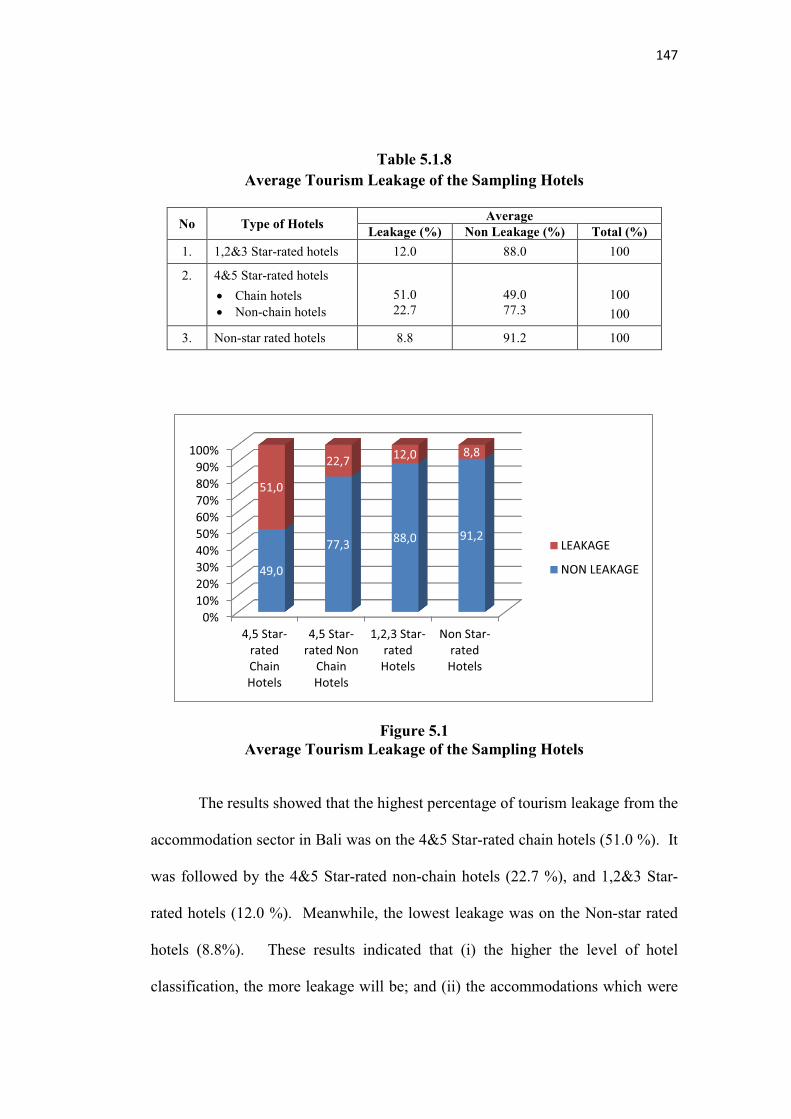
148
owned by foreigners and/or managed by international chain hotel systems have
more leakage than other type of accommodations. The more leakage, therefore
the less revenue from tourism will be received by the host country and
community. In another word, more profit from tourism will go to outside of the
country. It is suggested that for future development of accommodation sector in
Bali, priority should be given to accommodations which are owned and/or
managed by local and national company in order to minimize the leakage and to
maximize the benefits for local community.
5.1.5.4 The Sequence of the Sources of Tourism Leakage
Based on the survey undertaken on 79 hotels, the sequence of the sources
of leakage were as follow:
(i) Overall, imported beverages were the first source of leakage in all types of
hotels. Meanwhile, profit transfer for foreign owners was also the main
source of leakage in 4&5 Star-rated chain hotel. This was the second source
of leakage after imported beverages. In 4&5 Star-rated chain hotel,
management fees paid to international chain management were the third
source of leakage.
(ii) Imported foods and payment for online fees also played a crucial role as the
sources of leakage in mostly all type of hotels. In 4&5 Star-rated chain and
non-chain hotels, the payment for foreign employees was also a significant
source of leakage.
(iii) Imported fruit and vegetables were also as source of leakage especially for
all Star-rated hotels.
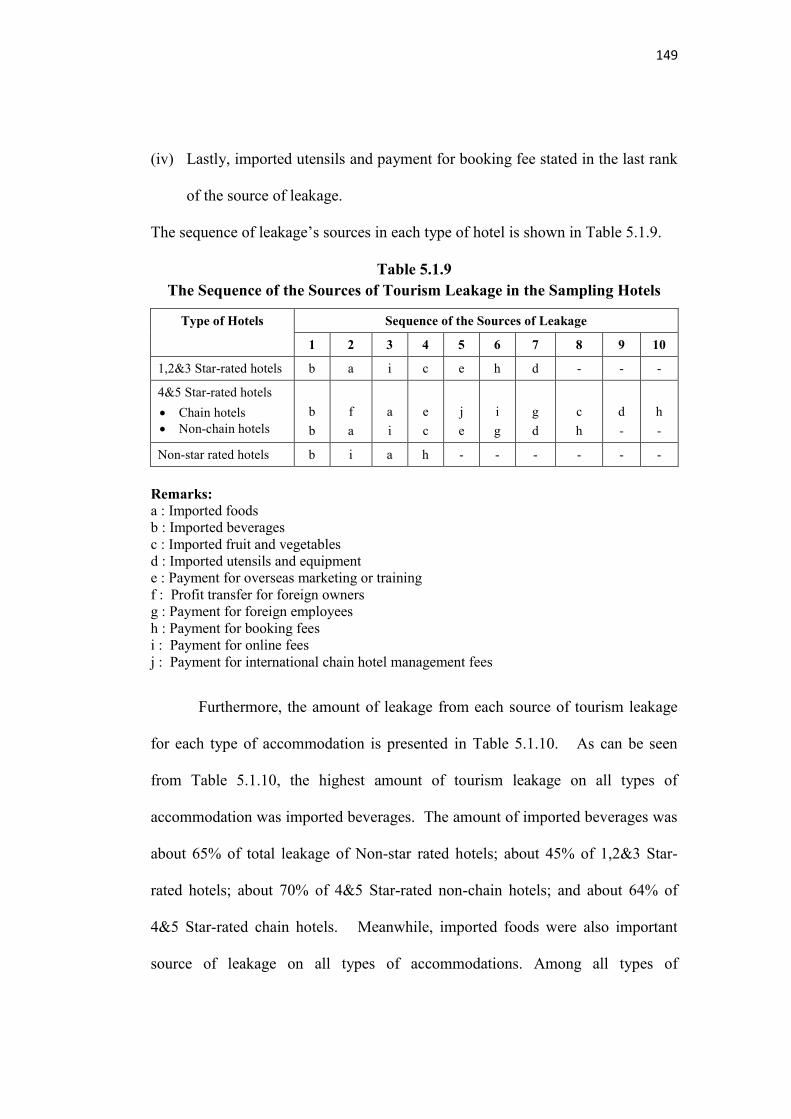
149
(iv) Lastly, imported utensils and payment for booking fee stated in the last rank
of the source of leakage.
The sequence of leakage’s sources in each type of hotel is shown in Table 5.1.9.
Table 5.1.9 The Sequence of the Sources of Tourism Leakage in the Sampling Hotels
Type of Hotels Sequence of the Sources of Leakage
1 2 3 4 5 6 7 8 9 10
1,2&3 Star-rated hotels b a i c e h d - - -
4&5 Star-rated hotels
Chain hotels
Non-chain hotels
b
b
f
a
a
i
e
c
j
e
i
g
g
d
c
h
d
-
h
-
Non-star rated hotels b i a h - - - - - -
Remarks: a : Imported foods b : Imported beverages c : Imported fruit and vegetables d : Imported utensils and equipment e : Payment for overseas marketing or training f : Profit transfer for foreign owners g : Payment for foreign employees h : Payment for booking fees i : Payment for online fees j : Payment for international chain hotel management fees
Furthermore, the amount of leakage from each source of tourism leakage
for each type of accommodation is presented in Table 5.1.10. As can be seen
from Table 5.1.10, the highest amount of tourism leakage on all types of
accommodation was imported beverages. The amount of imported beverages was
about 65% of total leakage of Non-star rated hotels; about 45% of 1,2&3 Star-
rated hotels; about 70% of 4&5 Star-rated non-chain hotels; and about 64% of
4&5 Star-rated chain hotels. Meanwhile, imported foods were also important
source of leakage on all types of accommodations. Among all types of
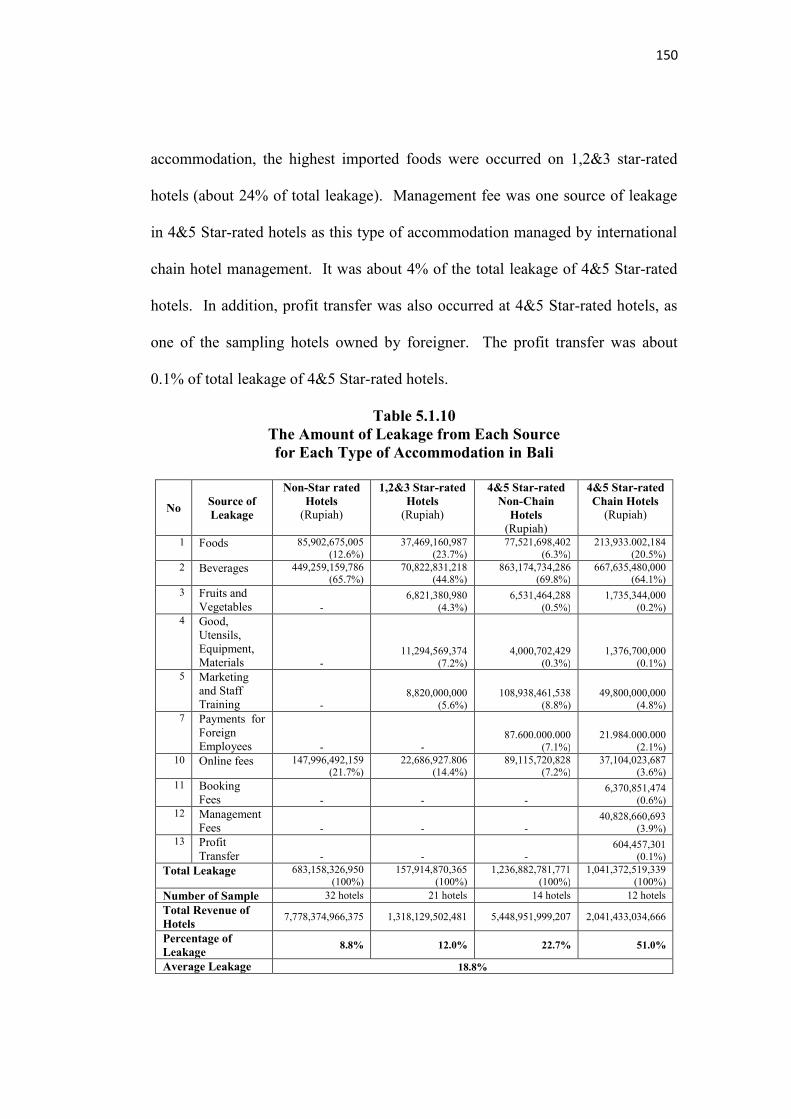
150
accommodation, the highest imported foods were occurred on 1,2&3 star-rated
hotels (about 24% of total leakage). Management fee was one source of leakage
in 4&5 Star-rated hotels as this type of accommodation managed by international
chain hotel management. It was about 4% of the total leakage of 4&5 Star-rated
hotels. In addition, profit transfer was also occurred at 4&5 Star-rated hotels, as
one of the sampling hotels owned by foreigner. The profit transfer was about
0.1% of total leakage of 4&5 Star-rated hotels.
Table 5.1.10 The Amount of Leakage from Each Source for Each Type of Accommodation in Bali
No Source of Leakage
Non-Star rated Hotels
(Rupiah)
1,2&3 Star-rated Hotels
(Rupiah)
4&5 Star-rated Non-Chain
Hotels (Rupiah)
4&5 Star-rated Chain Hotels
(Rupiah)
1 Foods 85,902,675,005 (12.6%)
37,469,160,987 (23.7%)
77,521,698,402 (6.3%)
213,933.002,184 (20.5%)
2 Beverages 449,259,159,786 (65.7%)
70,822,831,218 (44.8%)
863,174,734,286 (69.8%)
667,635,480,000 (64.1%)
3 Fruits and Vegetables -
6,821,380,980 (4.3%)
6,531,464,288 (0.5%)
1,735,344,000 (0.2%)
4 Good, Utensils, Equipment, Materials -
11,294,569,374 (7.2%)
4,000,702,429 (0.3%)
1,376,700,000 (0.1%)
5 Marketing and Staff Training -
8,820,000,000 (5.6%)
108,938,461,538 (8.8%)
49,800,000,000 (4.8%)
7 Payments for Foreign Employees - -
87.600.000.000 (7.1%)
21.984.000.000 (2.1%)
10 Online fees 147,996,492,159 (21.7%)
22,686,927.806 (14.4%)
89,115,720,828 (7.2%)
37,104,023,687 (3.6%)
11 Booking Fees - - -
6,370,851,474 (0.6%)
12 Management Fees - - -
40,828,660,693 (3.9%)
13 Profit Transfer - - -
604,457,301 (0.1%)
Total Leakage 683,158,326,950 (100%)
157,914,870,365 (100%)
1,236,882,781,771 (100%)
1,041,372,519,339 (100%)
Number of Sample 32 hotels 21 hotels 14 hotels 12 hotels
Total Revenue of Hotels
7,778,374,966,375 1,318,129,502,481 5,448,951,999,207 2,041,433,034,666
Percentage of Leakage
8.8% 12.0% 22.7% 51.0%
Average Leakage 18.8%
151
5.1.6 Conclusion
Calculation of tourism leakage on accommodation sector in Bali showed
that the highest percentage of leakage of the sampling hotels on accommodation
sector was on the 4&5 Star-rated chain hotels (51.0 %), followed by the 4&5 Star-
rated non-chain hotels (22.7%), and 1,2&3 Star-rated hotels (12.0%). Meanwhile,
the lowest leakage was on the Non-star rated hotels (8.8 %). Overall, the average
tourism leakage on accommodation sector in Bali was 18.8 %.
These results indicate that (i) the higher the level of hotel classifications,
the more leakage will be; and (ii) accommodation which was owned by foreigner
and/or managed by international chain hotel system had more leakage than other
types of accommodation. The more leakage, therefore the less revenue from
tourism will be received by the host country and community. In another word,
more profit from tourism will go to outside of the country.
It was found that sources of leakage were imported food and beverages,
payment for booking fees, online fees, and management fees. Payment for profit
transfer for the ownership of the accommodation was also been found as source of
tourism leakage on 4&5 Star-rated chain hotels.
152
5.2 Results of Macro Analysis of Tourism Leakage on Accommodation Sector
5.2.1 Introduction
In this part, tourism leakage from accommodation sector in Bali is
calculated in macro analysis by using Social Accounting Matrix (SAM) approach.
SAM Hotels of Bali tourism was developed in a matrix_31x31 which was based
on Social Accounting Matrix of Bali Province 2010 and other related data from
Central Bureau Statistic of Bali Province. In order to ascertain the amount of
leakage from each type of accommodation, description of account of receipt-
expenditure and account of production of each hotel type is outlined. Then, it is
continued with the calculation of leakage of each hotel type. This part is closed
by conclusion.
5.2.2 Description of Account for Each Type of Hotel
5.2.2.1 Receipt-Expenditure Account and Production Account of Non-star Rated Hotels
a. Receipt-Expenditure Account of Non-star Rated Hotels
Receipt-Expenditure account depicts linkages between receipt account and
expenditure account. Based on Matrix SAM_31x31 (see Appendix 4.3), sources
of receipt of Non Star-rated hotels in Bali were: (i) Income which was generated
as payment of production factors of non labour. It was about 269.56 billion
rupiah (row 12 column 6 of Matrix SAM_31x31 in Appendix 4.3); (ii) Transfer
from household was about 24.20 million rupiah (row 12 column 11); (iii) Transfer
between hotels was about 77.06 billion rupiah (sum of row 12 column 12 up to
row 12 column 16); (iv) Transfer from government was about 61.02 million
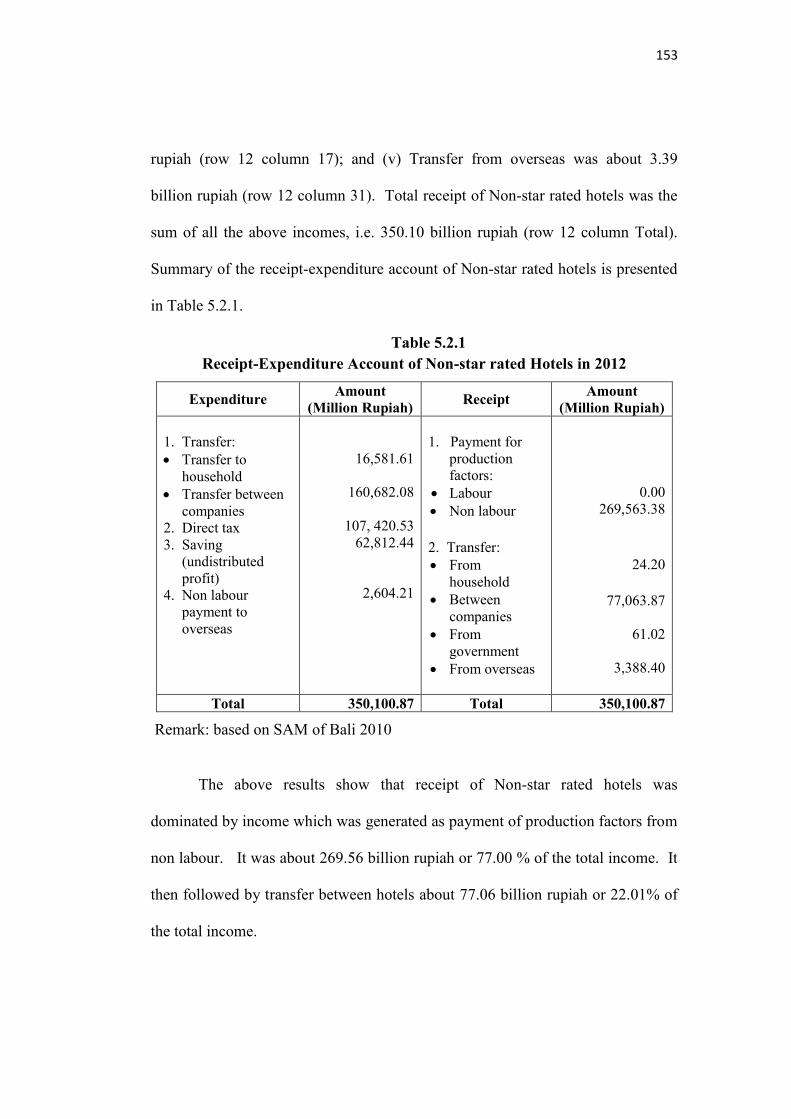
153
rupiah (row 12 column 17); and (v) Transfer from overseas was about 3.39
billion rupiah (row 12 column 31). Total receipt of Non-star rated hotels was the
sum of all the above incomes, i.e. 350.10 billion rupiah (row 12 column Total).
Summary of the receipt-expenditure account of Non-star rated hotels is presented
in Table 5.2.1.
Table 5.2.1 Receipt-Expenditure Account of Non-star rated Hotels in 2012
Expenditure Amount
(Million Rupiah) Receipt
Amount (Million Rupiah)
1. Transfer: Transfer to
household
Transfer between companies
2. Direct tax 3. Saving
(undistributed profit)
4. Non labour payment to overseas
16,581.61
160,682.08
107, 420.53 62,812.44
2,604.21
1. Payment for
production factors:
Labour
Non labour
2. Transfer:
From household
Between companies
From government
From overseas
0.00 269,563.38
24.20
77,063.87
61.02
3,388.40
Total 350,100.87 Total 350,100.87
Remark: based on SAM of Bali 2010
The above results show that receipt of Non-star rated hotels was
dominated by income which was generated as payment of production factors from
non labour. It was about 269.56 billion rupiah or 77.00 % of the total income. It
then followed by transfer between hotels about 77.06 billion rupiah or 22.01% of
the total income.
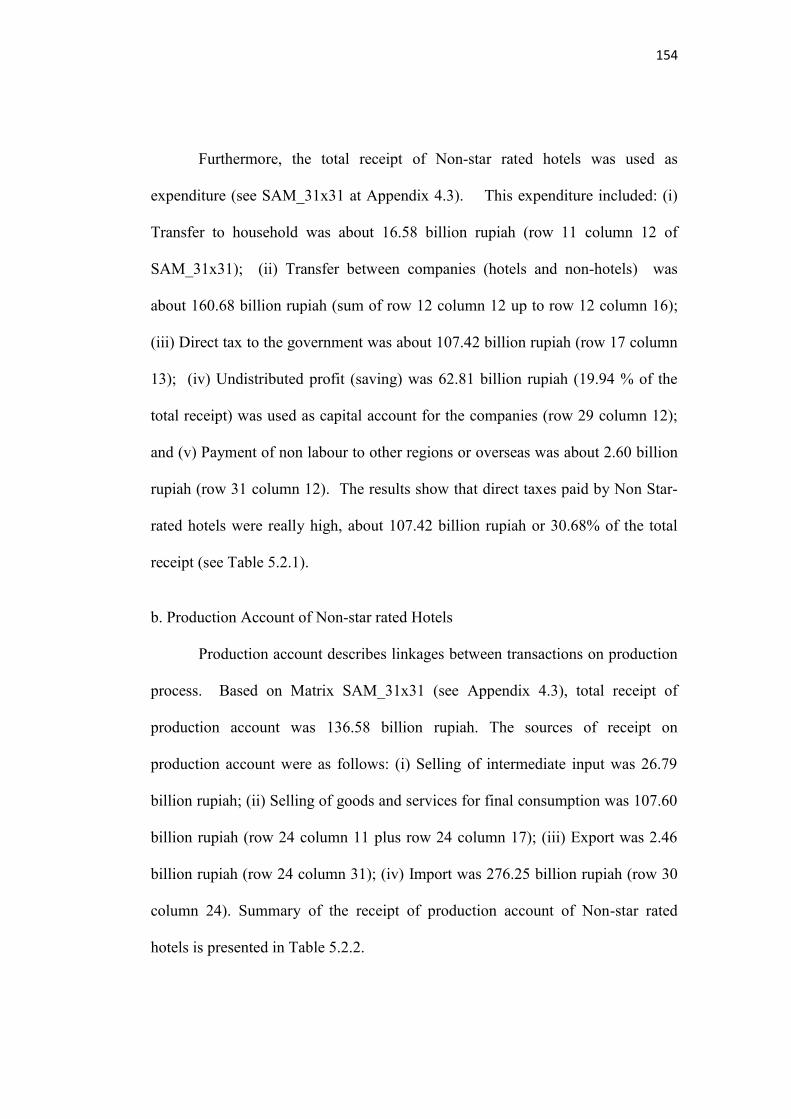
154
Furthermore, the total receipt of Non-star rated hotels was used as
expenditure (see SAM_31x31 at Appendix 4.3). This expenditure included: (i)
Transfer to household was about 16.58 billion rupiah (row 11 column 12 of
SAM_31x31); (ii) Transfer between companies (hotels and non-hotels) was
about 160.68 billion rupiah (sum of row 12 column 12 up to row 12 column 16);
(iii) Direct tax to the government was about 107.42 billion rupiah (row 17 column
13); (iv) Undistributed profit (saving) was 62.81 billion rupiah (19.94 % of the
total receipt) was used as capital account for the companies (row 29 column 12);
and (v) Payment of non labour to other regions or overseas was about 2.60 billion
rupiah (row 31 column 12). The results show that direct taxes paid by Non Star-
rated hotels were really high, about 107.42 billion rupiah or 30.68% of the total
receipt (see Table 5.2.1).
b. Production Account of Non-star rated Hotels
Production account describes linkages between transactions on production
process. Based on Matrix SAM_31x31 (see Appendix 4.3), total receipt of
production account was 136.58 billion rupiah. The sources of receipt on
production account were as follows: (i) Selling of intermediate input was 26.79
billion rupiah; (ii) Selling of goods and services for final consumption was 107.60
billion rupiah (row 24 column 11 plus row 24 column 17); (iii) Export was 2.46
billion rupiah (row 24 column 31); (iv) Import was 276.25 billion rupiah (row 30
column 24). Summary of the receipt of production account of Non-star rated
hotels is presented in Table 5.2.2.

155
Furthermore, the receipt of Non-star rated hotels was used to some
activities or expenditures, as follow: (i) Purchasing for intermediate input was
about 58.43 billion rupiah (sum of row 24 column 18 up to row 28 column 18 of
SAM_31x31); (ii) Payment for labour wages and salaries was about 53.29 billion
rupiah (row 1 column 18); (iii) Surplus of the companies was about 23.34 billion
rupiah (row 6 column 18); (iv) Payment for indirect taxes was about 1.52 billion
rupiah (row 30 column 24). Summary of the production account of Non-star rated
hotels is presented in Table 5.2.2. As shown in Table 5.2.2, the highest
expenditure of Non-star rated hotels was for purchasing intermediate input (raw
materials). It was about 58.43 billion rupiah or 42.78% of the total expenditure. It
was followed by purchasing for labour payment about 53.29 billion rupiah or
39.02% of the total expenditure.
Table 5.2.2 Production Account of Non-star rated Hotels in 2012
Expenditure Amount
(Million Rupiah) Receipt
Amount (Million Rupiah)
1. Purchasing
intermediate demand
2. Wages and salaries 3. Companies’ Surplus 4. Indirect tax
58,432.32
53,292.15 23,338.94 1,515.46
1. Selling
intermediate demand
2. Selling goods and services
3. Selling capital goods
4. Export 5. Import
26,793.04
107,603.11
0.00
2,458.97 276.25
Total 136,578.87 Total 136,578.87
Remark: based on SAM of Bali 2010
156
5.2.2.2 Receipt-Expenditure Account and Production Account of 1,2&3 Star-rated Hotels
a. Receipt-Expenditure Account of 1,2&3 Star-rated Hotels
Based on Matrix SAM_31x31 (see Appendix 4.3), sources of receipt of
1,2&3 Star-rated hotels in Bali were: (i) Income which was generated as payment
of production factors of non labour. It was about 8.13 trillion rupiah (sum of
row 13 column 6 up to row 13 column 10 of Matrix SAM_31x31); (ii) Transfer
from household was about 1.41 billion rupiah (row 13 column 11); (iii) Transfer
between hotels was about 183.03 billion rupiah (sum of row 13 column 12 up to
row 13 column 16); (iv) Transfer from government was about 911.28 million
rupiah (row 13 column 17); and (v) Transfer from overseas about 79.70 billion
rupiah (row 13 column 31). Total receipt of 1,2&3 Star-rated hotels was 8,391.84
billion rupiah (row 13 column Total). Summary of the receipt-expenditure
account of 1,2&3 Star-rated hotels is presented in Table 5.2.3. The results in this
table show that the highest contributor to the receipt account of 1,2&3 Star-rated
hotels was payment from production factors from non labour. It was 96.84% of
the total receipt. Others were very small, such as income between companies
(2.18%) and transfer from overseas (0.95%).
Meanwhile, referred to Matrix SAM_31x31 (see Appendix 4.3), the
expenditure of 1,2&3 Star-rated hotels consisted of several activities, namely: (i)
Transfer to household was 850.39 billion rupiah (row 11 column 13 of
SAM_31x31); (ii) Transfer between companies (hotels and non-hotels) was
283.04 billion rupiah (sum of row 12 column 13 up to row 16 column 13); (iii)
Direct tax to the government was 4.25 trillion rupiah (row 17 column 13); (iv)
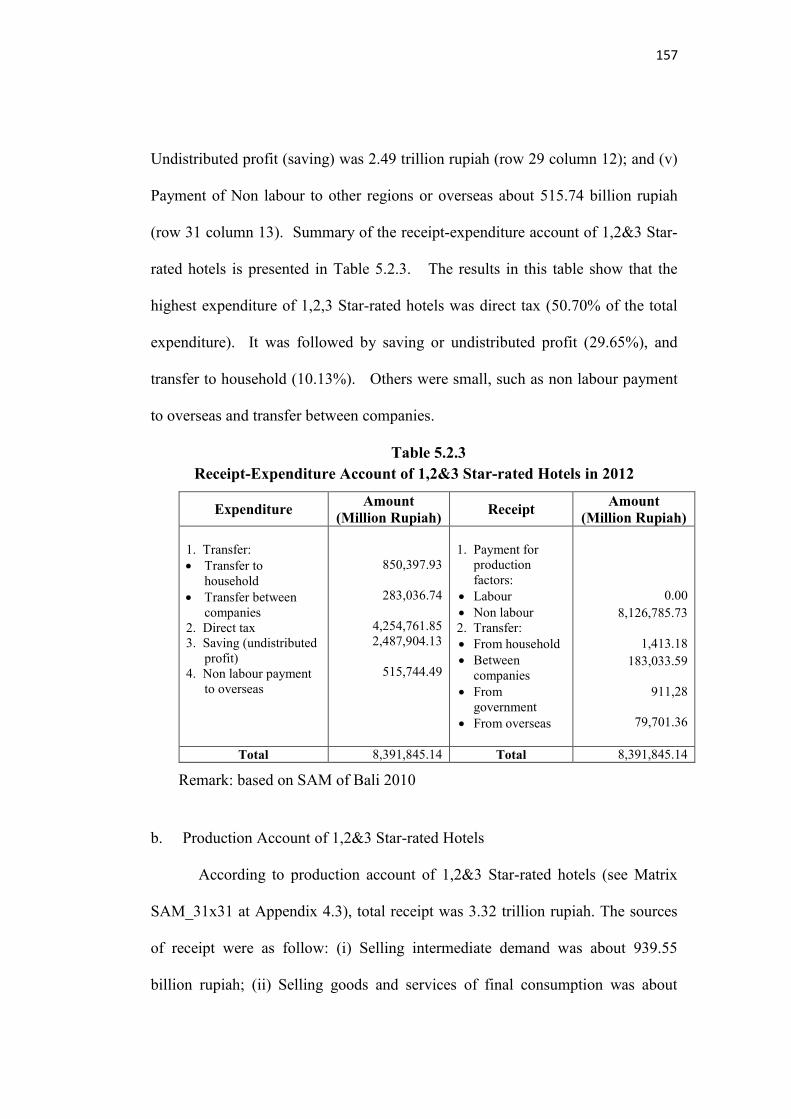
157
Undistributed profit (saving) was 2.49 trillion rupiah (row 29 column 12); and (v)
Payment of Non labour to other regions or overseas about 515.74 billion rupiah
(row 31 column 13). Summary of the receipt-expenditure account of 1,2&3 Star-
rated hotels is presented in Table 5.2.3. The results in this table show that the
highest expenditure of 1,2,3 Star-rated hotels was direct tax (50.70% of the total
expenditure). It was followed by saving or undistributed profit (29.65%), and
transfer to household (10.13%). Others were small, such as non labour payment
to overseas and transfer between companies.
Table 5.2.3 Receipt-Expenditure Account of 1,2&3 Star-rated Hotels in 2012
Expenditure Amount
(Million Rupiah) Receipt
Amount (Million Rupiah)
1. Transfer: Transfer to
household
Transfer between companies
2. Direct tax 3. Saving (undistributed
profit) 4. Non labour payment
to overseas
850,397.93
283,036.74
4,254,761.85 2,487,904.13
515,744.49
1. Payment for
production factors:
Labour
Non labour 2. Transfer:
From household
Between companies
From government
From overseas
0.00
8,126,785.73
1,413.18
183,033.59
911,28
79,701.36
Total 8,391,845.14 Total 8,391,845.14
Remark: based on SAM of Bali 2010
b. Production Account of 1,2&3 Star-rated Hotels
According to production account of 1,2&3 Star-rated hotels (see Matrix
SAM_31x31 at Appendix 4.3), total receipt was 3.32 trillion rupiah. The sources
of receipt were as follow: (i) Selling intermediate demand was about 939.55
billion rupiah; (ii) Selling goods and services of final consumption was about
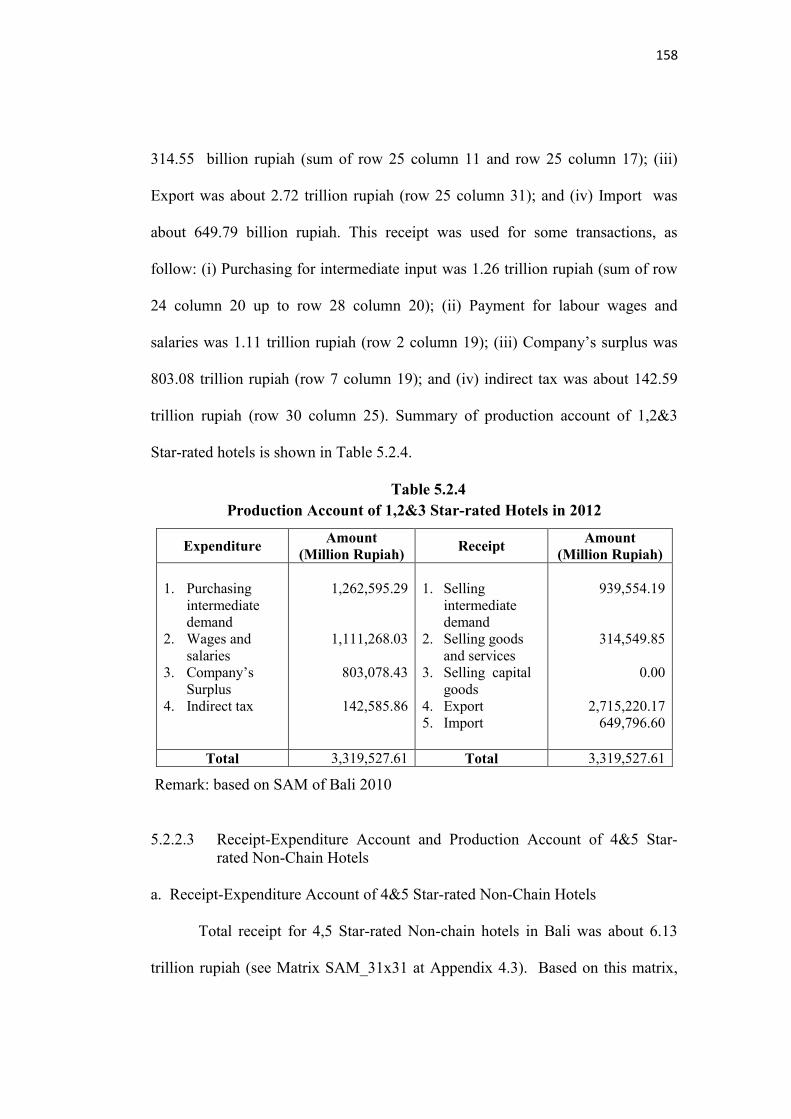
158
314.55 billion rupiah (sum of row 25 column 11 and row 25 column 17); (iii)
Export was about 2.72 trillion rupiah (row 25 column 31); and (iv) Import was
about 649.79 billion rupiah. This receipt was used for some transactions, as
follow: (i) Purchasing for intermediate input was 1.26 trillion rupiah (sum of row
24 column 20 up to row 28 column 20); (ii) Payment for labour wages and
salaries was 1.11 trillion rupiah (row 2 column 19); (iii) Company’s surplus was
803.08 trillion rupiah (row 7 column 19); and (iv) indirect tax was about 142.59
trillion rupiah (row 30 column 25). Summary of production account of 1,2&3
Star-rated hotels is shown in Table 5.2.4.
Table 5.2.4 Production Account of 1,2&3 Star-rated Hotels in 2012
Expenditure Amount
(Million Rupiah) Receipt
Amount (Million Rupiah)
1. Purchasing intermediate demand
2. Wages and salaries
3. Company’s Surplus
4. Indirect tax
1,262,595.29
1,111,268.03
803,078.43
142,585.86
1. Selling
intermediate demand
2. Selling goods and services
3. Selling capital goods
4. Export 5. Import
939,554.19
314,549.85
0.00
2,715,220.17 649,796.60
Total 3,319,527.61 Total 3,319,527.61
Remark: based on SAM of Bali 2010
5.2.2.3 Receipt-Expenditure Account and Production Account of 4&5 Star-rated Non-Chain Hotels
a. Receipt-Expenditure Account of 4&5 Star-rated Non-Chain Hotels
Total receipt for 4,5 Star-rated Non-chain hotels in Bali was about 6.13
trillion rupiah (see Matrix SAM_31x31 at Appendix 4.3). Based on this matrix,

159
the sources of receipt were as follow: (i) Income from the payment of production
factors of non labour was about 5.59 trillion rupiah (sum of row 14 column 6 up
to row 14 column 10 of Matrix SAM_31x31); (ii) Transfer from household was
about 4.26 billion rupiah (row 14 column 11); (iii) Transfer between companies
was about 354.12 billion rupiah (sum of row 14 column 12 up to row 14 column
16); (iv) Transfer from government was about 2.47 billion rupiah (row 14 column
17); and (v) Transfer from overseas was about 172.73 billion rupiah (row 14
column 31). The summary of receipt-expenditure account of 4&5 Star-rated non-
chain hotels is presented in Table 5.2.5. The results show that the highest
contributor to the receipt account of 4&5 Star-rated Non-chain hotels was
payment from production factors of non labour (91.30% of the total receipt). It
was followed by income between companies (5.78%), and receipt from overseas
(2.82%).
Meanwhile, total expenditure of 4&5 Star-rated Non-chain hotels was
6.13 trillion rupiah, and it consisted some transactions, as follow: (i) Transfer to
household was 401.26 billion rupiah (row 11 column 14 of SAM_31x31); (ii)
Transfer between companies (hotels and non-hotels) was 173.14 billion rupiah
(sum of row 12 column 14 up to row 16 column 14); (iii) Direct tax to
government was about 3.26 billion rupiah (row 17 column 14); (iv) Undistributed
profit (saving) was 1.90 trillion rupiah (row 29 column 14); and (v) Payment of
non-labour to other regions or overseas was about 394.73 billion rupiah (row 31
column 14). The summary of expenditure of receipt-expenditure account of 4&5
Star-rated non-chain hotels is presented in Table 5.2.5. From this table, it can be
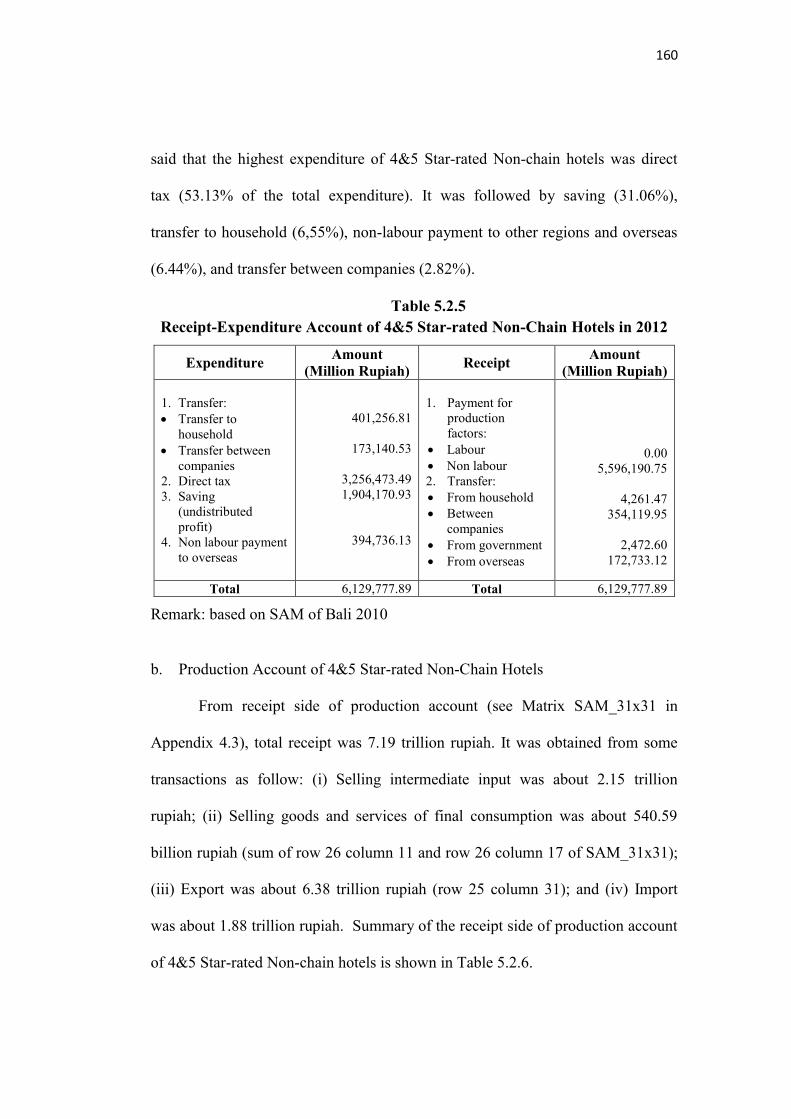
160
said that the highest expenditure of 4&5 Star-rated Non-chain hotels was direct
tax (53.13% of the total expenditure). It was followed by saving (31.06%),
transfer to household (6,55%), non-labour payment to other regions and overseas
(6.44%), and transfer between companies (2.82%).
Table 5.2.5 Receipt-Expenditure Account of 4&5 Star-rated Non-Chain Hotels in 2012
Expenditure Amount
(Million Rupiah)Receipt
Amount (Million Rupiah)
1. Transfer: Transfer to
household
Transfer between companies
2. Direct tax 3. Saving
(undistributed profit)
4. Non labour payment to overseas
401,256.81
173,140.53
3,256,473.49 1,904,170.93
394,736.13
1. Payment for
production factors:
Labour
Non labour 2. Transfer:
From household
Between companies
From government
From overseas
0.00 5,596,190.75
4,261.47
354,119.95
2,472.60 172,733.12
Total 6,129,777.89 Total 6,129,777.89
Remark: based on SAM of Bali 2010
b. Production Account of 4&5 Star-rated Non-Chain Hotels
From receipt side of production account (see Matrix SAM_31x31 in
Appendix 4.3), total receipt was 7.19 trillion rupiah. It was obtained from some
transactions as follow: (i) Selling intermediate input was about 2.15 trillion
rupiah; (ii) Selling goods and services of final consumption was about 540.59
billion rupiah (sum of row 26 column 11 and row 26 column 17 of SAM_31x31);
(iii) Export was about 6.38 trillion rupiah (row 25 column 31); and (iv) Import
was about 1.88 trillion rupiah. Summary of the receipt side of production account
of 4&5 Star-rated Non-chain hotels is shown in Table 5.2.6.

161
On the other hand, the total receipt of 4&5 Star-rated Non-chain hotels
was used to some activities as follows: (i) Purchasing intermediate input was
about 3.82 trillion rupiah (sum of row 24 column 20 up to row 28 column 20 of
SAM_31x31); (ii) Payment for labour wages and salaries was about 1.68 trillion
rupiah (row 3 column 20); (iii) surplus of the company was about 1.39 trillion
rupiah (row 9 column 21); and (iv) Payment for indirect tax was about 309.02
billion rupiah (row 30 column 26). Summary of the expenditure side of
production account of 4&5 Star-rated Non-chain hotels is shown in Table 5.2.6.
Table 5.2.6 Production Account of 4&5 Star-rated Non-Chain Hotels in 2012
Expenditure Amount
(Million Rupiah) Receipt
Amount (Million Rupiah)
1. Purchasing intermediate demand
2. Wages and salaries
3. Company’s Surplus
4. Indirect tax
3,815,216.11
1,683,787.70
1,386,236.92
309,019.83
1. Selling
intermediate demand
2. Selling goods and services
3. Selling capital goods
4. Export 5. Import
2,153,770.52
540,587.20
0.00
6,377,602.16 1,877,699.32
Total 7,194,260.56 Total 7,194,260.56
Remark: based on SAM of Bali 2010
5.2.2.4 Receipt-Expenditure Account and Production Account of 4&5 Star-rated Chain Hotels
a. Receipt-Expenditure Account of 4&5 Star-rated Chain Hotels
Total receipt for 4&5 Star-rated Non-chain hotels in Bali was 3.81 trillion
rupiah (see Matrix SAM_31x31 at Appendix 4.3). Sources of receipt were: (i)
Income generated from payment of production factors of non labour. It was about
162
3.65 billion rupiah (sum of row 15 column 6 up to row 15 column 10 of Matrix
SAM_31x31); (ii) Transfer from household was about 46.08 million rupiah (row
15 column 11); (iii) Transfer between companies was about 114.97 billion rupiah
(sum of row 15 column 12 up to row 15 column 16); (iv) Transfer from
government was about 2.47 million rupiah (row 15 column 17); and (v) Transfer
from overseas was about 49.91 billion rupiah (row 15 column 31). The summary
of receipt account of 4&5 Star-rated chain hotels is presented in Table 5.2.7. The
results showed that the receipt account of 4&5 Star-rated chain hotels was
dominated by payment from production factors from non labour (95.67 % of the
total receipt). It was followed by income between companies (3.02 %) and
transfer from overseas (1.31 %).
Meanwhile, total expenditure of 4&5 Star-rated chain hotels was 3.81
trillion rupiah (see Matrix SAM_31x31 at Appendix 4.3). The expenditure
account consisted of several transactions, as follow: (i) Transfer to household was
68.47 billion rupiah (row 11 column 15 of SAM_31x31); (ii) Transfer between
companies (hotels and non-hotels) was 379.32 billion rupiah (sum of row 12
column 15 up to row 16 column 15); (iii) Direct tax to the government was about
1.56 trillion rupiah (row 17 column 15); (iv) Undistributed profit (saving) was
about 911.72 billion rupiah (row 29 column 15); and (v) Payment for non labour
to other regions or overseas was about 893.69 billion rupiah (row 31 column 15).
The summary of expenditure account of 4&5 Star-rated chain hotels is presented
in Table 5.2.7.
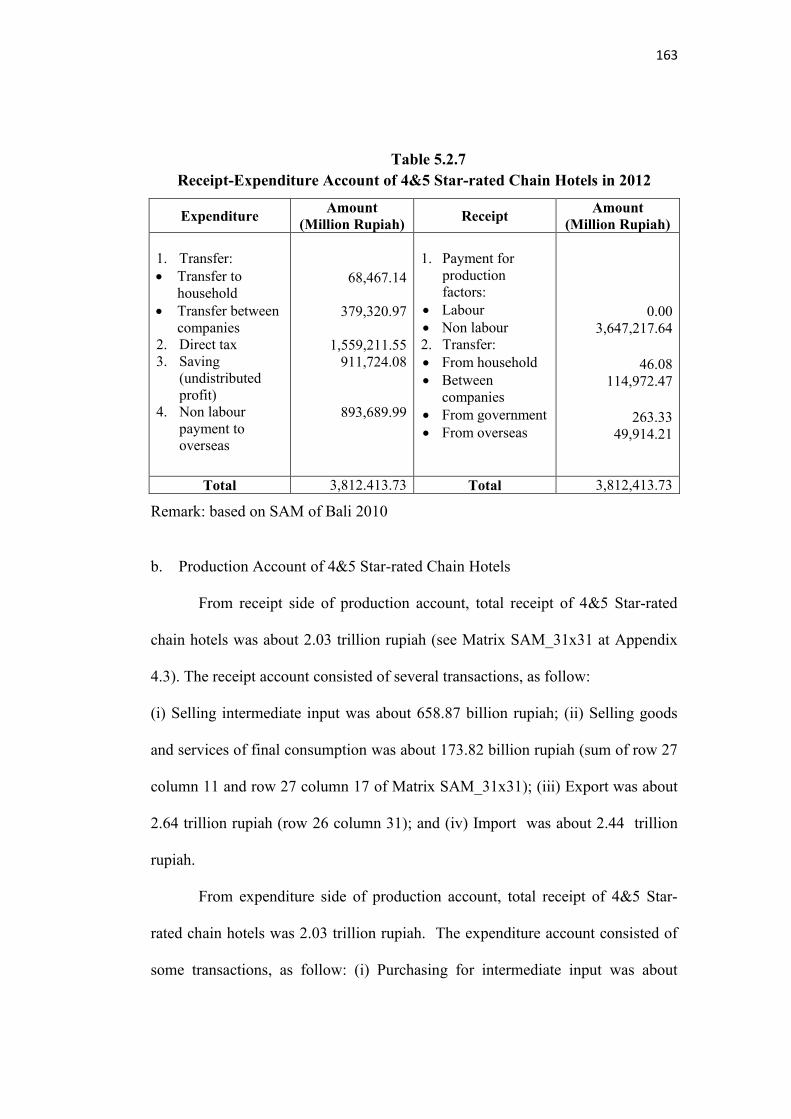
163
Table 5.2.7 Receipt-Expenditure Account of 4&5 Star-rated Chain Hotels in 2012
Expenditure Amount
(Million Rupiah) Receipt
Amount (Million Rupiah)
1. Transfer: Transfer to
household
Transfer between companies
2. Direct tax 3. Saving
(undistributed profit)
4. Non labour payment to overseas
68,467.14
379,320.97
1,559,211.55
911,724.08
893,689.99
1. Payment for
production factors:
Labour
Non labour 2. Transfer:
From household
Between companies
From government
From overseas
0.00
3,647,217.64
46.08 114,972.47
263.33 49,914.21
Total 3,812.413.73 Total 3,812,413.73
Remark: based on SAM of Bali 2010
b. Production Account of 4&5 Star-rated Chain Hotels
From receipt side of production account, total receipt of 4&5 Star-rated
chain hotels was about 2.03 trillion rupiah (see Matrix SAM_31x31 at Appendix
4.3). The receipt account consisted of several transactions, as follow:
(i) Selling intermediate input was about 658.87 billion rupiah; (ii) Selling goods
and services of final consumption was about 173.82 billion rupiah (sum of row 27
column 11 and row 27 column 17 of Matrix SAM_31x31); (iii) Export was about
2.64 trillion rupiah (row 26 column 31); and (iv) Import was about 2.44 trillion
rupiah.
From expenditure side of production account, total receipt of 4&5 Star-
rated chain hotels was 2.03 trillion rupiah. The expenditure account consisted of
some transactions, as follow: (i) Purchasing for intermediate input was about

164
935.53 billion rupiah (sum of row 24 column 21 up to row 28 column 21 of
SAM_31x31); (ii) Payment for labour wages and salaries was about 434.94
billion rupiah (row 4 column 21); (iii) Surplus of the company was about 619.14
billion rupiah (row 9 column 21); (iv) Payment for indirect tax was about 44,65
billion rupiah (row 30 column 27). Summary of production account of 4&5 Star-
rated chain hotels is presented in Table 5.2.8.
Table 5.2.8 Production Account of 4&5 Star-rated Chain Hotels in 2012
Expenditure Amount
(Million Rupiah) Receipt
Amount (Million Rupiah)
1. Purchasing
intermediate demand
2. Wages and salaries
3. Company’s Surplus
4. Indirect tax
935,532.71
434,938.91
619,137.41
44,648.30
1. Selling
intermediate demand
2. Selling goods and services
3. Selling capital goods
4. Export 5. Import
658,874.73
173,822.83
0.00
2,643,230.95 2,441,671.18
Total 2,034,257.33 Total 2,034,257.33
Remark: based on SAM of Bali 2010
5.2.3 Calculation of Tourism Leakage from Accommodation Sector in Bali Based on Macro Analysis
The sources of tourism leakage based on macro analysis were as follows:
(i) transfer to overseas from production factors, which consists of payment for
labour and payment for capital ownership; and (ii) transfer to overseas from
institution for payment of non labour, this includes payment for goods and
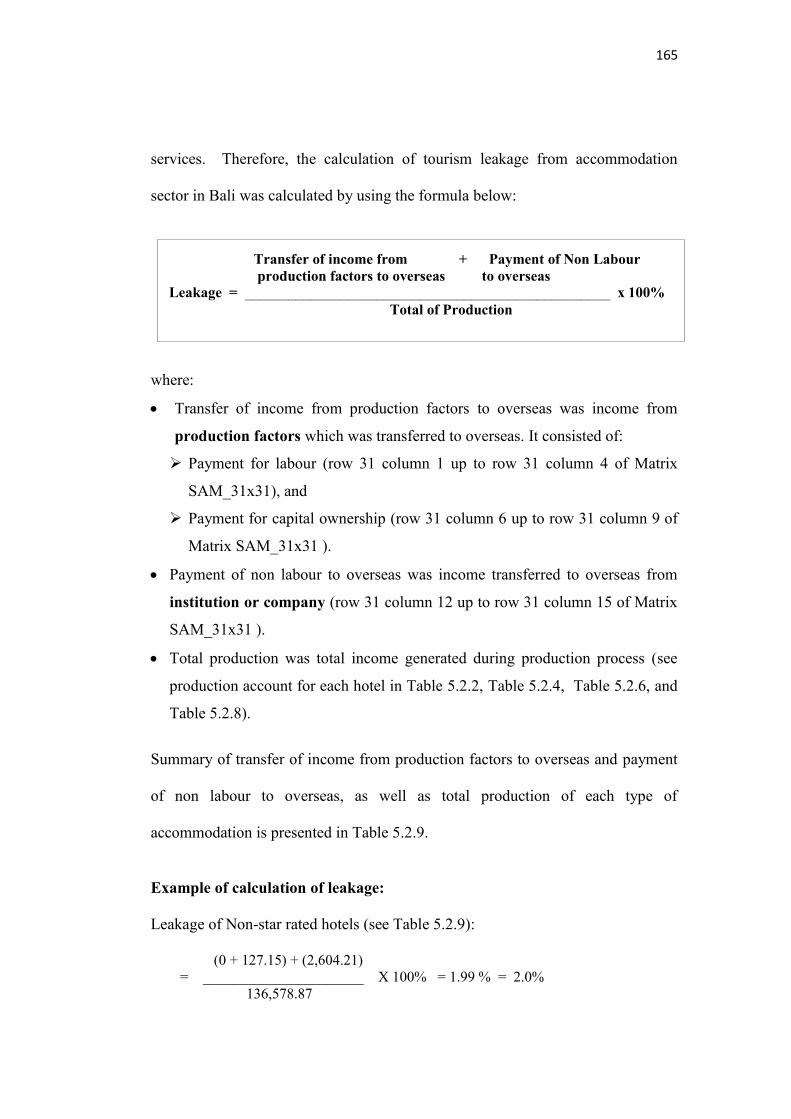
165
services. Therefore, the calculation of tourism leakage from accommodation
sector in Bali was calculated by using the formula below:
Transfer of income from + Payment of Non Labour production factors to overseas to overseas
Leakage = __________________________________________________ x 100% Total of Production
where:
Transfer of income from production factors to overseas was income from
production factors which was transferred to overseas. It consisted of:
Payment for labour (row 31 column 1 up to row 31 column 4 of Matrix
SAM_31x31), and
Payment for capital ownership (row 31 column 6 up to row 31 column 9 of
Matrix SAM_31x31 ).
Payment of non labour to overseas was income transferred to overseas from
institution or company (row 31 column 12 up to row 31 column 15 of Matrix
SAM_31x31 ).
Total production was total income generated during production process (see
production account for each hotel in Table 5.2.2, Table 5.2.4, Table 5.2.6, and
Table 5.2.8).
Summary of transfer of income from production factors to overseas and payment
of non labour to overseas, as well as total production of each type of
accommodation is presented in Table 5.2.9.
Example of calculation of leakage: Leakage of Non-star rated hotels (see Table 5.2.9): (0 + 127.15) + (2,604.21) = ______________________ X 100% = 1.99 % = 2.0% 136,578.87
166
Based on the above formula, leakage of other types of accommodations
was calculated. The results are as follows (see Table 5.2.9):
(i) Leakage of 1,2&3 Star-rated hotels was 15.66%;
(ii) Leakage of 4&5 Star-rated Non-chain hotels was 7.14%;
(iii) Leakage of 4&5 Star-rated chain hotels was 55.31%; and
(iv) The average leakage of hotels was 19.48%.
Table 5.2.9 shows the amount of tourism leakage from each type of
accommodation in Bali. Detail of the amount of tourism leakage on each type of
accommodation is outlined as follow:
i. The amount of tourism leakage of Non-star rated hotels was 2,0%. It consisted
of capital ownership (127.15 million rupiah or 0.09%) and payment of non
labour (2.6 billion rupiah or 1.91%).
ii. The amount of tourism leakage of 1,2&3 Star-rated hotels was 15.66%. It
consisted of capital ownership (3.9 billion rupiah or 0.12%), and payment of
non labour (515.7 billion rupiah or 15.54%).
iii. The amount of tourism leakage of 4&5 Star-rated non-chain hotels was 7.14%.
It consisted of payment for labour (933.02 billion rupiah or 0.01%), payment
for capital ownership (118.37 billion rupiah or 1.64%), and payment of non
labour (394.74 billion rupiah or 5.49%).
iv. The amount of tourism leakage of 4&5 Star-rated chain hotels was 55.31%. It
consisted of payment for labour (41.66 billion rupiah or 1.43%), payment for
capital ownership (669.58 billion rupiah or 23.08%) and payment of non labour
(893.69 billion rupiah or 30.80%).

167
According to Table 5.2.9, the highest percentage of tourism leakage was
found on 4&5 Star-rated chain hotels (55.31%), followed by 1,2&3 Star-rated
hotels (15.66%); 4&5 Star Non-chain hotels (7.14%); and the lowest leakage was
on Non-star rated hotels (2.0%). The average of leakage of all types of
accommodation was 19.48%.
Table 5.2.9 Percentage of Tourism Leakage of Bali Tourism on
Accommodations Sector in 2012
No
Production Activities
Types of Accommodation TOTAL
(Million Rupiah)
Non-Star rated Hotels
(Million Rupiah)
1,2&3 Star-rated Hotels
(Million Rupiah)
4&5 Star-rated Non Chain
Hotels (Million Rupiah)
4&5 Star-rated Chain Hotels
(Million Rupiah)
1 Total of Production 136,578.87 3,319,527.61 7,194,260.56 2,901,333.11 13,551,700.15
2 Income from production factors which was transferred to overseas: a. Labour b. Capital ownership
-
127.15 (0.09%)
-
3,945.79 (0.12%)
933.02 (0.01%)
118,373.85 (1.64%)
41,659.82
(1.43%) 669,584.74
(23.08%)
42,592.84 (0.31%)
792,031.54 (5.84%)
3 Payments of Non Labour to overseas
2,604.21 (1.91%)
515,744.49
(15.54%)
394,736.13
(5.49%)
893,689.99
(30.80%)
1,806,774.83
(13.33%)
Leakage (%) 2.00 15.66 7.14 55.31 19.48
Remark: based on SAM of Bali 2010
Based on Table 5.2.9, the causes of a high leakage on 4&5 Star-rated chain hotels
were the payments on production factors which were transferred to overseas and
the payment of non labour to overseas. More detail explanation is described as
follow:
i. Payment from institution (companies/hotels) for non labour to other regions
outside Bali and overseas was 893,689.99 billion rupiah or 30.80% of the total
production.

168
ii. Payment for capital ownership which was transferred to other regions outside
Bali and overseas was 669,584.74 billion rupiah or 23.08% of the total
production.
iii. Payment for labour which was transferred to other regions outside Bali and
overseas was 41,659.82 billion rupiah or 1.43% of the total production.
Furthermore, type of accommodation 1,2&3 Star-rated hotels was the
second highest on tourism leakage from accommodation sector in Bali. It was
higher than leakage of 4&5 Star-rated non-chain hotels. It is because of a high
percentage of payment on non labour either to other regions outside Bali or to
overseas. The leakage from non labour of 1,2&3 Star-rated hotels was 15.53% of
the total production. Meanwhile payment for non labour on 4&5 Star-rated Non-
chain hotels was 5.49% of the total production. In fact, payment for capital
ownership of 4&5 Star-rated Non-chain hotels was higher than those on 1,2&3
Star-rated hotels. It was 118,373.85 billion rupiah (23.08%) for 4&5 Star-rated
hotel, meanwhile payment for capital ownership of 1,2&3 Star-rated hotel was
3,945.79 billion rupiah or 0.12%.
5.2.4 Conclusion
This part demonstrates calculation of tourism leakage on accommodation
sector in Bali based on macro analysis by using SAM Hotels of Bali 2010.
Sources of tourism leakage on accommodation sector are capital ownership of
accommodation, and payment for imported goods, services and foreign labours.
The results show that the highest percentage of tourism leakage was found on
4&5 Star-rated chain hotels (55.32%), followed by 1,2&3 Star-rated hotels
169
(15.66%), and 4&5 Star non-chain hotels (7.15%). The lowest leakage was on
Non-star rated hotels (2.0%). These results indicate that 4&5 Star-rated chain
hotels bring about more tourism leakage as they use many imported goods and
services, foreign labour as well as capital ownership. Therefore, less revenue from
tourism will be received by the host or local community, as more profits from
tourism will go to outside of the region or country. Finally, it is estimated that less
contribution to local economy and less benefits for local Balinese community.

170
5.3 Impact of Government Subsidies and Import Reduction by Accommodation Sector on Tourism Leakage, Job Opportunity and Income Distribution
5.3.1 Introduction
In this section, impacts of government subsidies and import reduction by
accommodation sector on tourism leakage, job opportunity, and income
distribution are presented. Government plays an important role in reducing
tourism leakage through policies on subsidies. To prove that government
subsidies impact on tourism leakage, job opportunity distribution and income
distribution, simulations were carried out. In this simulation, government
subsidies were illustrated in terms of giving electricity subsidies to the hotels. In
addition, accommodation sector can also take a part in reducing tourism leakage
through minimizing imported products as well as minimizing the utilization of
foreign employees (Fletcher, 1994; Lacher and Nepal, 2010; Lejarraga and
Walkenhorst, 2010). In this simulation, import reduction from the tourism
industries were illustrated in terms of reduction in the use of imported products
and foreign employees. By using multiplier effect analysis of SAM Hotel of Bali
2010, a series of simulation on the role of government and accommodation sector
was undertaken. In the SAM Hotel of Bali, the account of Trade and
Transportation Margin was excluded because this margin was already included in
every transaction, so that the SAM matrix becomes SAM_108x108 (Appendix
5.5). Simulation was undertaken based on the assumption that all other accounts
on “ceteris paribus”, which means that all other accounts remain constant, except
171
Government account and account of Overseas Transaction (Rest of the World
Account) (Thorbecke, 1988). The simulation followed the steps below:
i. Determining matrix SAM_108x108 (A)
ii. Determining Matrix Identity SAM_108x108 (I)
iii. Determining matrix (Identity-A) SAM_108x108 (I-A)
iv. Determining Inverse matrix SAM_108x108 (Inverse)
v. Multiplication between Inverse matrix of SAM_108x108 and vector matrix
(1x10⁸) of all types of accommodation (Non-star rated hotels; 1,2&3 Star-
rated hotels; 4&5 Star-rated chain hotels; and 4&5 Star-rated non-chain
hotels).
5.3.2 Simulation
Impact of government subsidies and impact of reducing import by
accommodation sector on job opportunity, tourism leakage, and income
distribution was undertaken in six simulations. The first simulation was
undertaken under a scenario as shown in Table 5.3.1, involving government
subsidies and reduction of import (goods, services and foreign labour) by
accommodation sector. Detail of the scenario for the first simulation is outlined
below:
i. Government subsidies were given to all types of accommodation as follow:
15% to Non-star rated hotels; 15% to 1,2&3 Star-rated hotels; 12% to 4&5
Star-rated non-chain hotels; and 5% to 4&5 Star-rated chain hotels; and
ii. Import reduction was undertaken by accommodation sector, as follow: 15%
reduction by 1,2&3 Star-rated hotels; 15% reduction by 4&5 Star-rated non-
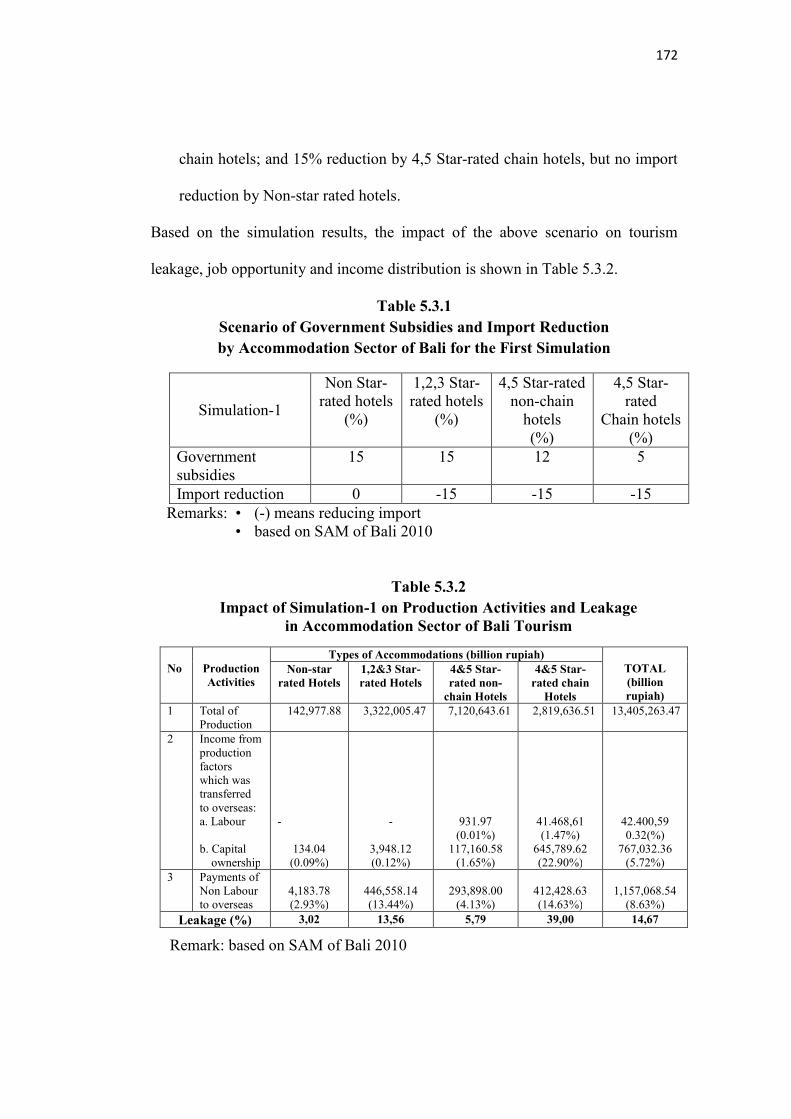
172
chain hotels; and 15% reduction by 4,5 Star-rated chain hotels, but no import
reduction by Non-star rated hotels.
Based on the simulation results, the impact of the above scenario on tourism
leakage, job opportunity and income distribution is shown in Table 5.3.2.
Table 5.3.1 Scenario of Government Subsidies and Import Reduction by Accommodation Sector of Bali for the First Simulation
Simulation-1
Non Star-rated hotels
(%)
1,2,3 Star-rated hotels
(%)
4,5 Star-rated non-chain
hotels (%)
4,5 Star-rated
Chain hotels (%)
Government subsidies
15 15 12 5
Import reduction 0 -15 -15 -15
Remarks: • (-) means reducing import • based on SAM of Bali 2010
Table 5.3.2 Impact of Simulation-1 on Production Activities and Leakage
in Accommodation Sector of Bali Tourism
No
Production Activities
Types of Accommodations (billion rupiah) TOTAL (billion rupiah)
Non-star rated Hotels
1,2&3 Star-rated Hotels
4&5 Star-rated non-
chain Hotels
4&5 Star-rated chain
Hotels 1 Total of
Production 142,977.88 3,322,005.47 7,120,643.61 2,819,636.51 13,405,263.47
2 Income from production factors which was transferred to overseas: a. Labour b. Capital
ownership
-
134.04 (0.09%)
-
3,948.12 (0.12%)
931.97 (0.01%)
117,160.58 (1.65%)
41.468,61 (1.47%)
645,789.62 (22.90%)
42.400,59 0.32(%)
767,032.36 (5.72%)
3 Payments of Non Labour to overseas
4,183.78 (2.93%)
446,558.14 (13.44%)
293,898.00
(4.13%)
412,428.63 (14.63%)
1,157,068.54
(8.63%)
Leakage (%) 3,02 13,56 5,79 39,00 14,67
Remark: based on SAM of Bali 2010
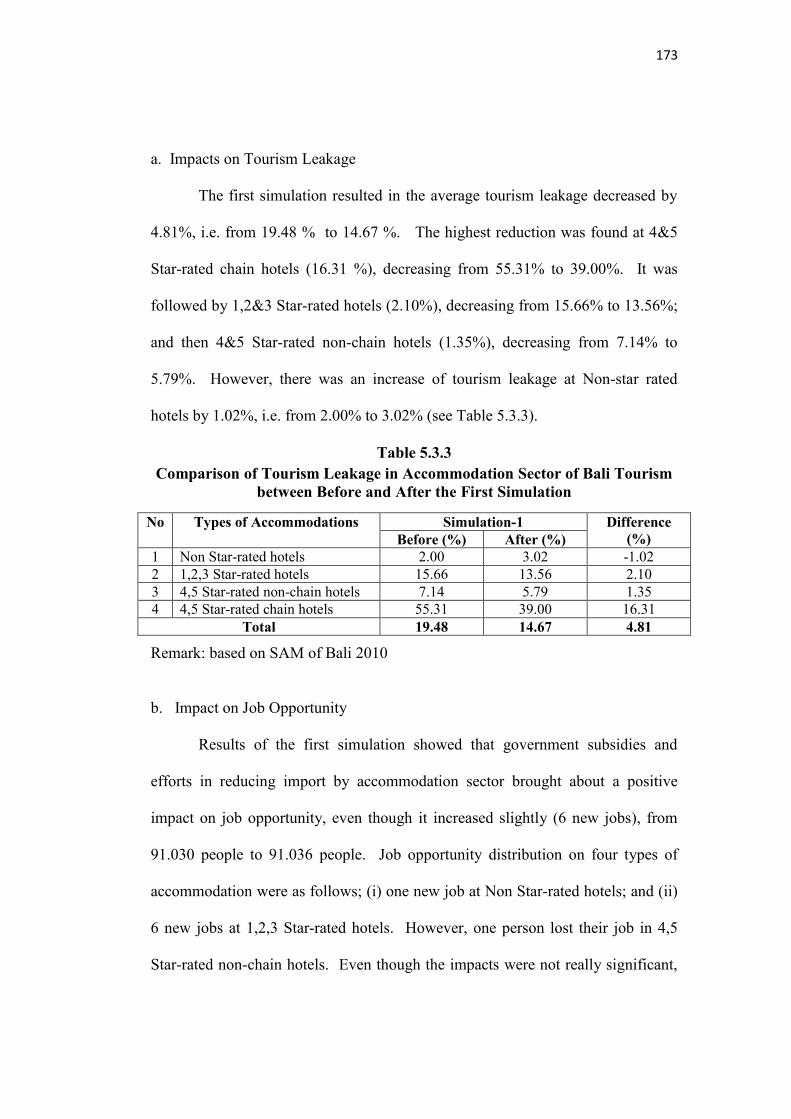
173
a. Impacts on Tourism Leakage
The first simulation resulted in the average tourism leakage decreased by
4.81%, i.e. from 19.48 % to 14.67 %. The highest reduction was found at 4&5
Star-rated chain hotels (16.31 %), decreasing from 55.31% to 39.00%. It was
followed by 1,2&3 Star-rated hotels (2.10%), decreasing from 15.66% to 13.56%;
and then 4&5 Star-rated non-chain hotels (1.35%), decreasing from 7.14% to
5.79%. However, there was an increase of tourism leakage at Non-star rated
hotels by 1.02%, i.e. from 2.00% to 3.02% (see Table 5.3.3).
Table 5.3.3 Comparison of Tourism Leakage in Accommodation Sector of Bali Tourism
between Before and After the First Simulation
No Types of Accommodations Simulation-1 Difference (%) Before (%) After (%)
1 Non Star-rated hotels 2.00 3.02 -1.02
2 1,2,3 Star-rated hotels 15.66 13.56 2.10
3 4,5 Star-rated non-chain hotels 7.14 5.79 1.35
4 4,5 Star-rated chain hotels 55.31 39.00 16.31
Total 19.48 14.67 4.81
Remark: based on SAM of Bali 2010
b. Impact on Job Opportunity
Results of the first simulation showed that government subsidies and
efforts in reducing import by accommodation sector brought about a positive
impact on job opportunity, even though it increased slightly (6 new jobs), from
91.030 people to 91.036 people. Job opportunity distribution on four types of
accommodation were as follows; (i) one new job at Non Star-rated hotels; and (ii)
6 new jobs at 1,2,3 Star-rated hotels. However, one person lost their job in 4,5
Star-rated non-chain hotels. Even though the impacts were not really significant,
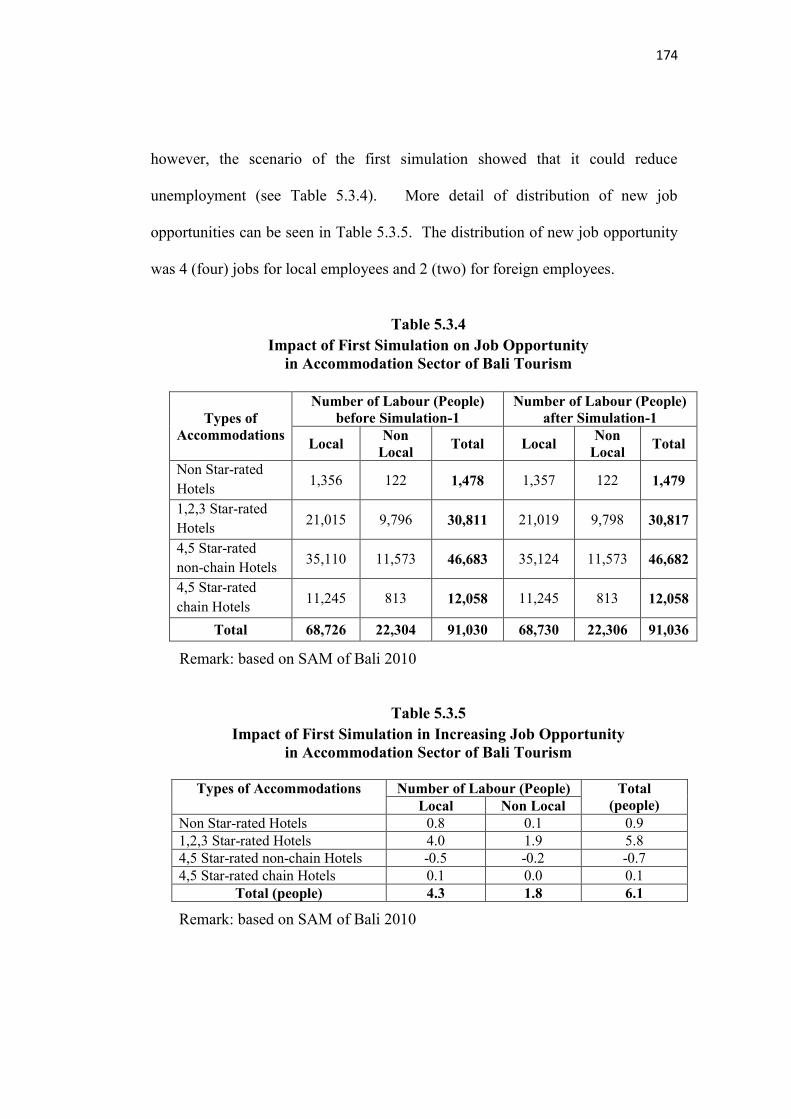
174
however, the scenario of the first simulation showed that it could reduce
unemployment (see Table 5.3.4). More detail of distribution of new job
opportunities can be seen in Table 5.3.5. The distribution of new job opportunity
was 4 (four) jobs for local employees and 2 (two) for foreign employees.
Table 5.3.4
Impact of First Simulation on Job Opportunity in Accommodation Sector of Bali Tourism
Types of
Accommodations
Number of Labour (People) before Simulation-1
Number of Labour (People) after Simulation-1
Local Non
Local Total Local
Non Local
Total
Non Star-rated
Hotels 1,356 122 1,478 1,357 122 1,479
1,2,3 Star-rated
Hotels 21,015 9,796 30,811 21,019 9,798 30,817
4,5 Star-rated
non-chain Hotels 35,110 11,573 46,683 35,124 11,573 46,682
4,5 Star-rated
chain Hotels 11,245 813 12,058 11,245 813 12,058
Total 68,726 22,304 91,030 68,730 22,306 91,036
Remark: based on SAM of Bali 2010
Table 5.3.5 Impact of First Simulation in Increasing Job Opportunity
in Accommodation Sector of Bali Tourism
Types of Accommodations Number of Labour (People) Total (people) Local Non Local
Non Star-rated Hotels 0.8 0.1 0.9
1,2,3 Star-rated Hotels 4.0 1.9 5.8
4,5 Star-rated non-chain Hotels -0.5 -0.2 -0.7
4,5 Star-rated chain Hotels 0.1 0.0 0.1
Total (people) 4.3 1.8 6.1
Remark: based on SAM of Bali 2010
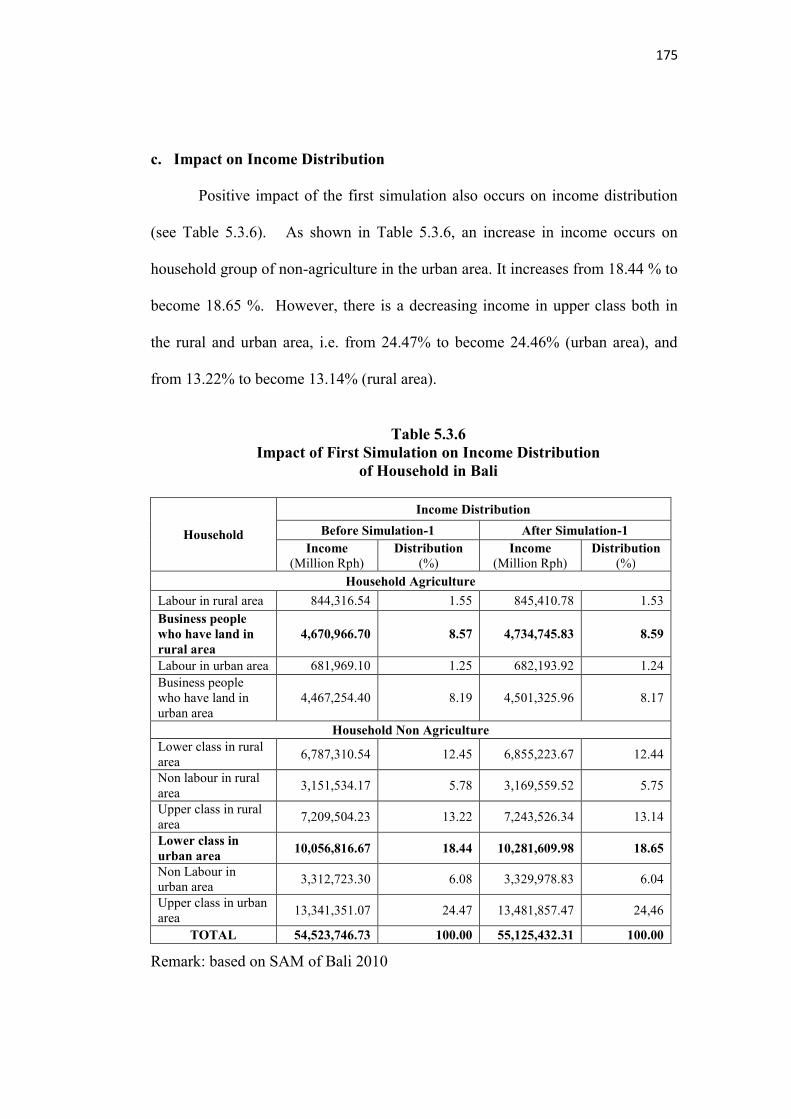
175
c. Impact on Income Distribution
Positive impact of the first simulation also occurs on income distribution
(see Table 5.3.6). As shown in Table 5.3.6, an increase in income occurs on
household group of non-agriculture in the urban area. It increases from 18.44 % to
become 18.65 %. However, there is a decreasing income in upper class both in
the rural and urban area, i.e. from 24.47% to become 24.46% (urban area), and
from 13.22% to become 13.14% (rural area).
Table 5.3.6 Impact of First Simulation on Income Distribution
of Household in Bali
Household
Income Distribution
Before Simulation-1 After Simulation-1 Income
(Million Rph) Distribution
(%) Income
(Million Rph) Distribution
(%) Household Agriculture
Labour in rural area 844,316.54 1.55 845,410.78 1.53
Business people who have land in rural area
4,670,966.70 8.57 4,734,745.83 8.59
Labour in urban area 681,969.10 1.25 682,193.92 1.24
Business people who have land in urban area
4,467,254.40 8.19 4,501,325.96 8.17
Household Non Agriculture Lower class in rural area
6,787,310.54 12.45 6,855,223.67 12.44
Non labour in rural area
3,151,534.17 5.78 3,169,559.52 5.75
Upper class in rural area
7,209,504.23 13.22 7,243,526.34 13.14
Lower class in urban area
10,056,816.67 18.44 10,281,609.98 18.65
Non Labour in urban area
3,312,723.30 6.08 3,329,978.83 6.04
Upper class in urban area
13,341,351.07 24.47 13,481,857.47 24,46
TOTAL 54,523,746.73 100.00 55,125,432.31 100.00
Remark: based on SAM of Bali 2010
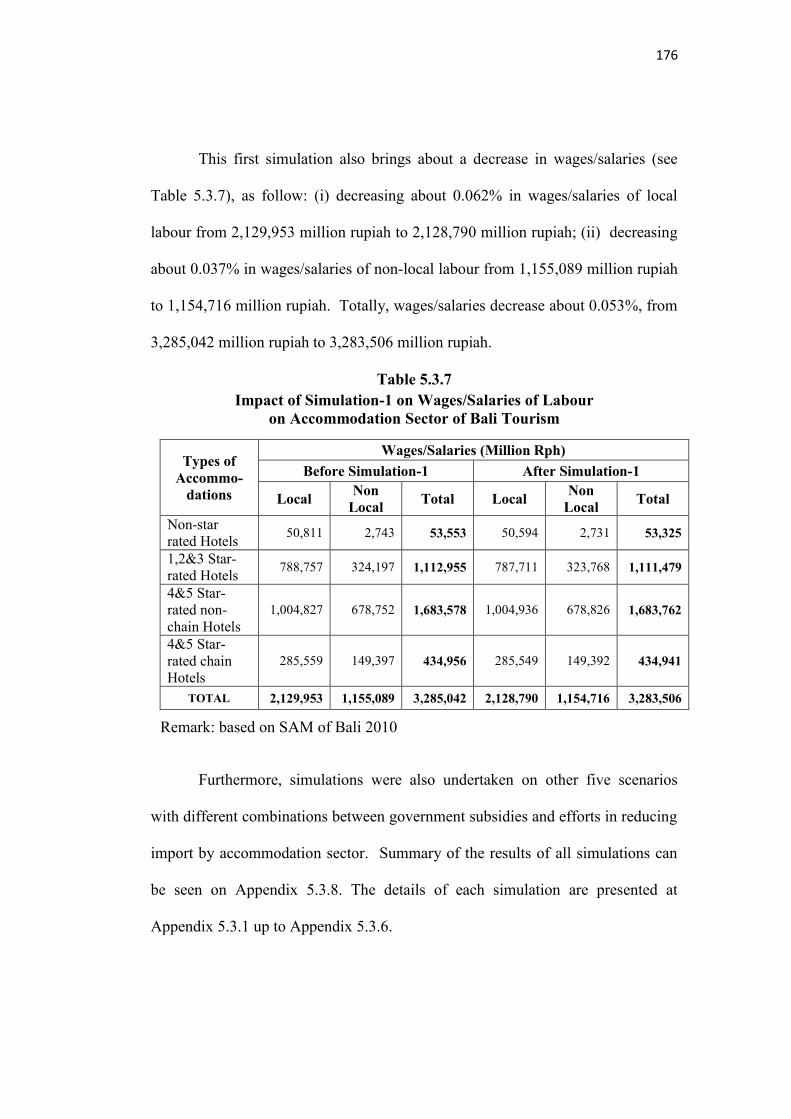
176
This first simulation also brings about a decrease in wages/salaries (see
Table 5.3.7), as follow: (i) decreasing about 0.062% in wages/salaries of local
labour from 2,129,953 million rupiah to 2,128,790 million rupiah; (ii) decreasing
about 0.037% in wages/salaries of non-local labour from 1,155,089 million rupiah
to 1,154,716 million rupiah. Totally, wages/salaries decrease about 0.053%, from
3,285,042 million rupiah to 3,283,506 million rupiah.
Table 5.3.7 Impact of Simulation-1 on Wages/Salaries of Labour
on Accommodation Sector of Bali Tourism
Types of Accommo-
dations
Wages/Salaries (Million Rph)
Before Simulation-1 After Simulation-1
Local Non
Local Total Local
Non Local
Total
Non-star rated Hotels
50,811 2,743 53,553 50,594 2,731 53,325
1,2&3 Star-rated Hotels
788,757 324,197 1,112,955 787,711 323,768 1,111,479
4&5 Star-rated non-chain Hotels
1,004,827 678,752 1,683,578 1,004,936 678,826 1,683,762
4&5 Star-rated chain Hotels
285,559 149,397 434,956 285,549 149,392 434,941
TOTAL 2,129,953 1,155,089 3,285,042 2,128,790 1,154,716 3,283,506
Remark: based on SAM of Bali 2010
Furthermore, simulations were also undertaken on other five scenarios
with different combinations between government subsidies and efforts in reducing
import by accommodation sector. Summary of the results of all simulations can
be seen on Appendix 5.3.8. The details of each simulation are presented at
Appendix 5.3.1 up to Appendix 5.3.6.

177
Table 5.3.8 Recapitulation of Results of Simulations using Scenarios of Government Subsidies and Import Reduction of Bali Tourism
SIMULATION
SCENARIOS SIMULATION RESULTS
Government Subsidies Reduce Import Average Leakage Average Income
Distribution
Non star
1,2&3 Star
4&5 star non-
Chain
4&5 Star
Chain
Non Star
1,2&3 Star
4&5 Star Non-Chain
4&5 Star
Chain
Before (%)
After (%)
Difference (%)
Job Opportunities Distribution
(People)
on Lower classes
in urban areas
Simulation 1 15 15 12 5 0 -15 -15 -15 19.49 14.67 -4.82 6 increase
0.21%
Simulation 2 15 6 6 0 0 -5 0 -20 19.49 13.33 -6.16 10 increase 0.12%
Simulation 3 25 15 5 0 0 -15 0 -25 19.49 11.07 -8.42 28 increase 0.21%
Simulation 4 38 15 0 0 0 -20 0 -30 19.49 7.93 -11.56 13 increase 0.24%
Simulation 5 40 18.5 0 0 0 -25 0 -30 19.49 7.53 -11.96 15 increase 0.26%
Simulation 6 30 10 0 0 0 -15 -15 -15 19.49 11.34 -8.15 -43 increase 0.14%
Remark: based on SAM of Bali 2010

178
5.3.3 The Simulation Results with the Optimum and the Worst Impacts
a. Simulation with Optimum Impact
The optimum result of six scenarios is found in the fifth simulation
(Simulation-5) with the combination of government subsidies and efforts in
reducing import by accommodation sector as shown in Table 5.3.9. The results
of the fifth simulation show that the impacts are as follow:
(i) Tourism leakage in accommodation sector decreases by 11.96 %, i.e. from
19.49 % to become 7.53 % (see Table 5.3.10),
(ii) Job opportunity increases by 15 people (see Table 5.3.11), and
(iii) Income of low class in urban area increases by 0.26 % (see Appendix 5.3.4).
Table 5.3.9 Scenario of Government Subsidies and Import Reduction by Accommodation
Sector of Bali Tourism for the Fifth Simulation
Simulation-5 Non-star
rated hotels (%)
1,2&3 Star-rated hotels
(%)
4&5 Star-rated non-chain hotels
(%)
4&5 Star-rated chain hotels
(%)
Government subsidies
40 18.5 0 0
Import reduction 0 -25 0 -30 Remarks: • (-) means reduction
• based on SAM of Bali 2010
Table 5.3.10
Comparison of Tourism Leakage in Accommodation Sector of Bali Tourism between Before and After the Fifth Simulation
No Types of Accommodations Simulation-5 Difference
(%) Before (%) After (%) 1 Non-star rated Hotels 2.00 4.53 2.53 2 1,2&3 Star-rated Hotels 15.66 8.25 7.40 3 4&5 Star-rated non-chain Hotels 7.15 7.15 00 4 4&5 Star-rated chain Hotels 55.32 7.86 47.45
Total 19.49 7.53 11.96 Remarks: • (-) means reduction
• based on SAM of Bali 2010

179
Table 5.3.11 Impact of Fifth Simulation on Job Opportunity
in Accommodation Sector of Bali Tourism
Types of Accommodations Number of Labour (people) Total (people) Local Non Local
Non-star rated Hotels 1.10 0.10 1.19
1,2&3 Star-rated Hotels 6.24 2.91 9.15
4&5 Star-rated non-chain Hotels 2.53 0.83 3.37
4&5 Star-rated chain Hotels 1.02 0.07 1.10
Total (people) 10.89 3.92 14.80 Remark: based on SAM of Bali 2010
b. Simulation with the Worst Impact
The sixth simulation (Simulation-6) resulted in the worst impact on
tourism leakage, income distribution and job opportunity. The sixth simulation is
undertaken by using a scenario of the combination of government subsidies and
efforts in reducing import by accommodation sector, as shown in Table 5.3.12.
The results of the Simulation-6 show that the impacts are as follow:
(i) Tourism leakage in accommodation sector decreases by 8.15 %, i.e. from
19.49 % to become 11.34 % (see Table 5.3.13),
(ii) Income of low class in urban area increases by 0.14 % (see Appendix 5.3.5)
(iii) However, a negative impact occurs on job opportunity, i.e. there is a
decreasing job opportunity by 43 people. It means that there will be 43
people lost their job (33 local labours and 10 non-local labours) (see Table
5.3.14).

180
Table 5.3.12 Scenario of Government Subsidies and Import Reduction by Accommodation
Sector of Bali Tourism for the Sixth Simulation
Simulation-6
Non-star rated hotels
(%)
1,2&3 Star-rated hotels
(%)
4&5 Star-rated Non-chain
hotels (%)
4&5 Star-rated
Chain hotels (%)
Government subsidies
30 10 0 0
Import reduction 0 -15 -15 -15 Remarks: • (-) means reduction
• based on SAM of Bali 2010
Table 5.3.13 Comparison of Tourism Leakage in Accommodation Sector
of Bali Tourism between Before and After the Sixth Simulation
No Types of Accommodations Simulation-6 Difference (%) Before
(%) After (%)
1 Non-star rated Hotels 2.00 3.94 1.95 2 1,2&3 Star-rated Hotels 15.66 10.58 5.06 3 4&5 Star-rated non-chain Hotels 7.15 3.17 3.98 4 4&5 Star-rated chain Hotels 55.32 42.61 22.68
Total 19.49 11.34 8.15
Remark: based on SAM of Bali 2010
Table 5.3.14 Impact of Sixth Simulation on Job Opportunity
in Accommodation Sector of Bali Tourism
Types of Accommodations Number of Labour (people) Total (people) Local Non Local
Non Star-rated Hotels 0.30 0.03 0.33
1,2,3 Star-rated Hotels -5.07 -2.36 -7.43
4,5 Star-rated non-chain Hotels -21.76 -7.17 -20.93
4,5 Star-rated chain Hotels -6.28 -0.45 -6.74
Total (people) -32.81 -9.99 -42.77
Remark: based on SAM of Bali 2010
181
5.3.4 Conclusion
This section discusses about the impacts of government subsidies and
import reduction by accommodation sector on tourism leakage, job opportunity,
and income distribution. The role of government in reducing tourism leakage of
accommodation sector in Bali through policy of subsidy is considered to be
important. Moreover, the involvement of accommodation sector in reducing
leakage is also very crucial. It can be undertaken through minimizing import of
goods and services as well as minimizing the utilization of foreign labours.
Simulations in order to assess the impact of government subsidy and import
reduction by accommodation sector are also discussed. The results suggest that
optimum impacts on tourism leakage, job opportunity, and income distribution
can be reached through an appropriate scenario. The optimum scenario is
undertaken by the fifth simulation (Simulation-5) with the combination of
government subsidies (40% for Non-star rated hotels and 18.5% for 1,2&3 Star-
rated hotels), and efforts of import reduction (25% of 1,2&3 Star-rated hotels and
30% of 4&5 Star-rated chain hotels). This scenario leads to a reduction of tourism
leakage by 11.96%, an increasing job opportunity by 15 people, and an increasing
income of low class in urban area by 0.26 %.
182
5.4. Perceptions and Preferences of Foreign Tourists regarding Imported and Local Products
5.4.1 Introduction A survey on foreign tourists who visited Bali was undertaken during the
period of April to June 2013. The sample comprised 600 foreign tourists who had
agreed to respond to a questionnaire. They answered the questions related to their
perceptions and preferences concerning imported and local products. The results
of the validity test show that the questionnaire was valid with an r-value (0.207) >
r-table (0.08), see Appendix 5.6. Meanwhile, the reliability test gave a value of
alpha Cronbach (0.67) > 0.6. This means that consistent results would be found
if the research were undertaken on other similar subjects.
This chapter discusses the characteristics of the respondents, analysed by
country of origin, citizenship, sex, age, occupation, place of stay, type of
accommodation, as well as expenses and length of stay in Bali.
5.4.2 Characteristics of Foreign Tourists who Visited Bali 5.4.2.1 Country of Origin
The respondents‟ countries of origin were categorized into 5 groups,
namely: European Countries, Australia and New Zealand, United States of
America, African countries, and Asian countries. The largest group came from
European Countries (58%), followed by Australia (25%), United States of
America (10%), African countries (5%), and Asian countries (2%) (see Figure
5.4.1).
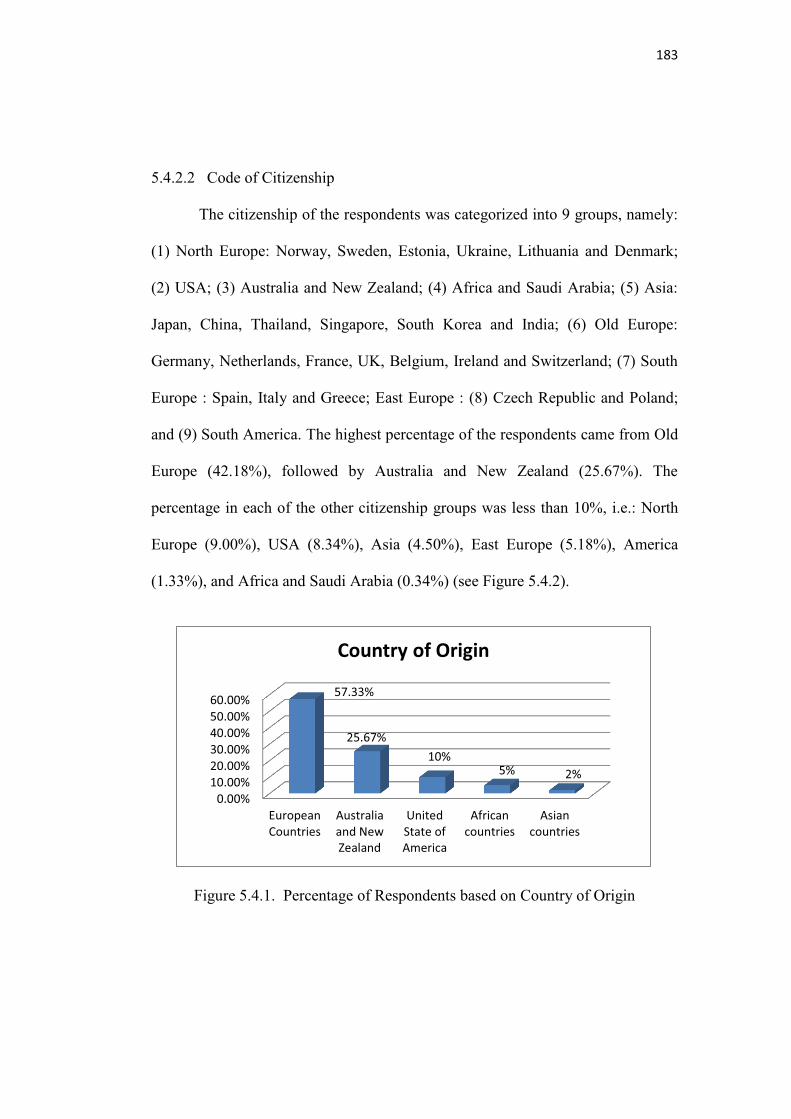
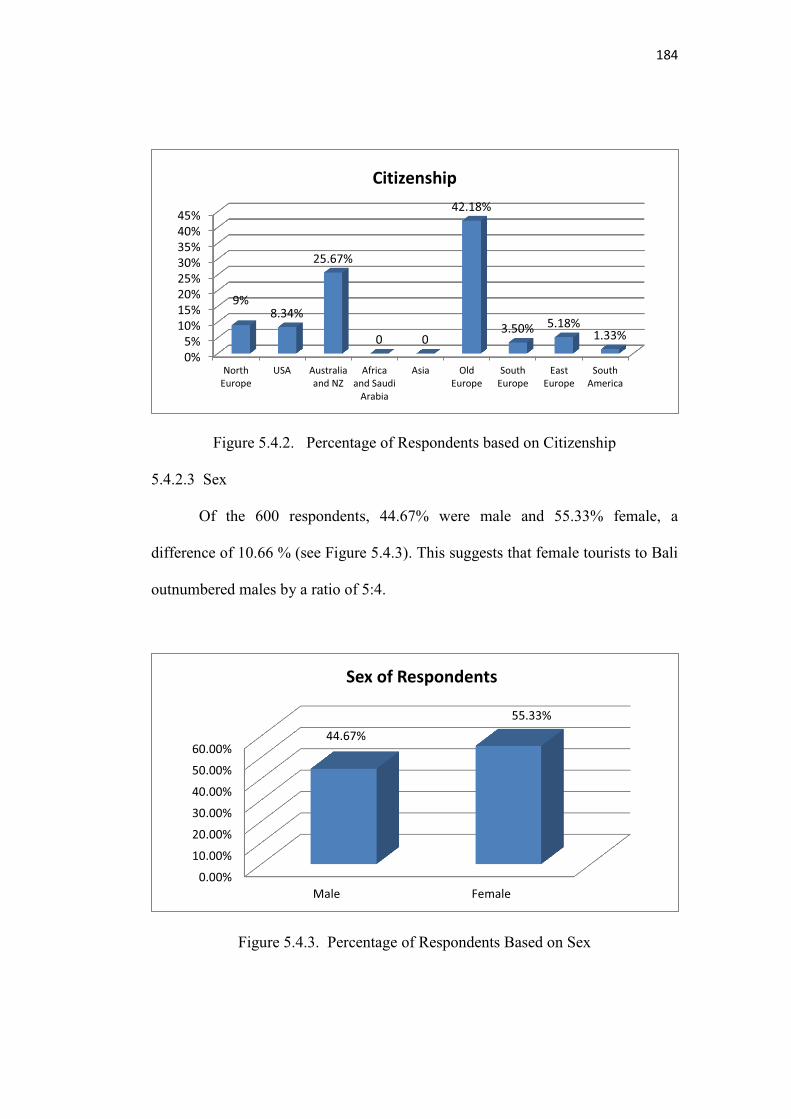

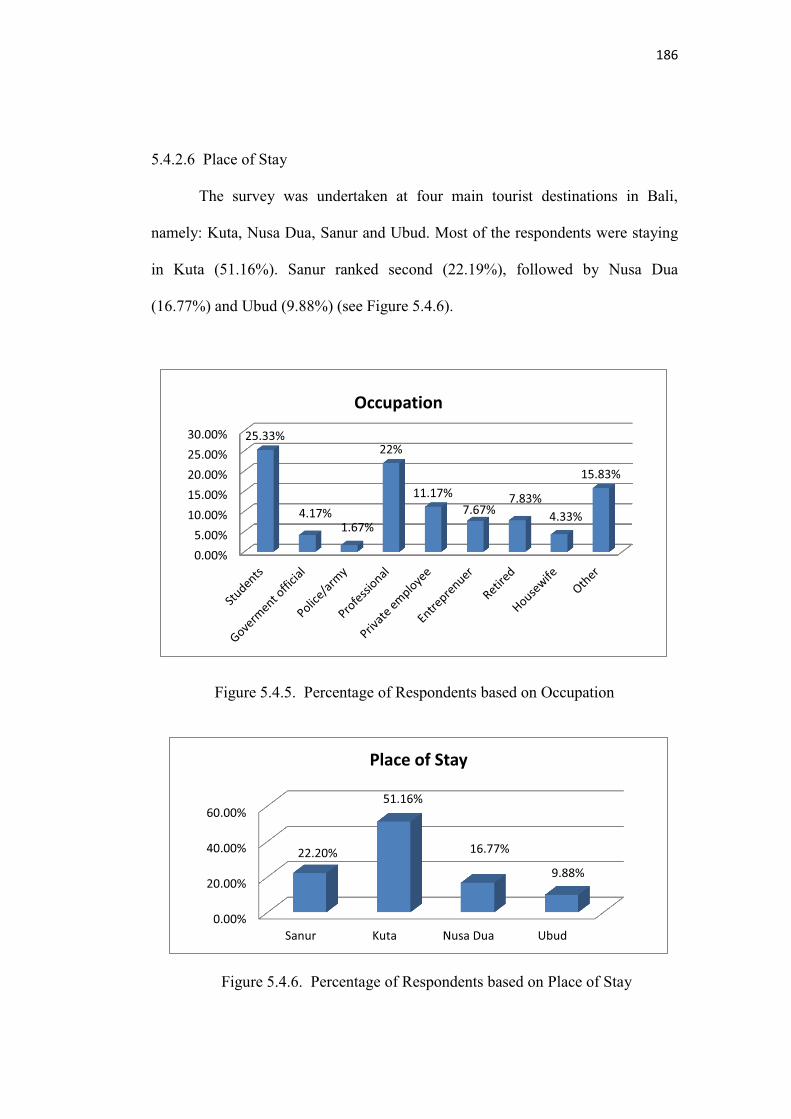

187
5.4.2.7 Type of Accommodation
More than one-third of the respondents were staying at Non-star rated
hotels (37.33%), followed by just under a quarter at 4&5 Star-rated non-chain
hotels (23.84%) and a fifth at 1,2&3 Star-rated hotels (20.33%). The rest of the
respondents were staying at 4&5 Star-rated chain hotels (18.50%) (see Figure
5.4.7). A survey undertaken by the Bali Government Tourism Office in 2012
showed different results because it was divided into 6 categories, as follows: (i)
Star-rated hotels (65.8%); (ii) Non-star rated hotels (8.9%); (iii) Cottages (5.4%);
(iv) Villas (16.4%) and (v) Family/friend‟s houses (1.7%), and other (1.8%) (Bali
Government Tourism Office, 2012). Nevertheless, these two studies do show
similar figures for the total percentage of foreign tourists staying at star-rated
hotels. In the current study this was 62.67% (i.e. the total percentage of those
staying at (i) 1,2&3 star-rated hotels, plus (ii) 4&5 Star-rated chain hotels, plus
(iii) 4&5 Star-rated non-chain hotels), while in the survey undertaken by the Bali
Government Tourism Office (2012) it was 65.8%.

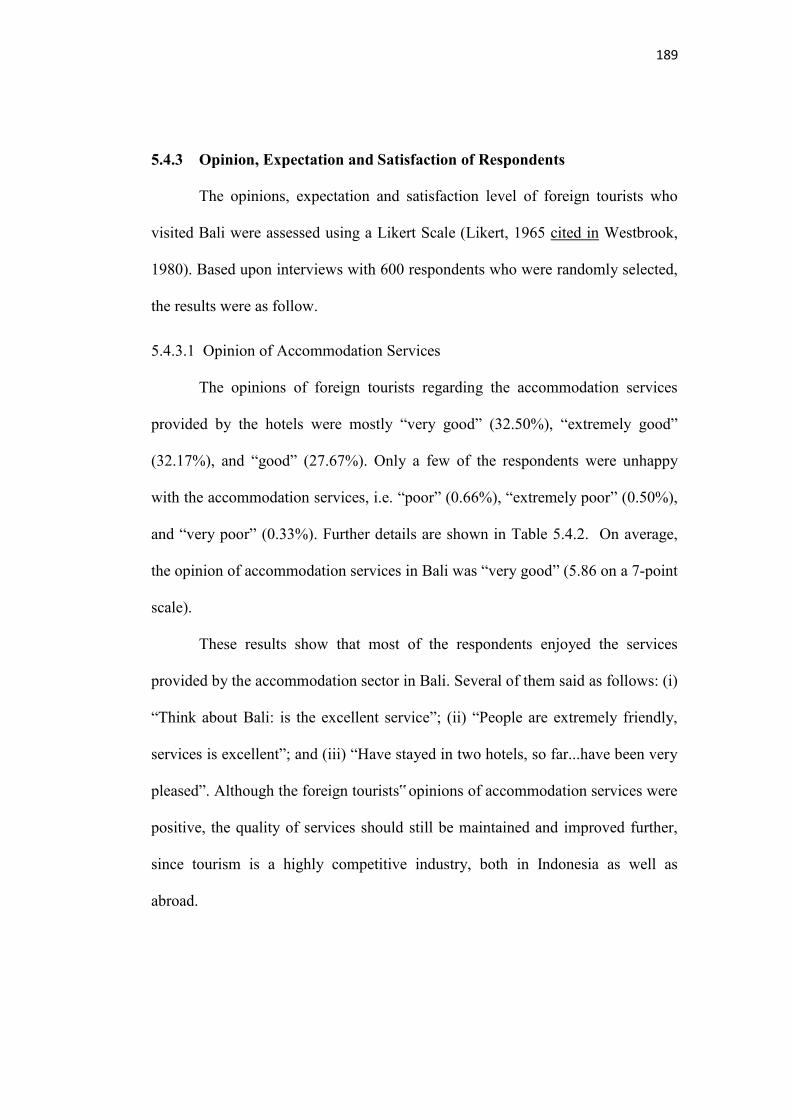
189
5.4.3 Opinion, Expectation and Satisfaction of Respondents
The opinions, expectation and satisfaction level of foreign tourists who
visited Bali were assessed using a Likert Scale (Likert, 1965 cited in Westbrook,
1980). Based upon interviews with 600 respondents who were randomly selected,
the results were as follow.
5.4.3.1 Opinion of Accommodation Services
The opinions of foreign tourists regarding the accommodation services
provided by the hotels were mostly “very good” (32.50%), “extremely good”
(32.17%), and “good” (27.67%). Only a few of the respondents were unhappy
with the accommodation services, i.e. “poor” (0.66%), “extremely poor” (0.50%),
and “very poor” (0.33%). Further details are shown in Table 5.4.2. On average,
the opinion of accommodation services in Bali was “very good” (5.86 on a 7-point
scale).
These results show that most of the respondents enjoyed the services
provided by the accommodation sector in Bali. Several of them said as follows: (i)
“Think about Bali: is the excellent service”; (ii) “People are extremely friendly,
services is excellent”; and (iii) “Have stayed in two hotels, so far...have been very
pleased”. Although the foreign tourists‟ opinions of accommodation services were
positive, the quality of services should still be maintained and improved further,
since tourism is a highly competitive industry, both in Indonesia as well as
abroad.
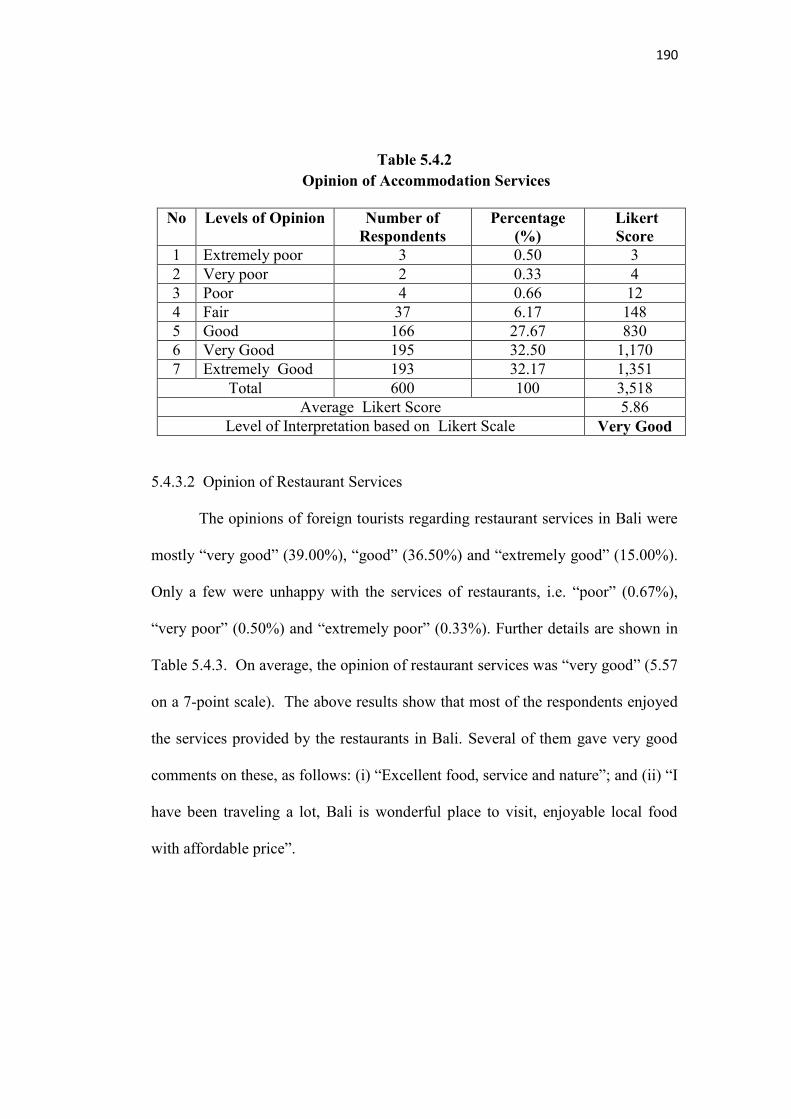
190
Table 5.4.2 Opinion of Accommodation Services
No Levels of Opinion Number of
Respondents Percentage
(%) Likert Score
1 Extremely poor 3 0.50 3
2 Very poor 2 0.33 4
3 Poor 4 0.66 12
4 Fair 37 6.17 148
5 Good 166 27.67 830
6 Very Good 195 32.50 1,170
7 Extremely Good 193 32.17 1,351
Total 600 100 3,518
Average Likert Score 5.86
Level of Interpretation based on Likert Scale Very Good
5.4.3.2 Opinion of Restaurant Services
The opinions of foreign tourists regarding restaurant services in Bali were
mostly “very good” (39.00%), “good” (36.50%) and “extremely good” (15.00%).
Only a few were unhappy with the services of restaurants, i.e. “poor” (0.67%),
“very poor” (0.50%) and “extremely poor” (0.33%). Further details are shown in
Table 5.4.3. On average, the opinion of restaurant services was “very good” (5.57
on a 7-point scale). The above results show that most of the respondents enjoyed
the services provided by the restaurants in Bali. Several of them gave very good
comments on these, as follows: (i) “Excellent food, service and nature”; and (ii) “I
have been traveling a lot, Bali is wonderful place to visit, enjoyable local food
with affordable price”.
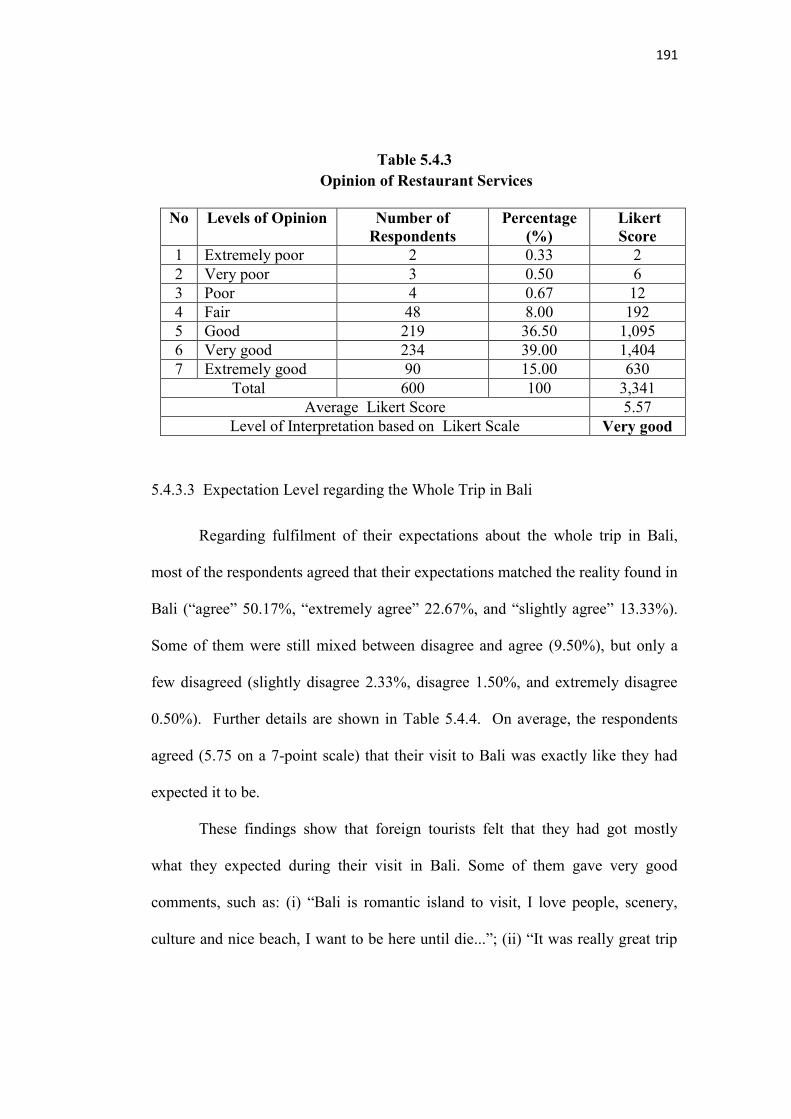
191
Table 5.4.3 Opinion of Restaurant Services
No Levels of Opinion Number of
RespondentsPercentage
(%) Likert Score
1 Extremely poor 2 0.33 2
2 Very poor 3 0.50 6
3 Poor 4 0.67 12
4 Fair 48 8.00 192
5 Good 219 36.50 1,095
6 Very good 234 39.00 1,404
7 Extremely good 90 15.00 630
Total 600 100 3,341
Average Likert Score 5.57
Level of Interpretation based on Likert Scale Very good
5.4.3.3 Expectation Level regarding the Whole Trip in Bali
Regarding fulfilment of their expectations about the whole trip in Bali,
most of the respondents agreed that their expectations matched the reality found in
Bali (“agree” 50.17%, “extremely agree” 22.67%, and “slightly agree” 13.33%).
Some of them were still mixed between disagree and agree (9.50%), but only a
few disagreed (slightly disagree 2.33%, disagree 1.50%, and extremely disagree
0.50%). Further details are shown in Table 5.4.4. On average, the respondents
agreed (5.75 on a 7-point scale) that their visit to Bali was exactly like they had
expected it to be.
These findings show that foreign tourists felt that they had got mostly
what they expected during their visit in Bali. Some of them gave very good
comments, such as: (i) “Bali is romantic island to visit, I love people, scenery,
culture and nice beach, I want to be here until die...”; (ii) “It was really great trip
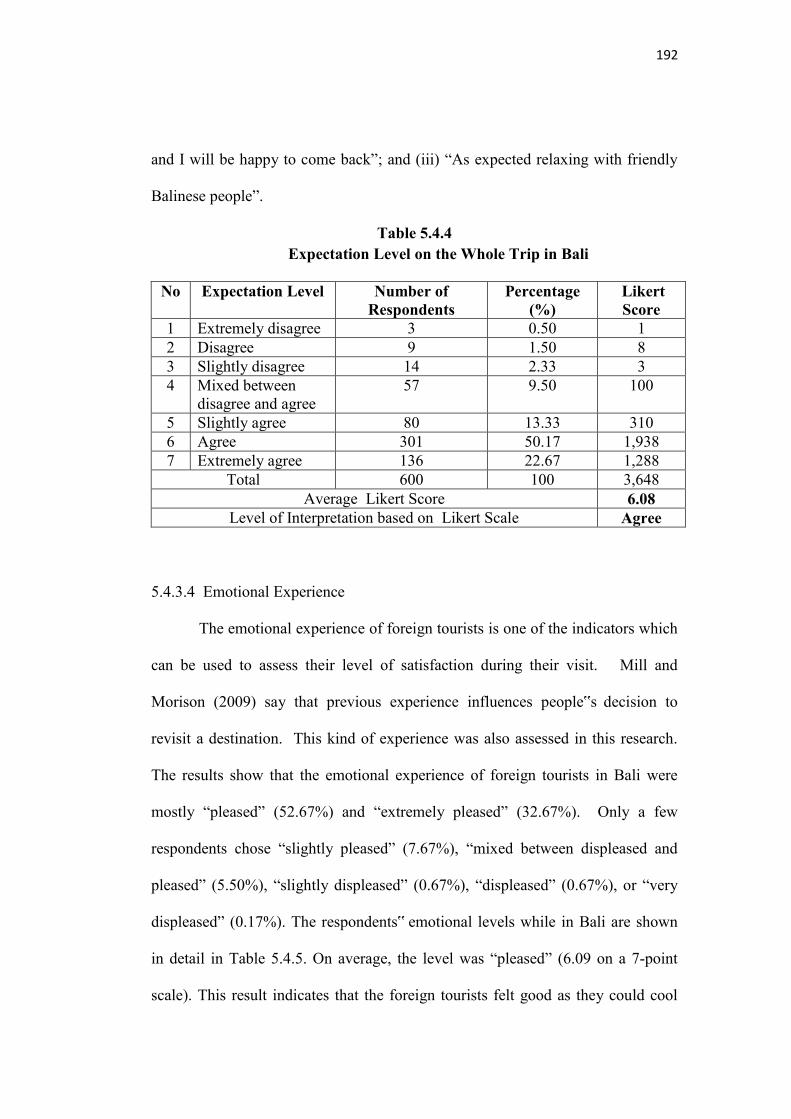
192
and I will be happy to come back”; and (iii) “As expected relaxing with friendly
Balinese people”.
Table 5.4.4 Expectation Level on the Whole Trip in Bali
No Expectation Level Number of
Respondents Percentage
(%) Likert Score
1 Extremely disagree 3 0.50 1
2 Disagree 9 1.50 8
3 Slightly disagree 14 2.33 3
4 Mixed between disagree and agree
57 9.50 100
5 Slightly agree 80 13.33 310
6 Agree 301 50.17 1,938
7 Extremely agree 136 22.67 1,288
Total 600 100 3,648
Average Likert Score 6.08 Level of Interpretation based on Likert Scale Agree
5.4.3.4 Emotional Experience
The emotional experience of foreign tourists is one of the indicators which
can be used to assess their level of satisfaction during their visit. Mill and
Morison (2009) say that previous experience influences people‟s decision to
revisit a destination. This kind of experience was also assessed in this research.
The results show that the emotional experience of foreign tourists in Bali were
mostly “pleased” (52.67%) and “extremely pleased” (32.67%). Only a few
respondents chose “slightly pleased” (7.67%), “mixed between displeased and
pleased” (5.50%), “slightly displeased” (0.67%), “displeased” (0.67%), or “very
displeased” (0.17%). The respondents‟ emotional levels while in Bali are shown
in detail in Table 5.4.5. On average, the level was “pleased” (6.09 on a 7-point
scale). This result indicates that the foreign tourists felt good as they could cool
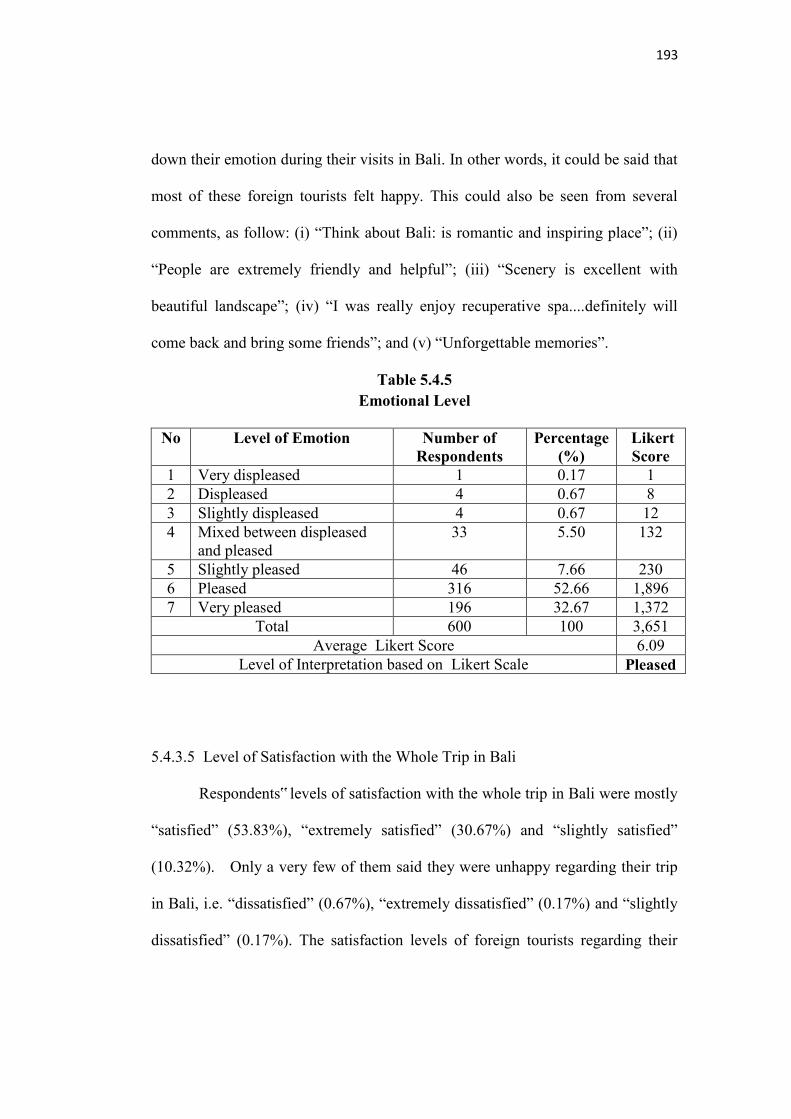
193
down their emotion during their visits in Bali. In other words, it could be said that
most of these foreign tourists felt happy. This could also be seen from several
comments, as follow: (i) “Think about Bali: is romantic and inspiring place”; (ii)
“People are extremely friendly and helpful”; (iii) “Scenery is excellent with
beautiful landscape”; (iv) “I was really enjoy recuperative spa....definitely will
come back and bring some friends”; and (v) “Unforgettable memories”.
Table 5.4.5 Emotional Level
No Level of Emotion Number of
Respondents Percentage
(%) Likert Score
1 Very displeased 1 0.17 1
2 Displeased 4 0.67 8
3 Slightly displeased 4 0.67 12
4 Mixed between displeased and pleased
33 5.50 132
5 Slightly pleased 46 7.66 230
6 Pleased 316 52.66 1,896
7 Very pleased 196 32.67 1,372
Total 600 100 3,651
Average Likert Score 6.09
Level of Interpretation based on Likert Scale Pleased
5.4.3.5 Level of Satisfaction with the Whole Trip in Bali
Respondents‟ levels of satisfaction with the whole trip in Bali were mostly
“satisfied” (53.83%), “extremely satisfied” (30.67%) and “slightly satisfied”
(10.32%). Only a very few of them said they were unhappy regarding their trip
in Bali, i.e. “dissatisfied” (0.67%), “extremely dissatisfied” (0.17%) and “slightly
dissatisfied” (0.17%). The satisfaction levels of foreign tourists regarding their
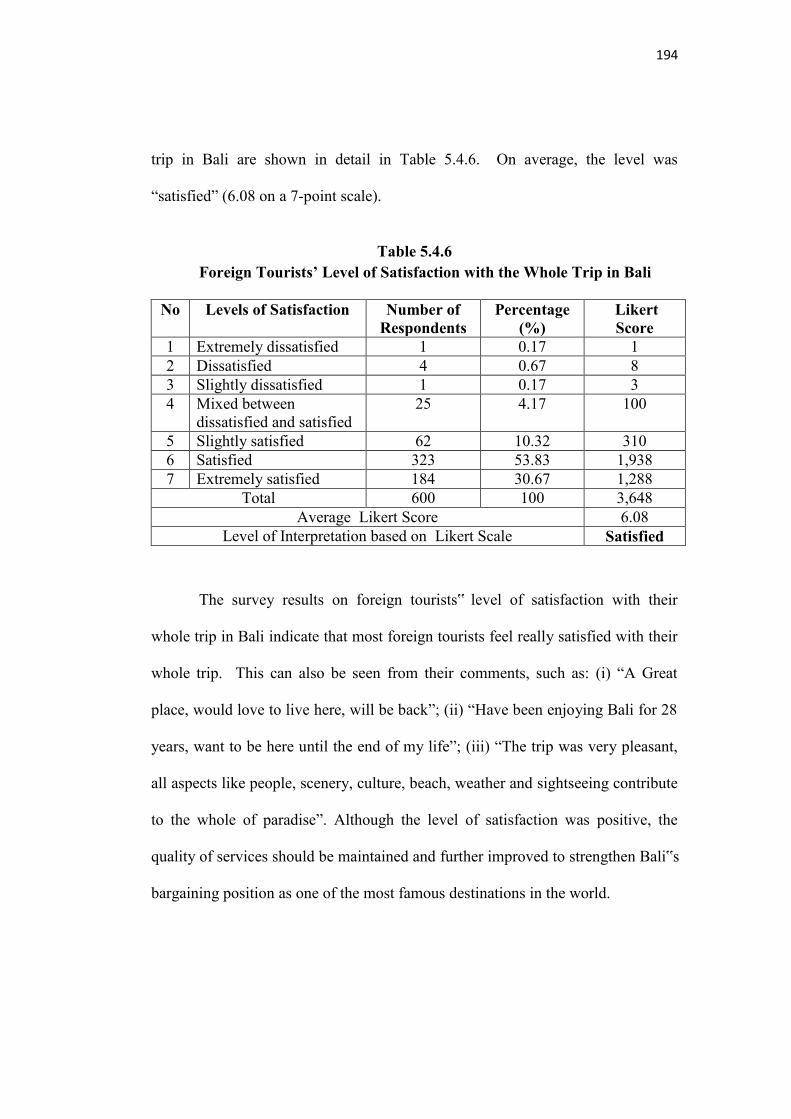
194
trip in Bali are shown in detail in Table 5.4.6. On average, the level was
“satisfied” (6.08 on a 7-point scale).
Table 5.4.6 Foreign Tourists’ Level of Satisfaction with the Whole Trip in Bali
No Levels of Satisfaction Number of Respondents
Percentage (%)
Likert Score
1 Extremely dissatisfied 1 0.17 1
2 Dissatisfied 4 0.67 8
3 Slightly dissatisfied 1 0.17 3
4 Mixed between dissatisfied and satisfied
25 4.17 100
5 Slightly satisfied 62 10.32 310
6 Satisfied 323 53.83 1,938
7 Extremely satisfied 184 30.67 1,288
Total 600 100 3,648
Average Likert Score 6.08
Level of Interpretation based on Likert Scale Satisfied
The survey results on foreign tourists‟ level of satisfaction with their
whole trip in Bali indicate that most foreign tourists feel really satisfied with their
whole trip. This can also be seen from their comments, such as: (i) “A Great
place, would love to live here, will be back”; (ii) “Have been enjoying Bali for 28
years, want to be here until the end of my life”; (iii) “The trip was very pleasant,
all aspects like people, scenery, culture, beach, weather and sightseeing contribute
to the whole of paradise”. Although the level of satisfaction was positive, the
quality of services should be maintained and further improved to strengthen Bali‟s
bargaining position as one of the most famous destinations in the world.
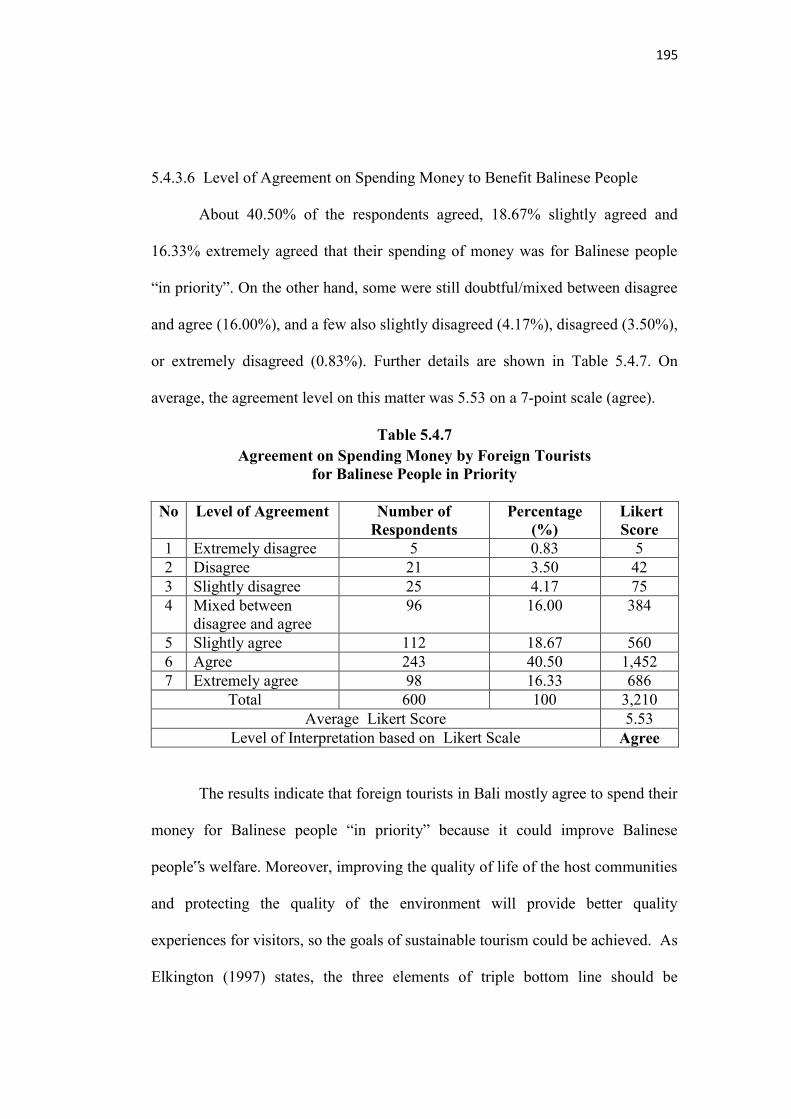
195
5.4.3.6 Level of Agreement on Spending Money to Benefit Balinese People
About 40.50% of the respondents agreed, 18.67% slightly agreed and
16.33% extremely agreed that their spending of money was for Balinese people
“in priority”. On the other hand, some were still doubtful/mixed between disagree
and agree (16.00%), and a few also slightly disagreed (4.17%), disagreed (3.50%),
or extremely disagreed (0.83%). Further details are shown in Table 5.4.7. On
average, the agreement level on this matter was 5.53 on a 7-point scale (agree).
Table 5.4.7 Agreement on Spending Money by Foreign Tourists
for Balinese People in Priority
No Level of Agreement Number of Respondents
Percentage (%)
Likert Score
1 Extremely disagree 5 0.83 5
2 Disagree 21 3.50 42
3 Slightly disagree 25 4.17 75
4 Mixed between disagree and agree
96 16.00 384
5 Slightly agree 112 18.67 560
6 Agree 243 40.50 1,452
7 Extremely agree 98 16.33 686
Total 600 100 3,210
Average Likert Score 5.53
Level of Interpretation based on Likert Scale Agree
The results indicate that foreign tourists in Bali mostly agree to spend their
money for Balinese people “in priority” because it could improve Balinese
people‟s welfare. Moreover, improving the quality of life of the host communities
and protecting the quality of the environment will provide better quality
experiences for visitors, so the goals of sustainable tourism could be achieved. As
Elkington (1997) states, the three elements of triple bottom line should be
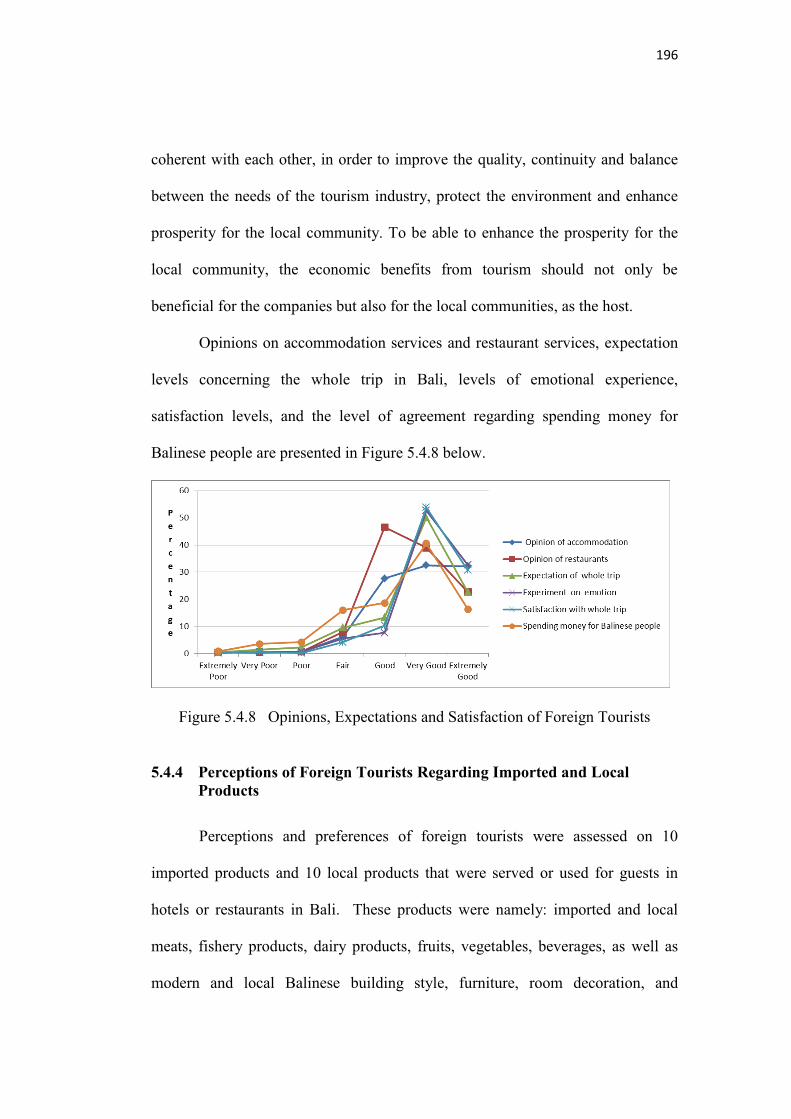

197
architecture. A seven-point Likert Scale (Likert, 1965 cited in Westbrook, 1980)
was used to assess the perceptions of the 600 foreign tourists in the sample. JMP
Software (SAS Company) was used to analyse the responses statistically. The
average scores for perceptions on imported and local products can be seen in
Table 5.4.8 and Figure 5.4.9.
Table 5.4.8 Average Scores for Perceptions on Imported and Local Products
No
Products
Perception
Average Likert Score
Imported Interpretation Local Interpretation
1 Meat 6.24# Extremely good 5.32 Very good
2 Dairy Products 6.08# Very good 5.58 Very good
3 Beverages 5.56# Very good 4.82 Good
4 Building style 5.21 Good 6.12# Very good
5 Room decoration 5.04 Good 5.81# Very good
6 Architecture 5.03 Good 6.31# Extremely good
7 Vegetables 5.00 Good 5.53 Very good
8 Fruits 4.85 Good 5.63# Very good
9 Fishery Products 4.83 Good 5.80# Very good
10 Furniture 4.53 Good 5.00 Good
Average 5.24 Good 5.59 Very good
Key: #: products with a higher than average score Italics indicates preference for the imported product Bold indicates preference for the local product
The results show that the overall average score for local products was
slightly higher than that for imported products (average score for local products
was 5.59, while that for imported products was 5.24).
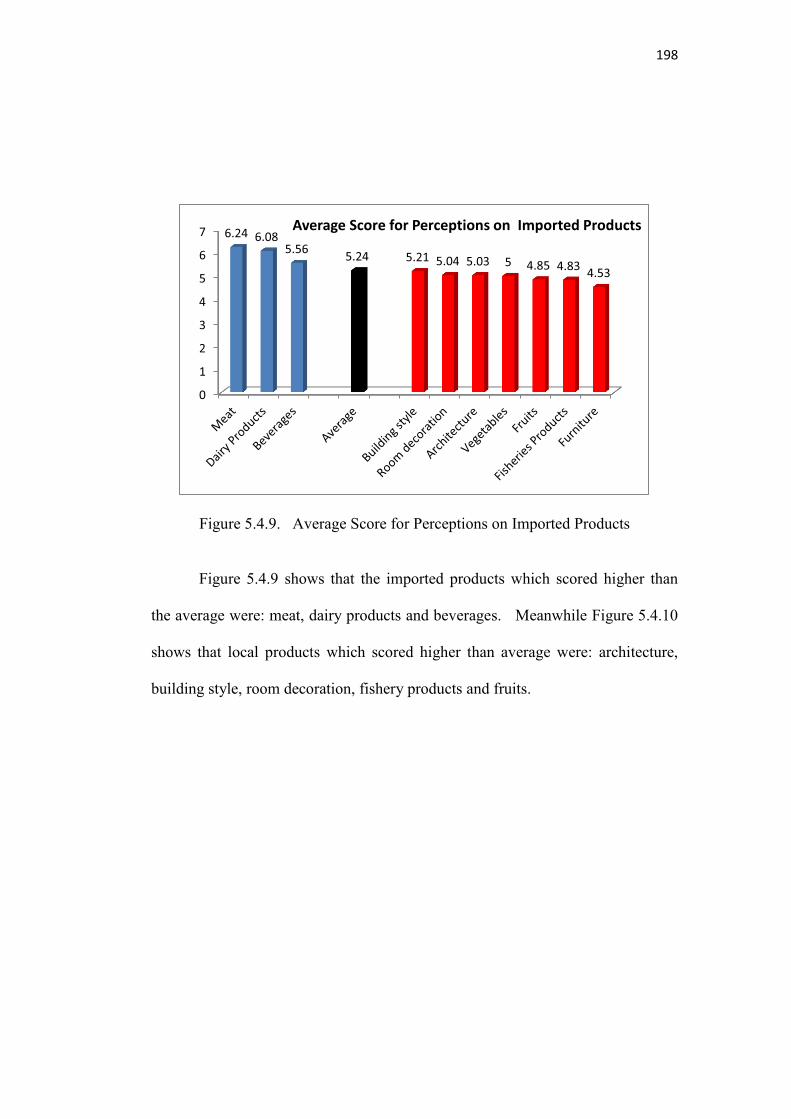
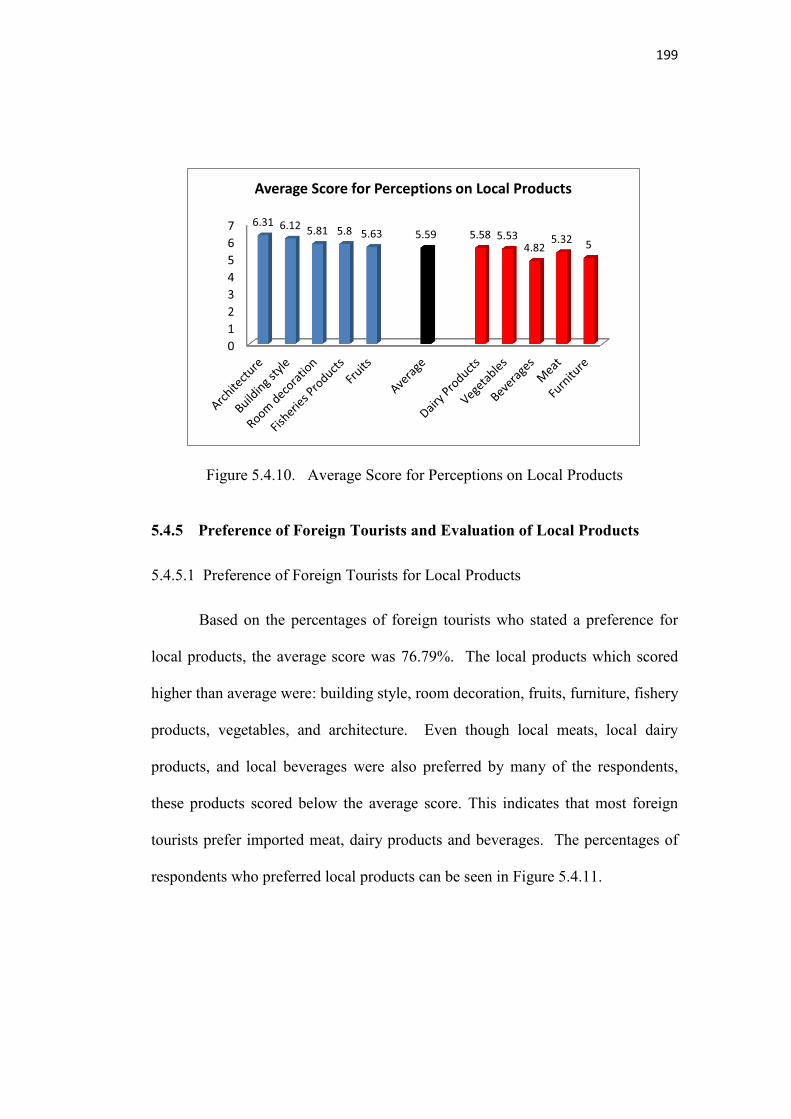
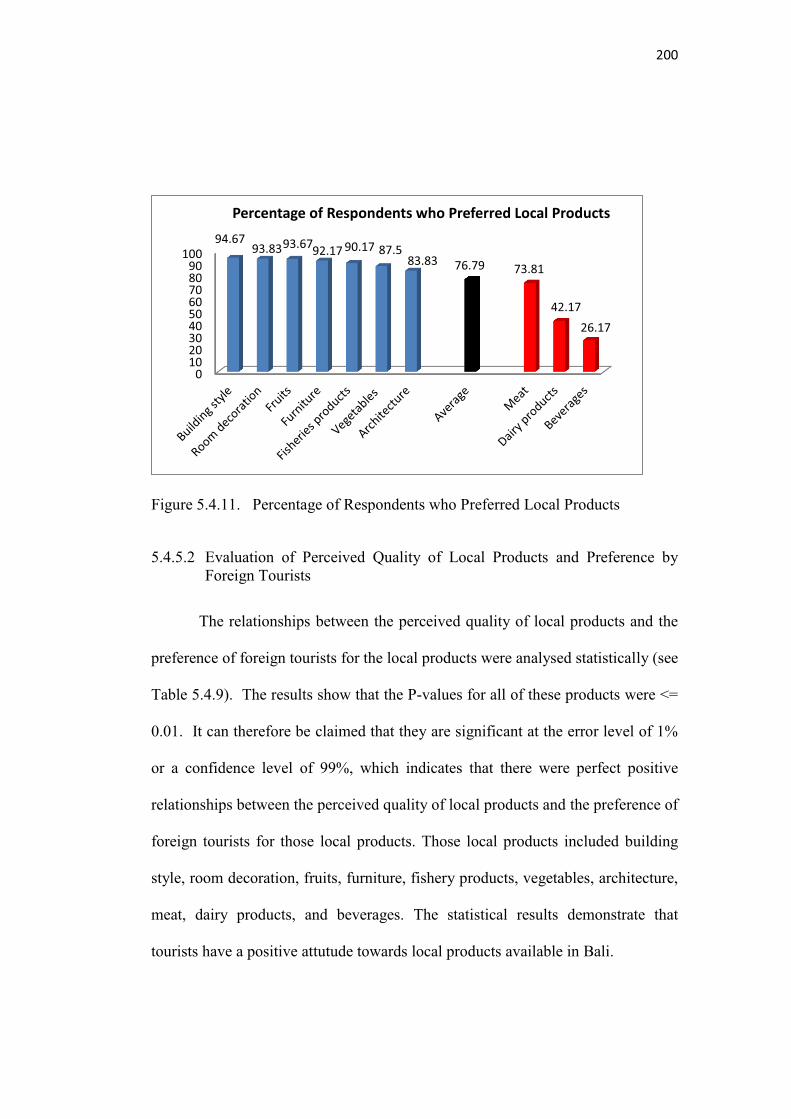

201
Table 5.4.9 Statistical Results of Foreign Tourists’ Preference for Local Products
Preference for Local Products
Perceived Quality of Local Products
F Value Statistical Significance
Conclusion
Building style 8.36 0.000 *** Positive relationship
Room decoration 15.28 0.000*** Positive relationship
Fruits 31.56 0.000*** Positive relationship
Furniture 9.16 0.000*** Positive relationship
Fishery products 39.56 0.000*** Positive relationship
Vegetables 60.03 0.000*** Positive relationship
Architecture 14.49 0.000*** Positive relationship
Meat 71.85 0.000*** Positive relationship
Dairy products 76.86 0.000*** Positive relationship
Beverages 57.82 0.000*** Positive relationship
Remarks: * : P value <=0.1 ** : P value <=0.05 *** : P value <=0.01
5.4.6 Analysis of Relationships between Variables
Analysis of relationships between the following variables was undertaken:
familiarity, satisfaction, motivation, perception on quality of services, perception
on quality of imported product, perception on quality of local products and benefit
for Balinese people. Results of statistical analysis using the JMP statistical
program are outlined below.
5.4.6.1 Relationship between Familiarity and Satisfaction
Familiarity (F) is a quality or condition for being familiar. In this study,
familiarity is related to the satisfaction of tourists during their visit in Bali.
Familiarity consists of spatial proximity and expertise of the country (Bashar,
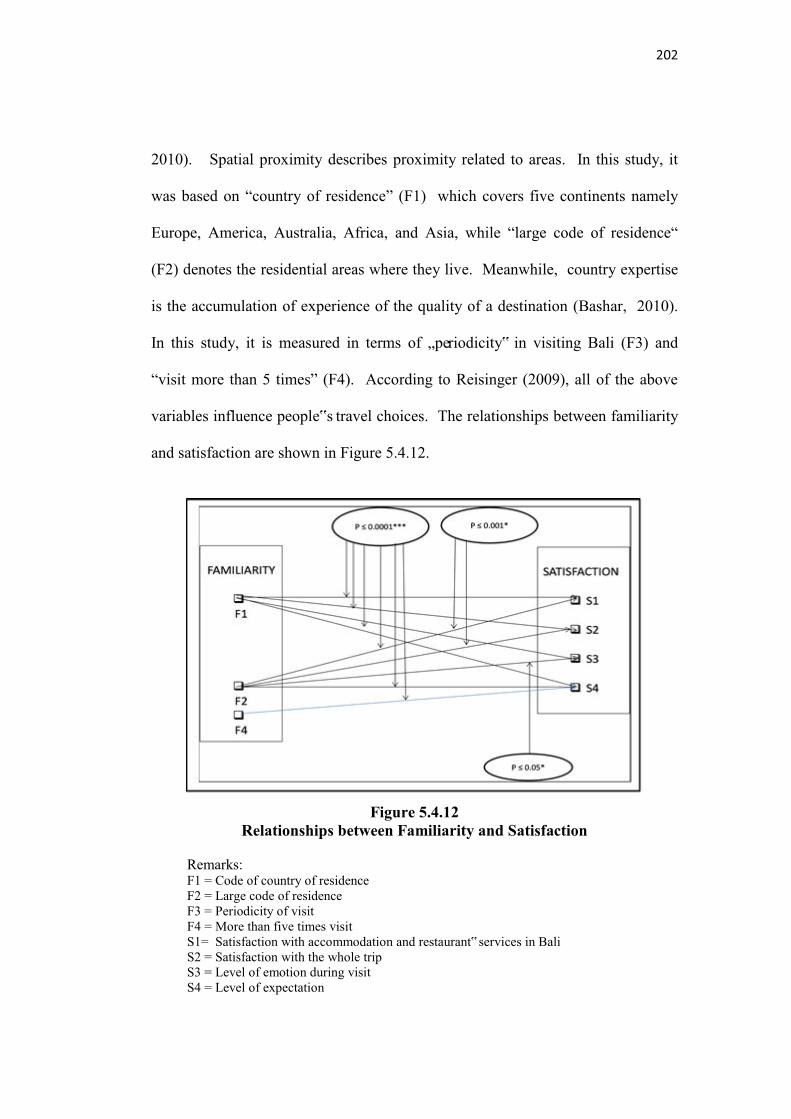

203
Most of the variables had a significant relationship wih the others, as
shown in Figure 5.4.13. Two variables of familiarity had significant relationships
with four variables of satisfaction, namely: (i) variable F1 (Code of country of
residence) had significant relationships with variables S1, S2, S3 and S4
(Satisfaction with accommodation and restaurant services in Bali, satisfaction
with the whole trip, level of emotion during visit, and level of expectation); (ii)
variable F2 (Large code of residence) also had significant relationships with
variables S1, S2, S3 and S4; and (iii) variable F4 (More than five times visit) had
a significant relationship only with variable S4 (Level of expectation).
5.4.6.2 Relationship between Familiarity and Benefit for Balinese
Familiarity is expected to have a relationship with the variable “Benefit for
Balinese” (B). It means that there was a relationship between familiarity and the
idea of spending money for Balinese people while visiting Bali. The results are
shown in Table 5.4.10. As can be seen from Table 5.4.10, only variable F3
(Periodicity of visits) has a significant relationship with variable B (Benefit for
Balinese) at a significant level of P-value ≤ 0.05.
Table 5.4.10 Relationship between Familiarity and Benefit for Balinese
Familiarity (F) Benefit for Balinese (B)
F1 (Code of country of residence) ns
F2 (Large code of residence) ns
F3 (Periodicity of visits) P ≤ 0.05
F4 (More than five times visit) Ns
Remarks: ns = non significant
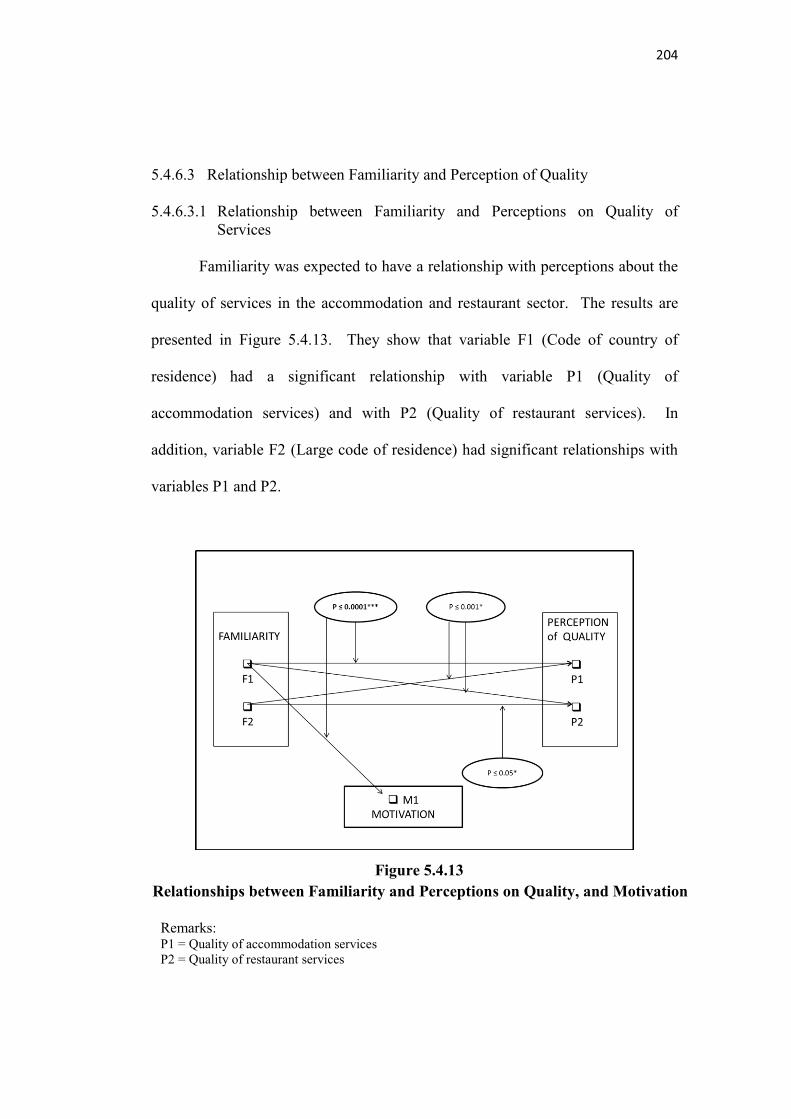

205
5.4.6.3.2 Relationship between Familiarity and Perceptions on Quality of
Products
There were significant relationships between variable F (Familiarity) and
variable P (Perception of quality of products), as outlined below:
1) Relationships between F1 (Code of country of residence) and P (Perception
of product quality) were as follow:
There were significant relationships between variable F1 (code of country of
residence) and the variables imported meat (P3), local meat (P4), local fishery
products (P6), imported dairy products (P7), local fruits (P10), imported
beverages (P13), local beverages (P14) and local building style (P15).
2) Relationships between F2 (Large code of residence) and P (Perception of
product quality) were as follow:
There were significant relationships between variable F2 (large code of
residence) and the variables imported meat (P3), imported dairy products
(P7), imported fruits (P9) and imported vegetables (P11).
3) There was no relationship between variable F3 (periodicity of visit) and
perceptions of local product quality (P).
4) The relationships between F4 (more than five times visit) and perceptions of
product quality were as follow:
There were significant relationships between variable F4 (more than five
times visit) and imported meat (P3), imported beverages (P13), local
beverages (P14) and local building style (P15).
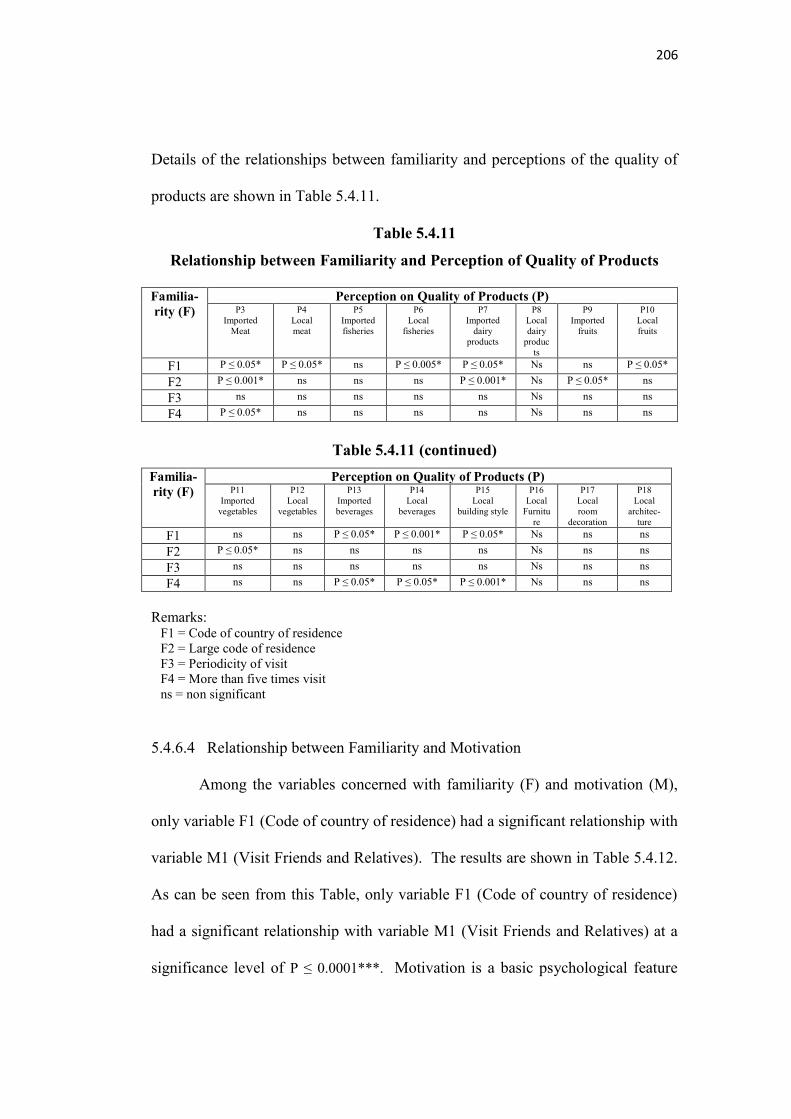
206
Details of the relationships between familiarity and perceptions of the quality of
products are shown in Table 5.4.11.
Table 5.4.11
Relationship between Familiarity and Perception of Quality of Products Familia- rity (F)
Perception on Quality of Products (P) P3
Imported Meat
P4 Local meat
P5 Imported fisheries
P6 Local
fisheries
P7 Imported
dairy products
P8 Local dairy
products
P9 Imported
fruits
P10 Local fruits
F1 P ≤ 0.05* P ≤ 0.05* ns P ≤ 0.005* P ≤ 0.05* Ns ns P ≤ 0.05*
F2 P ≤ 0.001* ns ns ns P ≤ 0.001* Ns P ≤ 0.05* ns
F3 ns ns ns ns ns Ns ns ns
F4 P ≤ 0.05* ns ns ns ns Ns ns ns
Table 5.4.11 (continued)
Familia- rity (F)
Perception on Quality of Products (P) P11
Imported vegetables
P12 Local
vegetables
P13 Imported beverages
P14 Local
beverages
P15 Local
building style
P16 Local
Furniture
P17 Local room
decoration
P18 Local
architec-ture
F1 ns ns P ≤ 0.05* P ≤ 0.001* P ≤ 0.05* Ns ns ns
F2 P ≤ 0.05* ns ns ns ns Ns ns ns
F3 ns ns ns ns ns Ns ns ns
F4 ns ns P ≤ 0.05* P ≤ 0.05* P ≤ 0.001* Ns ns ns
Remarks:
F1 = Code of country of residence F2 = Large code of residence F3 = Periodicity of visit F4 = More than five times visit ns = non significant
5.4.6.4 Relationship between Familiarity and Motivation
Among the variables concerned with familiarity (F) and motivation (M),
only variable F1 (Code of country of residence) had a significant relationship with
variable M1 (Visit Friends and Relatives). The results are shown in Table 5.4.12.
As can be seen from this Table, only variable F1 (Code of country of residence)
had a significant relationship with variable M1 (Visit Friends and Relatives) at a
significance level of P ≤ 0.0001***. Motivation is a basic psychological feature
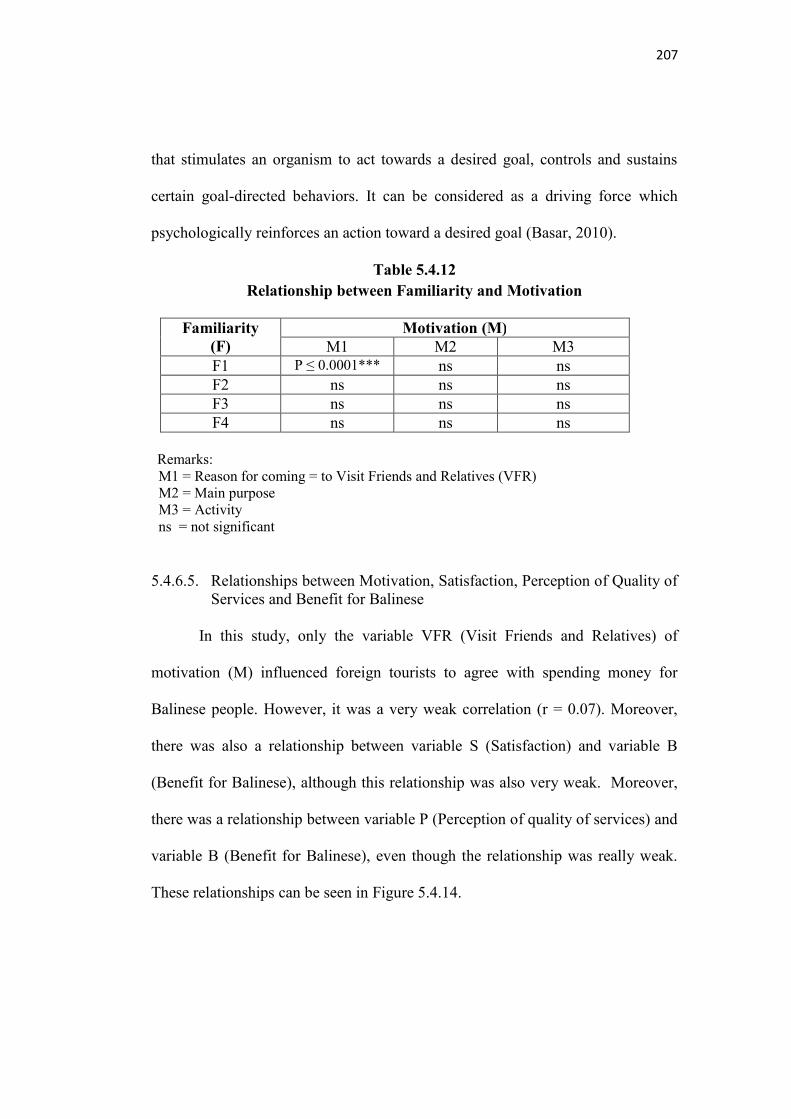
207
that stimulates an organism to act towards a desired goal, controls and sustains
certain goal-directed behaviors. It can be considered as a driving force which
psychologically reinforces an action toward a desired goal (Basar, 2010).
Table 5.4.12 Relationship between Familiarity and Motivation
Familiarity (F)
Motivation (M) M1 M2 M3
F1 P ≤ 0.0001*** ns ns
F2 ns ns ns
F3 ns ns ns
F4 ns ns ns
Remarks:
M1 = Reason for coming = to Visit Friends and Relatives (VFR) M2 = Main purpose M3 = Activity ns = not significant
5.4.6.5. Relationships between Motivation, Satisfaction, Perception of Quality of Services and Benefit for Balinese
In this study, only the variable VFR (Visit Friends and Relatives) of
motivation (M) influenced foreign tourists to agree with spending money for
Balinese people. However, it was a very weak correlation (r = 0.07). Moreover,
there was also a relationship between variable S (Satisfaction) and variable B
(Benefit for Balinese), although this relationship was also very weak. Moreover,
there was a relationship between variable P (Perception of quality of services) and
variable B (Benefit for Balinese), even though the relationship was really weak.
These relationships can be seen in Figure 5.4.14.

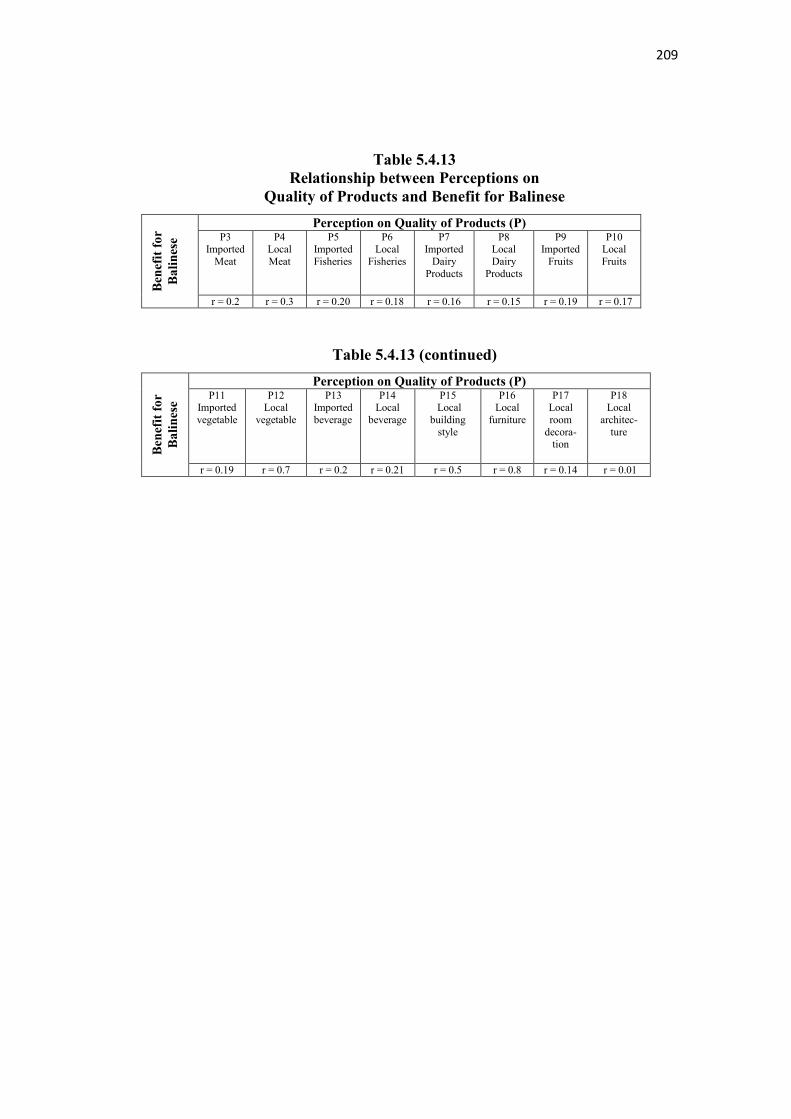
209
Table 5.4.13 Relationship between Perceptions on
Quality of Products and Benefit for Balinese
Ben
efit
for
B
alin
ese
Perception on Quality of Products (P) P3
Imported Meat
P4 Local Meat
P5 Imported Fisheries
P6 Local
Fisheries
P7 Imported
Dairy Products
P8 Local Dairy
Products
P9 Imported
Fruits
P10 Local Fruits
r = 0.2 r = 0.3 r = 0.20 r = 0.18 r = 0.16 r = 0.15 r = 0.19 r = 0.17
Table 5.4.13 (continued)
Ben
efit
for
B
alin
ese
Perception on Quality of Products (P) P11
Imported vegetable
P12 Local
vegetable
P13 Imported beverage
P14 Local
beverage
P15 Local
building style
P16 Local
furniture
P17 Local room
decora-tion
P18 Local
architec-ture
r = 0.19 r = 0.7 r = 0.2 r = 0.21 r = 0.5 r = 0.8 r = 0.14 r = 0.01

210
5.5 Point of View of Hotel Managers
5.5.1 Introduction
A qualitative survey through in-depth interview was undertaken in Bali
during April to June 2013. There were 79 accommodation managers from various
accommodation types interviewed in order to obtain their points of view regarding
the use of imported products. The selection of accommodation managers was
undertaken based on proportional to size sampling method, involving three
clusters of accommodation, namely: (i) 1,2&3 Star-rated hotels, (ii) 4&5 Star-
rated hotels either chain or non-chain hotels, and (iii) Non-star rated hotels. There
were several different points of view gained from different types of hotel
managers. The points of view of hotel managers are outlined into several parts, as
follow: (1) Reasons to use imported products; (2) Quality and availability of local
products; (3) Point of view of hotel managers about cause and impact of leakage
in tourism; (4) Willingness in reducing the use of imported products and give the
priority on local products; and (5) Discussion.
5.5.2 Reasons in Choosing Imported Products As revealed by Bull (1991) that import was one of the causes for economic
leakage which occurred when food and beverage must often be imported, since
local products had been considered not eligible to fulfill the requirement of the
hotel's standard of products, and the host country doesn't have a supplying
industry. Points of view regarding the reason for using imported products were
different among types of hotels in Bali. The reasons were as follow:
211
(1) Quality reason. Quality of imported products was the main reason for using
imported products. Most of Star-rated hotels either 4&5 Star-rated chain or
non-chain hotels as well as 1,2&3 Star-rated hotels tended to use imported
products. Hotel managers from Star-rated chain hotels said that products
must have a high standard of quality in order to fulfill the requirement of
chain hotel standard. They thought that imported meats, dairy products and
alcoholic beverages have a better quality in comparison to the local products.
They firmly explained that Star-rated hotels need a high quality of imported
food, alcoholic beverage, and utensil as well as other equipment in order to
fulfill the quality standard requirement.
In term of utensils and equipment, most of 4&5 Star-rated either chain or
non-chain hotels used imported products for utensils, cutlery, beds and bath
equipment as the compulsory for high standards quality of international chain
hotel and this kind of imported products have better quality than local
products. On the other hand, most of Non-star rated hotel did not use
imported utensil and equipment. Furthermore, some imported room
decorations had been used by 4&5 Star-rated hotel. They used a combination
of modern and local style for room decoration because they also desired to
show the authentic Balinese arts.
(2) Competition among hotels on presenting better quality of products and
services. According to the hotel managers, there were a lot of Star-rated
hotels available in Bali which offer variety of attractive restaurant’s menus.
They said that imported meat, dairy product and alcoholic beverage were

212
compulsory for chain hotels in presenting a high quality cuisine. They argued
that imported products have excellent quality and better than local products.
(3) To avoid complaint. Hotel managers thought that foreign tourists preferred
imported products. According to the hotel managers, most of foreign tourists
would like to consume imported meats, dairy products, and alcoholic
beverages as they obtain in their home countries. The imported meats are
particularly beef and lamb which have fatty and smooth texture, as well as
fresh and durability dairy products, and variety of alcoholic beverages that
had not been found in local products. By providing those imported products,
it will meet the tourists’ need.
This study found that 4&5 Star-rated chain hotels had the highest demand
for imported products, followed by 4&5 Star-rated non-chain hotels and 1,2&3
Star-rated hotels. Meanwhile, most of Non-star rated hotel preferred serving local
products to their guests. This finding was gained from the information given by
hotel managers in all types of hotels.
5.5.3 Point of View of Hotel Managers on Local Products
Points of view of hotel managers regarding local products, particularly
quality and availability of local products, were as follow:
(1) Most of local foods could not fulfill the requirement by hotels either in term
of quality or quantity. The hotel managers explained that some meats,
especially beef and lamb need to be imported. However, they usually use
some other local meats, such as chicken and pork, as the quality of these
kinds of meat can fulfill tourist’s need. Fish products are also available
213
abundantly in Bali, because Bali as a small island is surrounded by sea with
many kinds of fish product.
(2) Availability and seasonality of horticulture products. Bali has variety of
authentic fruits. However, availability of local fruits did not continue due to
seasonality of the fruits. This situation encourages hotel managers to use
imported fruits, such as apples, oranges, grapes, cherries, almond, etc.
However, availability of local vegetables was sufficient to fulfill demand of
hotels, even though 4&5 star-rated hotels imported several vegetable products
which were not available locally or could not fulfill by local producers, such
as dried spinach, sundried tomato, asparagus, fettuccini, sunflower lettuce,
baby romaine, celery seed, berlotti bean, etc. Furthermore, most star-rated
hotels imported alcoholic beverage and dairy products in order to fulfill the
requirement of hotels, as the variety and quality of local alcoholic beverages
and local dairy products were not sufficient to fulfill the demand of tourists.
(3) Local furniture, room decoration and building style. Managers of all type of
hotels had similar points of view on the use of local furniture, building style,
room decoration and architecture. The said that tourists mostly prefer
authentic Balinese furniture, room decoration, building style as well as
Balinese architecture which were artistic and unique.
214
5.5.4 Points of View of Hotel Managers on Cause and Impact of Leakage in Tourism Industry
Different points of view from hotel managers had been found in term of
cause and impact of economic leakage in tourism. Some of hotel managers for all
type of star-rated hotels understood that cause of economic leakage in tourism
were the use of imported products, services and foreign labours. Their mindset
had been on how to serve their guests with high quality of products. However,
some of them did not care about economic leakage in tourism due to imported
products as long as they found good quality of products to serve their guests.
Different points of view had been found from hotel managers/owners of
Non-Star-rated hotels. They mostly did not understand about economic leakage in
tourism. In fact, according to them, they have already used mostly local products.
However, most of them realized that the use of imported alcoholic beverages were
very important to serve their guests.
5.5.5 Willingness in Reducing Imported Products and Giving the Priority on Local Products
Regarding the willingness in reducing imported products, most of hotel
managers agreed to reduce the use of imported products and to give priority on
local products as long as the quality and availability of the local products could
fulfill tourists' need. Moreover, most of hotel managers really concerned
regarding the use of local components in tourism by serving local products to
foreign tourists. For example, creating variety of restaurant’s menus by using
local products was one of the solutions to improve the role of local products in
tourism.
215
However, most of hotel managers were really concern about the quality of
all types of product, such as foods, beverages, dairy products, food stuffs, fruits
and vegetables. They realized that the quality of local products were mostly
poorer in comparison to imported products. They also suggested that the
availability of local products as a substitute for imported product was also crucial.
Some suggestions had been given by some hotel managers to improve the quality
of local products, such as: (i) to improve the ability of farmers in producing better
quality of local products (including livestock and horticulture products such as
fruits and vegetables) by giving the farmers a better education and training; (ii) to
give some funding to farmers in order to improve the quality of farming system;
and (iii) to suggest the local government to pay more attentions on development
of agricultural products to fulfill requirement of quality standard needed by hotels
in order to fulfill tourists’ need.
From points of view of hoteliers, enhancing the quality of human
resources is also really important by working together between government, hotel
associations, farmers and agricultural industry in order to improve quality of local
products.
5.5.6 Conclusion
Points of view of accommodation managers on the importance of imported
products have not met the tourists’ need on local products. The manager tends to
behave by giving too much respect to the quality of imported products in
comparison to the local products. Therefore, they prefer to serve imported
products to foreign tourists. This incorrect perception and attitude of hotels’

216
managers toward tourists’ need lead to incorrect decision and actions. Such
behavior of accommodation managers brought about dependence on imported
products to fulfill tourists’ demand. This led to increase tourism leakage in Bali.
The results suggest that accommodation managers should change their
habits in order to reduce current tourism leakage from accommodation sector.
Moreover, the government policy should encourage the development of better
quality of agricultural products, including fruits, livestock and wines in Bali.
Some funding techniques should be proposed to assist local producers. Hotel
managers are willing to reduce the use of imported products, and to give priority
on local products as long as the quality and availability of the local products could
fulfill tourists' need.
217
5.6 Minimization of Tourism Leakage in Accommodation Sector in Bali
Minimization of tourism leakage in accommodation sector in Bali consists
of six elements, namely: (1) program goals, (2) program needs, (3) affected
sectors, (4) program constraints, (5) possible changes in the program, and (6)
involvement of agencies in the policy. Each element consists of sub-element
which has contextual relationships among each other in accordance to the
minimization strategy for tourism leakage in accommodation sector in Bali. The
contextual relationship of each sub-element is presented in Table 5.6.1.
Table 5.6.1
Contextual Relationship of Each Sub-element within the Element ________________________________________________________________________
Elements Contextual Relationship ________________________________________________________________________
1. Program goals (Gi) Gi contributes in achieving Gj 2. Program needs (N
i) Ni supports Nj
3. Affected sectors (Ti) Ti influences Tj
4. Program constraints (Ci) Ci causes Cj
5. Possible changes in the program (Mi) Mi results in Mj
6. Involvement of agencies in policy (Ai) Ai supports Aj
________________________________________________________________________
ij = 1,2,3 ... (i,j ≤ 10)
5.6.1 Program Goals for Minimization of Tourism Leakage
Element of program goals for minimization of tourism leakage from
accommodation sector in Bali consisted of 10 sub-elements, namely:
1. To improve community welfare
2. To optimize the potential of local products
3. To develop agriculture, livestock, fisheries and handicraft industry
4. To increase regional income

218
5. To increase job opportunity
6. To conserve environment and to preserve culture
7. To empower community
8. To reduce the use of imported products for tourists
9. To increase export of local products
10. To achieve sustainable tourism
Analysis of the contextual relationships among the sub-elements of program goals
by using ISM method resulted in reachability matrix (RM) as shown in Table
5.6.2. Based on the RM in Table 5.6.2, the key sub-elements of program goals for
minimization of tourism leakage are: (i) To optimize the potential of local
products (E2); (ii) To develop agriculture, livestock, fisheries and handicraft
industry (E3); (iii) To empower community (E7); (iv) To reduce the use of
imported products for tourists (E8); and (v) To increase export of local products
(E9). According to Driver Power (DP) and Dependence (D), these five sub-
elements of the program goals located at the fourth sector (independent), but other
five sub-elements located at the second sector (dependent), as shown in Figure
5.6.1. This finding stated that these five sub-elements will have a major driven
power to achieve the goals for minimization of tourism leakage from
accommodation sector in Bali. Therefore, focus should be given to these five sub-
elements.

219
Table 5.6.2
Reachability Matrix of Program Goals for Minimization of Tourism Leakage
No. E1 E2 E3 E4 E5 E6 E7 E8 E9 E10 DP E1 1 0 0 1 1 1 0 0 0 1 5
E2 1 1 1 1 1 1 1 1 1 1 10
E3 1 1 1 1 1 1 1 1 1 1 10
E4 1 0 0 1 1 1 0 0 0 1 5
E5 1 0 0 1 1 1 0 0 0 1 5
E6 1 0 0 1 1 1 0 0 0 1 5
E7 1 1 1 1 1 1 1 1 1 1 10
E8 1 1 1 1 1 1 1 1 1 1 10
E9 1 1 1 1 1 1 1 1 1 1 10
E10 1 0 0 1 1 1 0 0 0 1 5 D 10 5 5 10 10 10 5 5 5 10 Remarks:
DP : Driver Power D : Dependence E1 : To improve community welfare
E2 : To optimize the potential of local products E3 : To develop agriculture, livestock, fisheries and handicraft industry E4 : To increase regional income E5 : To increase job opportunity E6 : To conserve environment and to preserve culture
E7 : To empower community E8 : To reduce the use of imported products for tourists E9 : To increase export of local products E10: To achieve sustainable tourism
Furthermore, the structural hierarchy of all sub-elements of program goals
for minimization of tourism leakage is presented in Figure 5.6.1. Based on this
figure, the sub-element at the highest level will have strong influences to the
lower level sub-elements. In this case, sub-elements E2, E3, E7, E8 and E9 have
strong influences to sub-elements E1, E4, E5, E6 and E10.

220
Figure 5.6.1. Relationships between Driver Power and Dependence of Sub-elements
of Program Goals for Minimization of Tourism Leakage
LEVEL 1 E1 E4 E5 E6 E10
LEVEL 2 E2 E3 E7 E8 E9
Figure 5.6.2. Structural Hierarchy of Sub-elements of Program Goals for Minimization of Tourism Leakage
5.6.2 Program Needs for Minimization of Tourism Leakage
Element of program needs for minimization of tourism leakage from
accommodation sector in Bali consists of 10 sub-elements, namely:
1. Qualified human resources
2. Good management in agribusiness, livestock, fisheries and handicraft
industry
221
3. Participation of farmers, cattlemen, fishermen and craftsmen
4. Quality, quantity, continuity of local products
5. Substitute products
6. Good quality of seed, livestock and raw materials
7. Funding for investment
8. Business Partnership
9. Government’s role
10. Coordination between stakeholders
Analysis of the contextual relationships among the sub-elements of program needs
by using ISM method resulted in reachability matrix (RM) as shown in Table
5.6.3. Based on the RM in Table 5.6.3, the key sub-element of program needs for
minimization of tourism leakage is government’s role (E9). According to Driver
Power (DP) and Dependence (D), this sub-element is at the fourth sector
(independent), and other three sub-elements, namely: good quality of seed,
livestock and raw materials (E6); Quality, quantity, continuity of local products
(E4); and substitute products (E5) locate at the second sector (dependent), as
shown in Figure 5.6.3. However, there are 6 other sub-elements located at the
third sector (linkage), namely: Qualified human resources (E1); Good
management in agribusiness, livestock, fisheries and handicraft industry (E2);
Participation of farmers, cattlemen, fishermen and craftsmen (E3); Funding for
investment (E7); Business Partnership (E8); and Coordination between
stakeholders (E10).

222
Table 5.6.3
Reachability Matrix of Program Needs for Minimization of Tourism Leakage
No. E1 E2 E3 E4 E5 E6 E7 E8 E9 E10 DP E1 1 1 1 1 1 1 1 1 0 1 9
E2 1 1 1 1 1 1 1 1 0 1 9
E3 1 1 1 1 1 1 1 1 0 1 9
E4 0 0 0 1 1 0 0 0 0 0 2
E5 0 0 0 0 1 0 0 0 0 0 1
E6 0 0 0 1 1 1 0 0 0 0 3
E7 1 1 1 1 1 1 1 1 0 1 9
E8 1 1 1 1 1 1 1 1 0 1 9
E9 1 1 1 1 1 1 1 1 1 1 10
E10 1 1 1 1 1 1 1 1 0 1 9 D 7 7 7 9 10 8 7 7 1 7
Remarks:
DP : Driver PowerD : Dependence E1 : Qualified human resources E2 : Good management in agribusiness, livestock, fisheries and handicraft industry E3 : Participation of farmers, cattlemen, fishermen and craftsmen E4 : Quality, quantity, continuity of local products E5 : Substitute products E6 : Good quality of seed, livestock and raw materials E7 : Funding for investment E8 : Business Partnership
E9 : Government’s role E10: Coordination between stakeholders
This finding states that the sub-element of government’s role will have a
major driver power for program needs in order to minimize tourism leakage from
accommodation sector in Bali. Therefore, focus should be given to the
government’s role. Moreover, conscientious attentions should be given to the
linkage’s sub-elements (E1, E2, E3, E7, E8, and E10) because they have causal
relationships each other and the relationships tend to be unstable.

223
Figure 5.6.3. Relationships between Driver Power and Dependence of Sub-elements of Program Needs for Minimization of Tourism Leakage
Furthermore, the structural hierarchy of all sub-elements of program needs
for minimization of tourism leakage is presented in Figure 5.6.4. Based on this
figure, the sub-elements at the highest level have strong influences to the lower
level sub-elements. In this case, the sub-element E9 has strong influence to other
sub-elements E1, E2, E3, E4, E5, E6, E7, E8, and E10.
LEVEL 1 E5
LEVEL 2 E4
LEVEL 3 E6
LEVEL 4 E1 E2 E3 E7 E8 E10
LEVEL 5 E9 Figure 5.6.4. Structural Hierarchy of Sub-elements of Program Needs for
Minimization of Tourism Leakage

224
5.6.3 Affected sectors for Minimization of Tourism Leakage
Element of affected sectors for minimization of tourism leakage from
accommodation sector in Bali consists of 8 sub-elements, namely:
1. Local community
2. Community leader
3. Community organization
4. Tourism industry
5. Agricultural, animal husbandry, and fisheries industries
6. Handicraft industry
7. Local employees
8. Government
Analysis of the contextual relationships among the sub-elements of affected sector
by using ISM method resulted in reachability matrix (RM) as shown in Table
5.6.4. Based on the RM in Table 5.6.4, the key sub-elements of affected sectors
for minimization of tourism leakage are: (i) Community leader (E2); (ii)
Community organization (E3); and (iii) Government (E8). According to Driver
Power (DP) and Dependence (D), these three sub-elements are at the fourth sector
(independent), and other three sub-elements locate at the second sector
(dependent), namely: Agricultural, animal husbandry, and fisheries industries
(E5); Handicraft industry (E6); and Local employees (E7). However, other two
elements are in the third sector (linkage), namely Local community (E1) and

225
Tourism industry (E4). The relationships between Driver Power (DP) and
Dependence (D) of affected sectors are shown in Figure 5.6.5.
This finding states that these three sub-elements (E2, E3 and E8) will have
a major driven power to influence the affected sectors for minimization of tourism
leakage from accommodation sector in Bali. Therefore, focus should be given to
these three sub-elements, namely: Community leader, Community organization,
and Government. Moreover, a conscientious attention should be given to the
linkage’s sub-elements (Local community and Tourism industry) because they
have causal relationships and the relationships tend to be unstable.
Table 5.6.4
Reachability Matrix of Affected sectors for Minimization of Tourism Leakage
No. E1 E2 E3 E4 E5 E6 E7 E8 DP
E1 1 0 0 1 1 1 1 0 5
E2 1 1 1 1 1 1 1 1 8
E3 1 1 1 1 1 1 1 1 8
E4 0 0 0 1 1 1 1 0 4
E5 0 0 0 0 1 0 1 0 2
E6 0 0 0 0 1 1 1 0 3
E7 0 0 0 0 1 0 1 0 2
E8 1 1 1 1 1 1 1 1 8
D 4 3 3 5 8 6 8 3
Remarks:
DP : Driver Power D : Dependence E1 : Local community
E2 : Community leader E3 : Community organization E4 : Tourism industry E5 : Agricultural, animal husbandry, and fisheries industries E6 : Handicraft industry E7 : Local employees
E8 : Government

226
Figure 5.6.5. Relationships between Driver Power and Dependence of Sub-
elements of Affected Sectors for Minimization of Tourism Leakage
Furthermore, the structural hierarchy of all sub-elements of affected sector
for minimization of tourism leakage is presented in Figure 5.6.6. Based on this
figure, the sub-elements at the highest level have strong influences to the lower
level sub-elements. In this case, Community leader (E2), Community
organization (E3) and Government (E8) have strong influence to other sub-
elements, namely E1, E4, E6, E5 and E7.
LEVEL 1 E5 E7
LEVEL 2 E6
LEVEL 3 E4
LEVEL 4 E1
LEVEL 5 E2 E3 E8
Figure 5.6.6. Structural Hierarchy of Sub-elements of Affected Sectors for Minimization of Tourism Leakage
227
5.6.4 Program Constraints for Minimization of Tourism Leakage
Element of program constraints for minimization of tourism leakage from
accommodation sector in Bali consists of 9 sub-elements, namely:
1. Lack of capability and skill of local human resources
2. Lack of availability and quality of local products
3. Lack of capability of local management
4. Lack of local infrastructure
5. Lack of capital investment
6. Lack of information and communication technology
7. National Investment Policy
8. International Trade Policy
9. Foreign Currencies Fluctuation
Analysis of the contextual relationships among the sub-elements of program
constraints by using ISM method resulted in reachability matrix (RM) as shown in
Table 5.6.5. Based on the RM in Table 5.6.5, the key sub-elements of program
constraints for minimization of tourism leakage are: (i) International Trade Policy
(E8) and (ii) Foreign Currencies Fluctuation (E9). This finding shows that these
two sub-elements have a major driven power to the program constrains for
minimization of tourism leakage from accommodation sector in Bali. Therefore,
focus should be given to these two sub-elements.

228
Table 5.6.5
Reachability Matrix of Program Constraints for Minimization of Tourism Leakage
No. E1 E2 E3 E4 E5 E6 E7 E8 E9 DP
E1 1 1 1 1 1 1 0 0 0 6
E2 0 1 0 0 0 0 0 0 0 1
E3 0 1 1 0 0 0 0 0 0 2
E4 0 1 1 1 0 0 0 0 0 3
E5 1 1 1 1 1 1 0 0 0 6
E6 1 1 1 1 1 1 0 0 0 6
E7 1 1 1 1 1 1 1 0 0 7
E8 1 1 1 1 1 1 1 1 1 9
E9 1 1 1 1 1 1 1 1 1 9
D 6 9 8 7 6 6 3 2 2
Remarks:
DP : Driver Power D : Dependence E1 : Lack of capability and skill of local human resources E2 : Lack of availability and quality of local products E3 : Lack of capability of local management E4 : Lack of local infrastructure E5 : Lack of capital investment E6 : Lack of information and communication technology E7 : National Investment Policy
E8 : International Trade Policy E9 : Foreign Currencies Fluctuation
Furthermore, relationships between Driver Power (DP) and Dependence
(D) of program constraints are shown in Figure 5.6.7. According to this figure,
three sub-elements are at the fourth sector (independent), namely: (i) International
Trade Policy (E8); (ii) Foreign Currencies Fluctuation (E9); and (iii) National
Investment Policy, and other three sub-elements locate at the second sector
(dependent), namely: Lack of availability and quality of local products (E2); Lack
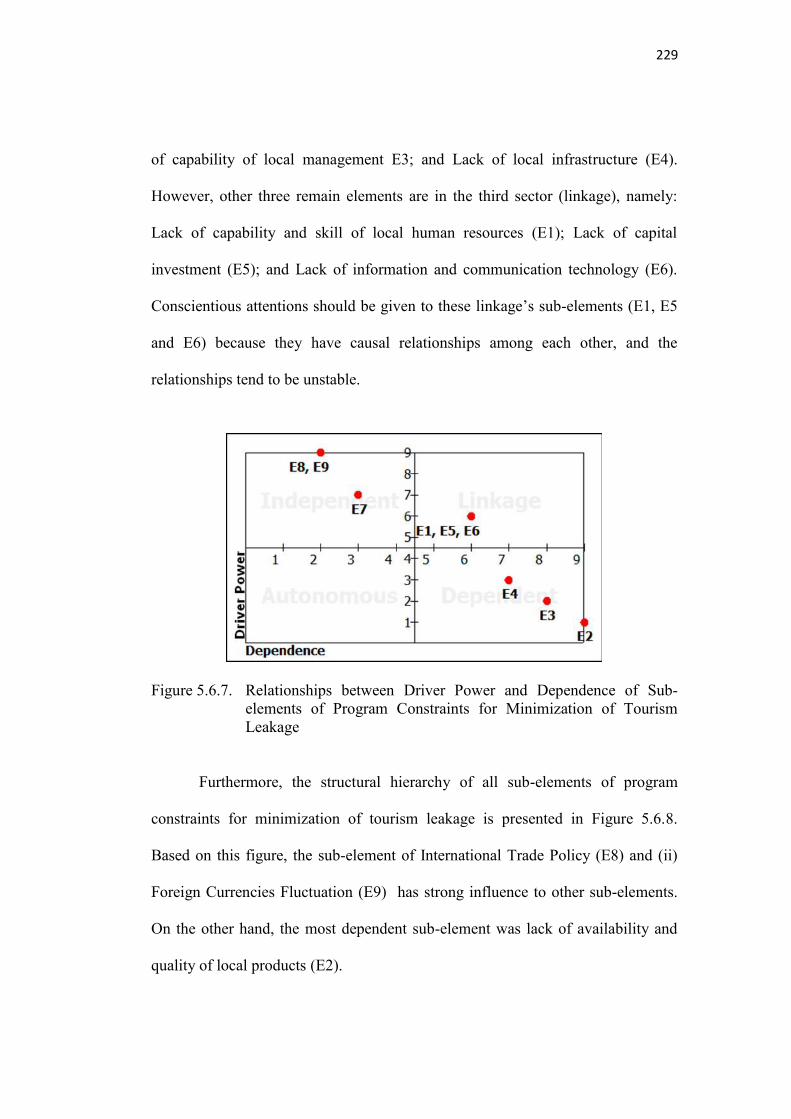
229
of capability of local management E3; and Lack of local infrastructure (E4).
However, other three remain elements are in the third sector (linkage), namely:
Lack of capability and skill of local human resources (E1); Lack of capital
investment (E5); and Lack of information and communication technology (E6).
Conscientious attentions should be given to these linkage’s sub-elements (E1, E5
and E6) because they have causal relationships among each other, and the
relationships tend to be unstable.
Figure 5.6.7. Relationships between Driver Power and Dependence of Sub-
elements of Program Constraints for Minimization of Tourism Leakage
Furthermore, the structural hierarchy of all sub-elements of program
constraints for minimization of tourism leakage is presented in Figure 5.6.8.
Based on this figure, the sub-element of International Trade Policy (E8) and (ii)
Foreign Currencies Fluctuation (E9) has strong influence to other sub-elements.
On the other hand, the most dependent sub-element was lack of availability and
quality of local products (E2).

230
LEVEL 1 E2
LEVEL 2 E3
LEVEL 3 E4
LEVEL 4 E1 E5 E6
LEVEL 5 E7
LEVEL 6 E8 E9
Figure 5.6.8. Structural Hierarchy of Sub-elements of Program Constraints for
Minimization of Tourism Leakage
5.6.5 Possible Changes in the Program for Minimization of Tourism Leakage
Element of possible changes for minimization of tourism leakage from
accommodation sector in Bali consists of 10 sub-elements, namely:
1. Decrease in import and increase in value-added
2. Increase and equalize income distribution
3. Change point of view of hotel managers on import oriented
4. Increase quantity, quality and continuity of local products
5. Development of capability of local human resource
6. Improve business management
7. Empowerment of agriculture, livestock, fisheries and craft industries
8. Policy on restriction of foreign investment
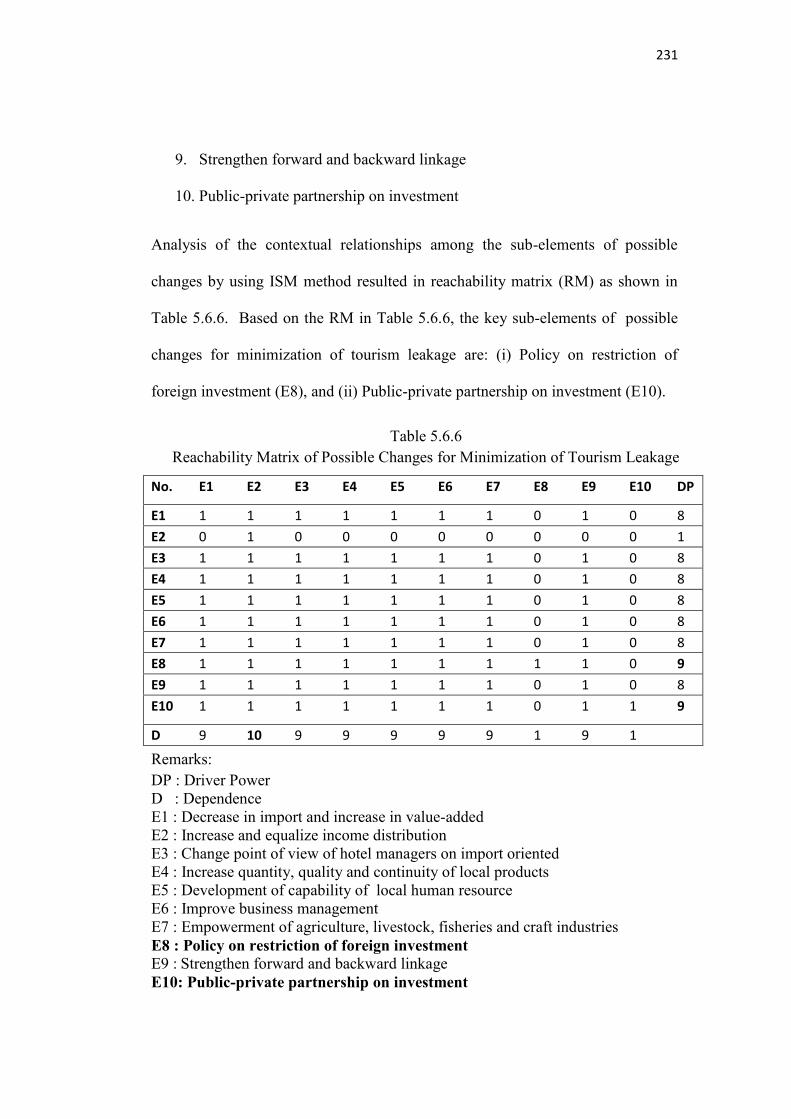
231
9. Strengthen forward and backward linkage
10. Public-private partnership on investment
Analysis of the contextual relationships among the sub-elements of possible
changes by using ISM method resulted in reachability matrix (RM) as shown in
Table 5.6.6. Based on the RM in Table 5.6.6, the key sub-elements of possible
changes for minimization of tourism leakage are: (i) Policy on restriction of
foreign investment (E8), and (ii) Public-private partnership on investment (E10).
Table 5.6.6
Reachability Matrix of Possible Changes for Minimization of Tourism Leakage
No. E1 E2 E3 E4 E5 E6 E7 E8 E9 E10 DP
E1 1 1 1 1 1 1 1 0 1 0 8 E2 0 1 0 0 0 0 0 0 0 0 1 E3 1 1 1 1 1 1 1 0 1 0 8 E4 1 1 1 1 1 1 1 0 1 0 8 E5 1 1 1 1 1 1 1 0 1 0 8 E6 1 1 1 1 1 1 1 0 1 0 8 E7 1 1 1 1 1 1 1 0 1 0 8 E8 1 1 1 1 1 1 1 1 1 0 9 E9 1 1 1 1 1 1 1 0 1 0 8 E10 1 1 1 1 1 1 1 0 1 1 9
D 9 10 9 9 9 9 9 1 9 1
Remarks:
DP : Driver Power D : Dependence E1 : Decrease in import and increase in value-added E2 : Increase and equalize income distribution E3 : Change point of view of hotel managers on import oriented E4 : Increase quantity, quality and continuity of local products E5 : Development of capability of local human resource E6 : Improve business management E7 : Empowerment of agriculture, livestock, fisheries and craft industries
E8 : Policy on restriction of foreign investment E9 : Strengthen forward and backward linkage
E10: Public-private partnership on investment

232
Furthermore, relationships between Driver Power (DP) and Dependence
(D) of possible changes are shown in Figure 5.6.9. According to this figure, two
sub-elements (E8 and E10) are at the fourth sector (independent), and another
sub-element, namely Increase and equalize income distribution (E2) locates at the
second sector (dependent). Meanwhile, other seven elements are in the third
sector (linkage), namely E1, E3, E4, E5, E6, E7 and E9. This finding states that
two sub-elements, namely Policy on restriction of foreign investment, and Public-
private partnership on investment have a major driven power to support possible
changes for minimization of tourism leakage from accommodation sector in Bali.
Therefore, focus should be given to these two sub-elements (E8 and E10).
However, conscientious attentions should be given to these linkage’s sub-
elements (E1, E3, E4, E5, E6, E7 and E9) because they have causal relationships
among each other, and the relationships tend to be unstable.
Figure 5.6.9. Relationships between Driver Power and Dependence of Sub-elements of Possible Changes for Minimization of Tourism Leakage

233
Furthermore, the structural hierarchy of all sub-elements of possible
changes for minimization of tourism leakage is presented in Figure 5.6.10. Based
on this figure, the sub-elements at the highest level have strong influences to the
lower level sub-elements. In this case, policy on restriction of foreign investment
(E8), and public-private partnership on investment (E10) have strong influence to
other sub-elements. The most dependent sub-element of possible changes for
minimization of tourism leakage is increase and equalize income distribution
(E2).
LEVEL 1 E2
LEVEL 2 E1 E3 E4 E5 E6 E7
LEVEL 3 E8 E10
Figure 5.6.10. Structural Hierarchy of Sub-elements of Possible Changes for Minimization of Tourism Leakage
5.6.6 Involvement of Agencies in the Program for Minimization of Tourism Leakage
Element of involvement of agencies in the program for minimization of
tourism leakage from accommodation sector in Bali consisted of 10 sub-elements,
namely:
1. Government Tourism Office
2. Government Office of Trade and Industry
234
3. Government Office of Agriculture, Animal Husbandry and Fisheries
4. Government Office of Plantation and Forestry
5. Government Office of Manpower and Transmigration
6. The Ministry of Tourism & Creative Economics, and Ministry of Foreign
Affairs
7. The Ministry of Finance
8. Regional and City Government
9. Association of tourism organizations
10. Research Centres and NGOs
Analysis of the contextual relationships among the sub-elements of involvement
of agencies by using ISM method resulted in reachability matrix (RM) as shown
in Table 5.6.7. Based on the RM in Table 5.6.7, the key sub-element of
involvement of agencies in the program for minimization of tourism leakage was
the Ministry of Foreign Affair. This finding stated that this sub-element has a
major driven power to the involvement of agencies for minimization of tourism
leakage from accommodation sector in Bali. Therefore, focus should be given to
the sub-element of the Ministry of Tourism & Creative Economics, and Ministry
of Foreign Affairs.
Furthermore, relationships between Driver Power (DP) and Dependence
(D) of the involvement of agencies are shown in Figure 5.6.11. According to this
figure, two sub-elements were at the fourth sector (independent), namely: the
Ministry of Tourism & Creative Economics, and Ministry of Foreign Affairs (E6),
and The Ministry of Finance (E7). The other remain eight elements were in the

235
third sector (linkage), namely E1, E2, E3, E4, E5, E8, E9 and E10. Conscientious
attentions should be given to these linkage’s sub-elements (E1, E2, E3, E4, E5,
E8, E9 and E10) because they have causal relationships among each other, and the
relationships tend to be unstable.
Table 5.6.7
Reachability Matrix of Involvement of Agencies in the Minimization Strategy of Tourism Leakage
No. E1 E2 E3 E4 E5 E6 E7 E8 E9 E10 DP E1 1 1 1 1 1 0 0 1 1 1 8
E2 1 1 1 1 1 0 0 1 1 1 8
E3 1 1 1 1 1 0 0 1 1 1 8
E4 1 1 1 1 1 0 0 1 1 1 8
E5 1 1 1 1 1 0 0 1 1 1 8
E6 1 1 1 1 1 1 1 1 1 1 10
E7 1 1 1 1 1 0 1 1 1 1 9
E8 1 1 1 1 1 0 0 1 1 1 8
E9 1 1 1 1 1 0 0 1 1 1 8
E10 1 1 1 1 1 0 0 1 1 1 8 D 10 10 10 10 10 1 2 10 10 10
Remarks:
DP : Driver Power D : Dependence E1 : Government Tourism Office E2 : Government Office of Trade and Industry E3 : Government Office of Agriculture, Animal Husbandry and Fisheries E4 : Government Office of Plantation and Forestry E5 : Government Office of Manpower and Transmigration
E6 : The Ministry of Tourism, and Ministry of Foreign Affairs E7 : The Ministry of Finance E8 : Regional and City Government E9 : Association of tourism organizations E10: Research Centres and NGOs

236
Furthermore, structural hierarchy of all sub-elements of the involvement
of agencies in the program for minimization of tourism leakage is presented in
Figure 5.6.12. Based on this figure, the sub-element at the highest level has
strong influences to the lower level of sub-elements. In this case, the sub-element
of the Ministry of Tourism and Ministry of Foreign Affairs (E6) influenced all
other sub-elements (E1, E2, E3, E4, E5, E7, E8, E9 and E10).
Figure 5.6.11. Relationships between Driver Power and Dependence of Sub-
elements of Involvement of Agencies in the Minimization Strategy of Tourism Leakage
LEVEL 1 E1 E2 E3 E4 E5 E8 E9 E10
LEVEL 2 E7
LEVEL 3 E6
Figure 5.6.12. Structural Hierarchy of Sub-elements of Involvement of Agencies
in the Minimization Strategy of Tourism Leakage
237
CHAPTER VI
DISCUSSION
6.1 Introduction
This chapter aims to discuss all results of this study. Firstly, results of
micro and macro analyses of tourism leakage in different types of
accommodations in Bali are discussed in Sub-Chapter 6.2. Causes of slightly
different results from the micro and macro analyses are explained based on
different approaches used. In the Sub-Chapter 6.3, discussion is focused on
simulation by using scenarios involving government intervention by giving
subsidies and efforts of accommodation sector on import reduction. Impacts of
both interventions can be seen on tourism leakage, job opportunity and income
distribution.
Furthermore, analysis on perception and preference of foreign tourists on
imported and local products is discussed in Sub-Chapter 6.4. Relationships
between variables in affecting foreign tourists‟ satisfaction, perception on quality
of products and services as well as the willingness of spending money for
Balinese people in priority are also discussed in this sub-chapter.
In the following sub-chapter, discussions on points of view of hotel
managers regarding imported and local products used in the hotel are presented.
In the last sub-chapter, strategy in minimizing tourism leakage is discussed based
on the results of Interpretative Structural Modeling (ISM). This chapter will be
closed by a simple conclusion.
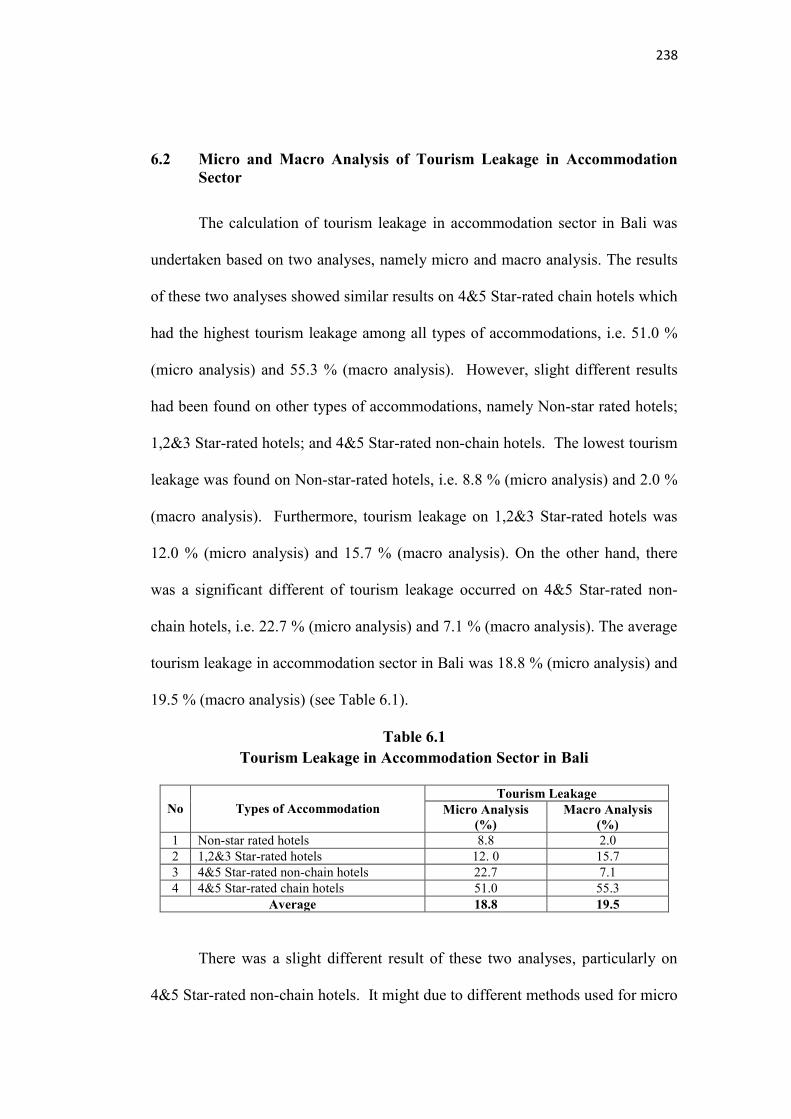
238
6.2 Micro and Macro Analysis of Tourism Leakage in Accommodation Sector
The calculation of tourism leakage in accommodation sector in Bali was
undertaken based on two analyses, namely micro and macro analysis. The results
of these two analyses showed similar results on 4&5 Star-rated chain hotels which
had the highest tourism leakage among all types of accommodations, i.e. 51.0 %
(micro analysis) and 55.3 % (macro analysis). However, slight different results
had been found on other types of accommodations, namely Non-star rated hotels;
1,2&3 Star-rated hotels; and 4&5 Star-rated non-chain hotels. The lowest tourism
leakage was found on Non-star-rated hotels, i.e. 8.8 % (micro analysis) and 2.0 %
(macro analysis). Furthermore, tourism leakage on 1,2&3 Star-rated hotels was
12.0 % (micro analysis) and 15.7 % (macro analysis). On the other hand, there
was a significant different of tourism leakage occurred on 4&5 Star-rated non-
chain hotels, i.e. 22.7 % (micro analysis) and 7.1 % (macro analysis). The average
tourism leakage in accommodation sector in Bali was 18.8 % (micro analysis) and
19.5 % (macro analysis) (see Table 6.1).
Table 6.1 Tourism Leakage in Accommodation Sector in Bali
No
Types of Accommodation
Tourism Leakage Micro Analysis
(%) Macro Analysis
(%) 1 Non-star rated hotels 8.8 2.0
2 1,2&3 Star-rated hotels 12. 0 15.7
3 4&5 Star-rated non-chain hotels 22.7 7.1
4 4&5 Star-rated chain hotels 51.0 55.3
Average 18.8 19.5
There was a slight different result of these two analyses, particularly on
4&5 Star-rated non-chain hotels. It might due to different methods used for micro

239
and macro analysis. The micro analysis of tourism leakage was undertaken based
on a simple arithmetic model following Unluonen, et. al. (2011). Data was
collected through a survey research which was undertaken in 79 sampling hotels
at four main tourism destinations in Bali, namely Kuta, Nusa Dua, Sanur and
Ubud. Meanwhile, macro analysis was undertaken by using Social Accounting
Matrix (SAM) of Bali‟s economy following a model developed by Thorbecke
(1988). Macro analysis was based on statistical data of Bali Province and other
data sources in order to develop SAM of Hotel in Bali (SAM Hotel). SAM Hotel
expresses a tourism account of Bali which describes circular flows of Bali tourism
(see Appendix 4.3). This SAM Hotel was developed from SAM Bali 2010 and
other related data.
Furthermore, the reasons of a slight different result from these two
analyses were as follow:
(1) Macro analysis by using SAM Hotel included transactions between sectors in
detail. These transactions included transactions between factors of production,
production sectors, institutions, commodities, capital account and indirect
taxes, as well as transactions between domestic and foreign activities
including imported of capital goods, raw materials as well as the use of
foreign employments. According to Thorbecke (1988), transactions between
domestic and foreign activities are recorded in the Rest of the World (ROW)
accounts. Some of these transactions were not calculated in the micro analysis.
By using SAM for macro analysis, it means that the analysis was
comprehensive, disaggregated, consistent and using complete data system that
240
captures the interdependence that exists within a socioeconomic system
(Thorbecke, 2000). This argument also supported by Hara (2008) who said
that SAM shows how the money flows in the economy/society involving three
important entities, namely production factors, production sector and
institution. So that, by using SAM approach, transaction between production
factors, production sector and institution related to four types of
accommodations give more detail results.
(2) Number of sampling hotels was also another cause of different result. Data
collection of the micro analysis on this study was based upon the Probability
Purposive to Size sampling (PPS) according to Kish (1965). However, SAM
Hotel used in the macro analysis was developed based on the population of the
tourism accommodations available in Bali.
(3) Tourism leakage on 1,2&3 Star-rated hotels and 4&5 Star-rated non-chain
hotels. Based on the macro analysis, tourism leakage on 1,2&3 Star-rated
hotels (15.7%) was higher than tourism leakage on 4&5 Star-rated non-chain
hotels (7.1%). Meanwhile, the micro analysis showed different results, i.e.
tourism leakage on 1,2&3 Star-rated hotels (12.0 %) was lower than tourism
leakage on 4&5 Star-rated non-chain hotels (22.7 %). According to the macro
analysis, the percentage of payments of non labour that was transferred to
other regions of Indonesia and to other countries on 1,2&3 Star-rated hotels
was higher than those of 4&5 Star-rated non-chain hotels. These results
indicated that payments of non labour to overseas on 1,2&3 Star-rated hotels

241
(15.5 %) was higher than those on 4&5 Star rated non-chain hotels (5.5 %)
(refer to Table 5.2.9 in Chapter 5).
Assessment of the tourism leakage based on the micro and macro analysis
are really important. Micro analysis supports the macro analysis basically on
collecting data and information from all type of accommodations. However,
macro analysis give more accurate results because this analysis demonstrate
transactions between sectors in detail which representing transaction within Bali
province, including transactions between factors of production, production
sectors, institutions, commodities, capital account and indirect taxes, as well as
transactions between domestic and foreign activities including imported of capital
goods, raw materials as well as the use of foreign employees. Meanwhile, the
micro analysis is only focused on the calculation of tourism leakage within the
tourism industry itself based on the use of imported products, including imported
foods, beverages, fruit and vegetables and good, utensils, equipment and material
used in the operational hotels in the operational of the accommodation.
Meanwhile, source of services are the use of foreign employees in operational
hotels, marketing and staf training, online fees, booking fees, management fees
and profit transfer.
Based on the results of both analyses as shown in Table 6.1, the highest
percentage of leakage either macro or micro analyses was on 4&5 Star-rated chain
hotels. The sources of tourism leakage on 4&5 Star-rated chain hotels based on
macro analysis as shown in Table 5.2.9 (see Chapter 5) were income from
production factors which was transferred to overseas and payments of non labour

242
to overseas. The highest leakage was payments of non labour to overseas
(30.80%). This included import of goods and services. It was followed by income
from production factors that were transferred to overseas, i.e. payment for capital
ownership (23.08%), and payment for labour (1.43%).
Moreover, the main sources of tourism leakage on 4&5 Star-rated chain
hotels based on micro analysis as shown in Table 5.1.10 (see Chapter 5) were
imported beverages (64.1% of total leakage) and foods (20.5% of total leakage).
The results of micro analysis gave more explanations to the results of macro
analysis which was saying the highest leakage was payment of non labour to
overseas (30.80%) which included import of goods and services. The import
goods were mostly beverages and foods.
These results show that accommodation that is managed by international
chain systems and/or owned by foreigners had higher leakage than other types of
accommodation. The more leakage, therefore the less revenue from tourism is
received by the host country and community. In another word, more revenue
from tourism goes to outside the destination region or country.
Tourism leakage impacts on multiplier effect. Archer and Fletcher (1996)
said that an increasing in the amount of leakage in any tourist-based economy in a
country or region, therefore its multiplier effect decreases. Furthermore, Var and
Quayson (1985) stated that the magnitude of tourism multiplier coefficient
depends on tourist spending, the economic base of a region/country and its
economic relations. When a destination region/country is self-sufficient in capital,
production and services, so that it has a greater multiplier coefficient. Moreover,
243
when there is an extended economic base in a destination region/country,
therefore the multiplier effect will be greater due to less import and greater value
added.
Regarding the percentage of tourism leakage from other countries, it was
reported by UNEP (2010) that tourism leakage of Thailand was 70% and India
was 40% in 2000. According to report by UN-Economic Commission for Latin
and the Caribbean (2010), tourism leakage of Caribbean was estimated about
80%, Mauritius was 90%, Seychelles was 60%, Saint Lucia was 44.8%, and
Jamaica was 40% in 1991. Hemmati and Koehler (2000) revealed that leakage
was ranging between 40% to 60% of total tourism earnings for many small island
destinations. However, it has not been found how much the percentage of leakage
can be tolerant. In this study, the percentage of leakage was calculated only based
on leakage that was occurred in accommodation sector. So that, a further research
needs to be undertaken in order to obtain the percentage of leakage from total
tourism revenue in Bali.
6.3 Impact of Government Subsidies and Import Reduction by Accommodation Sector on Tourism Leakage, Job Opportunity and Income Distribution
Government could play an important role in reducing leakage through a
policy of subsidy intervention. In addition, tourism industry could also take an
important role in reducing leakage through minimizing the use of imported
products and services, as well as the utilization of foreign employees. Based on
the simulations that were outlined in Chapter 5, the optimum result in minimizing
tourism leakage, increasing job opportunity and income distribution could be
244
achieved by a scenario involving variables of government subsidy and import
reduction. This scenario was called Simulation-5 in this study, i.e. government
gave subsidies 40% to Non-star rated hotels, and 18.5% to 1,2&3 Star-rated
hotels, but no subsidy was given to either 4&5 Star-rated non-chain hotels or 4&5
Star-rated chain hotels. At the same time, accommodation sector reduced the use
of imported products and services by 25% on Non-star rated hotels and 30% on
4&5 Star-rated chain hotels. The results show that tourism leakage decreases by
11.96% from 19.49% to 7.53%, and new job opportunity increases by 15 peoples
(refer to Table 5.3.10 and Table 5.3.11 in Chapter 5). In addition, this simulation
results in increasing of income distribution on lower classes in urban areas by
0.26%. Antara (1999) supported the fact that there were linkages between
government intervention, tourism sector and production sector in Bali. He found
that increasing in government expenditure together with increasing in tourist‟s
expenditure encouraged economic growth in Bali.
The results of simulation also show that it was important to minimize the
tourism leakage through reduction of imported goods and services, as well as
minimization of utilization of foreign labours by accommodation sector. As stated
by Mill and Morrison (2009), any money spent on import leaks out of the
destination‟s economy. Regarding the importance of reducing import in order to
reach optimum results in minimizing leakage, the results show that imports need
to be minimized. However, the minimum limit of import needs to be considered
carefully, as shown by the scenario of Simulation-6 (refer to Table 5.3.12). In
fact, regarding the results of Simulation-6, it can be seen that putting import in a

245
certain condition results in a decreasing job opportunity of 43 persons (refer to
Table 5.3.14). This indicates that import could not be minimized to the lowest
amount, because import plays an important role in generating national income and
trade balance between countries.
Export and import transactions are important economic activities for every
country. According to Zhang (2004), cross-country differences in export and
import affect the real per capita income levels, which mean that export and import
are highly correlated across countries to national income. However, efforts need
to be undertaken to keep international account in trade balance condition. Adam
Smith and David Ricardo (Hollander, 1911; Ruffin, 2002; Sukirno, 2010) argued
that development in international trade results in improvement of prosperous
nations through imports as well as exports. Based on the Most of Favour Nation
Principle of World Trade Organization (WTO), each country has right to be
treated similarly among countries‟ members. This principle means that each
country must improve their capability in producing products and services. Trade
between countries is getting more useful if each country has their own
comparative advantages.
Tourism is one of international trade in services which has been used in
some countries to be one of their products in international trade as source of
increasing national income. Bali has comparative advantages on uniqueness of
culture, and people, as well as on attractiveness of beaches and scenery. Tourism
in Bali has become an important service sector in order to increase national
income as well as to improve community‟s standard of living and prosperity.
246
6.4 Perception and Preference of Foreign Tourists on Imported and Local Products
Based upon 10 types of product considered in this study (refer to Table
5.4.8 in Chapter 5), foreign tourists perceived that quality of local products was
higher than imported products, in which the average score of local products was
5.59 out of 7 Likert‟s scale (categorized very good) but imported products was
5.24 (categorized good). Among all local products, some products had higher
score than the average score, namely building style, room decoration, architecture,
fisheries products, and fruits. It means that local building style, room decoration,
architecture, fisheries products, and fruits were considered better than imported
products. However, imported meat, dairy products and beverages had higher
scores than the average score. It means that imported meat, dairy products and
beverages were considered better than local products.
Regarding preferences of foreign tourists between imported and local
products, the results showed that most of foreign tourists preferred local products
(refer to Figure 5.4.11 in Chapter 5), except for meats, dairy products and
beverages. On the other hand, based upon the relationships between perceived
quality of local products and preference of foreign tourists, the statistical results
show that the preference of foreign tourists have significant positive relationships
to all local products (refer to Table 5.4.9 in Chapter 5). This finding demonstrates
that foreign tourists significantly looked for local products which are available in
Bali.
However, inconsistent result was found on one of the products, namely
“meat”. Based on the percentage of foreign tourists who preferred local meat, the

247
result shows that 73.81% of them preferred local meat. This means that 73.81%
out of 600 respondents preferred local meat and 26.19% of them preferred
imported meat (refer to Figure 5.4.11 in Chapter 5). In fact, the results show that
perception of foreign tourists on local meat based on Likert evaluation was lower
than imported meat. The Likert‟s score of perception on local meat was 5.32
(categorized very good) and the score of imported meat was 6.24 (categorized
extremely good) (refer to Table 5.4.8 in Chapter 5). This finding means that even
though most of foreign tourists preferred local meat, however their perception on
local meat was lower than imported meat.
Inconsistent in decision making process was happened in respondents‟
mind. It might due to a reason, as follow. There was unclear question in the
questionnaire regarding the word “meat”, because the word “meat” could be either
beef, chicken, pork, lamb or other meat products. However, a survey was
undertaken by researcher on the flight from Denpasar to Paris by interviewing six
foreign tourists who just completed their vacations in Bali. It was found that all of
them gave really clear explanation on their consuming behaviour on meat in Bali.
They only felt unsatisfied on consuming local beef and local lamb, but they had
not have any problem on consuming local chicken, local pork or local duck during
their stay in Bali. Regarding this ambiguous questions on meat, further research
needs to be undertaken clearly in this part by classified meat in a more detail, such
as mentioning beef, chicken, pork, lamb, duck, or other meat products in the
questionnaire.

248
6.5 Relationships Between Variables
6.5.1 Relationships between Variables of Familiarity and Variables of Satisfaction
The relationships between the variables of familiarity and the variables of
satisfaction were also tested by using statistical analysis (see Figure 6.1). The
results show that there were very significant relationships between some variables
of familiarity and all variables of satisfaction (p-value ≤ 0.0001***), as shown in
Figure 5.4.12 in Chapter 5. These very significant relationships were found
between variable code of country of residence and all variables of satisfaction
(satisfaction with the services of accommodation, the services of restaurants, the
whole trips, the level of emotion during visiting Bali, and the level of
expectation). In addition to that, there are almost similar relationships between
variable large code of residence and all variables of satisfaction, as shown in
Figure 5.4.12 in Chapter 5. These findings state that there are strong relationships
between the places of residence of foreign tourists who visited Bali and the level
of their satisfactions.
Furthermore, there was also a very significant relationships between the
variable more than five times visit of familiarity and the variable level of
expectation of satisfaction (refer to Figure 5.4.12 in Chapter 5). This finding
indicates that foreign tourists who have visited Bali more than five times were
already familiar with the situation in Bali, therefore they satisfied with their
expectation. However, variable periodicity to visit of familiarity had no
significant relationship with all variables of satisfaction.

249
Regarding the variables of Familiarity (F) and Motivation (M), only
variable F1 (Code of country of residence) had a significant relationship with
variable M1 (Visit friends and relatives/VFR). Motivations can be intrinsic (push)
or extrinsic (pull). Push motivations correspond to a tourist‟s desire and emotional
frame of mind. Pull motivations represent the attributes of the destination to be
visited. Visit friend and relatives (VFR) was the main reason for coming to Bali,
and only variable F1 (Code of country of residence) had significant relationship
with variable motivation (M). According to Yoon and Uysal (2005), socio-
demographic variables to be a mediator variable between motivations (either pull
or push motivation) and destination loyalty. In case of Bali, desire to do travelling
was pushed by the reason on visiting friends and relatives as one of the effects of
socio-demographic variables. Being familiar of a destination (Bali) as they have
friend and relatives to be visited was the main reason to do travelling to Bali.
Similar results have been found between relationship between familiarity and
satisfaction, and between familiarity and motivation. These results support the
study by Bashar (2010) who reveals that familiarity influence satisfaction on
travelling especially on spatial proximity which describes proximity to an area.
Proximity or feeling closeness influence feeling of being motivated to visit friends
and relatives to a destination.

250
6.5.2 Relationships of Some Variables with Variable Benefit for Balinese People
Regarding the idea of tourist expenditures spent mostly for Balinese, four
variables affecting the willingness of foreign tourists to spend their money for
Balinese people in priority were tested by using statistical analysis. These
variables were namely: satisfaction, familiarity, motivation and perception on the
quality of products and services of Bali tourism. The results show that all
variables affect the variable benefit for Balinese, as shown in Figure 6.1.
Figure 6.1. Relationships between Variables
The results of analysis of relationships between variables in detail are
outlined as follow:
251
A significant relationship was found between the variable periodicity to
visit Bali and the variable benefit for Balinese (refer to Table 5.4.10 in Chapter 5).
This finding indicates that the more often visiting Bali, the higher the willingness
to contribute to Balinese people.
Positive correlations were found between all variables of satisfaction
(satisfaction on services of accommodation, on services of restaurant, on the
whole trips, level of emotion during visiting Bali, and level of expectation) and
the variable benefit for Balinese people (refer to Figure 5.4.14 in Chapter 5). The
results indicate that the higher the satisfaction of foreign tourists in visiting Bali,
the higher benefit for Balinese people. However, these relationships were
relatively weak (coefficient of correlations = 0.17 - 0.32).
Positive correlation was found between the variable visit friend and
relative (VFR) of motivation and the variable benefit for Balinese, although the
relationship was very weak (coefficient of correlation = 0.07). This result
indicates that the more foreign tourists visiting friend and relative in Bali, the
higher benefit for Balinese people.
Positive correlations were found between variables of perception on
quality of services and the variable benefit for Balinese (refer to Figure 5.4.14 in
Chapter 5). The correlations between two variables of perception on quality of
services and the variable benefit for Balinese were ranging from 0.18 to 0.20. The
similar results were found between variables of perception on quality of local
products and the variable benefit for Balinese (refer to Table 5.4.13 in Chapter 5).
The correlations between all variables of perception on quality of local products
252
and the variable benefit for Balinese were ranging from 0.01 to 0.8. There were
several perceptions on the quality of local products that had relatively strong
correlations with benefit for Balinese, namely local furniture (r = 0.8), local
vegetables (r = 0.7), and local building style (r = 0.5). These results indicate that
the higher the perception on quality of local products and services, the higher
benefits for Balinese people. This finding supports the study by Goodrich (1978),
Solomon (1999), and Andriotis (2005) who found that tourist behavior in
choosing a destination has a significant relationship to the perception of tourists
on a destination.
Based on the statistical results, it can be concluded that most of tourists
who visit Bali are willing to spend their money to the local people and to be a
part of the system of Bali tourism in term of maintaining sustainable tourism in
Bali. Most of tourists are also willing to spend their money and would love to
stay in the village and prefer authencticity of the local products. The other
concern of foreign tourists are staying in the locally decorated Balinese style and
are willing to give more money to be used as the assurance of environmental
protection to minimize negative impacts of tourism development in Bali as long
as the mechanism of being involved is well organized. They would also love to
live with the harmonious interaction with local Balinese people and willing to
maintain cultural heritage of Bali as one of the famous attractive destination in
the world. Their opinion, expectation and expression of satisfaction of the whole
trip to Bali show that they found what they expected during their visit to Bali and
253
there is no doubt for them to be responsible for the long term development of
tourism in Bali.
Based on the above analysis between variables which support the
willingness of foreign tourists to spend their expenditure during their visit in Bali
for the benefits of Balinese people, strategy may be developed related to fulfill
tourists‟ needs in order to gain tourists‟ satisfaction during their visit in Bali.
Therefore, it hopes that foreign tourists keep re-visiting Bali, and Bali become one
of prime tourist destination in the world through word-of-mouth marketing
strategy by those foreign tourists and other marketing strategies.
Future emerging trends need to be focussed on the improvement of
quality of products and services of tourism in Bali in order to improve the level of
satisfaction of foreign tourist in visiting Bali. This could lead to an increase in
the willingness of foreign tourists to spend money for local Balinese. The role of
stakeholders of Bali tourism are very important through integrated coordination
in all aspects of tourism devlopment, so that development of tourism brings about
improvement of the life quality of Balinese. Community empowernment should
become the basis of tourism development in Bali, therefore tourism in Bali will
bring maximum benefits for local community.
6.6 Points of View of Hotel Managers and Willingness in Reducing Tourism Leakage
Tourism leakage could not be avoided because hotel managers have their
own points of view regarding the use of imported products. Most of hotel
managers from star-rated chain hotels said that in order to fulfill the chain hotel‟s
requirements, the products that are presented to guests should be high quality
254
products. They firmly stated that imported meat, dairy products and alcoholic
beverages have better quality than local products. They also firmly explained that
star-rated chain hotels need high quality of imported food, alcoholic beverages,
utensils and other equipment in order to fulfill the quality standard of chain hotels.
Managers of other types of hotels also had similar points of view regarding the
imported products. But, a slight different point of view was given by non-star
rated hotels, because non-star rated hotels used very little imported products.
Details on this matter are outlined in Sub-Chapter 5.5.2.
Different points of view from hotel managers were found regarding the
cause and impact of tourism leakage. Some hotel managers of star-rated hotels
understood that the use of imported products, services and foreign employees are
the causes of tourism leakage. They also realized that tourism leakage brought
about the loss of local economy because some portions of the revenue from
tourism go to outside of destination region or country. However, their mindset
had been in how to serve guests with high quality products. On the other hand,
some hotel managers did not care about tourism leakage caused by imported
products and services, as long as they got good quality products to serve the
guests. Moreover, most of hotel managers of Non-Star-rated hotels did not
understand about tourism leakage. In fact, they have already used mostly local
products, except imported wine and alcoholic beverages. Details on this matter
are outlined in Sub-Chapter 5.5.4.
Regarding point of views of hotel managers in reducing tourism leakage,
most of hotel managers are willing to reduce the use of imported products and
255
give the priority to local products as long as there are local products and/or
substitute for imported products that can fulfill the quality standard requirements.
However, recent situation in Bali showed that supply of most local foods did not
fulfill the quality standard requirement in terms of quality, quantity and continuity
of the products. Details on this matter are outlined in Sub-Chapter 5.5.5.
Although tourism leakage could not be avoided, however it could be
reduced or minimized. There is opportunity in reducing tourism leakage through
reducing the use of imported products because the survey results showed that
some local products that are usually presented for foreign tourists have significant
positive relationship with the foreign tourist preferences. Foreign tourists also
significantly looked for local of Balinese products. These local products were
namely fisheries products, fruits, vegetables, room decoration, furniture, building
style, and Balinese architecture.
The above survey results told us that the perception of most of hotel
managers on tourist‟s needs was different to foreign tourist‟s perception on the
local products. Regarding different perception between hotel managers and
foreign tourist who visited Bali, there is a need to encourage hotel managers to
change their perception and attitude in order to change their behavior, especially
for them who work in the Star-rated chain hotels. Perception and attitude
influence people‟s behavior (Chen and Liu, 1992; Chiliya and Lombard, 2009 and
Clemons, 2008). As stated by Lin, et. al. (2012) and Vinson, et. al. (2007)
perception as a psychological construct is associated with other constructs such as
attitude and emotion that will influence decision making process and behavior of

256
human being. Furthermore, the reasons for the tourism leakage in surrounding
tourism destinations are multifaceted. Some of the main reasons are the lack of
local ownership, local employment, and local capital, as well as inability to link
tourism to the local economy. Local ownership is crucial to be developed as the
owners of major tourism businesses. This will keep a majority of the profits in the
destination region. In addition, tourism leakage can be reduce by employing
more locals and buying more locally produced goods as well as creating strong
linkages to local industries (Chirenje, et. al., 2013; Kontogeorgopoulos,1998 and
Milne, 1987). Unfortunately, local entrepreneurs frequently lack of capital,
education and experience (Ashraful, et. al., 2012). As a result, foreign investors
will dominate the owner of large tourism firms, therefore profits are kept by the
outsiders who own the firms. Management and marketing may also be a major
problem for local ownership as local entrepreneurs typically do not have the
experience or education to market products to foreigners, and their ability to
educate themselves is often limited (Blake, et. al., 2008).
Local employment will also have a strong effect on reducing tourism
leakage as wages are generally not leaked (Hemmati and Koehler 2000).
However, local residents are often not ideally suited for the jobs as they lack of
proper education, experiences and language skills. Therefore, large chain firms
frequently import more skilled labour from urban areas to fill these positions
Goodwin (2008); Hemmati and Koehler 2000; Mbiawa 2005). Many studies
found that the majority of locals worked as unskilled labour and earned fewer
257
wage, while expatriates were employed in management positions and earned very
high wages (Kontogeorgopoulos,1998).
Tourist destinations that do not promote high multipliers and high level of
linkages will not produce substantial economic development. So that, linkages
between tourism industry and local economy are very important which lead to
increase the multiplier effect (Hampton, 1998; Scheyvens and Russel, 2012;
Smith, et. al., 1992). It is crucial to increase the amount of locally produced
goods which can increase multiplier effect. To maximize the economic impact of
tourism, it is suggested that region should attempt to increase the amount of
connections between tourism and local businesses rather than depend on imported
goods and services (UNWTO, 2010).
Bagus Sudibya as one of the stakeholders in tourism industry in Bali
supported the finding of this research. He revealed that synergy between tourism
and agriculture is crucially needed to keep tourism in Bali sustained. He said that:
“ ... Tourism and agriculture cannot be separated. It relates each other. Tourism
without agriculture will be paralyzed, whereas agriculture without tourism will
die ..” (Personal Communication, 12th May 2013)
Another professional in tourism industry, Made Suryawan said that:
“ ... Integrated communication and coordination between government, industry
and communities are urgently needed. They must understand in depth about
leakage, must see that we can get more income by reducing leakage ...” He also said that there is a crucial need to improve the quality of human resources
through better education. He also emphasized that hotel association need to
improve the Human Resource Development (HRD) division at each hotel by
working together to enhance quality of human resources. Moreover, hoteliers and
258
government need to work together to create and improve the quality of tourism
products, especially food and beverage. This requires such improvement the
quality of agricultural products and livestock, as well as increasing the supply of
local wines and liquors. There is also a need to create substitute products for
imported products in order to fulfill tourist‟s demand. He firmly said that
government should support farmers to produce agricultural products that meet the
tourists‟ need (Personal Communication, 30th April 2013).
Government should play an important role in minimizing tourism leakage.
However, Head of Bali Government Tourism Office, Ida Bagus Kade Subhiksu,
said that there is no regulation regarding import restrictions of goods, such as
food, beverages, furniture and other items. Government of Bali Province has only
appealed to hoteliers to optimize the use of local products such as fruits and
vegetables. Problem has emerged, that the availability of tropical fruits cannot
fulfill the demand due to seasonal in nature. He said that:
“ ...We lose the opportunity to supply foods and beverages to tourists due
to inappropriate quality of the local products. Efforts have been done,
however, many things need to be addressed ...”.
Demand for local fruits has increased not only to fulfill demand for tourists, but
also for making offering by Balinese community. In other hand, there was
insufficient supply to fulfill the demand. So that, imported fruits cannot be
avoided. He realized that to minimize leakage, cooperation between government,
industry and farmer is crucially needed (Personal Communication, 4th April 2013).
Several efforts have been undertaken by government of Bali province to
protect and develop local products especially local fruits. Empowerment of local

259
products has been undertaken by Bali government through “Regulation of Bali
Government No. 3/2012 regarding Empowerment, Protection and Development of
Small-scale Industry”. Ketut Wija, one of Bali Government‟s official said that
this regulation requires involvement of tourism industry and other related industry
to give chance for local products to be promoted to and served for tourists. It was
realised that the quality of local products was lower than imported products. So
that, some efforts have been undertaken to improve the quantity, quality and
continuity of local products. He also revealed that local community should
participate in developing fruit farms in Bali that can produce fruits similar to
imported fruits (Bali Post, June 2013).
The tourism sector could also be enhanced through stronger linkages with
regional handicraft producers and artisans. Building synergies with such
producers could enable them to become significant suppliers of interior design
elements, such as handicrafts, paintings, and other furniture. This will be able to
reduce leakage significantly (Scheyvens and Russel, 2012 and Synman, 2012).
6.7 Strategy of Minimization of Tourism Leakage at Accommodation Sector
Strategy of minimization of tourism leakage at accommodation sector in
Bali is developed based upon the results of Interpretative Structural Modeling
(ISM) in Sub-Chapter 5.6. There are six groups of strategy is proposed according
to six elements of minimization program for tourism leakage in accommodation
sector that were used in this ISM, namely: (i) program goals, (ii) program needs,
(iii) affected sectors, (iv) program constraints, (v) possible changes in the

260
program, and (vi) involvement of agencies in the policy. Each above element
consisted of some sub-elements. Those sub-elements in every element were
assessed by ISM. Based on the results of this ISM, several sub-elements were
considered as sub-key elements for each element. These sub-key elements are
elaborated further and written as strategy. The proposed strategies are as follow:
(1) Strategy related to program goals
(i) To optimize the potential of local products.
(ii) To develop agriculture, livestock, fisheries and handicraft industry.
(iii) To empower community.
(iv) To reduce the use of imported products for tourists.
(v) To increase export of local products.
(2) Strategy related to program needs
(vi) To improve government‟s role in every strategy related to minimize
tourism leakage.
(3) Strategy related to affected sectors
(vii) To involve community leaders in community empowerment.
(viii) To empower community organization in developing agriculture,
livestock, fisheries and handicraft industry.
(ix) To urge government to develop and implement supporting policies in
order to minimize leakage.
(4) Strategy related to program constraints
(x) To establish International Trade Policy that gives priority to reduce
import and to increase export of local products.
(xi) To stabilize the foreign currencies fluctuation by Indonesian
Government.
(5) Strategy related to possible changes
261
(xii) To establish policy on restriction of foreign investment on
accommodation sector in Bali.
(xiii) To facilitate public-private partnership on investment in tourism.
(6) Strategy related to involvement of agencies
(xiv) To improve the role of the Ministry of Tourism and Creative Economy
and the Ministry of Foreign Affairs in promoting Bali tourism
worldwide and to encourage tourists to consume local products in
priority.
Model for minimization of tourism leakage on accommodation sector can be seen
in Figure 6.2.
As can be seen from the model for minimization of tourism leakage on
accommodation sector, leakage can be reduced through optimizing the use of
local products and reduction in using imported products and foreign employees.
In terms of institutional, suggested effort will be demostrated. The results of
ISM analysis suggest that the role of provincial and local government, community
organization, community leaders, and the central government such as The
Ministry of Tourism and Creative Economy and Ministry of Foreign Affairs as
well as are really important. Community leaders and community organization
have crucial role in encouraging the development of agriculture and handicraft
industries through empowerment of local community.
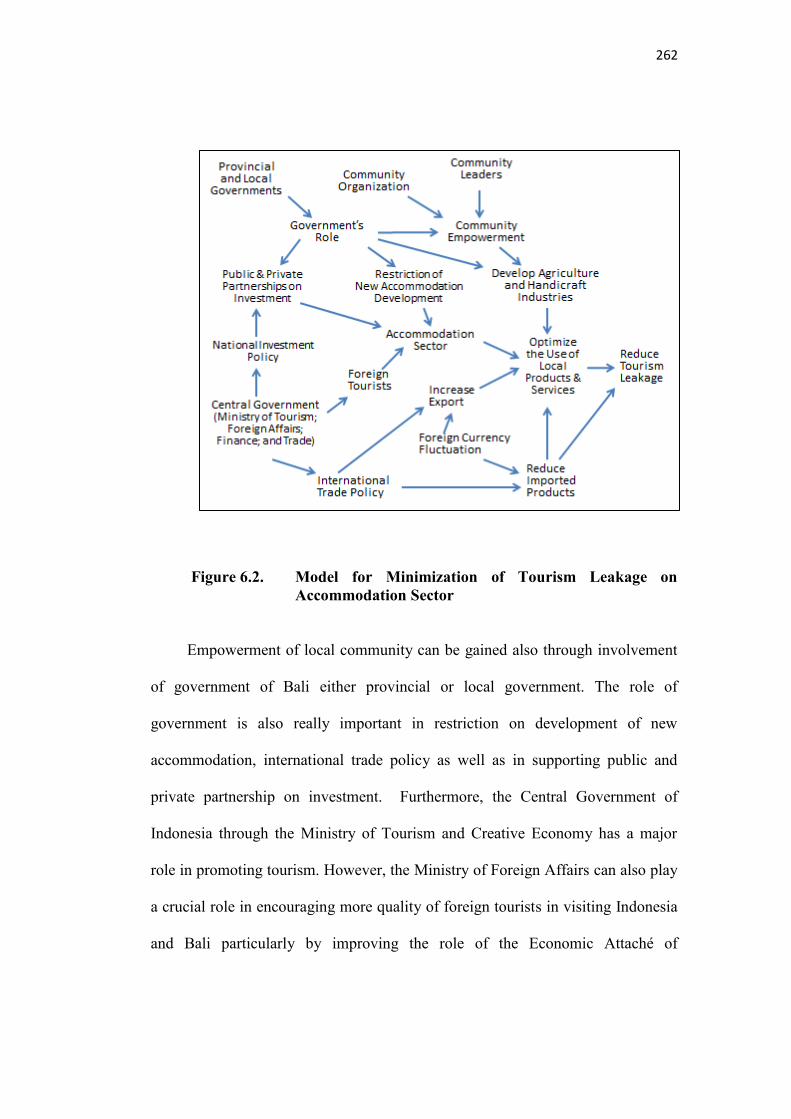
262
Figure 6.2. Model for Minimization of Tourism Leakage on Accommodation Sector
Empowerment of local community can be gained also through involvement
of government of Bali either provincial or local government. The role of
government is also really important in restriction on development of new
accommodation, international trade policy as well as in supporting public and
private partnership on investment. Furthermore, the Central Government of
Indonesia through the Ministry of Tourism and Creative Economy has a major
role in promoting tourism. However, the Ministry of Foreign Affairs can also play
a crucial role in encouraging more quality of foreign tourists in visiting Indonesia
and Bali particularly by improving the role of the Economic Attaché of
263
Indonesian Embassy at every country. This can minimize tourism promotion cost
overcome by the government of Indonesia.
Considering the results of this study that foreign tourists significantly
looked for local products, therefore the use of local products can be encouraged in
accommodation sector through hotel managers who in charge in the operational of
the accommodation. In this point, “push marketing strategy” is needed, which
mean that optimizing to offer local foods in the hotel‟s and restaurant‟s menu is
very important. According to Kotler and Lane (2006), push marketing strategy is
a marketing strategy which focused on using advertising and promotion to
persuade consumers to ask for the products. So that, as push marketing strategy
focuses on offering of local products, then hotel managers must put more local
menu made from fisheries products as Bali has abundant fresh fisheries products.
In addition, the results shows that the highest percentage of source of leakage was
imported beverages. This indicated that foreign tourists prefer imported
beverages. In this point, “pull marketing strategy” is crucial to be implemented
by offering substitute products. Kotler and Lane (2006) revealed that pull
marketing is a promotion strategy that which was built up based on consumer
demand. Regarding results of this study that foreign tourists looked for imported
beverages, so that, availability of substitute products are really important. In fact,
Bali has some beverage products which can be used as substitute products,
particularly wines and alcoholic drinks such as Hatten Wines, Indigo Wine, and
Balimoon which are locally produced in Bali. Other types of products need to be
developed in order to fulfill tourists´ need.
264
International trade policy regarding protection of local products is crucial.
Government needs to give subsidies to the local industries as well as to the
farmer, cattlemen, fisheries and craftsmen to improve competitiveness and quality
of local products. Subsidies are also needed in term of improvement of quality of
local employees through a better education and training. This policy is supported
by the last agreement of WTO (“Bali Package”) which allows all of WTO‟s
member to give subsidies (http://www.dw.de/wto-bali-agreement-expected-to-
boost-growth/ a-17278088). However, another agreement, such as reduction of
import tax may lead to a new problem for developing countries, because this
agreement gives a better chance to developed countries to export their products to
developing countries such as Indonesia, even though this agreement also gives a
similar chance to Indonesia to export the products to overseas. With the quality of
some products are still below the standard of international products, there is a
need to develop strategies regarding improving the quality of local products to be
able to compete with imported products. It is also crucial to improve quality of
local human resource in order to support a better local product quality. Central
government of Indonesia also needs to stabilize foreign currency fluctuation. This
can influence export performance and reduce imported products.
The results of this study also show that payment of foreign employees was
one of main sources of tourism leakage. As one of the member of World Trade
Organization (WTO) and the impact of globalization, Indonesia is obligated to
open the opportunity for foreign employees to work in Indonesia. To anticipate
the increasing number of foreign employees who intend to work in Indonesia, the
265
government of Indonesia should protect the local employees by having complete
regulations in managing foreign employees in Indonesia. The use of foreign
employees needs to be undertaken selectively through strict mechanism and
procedures, and by giving the priority for local employees. It is regulated based on
the regulation of Ministry of Labour Force, No. PER.02/MEN/III/2008 regarding
procedure for using foreign workers, and Presidential Decree No. 75/1995
regarding the use of foreign workers. Other regulation is the law of Republic of
Indonesia No. 13/2003 regarding the labour force. It is clearly mentioned in the
article 42 up to 49 in this law regarding the procedures of applying work, planning
related to the use of foreign workers as well as the period of using foreign
workers.
Other law regarding the use of foreign employees in Indonesia is the law
of Republic of Indonesia No. 10/2009 in the article 56 regarding foreign
employment. It says that “employers can hire foreign employees to work in
Indonesia as long as fulfil the rules required by the government of Indonesia”.
From this regulation, it is expected that the future workforce of Indonesia capable
to adopt the skills of foreign employees in order to empower the Indonesian
labour force optimally. This means that foreign employees should give training
regularly to the local employees in order to improve skill and knowledge of local
employees. So that, it gradually reduces the use of foreign employees in the
operational of accommodation in Bali. This efforts can also minimize the tourism
leakage.
266
Enormous challenges faced by the developing countries such as Indonesia
since the implementation of free trade area in which each country compete freely
in gaining success in the international market. Implementation of GATS (General
Agreement on Trade and Services) in the world trade means that competition is
explored in term of the quality of human resource. So that, it cannot be denied
that improvement of human resource is crucial in order to improve
competitiveness especially for country which is doing business in services, such
as tourism.
6.8 Marketing Strategy to Minimize Tourism Leakage in Bali
As can be seen from the model of minimization of tourism leakage in Bali,
leakage can be reduced by optimizing the use of local products and to reduce the
use of imported products and foreign employees. It is supported by the results of
statistical analysis of foreign tourists‟ preference in consuming local and imported
products, is that foreign tourists significantly look for local products. However, in
fact, the results also show that the local products are really weak in terms of
availability, quality and continuity to fulfill the demand of foreign tourists. To
overcome this gap, development of marketing mix is crucially needed as one of
the most critical challenging task for the stakeholder in Bali tourism.
To develop marketing strategy to minimize tourism leakage in Bali, seven Ps of
the marketing mix is accommodated which is the expansion of the marketing mix
of products developed by Kotler (1991) which consists of 4 (four) Ps namely
product, price, promotion and distribution. Three additional elements of Ps
proposed by Reid, et al. (2010) was added which consists of people, process and

267
physical evidence as the marketing mix of service and hospitality (Reid, et al.,
2010), see Figure 6.3.
Figure 6.3. Seven Ps of Marketing Mix in Services and Hospitality ( Modified from Reid, et al., 2010)
In the Figure 6.3, the first layer around the target market represents marketing
mix which are the variables controlled by the managers to formulate strategies in
a combined of marketing program. This program is the basis in which the firm‟s
products and services compete with other firms in the competitive environment.
The outside layer of the diagram represents external environments that influence
the marketing process which are consist of economic condition, trend in society,
competitive pressures, political and legal development as well as advanced in
technology will affect the performance of a product or service. Firm must
continually monitor the environments and make changes in their marketing
program (Kotler, 1991 and Reid, et al., 2010).
268
Regarding this research, the target of sustainable tourism in Bali is to
minimize tourism leakage of Bali in order to increase economic benefit of
tourism to the local Balinese. It is depicted in the centre of the diagram of 7 Ps in
Figure 6.3. To achieve this target, 7 Ps of marketing mix on service and
hospitality are generated namely product, price, place, promotion, people, process
and physical evidence.
1. Product
Product in tourism industry refers to unique combination of goods and
services offered by tourism industries to consumers which includes both tangible
and intangible elements of the services offering (Reid, et al., 2010). The tangible
elements include the tourist attractions, accommodations, restaurants,
transportation and shopping facilities. Meanwhile, the intangible element is the
image of the destination. The visitors‟ perception of competing destinations is
based on the number and quality of tangible attributes. The complexity of
destination marketing is that tourists usually select among destination based on
the total set of destination attributes. Therefore, the increasingly competitive
marketplace can create economies of scale for the destination. It is necessary to
determine the importance of these attributes when positioning the destination
using product development and marketing communications approach as a part of
marketing mix of services and hospitality.
Tourism Products Development to Minimize Tourism Leakage in Bali
According to Wiranatha (Personal Communication, 22th March 2015),
tourism involves four types of activities, namely:
269
a. Something to see (scenery, culture performances, heritage sites, etc.)
b. Something to do (tourists activities). A wide range of different activities for
tourists is being offered, such as an observation of wildlife, fauna and flora at
national parks, trekking, rafting, cycling, enjoy white sand at the beaches, jet
ski, surfing, diving, and snorkeling. Ecotourism trips could also be possible
which are mainly based on nature experience. Religious/spiritual, spa &
wellness are other attractive activities as Bali has been known as inspiring
island which serves natural healing, reduce stress and emotional cooling down.
Night life could also be gorgeous activities for young people. However,
challenges have been faced regarding the social impact for the local Balinese.
Night life is identical with consumption of alcoholic beverages. In fact, the
results show that alcoholic beverages were the highest source of tourism
leakage in Bali. Create, develop and increase varieties of local beverages are
urgently needed as substitute products to replace the imported beverages.
c. Something to buy (to buy local foods, local fruits and vegetables, local
beverages as well as authentic Balinese handicrafts). Doing shopping is also
favourite activity for many target markets. Increasing varieties of local culinary
and handicrafts is really important. To create and develop varieties of the local
culinary and handicrafts will support and strengthen the local economy.
d. Something to learn (workshops or courses about Bali). Balinese can set up a
whole range of workshops or courses that could be offered to prospective
tourists, such as: Balinese and Indonesia language, Balinese cooking, Balinese
Hinduism, making of offerings, making of monster‟s doll (ogoh-ogoh), jewelry
270
making (silversmithing and goldsmithing), traditional irrigation system
(Subak), painting, Balinese dance, wood carving, basket weaving, shadow
puppet making, weaving (tenun ikat), batik printing and gamelan playing.
Creating and developing varieties of courses about Bali for foreign tourists will
support and strengthen the local economies.
Destination product development to minimize tourism leakage in Bali
could be focused in the above activities through offering foreign tourist to: (1) to
stay in accommodations (hotels, homestays or villas) owned by Balinese; (2) to
eat in restaurants owned by Balinese by choosing the authentic local foods that
are using local meat, seafood and vegetables, exotic local fruits and beverages;
and (3) to buy products that are produced by the Balinese. By promoting
vacation on the real Balinese atmosphere such as stay in accommodations owned
by the Balinese supported by the authenticity of local Balinese foods, fruits and
beverages, these will strengthen the local economy, so the benefit of tourism
development can be more beneficial to the local Balinese.
Other destination products development are: (1) to educate tourists who
visit Bali in order to reduce complain regarding the availability of the local
products, services and hospitality offered by tourism industry in Bali; (2) to
educate local Balinese community to improve their ability and capability to give
better service and hospitality to support the tourism industry; and (3) Quality
improvement in all aspects supported by government and tourism industry of Bali
regarding availability, quantity and quality of local products in order to give
better services and hospitality to the tourists who visit Bali.

271
Branding Strategy for Tourism Products of Bali to Minimize Tourism Leakage
In creating a new brand, Country of Origin and Geographical Origin are
also important factors in affecting competitive market. These factors can be used
as indicators of quality and respect the country and geographical image, and they
have been identified as the important cue that might be used by global marketers
to influence consumers‟ evaluation of the brand which affects on consumer‟
perceptions and purchase intention. Country of Origin (COO), which refers to the
country that manufactures, designs or assembles the product or brand, meanwhile
Geographical Origin (GO) expresses overall perception of consumers about the
product from a particular consumer group, industry representative, or island
representative (Lee, et. al., 2009). The consumer groups, industry
representatives, and trade representatives have increasingly considered the
potential role of Geographical Origin labels as consumer information and
marketing tools.
Regarding creating new brand to minimize tourism leakage of Bali, the
word of “Bali” is used based on the context of Geographical Origin due to Bali
has already had a strong image in the global tourism market. Bali has been known
as one of popular tourist destination in the world due to its unique cultural activity
and beautiful natural scenery. Bali culture is unique and famous especially for its
rich and vibrant arts. Hinduism as the main religion is the major influence behind
its culture. Traditional ritual of Balinese can almost be seen daily, celebrating the
cycle of birth, death and reborn. Annual art festivals support Bali as an attractive
272
destination to be visited. Music, drama, dance and costumes become a feast for
the senses during temple festivities. Various forms of dance and music have made
Bali's arts and culture scene one of the most diverse in the world
(http://www.symbiosis-travel.com/indonesia/music-dance/219/bali-art-and-
culture/)
In addition, the image of Bali as a small island surrounded by beaches has
been positioned as having three “S” of destination, namely: “Sun, Sea and Sand”
which strengthen its image based on the market segment by age group. Bali is
really famous as having some of the best beaches and sea for doing surfing and
diving activities by young people. With the varieties of distinct elements of Bali
will support generating the brand image of Bali. The goal of destination branding
is to capture the distinct elements of the destination and communicating them
through its components such as identity, personality and image. This could be
undertaken through combining all of the attributes associated to form an identity
that is unique and differentiate the destination from the competition.
Based on the types of activities undertaken by tourist namely: something
to see, something to do, something to buy and something to learn, destination
branding strategy of Bali to minimize tourism leakage can be generated as
“BALITRULY” which express: (1) to stay in accommodations owned by
Balinese, (2) to eat in restaurants owned by Balinese, (3) to buy products that are
produced by the Balinese, and (4) to pay a fair price. The word “TRULY”
expresses the real activities that could be felt and undertaken by foreign tourists
during their vacation time in Bali. This is an imagination of being involved in the
273
natural Balinese activities and situation which can be offered to visitors. Benefits
from tourism in Bali can be used to maintain the Balinese culture and to preserve
the environment. These will sustain Balinese culture and keep Bali as world
famous tourist destination alive forever.
Considering the results that foreign tourists significantly looked for local
products, therefore the use of local products need to be encouraged in
accommodation sector through the responsibility of hotel managers who are in
charge in the operational of accommodation. In this point, “push marketing
strategy” is crucial to be implemented as push marketing strategy is a promotion
strategy that focused on using the sales force and trade promotion to push the
products to consumers (Kotler and Armstrong, 2004). This means that hotel
managers need to optimize in offering and creating menu in hotels and restaurants
based on authenticity of local products such as fisheries products as Bali has
abundant fresh fisheries products due to geographically Bali is surrounded by the
coast. In addition, local authentic fruits and vegetables are also potential local
Balinese agricultural products which need to be offered and promoted to the
foreign tourists. However, the results show that foreign tourists prefer imported
meet, beverages and dairy products. In this point, “pull marketing strategy” is
crucial to be implemented by offering substitute products as pull strategy is a
promotion strategy which focused on build up consumer demand (Kotler and
Armstrong, 2004; Kotler and Lane, 2006). The availability of substitute products
to replace imported products is really important. In fact, Bali has some beverage
products which can be used as substitute products, particularly wines and

274
alcoholic drinks which are locally produced in Bali. In fact, there has already
been the use of country of origin in Balinese beverages such as “Bali Moon”
which has been one of the famous alcoholic products consumed by foreign
tourists during their visit in Bali. Another famous beverages product is “Hatten
Wine”. Improvement quality and variety of local wines and alcoholic drinks are
also crucial to be focused on. However, import of meet cannot be avoided as
local meet doesn‟t meet foreign tourists‟ need.
In terms of products development, country of origin and labelling strategy
are important factors affecting the competitive market, although there are many
parameters considered by consumers when decide to buy the products, such as
brand, colour, design, etc. As Ghazali, et. al. (2008); Lin & Chen (2006) and
Roth & Diamantopoulos (2009) state that country of origin is closely linked to
the country‟s image which is created by variables such as representative products,
national characteristics, traditions and overall perception of consumers form of the
products based on their prior perceptions of the country‟s production and
marketing strengths and weaknesses. In addition, Akerlof (1990) supports the use
of food labeling as a critical mechanism to help ensure consumers to correctly
match with products, enable producers to adapt production of the products to
meet consumer‟s demands and expectations. Regarding this research, creating
more country of origin of Balinese products and labels are crucial to be developed
to strengthen Balinese products positioning on fresh fisheries and authenticity of
fruits and vegetables products. Efforts and more integrated researches in
marketing need to be focused in this topic. Variety of alternatives food labels of

275
Balinese agricultural and food products need to be developed. For fisheries
products, alternative food labels could be as follows: (i) “Bali Bagus” which the
meaning of “Bali with good quality of products”. This label would be possible
for fashion design products, (ii) “Bali fresh from the sea” could be more
interesting for fisheries products of Bali. Furthermore, labels could also be
possible regarding the original production of products in a district or village in a
region of Bali, such as “Lovina Fresh Grape” for Balinese original grape products
and “Bedugul fresh farm” for the labels of vegetables, (iii), “Bali coconut” is
another possibility as abundant coconut trees are available in Bali to strengthen
the labels of Balinese products. In this terms label “Bali Coconut”, it is also
possible to use this label not only for Balinese coconut but also for Bali as a
destination as Bali typically famous with beautiful beaches covered by white sand.
Coconut trees typically are planted at surrounding the beaches. As an example of
the use of the label “coconut” can be seen in the advertisement on some of
France‟s television channel, such as BRTV, Gulli, etc. It can be seen that the
label “coconut” used by one of the famous destinations in the world, namely
„Tahiti” which used label “Tahiti Coconut” for labelling their coconut to promote
coconut product and beaches destination of Tahiti. Another example is how
France use the concept of country of origin approach for labelling and promote
their destination, such as “vin de Bordeaux” which means “wine from Bordeaux”
as a label of one of the original wine productions produced by one of the regions
in France. So that, domestic and trade representatives have increasingly
considered as the potential role of geographical origin labels as Loureiro and
276
McCluskey (2000) say that the quality trade representatives have increasingly
considered the potential role of geographical origin labels as consumer
information and marketing tools.
Lastly, there is also a crucial need to improve the quality of human
resources through better education. Moreover, hoteliers and government need to
work together to create and improve the quality of tourism products, especially
food and beverage. This requires such improvement the quality of agricultural
products and livestock, as well as increasing the supply of local wines and liquors.
There is also a need to create substitute products for replacing imported products
in order to fulfill tourist‟s demand. As Zheng ( 2011) says that leakage can be
minimized by developing stronger links between tourism and other sectors in the
local economy.
2. Price
Price is a critical and important factor of marketing mix and plays an
important role to influence demand in the competitive market. The role of price
in tourism marketing is to reflect products as services which are the costs
allocated to the responsible service and should be considered at short-term and
long-term strategic including costs for environmental conservation and corporate
social responsibility. As Gossling, et al. (2009) reveal that price offered to the
customers should include the full costs of the product‟s or service‟s negative
externalities.
277
Zamrozy (2007) suggests a shift in the tourism marketing paradigm away
from economic profit priorities toward sustainability. The sustainability approach
adopts a holistic, integrated view of marketing, considering social equity,
environmental protection, and economic viability. The paradigm shift naturally
occurs by tracing the evolution of marketing approaches from production, sales,
and a consumer orientation toward marketing alternatives such as societal, green,
responsible, and relationship marketing. Sustainable tourism marketing model
integrates tourism into a larger holistic context and focuses on marketing a quality
of life for all stakeholders in the system. He considers the triple bottom line as
more sustainable objectives in tourism marketing and adopts an integrated view
on tourism marketing, i.e. an extension of the production, selling, and consumer
orientation, considering not only consumer satisfaction but also expanding it
towards society‟s wellbeing.
Regarding this study, if the owners of the tourism accommodation such as
hotels, homestays and villas are the local Balinese, then coordination to
implement the concept of sustainable tourism is easier as they are part of the
Balinese community who have a social responsibility and environmental concern
in the implementation of tourism development in Bali. In addition, Balinese
perspective on every development in Bali is based on the Balinese philosophy
called “Tri Hita Karana” that is the point of view to keep harmonious and
balanced relationship between human to the God (Almighty), human-to-
human and human to environment. This concept has long been recognized and
practiced among the Balinese as a local knowledge which has been adopted in

278
preserving and protecting the environment and maintaining harmonious
relationship between community (Wiranatha and Dalem, 2005).
Pricing strategy in marketing mix of tourism industry is to put the
premium price or setting up the price higher than similar products or services in
order to represent exceptional quality and distinction service provided by tourism
industry. The implication for marketing is that consumers are willing to pay more
for certain goods and services as long as it could create a brand equity or value for
which the consumer is willing to pay extra. Tourism marketers view luxury and
comfortable vacation as the main factor differentiating a vacation brand in a
product category as this can encourage favorable perceptions among visitors.
Tourists who visit Bali should find what they are expected to have during their
vacation in Bali, including environmentally friendly of destination supported by
the hospitality of the Balinese community. Appropriate pricing strategy will
support sustainable marketing mix principles which emphasizes in the long-term
integration of environmental, social and economic management to reinforce
resource-based corporate strategy in order to reduce risk and simultaneously to
open up an innovative and productive activity. Corporate strategy and marketing
should employ a combination of economic, political, social and ecological norms.
Regarding effort to minimize tourism leakage in Bali based on the price
determination, it is suggested that determination of the premium price through
putting higher price of foods and beverages in the price list of menus served by
hotels and restaurants in Bali which use imported products. High difference of
price between dishes using imported products and local products will influence

279
tourist‟s point of view and decision making process in choosing the type of dishes.
So that, serve varieties of dishes based on the local products and served in the
international taste help to reduce the tourism leakage. However, educate the local
chefs is crucial by giving training in term of creating dishes by using local
products and served in the international way is really important to improve
competitive of the local products. The role of government is also really important
by giving subsidies to the small scale of hotels and restaurants through better
education and improve their employees‟ skill by undertaken training in order to
improve local human resources.
3. Promotion
Promotion in tourism industry is effort to inform, persuade, and
communicate products or services to the consumers. The function of promotion is
also as a marketing communications that represent the brand‟s voice and allow it
to build relationships with customers and to communicate sustainability solutions
provided by the company through its products and services and other stakeholders
as a whole (Kotler & Keller, 2006; Belz and Peattie, 2009). All of the
promotional mix is equally important including advertising, personal selling
through words-of-mouth promotion, public relations and interactive promotion
by using medias, such as online communications and social media.
Effective promotion related to the potential target market regarding Bali tourism
has been undertaken by individual or companies by using varieties of promotional
tools. Promotion is also a powerful tool to educate visitors related to the
280
strengths and weaknesses of tourism products of Bali in order to avoid complain
regarding the quality of local products and services. A suitable communication
strategy should support destination authorities to convey their message and
promote environmentally friendly practices locally, development of local
economic by empowerment of local knowledge, local community, local
organization to keep maintaining local genius in order to reduce social impact of
tourism and environmental damage in destination.
Advertising and promotion are part of marketing mix that need to be
maintained as it can establish awareness and positive value in the minds of
consumers, so that results in repeat buyers (revisit) as well as improve brand
loyalty among consumers. Advertising must be planned, implemented and
evaluated with care to increase sales, including: (i) to present information to the
customer about new products, new service, new decoration and other items of
interest; (ii) to reinforce consumer behaviour by communicating with individual
who have patronized a particular hotel or restaurant in the past and expose these
consumers to a continuous flow of advertising to do revisit by reinforcing their
positive experience and rewarded with a pleasant experience; and (iii) advertising
enhances the image of hospitality in tourism operations as words and phrases
often contribute the image building in the mind of consumers (Reid, et al., 2010).
Regarding this study, effort to promote the new created brand called
“BALITRULY” as creating tourism product development of Bali to minimize
tourism leakage can be undertaken by using all of the above promotional models,
such as advertising, personal selling through words-of-mouth promotion, and
281
interactive promotion by using the medias such as online communication and
other social medias. An example of the interactive promotion that was undertaken
in Bali regarding the implementation of marketing strategy to minimize tourism
leakage in Bali was undertaken in Gianyar Bali by the Government of Gianyar
Regency of Bali Province on 12th April 2015 through a talk show about
“Delicious Farm to Table” and was promoted through interactive promotion
covered by TV Channel, Newspaper and other social medias. The purpose of this
event was to promote Balinese culinary through empowerment of the local
products. The theme was “Localicious Farm to Table” means that delicious of
Balinese culinary by using local products. The speakers were the famous master
of Chef of Indonesia, namely Hendry Alexie Bloem, Deddy Soekartin and Haryo
Pramoe, Kelana and Nadja Azzura. In this event, there was a commitment of the
Indonesia Chef Association (ICA) to use local meat in every cuisine cooked by
the member of ICA. It was a great effort to minimize imported meat by optimize
the use of local meat (Bali Post, 13th April 2015). This means that effort to
minimize leakage has been undertaken. By promoting this event, we can see that
the role of promotion as one of the marketing mix in tourism is really important to
minimize tourism leakage in Bali.
4. Place
Place or marketing channels, is a wide range of independent organizations
involved in the process of making a product or service available for used or
consumed (Kotler & Keller, 2006). Place is also described as distribution
channels and determine where is the service of product going to be located. The

282
choice of such channels is important as the variety of channels used. In the
tourism industry, Reid, et al. (2010) reveal that place in tourism provide a
guideline about different tourist spots. It also provide the appropriate tour time
and distance from various spots, give ideas different travel routes, selecting
attractions and support facilities along different travel routes, and informing
potential tourists about alternative travel routes.
Tourism industries add value along the value chain from origin to
destination and include the firms and organizations that make the tourism industry
as a part of tourism system, such as destination marketing organizations, retail
travel agencies, tour wholesalers, transportation providers, accommodation
providers and attractions. Encouraging alternative model of transportation to
access or move within a destination might reduce tourists‟ overall ecological
negative impact. Lower-impact forms of transport, such as walking, cycling and
local public transport, might also help to sustain local communities and their
economies. Lower-impact transportation to a resort destination could be an
important consideration (Reid, et al., 2010).
Regarding this study, availability of local transportation owned by the
local Balinese has emerged, such as local taxis which are owned and managed by
the association of local people, such as in some destinations, namely Nusa Dua
Taxi and Canggu Taxi, etc. Traditional boats and rowboats which are owned and
managed by local Balinese have been found at the destination of Lake Batur.
Visitors who want to go to Trunyan must use water transportation (boats or
rowboats) across the Batur lake to get the destination. Moreover, visitors who

283
want to go to Lembongan, Penida and Ceningan islands also need boats to get the
destinations. These type of transportations are really good business to the local
people in these destinations. It shows that effort to empowerment of local
community has been undertaken which means that the economic impact of
tourism development can be more beneficial for local economy.
Regarding reduce-impact of tourism to the environment such as carbon emission,
there is a program created in destination called Gili Trawangan, at Lombok
island. There is no motorizing vehicle in this spot destination as the local
transportation. This destination used local transportation called „andong”,
traditional chariot drawn by horses. Bali should adopt this type of transportation
system to minimize negative impact of tourism on the environment and it will be
more economic benefits for the local economy.
5. People
People/participants include all of human actors who involve in the
delivery of products or service which can influence the visitor perceptions. The
role of human resource management is really important in managing service
performance outcomes which has the main purpose to satisfy consumers as
different consumers have varieties of needs and wants (Langeard, et al., 1981).
As can be seen from the model for minimization of tourism leakage, that
stakeholders play an important role in reducing tourism leakage in Bali. The
stakeholders are the provincial and local government, community organization,
community leaders, and local community. Community leaders and community
organization have crucial role in encouraging the development of agriculture and

284
handicraft industries through empowerment of local community. According to
Aref et al. (2010), community refers to a group of individuals who live or work
within the same geographic area which have the same culture or common
interests. The involvement of local communities in tourism development cannot
be overlooked due to their crucial roles in bridging up the gap between
government and the use of resources in a tourist destination. The local
community can create an effective environmental utilization based on indigenous,
local knowledge, economic and social empowerment to protect cultural heritage
and nature-based experiences and undertake cross-culture appreciation to visitor
(Jamal and Stronza, 2009). Local community is usually willing to participate in
tourism development and regarded as legitimate stakeholders in tourism
development because their interests affect the decision process of policy makers.
Based on one of the philosophy of Balinese that to keep harmonious and
balanced relationship between community, there is no doubt to implement the
involvement of local Balinese in marketing process in order to minimize tourism
leakage in Bali by promoting local product to the customers.
6. Process
Process describes how the service is assembled and delivered to visitor. In
the tourism context, process might describe such activities as follows: a move
away from paper-based to digital booking and account management systems;
production of alternative energy forms, such as solar or wind; management of the
supply chain for food and beverages, and labour; the use of low-carbon emission
transportation modes, such as hybrid or electric-engine vehicles, for moving
285
visitors to or within a destination; and having effective use-minimization and
recycling systems in place, particularly in environmentally locations such as
islands, national parks and protected areas (Zeithaml et al., 2006). Key-activated
lighting systems for accommodation and sensor-activated public-area lighting
systems can force energy reduction processes, while signs to encourage
consumers to reduce their environmental footprint by reusing bathroom linen or
minimizing water usage apply a social marketing approach that encourages
behaviour change for a positive societal benefit (Bohdanowicz, et al., 2011).
To achieve sustainable tourism development, local communities need to
participate in decision making process. They can take part in identifying and
promoting tourist resources and attractions that form the basis of community
tourism development. In fact, however, there has been lack of community
participation in tourism planning and development especially from the grassroots
on how communities would like to participate in tourism development. As
Mayers (2005) says that type stakeholder is divided into two categories: the first
category is the stakeholder who affect decisions and the second category is the
stakeholder who are affected by decisions. The degree of involvement of local
communities in various decision making and policy issues is determined by the
extent to which they affect or are affected by these decisions and policies.
Stakeholder need to be involved in the planning process as well as in the
implementation of policies and action plans. This ensures that development meet
the perceived needs of the local community. This argument supported by
Niezgoda and Czernek (2008) who say that if the local communities do not
286
involve in decision making process of tourism development in a region, it will
be impossible for the local communities to be involved during implementation.
Consideration of the origin of the tangible inputs that make up the tourism
experience for the consumer can go a long way to foster ecological, sociocultural
and long-term economic sustainability. Collaboration between tourism industry
and local community are really important. Local community can take
responsibility as suppliers in delivering foods, beverages and other merchandise,
such as souvenirs. It will not only reduce transportation costs and negative
externalities but also build collaborative social capital and economic capacity with
suppliers in the local community. Supplying local produce and merchandise might
also enhance the authenticity of the tourist‟s experience, adding value and
satisfaction. In addition, visitors can learn how the tourism product is produced
and delivered to the customers. Feedbacks from customers are really important
for the quality improvement.
7. Physical Evidence
Physical evidence means the situation in which the service is delivered in
the nice and warm interaction between the firm and customers that facilitate
performance or communication of the service (Bright, 2000). Physical evidence
in the tourism industry is important at both the individual firm level and at the
broader destination level (Zeithaml et al., 2006). Managing destination become
more important to satisfy tourist without damaging the environment. The
implementation of tourism system model which emphasize on the interaction and
interdependency among its parts proposed by Mill and Morison (2009) is one of
287
the solutions, which is based on the interaction between destination planning,
developing and controlling of tourism, interaction from demand side which is
focused on the factors influencing the market as well as from the marketing side
such as strategy, planning, promotion and distribution. At the destination, there
is also a mix interdependent elements which need attention in order to produce a
satisfaction vacation experience, which is composed by attractions, facilities,
infrastructure, transportation and hospitality (Mill and Morison, 2009). So that,
sustainability of local resources becomes one of the most important elements of
destination image as destination choice is influenced by an individual‟s perception
of alternative possibilities.
Regarding minimizing tourism leakage in Bali, type of tourism products
which give more benefit to the local Balinese community are really important to
be offered to the tourist such as cultural tourism, rural-based tourism, agrotourism,
mountain tourism and marine tourism. For example, offering tourist‟ activities
such as attractive experience and learning about art and culture of Bali in the
area of Ubud which will give them unforgettable memories. This place is really
famous as the centre of art and culture of Bali such as Balinese dance, painting
and wood carving. Tourist can also enjoy nice view and scenery based on
typically traditional Balinese life as well as enjoy exotic traditional food in many
traditional restaurants. In addition, rural-based tourism can also be seen in the
“Penglipuran” which is a place of traditional Balinese life in a typically Balinese
traditional village.
288
Moreover, agrotourism has been found in the area of Bangli which has the
tourism product namely ”Agrotourism of Balinese Coffee Plantation and
Processing”. Other destinations called Munduk and Sidemen which are really
famous destination to be visited. Tourist can stay with the Balinese family at their
homestay and enjoy rural life of Balinese daily life in a wonderful view of mount
Agung and marvelous rice field plantation. Bali is also really famous with the
white sand of beaches for sun bathing, coral reefs for diving and snorkeling, big
waves for surfing, etc. Other attractive destinations in Bali are small islands
namely Lembongan, Ceningan and Nusa Penida which have typically marine
tourism activities and the plantation of seaweededs.
Destination cannot easily change their physical attributes like the
landscape or climate, so they must build their images around unique attributes that
provide them sustainable competitive advantage. The destination including its
attraction should be designed to meet the needs of the target market. Therefore,
the diagnosis of the destination‟s strengths and weaknesses is helpful in designing
the tourism offerings and marketing programs as destination image refers to an
impression a person holds about a destination. Therefore, it is important for a
destination to increase visitation to promote a coherent image (Langeard, et.al.,
1981). Images can be formed through advertising and promotion, news accounts,
discussions with friends or relatives, travel agents, and past experiences.
Destination management related to improvement of service and hospitality
are really important through improvement of human resource by giving training to
their employees, educate consumers, and manage consumer expectations.

289
Service firms can add „value‟ to the product through their employees, who are part
of the service experience. Also, consumers are more likely to be satisfied if they
have reasonable expectations, i.e., if the firm can meet, or exceed, their
expectations (Reid, et al. 2010). Physical evidence can be easily associated with
the product by the customer. As the tourism product is highly intangible, the
place, the decor, the people, and everything else in the tourism office may be
related to the experience. For example, restaurants decorate their dining rooms in
an attempt to promote a „theme‟ and they use this theme in their marketing
materials, such as romantic restaurant for the target market are teenager by
creating themes based on the physical surroundings. This includes the
atmosphere of the service operation and any tangible evidence used to market the
product. When tourists visit a historic place for the first time, they carry home
not only the memories of beautiful structure, but they also remember all other
factors like transport facilities available, the surrounding markets, the people's
behavior, etc. as one whole experience.
Finally can be said that in the process of delivering products and services
to the consumers and participation of people/participants are really important to
support the marketing mix in order to minimize tourism leakage of Bali tourism.
The marketing mix includes participation of people in developing tourism
products, supported by reasonable price, appropriate promotion tools, availability
of local transportations in the spots destination which have lower impact on the
environment and physical evidence of the products and service offered to the
appropriate target market. The final purpose is to achieve sustainable tourism

290
through ensure the quality, continuity and balance between the needs of tourism,
protection of the environment and prosperity for the local community, which
means that the economic benefit of tourism should not only for the companies
concerned but also for the local communities as the host.
6.9 Novelty
The holistic and integrated analysis of tourism leakage from the
accommodation in this dissertation is something new, which has never been found
in any similar research so far. Moreover, this dissertation also makes use of
Interpretative Structural Modeling (ISM), which has never been found in tourism
research by other researchers.
6.10 Conclusion
This chapter discusses the calculation of tourism leakage from the
accommodation sector in Bali at micro (industrial) level and macro (regional)
level. This chapter also discusses the causes of leakage and the ways in which
simulated scenarios of government subsidies and reduction in imports by the
accommodation sector would impact on leakage, job opportunity and income
distribution. The average leakage estimated by micro analysis was 18.8%, while
that based on macro analysis was 19.5%. An analysis of foreign tourists‟
perceptions of and preference for imported and local products was also discussed
in some depth. The results show that their perceptions of both local and imported
products were positive, with local items scoring slightly higher (5.59) than
imported ones (5.24) on average. It was also found from statistical analysis that
291
foreign tourists were interested in the local products available in Bali. It was also
found that hotel managers would be willing to use local products as long as the
quality, quantity and continuity of local products met the quality standard required
by hotels.
A strategy for minimizing tourism leakage was developed based upon the
results of Interpretative Structural Modeling (ISM). The proposed strategy
included: (i) to reduce the use of imported products for tourists; (ii) to optimize
the potential of local products; (iii) to develop agriculture, livestock, fisheries and
handicraft industry; (iv) to empower the community in developing agriculture,
livestock, fisheries and handicraft industry; (v) to establish policies on restricting
the development of new accommodation in Bali; and (vi) to improve the roles of
provincial and local government.
This holistic and integrated analysis of tourism leakage from the
accommodation sector in this dissertation is something new, which has never been
found in any similar research so far. Moreover, this dissertation also makes use of
Interpretative Structural Modeling (ISM). The implementation of ISM has not
been found in previous tourism research. Efforts to minimize tourism leakage
was also demonstrated based on the 7 Ps of marketing mix of service and
hospitality approach namely product, price, place, promotion, people, process and
physical evidence in order to support sustainable tourism in Bali.

292
PART III
CONCLUSION AND SUGGESTION
293
CHAPTER VII CONCLUSION AND SUGGESTIONS
7.1 Conclusion
Based on the results of this study, it can be concluded that:
1. Based on micro analysis, the figures for tourism leakage from the
accommodation sector in Bali in year 2012 were as follow:
(i) Leakage from Non-star rated hotels was 8.8%,
(ii) Leakage from 1,2&3 Star-rated hotels was 12.0%,
(iii) Leakage from 4&5 Star-rated non-chain hotels was 22.7%,
(iv) Leakage from 4&5 Star-rated chain hotels was 51.0%, and
(v) Average leakage from all types of hotels was 18.8%.
2. Based on macro analysis, the figures for tourism leakage from the
accommodation sector in Bali in year 2012 were as follow:
(i) Leakage from Non-star rated hotels was 2.0%,
(ii) Leakage from 1,2&3 Star-rated hotels was 15.7%,
(iii) Leakage from 4&5 Star-rated non-chain hotels was 7.1%,
(iv) Leakage from 4&5 Star-rated chain hotels was 55.3%, and
(v) Average leakage from all types of hotels was 19.5%.’
3. Both of the analysis either macro or micro analysis in calculating tourism
leakage in Bali are really important. Micro analysis supports the macro
analysis basically on gaining data from all type of hotels. However, the result
from the macro analysis give more accurate results because this analysis

294
demonstrates transactions between sectors in detail, including transactions
between factors of production, production sectors, institutions, commodities,
capital account, as well as transactions between domestic and foreign
activities including imported of capital goods, raw materials as well as the use
of foreign employments. Meanwhile, the micro analysis, is the calculation of
tourism leakage which was only undertaken within the tourism industry of
Bali especially on the accommodation.
4. The highest percentage of tourism leakage was found in 4&5 Star-rated chain
hotels, i.e. 51.0% (micro analysis) and 55.3% (macro analysis). Regarding
the macro analysis that was based on the total population of the
accommodation sector in Bali, it can be concluded that the highest percentage
of tourism leakage was 55.3% in 4&5 Star-rated chain hotels.
5. Central, provincial and local government play an important role in
minimizing tourism leakage, increasing job opportunity and increasing
income distribution through policies on giving subsidies. The involvement of
the accommodation sector was also found to be crucial through minimizing
its use of imported products and services, and foreign employees. The
optimum result was found through a simulation using a scenario (simulation-
5) in which the government gives subsidies of 40% to Non-star rated hotels
and 18.5% to 1,2&3 Star-rated hotels. At the same time, the accommodation
sector also reduces imports by 25% for 1,2&3 Star-rated hotels and by 30%
for 4&5 Star-rated chain hotels. This simulation-5 resulted in: (i) Decreasing
the average leakage by 12.0 % (from 19.5 % to 7.5 %); (ii) Increasing job
295
opportunity by 14.8%; and (iii) Increasing the income of low class
households in urban areas by 0.26%.
6. The average score for foreign tourists’ perceived quality of products was
higher for local than for imported products; the average score for local
products was 5.59 on a 7-point scale and that for imported products was 5.24.
Most of the foreign tourists (76.8%) preferred local products. Regarding the
relationship between foreign tourists’ preferences and their perceptions on the
quality of local products, the statistical results show perfect positive
relationships between the tourists’ preferences and the perceived quality of
local products. These findings demonstrate that foreign tourists have a
positive attitude towards local products that are available in Bali. However,
contradictory results were found regarding foreign tourists’ perception of and
preference for meat. Even though they expressed a preference for local meat,
the results show that on average their perception of local meat was that it was
inferior to imported meat.
7. Most of tourists who visit Bali are willing to spend their money to the local
people and to be a part of the system of Bali tourism in term of maintaining
sustainable tourism in Bali. They are also willing to spend their money and
would love to stay in the village and prefer authenticity of the local products.
The other concern of foreign tourists are staying in the locally decorated
Balinese style and are willing to give more money to be used as the
assurance of environmental protection to minimize negative impacts of
tourism development in Bali as long as the mechanism of being involved is

296
well organized. They would also love to live with the harmonious interaction
with local Balinese people and willing to maintain cultural heritage of Bali as
one of the famous attractive destination in the world. Their opinion,
expectation and expression of satisfaction of the whole trip to Bali show that
they found what they expected during their visit to Bali and there is no doubt
for them to be responsible for the long term development of tourism in Bali.
8. Differences were found between the points of view expressed by foreign
tourists and hotel managers regarding local products. Hotel managers
thought that foreign tourists generally preferred imported products.
Meanwhile statistical results indicated that foreign tourists actually had a
more positive attitude towards local products. There is therefore a need to
encourage hotel managers to change their perceptions and attitudes towards
local and imported products. As a result, fewer imported products will be
consumed by foreign tourists, and tourism leakage will also decrease.
Moreover, the results show that most of the hotel managers surveyed are
willing to reduce the use of imported products and give priority to local
products as long as the quality and continuity of local products can be
guaranteed.
7. Strategy to minimize tourism leakage from the accommodation sector in Bali
is developed based upon the results of Interpretative Structural Modeling
(ISM). Six groups of strategy were proposed according to the six elements of
the program. Each strategy is composed from the key elements resulting from
the ISM. Some of the important strategies are: (i) to optimize the potential of

297
local products; (ii) to develop agriculture, livestock, fisheries and handicraft
industry; (iii) to empower the community; (iv) to reduce the use of imported
products for tourists; (v) to urge government to develop and implement
supporting policies in order to minimize leakage; (vi) to establish
International Trade Policy that reduces import and increases export of local
products; (vii) to facilitate public-private partnership on investment in
tourism; (viii) to establish policy on restricting the development of new
accommodations in Bali; and (ix) to improve the role of the Central
Government of Indonesia through the Ministry of Tourism and Creative
Economics, and the Ministry of Foreign Affairs, and through encouraging a
better quality of foreign tourists to visit Bali by improving the role of the
Economic Attache of the Indonesian Embassy in every country in order to
minimize tourism promotion costs.
8. Marketing strategy to minimize tourism leakage in Bali can be undertaken
based on the 7 Ps of marketing mix on service and hospitality approach
namely product, price, place, promotion, people, process and physical
evidence in order to support sustainable tourism in Bali. Process of
delivering products and services to the consumers and participation of
people/participants are really important in order to minimize tourism leakage
of Bali tourism, including participation of people in developing tourism
products, supported by reasonable price, appropriate promotion tools,
availability of local transportations in the spots destination which have lower
impact on the environment and physical evidence of the products and service
298
offered to the appropriate target market. The final purpose is to achieve
sustainable tourism through ensure the quality, continuity and balance
between the needs of tourism, protection of the environment and prosperity
for the local community, which means that the economic benefit of tourism
should not only for the companies concerned but also for the local
communities as the host.
7.2 Suggestions for Future Research
1. The results of this study show that even though most of the foreign tourists
preferred local meat, nevertheless their perception was that local meat was
inferior to imported meat. This inconsistency was possibly due to the use of
the general word “meat” in the questionnaire. Future research should
therefore use a more detailed classification of “meat”, such as beef, chicken,
pork, lamb, duck or other meat.
2. Regarding research on preferences for local and imported foods and
beverages, more valid results will be gained if respondents (tourists) are
given samples of local and imported food or beverage to be tasted. However,
this type of research will lead to a higher cost and be more time consuming.
3. In further research, the 1,2&3 star-rated hotels need to be classified into chain
hotels and non-chain hotels in order to obtain a more valid calculation of
tourism leakage.
4. The calculation of tourism leakage was only undertaken based on registered
accommodations that were listed by the Bali Government Tourism Office.

299
Unregistered accommodations were not included in this study. Therefore,
further research needs to be undertaken to involve all types of
accommodations including unregistered accommodations.
5. Further research on developing a program and action plan to minimize
tourism leakage in the accommodation sector could be undertaken in order to
implement the strategy that was developed in this study.
6. Further research on marketing also need to be undertaken to strengthen and
improve competitiveness of the local products as well as substitute
products.
300
REFERENCES
Akerlof, G.A. 1990. The Market for Lemons: Quality Uncertainty and the Market Mechanism. Quarterly Journal of Economics. 84: 488-500.
Albertus, G. Joubert, R. G. 2012. Using Critical Systems Thinking to Improve
Student Performance in Networking World Academy of Science, Engineering and Technology, 64 2012
American Marketing Association, 2004. Chicago, IL, pp. 17-18, available at:
www. marketingpower.com Andriotis, K. 2005. Community Groups' Perceptions of and Preferences for
Tourism Development: Evidence from Crete. Journal of Hospitality &
Tourism Research. 29: (67-89). Sage Publication. Anonymous. 2009. Bali Tourism Satellite Account.A Joint Project by Statistics
Indonesia and Department of Culture and Tourism. Anonymous. 2010. China Exchange Earning. [cited 2012 Jun. 6]. Available from
URL:www.chinaexchange.org/search/?search/forminput=earn%20foreign%2Exchange.
Anonymous.2010. Indian Exchange Earning.[cited 2012 Jun. 6]. Available from
URL:(www.indiankanoon.org/search/?search/forminput=earn%20foreign%20exc)
Anonymous.2012. Australian Exchange Rate 2012. [cited 2012 Jun. 6].
Available from URL: (www.australia.gov.au.topic.tourism) Anonymous.2012. Australian Exchange Rate 2012. [cited 2012 Jun. 6].
Available from URL:www2.unwto.org/en/content/why-tourism Antara, Made. 1999. Dampak Pengeluaran Pemerintah dan Wisatawan terhadap
Kinerja Perekonomian Bali: Pendekatan Social Accounting Matrix. Unpublished Disertation. Institut Pertanian Bogor. Bogor.
Archer, B.H., and Fletcher, J.E. 1996. „The economic impact of tourism in
Seychelles‟, Annals of Tourism Research, Vol 23, No 1, pp 32–47. Ashraful, M, and F. Chowdhury. 2012. The impact of tourism in a deficit
economy: A Conceptual Model in Bangladesh Perspective. Business
Intelligence Journal. 5 (14) : 163-168.

301
Ashley, C., H. Goodwin, D. McNab, M. Scott, and L. Chaves. 2006: Making
Tourism Count for the local Economy in the Caribbean. Guidelines for
Good Practice. Pro-poor Tourism Partnership and The Caribbean Tourism Organization.
Attri, R., N Dev and V Sharma. 2013. Interpretive Structural Modelling (ISM)
approach: An Research Journal of Management Sciences Overview. Research Journal of Management Sciences, Vol. 2(2), 3-8, February. International Science Congress Association
Badaruddin, M. and Mageswari, R. 2010.Domestic Tourism: Perception of
Domestic Tourist on Tourism Products in Penang Island. Asian Journal of
Management Research: (759-815). Baker, C. 2008. Environmental Management for Hotels: The Industry Guide to
Sustainable Operation. International Tourism Partnership. London. Bali Government Tourism Office. 2011. Bali Tourism Statistic 2010. Denpasar.
Bali. Bali Government Tourism Office. 2013. Bali Tourism Statistic 2012. Denpasar.
Bali. Bali Statistical Office. 2011. Bali in Figure. Denpasar. Bali. Bali Statistical Office. 2013. Bali in Figure. Denpasar. Bali. Bali Post. Local Newspaper, 18 June 2013. Pemberdayaan Produk Lokal.
Empowerment of Local Products. News on the page 2 of 23 pages. Bashar, A. 2010. An Analysis of Push and Pull Travel Motivations of Foreign
Tourists to Jordan. International Journal of Business and Management, 5 (12).
Becken, S. 2007. Tourists Perception of International Air Travel‟s Impact on
Global Climate and Potential Climate Change Policies. Journal of
Sustainable Tourism 15(4): 351-368.
Belisle, F. 1983. Tourism and Food Production In the Caribbean. Annals of
Tourism Research 10: 497-513.
Belz, F.-M., & K. Peattie, K. 2009. Sustainability marketing, a global perspective. Chichester: Wiley.
Blake, A, and J.S. Arbache JS, M.T. Sinclair and V. Teles. 2008. Tourism and Poverty Relief. Annals of Tourism Research, 5: 107–126.
302
Bloom, J. 2009. Transferrable Learning in Education for Sustainability. Department of Teaching & Learning College of Education Northern Arizona University. Prepared for the Education Sustainability Infusion Project of the Coconino County Sustainable Economic Development Initiative (SEDI).
Booms, B.H., & Bitner, M.J. 1981. Marketing strategies and organizational
structures for service firms. In J.H. Donnelly & W.R. George (Eds.), Marketing of services (pp. 47–51). Chicago, IL: American Marketing Association.
Booms, B.H., & Bitner, M.J. 1980. New management tools for the successful
tourism manager. Annals of Tourism Research, 7(3), 337–352. Brey, E.T., D. B. Klenosky, X. Lehto and A. M. Morrison. 2008. Standard
Hospitality Elements At Resorts An Empirical Assessment. University of Memphis Purdue University. Journal of Travel Research: 247-257. Originally published online 6 October 2008.
Bright, A. 2000. The Role of Social Marketing in Leisure and Recreation
Management. Journal of Leisure Research. Vol. 32 No. 1, pp. 12-17. Bull, A. 1991. The Economics of Travel and Tourism. Second Edition. Pitman
and Wiley, Melbourne. Australia. Butler, R.W. 2006. The Tourism Area Life Cycle.Vol.1. Application and
Modifications. Series Edition. Channel View Publications. Clevendon, England.
Cai, J., L. PingSun Leung and J. Mak. 2006. Tourism‟s Forward and Backward
Linkages. Journal of Travel Research. (45): 36. 356-362. Capra, F. 2002. The Hidden Connections. Integrating the Biological, Cognitive
and Social. Dimensions of Life into a Science of Sustainability, Doubleday, New York, NY.
Central Bureau of Statistic of Bali Province. 2011. Bali in Figure. Central Bureau of Statistic of Bali Province. 2011. Social Accounting Matrix of
Bali Province 2010. The Collaboration Research Report between Central Bureau of Statistic of Bali Province and Development Planning Board of Bali Province.
Chidambaranathan S., C, Muralidharan and S.G. Deshmukh. 2009. Analyzing the
Interaction of Critical Factors of Supplier Development using
303
Interpretive Structural Modeling-an empirical study, International
Journal of Advance Manufacturing Technology, 43, 1081-1093 (2009). Chiliya, N. H. and G. R. Lombard. 2009. The impact of Marketing Strategies on
Profitability of Small Grocery Shops in South Africa townships. African
Jounal in Bus and Management, 3(3): 70-79.
Chirenje, L.I., J. Chitotombe, S. Gukurume, B. Chazovachi and L ,Chitongo. 2013. The Impact of Tourism Leakages on Local Economies: A Case Study of Nyanga District, Zimbabwe. Journal of Hum Ecol, 42(1): 9-16 (2013).
Chen, S.L. and C.K. Liu. 1992. A Study of Travel Market Segmentation by Site
Attributes. Journal of Outdoor Recreation Study, 5(2): 39-70. Cicchetti, D. V., Showalter, D., & Tyrer, P. J. 1985. The effect of number of
rating scale categories on levels of inter-rater reliability: a Monte-Carlo investigation. Applied Psychological Measurement, 9, 31-36.
Clarke, J. 2002. A synthesis of activity towards the implementation of sustainable
tourism: ecotourism in a different context. International Journal of
Sustainable Development, Vol. 5 No. 3, pp. 232-45. Clarkson, M.B.E. 1995. A Stakeholder Framework for Analysing and Evaluating
Corporate Social Performance. Academy of Management Review, 20(1):92-117
Clemons, E.K. 2008.How Information Changes Consumer Behavior and How Consumer Behavior Determines Corporate Strategy. Journal of
Management Informomation System, 25(2): 13–40. Cox, E. P. 1980. The optimal number of response alternatives for a scale: a
review. Journal of Marketing Research, 17, 407-422. Colman, A. M., Norris, C. E., & Preston, C. C. 1997. Comparing rating scales of
different lengths: Equivalence of scores from 5-point and 7-point scales. Psychological Reports, 80, 355-362.
Creswell, J.W and V.L.P. Clark. 2007. Mixed Methods Research. Designing and
Conducting. University of Nebraska-Lincoln. SAGE Publication. United States of America
Creswell, J.W. 2010. Research Design. Qualitative and Quantitaive and Mixed
Methods Approaches. Third Edition. SAGE Publications. Thousand Oaks California, 91320.
304
Dadkhah, K.M. (nd). Income Distribution and Economic Growth in the United States: 1947 – 2001.
Davis, H.H., 2003. Traveler Perceptions of a Destination as a Source of New
Product Concepts: Q-Method Study of Summer Visitors to the Bay of Fundy. Working Papet. TTRA Canada Annual Conference. Saint John, Bruncwik
Davidson, R. 1993. Tourism, 2nd ed. London: Pitman Publishing. Dewi, N.G.A. Susrami. (2009). Peran Bali Tourism Development Corporation
(BTDC) Dalam Pengentasan Kemiskinan di Desa Bualu dan Tanjung
Benoa, Kawasan Pariwisata Nusa Dua – Bali. Unpublished Master Thesis. Udayana University.Denpasar.
Dinan, C. and A. Sargeant. 2000. Social marketing and sustainable tourism-is
there a match?”. International Journal of Tourism Research, Vol. 2, pp. 1-14.
Diparda Bali. 2012. Bali Toursm Statistic. Report of Bali Government Tourism
Office. Denpasar. Donaldson, T., and L. Preston. 1995. The Stakeholder Theory of The Modern
Corporation: concepts, evidence and implications. Academy of Management Review 20, 65–91.
Dwyer, L., & Forsyth, P. 1994. Foreign Tourism Investment Motivation and
Impact. Annuals of Tourism Research, 21(3), 512-557. Erawan, I.N. 1994. Tourism and Economic Development. A Case of Bali. First
Edition.PT. Upada Sastra. Denpasar. Erawan, I.N. 1998.Community Based Tourism Development Strategy to
Accelerate Poverty in Bali. Research Report. Udayana University Denpasar. Bali.
Erawan, I. N. 2003. The Impact of Bombing Tragedy in Legian Kuta Through
The Role of Tourism Sector on Gross Domestic Regional Product of Bali. Economic and Business Indonesian Journal. Vol (18):2, April 2003, 161-174. Faculty of Economic. Gajah Mada University. Yogyakarta.
Eriyatno. 2012. System Theory. Improve the Quality and Effectiveness of
Management. Fourth Edition. Larasati, L. (Ed). Guna Widya, Surabaya.
305
Elkington, J. 1997. Cannibals with Forks: The Triple Bottom Line (TBL) of 21st century business. Capstone: Oxford.
Endre, H. and D. C. Frechtling. 1999. Estimating the Multiplier Effects of
Tourism Expenditures on a Local Economy through a Regional Input-Output Model. Journal of Travel Research,Vol. 37, no. 4 (May 1999), pp. 324-332.
Frankel, J.A., Rose, A.K. 2002. An Estimate of the Effect of Common Currencies
on Trade and Income, Quarterly Journal of Economics, 117(2), 437-466. Freeman, R.E., 1984. Strategic Management: a Stakeholder Approach. Basic
Books, New York. Frechtling, D.C. 1994. Asessing the Impacts of Travel and Tourism: Introduction
to Travel Economic Impact Estimation. Journal of Travel and Tourism
and Hospitallity Research, J.R.B. Ritchie and C.R. Goelner (eds). New York: John Wiley and Sons. Inc, 384-385.
Frechtling, D.C. 1999. „The Tourism Satellite Account: foundations, progress. Fletcher, J. E. 1994. “Input-Output Analysis.” In Tourism Marketing and
Management Handbook, 2nd ed., edited by Stephen F. Witt and Lui Moutinho. New York: Prentice Hall Inc., pp. 480–87
Fletcher, J. E. 1989. Input-output analysis and tourism impact studies, Annals of
Tourism Research, 16, 514–29. and issues‟. Tourism Management. Vol 20: 20, pp 163–170.
Fridgen, J.D. 1996. Dimensions of Tourism. Educational Institute of the
American Hotel & Lodging Association. The United States of America. Furutani, T., and Akira Fujita.2005. A Study on Foreign Tourist‟ Behavioural and
Consumer Satisfaction in Kamakura. Journal of The Eastern Asia Society
for Transportation Studies, (6):2154-219. Gee, C.Y. 1994. International Hotels, Development and Management. East
Lansing, MI: The eductaional Institute of the American Hotel and Motel Association.
Ghazali, M. , A.Z. Othman, M. Yahya & Ibrahim, M. S. 2008. Products and
country of origin effects: The Malaysian consumers‟ perception. International Review of Business Research Papers, 4(2), 91-102.
Gilbert , D. C. 1991. An Examination of the Consumer decision process related to
tourism. In Progress in Tourism, Recreation and Hospitality

306
Management (C. Cooper, ed.), vol 3, Belhaven Press. Griffin, G. 2005. Customer Loyalty. Penerbit Erlangga. Jakarta.
Goodrich, J.N. 1978. The Relationship Between Preferences for and Perceptions
of Vacation Destinations: Application of a Choice Model. Journal of
Travel Research 1978, 17 (8-13). Sage Publication. Goodwin, H. 2008. Tourism and Local Economic Development, and Poverty
Reduction. Journal ofApplied Research in Economic Development, 5: 55-64.
G¨ossling, S. 2009. Carbon neutral destinations: A conceptual analysis. Journal of
SustainableTourism, 17(1), 17–37. Gummeson, E. 1998. Service Quality and Product Quality Combined. Review of
Business Journal. (9): 3. 269-277. Hara, T. 2008. Quantitive Tourism Industry Analysis. Intoduction to Input-
Output, Social Acconting Matrix and Tourism Satellite Accounts. Butterworth-Heinemann, Burlington, USA.
Haemoon. 1999. Service Quality, Customer Satisfaction, and Customer Value: A
Holistic Perspective. Intenational Journal of Hospitality Management Vol 18: 67-82.
Hampton, M.P. 1998. „Backpacker tourism and economic development.‟, Annals
of Tourism Research, Vol 25, No 3, pp 639–660
Harrison, D. 1992. Pro-Poor Tourism: A Critique. Third World Quarterly. 29(5), pp. 851–68.
Harrison, D. 1993. Tourism and the Less Developed Countries. London:
Belheaven Press. Hemmati, M. and Koehler, N. 2000. Financial Leakages in Tourism. Sustainable
Travel and Tourism. 25(29): 219-113. Hendry, B.C. 2013. New Paradigm of Systems Thinking. International Journal
of Economics, Finance and Management, 2(5), August 2013. Hollander, J. 1911.Ricardo and Torrens.Economic Journal, Vol. 21, pp. 455-468. Hudman, L.E., and Hawkins, D.E. 1989. Tourism in Contemporary Society,
Prentice Hall, Englewood, NJ. Hughes, H.L. 1994. Tourism Multiplier Studies: A more judicious approach.
Journal of Tourism Management, 15: 405-406.

307
Huseyin, S. 1996. Social Accounting Matrix (SAM) and Its Implications for
Macroeconomic Planning. Unpublished Assessed Article, Bradford University, Development Project Planning Centre (DPPC), Bradford, UK.
Insula-International Scientific Council for Island Development. 1995. [cited 2012
August 20]. Available from http://www.insula.org/tourism/charter.htm Janes, F.R. 1988. Interpretive Structural Modelling(ISM): A methodology for
Structuring Complex. Trans Inst MC Vol 10 No 3 August 1988. Jamrozy, U. 2007. Marketing of Tourism: a Paradigm Shift Toward
Sustainability. International Journal of Tourism and Hospitality. (1):2. Emeral Group Publishing Limited.
Karagiannis. 2004. The Caribbean Economies in an Era of Free Trade. pp. 3–22.
M. Witter (eds).Ashgate: Aldercroft. Keefe, L.M. 2004. What is the meaning of „marketing‟?”, Marketing News, Vol.
38 No. 15. Kehoe, T. J. 1996. Asia Accounting Matrix and Applied General Equilibrium
Models. Federal Reserve Bank of Minneapolis Research Department. Working Paper.
Kennedy, D. 1993. Tourism and the Environment-What Follow PATA
Occational Paper Series (5): 1-9. Keuning, S.J., and W. A. De Ruijter. 2010. Guideline to The Construction of a
SAM (Social Accounting Matrix) Model. Institute of Social Studies. Tebosin Consulting Engineers. The Hague.
Kholil, Eriyatno, S.H. Sutjahyo, Sudarsono. 2008. Pengembangan Model
Kelembagaan Pengelolaan Sampah dengan Metode ISM (Interpretative Structural Modelling). Studi Kasus di Jakarta Selatan. Jurnal
Transdisiplin Sosiologi, Komunikasi, dan Ekologi Manusia. April 2008. Vol 2 (01). P:31-48.
Kim, H. and T, Jamal. 2007. Touristic Quest for existential Authenticity. Annals
of Tourism Research, 34(1): 181-201.
King, B., M. Vey, and D. Simmons. 2000. A societal marketing approach to national tourism planning: evidence from the South Pacific”, Journal of
Tourism Management, Vol. 21, pp. 407-16.
308
Kilbourne, W.E. 1998. Green marketing, a theoretical perspective. Journal of
Marketing Management, Vol. 14 No. 6, pp. 641-55. Kish, L. (1965). Survey Sampling. Copyright by John Wiley & son, Inc. Library
of Congress. United State of America. Kontogeorgopoulos, N.1998. Accommodation employment patterns an
Opportunities. Annals of Tourism Research , Volume 25, Issue 2, April Pages 314-33
Kotler , P. 1991. Marketing Management: Analysis, Planning, Implementation,
and Control. New Jersey: Prentice-Hall. Kotler, P and Armstrong, G. 2004. Marketing management: Analysis Planning,
Implementation and Control. 10 th Edition. Pearson Education.
Kotler, P and K. Lane. 2006. Marketing Management 12e. Twelfth Edition.
Upper Saddle River, New Jersey.
Kotler, P., & K.L. Keller. 2006. Marketing management (12th ed.). Upper Saddle River, NJ: Pearson Prentice Hall.
Krugman, P.R. & M. Obstfeld. 2006. Internationall Economics. Theory and
Policy. Seventh Edition. Pearson Addison-Wesley. USA Lacher, R. G., and S. K. Nepal. 2010. From Leakages to Linkages: Local-level
Strategies for Capturing Tourism Revenue in Northern Thailand. Tourism Geographies Journal. 12(1): 77-99.
Langeard, E., Bateson, J.E.G., Lovelock, C.H., & Eiglier, P. 1981. Services
marketing: New insights from consumers and managers. Cambridge, MA: Marketing Science Institute.
Lahiri, A . 2011. National Income in Open Economy. Handout International
Finance (Econ 556). Universiy of British Colimbia. Department of Economics.
Lam, T. and C. H. C. Hsu. 2006. Predicting Behavioral Intension of Choosing
a Travel Destination. Journal of School of Hotel and Tourism
Management.(27): 589-599.
Lane, P.R. 1999. The new open economy macroeconomics: a survey. Journal of
International Economics. 54 (2001) 235–266. www.elsevier.nl / locate /econbase.

309
Lee, J.K. & W.N. Lee. 2009. Country-of-origin Effects on Consumer Product Evaluation and Purchase Intention: The Role of Objective Versus Subjective Knowledge. Journal of International Consumer Marketing,
21(2), 137-151. 2009. Lieper, N. 1979. The framework of tourism: Towards a definition of tourism,
tourist, and the tourist industry. Annals of Tourism Research, 6(4), 390–407.
Lin, L.Y. & C.S Chen. 2006 The influence of the country-of-origin image,
product knowledge and product involvement on consumer purchase decisions: an empirical study of insurance and catering services in Taiwan. Journal of Consumer Marketing, 23(5), 248-265.
Lin, S.J, C. Hua and C. You. 2012. Consumer Behavior and Perception of
Marketing Strategy for Amusement parks: A case study of Taiwan. African Journal of Business Management,Vol. 6(14), pp. 4795-4803, 11 April, 2012
Liu, J.C. 1986. „Relative economic contributions of visitor groups in Hawaii‟,
Journal of Travel Research, Vol 25, No 1, pp 2–9. Lejarraga, I. and P. Walkenhorst. 2010. On Linkages and Leakages: Measuring
The Secondary Effects of Tourism. Applied Economics Letters Journal. 17. 417-421.
Lonergan, B. (nd). Income Distribution and Growth: Ideas from Bernard Thomas More Institute, Montreal.
Loureiro, M.L. and J.J. McCluskey. 2000. Assessing Consumer Response to
Protected Geographical Indication Labeling. Agribusiness 16(3): 309-320. Lundberg, D., Krishnamoorthy, E.M., and Stavenga, M. H. 1991. Tourism
Economics, John Wiley. New York. Martín, R. H. 2007. Tourism Event: Impact On Import. International Journal of
Event Management Research, (3): 1. University of La Laguna. Spain. www.ijemr.org
McGahey, S. 1996. Tourism: The Multiplier Effect and Leakage. [cited on 2011
Des. 31]. Available from: URL : http://www.uog.edu/sbdc/journals/mcgahey96.htm, accessed 29 May 2001.
Marvel, A. 2011. The Role of Tourism in Development: Enhancing Foreign
Exchange Earnings. [cited 2011 Jun. 5] Available from: (www.ga-conf11marvell-1.ppt).

310
Marcouiller, D.W. 2008. Distribution of Income from Tourism Sensitive Employment. Journal of Tourism Economics, 14 (3), 545–565.
Mathieson, A. and G. Wall. 1992. Tourism: Economic, Physical and Social
Impacts. Longman. Mbaiwa. J.E. 2005. Enclave tourism and its socio-economic impacts in the
Okavango Delta, Botswana. Journal of Tourism Management, 26: 157-172.
McGehee, N. G. 2007. An Agritourisms Systems Models Model; Journal of
AWeberian Perspective.15(2).111-122. McIntosh, R.W., & Goeldner, C.R. 1995. Tourism Principles, Practices,
Philosophies, 7th ed. New York: John Wiley & Sons, Inc. Meng, S. M., G.S. Liang and S. H. Yang. 2011. The Relationships of Cruise
Image, Perceived Value, Satisfaction and Post-Purchase Behaviour Intention on Taiwanese Tourists. African Journal of Business
Management, 5.1: 19-29.
Merta, W. 2011. The Impact of Increasing Tourism Output on Socio-Economic
Condition of Community in Bali Province. Social Accounting Matrix Approaches. Ubpublished Master Disertation. Postgraduate Studies. Udayana University. Denpasar, Bali
Meyer, D. 2007. Pro-Poor Tourism: From Leakages to Linkages. A Conceptual
Framework for Creating Linkages between the Accommodation Sector and „Poor‟ Neighbouring Communities. Current Issues in Tourism
Journal. 10(6): 558-583.
Middleton, V. T. C and J. Clarke. 2001. Marketing for Travel and Tourism.
3rdEdition.Butterworth-Heinemann.
Mill, R. C., and A.M. Morrison. 2009. The Tourism System. Kendall Hunt Publishing Company. The United States of America.
Milne, S. S. 1987. Differential Multipliers. Annals of Tourism Research
14(4):499-515. Mitchell, R.K., B.R. Agle, D.J Wood. 1997. Toward a Theory of sSakeholder
Identification and Salience: defining the principle of who and what really counts. Academy of Management Review 22, 853–886.
Nagashima, A. 1990. A comparison of Japanese and US attitudes toward foreign
products. The Journal of Marketing, 68-74. 1990. http://dx.doi.org/10.2307/1250298
311
Nazara, S. 1997. Input-Output Analysis. Faculty of Economic University of Indonesia Publisher. Jakarta. Indonesia.
Newman, W.L. 1994. Social Research Methods. Qualitative and Quantitative
Approaches. Second Edition. A Division of Simon & Achuster, Inc. 160 Gould Street, Needham Heights, Massachusetts, USA
Neuman, L., & Neumann, Y. 1981. Comparison of six lengths of rating scales:
students‟ attitudes toward instruction. Psychological Reports, 48, 399-404.
Nopirin. 1995. International Economic. Third Edition. BPFE Yogyakarta.
Indonesia Nursetyohadi, D. 2009. Dampak Kebijakan Sektor Pertanian Terhadap Kondisi
Sosial Ekonomi Propinsi Bali. Pendekatan Sosial Accounting Matrix. Thesis. Program Pascasarjana Uniersitas Udayana, Denpasar, Bali
Okerson, B. B. 2011. PaperJP-03JMP®ing In: A SAS® Programmer's Look at
JMP Barbara B. Okerson WellPoint, Richmond, VA. http://analytics.ncsu.edu/sesug/2011/JP03.Okerson.pdf). (cited 9 December 2013).
Parasuraman, A., V. A. Zeithaml, and U. Berry. 1985. A Conceptual Model of Service Quality and its Implication for Future Research. Journal of
Marketing. 49: 41-50.
Pavaskar, M. 1987. Employment effects of tourism and the Indian experience.
Journal ofTravel Research. Fall, 32–38.and Imported Orange in Badung
Market. Unpublished Thesis. Department of Agribusiness Udayana
University.
Peattie, K. 1999. Trappings versus substance in the greening of marketing planning. Journal of Strategic Marketing, Vol. 7, pp. 131-48.
Peraturan Menteri Nomor 02/MEN/III/2008 tentang Tatacara Penggunaan Tenaga Kerja Asing.
Peraturan Presiden Nomor 75/1995 tentang Penggunaan Tenaga Kerja Asing.
Platullo, P. 1996. Last Resorts – The Cost of Tourism in the Caribbean, Cassell, Wellington House, London.
Porter, M.E., 1985. Competitive Advantage. The Free Press. New York.

312
Putra, I N. D. and M. Hitchcock.2006. The Bali Bombs and the Tourism Development Cycle. Progress in Development Studies6, 2, pp.1–10.
Qureshi M.N., Kumar D. and Kumar P. 2007. Modeling the Logistics
Outsourcing Relationships Variables to Enhance Shippers Productivity and Competitiveness in Logistics Supply Chain, International Journal of
Production and PerformanceManagement, 56(8), 689-714. Reza, S., Tabrizi, Y.P. Foong, N. Ebrahimi. 2010. Determine the Relationships
among Knowledge Management Criteria inside Malaysian Organizations. World Academy of Science, Engineering and Technology 48, 2010.
Richard, L., Celsi and Jerry C. Olson. 1998. The role of Involvement in
Attention and Comprehension Processes. Journal of Consumer
Research: 210-224. Rodenburg, E. 1980.Evaluation of The Social Economic Affects of the Three
Scales. Annals of Tourism Research, 7(2):177-196. Department of Anthropology University of California.USA.
Roth, K.P. & A. Diamantopoulos. 2009. Advancing the country image construct.
Journal of Business Research, 62(7), 726-740. Ruffin , R.J. 2002. David Ricardo‟s Discovery of Comparative Advantage,
History of Political Economy, vol. 34, Winter 2002,pp. 727–48. Ryan, C. 1991. Recreational Tourism. London: Routledge. Reid, R.D and D.C. Bojanic. 2010. Hospitality Marketing Management. John
Wiley & Sons, Inc. Fifth Edirion. Reisinger, Y. 2009. International Tourism. Cultural and Behavior. Elsevier.
USA. Saxena J.P., Sushil and Vrat P. 1990. The impact of indirect relationships in
classification of variables: A MICMAC analysis for energy conservation, System Research, 7(4), 245-253 (1990).
Scheyvens , R. and M. Russel. 2012. Tourism and poverty Alleviation in Fiji:
Comparing the impacts of Smalland large-scale Tourism Enterprises. Journal of Sustainable Tourism, 20: 417-436.
Senge, P. M. 1994. The Art and Practice of The Learning Organization. The fifth
discipline. New York: Doubleday

313
Seiler, J. H., & Kowalsky, M. 2011. Systems Thinking Evidence from Colleges of Business and their Universities. American Journal of Business
Education, 4(3), 55-61. Sharma H.D., Gupta A.D. and Sushil. 1995. The Objectives of Waste
Management in India: A Future Inquiry, Technological Forecasting and Social Change, 48, 285–309.
Simamora, B. 2004. Panduan Riset Perilaku Konsumen. PT. Gramedia Pustaka
Utama. Jakarta Smeral, E. 2006. Tourism Satellite Accounts: A Critical Assessment. Journal of
Travel Research (45): 92. [cited 2012 Jan 10]. Available from URL: http://jtr.sagepub.com/cgi/content/ abstract/45/1/92.
Sevilla, C.G., J.A. Ochava, T.G. Punsalam, B.P. Regala and G.G. Uriarte. 1993.
Research Method. University of Indonesia. Smith, C. & Jenner, P. 1992. The Leakage of Foreign Exchange Earnings from
Tourism. EIU Travel & Tourism Analyst, No. 3, 52-66. Sukirno. 2010. Macro Economic. Third Edition. Rajagrafindo Perkasa. Jakarta.
Indonesia Solomon, M. 1999. Consumer Behaviour: Buying, Having and Being. Fourth
Edition. Prentice Hall. Upper Saddle River, New Jersey. Som, A.P.M., and M. Bader Badarneh. 2011. Tourist Satisfaction and Repeat
Visitation: Toward a New Comprehensive Model. International Journal
of Human and Social Sciences. (6):1. 38-45. Supradist, N. 2004. Economic leakage in tourism sector. Thesis for the fulfilment
of the Master of Science in Environmental Management and Policy Lund, Sweden, October 2004.
Swarbrooke, J. and Susan Horner. 2009. Consumer Behaviour in Tourism.
Second Edition. British Library Cataloguing in Publicing Data. Synman, S.L. 2012. The Role of Tourism Employment in Poverty Reduction and
Community Perceptions of Conservation and Tourism in Southern
Africa. Journal of Sustainable Tourism, 20: 395-416.
Telfer, D.J. & W, Geoffrey. 2000. Strengthening backward economic linkages: Local food purchasing by three Indonesian hotels. Tourism Geographies 4, 421. Retreived February 5, 2005, from EBSCO database.
314
Telfer, DJ. 2000. Tastes of Niagara: Building Strategic Alliances Between Tourism and Agriculture. International Journal of Hospitality and Tourism Administration 1. 71-88.
Theobald, W. F. 2005. Global Tourism. Third Edition. Elsevier, Inc., Burlington, USA.
Timothy, J. T., Y. Androbert and Johnstona. 2001. Framework for Assessing
Direct Economic. Impacts of Tourist Events: Distinguishing Origins, Destinations, and Causes of Expenditures. Sage Publications. Journal of
Travel Research 40(8): 94-100. Thorbecke, E. 1988. The Social Accounting Matrix and Consistency Type, in
Social accounting Matrices: A Basic for Planning. G. Pyatt and J.I. Round (eds). The World Bank, Washington, DC.
Thorbecke, E. 1991. Structural Adjustment and Rationalization of The Public
Sector in Indonesia, 1983-1988. Paper Presented for Senior Policy Conference in Caracasm Venezuela.
Thorbecke, E., C. Morrison, R. Downey, B. K. David., and Roand-Holst, 1992.
Adjustment and Equity in Indonesia. Development Centre of The Organization for Economic Co-Operation and Development. Paris. Franee.
Thorbecke, E. 2000. The Use of Social Accounting Matrices in Modeling. Paper
Prepared for the 26th General Conference of The International Association for Research in Income and Wealth Cracow, Poland, 27 August to 2 September 2000. Cornell University, Ithaca, NY 14853 USA.
Thorbecke, E. 2001. The Social Accounting Matrix: Deterministic or Stochactic
Concept. Paper Prepare for a Conference in Honour of Graham Pyatt‟s retirement, at the Instutute of Social Studies, The Hague, Netherlands.
Torres, R. 2002. Toward a better understanding of Tourism and agriculture linkages in the Yucatan: Tourist Food Consumption and Preferences. Tourism Geographies, 4, 282-306.
Undang Undang Nomor 10/Tahun 2009 tentang Kepariwisataan
Undang Undang Nomor 13/Tahun 2003 tentang Ketenagakerjaan
United Nation-Economic Comission for Latin and Thr Caribbean. 2010. Economic Survey for The Caribbean 2009-2010. UN-Report.

315
UNEP (United Nation Environment Program). 2010. Tourism and Sustainability. [cited 2012 Feb. 10]. Available from URL: http://www.unep.fr/scp/tourism/sustain/ikarempacts/ economic/ negative.htm.
UNEP (United Nation Environment Program). 2011. Green Economy. Tourism
Investing in Energy and Resource Efficiency.[cited 2012 August. 18]. Available from URL: http://www.grida.no/news/press/3469.aspx
Unluonen, K., A. Kiliclair and S. Yukel. 2011. The Calculation Approach for
Leakages of International Tourism Receipts: The Turkish Case. Tourism
Economics Journal. 17(4): 785-802. UNWTO. 2007. A Practical Guide to Tourism Destination Management. United
Nation World Tourism Organisation, Madrid. UNWTO. 2010. Questionnaire on Tourism and Employment: Overview of
Results: UNWTO Statistics and Tourism Satellite Account (TSA) Programme. Ministers Meeting – Republic of Korea. 11 – 13 October 2010. [cited 2011 Nop. 14]. Available from URL: http://t20.unwto.org/sites/all/files/docpdf.
UNWTO. 2011. UNWTO Tourism Highlight. [cited 2012 Augst 16]. Available
from URL: http://www.UNWTO highlights11enhr.pdf. UNWTO. 2012. Sustainable Development. [cited 2011 Nop. 14]. Available from
UR:http://sdt.unwto.org/en/ content/about-us-5. Wheeler, M. 1993. Tourism marketers in local government. Annals of Tourism
Research, Vol. 20, pp. 354-6. WTO Agreement. [cited 2013 December 14]. (http://www.dw.de/wto-bali-
agreement-expected-to-boost-growth/a-17278088). Var, T., and Quayson, J. 1985, „The multiplier impact of tourism in the
Okanagan‟, Annals of Tourism Research, Vol 12, No 12, pp 497–514.
Vinson, D.E, J. E. Scott, L. M. Lamont. 2007. The Role of Personal Values in
Marketing and Consumer Behavior. Journal of Marketing, 41(2): pp. 44-50. Published by: American Marketing Association
Waldman, J.D. 2007. Thinking Systems Need Systems Thinking. Systems
Research & Behavioral Science, 24(3), 271-284. Waite, M and S. Hawker. 2009. Oxford Paperback Dictionary & Thesaurus.
Oxford Univerity Press.

316
Watson R., 2005. Interpretive Structural Modeling: A Useful Tool for Worth
Assessment Technological Forecasting and Social Change: 11(165-185) WCED (The World Commission on Environment And Development. 1987. Our
Common Future. New York: Oxford University Press. Wearing, S. and S. Archer. 2000. Towards a framework for sustainable marketing
of protected areas. Australian Parks and Recreation Journal, Vol. 4 No. 1, pp. 33-40.
Westbrook, R. A. 1980. A Rating Scale for Measuring Product/Service
Satisfaction. Journal of Marketing. Vol. 44 (Fall. 1980): 68-72 Wheatcroft, S. 1998. The airline industry and tourism. In Ioannides, D. and K.G.
Debbage (eds). The Economic Geography of The Tourist Industry. 159-179. London: Routledge.
Wiranatha, Agung Suryawan. 2001. A Systems Model For Regional Planning
towards Sustainable Development in Bali, Indonesia. Unpublished Ph.D. Thesis. Department of Geographical Sciences and Planning. The University of Queensland. Australia.
Wiranatha, A.S. and A.A.G.R. Dalem. 2010. Implementation of Local
Knowledge “Tri Hita Karana” on Ecotourism Management in Bali. Journal on Socio-Economics of Agriculture and Agribusiness. Vol 10 (1). 14 February 2010.
Wolstenholme, E. 2000. Are We any Nearer Implementing System Concepts in
Business and Government? Conference Proceedings of The International Conference on System Thinking in Management (ICSTM). 2000. Geelong: Deaking University.
World Tourism Organization (WTO). 1991. A Proposal for a Satellite Account
and Information System for Tourism. International Conference on Travel and Tourism Statistics, WTO Press, Madrid.
World Tourism Organization (WTO). 1996. Agenda 21 for the Travel and
Tourism Industry: Toward Sustainable Development. Madrid: World Tourism Organization.
World Tourism Organization (WTO). 1997. International Tourism: A Global
Perspective. Chuck, Y.G. (Eds). WTO Tourism Education and Training Series.

317
World Tourism Organisation (WTO). 2007. A Practical Guide to Tourism Destination Management.
Yamane. 1973. Determining Sample Size. Chapter 3. Methodology. [cited 2012
Jun. 6]. Available from URL: www.thapra.lib.su.acth/objects/thesis/fulltex/thapra/.../chapter3.pdf.
Zeithaml, V., Bitner, M.J., & Gremler, D.D. 2006. Services marketing, integrating
customer focus across the firm. New York: McGraw-Hill Zhang, S. 2004. The Link between Trade and Income: Export Effect, Import
Effect, or Both. Department of Economics and Business. State University of New York at Fredonia. Thompson Hall, Fredonia, New York
Zheng, Z. 2011. Strategies for Minimizing Tourism Leakages in Indo-Chinese
Development Countries. Asia Pacific Journal of Tourism Research.5(2): 11-20.
Zikmund, G.W. 1997. Business Research Methods. The Dryden Press. Fort
Worth. Texas. Zortuk, M. 2009. Economic Impact of Tourism on Turkey‟s Economy: Evidence
from Cointegration Tests. International Journal of Finance and
Economic. (25): 232-239. http://www.eurojournals.com/finance.htm.

318
Appendix 2.1 The Basic Social Accounting Matrix Expenditures
1 2a 2b 3 4 5 6
Factors of production
Institutions Production activities
Rest of the world combined account
Totals Current accounts Combined capital account Households Companies Government
Rec
eip
ts
1 Factors of production Value added payments to factors
Net factor income received from abroad
Incomes of the domestic factors of production
2a
Inst
itu
tion
s
Cu
rren
t ac
coun
ts
Households Allocation of labour income to household
Current transfers between households
Profits distributed to domestic households
Current trans-fers to domestic households
Net non-factor incomes received from abroad
Incomes ofthe domestic institutions after transfers
2b Companies
Allocation of operatingsurplus to companies
Current trans-fers to domestic companies
3 Government
Direct taxes on income and indirect taxes on current expenditures
Direct taxes on companies plus operating surplus of state enterprises
Indirect taxes on capital goods
Indirect taxes on inputs
Net non-factor incomes received plus indirect taxes on exportd
4 Combined capital account
Household savings
Undistributed profits after tax
Gov’t current account surplus
Net capital rec’d from abroad
Aggregate savings
5 Production activities Household con-sumption expend. on dom. goods
Government current expenditure
Investment expenditures on domestic goods
Raw material purchases of domestic goods
Exports
Aggregate
demand gross outputs
6 Rest of the world combined account
Household con-sumption expend. on imp. goods
Imports of capital goods
Imports of raw materials
Imports
Totals Incomes of the domestic factors of production
Total outlay of households
Total outlay of companies
Total outlay of government
Aggregate Investment
Total costs Total foreign exchange receipts
Source : Thorbecke (2000)
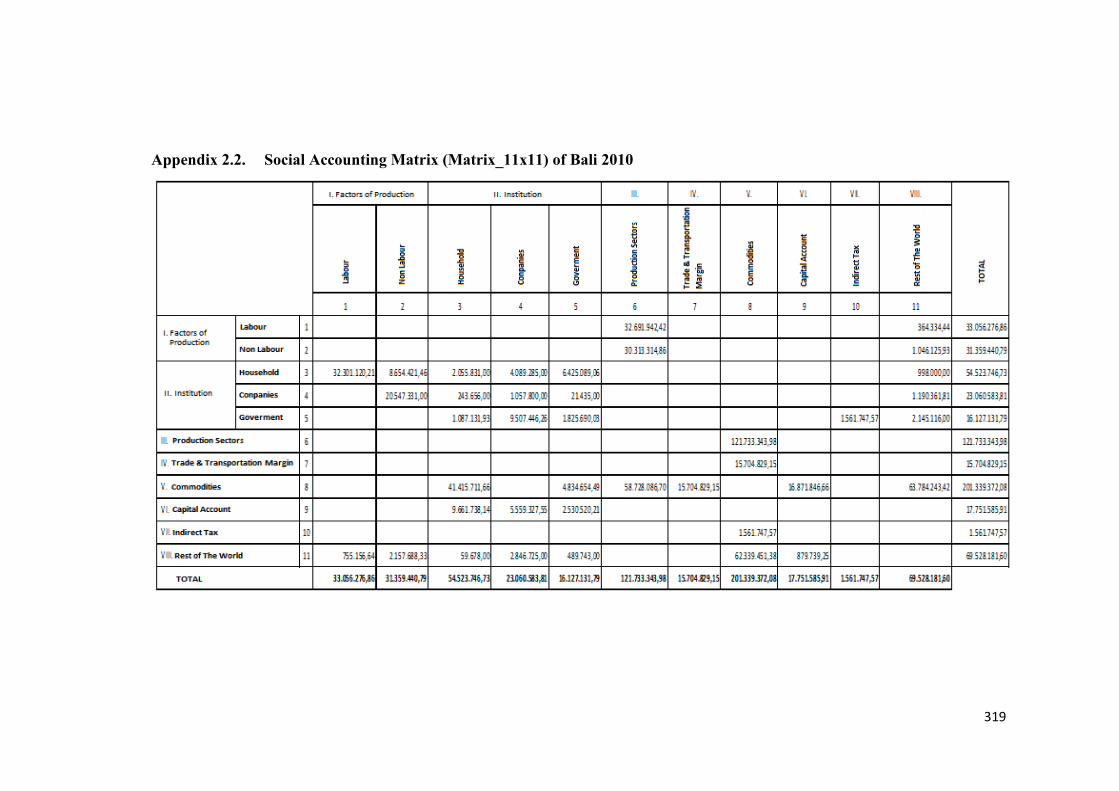
319
Appendix 2.2. Social Accounting Matrix (Matrix_11x11) of Bali 2010
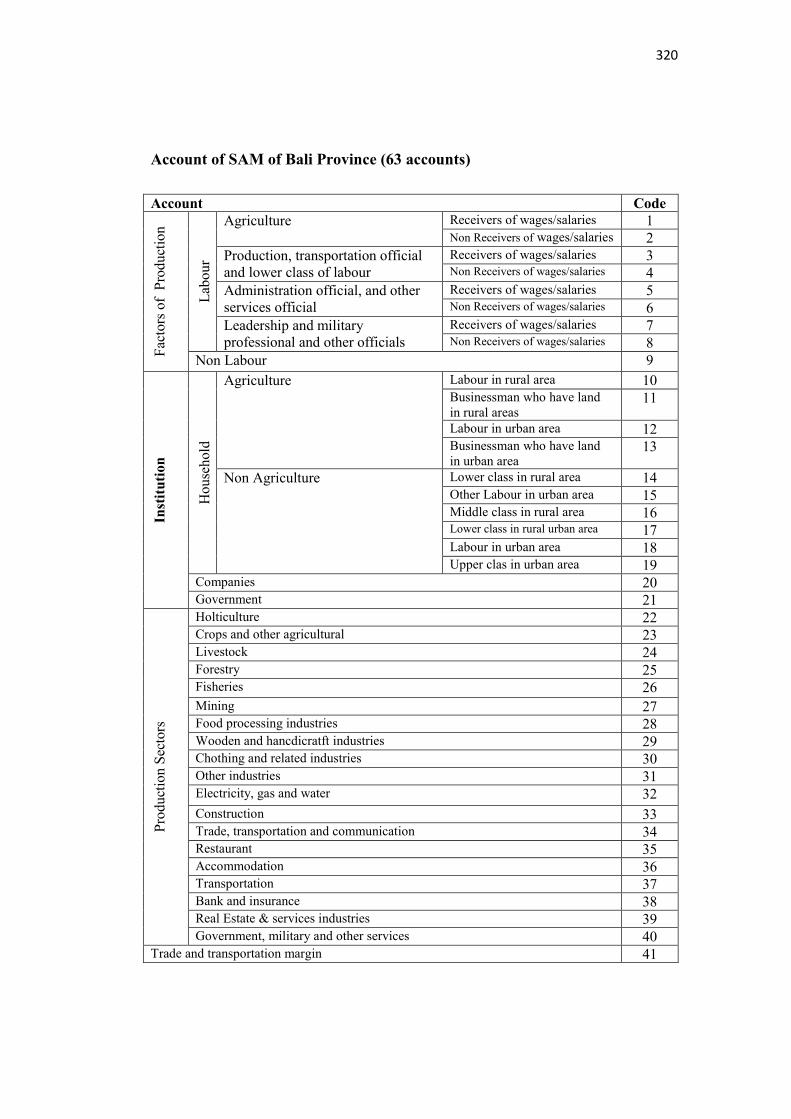
320
Account of SAM of Bali Province (63 accounts)
Account Code
Fac
tors
of
Pro
duct
ion
Lab
our
Agriculture Receivers of wages/salaries 1 Non Receivers of wages/salaries 2
Production, transportation official and lower class of labour
Receivers of wages/salaries 3 Non Receivers of wages/salaries 4
Administration official, and other services official
Receivers of wages/salaries 5 Non Receivers of wages/salaries 6
Leadership and military professional and other officials
Receivers of wages/salaries 7 Non Receivers of wages/salaries 8
Non Labour 9
Inst
itut
ion
House
hold
Agriculture Labour in rural area 10 Businessman who have land in rural areas
11
Labour in urban area 12 Businessman who have land in urban area
13
Non Agriculture Lower class in rural area 14 Other Labour in urban area 15 Middle class in rural area 16 Lower class in rural urban area 17 Labour in urban area 18 Upper clas in urban area 19
Companies 20 Government 21
Pro
duct
ion S
ecto
rs
Holticulture 22 Crops and other agricultural 23 Livestock 24 Forestry 25 Fisheries 26
Mining 27 Food processing industries 28 Wooden and hancdicratft industries 29 Chothing and related industries 30 Other industries 31 Electricity, gas and water 32
Construction 33 Trade, transportation and communication 34 Restaurant 35 Accommodation 36 Transportation 37 Bank and insurance 38 Real Estate & services industries 39 Government, military and other services 40
Trade and transportation margin 41

321
Co
mm
od
itie
s Holticulture 42
Crops and other agricultural 43
Livestock 44
Forestry 45
Fisheries 46
Mining 47
Food processing industries 48
Wooden and hancdicratft industries 49
Clothing industry 50
Other industries 51
Electricity, gas and water 52
Construction 53
Trade, transportation and communication 54
Restaurant 55
Accommodation 56
Transportation 57
Bank and insurance 58
Real Estate & services industries 59
Government, military and other services 60
Capital account 61
Indirect tax 62
Rest of the World 63
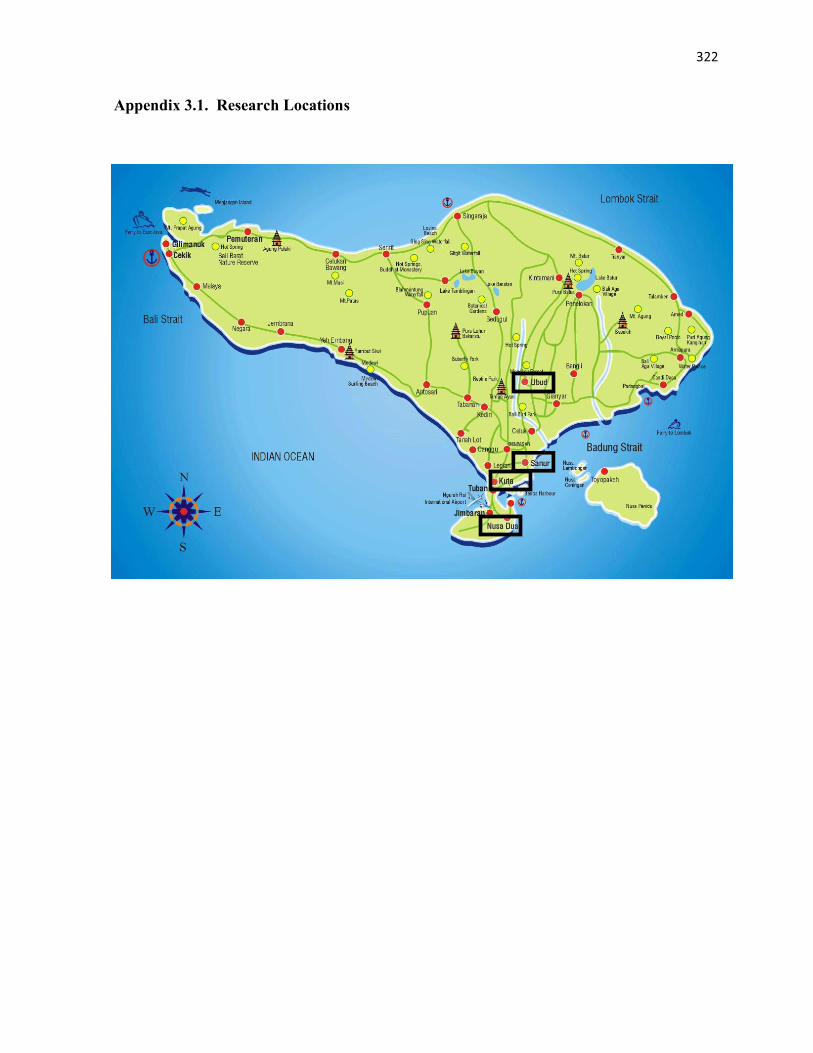
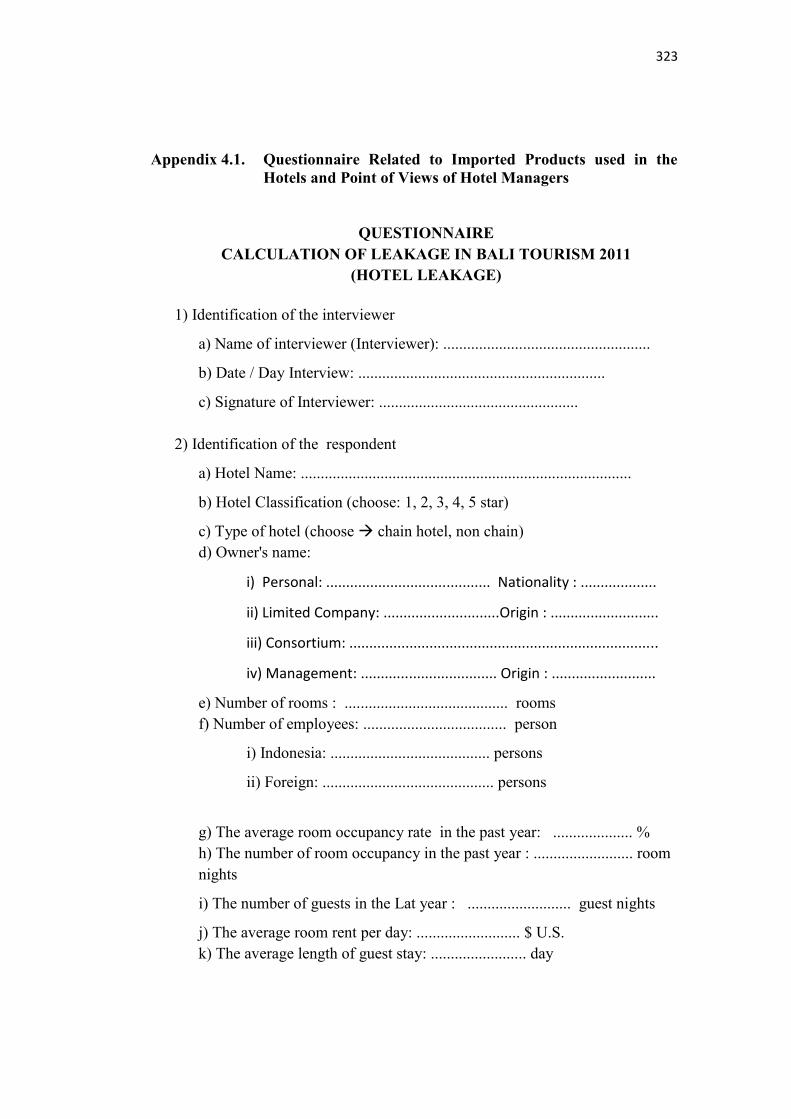
323
Appendix 4.1. Questionnaire Related to Imported Products used in the Hotels and Point of Views of Hotel Managers
QUESTIONNAIRE CALCULATION OF LEAKAGE IN BALI TOURISM 2011
(HOTEL LEAKAGE)
1) Identification of the interviewer
a) Name of interviewer (Interviewer): ....................................................
b) Date / Day Interview: ..............................................................
c) Signature of Interviewer: ..................................................
2) Identification of the respondent
a) Hotel Name: ...................................................................................
b) Hotel Classification (choose: 1, 2, 3, 4, 5 star)
c) Type of hotel (choose chain hotel, non chain)
d) Owner's name:
i) Personal: ......................................... Nationality : ...................
ii) Limited Company: .............................Origin : ...........................
iii) Consortium: .............................................................................
iv) Management: .................................. Origin : ..........................
e) Number of rooms : ......................................... rooms
f) Number of employees: .................................... person
i) Indonesia: ........................................ persons
ii) Foreign: ........................................... persons
g) The average room occupancy rate in the past year: .................... %
h) The number of room occupancy in the past year : ......................... room
nights
i) The number of guests in the Lat year : .......................... guest nights
j) The average room rent per day: .......................... $ U.S.
k) The average length of guest stay: ........................ day

324
3) Type and Large imports (purchases from abroad)
No Type of import product Amount Unit Price per
unit
Value (US $) Preferences (reason, choosing imported products)
1 Food Import
a) Meat:
Beef Lamb Chicken Pork Others ........ b) Fisheries Imports • Fish (fish) • Shrimp (prawn) • Lobster • The cuttlefish (squid) • Octopus (octopus) • Others ................. c) Import of processed
foods
• Cheese (cheese) • Macaroni • Olive oil • Butter • Sauce • Mayonnaise • Spaghetti • Pasta • Jam • Tomato paste • Salad oil • Mozarella • Sundried tomato • Salami • Tabasco • Origano • Asparagus • frozen Spinach • Fettucini • Sunflower seeds • Tempura • Ice cream • Samosa Curry • Others: .................

325
No Product Type Import Amount
Unit Price per unit
Value (US $) Preferences (Reason, choosing imported products)
2 Imported Drinks (Beverages):
a) Beverage Import (Dairy Products):
• Fresh milk
• Youghurt
• Juice
• Other: ...............
b) Imported Alcoholic Drinks:
• Wine
• Beer
• Alcoholic drinks (liquors)
• Other: ................
c) Imported Drinks Other:
3 Imported Fruit and Vegetables
a) Imported Fruits:
• Fruit .................... • Fruit .................... • Fruit ....................
b) Imported Vegetables:
• Vegetable ....... • Vegetable ....... • Vegetables.......
4 Imported Tools Kitchen (Utensils):
Household Utensils
• Stove
• Pan
• Frying pan
• Mixer
• Blender
• Cooker
• Microwave
• Oven
• Other: ..........
b) Imported China and Silver wear
• Plates
• Glass • Cups
• Cutleries
• Mugs
Others: .................
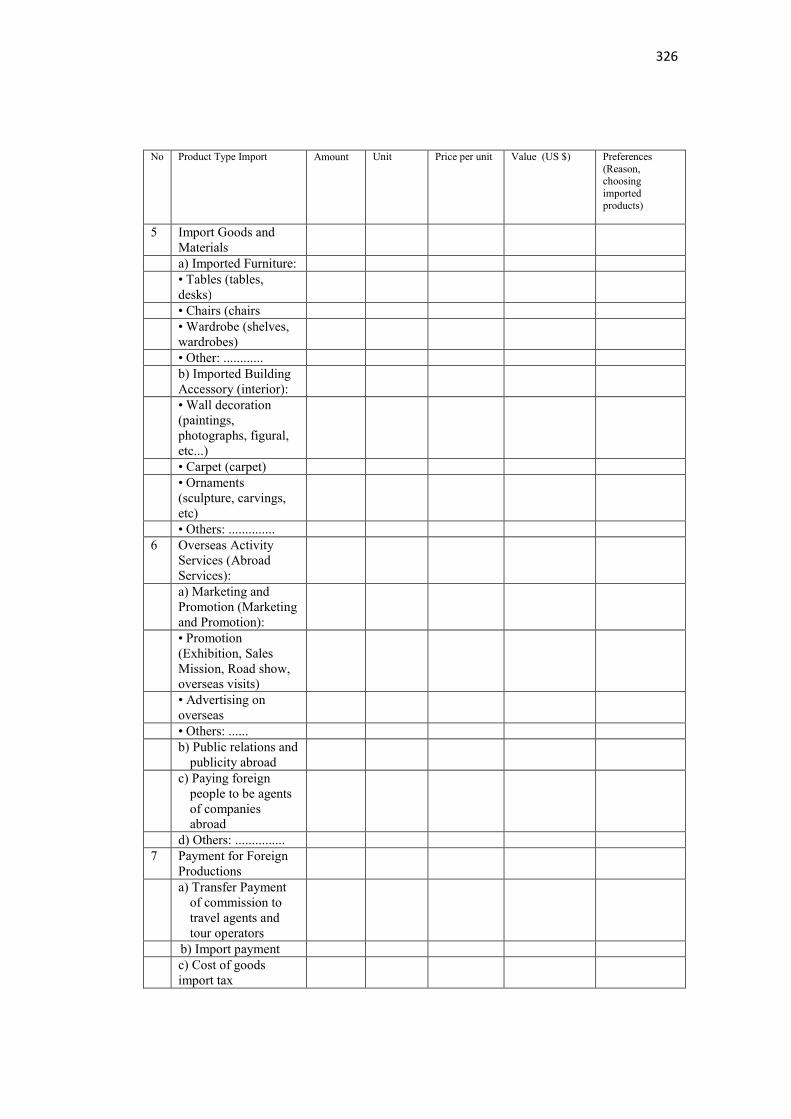
326
No Product Type Import Amount
Unit Price per unit Value (US $) Preferences (Reason, choosing imported products)
5 Import Goods and Materials
a) Imported Furniture:
• Tables (tables, desks)
• Chairs (chairs
• Wardrobe (shelves, wardrobes)
• Other: ............
b) Imported Building Accessory (interior):
• Wall decoration (paintings, photographs, figural, etc...)
• Carpet (carpet)
• Ornaments (sculpture, carvings, etc)
• Others: ..............
6 Overseas Activity Services (Abroad Services):
a) Marketing and Promotion (Marketing and Promotion):
• Promotion (Exhibition, Sales Mission, Road show, overseas visits)
• Advertising on overseas
• Others: ......
b) Public relations and publicity abroad
c) Paying foreign people to be agents of companies abroad
d) Others: ...............
7 Payment for Foreign Productions
a) Transfer Payment of commission to travel agents and tour operators
b) Import payment
c) Cost of goods import tax
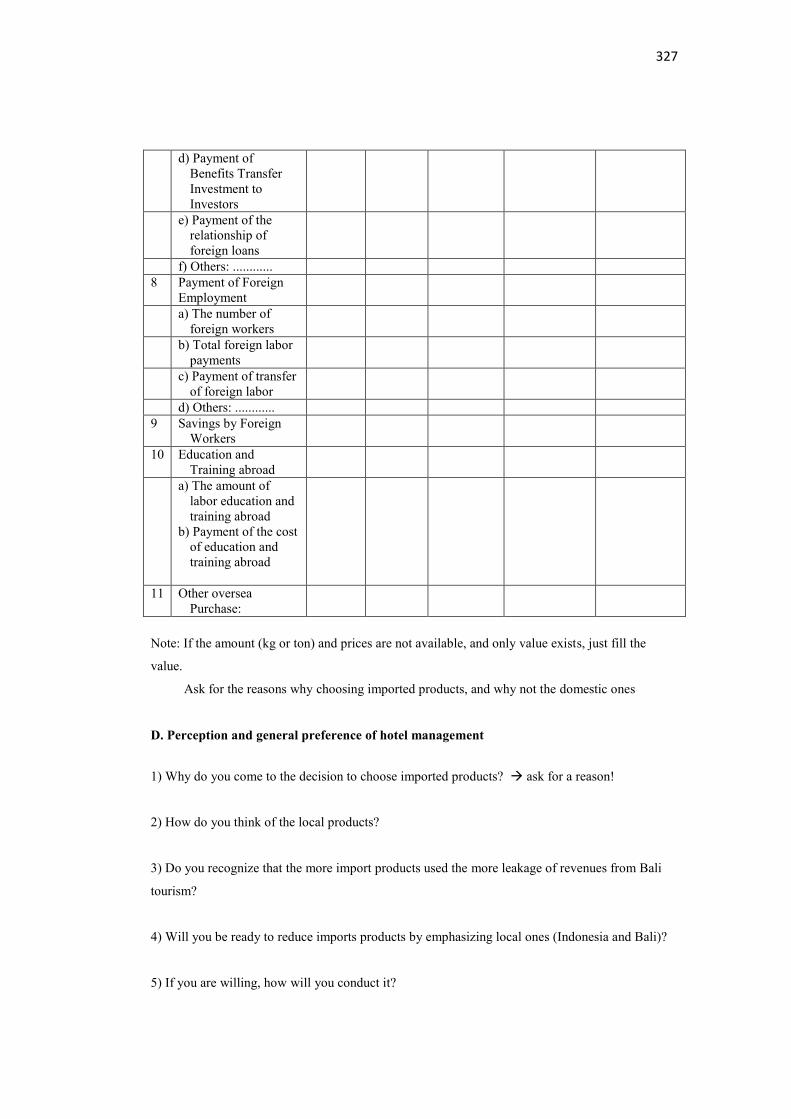
327
d) Payment of Benefits Transfer Investment to Investors
e) Payment of the relationship of foreign loans
f) Others: ............
8 Payment of Foreign Employment
a) The number of foreign workers
b) Total foreign labor payments
c) Payment of transfer of foreign labor
d) Others: ............
9 Savings by Foreign Workers
10 Education and Training abroad
a) The amount of labor education and training abroad
b) Payment of the cost of education and training abroad
11 Other oversea Purchase:
Note: If the amount (kg or ton) and prices are not available, and only value exists, just fill the
value.
Ask for the reasons why choosing imported products, and why not the domestic ones
D. Perception and general preference of hotel management
1) Why do you come to the decision to choose imported products? ask for a reason!
2) How do you think of the local products?
3) Do you recognize that the more import products used the more leakage of revenues from Bali
tourism?
4) Will you be ready to reduce imports products by emphasizing local ones (Indonesia and Bali)?
5) If you are willing, how will you conduct it?
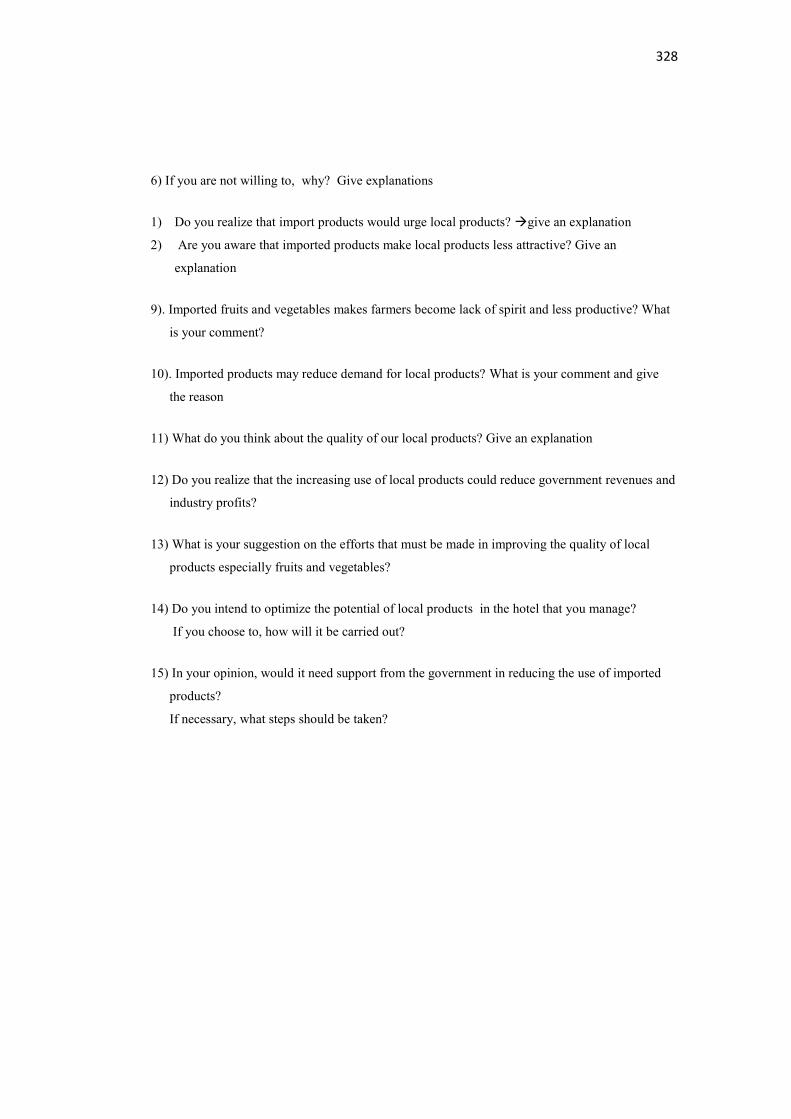
328
6) If you are not willing to, why? Give explanations
1) Do you realize that import products would urge local products? give an explanation
2) Are you aware that imported products make local products less attractive? Give an
explanation
9). Imported fruits and vegetables makes farmers become lack of spirit and less productive? What
is your comment?
10). Imported products may reduce demand for local products? What is your comment and give
the reason
11) What do you think about the quality of our local products? Give an explanation
12) Do you realize that the increasing use of local products could reduce government revenues and
industry profits?
13) What is your suggestion on the efforts that must be made in improving the quality of local
products especially fruits and vegetables?
14) Do you intend to optimize the potential of local products in the hotel that you manage?
If you choose to, how will it be carried out?
15) In your opinion, would it need support from the government in reducing the use of imported
products?
If necessary, what steps should be taken?
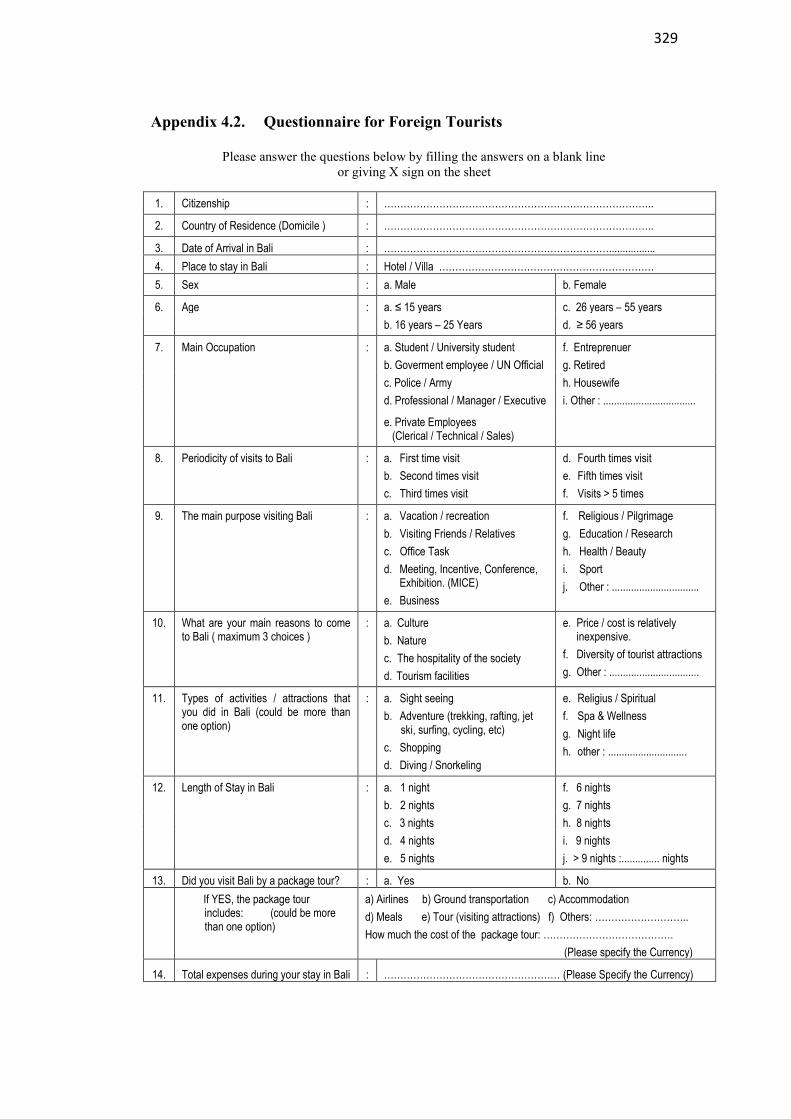
329
Appendix 4.2. Questionnaire for Foreign Tourists
Please answer the questions below by filling the answers on a blank line or giving X sign on the sheet
1. Citizenship : ………………………………………………………………………..
2. Country of Residence (Domicile ) : ………………………………………………………………………..
3. Date of Arrival in Bali : …………………………………………………………….................
4. Place to stay in Bali : Hotel / Villa …………………………………………………………
5. Sex : a. Male b. Female
6. Age : a. ≤ 15 years c. 26 years – 55 years
b. 16 years – 25 Years d. ≥ 56 years
7. Main Occupation : a. Student / University student f. Entreprenuer
b. Goverment employee / UN Official g. Retired
c. Police / Army h. Housewife
d. Professional / Manager / Executive i. Other : ..................................
e. Private Employees (Clerical / Technical / Sales)
8. Periodicity of visits to Bali : a. First time visit
b. Second times visit
c. Third times visit
d. Fourth times visit
e. Fifth times visit
f. Visits > 5 times
9. The main purpose visiting Bali : a. Vacation / recreation
b. Visiting Friends / Relatives
c. Office Task
d. Meeting, Incentive, Conference, Exhibition. (MICE)
e. Business
f. Religious / Pilgrimage
g. Education / Research
h. Health / Beauty
i. Sport
j. Other : ................................
10. What are your main reasons to come to Bali ( maximum 3 choices )
: a. Culture
b. Nature
c. The hospitality of the society
d. Tourism facilities
e. Price / cost is relatively inexpensive.
f. Diversity of tourist attractions
g. Other : .................................
11. Types of activities / attractions that you did in Bali (could be more than one option)
: a. Sight seeing
b. Adventure (trekking, rafting, jet ski, surfing, cycling, etc)
c. Shopping
d. Diving / Snorkeling
e. Religius / Spiritual
f. Spa & Wellness
g. Night life
h. other : .............................
12. Length of Stay in Bali : a. 1 night f. 6 nights
b. 2 nights g. 7 nights
c. 3 nights h. 8 nights
d. 4 nights i. 9 nights
e. 5 nights j. > 9 nights :.............. nights
13. Did you visit Bali by a package tour? : a. Yes b. No
If YES, the package tour includes: (could be more than one option)
a) Airlines b) Ground transportation c) Accommodation
d) Meals e) Tour (visiting attractions) f) Others: ………………………..
How much the cost of the package tour: ………………………………….
(Please specify the Currency)
14. Total expenses during your stay in Bali : ……………………………………………… (Please Specify the Currency)
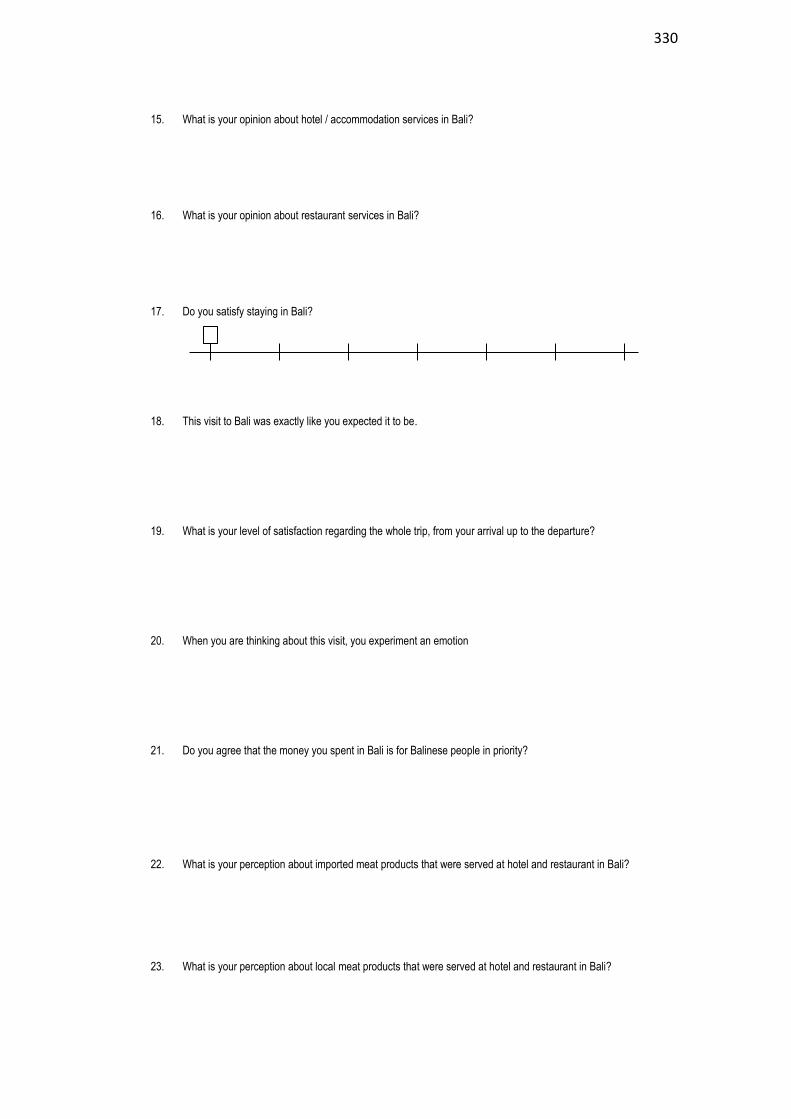
330
15. What is your opinion about hotel / accommodation services in Bali? 16. What is your opinion about restaurant services in Bali? 17. Do you satisfy staying in Bali? 18. This visit to Bali was exactly like you expected it to be. 19. What is your level of satisfaction regarding the whole trip, from your arrival up to the departure? 20. When you are thinking about this visit, you experiment an emotion 21. Do you agree that the money you spent in Bali is for Balinese people in priority?
22. What is your perception about imported meat products that were served at hotel and restaurant in Bali?
23. What is your perception about local meat products that were served at hotel and restaurant in Bali?
1 2 3 4 5 6 7
Extremely dissatisfied
Dissatisfied Slightly dissatisfied
Mixed dissatisfied and
satisfied
Slightly Satisfied
Satisfied Extremely satisfied
1 2 3 4 5 6 7
Extremely disagree
Disagree Slightly disagree
Mixed (disagree and
agree)
Slightly agree
Agree Extremely agree
1 2 3 4 5 6 7
Extremely poor
Very poor Poor Fair Good Very Good Extremely Good
1 2 3 4 5 6 7
Extremely poor
Very poor Poor Fair Good Very Good Extremely Good
1 2 3 4 5 6 7
Extremely dissatisfied
Dissatisfied Slightly dissatisfied
Mixed (dissatisfied and
satisfied
Slightly satisfied
Satisfied Extremely satisfied
1 2 3 4 5 6 7
Very displeased
Displeased Slightly displeased
Mixed (displeased
and pleased)
Slightly pleased
Pleased Very pleased
1 2 3 4 5 6 7
Extremely disagree
Disagree Slightly disagree
Mixed (disagree and agree)
Slightly agree
Agree Extremely agree
1 2 3 4 5 6 7
Extremely poor
Very poor Poor Fair Good Very Good Extremely good
1 2 3 4 5 6 7
Extremely poor
Very poor Poor Fair Good Very Good Extremely good

331
24. What kind of meat products do you prefer?
a. Imported meat products b. Local meat products
25. What is your perception about imported fishery products that were served at hotel and restaurant in Bali?
26. What is your perception about local fishery products that were served at hotel and restaurant in Bali?
27. What kind of fishery products do you prefer?
a. Imported fishery products b. Local fishery products
28. What is your perception about imported dairy products that were served at hotel and restaurant in Bali?
29. What is your perception about local dairy products that were served at hotel and restaurant in Bali?
30. What kind of dairy products do you prefer?
a. Imported dairy products b. Local dairy products
31. What is your perception about imported fruits that were served at hotel and restaurant in Bali?
32. What is your perception about local fruits that were served at hotel and restaurant in Bali?
33. What kind of fruits do you prefer?
a. Imported fruits b. Local fruits
34. What is your perception about imported vegetables that were served at hotel and restaurant in Bali?
35. What is your perception about local vegetables that were served at hotel and restaurant in Bali?
1 2 3 4 5 6 7
Extremely poor
Very poor Poor Fair Good Very Good Extremely good
1 2 3 4 5 6 7
Extremely poor
Very poor Poor Fair Good Very Good Extremely good
1 2 3 4 5 6 7
Extremely poor
Very poor Poor Fair Good Very Good Extremely good
1 2 3 4 5 6 7
Extremely poor
Very poor Poor Fair Good Very Good Extremely good
1 2 3 4 5 6 7
Extremely poorl
Very poor Poor Fair Good Very Good Extremely good
1 2 3 4 5 6 7
Extremely poor
Very poor Poor Fair Good Very Good Extremely good
1 2 3 4 5 6 7
Extremely poor
Very poor Poor Fair Good Very Good Extremely good
1 2 3 4 5 6 7
Extremely poor
Very poor Poor Fair Good Very Good Extremely good

332
36. What kind of vegetables do you prefer?
a. Imported vegetables b. Local vegetables
37. What is your perception about imported beverages (wines and liquors) that were served at hotel and restaurant in Bali?
38. What is your perception about local beverages (wines and liquors) that were served at hotel and restaurant in Bali?
39. What kind of beverages (wines and liquors) do you prefer?
a. Imported wines and liquors b. Local wines and liquors
40. What is your perception about building style of the hotel / accommodation that you stay in?
41. What kind of building style of the hotel / accommodation do you prefer?
a. Foreign building style b. Local building style
42. What is your perception about furniture in your hotel?
43. What kind of furniture do you prefer?
a. Imported furnitures b. Local furnitures
44. What is your perception about room decoration in your hotel?
45. What kind of room decoration do you prefer?
a. Imported room decoration b. Local room decoration
46. What is your perception about Balinese architecture used in the hotel / accommodation that you stay in?
47. What kind of architecture style do you prefer? a. Foreign architecture style b. Local Balinese architecture
1 2 3 4 5 6 7
Extremely poor
Very poor Poor Fair Good Very Good Extremely good
1 2 3 4 5 6 7
Extremely poor
Very poor Poor Fair Good Very Good Extremely good
1 2 3 4 5 6 7
Extremely poor
Very poor Poor Fair Good Very Good Extremely good
1 2 3 4 5 6 7
Extremely poor
Very poor Poor Fair Good Very Good Extremely good
1 2 3 4 5 6 7
Extremely poor
Very poor Poor Fair Good Very Good Extremely good
1 2 3 4 5 6 7
Extremely poor
Very poor Poor Fair Good Very Good Extremely good
333
Comments about your visit to Bali ________________________________________________________________________________________
________________________________________________________________________________________
________________________________________________________________________________________
________________________________________________________________________________________
________________________________________________________________________________________
________________________________________________________________________________________
________________________________________________________________________________________
________________________________________________________________________________________
________________________________________________________________________________________
________________________________________________________________________________________
________________________________________________________________________________________
________________________________________________________________________________________
________________________________________________________________________________________
________________________________________________________________________________________
Good bye and thank you
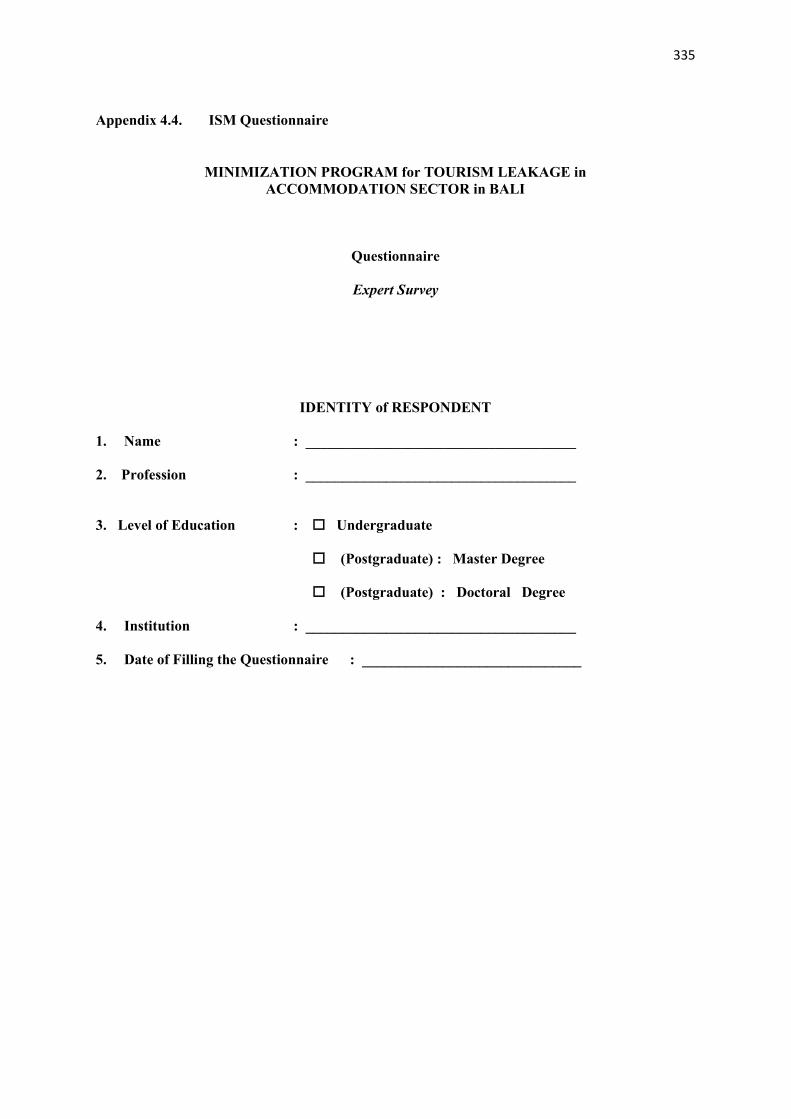
335
Appendix 4.4. ISM Questionnaire
MINIMIZATION PROGRAM for TOURISM LEAKAGE in ACCOMMODATION SECTOR in BALI
Questionnaire
Expert Survey
IDENTITY of RESPONDENT
1. Name : _____________________________________
2. Profession : _____________________________________
3. Level of Education : Undergraduate
(Postgraduate) : Master Degree (Postgraduate) : Doctoral Degree
4. Institution : _____________________________________
5. Date of Filling the Questionnaire : ______________________________
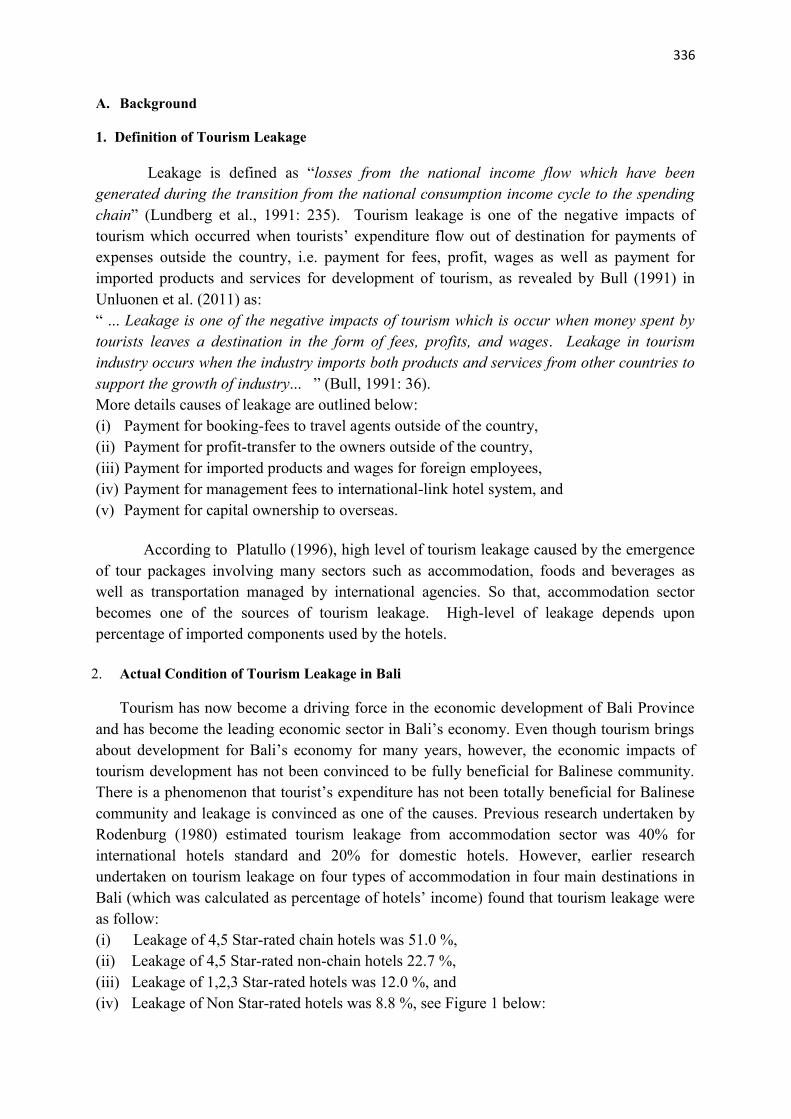
336
A. Background 1. Definition of Tourism Leakage
Leakage is defined as “losses from the national income flow which have been
generated during the transition from the national consumption income cycle to the spending
chain” (Lundberg et al., 1991: 235). Tourism leakage is one of the negative impacts of
tourism which occurred when tourists’ expenditure flow out of destination for payments of
expenses outside the country, i.e. payment for fees, profit, wages as well as payment for
imported products and services for development of tourism, as revealed by Bull (1991) in
Unluonen et al. (2011) as:
“ ... Leakage is one of the negative impacts of tourism which is occur when money spent by
tourists leaves a destination in the form of fees, profits, and wages. Leakage in tourism
industry occurs when the industry imports both products and services from other countries to
support the growth of industry... ” (Bull, 1991: 36).
More details causes of leakage are outlined below:
(i) Payment for booking-fees to travel agents outside of the country,
(ii) Payment for profit-transfer to the owners outside of the country,
(iii) Payment for imported products and wages for foreign employees,
(iv) Payment for management fees to international-link hotel system, and
(v) Payment for capital ownership to overseas.
According to Platullo (1996), high level of tourism leakage caused by the emergence
of tour packages involving many sectors such as accommodation, foods and beverages as
well as transportation managed by international agencies. So that, accommodation sector
becomes one of the sources of tourism leakage. High-level of leakage depends upon
percentage of imported components used by the hotels.
2. Actual Condition of Tourism Leakage in Bali
Tourism has now become a driving force in the economic development of Bali Province
and has become the leading economic sector in Bali’s economy. Even though tourism brings
about development for Bali’s economy for many years, however, the economic impacts of
tourism development has not been convinced to be fully beneficial for Balinese community.
There is a phenomenon that tourist’s expenditure has not been totally beneficial for Balinese
community and leakage is convinced as one of the causes. Previous research undertaken by
Rodenburg (1980) estimated tourism leakage from accommodation sector was 40% for
international hotels standard and 20% for domestic hotels. However, earlier research
undertaken on tourism leakage on four types of accommodation in four main destinations in
Bali (which was calculated as percentage of hotels’ income) found that tourism leakage were
as follow:
(i) Leakage of 4,5 Star-rated chain hotels was 51.0 %,
(ii) Leakage of 4,5 Star-rated non-chain hotels 22.7 %,
(iii) Leakage of 1,2,3 Star-rated hotels was 12.0 %, and
(iv) Leakage of Non Star-rated hotels was 8.8 %, see Figure 1 below:
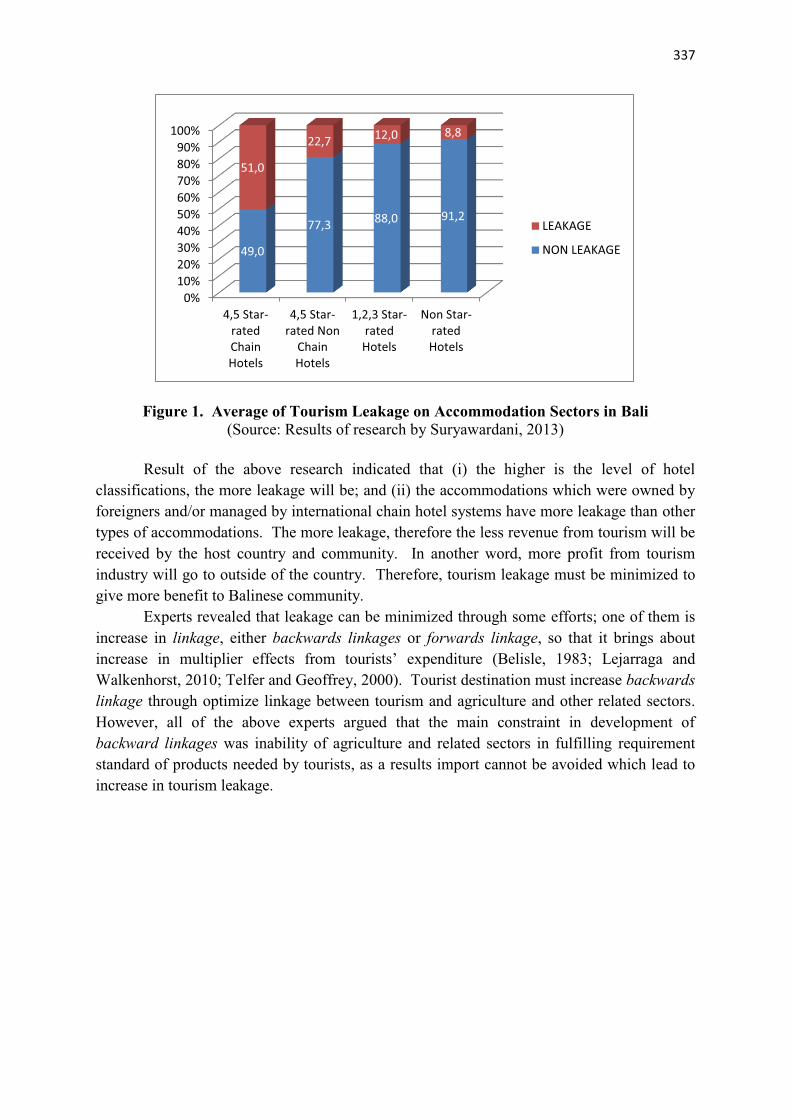

338
B. Minimization Program for Tourism Leakage in Accommodation Sector in Bali Based on the above information, strategy in minimization tourism leakage needs to be
developed. Ideas from experts of Bali tourism and related industries need to be collected in
generating the strategy. Role of government, stakeholders and participation of Balinese
community are crucial in reaching sustainable tourism.
Minimization Program for Tourism Leakage in Accommodation Sector in Bali consists of six elements:
1. Program goals (G)
2. Program needs (N)
3. Affected sectors (T)
4. Program constraints (C)
5. Possible changes in the program (M)
6. Involvement of agencies in the policy (A) Each element consists of sub-element which has contextual relationship each other in accordance with Minimization Program for Tourism Leakage in Accommodation Sector in Bali, i.e.:
_________________________________________________________________________________
Elements Contextual Relationship _________________________________________________________________________________
1. Program goals (Gi) Gi contribute in achieving Gj 2. Program needs (N
i) Ni supports Nj
3. Affected sectors (Ti) Ti its role influences Tj
4. Program constraints (Ci) Ci causes Cj
5. Possible changes in the program (Mi) Mi results in Mj
6. Involvement of agencies in policy (Ai) Ai supports Aj
_________________________________________________________________________________
ij = 1,2,3 ... (i,j ≤ 10)
Information used in this method is gained from respondents’ opinion. Respondents in
this research are tourism experts who understand the contextual relationship between
variables related to minimization program of tourism leakage on accommodation sector in
Bali tourism including government, stakeholders and community.
Therefore, it would be grateful if you could share your knowledge and experience by filling
this questionnaire which can be very useful as a source of information for this study.

339
1. PROGRAM GOALS
Contextual relationship contribute in achieving
There were 10 sub-elements of “Program Goals ” on minimization of tourism leakage on
accommodation sector in Bali tourism. Would you please give your opinion regarding the
level of contextual relationship between sub-elements “Program Goals” by filling matrix of
the contextual relationship with the alphabet as follow: V, A, X or O. Each alphabet has
meaning as outlined below:
V : if regarding your opinion, sub-element-i of the element “Program Goals” contribute in
achieving sub-element-j of the element “Program Goals”. A : if regarding your opinion, sub-element-j of the element “Program Goals” contribute in
achieving sub-element-i of the element “Program Goals”.
X : if regarding your opinion, sub-element-i and sub-element-j of the element “Program
Goals” contribute each other in achieving “Program Goals”.
O : if regarding your opinion, sub-element-i and sub-element-j of the element “Program
Goals” does not contribute each other in achieving “Program Goals”.
Ten of the elements were:
1. Increase community welfare
2. Optimization the potential of local products
3. Development of agriculture, livestock, fisheries and handicraft industry
4. Increase regional income
5. Increase job opportunity
6. Conservation of environment and preservation of culture
7. Community empowerment
8. Reducing the use of imported products for tourists
9. Increase export of local products
10. Sustainable tourism
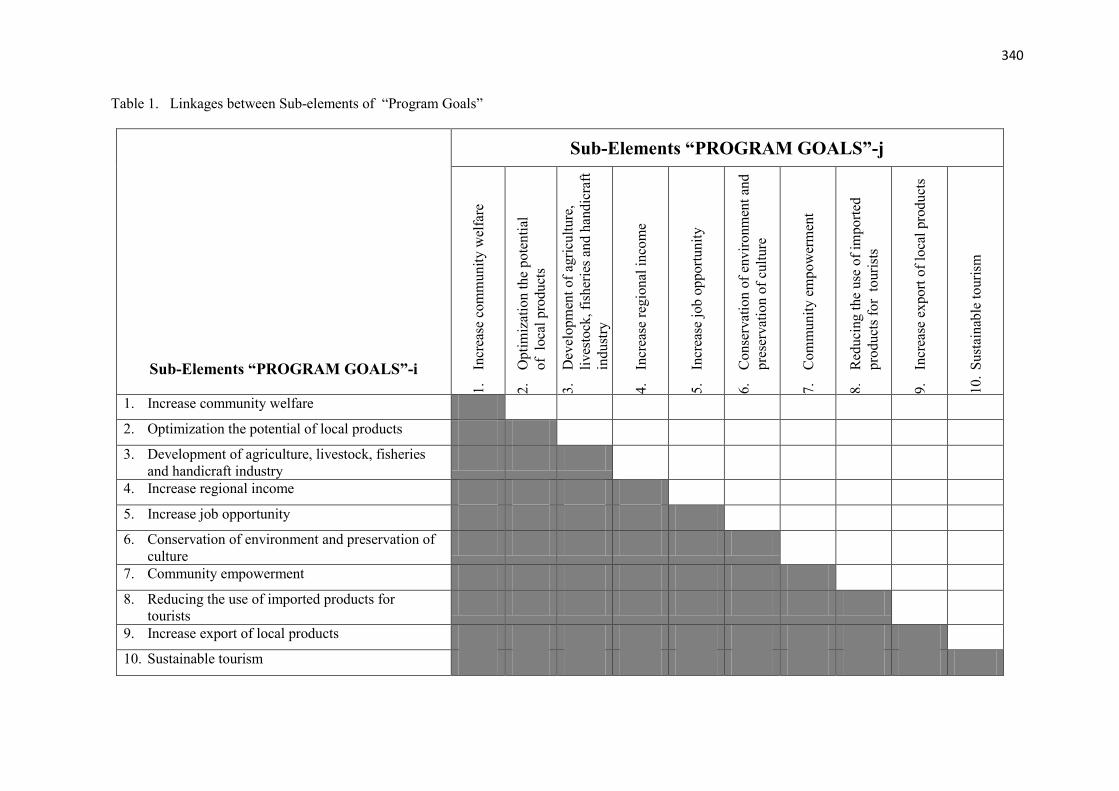
340
Table 1. Linkages between Sub-elements of “Program Goals”
Sub-Elements “PROGRAM GOALS”-i
Sub-Elements “PROGRAM GOALS”-j
1.
Incr
ease
com
munit
y w
elfa
re
2.
Opti
miz
atio
n t
he
pote
nti
al
of
loca
l pro
duct
s
3.
Dev
elopm
ent
of
agri
cult
ure
,
lives
tock
, fi
sher
ies
and h
andic
raft
indust
ry
4.
Incr
ease
reg
ional
inco
me
5.
Incr
ease
job o
pport
unit
y
6.
Conse
rvat
ion o
f en
vir
onm
ent
and
pre
serv
atio
n o
f cu
lture
7.
Com
munit
y e
mpow
erm
ent
8.
Red
uci
ng t
he
use
of
import
ed
pro
duct
s fo
r t
ouri
sts
9.
Incr
ease
export
of
loca
l pro
duct
s
10.
Sust
ainab
le t
ouri
sm
1. Increase community welfare
2. Optimization the potential of local products
3. Development of agriculture, livestock, fisheries and handicraft industry
4. Increase regional income
5. Increase job opportunity
6. Conservation of environment and preservation of culture
7. Community empowerment
8. Reducing the use of imported products for tourists
9. Increase export of local products
10. Sustainable tourism

341
2. PROGRAM NEEDS Contextual relationship support
There were 10 sub-elements of “Program Needs” on minimization program of tourism
leakage on accommodation sector in Bali tourism. Would you please give your opinion regarding
the level of contextual relationship between sub-elements “Program Needs” by filling matrix of the
contextual relationship with the alphabet as follow: V, A, X or O. Each alphabet has meaning as
outlined below:
V : if regarding your opinion, sub-element-i of the element “Program Needs” supports sub-
element-j of the element “Program Needs”. A : if regarding your opinion, sub-element-j of the element “Program Needs” supports sub-
element-i of the element “Program Needs”.
X : if regarding your opinion, sub-element-i and sub-element-j of the element “Program
Needs” supports each other in achieving “Program Needs”.
O : if regarding your opinion, sub-element-i and sub-element-j of the element “Program
Needs” does not support each other in achieving “Program Needs”.
Ten of the elements were:
1. Qualified human resources
2. Good management in agribusiness, livestock, fisheries and handicraft industry
3. Participation of farmers, cattlemen, fishermen and craftsmen
4. Quality, quantity, continuity of local products
5. Substitute products
6. Good quality of seed, livestock and raw materials
7. Funding for investment
8. Business Partnership
9. Government’s role
10. Coordination between stakeholders

342
Table 2. Linkages between Sub-elements “Program Needs”
Sub-elements “Program Needs”-i
Sub-elements “Program Needs”-j
1.
Qual
ifie
d h
um
an r
esourc
e
2.
Go
od
man
agem
ent
in
agri
bu
sin
ess,
liv
esto
ck,
fish
erie
s an
d h
and
icra
ft i
nd
ust
ry
3.
Par
tici
pat
ion
of
farm
ers,
catt
lem
en,
fish
erm
en a
nd
craf
tsm
en
4.
Qual
ity, quan
tity
, co
nti
nuit
y
of
loca
l pro
duct
s
5.
Subst
itute
pro
duct
s
6.
Good q
ual
ity o
f se
ed,
lives
tock
and r
aw m
ater
ials
7.
Fundin
g f
or
inves
tmen
t
8.
Busi
nes
s P
artn
ersh
ip
9.
Role
of
gover
nm
ent
10.
Coord
inat
ion b
etw
een
stak
ehold
ers
1. Qualified human resource
2. Good management in agribusiness, livestock, fisheries and handicraft industry
3. Participation of farmers, cattlemen, fishermen and craftsmen
4. Quality, quantity, continuity of local products
5. Substitute products
6. Good quality of seed, livestock and raw materials
7. Funding for investment
8. Business partnership
9. Role of government
10. Coordination between stakeholders
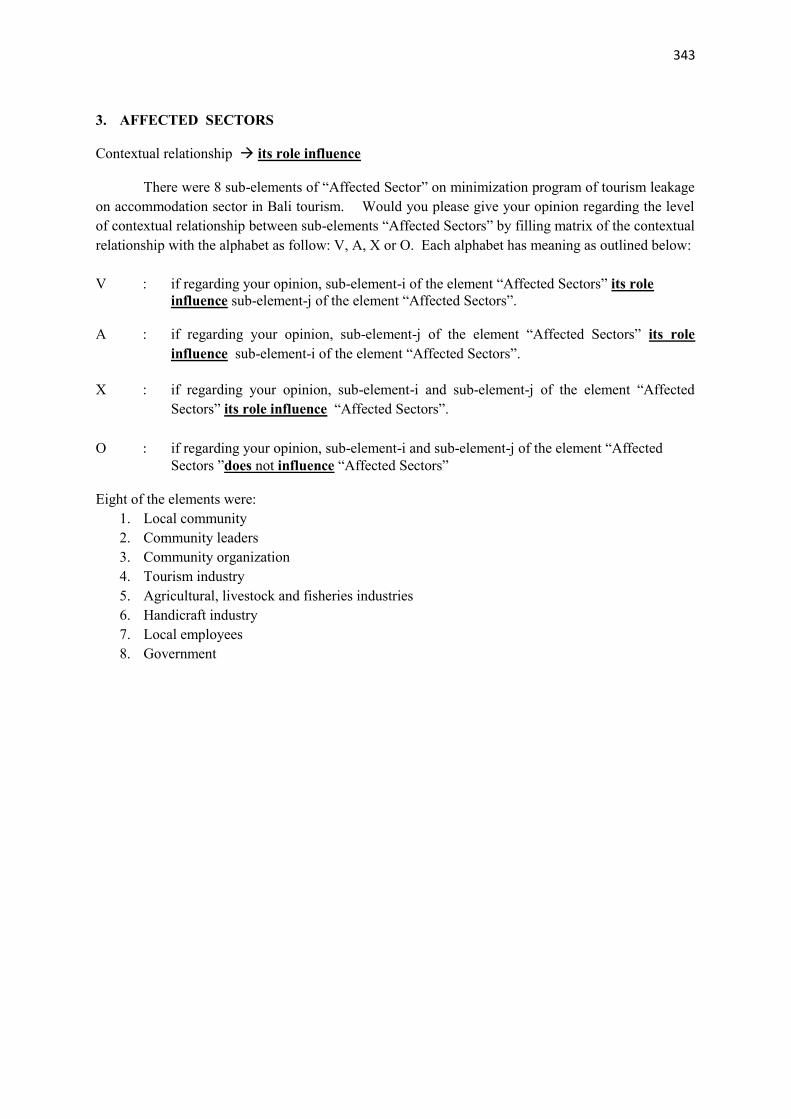
343
3. AFFECTED SECTORS
Contextual relationship its role influence
There were 8 sub-elements of “Affected Sector” on minimization program of tourism leakage
on accommodation sector in Bali tourism. Would you please give your opinion regarding the level
of contextual relationship between sub-elements “Affected Sectors” by filling matrix of the contextual
relationship with the alphabet as follow: V, A, X or O. Each alphabet has meaning as outlined below:
V : if regarding your opinion, sub-element-i of the element “Affected Sectors” its role influence sub-element-j of the element “Affected Sectors”.
A : if regarding your opinion, sub-element-j of the element “Affected Sectors” its role
influence sub-element-i of the element “Affected Sectors”.
X : if regarding your opinion, sub-element-i and sub-element-j of the element “Affected
Sectors” its role influence “Affected Sectors”.
O : if regarding your opinion, sub-element-i and sub-element-j of the element “Affected
Sectors ”does not influence “Affected Sectors” Eight of the elements were:
1. Local community
2. Community leaders
3. Community organization
4. Tourism industry
5. Agricultural, livestock and fisheries industries
6. Handicraft industry
7. Local employees
8. Government

344
Table 3. Linkages between Sub-elements “Affected Sectors”
Sub-elements “Affected Sectors” -i
Sub-elements “Affected Sectors”-j
1.
Loca
l co
mm
unit
y
2.
Com
munit
y l
eader
s
3.
Com
munit
y o
rgan
izat
ion
4.
Touri
sm i
ndust
ry
5.
Agri
cult
ura
l, l
ives
tock
and
fish
erie
s in
dust
ries
6.
Han
dic
raft
indust
ries
7.
Loca
l em
plo
yee
s
8.
Gover
nm
ent
1. Local community
2. Community leaders
3. Community organization
4. Tourism industry
5. Agricultural, livestock and fisheries industries
6. Handicraft industries
7. Local employees
8. Government
345
4. PROGRAM CONSTRAINTS
Contextual Relationship cause
There were 8 sub-elements of “Program Constraints” on minimization program of tourism
leakage on accommodation sector in Bali tourism. Would you please give your opinion regarding
the level of contextual relationship between sub-elements “Program Constraints” by filling matrix of
the contextual relationship with the alphabet as follow: V, A, X or O. Each alphabet has meaning as
outlined below:
V : if regarding your opinion, sub-element-i of the element “Program Constraints” causes sub-element-j of the element “Program Constraints”.
A : if regarding your opinion, sub-element-j of the element “Program Constraints” causes
sub-element-i of the element “Program Constraints”.
X : if regarding your opinion, sub-element-i and sub-element-j of the element “Program
Constraints” cause “Program Constraints”.
O : if regarding your opinion, sub-element-i and sub-element-j of the element “Program
Constraints” does not cause “Program Constraints” Eight of the elements were:
1. Lack of capability and skill of local human resources
2. Lack of availability and quality of local products
3. Lack of capability of local management
4. Lack of local infrastructure
5. Lack of capital investment
6. Lack of information and communication technology
7. National Investment Policy
8. International Trade Policy
9. Foreign Currencies Fluctuation

346
Table 4. Linkages between Sub-elements “ Program Constraints”
Sub-elements “Program Constraints”-i
Sub-elements “Program Constraints”-j
1.
Lac
k o
f ca
pab
ilit
y a
nd s
kil
l of
loca
l hum
an r
esourc
es
2.
Lac
k o
f av
aila
bil
ity a
nd
qual
ity o
f lo
cal
pro
duct
s
3.
Lac
k o
f ca
pab
ilit
y o
f lo
cal
man
agem
ent
4.
Lac
k o
f lo
cal
infr
astr
uct
ure
5.
Lac
k o
f ca
pit
al i
nves
tmen
t
6.
Lac
k o
f in
form
atio
n a
nd
com
munic
atio
n t
echnolo
gy
7.
Nat
ional
Inves
tmen
t P
oli
cy
8.
Inte
rnat
ional
Tra
de
Poli
cy
9.
Fore
ign C
urr
enci
es
Flu
ctuat
ion
1. Lack of capability and skill of local human resources
2. Lack of availability and quality of local products
3. Lack of capability of local management
4. Lack of local infrastructure
5. Lack of capital investment
6. Lack of information and communication technology
7. National Investment Policy
8. International Trade Policy
9. Foreign Currencies Fluctuation
347
5. POSSIBLE CHANGES in the PROGRAM
Contextual Relationship results in
There were 10 sub-elements of “Possible Changes in the Program” on minimization program
of tourism leakage on accommodation sector in Bali tourism. Would you please give your opinion
regarding the level of contextual relationship between sub-elements “Possible Changes in the
Program” by filling matrix of the contextual relationship with the alphabet as follow: V, A, X or O.
Each alphabet has meaning as outlined below:
V : if regarding your opinion, sub-element-i of the element “Possible Changes in the
Program” results in sub-element-j of the element “Possible Changes in the Program”.
A : if regarding your opinion, sub-element-j of the element “Possible Changes in the
Program” results in sub-element-i of the element “Possible Changes in the Program”.
X : if regarding your opinion, sub-element-i and sub-element-j of the element “Possible
Changes in the Program” results in “Possible Changes in the Program”.
O : if regarding your opinion, sub-element-i and sub-element-j of the element “Program
Constrains” does not result in “Program Constrains”
Ten of the elements were:
1. Decrease in import and increase in addedvalue
2. Increase and equalize income distribution
3. Change in point of views of hotel managers from “import oriented”
4. Increase quantity, quality and continuity of local products
5. Development of capability of local human resources
6. Improve business management
7. Empowerment of agricultural, livestock, fisheries and craft industries
8. Policy on restriction of foreign investment
9. Strengthen forward and backward linkages
10. Public-private partnership on investment
348
Table 5. Linkages between Sub-elements “Possible Changes in the Program”
Sub-elements “Possible Changes in the Program”-i
Sub-elements “Possible Changes in the Program” in the Program-j
1.
Dec
reas
e in
im
port
and
incr
ease
in ad
ded
-val
ue
2.
Incr
ease
and e
qual
ize
inco
me
dis
trib
uti
on
3.
3.
Chan
ge
in p
oin
t of
vie
ws
of
hote
l m
anag
ers
from
“im
port
ori
ente
d”
4.
Incr
ease
quan
tity
, qual
ity a
nd
conti
nuit
y o
f lo
cal
pro
duct
s
5.
Dev
elopm
ent
of
capab
ilit
y o
f
loca
l hum
an r
esourc
es
6.
6.
Impro
ve
busi
nes
s
man
agem
ent
7.
Em
pow
erm
ent
of
agri
cult
ura
l,
lives
tock
, fi
sher
ies
and c
raft
indust
ries
8.
Poli
cy o
n r
estr
icti
on o
f
fore
ign i
nves
tmen
t
9.
Str
ength
en f
orw
ard a
nd
bac
kw
ard l
inkag
es
10.
Publi
c-pri
vat
e par
tner
ship
and i
nves
tmen
t
1. Decrease in import and increase in added-value
2. Increase and equalize income distribution
3. Change in point of views of hotel managers from “import oriented”
4. Increase quantity, quality and continuity of local products
5. Development of capability of local human resources
6. Improve business management
7. Empowerment of agricultural, livestock, fisheries and craft industries.
8. Policy on restriction of foreign investment
9. Strengthen forward and backward linkages
10. Public-private partnership on investment

349
6. INVOLVEMENT of AGENCIES in POLICY
Contextual relationship its role support
There were 10 sub-elements of “Involvement of Agencies in policy” on minimization
program of tourism leakage on accommodation sector in Bali tourism. Would you please give your
opinion regarding the level of contextual relationship between sub-elements “Involvement of
Agencies in policy” by filling matrix of the contextual relationship with the alphabet as follow: V, A,
X or O. Each alphabet has meaning as outlined below:
V : if regarding your opinion, sub-element-i of the element “Involvement of Agencies in
policy” supports sub-element-j of the element “Involvement of Agencies in policy”. A : if regarding your opinion, sub-element-j of the element “Involvement of Agencies in
policy” supports sub-element-i of the element “Involvement of Agencies in policy”.
X : if regarding your opinion, sub-element-i and sub-element-j of the element “Involvement
of Agencies in policy” supports “Involvement of Agencies in policy”.
O : if regarding your opinion, sub-element-i and sub-element-j of the element “Involvement
of Agencies in policy ”does not supporting each other “Involvement of Agencies in
policy”.
Ten of the elements were:
1. Government Tourism Office
2. Government Office of Trade and Industry
3. Government Office of Agriculture, Animal Husbandry and Fisheries
4. Government Office of Plantation and Forestry
5. Government Office of Manpower and Transmigration
6. The Ministry of Tourism & Ministry of Foreign Affairs
7. The Ministry of Finance
8. Regional and City Government
9. Association of tourism organizations
10. Research Centres and NGOs
350
Table 6. Linkages between Sub-elements “Involvement of Agencies in the Policy”
Sub-elements “Involvement of Agencies in the Policy”-i
Sub-elements “Involvement of Agencies in the Policy”-j
1.
Gover
nm
ent
Touri
sm O
ffic
e
2.
Gover
nm
ent
Off
ice
of
Tra
de
and I
ndust
ry
3.
Gover
nm
ent
Off
ice
of
Agri
cult
ure
, A
nim
al
Husb
andry
and F
isher
ies
4.
Gover
nm
ent
Off
ice
of
Pla
nta
tion a
nd F
ore
stry
5.
Gover
nm
ent
Off
ice
of
Man
pow
er a
nd
Tra
nsm
igra
tion
6.
The
Min
istr
y o
f T
ouri
sm &
Min
istr
y o
f F
ore
ign A
ffai
rs
7.
The
Min
istr
y o
f F
inan
ce
8.
Res
earc
h C
entr
es a
nd N
GO
s
9.
Ass
oci
atio
n o
f to
uri
sm
org
aniz
atio
ns
10.
Res
earc
h C
entr
e an
d S
oci
al
Agen
cies
1. Government Tourism Office
2. Government Office of Trade and Industry
3. Government Office of Agriculture, Animal Husbandry and Fisheries
4. Government Office of Plantation and Forestry
5. Government Office of Manpower and Transmigration
6. The Ministry of Tourism & Ministry of Foreign Affairs
7. The Ministry of Finance
8. Regional and City Government
9. Association of tourism organizations
10. Research Centres and NGOs
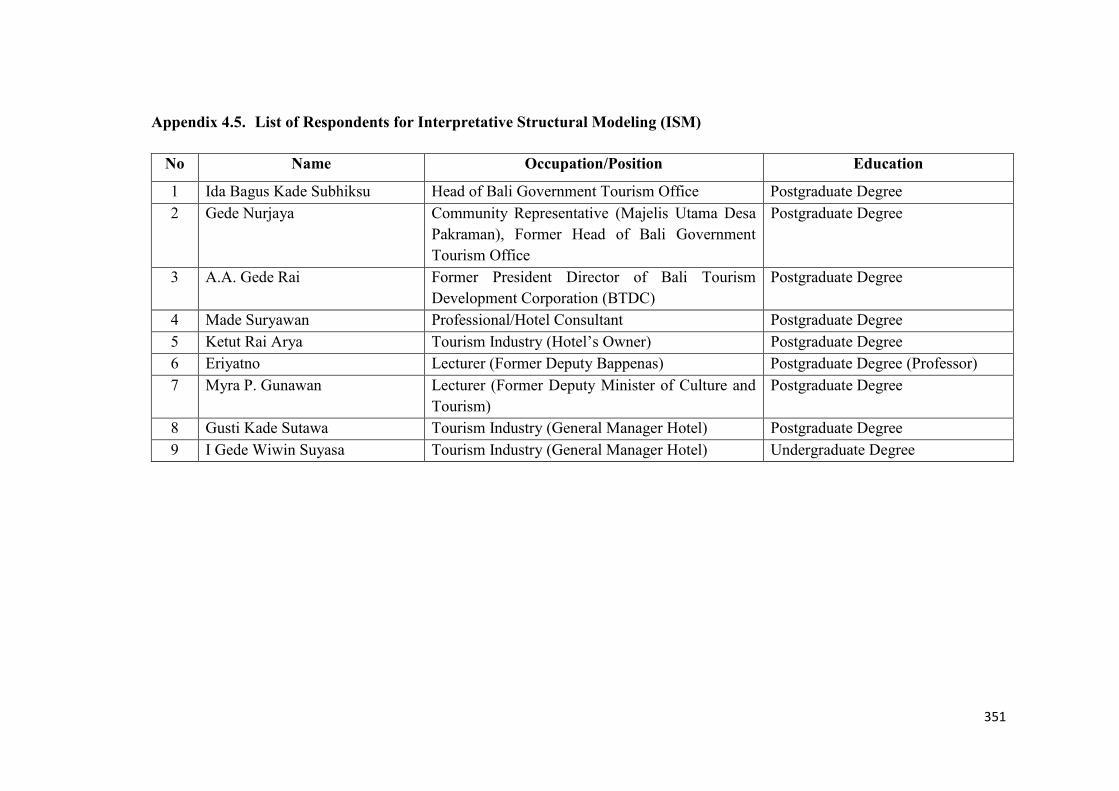
351
Appendix 4.5. List of Respondents for Interpretative Structural Modeling (ISM)
No Name Occupation/Position Education
1 Ida Bagus Kade Subhiksu Head of Bali Government Tourism Office Postgraduate Degree
2 Gede Nurjaya Community Representative (Majelis Utama Desa
Pakraman), Former Head of Bali Government
Tourism Office
Postgraduate Degree
3 A.A. Gede Rai Former President Director of Bali Tourism
Development Corporation (BTDC)
Postgraduate Degree
4 Made Suryawan Professional/Hotel Consultant Postgraduate Degree
5 Ketut Rai Arya Tourism Industry (Hotel’s Owner) Postgraduate Degree
6 Eriyatno Lecturer (Former Deputy Bappenas) Postgraduate Degree (Professor)
7 Myra P. Gunawan Lecturer (Former Deputy Minister of Culture and
Tourism)
Postgraduate Degree
8 Gusti Kade Sutawa Tourism Industry (General Manager Hotel) Postgraduate Degree
9 I Gede Wiwin Suyasa Tourism Industry (General Manager Hotel) Undergraduate Degree
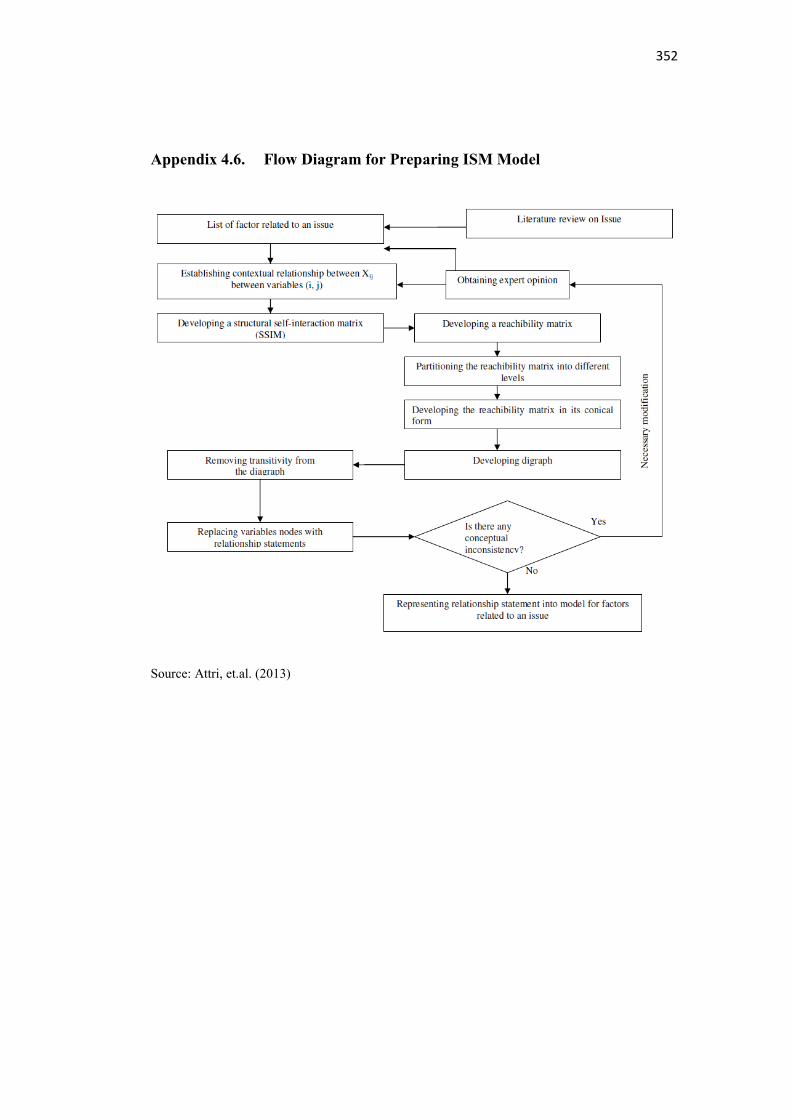
352
Appendix 4.6. Flow Diagram for Preparing ISM Model
Source: Attri, et.al. (2013)
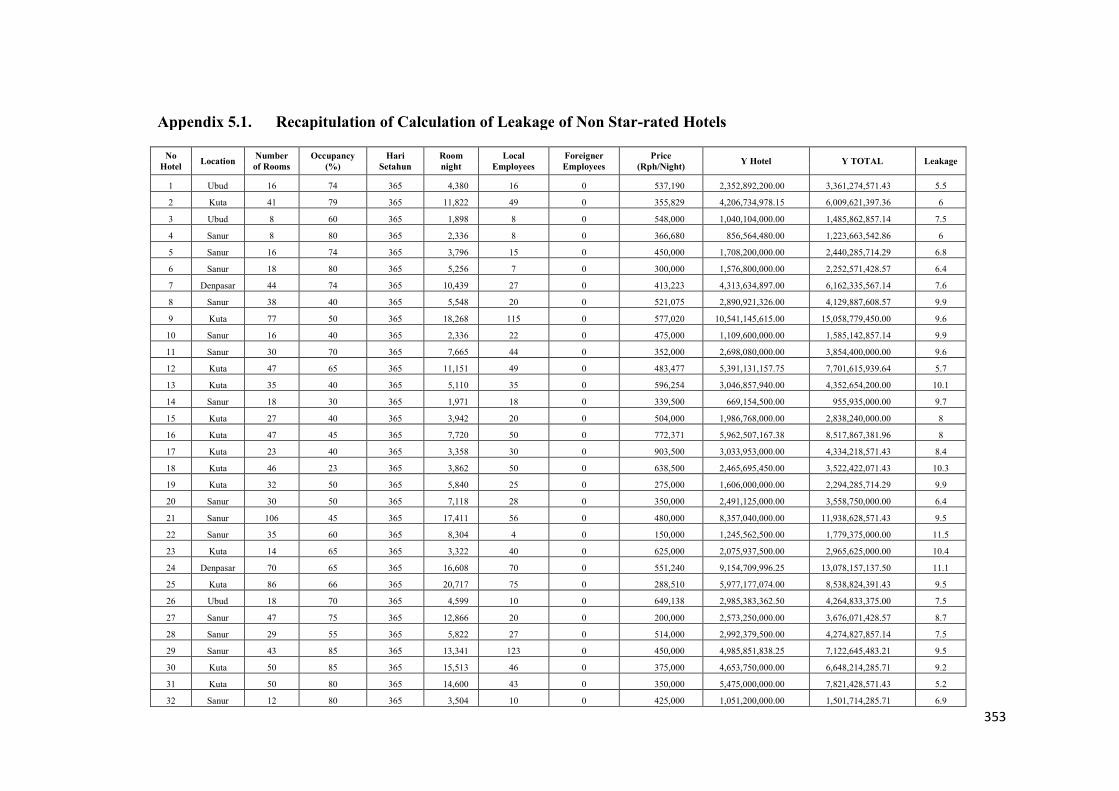
353
Appendix 5.1. Recapitulation of Calculation of Leakage of Non Star-rated Hotels
No Hotel
Location Number of Rooms
Occupancy (%)
Hari Setahun
Room night
Local Employees
Foreigner Employees
Price (Rph/Night)
Y Hotel Y TOTAL Leakage
1 Ubud 16 74 365 4,380 16 0 537,190 2,352,892,200.00 3,361,274,571.43 5.5
2 Kuta 41 79 365 11,822 49 0 355,829 4,206,734,978.15 6,009,621,397.36 6
3 Ubud 8 60 365 1,898 8 0 548,000 1,040,104,000.00 1,485,862,857.14 7.5
4 Sanur 8 80 365 2,336 8 0 366,680 856,564,480.00 1,223,663,542.86 6
5 Sanur 16 74 365 3,796 15 0 450,000 1,708,200,000.00 2,440,285,714.29 6.8
6 Sanur 18 80 365 5,256 7 0 300,000 1,576,800,000.00 2,252,571,428.57 6.4
7 Denpasar 44 74 365 10,439 27 0 413,223 4,313,634,897.00 6,162,335,567.14 7.6
8 Sanur 38 40 365 5,548 20 0 521,075 2,890,921,326.00 4,129,887,608.57 9.9
9 Kuta 77 50 365 18,268 115 0 577,020 10,541,145,615.00 15,058,779,450.00 9.6
10 Sanur 16 40 365 2,336 22 0 475,000 1,109,600,000.00 1,585,142,857.14 9.9
11 Sanur 30 70 365 7,665 44 0 352,000 2,698,080,000.00 3,854,400,000.00 9.6
12 Kuta 47 65 365 11,151 49 0 483,477 5,391,131,157.75 7,701,615,939.64 5.7
13 Kuta 35 40 365 5,110 35 0 596,254 3,046,857,940.00 4,352,654,200.00 10.1
14 Sanur 18 30 365 1,971 18 0 339,500 669,154,500.00 955,935,000.00 9.7
15 Kuta 27 40 365 3,942 20 0 504,000 1,986,768,000.00 2,838,240,000.00 8
16 Kuta 47 45 365 7,720 50 0 772,371 5,962,507,167.38 8,517,867,381.96 8
17 Kuta 23 40 365 3,358 30 0 903,500 3,033,953,000.00 4,334,218,571.43 8.4
18 Kuta 46 23 365 3,862 50 0 638,500 2,465,695,450.00 3,522,422,071.43 10.3
19 Kuta 32 50 365 5,840 25 0 275,000 1,606,000,000.00 2,294,285,714.29 9.9
20 Sanur 30 50 365 7,118 28 0 350,000 2,491,125,000.00 3,558,750,000.00 6.4
21 Sanur 106 45 365 17,411 56 0 480,000 8,357,040,000.00 11,938,628,571.43 9.5
22 Sanur 35 60 365 8,304 4 0 150,000 1,245,562,500.00 1,779,375,000.00 11.5
23 Kuta 14 65 365 3,322 40 0 625,000 2,075,937,500.00 2,965,625,000.00 10.4
24 Denpasar 70 65 365 16,608 70 0 551,240 9,154,709,996.25 13,078,157,137.50 11.1
25 Kuta 86 66 365 20,717 75 0 288,510 5,977,177,074.00 8,538,824,391.43 9.5
26 Ubud 18 70 365 4,599 10 0 649,138 2,985,383,362.50 4,264,833,375.00 7.5
27 Sanur 47 75 365 12,866 20 0 200,000 2,573,250,000.00 3,676,071,428.57 8.7
28 Sanur 29 55 365 5,822 27 0 514,000 2,992,379,500.00 4,274,827,857.14 7.5
29 Sanur 43 85 365 13,341 123 0 450,000 4,985,851,838.25 7,122,645,483.21 9.5
30 Kuta 50 85 365 15,513 46 0 375,000 4,653,750,000.00 6,648,214,285.71 9.2
31 Kuta 50 80 365 14,600 43 0 350,000 5,475,000,000.00 7,821,428,571.43 5.2
32 Sanur 12 80 365 3,504 10 0 425,000 1,051,200,000.00 1,501,714,285.71 6.9

354

354
Appendix 5.2. Recapitulation of Calculation of Leakage of 1,2,3 Star-rated Hotels
No Hotel
Location Number of Rooms
Occupancy (%)
Hari Setahun
Room night
Local Employees
Foreigner Employees
Price (Rph/night)
Y Hotel Y Total Leakage
1 Sanur 115 79 365 33160.25 160 0 450,332 14,933,121,703 21,333,031,004 10.5
2 Sanur 100 40 365 28835.00 78 0 294,196 8,483,141,660 12,118,773,800 9.7
3 Kuta 84 80 365 24221.40 82 0 460,417 11,151,944,324 15,931,349,034 10.7
4 Kuta 146 70 365 42099.10 98 0 510,246 21,480,897,379 30,686,996,255 8.8
5 Kuta 60 70 365 17301.00 40 0 336,595 5,823,430,095 8,319,185,850 10.3
6 Sanur 79 68 365 22779.65 89 0 373,821 8,515,511,543 12,165,016,490 9.9
7 Kuta 90 80 365 25951.50 116 0 429,886 11,156,186,529 15,937,409,327 9.7
8 Sanur 38 76 365 10957.30 47 1 513,203 5,623,313,753 8,033,305,362 11.8
9 Sanur 98 90 365 28258.30 220 0 1,131,808 31,982,955,877 45,689,936,968 11.9
10 Sanur 28 69 365 8073.80 82 0 1,428,250 11,531,404,850 16,473,435,500 12
11 Sanur 61 84 365 17589.35 77 0 387,923 6,823,313,420 9,747,590,600 12
12 Kuta 173 80 365 49884.55 200 0 1,016,529 50,709,091,727 72,441,559,610 13.5
13 Kuta 96 65 365 27681.60 130 0 726,240 20,103,471,343 28,719,244,776 9.5
14 Kuta 122 61 365 35178.70 138 1 502,361 17,672,389,321 25,246,270,459 12.9
15 Ubud 80 70 365 23068.00 85 0 725,207 16,729,063,542 23,898,662,203 11.3
16 Kuta 44 50 365 12687.40 9 0 336,595 4,270,515,403 6,100,736,290 10.9
17 Sanur 18 75 365 5190.30 25 0 480,850 2,495,755,755 3,565,365,364 10.1
18 Sanur 40 65 365 11534.00 30 0 422,500 4,873,115,000 6,961,592,857 9.3
19 Kuta 18 48 365 5190.30 47 1 785,455 4,076,744,491 5,823,920,702 12.2
20 Kuta 22 80 365 6343.70 22 0 521,075 3,305,540,306 4,722,200,437 12.9
21 Kuta 95 85 365 27393.25 104 0 550,000 15,066,287,500 21,523,267,857 13.3

355
Appendix 5.3. Recapitulation of Calculation of Leakage of 4,5 Star-rated Non-chain Hotels
No Hotel
Location Number
of Rooms
Occupancy (%)
Hari Setahun
Room Night
Local Employees
Foreigner Employees
Price (Rph/night)
Y Hotel Y TOTAL Leakage
1 Nusa Dua 541 66 365 130,327 588 4 1,706,384 222,387,736,930 317,696,767,042 22.2
2 Kuta 57 80 365 16,644 100 0 1,704,143 28,363,747,770 40,519,639,671 18
3 Nusa Dua 150 77 365 42,158 235 0 1,079,802 45,521,752,815 65,031,075,450 19.9
4 Ubud 67 65 365 15,896 157 0 762,423 12,119,285,402 17,313,264,860 18
5 Ubud 27 75 365 7,391 20 0 905,042 6,689,391,683 9,556,273,832 19
6 Kuta 318 80 365 92,856 483 3 1,510,967 140,302,305,324 200,431,864,749 21.9
7 Kuta 101 79 365 29,123 110 0 831,405 24,213,298,807 34,590,426,867 12.6
8 Ubud 108 66 365 26,017 295 2 1,482,432 38,568,716,822 55,098,166,888 18.6
9 Sanur 182 87 365 57,794 350 0 946,662 54,711,449,397 78,159,213,425 18.1
10 Ubud 34 12 365 1,489 113 0 1,165,294 1,735,355,825 2,479,079,750 19.4
11 Sanur 120 75 365 32,850 180 0 1,672,344 54,936,483,975 78,480,691,393 19.3
12 Ubud 52 64 365 12,147 339 1 2,561,129 31,110,540,115 44,443,628,736 20.3
14 Sanur 23 60 365 5,037 126 0 1,816,488 9,149,647,538 13,070,925,054 20.6
15 Nusa Dua 173 70 365 44,202 75 0 1,395,732 61,693,432,697 88,133,475,282 18.7

356
Appendix 5.4. Recapitulation of Calculation of Leakage of 4,5 Star-rated Chain Hotels
No Hotel
Location Number
of Rooms
Occupancy (%)
Hari setahun
Room night
Local Employees
Foreigner Employees
Price (Rph/night)
Y Hotel Y TOTAL Leakage
1 Nusa Dua 35 15 365 1,916 157 4 11,040,316 21,156,005,535 30,222,865,050 66.7
2 Kuta 187 70 365 47,779 261 2 1,043,976 49,879,583,427 71,256,547,753 43
3 Sanur 390 78 365 111,033 350 4 1,926,928 213,952,596,624 305,646,566,606 47.6
4 Jimbaran 147 85 365 45,607 646 20 3,953,700 180,315,407,475 225,394,259,344 54.2
6 Nusa Dua 500 81 365 147,825 726 4 1,388,287 205,223,451,863 293,176,359,804 43
7 Nusa Dua 120 80 365 35,040 231 2 1,203,305 42,163,818,880 60,234,026,971 46
8 Kuta 130 70 365 33,215 103 1 764,000 25,376,260,000 36,251,800,000 41
9 Nusa Dua 186 77 365 52,275 177 2 1,291,884 67,533,606,240 96,476,580,343 41
10 Nusa Dua 175 70 365 44,713 160 2 1,150,517 51,442,469,006 73,489,241,438 46.8
11 Nusa Dua 276 67 365 67,496 460 8 1,654,124 111,646,422,679 159,494,889,542 49.1
12 Nusa Dua 122 75 365 33,398 358 11 9,642,097 322,021,934,558 460,031,335,082 51
13 Nusa Dua 334 76 365 92,652 631 11 1,735,869 160,830,993,915 229,758,562,735 49.9

384
Appendix 5.6.
Result of Validity Test of 600 Foreign Tourists
Variables r-value r-table Remarks
Quality_lodging (X1) 0.555 0.080 Valid
Quality_restaurant (X2) 0.579 0.080 Valid
Satisfy_stayingbali (X3) 0.593 0.080 Valid
Fit_expectancies (X4) 0.577 0.080 Valid
Level_wholestay_bali (X5) 0.613 0.080 Valid
Emotion_stayingbali (X6) 0.517 0.080 Valid
Money_to_community (X7) 0.416 0.080 Valid
Quality_meat_Imp (X8) 0.077 0.080 Valid
Quality_meat_local (X9) 0.605 0.080 Valid
Preference_meat (X10) 0.166 0.080 Valid
Quality_fish_Imp (X11) 0.475 0.080 Valid
Quality_fish_local (X12) 0.506 0.080 Valid
Preference_fish (X13) 0.101 0.080 Valid
Quality_dairy_Imp (X14) 0.533 0.080 Valid
Quality_dairy_local (X15) 0.490 0.080 Valid
Preference_dairy (X16) 0.139 0.080 Valid
Quality_fruit_Imp (X17) 0.463 0.080 Valid
Quality_fruit_local (X18) 0.551 0.080 Valid
Preference_fruit (X19) 0.122 0.080 Valid
Quality_vegetables_Imp (X20) 0.524 0.080 Valid
Quality_vegetables_loc (X21) 0.560 0.080 Valid
Preference_vegetables (X22) 0.116 0.080 Valid
Quality_beverage_Imp (X23) 0.125 0.080 Valid
Quality_beverage_loc (X24) 0.503 0.080 Valid
Preference_beverage (X25) 0.162 0.080 Valid
Quality_buildingstyle_loc (X26) 0.374 0.080 Valid
Preference_buildingstyle (X27) 0.160 0.080 Valid
Quality_furnitures_loc (X28) 0.498 0.080 Valid
Preference_furnitures (X29) 0.133 0.080 Valid
Quality_roomdecoration_loc (X30) 0.557 0.080 Valid
Preference_roomdecoration (X31) 0.154 0.080 Valid
Quality_baliarchetectures_loc (X32) 0.259 0.080 Valid
Preference_baliarchitecture (X33) 0.178 0.080 Valid
Remarks: r-table (critical) α=5% and n=600 respondents was 0.080

385
Appendix 6. Coaching for Fieldworkers

386
Appendix 7. Interview with Head of Bali Government Tourism Office (Ida Bagus Kade Subhiksu)
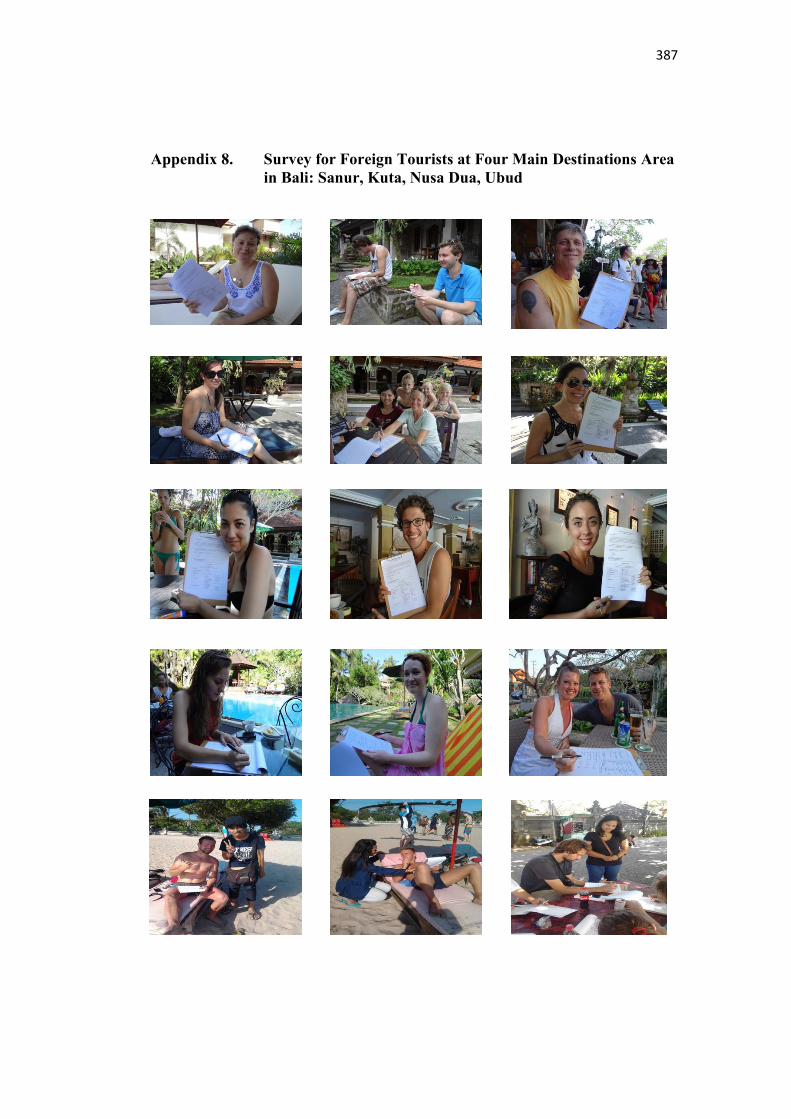
387
Appendix 8. Survey for Foreign Tourists at Four Main Destinations Area in Bali: Sanur, Kuta, Nusa Dua, Ubud