TOURISM IN ICELAND IN FIGURES - Ferðamálastofa · PDF fileTOURISM IN ICELAND IN...
29
TOURISM IN ICELAND IN FIGURES JUNE 2017
Transcript of TOURISM IN ICELAND IN FIGURES - Ferðamálastofa · PDF fileTOURISM IN ICELAND IN...

TOURISM IN ICELAND IN FIGURES JUNE 2017

1
REPORT BY: ODDNÝ ÞÓRA ÓLADÓTTIR
COVER PHOTO: RAGNAR TH. SIGURÐSSON / PORTHÖNNUN
TOURISM IN ICELAND IN FIGURES
CONTENTS
Page
ECONOMIC STATISTICS IN ICELANDIC TOURISM 2 FOREIGN CARD TURNOVER 4 INTERNATIONAL VISITORS AND CRUISES 5 INTERNATIONAL VISITORS TO ICELAND 2014-2016 6 INTERNATIONAL VISITORS BY MONTHS 7 INTERNATIONAL VISITORS BY SEASON 8 NATIONALITIES THROUGH KEFLAVIK AIRPORT 2016/2015 9 MARKETING AREAS THROUGH KEFLAVIK AIRPORT 2012-16 10 DEPARTURES FROM KEFLAVÍK AIRPORT 2016 11 OVERNIGHT STAYS – ALL TYPES OF ACCOMMODATION 12 GUEST NIGHTS BY REGION 2016/2015 13 AVAILABLE ROOMS AND OCCUPANCY RATE 14 GUEST NIGHTS BY TYPE OF ACCOMMODATION 15 INTERNATIONAL VISITORS IN ICELAND 2015-2016 16 TRAVELS OF ICELANDERS 2016/2015/2014 23

2
ECONOMIC STATISTICS IN ICELANDIC TOURISM
THE SHARE OF TOURISM IN EXPORT REVENUE
Tourism’s share of foreign exchange earnings has grown from 23.7%
to 39.2% between 2012-2016 according to measurements on the
export of goods and services.
Export of goods and services (ISK billion)
Tourism* (ISK billions)
Share of tourism
2012 1012,182 239,544 23.7% 2013 1047,908 276,634 26.4% 2014 1068,320 304,637 28.5%
2015 1188,744 369,536 31.1% 2016 1189,270 466,287 39.2%
*Total activity of Icelandic companies operating in Iceland and abroad.
Tourism generated higher foreign exchange earnings than exports of
marine products and industrial products in the years 2013–2016.
SPENDING OF FOREIGN VISITORS
Revenue from foreign tourists amounted to ISK 359.7 billion in 2016
i.e. ISK 96.5 billion more than in 2015¹. This represents a year-on-year
increase of some 36.7%.
Visitors, total Tourists (Overnight visitors)
Same day visitors (Cruise arrivals)
2012 137.456,5 135.640,7 1.815.8 2013 165.850,0 163.873,3 1.976.,8 2014 197.267,5 195.141,4 2.126,1
2015 263.213,5 260.827,4 2.386,1 2016 359.751,6 357.049,5 2.702,1
¹ ISK at each year’s levels.
The Tourism Industry 2016 overview from Statistics Iceland breaks
down tourism expenditure by sector. Almost a third of expenditure,
or 107 billion, is attributable to holiday accommodation and catering
services; 22%, or 79.3 billion, to passenger transport by air; 14%, or
50.8 billion, to passenger transport by land and sea; 13.8%, or 49.7
billion, to travel agencies; 13.4%, or 48 billion, to various retail
enterprises; and 6.9%, or 24.7 billion, to other.
Source: Statistics Iceland.
26,4% 28,5%31,1%
39,2%
0
10
20
30
40
50
2013 2014 2015 2016
EXPORT OF GOODS AND SERVICES
Product of marine products Product of manufacturing products
Revenues of foreign travellers Other
Accommodation/ F&B serving
service30%
Road/Water passenger transportation/Transport
equipment rental14%
Air passenger transportation
22%
Travel agencies14%
Goods purchased from trade activities
13%
Other7%
INBOUND TOURISM EXPENDITURE BY CONSUMPTION PRODUCTION, 2016

3
JOBS IN TOURISM-RELATED INDUSTRIES
The total number of people employed in tourism-related sectors was
19,500 in January 2016, or the month the fewest were employed, and
28,900 in August 2016, when the most were employed. Most
employees worked in accommodation and at restaurants, 13,200 in
January and 18,100 in August. However, the percentage increase of
employees was greatest among travel agencies, tour operators,
booking services and in sectors classified as other. Since 2012, the
number of employees in tourism-related sectors has increased yearly
by more than 60%.
TURNOVER IN ACTIVITIES RELATED TO TOURISM
Total turnover in typical tourism sectors increased on average by 19%
between 2012 and 2016. The greatest increase was from 2015–2016,
or by 41%. In relative terms, turnover increased most in the operating
of holiday accommodation and in the rental of cars and light motor
vehicles, or on average by 25% between years. Turnover increased on
average by 15% between years in restaurant sales and services and
about 7% in passenger transport by air. Regarding the comparison of
the turnover figures for travel agencies and passenger transport, it
should be noted that this activity was exempt from VAT until the
beginning of 2016.
Turnover (ISK millions)
2012 2013 2014 2015 2016 Total turnover 301.582 334.750 360.484 420.059 591.454
Passenger air transport 196.824 211.390 214.723 242.701 258.511 Accommodation 33.662 41.624 51.422 61.878 83.758 Food and beverage service activities
48.600 55.080 61.853 72.157 86.327
Renting/leasing of cars & light motor vehicles
18.045 21.583 26.336 35.273 45.279
Travel agencies¹ 3.773 4.502 5.523 7.323 95.979 Passenger land transport¹
679 571 628 727 21.600
¹At the beginning of 2016, changes to the law on value added tax came into effect, and
passenger transport (other than scheduled services) and travel agency services were then
subject to value added tax, from which they had previously been exempt.
Source: Statistics Iceland. 2,900
4,400
3,500
18,100
1,900
2,500
2,600
13,200
Other
Travel agency, tour operator andother reservation service and related
activities
Passenger air transport
Accommodation/Food and beverageservice activities
Other
Travel agency, tour operator andother reservation service and related
activities
Passenger air transport
Accommodation/Food and beverageservice activities
Au
gust
Jan
uar
y
NUMBER OF EMPLOYEES IN ACTIVITIES RELATED TO TOURISM 2012-2016
2016
2015
2014
2013
2012

4
FOREIGN CARD TURNOVER
Foreign payment card turnover in Iceland tripled from 2012–2016. In
2016, payment card turnover was ISK 232 billion, 50.2% higher than
in 2015, when payment card turnover was ISK 154 billion. Payment
card turnover increased by 21.3% from 2012–13, by 24.6% from
2013–2014 and by 37.6% from 2014–2015.
Foreign card turnover has been the highest during the summer, but
the share of the summer card turnover has fallen steadily in line with
the increase of tourists visiting outside the summer months. The
yearly share of foreign card turnover during the summer was about
47% until 2012, but by 2016, it was 38.2%.
FOREIGN CARD TURNOVER BY EXPENSE ITEMS*
In 2016, a little less than a third (29.5%) of foreign payment card
turnover was spent on accommodation and restaurant services,
17.3% on passenger transport and 11.6% for various services related
to passenger transport and for petrol stations, repair and
maintenance services. About 14.5% went to different types of
tourism, 13% to commerce and 2.4% to cultural, recreational and
leisure activities, and 5.5% went to other aspects connected to
tourism. Cash withdrawals made up 6.7% of card turnover.
* The data on card turnover by expense items contains all payment card use, both debit and
credit cards. The card turnover of foreigners who purchase travel tickets or package tours to
Iceland from their home countries is not included unless the card turnover is channelled
through Icelandic acquirers.
Source: Centre for Retail Studies.
74,268 90,057112,196
154,417
231,990
2012 2013 2014 2015 2016
TOTAL USE OF FOREIGN DEBIT AND CREDIT CARDS IN ICELAND (ISK billions)
0
10.000
20.000
30.000
40.000
J F M A M J J A S O N D
CARD TURNOVER BY MONTH (ISK billions)
20122013201420152016 15,633
11,299
5,530
30,068
33,730
8,989
17,939
40,100
24,423
44,028
Cash withdrawals
Other
Culture and recreation
Shopping
Miscellaneous tourism
Fuel, automobile services
Passenger transport-other
Passenger transport
Catering services
Accommodation services
CARD TURNOVER BY EXPENSE ITEM (ISK billions)
2016
2015
5
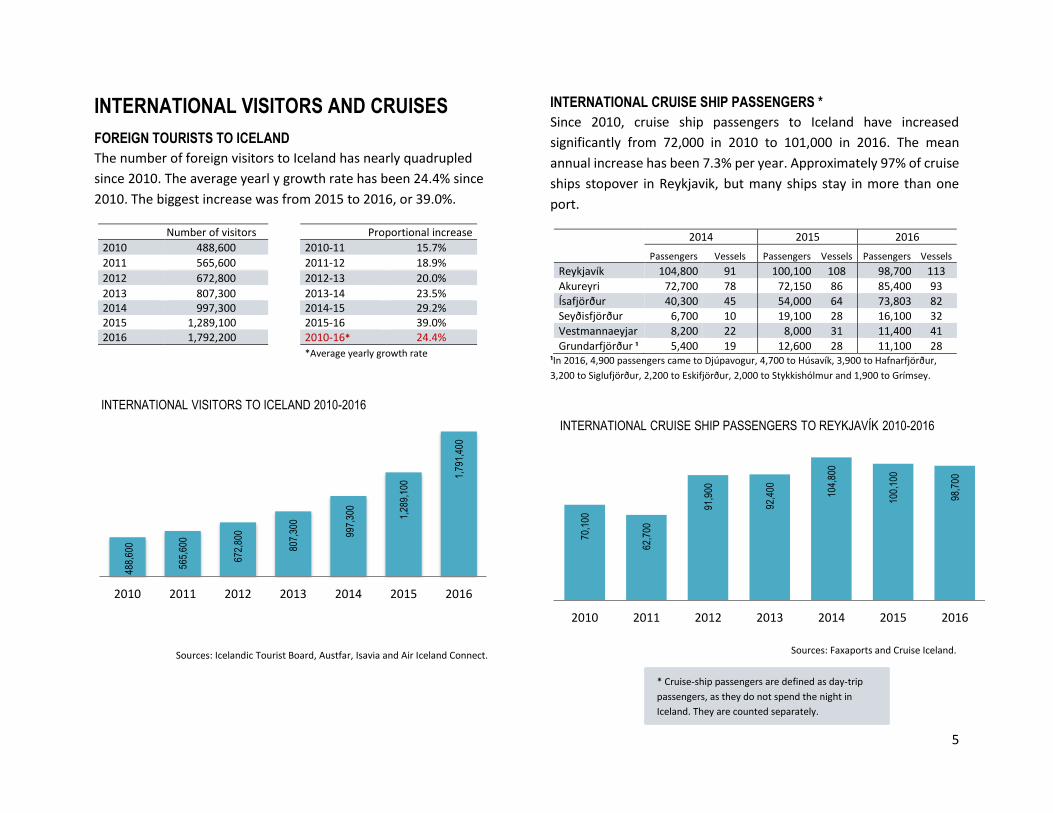
INTERNATIONAL VISITORS AND CRUISES
FOREIGN TOURISTS TO ICELAND
The number of foreign visitors to Iceland has nearly quadrupled
since 2010. The average yearl y growth rate has been 24.4% since
2010. The biggest increase was from 2015 to 2016, or 39.0%.
Number of visitors Proportional increase
2010 488,600 2010-11 15.7%
2011 565,600 2011-12 18.9%
2012 672,800 2012-13 20.0%
2013 807,300 2013-14 23.5% 2014 997,300 2014-15 29.2% 2015 1,289,100 2015-16 39.0% 2016 1,792,200 2010-16* 24.4%
*Average yearly growth rate
Sources: Icelandic Tourist Board, Austfar, Isavia and Air Iceland Connect.
INTERNATIONAL CRUISE SHIP PASSENGERS *
Since 2010, cruise ship passengers to Iceland have increased
significantly from 72,000 in 2010 to 101,000 in 2016. The mean
annual increase has been 7.3% per year. Approximately 97% of cruise
ships stopover in Reykjavik, but many ships stay in more than one
port.
2014 2015 2016
Passengers Vessels Passengers Vessels Passengers Vessels
Reykjavík 104,800 91 100,100 108 98,700 113
Akureyri 72,700 78 72,150 86 85,400 93
Ísafjörður 40,300 45 54,000 64 73,803 82 Seyðisfjörður 6,700 10 19,100 28 16,100 32
Vestmannaeyjar 8,200 22 8,000 31 11,400 41
Grundarfjörður ¹ 5,400 19 12,600 28 11,100 28 ¹In 2016, 4,900 passengers came to Djúpavogur, 4,700 to Húsavík, 3,900 to Hafnarfjörður,
3,200 to Siglufjörður, 2,200 to Eskifjörður, 2,000 to Stykkishólmur and 1,900 to Grímsey.
Sources: Faxaports and Cruise Iceland.
488,
600
565,
600
672,
800
807,
300
997,
300
1,28
9,10
0
1,79
1,40
0
2010 2011 2012 2013 2014 2015 2016
INTERNATIONAL VISITORS TO ICELAND 2010-2016
70,1
00
62,7
00
91,9
00
92,4
00
104,
800
100,
100
98,7
00
2010 2011 2012 2013 2014 2015 2016
INTERNATIONAL CRUISE SHIP PASSENGERS TO REYKJAVÍK 2010-2016
* Cruise-ship passengers are defined as day-trip
passengers, as they do not spend the night in
Iceland. They are counted separately.

6
INTERNATIONAL VISITORS TO ICELAND 2014-2016
The total number of foreign visitors was around 1.8 million in 2016, a 39% increase from 2015, when foreign visitors numbered around 1.3 million.
Around 1,790,000 tourists came on flights through Keflavík International Airport in 2016, or 98.7% of the total number of visitors. Around 20,000 came with Norræna through Seyðisfjörður, or around 1.1% of the total. Around 3,800 came on flights through Reykjavík Airport or Akureyri Airport, or 0.2 % of the total. It must be assumed that there are variations in counts at Keflavik International Airport, as they cover all departures, including foreign nationals resident in Iceland.
INTERNATIONAL VISITORS BY POINT OF ENTRY
Change between
years
2014 2015 2016 14/15 15/16
Keflavik Airport 969,181 1,261,938 1,767,726 30.2% 40.1%
Seyðisfjörður seaport 18,115 18,540 19,795 2.3% 6.8%
Other airports 10,048 8,661 4,680 -13.8% -46.0%
Total 997,344 1,289,139 1,792,201 29.2% 39.0%
VISITORS THROUGH KEFLAVÍK AIRPORT By Nationality
2014 2015 2016 14/15 15/16
Canada 38,790 46,654 83,144 20.3% 78.2%
China 26,037 47,643 66,781 83.0% 40.2%
Denmark 48,237 49,225 49,951 2.0% 1.5%
Finland 15,415 16,021 19,895 3.9% 24.2%
France 58,293 65,822 85,221 12.9% 29.5%
Germany 85,915 103,384 132,789 20.3% 28.4%
Italy 19,870 23,817 31,573 19.9% 32.6%
Japan 13,340 16,547 22,371 24.0% 35.2%
Netherlands 26,222 29,546 39,098 12.7% 32.3%
Norway 53,647 51,402 51,012 -4.2% -0.8%
Spain 20,932 27,166 39,183 29.8% 44.2%
Sweden 40,992 43,096 54,515 5.1% 26.5%
Switzerland 19,315 25,935 28,682 34.3% 10.6%
UK 180,503 241,024 316,395 33.5% 31.3%
USA 152,104 242,805 415,287 59.6% 71.0%
Other 169,569 231,851 331,829 36.7% 43.1%
Total 969,181 1,261,938 1,767,726 30.2% 40.1%
By Market Area Nordic countries 158,291 159,744 175,373 0.9% 9.8%
UK 180,503 241,024 316,395 33.5% 31.5%
Central/S-Europe 230,547 275,670 356,546 19.6% 29.3%
N-America 190,894 289,459 498,431 51.6% 72.2%
Other 208,946 296,014 420,981 41.7% 42.2%
Total 969,181 1,261,938 1,767,726 30.2% 40.1%
VISITORS THROUGH SEYÐISFJÖRÐUR SEAPORT
2014 2015 2016 14/15 15/16
Nordic countries 5,340 4,806 2,512 -10.0% -47.7%
Germany 7,705 8,489 9,959 10.2% 17.3%
Centr./S-Europe* 3,314 3,431 3,815 3.5% 11.2%
Other 1,756 1,814 3,509 3.3% 93.4%
Total 18,115 18,540 19,795 2.3% 6.8%
*Netherlands, Belgium, Austria, Switzerland, France, Spain and Italy.
Sources:
-The Icelandic Tourist Board counts visitors when they leave through Keflavík Airport
according to nationality and publishes the figures every month on its website.
-Austfar estimates visitor numbers with Norræna based on sales figures.
-Isavia and Air Iceland Connect estimate visitor numbers through other airports based
on passenger and sales figures.

7
INTERNATIONAL VISITORS BY MONTHS
Over the past three years, the increase in the number of tourists has
been proportionately greater in winter than in spring, summer and
fall. Records were broken in all months of 2015 and 2016 in
comparison with the same months in preceding years. The increase
was more than 30% for seven months from 2014–2015 and ten
months from 2015–2016, but the largest increase was from 2015–
2016 in October, November and December, when it exceeded 60%.
DEPARTURES FROM KEFLAVÍK AIRPORT BY MARKET
Travellers from individual market areas were widely distributed in
2016. Thus, travellers from Central and South Europe were prominent
during the summer months, while travellers from the Nordic
countries, North America and from countries categorised as
“elsewhere” were distributed evenly over the year. Travellers from
the UK were the exception, as around half of these visitors came
during the winter months.
Source: Icelandic Tourist Board.
77.5
59
100.
742
115.
808
94.8
75 124.
249 18
6.53
8
236.
016
241.
559
175.
335
158.
542
131.
723
124.
780
J F M A M J J A S O N D
DEPARTURES FROM KEFLAVÍK AIRPORT BY MONTH
2014 2015 2016
35%
34%
27%
21%
36%
24%
25%
23%
39%
49%
34%
32%
24%
43
%
38%
33% 37
%
36%
31%
28%
43%
60%
61%
76%
J F M A M J J A S O N D
INCREASE OF VISITORS 2014-2016
2014-15 2015-16
0
20.000
40.000
60.000
80.000
100.000
J F M A M J J A S O N D
TRAVELLERS THROUGH BY MARKET REGION 2016
Nordic nations UK Central-/S-Europe
N-America Other
8
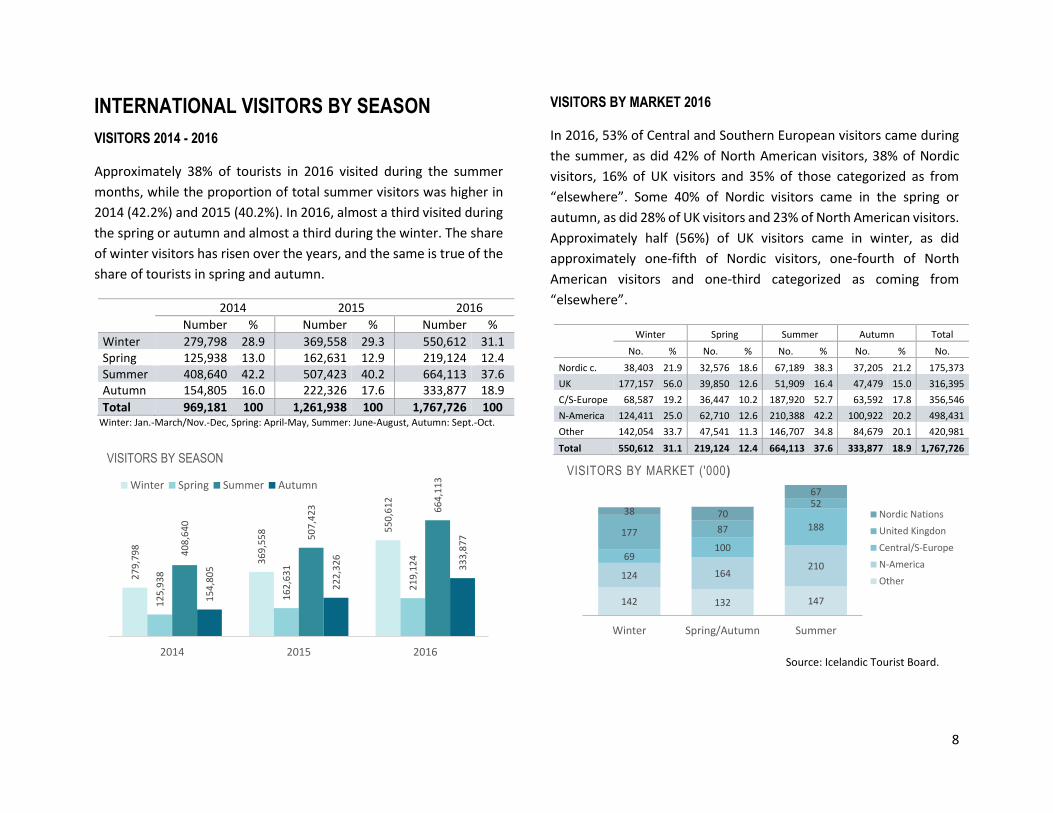
INTERNATIONAL VISITORS BY SEASON
VISITORS 2014 - 2016
Approximately 38% of tourists in 2016 visited during the summer
months, while the proportion of total summer visitors was higher in
2014 (42.2%) and 2015 (40.2%). In 2016, almost a third visited during
the spring or autumn and almost a third during the winter. The share
of winter visitors has risen over the years, and the same is true of the
share of tourists in spring and autumn.
2014 2015 2016
Number % Number % Number %
Winter 279,798 28.9 369,558 29.3 550,612 31.1 Spring 125,938 13.0 162,631 12.9 219,124 12.4 Summer 408,640 42.2 507,423 40.2 664,113 37.6 Autumn 154,805 16.0 222,326 17.6 333,877 18.9
Total 969,181 100 1,261,938 100 1,767,726 100 Winter: Jan.-March/Nov.-Dec, Spring: April-May, Summer: June-August, Autumn: Sept.-Oct.
VISITORS BY MARKET 2016
In 2016, 53% of Central and Southern European visitors came during
the summer, as did 42% of North American visitors, 38% of Nordic
visitors, 16% of UK visitors and 35% of those categorized as from
“elsewhere”. Some 40% of Nordic visitors came in the spring or
autumn, as did 28% of UK visitors and 23% of North American visitors.
Approximately half (56%) of UK visitors came in winter, as did
approximately one-fifth of Nordic visitors, one-fourth of North
American visitors and one-third categorized as coming from
“elsewhere”.
Winter Spring Summer Autumn Total
No. % No. % No. % No. % No.
Nordic c. 38,403 21.9 32,576 18.6 67,189 38.3 37,205 21.2 175,373
UK 177,157 56.0 39,850 12.6 51,909 16.4 47,479 15.0 316,395
C/S-Europe 68,587 19.2 36,447 10.2 187,920 52.7 63,592 17.8 356,546
N-America 124,411 25.0 62,710 12.6 210,388 42.2 100,922 20.2 498,431
Other 142,054 33.7 47,541 11.3 146,707 34.8 84,679 20.1 420,981
Total 550,612 31.1 219,124 12.4 664,113 37.6 333,877 18.9 1,767,726
Source: Icelandic Tourist Board.
27
9,7
98
36
9,5
58 5
50
,61
2
12
5,9
38
16
2,6
31
21
9,1
244
08
,64
0
50
7,4
23 66
4,1
13
15
4,8
05
22
2,3
26
33
3,8
77
2014 2015 2016
VISITORS BY SEASON
Winter Spring Summer Autumn
142 132 147
124 164210
69100
188177 87
5238 70
67
Winter Spring/Autumn Summer
VISITORS BY MARKET ('000)
Nordic Nations
United Kingdon
Central/S-Europe
N-America
Other
9
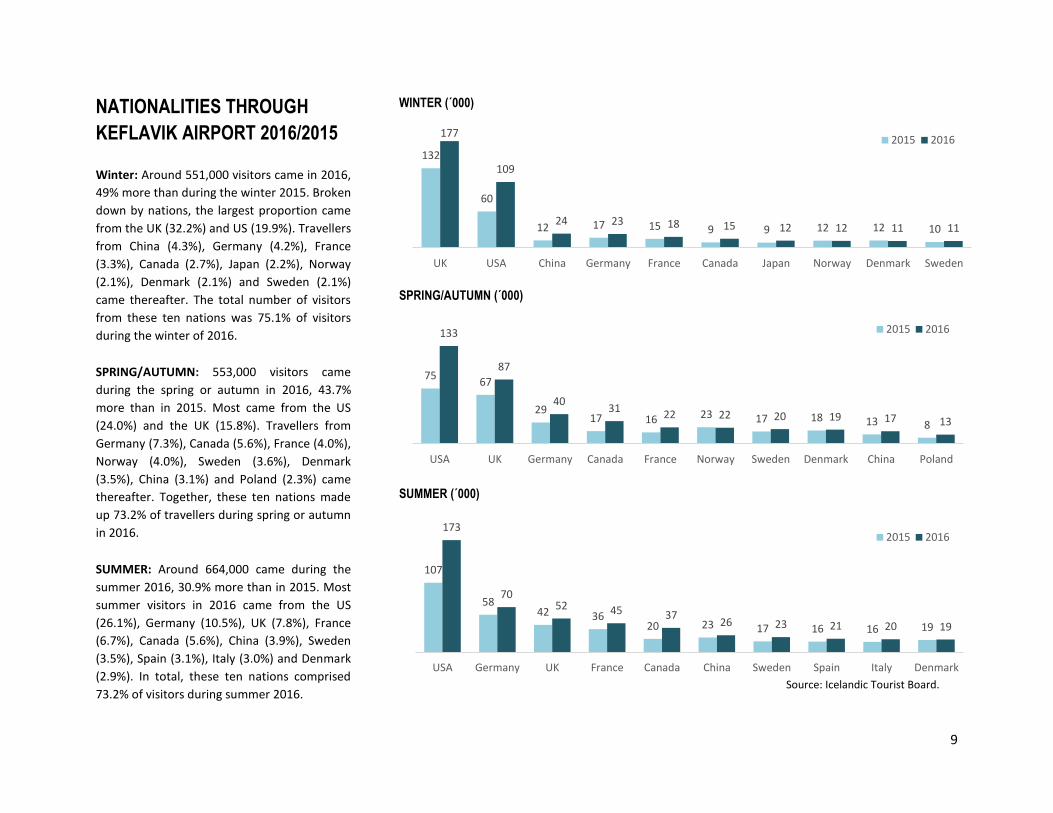
NATIONALITIES THROUGH
KEFLAVIK AIRPORT 2016/2015
Winter: Around 551,000 visitors came in 2016,
49% more than during the winter 2015. Broken
down by nations, the largest proportion came
from the UK (32.2%) and US (19.9%). Travellers
from China (4.3%), Germany (4.2%), France
(3.3%), Canada (2.7%), Japan (2.2%), Norway
(2.1%), Denmark (2.1%) and Sweden (2.1%)
came thereafter. The total number of visitors
from these ten nations was 75.1% of visitors
during the winter of 2016.
SPRING/AUTUMN: 553,000 visitors came
during the spring or autumn in 2016, 43.7%
more than in 2015. Most came from the US
(24.0%) and the UK (15.8%). Travellers from
Germany (7.3%), Canada (5.6%), France (4.0%),
Norway (4.0%), Sweden (3.6%), Denmark
(3.5%), China (3.1%) and Poland (2.3%) came
thereafter. Together, these ten nations made
up 73.2% of travellers during spring or autumn
in 2016.
SUMMER: Around 664,000 came during the
summer 2016, 30.9% more than in 2015. Most
summer visitors in 2016 came from the US
(26.1%), Germany (10.5%), UK (7.8%), France
(6.7%), Canada (5.6%), China (3.9%), Sweden
(3.5%), Spain (3.1%), Italy (3.0%) and Denmark
(2.9%). In total, these ten nations comprised
73.2% of visitors during summer 2016.
WINTER (´000)
SPRING/AUTUMN (´000)
SUMMER (´000)
Source: Icelandic Tourist Board.
132
60
12 17 15 9 9 12 12 10
177
109
24 23 18 15 12 12 11 11
UK USA China Germany France Canada Japan Norway Denmark Sweden
2015 2016
7567
2917 16 23 17 18 13 8
133
87
4031
22 22 20 19 17 13
USA UK Germany Canada France Norway Sweden Denmark China Poland
2015 2016
107
5842 36
20 23 17 16 16 19
173
7052 45 37
26 23 21 20 19
USA Germany UK France Canada China Sweden Spain Italy Denmark
2015 2016

10
MARKETING AREAS THROUGH
KEFLAVIK AIRPORT 2012-16
WINTER: The number of winter visitors in 2016
was quadruple that of those counted in 2012.
The average annual increase has been 38%
since 2012. Visitors from Britain were about
one-third of winter visitors in 2016, whilst
visitors from North America made up almost a
fifth. These two market areas, as well as those
classified as “other”, have increased the most
since 2012.
SPRING/AUTUMN: Visitors in the spring/
autumn have increased from 192,000 in 2012 to
533,000 in 2016, an almost threefold increase.
The increase has been around 30.6% per year.
In the past, most visitors came from the Nordic
countries, or around 25% of the market share,
but by 2016, the share from North America was
highest, at around 30%. The share of those
classified as “Other” became a quarter in 2016.
SUMMER: Travellers in summer have more
than doubled since 2012, from 301,000 in 2012
to around 664,000 in 2016. The average annual
increase has been 22%. Visitors from North
America were the largest market in the summer
of 2016, or 31.7% of the total. Their share has
grown year after year, and they have surpassed
visitors coming from Central and Southern
European countries, who made up the largest
group of visitors during the summer for the
longest time.
Winter
SPRING/AUTUMN
SUMMER
Source: Icelandic Tourist Board.
0
50.000
100.000
150.000
200.000
2012 2013 2014 2015 2016
0
50.000
100.000
150.000
200.000
2012 2013 2014 2015 2016
0
50.000
100.000
150.000
200.000
250.000
2012 2013 2014 2015 2016
Nordic Nations UK Central/S-Europe USA/Canada Other

11
DEPARTURES FROM KEFLAVÍK AIRPORT 2016
By nationality By season* By month
Total Winter Spring Summer Autumn Jan Feb Mar Apr May Jun Jul Aug Sep Oct Nov Dec
Canada 83,144 9,053 6,902 20,370 10,329 1,569 1,611 2,601 2,540 7,421 13,087 12,305 11,955 10,845 9,943 5,465 3,802
China 66,781 12,368 3,984 22,545 8,746 3,322 4,452 3,382 2,005 2,475 7,850 8,328 9,938 6,118 6,474 2,935 9,448
Denmark 49,951 12,246 8,348 18,803 9,828 2,063 1,761 3,265 3,955 4,519 4,560 8,982 5,792 5,308 5,362 2,588 1,796
Finland 19,895 3,271 3,275 5,986 3,489 498 551 1,125 1,300 2,595 2,576 2,578 1,933 2,150 2,897 905 787
France 85,221 14,749 7,545 35,521 8,007 2,518 3,596 4,483 4,170 5,629 9,234 14,508 20,844 7,213 5,318 3,884 3,824
Germany 132,789 16,649 10,493 57,741 18,501 3,268 3,733 6,099 4,318 9,641 17,433 25,203 26,872 16,849 9,480 5,864 4,029
Italy 31,573 2,969 2,137 15,801 2,910 556 630 1,110 1,023 1,196 3,158 5,439 11,424 2,868 1,467 1,560 1,142
Japan 22,371 8,858 1,229 2,513 3,947 1,800 2,688 2,597 555 737 835 1,028 1,869 3,059 2,377 2,406 2,420
Netherlands 39,098 7,500 3,609 13,607 4,830 1,346 2,012 2,212 1,680 3,437 3,971 5,900 6,596 3,737 3,468 2,471 2,268
Norway 51,012 11,967 10,818 16,847 11,770 1,940 2,238 2,996 4,476 6,475 5,643 6,276 5,591 5,114 5,838 2,804 1,621
Poland 39,613 6,384 3,366 12,479 4,850 1,171 1,153 1,490 2,055 3,326 5,210 6,101 4,525 3,819 3,412 2,867 4,484
Russia 6,320 1,031 581 2,426 839 220 132 142 200 475 803 1,104 1,372 633 467 487 285
Spain 39,183 3,065 2,871 16,244 4,986 782 573 1,663 980 1,538 2,887 6,882 11,010 5,153 2,652 2,423 2,640
Sweden 54,515 9,896 8,470 16,547 8,183 1,738 1,720 2,652 3,187 6,069 6,750 9,073 7,435 5,791 4,745 3,507 1,848
Switzerland 28,682 4,042 2,454 15,014 4,425 554 949 1,158 1,244 1,591 3,213 7,256 6,090 2,879 2,508 660 580
UK 316,395 132,296 29,647 42,203 36,878 27,521 43,123 36,530 23,990 15,860 16,189 18,165 17,558 16,274 31,205 36,594 33,389
USA 415,287 60,340 31,137 107,234 44,094 14,428 16,339 23,587 20,186 32,563 55,510 60,607 59,924 45,378 34,756 30,580 24,429
Other 285,896 52,874 25,765 85,542 35,714 12,265 13,481 18,716 17,011 18,702 27,629 36,230 33,831 32,147 26,173 23,723 25,988
Total 1,767,726 369,558 162,631 507,423 222,326 77,559 100,742 115,808 94,875 124,249 186,538 236,016 241,559 175,335 158,542 131,723 124,780
By market By season* By month
Total Winter Spring Summer Autumn Jan Feb Mar Apr May Jun Jul Aug Sep Oct Nov Dec
Nordic countr. 175,373 37,380 30,911 58,183 33,270 6,239 6,270 10,038 12,918 19,658 19,529 26,909 20,751 18,363 18,842 9,804 6,052
UK 316,395 132,296 29,647 42,203 36,878 27,521 43,123 36,530 23,990 15,860 16,189 18,162 17,558 16,274 31,205 36,594 33,389
Cent-/S-Europe 356,546 48,974 29,109 153,928 43,659 9,024 11,493 16,725 13,415 23,032 39,896 65,188 82,836 38,699 24,893 16,862 14,483
North America 498,431 69,393 38,039 127,604 54,423 15,997 17,950 26,188 22,726 39,984 68,597 72,912 68,879 56,223 44,699 36,045 28,231
Other 420,981 81,515 34,925 125,505 54,096 18,778 21,906 26,327 21,826 25,715 42,327 52,845 51,535 45,776 38,903 32,418 42,625
Total 1,767,726 369,558 162,631 507,423 222,326 77,559 100,742 115,808 94,875 124,249 186,538 236,016 241,559 175,335 158,542 131,723 124,780
* Winter: January-March/November-December, Spring: April-May, Summer: June-August, Autumn: September-October. Source: Icelandic Tourist Board.

12
OVERNIGHT STAYS – ALL
TYPES OF ACCOMMODATION*
The total number of registered overnight
stays in Iceland was around 7.8m in 2016.
The overnight stays of foreign visitors were
around 6.8m in 2016 and have increased by
21.2% annually since 2010. Overnight stays
of Icelanders were around one million in
2016 and have increased by 4.1% since
2010.
OVERNIGHT STAYS BY SEASONS
During 2016, 46.5% of registered overnight
stays were during the summer, 27.9%
during the spring or autumn and 25.7%
during winter. About 3.9 million overnight
stays were spent in the greater Reykjavík
area and in Reykjanes peninsula in 2016, or
about half of the total overnight stays, of
which 37.0% were during winter, 32.5% in
the summer and 30.5% in the spring or
autumn. About half (50.1%) of overnight
stays, or about 3.9 million, were spent in
other parts of the country, of which 60.3%
were during the summer, 25.3% in spring or
autumn and 14.4% in winter.
855 805 854 1,025 1,085 909 1,044
2,1442,444
2,8983,522
4,405
5,561
6,765
2010 2011 2012 2013 2014 2015 2016
OVERNIGHT STAYS IN ALL TYPES OF REGISTERED ACCOMMODATION 2010-16 ('000)
Icelanders Foreigners
3.104 3.378 3.628
929 1.085 1.2672.175 2.227 2.361
1.2811.691
2.178
774957
1.187507 734
991
1.104
1.467
2.003
8531.105
1.439251
362564
2014 2015 2016 2014 2015 2016 2014 2015 2016
Total guest nights Capital Region/Reykjanes Countryside
Winter
Spring/Autumn
Summer
OVERNIGHT STAYS 2016/2015/2014 ('000)
* A summary of overnight stays takes into
account overnight stays which are listed in
Statistics Iceland’s database and does not
include a million unlisted overnight stays that
have been estimated by Statistics Iceland.

13
GUEST NIGHTS BY REGION
2016/2015 Winter: Some 2 million guest nights were spent in the winter of 2016, i.e. 37% more than in 2015. Some 75% of guest nights (i.e. 1.4 million) were spent in the Capital Region and Reykjanes peninsula, 92% of which were spent by foreigners. Outside of the Capital Region and Reykjanes peninsula, most guest nights were spent in South Iceland (15.2% of the total).
Spring/Autumn: Just less than 2.2 million guest nights were spent in the spring and autumn of 2016, i.e. 28% more than in the same period in 2015. Around 54.5% of total guest nights were in the Capital Region and Reykjanes, 22.2% in South Iceland, 12.1% in North Iceland, 7.5% in West Iceland/West-fjords and 3.7% in East Iceland. Foreigners accounted for 87.4% of total guest nights in the spring and autumn of 2016.
Summer: Some 3.6 million guest nights were spent in the summer of 2016, i.e. 9.5% more that in the summer of 2015. Around 35% of total guest nights were in the Capital Region and Reykjanes peninsula, 26.1% in South Iceland, 18.5% in North Iceland, 13.1% in West Iceland and Westfjords and 7.5% in East Iceland. Foreigners accounted for 85.3% of total guest nights in Iceland in the summer 2016.
WINTER (´000)
SPRING/AUTUMN (´000)
SUMMER (´000)
Source: Statistics Iceland.
1.0111.324
174 305
2015 2016 2015 2016 2015 2016 2015 2016 2015 2016
CapitalRegion/Reykjanes
West/Westfjords North East South
Foreigners Icelanders
8741.083
110 134 150 213 296 407
83103
76
2015 2016 2015 2016 2015 2016 2015 2016 2015 2016
CapitalRegion/Reykjanes
West/Westfjords North East South
Foreigners Icelanders
1.0021.169
346 366 501 540206 226
751 791
8398
116 108125 130
41 44
142 154
2015 2016 2015 2016 2015 2016 2015 2016 2015 2016
CapitalRegion/Reykjanes
West/Westfjords North East South
Foreigners Icelanders

14
HOTEL ROOM OCCUPANCY 2016
AVAILABLE ROOMS AND OCCUPANCY RATE
AVAILABLE ROOMS IN HOTELS AND GUESTHOUSES
In July 2016, there were 14,787 rooms available in 470 hotels, hotel apartments and guesthouses in Iceland, 39.8% thereof in the Capital Region. Room availability in 2016 in Iceland was 4.3% higher than in 2015.
2015 2016 Changes between 2015
and 2016 No. % No. %
Capital Region 5,223 36.8% 5,881 39.8% 12.6% Reykjanes 679 4.8% 682 4.6% 0.4% West 995 7.0% 1,023 6.9% 2.8% Westfjords 615 4.3% 616 4.2% 0.2% Northwest 642 4.5% 607 4.1% -5.5% Northeast 1,864 13.1% 1,926 13.0% 3.3% East 951 6.7% 883 6.0% -7.1% South 3,211 22.6% 3,169 21.4% -1.3%
Total 14,180 100% 14,787 100% 4.3%
Rooms in hotels and guesthouses in all
of Iceland have increased by 5,012, or
51.2%, since 2010. The most increase
has been in the Capital Region, where
2,164 rooms have been added since
2010.
However, the number of rooms has
proportionally increased the most in the
Reykjanes peninsula since 2010, as the
number has almost doubled. The next
largest increase has been in the Capital
Region, or 58.2%, and in the South, or
48.4%.
OCCUPANCY RATES IN HOTELS (%)
Nationwide room occupancy in year-round hotels was 71.2% in 2016, which is 51.8% increase from 2010 when it was 46.9%.
In 2016, the best utilization was in the Capital Region, or 85.5%, followed by Reykjanes with 72.7%.
There was an annual increase in room occupancy from 2015 to 2016 during 11 months of the year in the Capital Region, in South Iceland and in North Iceland, 9 months of the year in Suðurnes, in West Iceland and the Westfjords and 8 months in East Iceland.
Occupancy was more than 75% in the Capital Region ten months of the year in 2016. In the Reykjanes peninsula, occupancy was more than 75% five months of the year in 2016. Occupancy was at its highest in the summer months (July/August) outside the Capital Region. Outside of the capital area and Reykjanes, the utilisation went below 25% for a few months during the winter of 2016.
Capital Region
Reykjanes peninsula
West, Westfjords
North East South
‘15 ‘16 ‘15 ‘16 ‘15 ‘16 ‘15 ‘16 ‘15 ‘16 ‘15 ‘16
J 73 72 37 40 25 16 18 17 6 7 20 24 F 88 92 60 59 32 31 26 27 12 13 39 49 M 85 89 62 67 32 37 25 35 20 16 45 56 A 70 73 55 55 26 34 30 49 20 26 33 43 M 75 79 72 51 43 45 41 45 37 40 45 53 J 81 88 84 86 72 74 64 70 70 73 72 74 J 90 94 88 98 87 87 79 88 90 84 90 89 A 86 93 82 97 76 82 76 89 87 84 82 87 S 74 85 70 93 55 61 55 72 51 58 59 66 O 77 86 61 87 34 36 32 47 26 26 48 62 N 76 91 44 74 24 35 24 27 12 14 32 48 D 66 85 39 66 13 22 14 16 7 8 26 50
Total 78 86 63 73 43 47 40 49 37 38 49 59
>75% utilisation
50-74% utilisation
25-49% utilisation
<24% utilisation
Source: Statistics Iceland.
Further information may be seen on
the Statistics Iceland website.
From 2016, overnight stay ratios for the municipality of Hornafjörður were
categorised with Southern Iceland instead of with the Eastern Fjords.
.

15
GUEST NIGHTS BY TYPE OF ACCOMMODATION
GUEST NIGHTS IN HOTELS AND GUESTHOUSES
In 2016, the total number of guest nights in hotels and guesthouses
was approximately 5.1 million, i.e. 25.8% more than in 2015. Guest
nights spent by foreigners were 88.4% of the 2016 total and
accounted for 90.4% increase in guest nights between years (2015-
2016).
2015 2016 Increase/decrease 2015-16 Number % Number %
Foreigners 3,613,046 87.9% 4,571,713 88.4% 26.5%
Icelanders 495,844 12.1% 598,019 11.6% 20.6%
Total 4,108,890 100% 5,169,732 100% 25.8%
Guest nights in hotels and guest houses increased every month in 2016 as compared to the previous year. The proportional distribution of guest nights across the seasons in 2015 was as follows: 38% in summer, 31% in spring and autumn and 31% in winter. Seasonal fluctuations applied to a lesser extent to Icelanders.
Twenty nationalities accounted for 94% of guest nights in hotels and guesthouses in 2016. The vast majority of overnight stays in hotels and guesthouses were from visitors from the US, Britain, Germany and Iceland, or 67.4% of the total.
OTHER ACCOMMODATION (‘000) Registered overnight stays in accommodation other than hotels and guesthouses was 2.6 million in 2016, 8.7% more than in 2015. Most of them were spent in camping sites (35.5%), residential housing (21.0%) and hostels (18.5%). Overnight stays by foreigners were 83.1% of the total in other accommodation, 10% more than in 2015, and the highest growth rates were for overnight stays in camp sites.
Foreigners Icelanders Total
2015 2016 2015 2016 2015 2016
Camping sites 534 665 258 272 792 937 Apartments 482 525 20 29 502 554 Youth hostels 440 456 38 32 478 488 Holiday centres 223 246 42 61 265 306 Private home acc. 206 229 27 20 233 250 Lodges/sleeping bag 63 71 27 33 90 104
Total 1,993 2,192 435 447 2,427 2,639
Source: Statistics Iceland.
15
3
19
1
19
8 27
9
22
3 31
4
17
7
23
6
27
1 33
5 44
9
50
6 59
7
64
9
56
7 63
1
33
3 45
1
25
5 36
4
20
8 31
6
18
3 29
9
24
31 31
40
38
51
37
52 46
51
54
55
59
67
60
66
46
58
40
53
32
40
27
35
15 16 15 16 15 16 15 16 15 16 15 16 15 16 15 16 15 16 15 16 15 16 15 16
J F M A M J J A S O N D
OVERNIGHT STAYS IN HOTELS AND GUESTHOUSES ('000)
Foreigners Icelanders
1.12
2
933
618
598
233
179
135
127
124
122
116
108
101
90 85 40 40 32 28 26
USA U
K
Ger
man
y
Icel
and
Fran
ce
Ch
ina
Swed
en
Can
ada
NL
Den
mar
k
Spai
n
CH
No
rway
Ital
y
Jap
an
Fin
lan
d
Bel
giu
m
Au
stri
a
Isra
el
Irel
and
2015 2016GUEST NIGHTS BY NATIONALITY('000)

16
INTERNATIONAL VISITORS IN ICELAND 2015-2016 The Icelandic Tourist Board asked Maskina to carry out an Internet survey among international visitors in the period October 2015 to August 2016, based on e-mail addresses collected at Keflavík Airport. The final sample was 9,286 people, with a response rate of 45%. In processing the statistics, the travel year was divided into two periods, i.e. winter (Oct.-May) and summer (June-August). Nine demographic categories were used: nationality markets, gender, age, career, income, education, career, type of trip and means of travel to Iceland.
WINTER SUMMER
GENDER Female 65.6% 58.5% Male 34.4% 41.5% AGE (average age) 37,0 yrs 38,0 yrs 34 years and younger 47.0% 51.7% 35-54 years 33.4% 32.4% 55 years and older 19.6% 15.9% LEVEL OF TOTAL HOUSEHOLD INCOME Low/low average 16.3% 21.7% Average 42.8% 39.7% High average/high 41.0% 38.7% RESPONDENTS BY MARKET Nordic countries 6.3% 6.4% United Kingdom 19.6% 8.0% Central-/South Europe 17.8% 47.3% North America 46.2% 31.3% Other 10.1% 7.0% TYPE OF TOUR Package trip 19.9% 11.1% Individually arranged trip 79.9% 89.0% Work-related trip 2.1% 1.3% Package trip/individually arranged trip 1.6% 1.3% PURPOSE OF VISIT Vacation/holiday 91.4% 90.9% Conference/meeting 1.6% 1.3% Visiting friends and relatives 5.2% 5.1% Event in Iceland 4.7% 5.9% Business/employment 2.2% 1.2% Study/research 3.1% 2.1%
WHY DID THE VISITOR COME TO ICELAND (%) As in earlier surveys performed by the Tourist Board, the majority of respondents mentioned interest in nature and the country when asked why they decided to come to Iceland. Many mentioned friends and relatives, the Internet, international footage, from articles about Iceland and a previous visit. Other aspects had less of an influence.
WHEN WAS THE DECISION MADE AND THE TRIP BOOKED
About 54% of tourists in the winter and 21% in the summer had the
idea to travel to Iceland within 6 months. The time from booking to
departure was shorter than 6 months in 28% of cases with tourists
during the winter and in 54% of cases during the summer.
8%
9%
11%
11%
11%
16%
17%
47%
58%
7%
10%
9%
10%
11%
12%
24%
46%
47%
Tourist brochure/guidebook
Travel agent or airline
Icelandic music
Previous visit
Article in newspaper/magazine
International movies/documentaries/TV
Social media/websites
From friends/relatives
General interests in nature/country
WHERE DID YOU GET THE IDEA OF COMING TO ICELAND?
WinterSummer
21%
54%
26%
20%
54%
26%
Summer
Winter
WHEN DID YOU FIRST THINK OF TRAVELLING TO ICELAND?
<6 months 6-12 months >1 yrs.
8%
28%
13%
26%
26%
20%
54%
26%
Summer
Winter
HOW LONG BEFORE DEPARTURE WAS THE TRIP BOOKED?
<3 months 3-6 monhts 6-12 months >1 yrs.

17
FACTORS INFLUENCING DECISION TO TRAVEL TO ICELAND
A large majority of winter and summer visitors said that nature had
influenced their decision to come to Iceland. Many mentioned that they
had always wanted to visit the country and there were many who
mentioned the culture and history. Favourable price offers were often
mentioned by winter visitors. Other aspects, however, lagged far behind.
SOURCE OF INFORMATION ON ICELAND (%)
The Internet is the main source of information about Iceland. When
asked specifically about the use of social media on the eve of a trip or
while travelling around Iceland, it was found that such media is used
extensively to send a private messages, when planning a trip and to get
ideas about travel opportunities as well as posting updates.
TRAVELLING COMPANION
Most visitors travelled to Iceland with their spouses, friends and
family members. Few travelled with a tour group or business
partners.
MEANS OF TRAVEL
Tour coaches were used extensively during the winter. The same can
be said of scheduled coaches and rental cars, although a larger
proportion used rental cars during the summer than in the winter.
5%
9%
13%
13%
19%
32%
56%
83%
10%
8%
17%
14%
37%
34%
57%
74%
Special event in Iceland
Friends/Relatives
Spa/Wellness
Stopover opportunity
Price offer/Low airfare
Icelandic culture or history
Always wanted to visit
Icelandic nature
Winter
Summer
12%
13%
20%
26%
29%
51%
13%
15%
25%
37%
28%
51%
When interacting with Icelandiccompanies/organisations
When booking components of your trip
When asking for ideas about what to do,see, where to stay, how to get around etc.
When posting status updates about yourupcoming trip to Iceland
When planning your trip
When sending personal messages
Winter
Summer
1%
3%
6%
11%
12%
15%
31%
36%
2%
2%
3%
5%
16%
15%
30%
38%
Business associate(s)
Boyfriend/girlfriend
Tour group
Family/children <18 yrs
Travelling alone
Family/children <18 yrs
Friends
Spouse
WinterSummer
5%
7%
9%
16%
27%
34%
54%
3%
2%
16%
10%
44%
26%
45%
Domestic flight
Domestic ferry
Taxi
Car (private)
Coach (organised tour)
Coach (regular routes)
Rented car
Winter
Summer

18
LENGTH OF STAY
Foreign visitors stayed on average 10.3 nights in Iceland during the
summer and 6.8 nights during winter. About 41% of tourists during
the summer spent seven nights or fewer and about 42% in winter
four nights or fewer.
OVERNIGHT STAYS BY REGION
Approximately 63% of overnight stays during the summer were spent
in the capital area and around 42% of overnight stays during the
winter.
RECREATIONAL PURCHASED IN ICELAND
Tourists in winter, as in the summer, were particularly interested in
activities related to nature, health and well-being. Swimming was the
activity that most tourists paid for during winter and summer. A
much larger proportion of visitors went on various guided tours
during the winter, whilst more visitors went on visits to geothermal
pools, whale watching tours, boating and horse riding tours during
the summer. Summer tourists visited museums and exhibitions to a
much greater extent. Numerous other activity options were utilised.
18%
16%
25%
24%
12%
5%
3%
3%
15%
36%
36%
6%
>15 nights
12-14 nights
8-11 nights
5-7 nights
3-4 nights
1-2 nights
Winter
Summer
42%
63%
19%
12%
13%
11%
26%
14%
Summer
Winter
Capital Region/Reykjanes South North Other regions
13%
2%
13%
14%
20%
31%
34%
35%
43%
61%
16%
35%
13%
12%
25%
51%
22%
10%
35%
62%
Glacier-/snowmobile trip
Northern lights tour
Art gallery
Guided hiking or mountaintrip
Spa/Wellness
Guided tour
Bathing in nature bath
Whale watching
Museum
Geothermal swimming pool
Winter
Summer

19
TO WHAT REGIONS AND PLACES
DID VISITORS TRAVEL
MOST VISITED LOCATIONS
Of 42 places and areas surveyed, Iceland’s
most visited tourist destinations were in
the Southwest and South Iceland:
As can be seen from the graph to the side, there was a big difference in the response between tourists arriving in summer and in winter concerning their thoughts on the number of tourists at a few destinations. About 54% of summer tourists felt there were too many people at Geysir and Gullfoss, 40% that there were too many at Jökulsárlón and Þingvellir and one-third that they were too many in Landmanna-laugar, Reykjavík, Mývatn and at Dettifoss.
Winter Summer Winter Summer Reykjanes 36.2% 39,8% East 15,6% 44,8%
Blue Lagoon 26.3% 23,4% Egilsstaðir/Hallormsstaður 7,8% 31,8%
Reykjanes lighthouse & surr. 14.0% 18,1% Djúpivogur 7,0% 18,9%
Reykjanesbær 15.7% 17,1% Borgarfjörður eystri 3,3% 13,4%
West 29.0% 48,4% Eskifjörður 3,5% 15,6%
Borgarfjörður 14.9% 23,0% Seyðisfjörður 6,3% 28,0%
Húsafell/Reykholt 9.5% 18,2% Neskaupsstaður/Norðfjörður 2,5% 8,3%
Snæfellsnes national park 19.4% 36,0% Stöðvarfjörður 4,0% 11,5%
Stykkishólmur 8.8% 20,3% South 55,0% 71,2%
Búðardalur/Dalir 5.8% 13,4% Þingvellir 41,4% 56,8%
Westfjords 8.4% 20,0% Geysir/Gullfoss 48,0% 62,6%
Ísafjörður 3.9% 11,9% Vestmanna-islands 2,7% 7,9%
Hólmavík/Strandir 3.8% 10,7% Vík 41,5% 56,6%
Arnarfjörður/Dynjandi 2.8% 8,6,% Skógar 31,8% 48,6%
Látrabjarg 1.6% 7,2% Eyrarbakki 8,7% 13,4%
Hornstrandir 1.2% 3,5% Hornafjörður 9,3% 16,8%
North 17.3% 50,2% Jökulsárlón (glacier lagoon) 30,6% 50,2%
Akureyri 14.5% 46,2% Skaftafell National Park 27,7% 46,4%
Skagafjörður 6.4% 20,1% Þórsmörk 10,4% 25,8%
Mývatn 12.6% 45,3% Highlands 9,6% 29,6%
Húsavík 6.2% 33,3% Landmannalaugar 2,4% 19,8%
Hvammstangi/Hvítserkur 4.7% 14,3% Kjölur (incl.Hveravellir) 2,9% 9,4%
Ásbyrgi/Dettifoss 8.2% 40,1% Sprengisandur 1,5% 4,7%
Melrakkaslétta/Þórshöfn 1.3% 4,2% Kárahnjúkar 0,3% 1,4%
Reykjanes 36,2% 39,8% Herðubreiðalindir/Askja 0,7% 7,7%
30%
71%
45%
50%
20%
48%
40
47
96%
10%
55%
16%
17%
8%
29%
36
55%
97%
Highlands
South
East
North
Westfjords
West
Reykjanes
Reykjavík surr.municipalities
Reykjavík
WinterSummer
1610 11
711
15 138
22
149
25 28
18
34
23 2218 20
33 32
20
4035 34
5154
40
Rey
kjav
ík
Hú
safe
ll
Snæ
fells
ne
s
Ísaf
jörð
ur
Aku
reyr
i
Mýv
atn
Det
tifo
ss
Seyð
isfj
.
Jöku
lsár
lón
Skaf
tafe
ll
Lan
dm
ann
a-la
uga
r
Gu
llfo
ss
Gey
sir
Þin
gvel
lir
GUEST NUMBERS - RESPONDENTS WHO FELT THERE WERE TOO MANY TOURISTS (%)
Winter Summer

20
EVALUATION OF TOURISM SERVICES In the survey, respondents are asked to evaluate 28 aspects of Icelandic tourism and score them in the range 0–10*.
MOST MEMORABLE ASPECT OF VISIT TO ICELAND The vast majority of winter and summer tourists mentioned nature-related aspects, specific locations or nature-related activities when asked what three things had been most memorable about their trip to Iceland. Many mentioned also the people, generous hospitality, the food and the restaurants.
6,92
7,33
7,50
7,66
7,82
7,84
7,9
7,91
7,92
7,98
7,98
8,04
8,07
8,07
8,14
8,14
8,15
8,16
8,18
8,19
8,23
8,32
8,42
8,46
8,50
8,50
8,83
8,87
8,05
7,81
8,09
8,19
8,47
8,25
8,42
8,40
8,37
8,45
8,68
8,42
8,22
8,74
8,54
8,46
8,36
8,19
8,46
8,41
8,32
8,45
8,80
8,65
8,70
8,72
8,97
8,97
Number of guests on tourist sites
Variety of restaurants
Sanitary facilities
Road conditions
Accommodation facilities
Variety of cultural activities
Conduct of guests
Overall quality of restaurants
Road system
Services at the restaurants
Accommodation service
Quality of food in restaurants
Signposts (road names, road numbers)
Overall quality of accommodation
Overall quality of culturally based activities
Services in culturally based activities
Security factors (warning signs, hazard…
Signposts (service signs, warning signs)
Variey of health-related activities
Tourist information and signposts
Rest areas/viewpoints
Accessibility (paths, viewpoints and the…
General conditions of tourist sites
Services health-related activities
Overall quality of health-related activities
Service in nature-based activities
Overall quality of nature-based activities
Variety of nature-based activities
Winter
Summer8%
8%
8%
8%
8%
10%
11%
11%
15%
15%
19%
28%
8%
8%
10%
12%
12%
12%
13%
17%
24%
24%
28%
Glaciers
Hot springs/Geothermal heat
Geysers
Reykjavík
Food/Restaurants
Hiking/Trekking
Blue Lagoon
Whales/Whalewatching
Waterfalls
Glacier lagoons/Icebergs
People/Hospitality
Nature/Landscape
Gullfoss/Golden waterfall
Glacier lagoons/Icebergs
Geysers
Golden Circle
Food/Restaurants
Reykjavík
Waterfalls
People/Hospitality
Blue Lagoon
Nature/Landscape
Northern lights
Sum
mer
Win
ter
*Aspects relating to nature and health-related recreation scored the
highest and aspects relating to the number of visitors, range of
restaurants, hygiene facilities and road conditions scored the lowest.

21
WHAT CAN BE IMPROVED IN ICELANDIC TOURISM?
Foreign visitors during the winter and summer felt that there could
be a number of improvements to Icelandic tourism, and numerous
aspects were mentioned in this regard, e.g. road conditions,
restriction of the number of tourists, public toilets, food costs, nature
conservation, high prices and road signs.
Winter Summer
Road conditions 10.3% 18.6% Limit tourist numbers 7.1% 16.9% Public restrooms 12.5% 16.0% Food expenses 8.2% 13.4% Nature conservation 6.4% 11.7% Prices very high (in general) 12.0% 11.2% Camping 0.7% 10.5% Road signs 12.7% 9.1% A variety of tour options 6.9% 7.6% Price of accommodation 1.9% 6.7% Variety of accommodation 2.1% 6.7% Maps 2.0% 6.4% Public transportation 10.6% 6.0% Garbage disposal 0.9% 5.0% Panoramic viewpoints/Rest areas 2.6% 4.5% Marking and organisation of footpaths 0.9% 4.5% Airport 3.4% 4.3% Services and variety of food/restaurants 7.7% 3.8% Offers/Discounts 0.6% 3.8% Quality of accommodation 1.8% 3.3% Bus-/Public transport 2.2% 2.9% Information in other languages 2.8% 2.9% Arrangement/Organisation - 2.6% Safety 2.0% 2.6% Hiking - 2.6% Information availability 4.7% 2.1% Cost of transport - 2.1% Impolite people/staff 2.5% 2.1%
SATISFACTION WITH THEIR TRIP TO ICELAND
Trips to Iceland exceeded expectations of 95% of respondents in the
winter and summer. Approximately 90% of winter visitors and 80% of
summer visitors thought it very likely or likely that they would return
to Iceland.
Approximately 56% of winter guests thought it likely that they would
come back during summer, 30% in spring or autumn and 14% in
winter. Approximately half of the summer visitors expected to come
back in the summer, about 30% in spring or autumn and about a
quarter in winter.
NET PROMOTER SCORE
Based on the survey findings, NPS was calculated for Iceland as a
tourist destination. This is a scale that is widely used to predict the
proportion of people willing to recommend, for example, a tourist
destination, company or product and the proportion of those who are
more likely to advise against the same factors.
The NPS score was 80.7 points for winter respondents and 71.6 points
for summer respondents.
64.1%
25.8%
7.0%2.0% 1.1%
50.4%
31.2%
11.0%4.6% 2.7%
Very likely Rather likely Neutral Rather unlikely Very likely
Winter Summer
The survey consists of questions about the reason for the trip to
Iceland, travel behaviour, spending, spending habits and tourism
attitudes towards various aspects of Icelandic tourism and can be
accessed on the Icelandic Tourist Board website.
.

22
TRAVELS OF ICELANDERS 2016/2015/2014
The Icelandic Tourist Board has for many years conducted surveys among Icelanders on their domestic and international travels. A survey from January 2017 was based on a 1,370-person sample selected randomly from MMR's 18,000-person opinion group, which was randomly selected from the National Register. The response proportion was 66.4%. The results were processed according to several demographic categories: gender, age, residence, education, employment, income and length of stay.
GENDER 2014 2015 2016
Female 47% 49% 49% Male 53% 51% 51% AGE 18-39 years 47% 44% 44% 40-59 years 40% 36% 36% 60-80 years 13% 19% 19% RESIDENCY Capital Region 62% 64% 64% Communities near the Capital Region 14% 12% 12% Rest of Iceland 24% 24% 25% HOUSEHOLD INCOME (ISK) Less than 249,000 14% 12% 8% 250,000-399,000 17% 15% 14% 400,000-599,000 21% 21% 22% 600,000-799,000 17% 17% 16% 800,000 and more 31% 35% 40% JOB Managers and experts 28% 29% 27% Technicians and office workers 13% 14% 17% Waiters and shop assistants 12% 15% 12% Tradesmen & industrial specialists 8% 9% 8% Machinists/workers/seamen/farmers 9% 8% 12% Students 15% 11% 10% Not employed outside the home 15% 14% 14%
TRIPS UNDERTAKEN IN ICELAND OR OVERSEAS
Approximately 84% of respondents travelled domestically in 2016,
slightly fewer than in 2014 and 2015. However, more respondents
went abroad in 2016 than in previous years, or 77%, while 67% went
abroad in 2014 and 71% in 2015.
NUMBER OF TRIPS
Those who went abroad in 2016 went on average 2.5 trips, as many
trips as in 2014 and 2015. Those who went on a day trip also did as
many day trips, or around five in total. Those taking domestic trips
away from home with at least one overnight stay took, on average,
5.9 trips, fewer than in 2014.
27%
23%
18%
7%
9%
11%
61%
62%
66%
6%
6%
5%
2014
2015
2016
TRAVELS IN ICELAND OR ABROAD
Only within Iceland Only overseas Both within Iceland and overseas Did not travel
2.5 trips
5.1 trips5.9 trips
Overseas trips Domestic day-trips Domestic trips
NUMBER OF TRIPS TAKEN
2014 2015 2016

23
- OVERSEAS TRIPS
NUMBER OF TRIPS AND LENGTH OF STAY
Some 77% of respondents went abroad in 2016 and went on an
average of 2.5 trips. The largest number, or 35%, took one trip, 31%
took two trips, 17% took three trips and 18% took four trips or more.
The average length of stay for overseas trips was 18.8nights ¹ in 2016,
around one night longer than in 2014 and 2015. Around 17% stayed
between one and six nights, almost a quarter stayed seven to thirteen
nights, about a quarter stayed two to three weeks and about a third
stayed more than three weeks.
¹Those staying longer than 100 nights were not included in the data.
WHAT KIND OF TRIP AND WHERE?
The majority went on a city or town break overseas, a visit to friends
or relatives, sun-seeking holidays and a work-related trip in 2016.
Travels of Icelanders in 2016 were largely limited to Spain, Portugal,
the UK, USA, Canada, Scandinavia, Germany and France.
35%31%
17%
9% 9%
1 trip 2 trips 3 trips 4 trips >5 trips
HOW MANY OVERSEAS TRIPS WERE TAKEN?
2014 2015 2016
17%
24%27%
31%
1-6 nights 7-13 nights 2-3 weeks >3 weeks
HOW MANY NIGHTS WERE SPENT OVERSEAS?
2014 2015 2016
15%
5%
2%
4%
5%
11%
23%
33%
36%
48%
Other
Various speciality trip
Skiing trip
Golf trip
Educational trip
Sports trip
Work-related
Sun-seeking holiday
Visit friends or relatives
City break
WHAT KIND OF OVERSEAS TRIP WAS TAKEN?
2016
2015
2014
6%
7%
8%
8%
11%
15%
16%
19%
23%
31%
33%
CH/Austria
Italy
Benelux
Norway
Sweden
France
Germany
Denmark
USA/Canada
UK/Ireland
Spain/Portugal
WHICH COUNTRIES WERE VISITED?
2016
2015
2014

24
- DOMESTIC DAY TRIPS ¹
Some 63% took a day-trip in 2016, on average 5.1 times. One-quarter
went on one to three trips, about 12% on four to five trips and almost
a quarter on six trips or more.
Most day-trips were to South Iceland, followed by West Iceland,
Reykjanes, Greater Reykjavík, Reykjanes and North Iceland.
WHERE WERE DAY-TRIPS TAKEN IN 2016?
Took a day-trips
Average no. of trips
% of day-trips
South 59% 4,6 33% West 33% 3,2 13% Capital Region 25% 6,4 19% Reykjanes 24% 2,6 8% North 22% 5,9 16% East 7% 7,9 7% Westfjords 7% 3,7 3% Highlands 5% 2,5 1%
¹ Recreational trip lasting at least 5 hours and spent away from the home without
staying overnight.
LOCATIONS VISITED ON DAY-TRIPS
Of the 56 locations asked about in various part of Iceland, the
following were most often visited.
37%
11%
13%
12%
7%
9%
10%
Did not take day-trip
>10 trips
6-10 trips
4-5 trips
3 trips
2 trips
1 trip
HOW MANY DAY-TRIPS WERE TAKEN?
2016
2015
2014
6%
7%
7%
7%
7%
7%
7%
8%
8%
9%
9%
9%
10%
12%
12%
12%
13%
14%
15%
18%
25%
25%
Vík
Stykkishólmur
Skógar
Húsafell/Reykholt
Húsavík
Westmann-Islands
Snæfellsnes National Park
Skagafjörður
Siglufjörður
Reykjanes lighthouse etc.
Mývatn
Krísuvík
Akureyri
Grindavík
Hvalfjörður
Akranes
Eyrarbakki
Reykjanesbær
Borgarnes
Geysir/Gullfoss
Capital Region
Þingvellir
WHICH AREAS/PLACES WERE VISITED ON DAY-TRIPS?
2016
2015

25
- DOMESTIC TRAVELS ¹
LENGTH OF STAY IN ICELAND
Approximately 87% travelled domestically in 2016, on average six
times. Just over a third went on 1–2 trips, just more a third on 3–5
trips and just less than a third on six or more.
July was the most popular month for trips in 2016, closely followed
by August and June. Fewer travelled at other times.
¹ Travel away from home and staying away for one or more nights.
OVERNIGHT STAYS BY REGION
The average length of stay was 14.5 nights in 2016, i.e. the same as in
2015. Around 30% stayed for less than a week, 31% for one to two
weeks, 19% for two to three weeks and 20% more than three weeks.
The findings on length of stay by region show that around half of
guest nights were spent in South Iceland and North Iceland in 2016,
similar to 2015.
ACCOMMODATION OPTIONS USED DURING TRAVEL
The majority stayed with friends or relatives, in tent, trailer tent or
motor home and in summer cottages or privately owned apartments.
Stays in cottages or apartments owned by associations were also
extensively used, while hotels and guesthouses came thereafter.
Other form of accommodation were less used.
15%
20%
15%
21%19%
11%
1 trip 2 trips 3 trips 4-5 trips 6-10 trips >10 trips
HOW MANY TRIPS WERE TAKEN?
2014 2015 2016
14% 15%19%
23%27%
49%
68%
59%
26%22% 18% 19%
J F M A M J J A S O N D
IN WHICH MONTH WAS THE TRIP TAKEN?
2014 2015 2016
15%
10%
17%
18%
8%
9%
23%
24%
8%
10%
27%
27%
3%
2%
2015
2016
Capital region/Reykjanes West Westfjords North East South Highlands
30%
35%
36%
40%
41%
Hotel/guesthouse
Privately owned summercottage or apartment
Association-ownedholiday cottage
Tent/trailer/motor home
Stayed with friends orrelatives
WHAT ACCOMMODATION WAS USED WHEN TRAVELLING?
2016
2015
2014

26
REGIONS AND PLACES
VISITED BY ICELANDERS
MOST VISITED DESTINATIONS
Of the 56 locations specifically mentioned in
the survey carried out by the Tourist Board,
the following were most visited in 2016:
1. Akureyri 38% 2. Capital Region 27% 3. Borgarnes 21% 4. Egilsstaðir/Hallormsstaður 15% 5. Húsafell/Reykholt 14% 6. Þingvellir 14% 7. Geysir/Gullfoss 14% 8. Skagafjörður 14% 9. Stykkishólmur 13% 10. Siglufjörður 12% 11. Mývatn 12% 12. Hvalfjörður 12%
2015 2016 2015 2016 Reykjanes peninsula 11% 14% East 22% 23% Reykjanesbær 8% 9% Egilsstaðir/Hallormsstaður 13% 15%
Grindavík 5% 5% Seyðisfjörður 4% 6%
Sandgerði 3% 2% Djúpivogur 5% 5%
Reykjanes lighthouse & surr. 2% 2% Borgarfjörður eystri 5% 4%
Krísuvík 2% 2% Eskifjörður 5% 4%
Blue Lagoon 2% 1% Stöðvarfjörður 3% 3%
West 46% 46% Vopnafjörður 3% 2% Borgarnes 20% 21% South 62% 58%
Húsafell/Reykholt 14% 14% Þingvellir 18% 14%
Stykkishólmur 11% 13% Geysir/Gullfoss 17% 14%
Snæfellsnes National Park 12% 11% Vík 9% 11%
Hvalfjörður 10% 12% Kirkjubæjarklaustur 10% 9%
Dalir 8% 8% Vestmanna-islands 10% 9%
Akranes 8% 7% Skógar 9% 8%
Westfjords 20% 20% Hornafjörður 8% 8%
Ísafjörður 10% 10% Jökulsárlón (glacier lagoon) 6% 7%
Hólmavík/Strandir 7% 7% Eyrarbakki 8% 6%
Patreksfjörður 6% 6% Skaftafell 6% 5%
Djúpavík 2% 3% Þórsmörk 3% 4%
Hrafnseyri 3% 2% Highlands 10% 8%
Látrabjarg 3% 2% Landmannalaugar 3% 3%
Hornstrandir 2% 2% Kjölur (incl. Hveravellir) 2% 3%
Flatey in Breiðafjörður 1% 2% Sprengisandur 2% 2%
North 52% 55% Herðubreiðalindir/Askja 1% 2%
Akureyri 35% 38% Kárahnjúkar 1% 1%
Skagafjörður 15% 14% Kverkfjöll 0% 1%
Siglufjörður 12% 12% Lakagígar 0% 0%
Mývatn 10% 12%
Húsavík 9% 10%
Hvammstangi 6% 7%
Ásbyrgi 5% 5%
Dettifoss 5% 3%
Þórshöfn 3% 3%
8%
14%
20%
23%
27%
46%
55%
58%
Highlands
Reykjanes
Westfjords
East
Capital Region
West
North
South
2016
2015

27
RECREATIONAL ACTIVITIES
Of activities paid for during the trip in 2016, many visited the
swimming pools/baths, museums/exhibitions, concerts/theatres and
took part in fishing and golf. Concerts/town festivals were asked
about specifically in the 2017 survey, and 12% stated that they had
paid for them; the same applies to skiing trips, where 8% paid for
them. Other activities were used to a lesser extent, such as spa and
fitness activities and excursions of various kinds, e.g. whale watching,
horse-riding and glacier trips. Around 34% did not pay for activities.
QUALITY AWARENESS
Around one-third of respondents in the survey in 2016 and 2017
claimed that having a recognised quality/environmental certification
would have a major impact on their choice of tourism company, a
higher proportion of respondents than in 2015.
TYPE OF TRIPS PLANNED FOR 2017
Approximately 90% have plans for travel in 2017. Of these, 58% are
planning a trip to a summerhouse within Iceland, around 51% will
visit friends or relatives, 42% will go on a city trip abroad, 32% on a
trip within Iceland with friends, 28% on a holiday in the sun, 28% on
a city or town trip within Iceland, 18% on an outdoor activities trip of
some kind and 24% intended to simply follow the good weather.
Approximately 11% have no plans for travel.
7%
8%
14%
21%
45%
Golf
Fishing
Theatre/concerts
Museums/exhibitions
Swimming/nature baths
WHAT RECREATIONAL ACTIVITIES WERE PAID FOR WHEN TRAVELLING?
2016
2014
2015
41%
28%
29%
23%
37%
35%
HOW MUCH OR LITTLE EFFECT DOES A QUALITY OR ENVIRONMENTAL CERTIFICATION HAVE ON YOUR CHOICE OF A TRAVEL SERVICE COMPANY WHEN TRAVELLING DOMESTICALLY?
Not at all or slightly important Fairly or very important
2017
2015
2016
18%
3%
18%
25%
32%
48%
4%
3%
5%
9%
10%
12%
19%
19%
24%
24%
42%
50%
Other
Skiing trip
Work-related travel
Visit friends and relatives
Sun-seeking holiday
City break
Other
Educational trip
Cultural/health/spa trip
Skiing trip
Sports trip
Work-related travel
Outdoor recreation
Chasing good weather
Travel with friends
City/town break
Visit friends and relatives
Summer cottage trip
Tra
vel o
vers
eas
Tra
vel i
n Ic
elan
d
WHAT KIND OF TRIPS ARE PLANNED FOR 2017?

28
- SUBJECTIVE ASSESSMENT
EFFECTS OF TOURISM AND FOREIGN TRAVELLERS
The majority of respondents of the survey in 2017, or 79%, felt that
the burden of tourists on Icelandic nature was too high. The
proportion of respondents with this view has increased year after
year, i.e. according to surveys, the percentages were 63% in 2014,
66% in 2015 and 76% in 2016. Nearly half believed that tourists
have increased Icelanders’ interest in nature, less than before.
Around a third believed that tourism has resulted in a wider range
of services that they were able to take advantage of, which is
somewhat lower than previous surveys show. More than half of
respondents suggested that tourism had created desirable jobs in
their home town, but this rate seems to be falling, as 59% agreed
with this statement in 2014 and 56% in 2015 and 2016. About 40%
agreed that tourists had increased Icelanders’ interest in their own
culture, which is a much lower rate than has been observed in
previous surveys.
NUMBER OF TOURISTS
When respondents were asked how they felt about the number of
tourists, 71% said the number of tourists was slightly or far too high
during the summer and about a third said the same about winter.
More than half thought it was reasonable during the winter and
about a quarter that it was reasonable during the summer. Only 3%
considered tourists to be too few in the summertime, while 13%
considered tourists to be too few in winter. The same question was
submitted in a survey conducted by the Social Sciences Institute on
behalf of the Icelandic Tourist Board at the end of 2014, but the
results were somewhat different. Then, 2% felt that the number of
tourists during the summer was too high and only 3% felt the same
about winter.
36%
39%
47%
54%
79%
Tourism has led to a wide range of services
Tourists have increased Icelanders' interestin their own culture
Tourists have increased Icelanders' interestin Icelandic nature
Tourism has created attractive jobopportunities
Tourist pressure on Icelandic nature is toohigh
ASSESSMENT OF THE EFFECTS OF TOURISM -Those (%) who agreed with the statements
2017
2017
2016
2015
9%
65%
29%
49%
48%
3%
3%
26%
71%
13%
54%
34%
Too few
Reasonable
Too many
Too few
Reasonable
Too many
Sum
mer
Win
ter
WHAT DO YOU THINK OF THE NUMBER OF TOURISTS?
2017
2014
Survey among Icelanders may be
found on ITB website.