TOURISM ECONOMIC IMPACT REPORT · 2 2017 ECONOMIC IMPACT REPORT | VISIT MISSISSIPPI FY 2017...
52
TOURISM ECONOMIC IMPACT REPORT TWO THOUSAND SEVENTEEN
Transcript of TOURISM ECONOMIC IMPACT REPORT · 2 2017 ECONOMIC IMPACT REPORT | VISIT MISSISSIPPI FY 2017...

1 2 0 1 7 E C O N O M I C I M P A C T R E P O R T | V I S I T M I S S I S S I P P I
T O U R I S M E C O N O M I C I M P A C T R E P O R T
T W O T H O U S A N D S E V E N T E E N
2 0 1 7 E C O N O M I C I M P A C T R E P O R T | V I S I T M I S S I S S I P P I
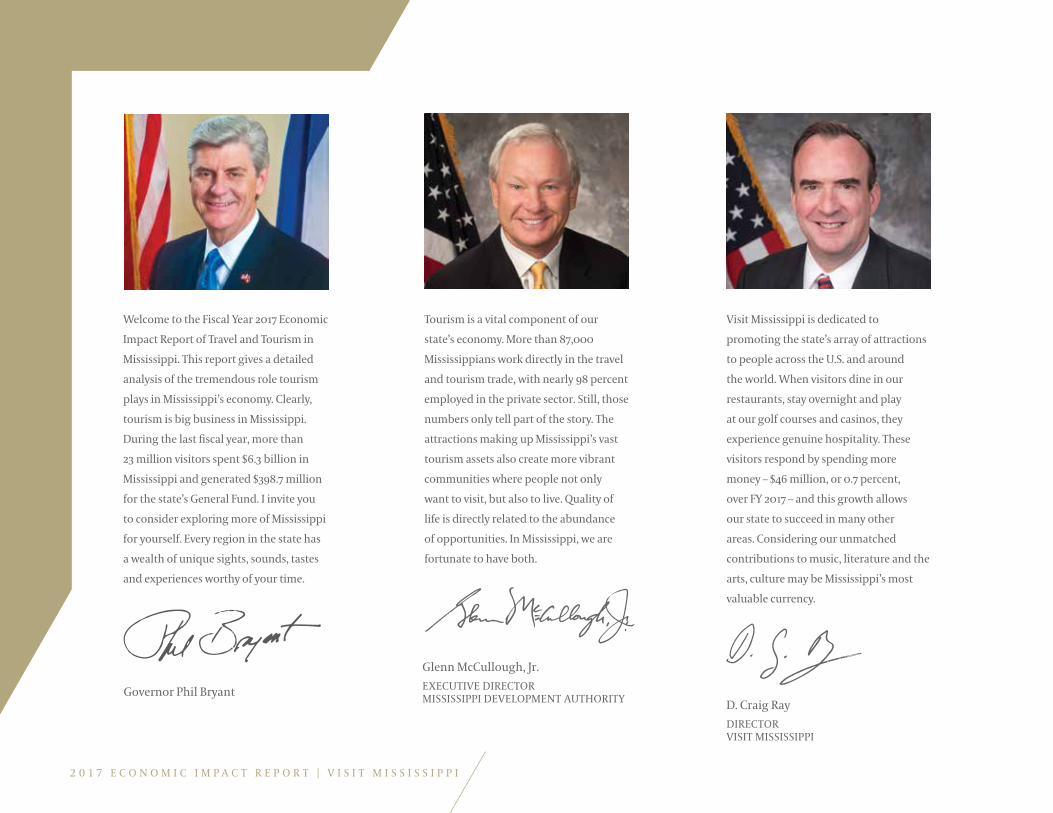
Welcome to the Fiscal Year 2017 Economic
Impact Report of Travel and Tourism in
Mississippi. This report gives a detailed
analysis of the tremendous role tourism
plays in Mississippi’s economy. Clearly,
tourism is big business in Mississippi.
During the last fiscal year, more than
23 million visitors spent $6.3 billion in
Mississippi and generated $398.7 million
for the state’s General Fund. I invite you
to consider exploring more of Mississippi
for yourself. Every region in the state has
a wealth of unique sights, sounds, tastes
and experiences worthy of your time.
Governor Phil Bryant
Visit Mississippi is dedicated to
promoting the state’s array of attractions
to people across the U.S. and around
the world. When visitors dine in our
restaurants, stay overnight and play
at our golf courses and casinos, they
experience genuine hospitality. These
visitors respond by spending more
money – $46 million, or 0.7 percent,
over FY 2017 – and this growth allows
our state to succeed in many other
areas. Considering our unmatched
contributions to music, literature and the
arts, culture may be Mississippi’s most
valuable currency.
D. Craig Ray DIRECTOR VISIT MISSISSIPPI
Tourism is a vital component of our
state’s economy. More than 87,000
Mississippians work directly in the travel
and tourism trade, with nearly 98 percent
employed in the private sector. Still, those
numbers only tell part of the story. The
attractions making up Mississippi’s vast
tourism assets also create more vibrant
communities where people not only
want to visit, but also to live. Quality of
life is directly related to the abundance
of opportunities. In Mississippi, we are
fortunate to have both.
Glenn McCullough, Jr. EXECUTIVE DIRECTOR MISSISSIPPI DEVELOPMENT AUTHORITY

Tourism Capital Investment FY 2017 Surveys (October 2016 – September 2017)
State Gross Domestic Product, Total Value Added
Travel and Tourism Employment Multipliers
Travel and Tourism Labor Income Multipliers
DELIMITATIONS LIMITATIONS METHODS APPENDICES GLOSSARY ACKNOWLEDGMENTS
01 03 05 09 11 13 15
191919204547
TABLE OF CONTENTS
Mississippi Gaming Commission
Quarterly Survey Trends
Gaming Employment, Revenue and Various Trends in Other States
Non-Gaming Summary of Revenue for State-Licensed Casinos
Welcome Center Reservation Service
Regional Airport/Air Passenger Data
Amtrak
Travel and Tourism
Expenditures/Lodging Data
City/County Tax Revenues and Fees Attributed to Travel and Tourism
Travel and Tourism Advertising and Employment by Partners
Mississippi Visitor Profile Study
International Travel to Mississippi
Travel and Tourism Exports and Imports
Household Tax Relief and Estimated Effective Tax Rates
A Consistent Producer
Employment Rankings and Trends
MIS
SISS
IPPI
AS
AN
AT
TR
AC
TIO
N
EXEC
UT
IVE
SUM
MA
RY
CITY
/CO
UN
TY/S
TATE
LEV
EL IN
DIC
ATO
RS
TR
AN
SPO
RTA
TIO
N
GA
MIN
G
STA
TE
TR
AV
EL A
ND
TO
UR
ISM
LIN
KS
OU
TD
OO
R R
ECR
EAT
ION
12 0 1 7 E C O N O M I C I M P A C T R E P O R T | V I S I T M I S S I S S I P P I
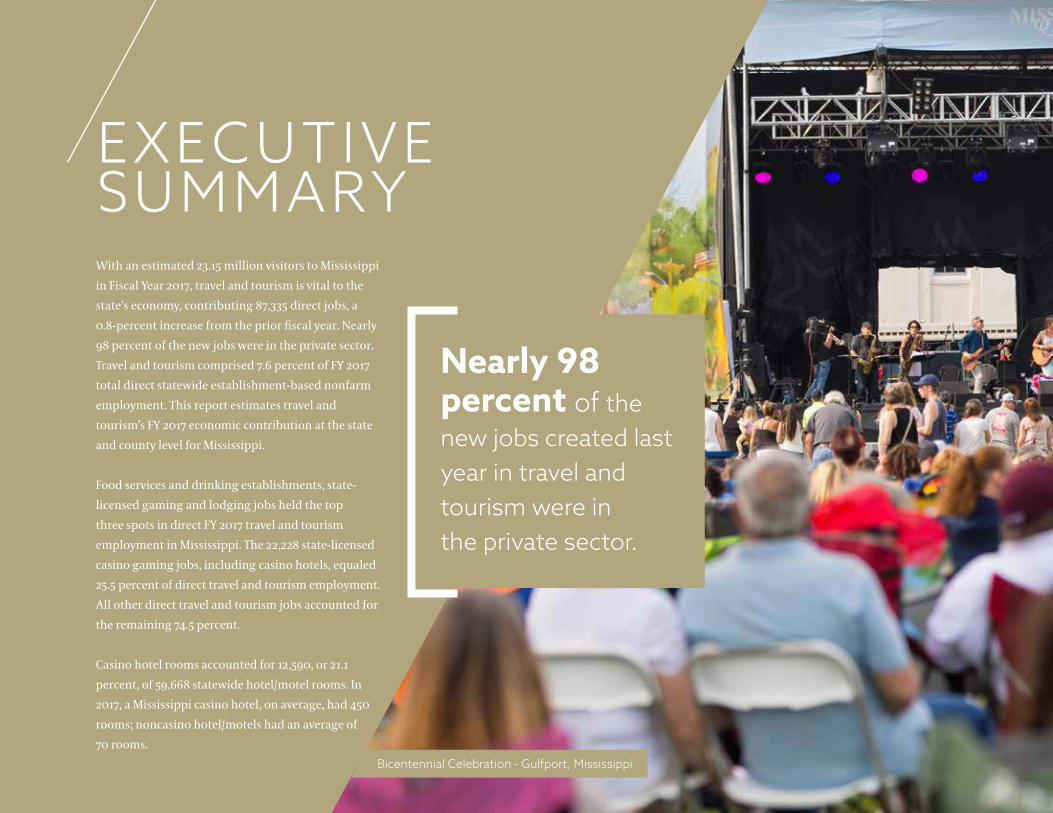
EXECUTIVE SUMMARYWith an estimated 23.15 million visitors to Mississippi
in Fiscal Year 2017, travel and tourism is vital to the
state’s economy, contributing 87,335 direct jobs, a
0.8-percent increase from the prior fiscal year. Nearly
98 percent of the new jobs were in the private sector.
Travel and tourism comprised 7.6 percent of FY 2017
total direct statewide establishment-based nonfarm
employment. This report estimates travel and
tourism’s FY 2017 economic contribution at the state
and county level for Mississippi.
Food services and drinking establishments, state-
licensed gaming and lodging jobs held the top
three spots in direct FY 2017 travel and tourism
employment in Mississippi. The 22,228 state-licensed
casino gaming jobs, including casino hotels, equaled
25.5 percent of direct travel and tourism employment.
All other direct travel and tourism jobs accounted for
the remaining 74.5 percent.
Casino hotel rooms accounted for 12,590, or 21.1
percent, of 59,668 statewide hotel/motel rooms. In
2017, a Mississippi casino hotel, on average, had 450
rooms; noncasino hotel/motels had an average of
70 rooms.
Bicentennial Celebration - Gulfport, Mississippi
Nearly 98 percent of the new jobs created last year in travel and tourism were in the private sector.

2 2 0 1 7 E C O N O M I C I M P A C T R E P O R T | V I S I T M I S S I S S I P P I
FY 2017 EXPENDITURES
Estimated travel and tourism expenditures by visitors totaled $6.343 billion in FY 2017, versus $6.297 billion in FY 2016, a year-over-year increase of $46 million, or 0.7 percent. The $6.343 billion spent is the second highest of all time, behind $6.352 billion spent in FY 2005. Travel and tourism’s $398.7 million slice of the FY 2017 General Fund was 7.4 percent, via visitor expenditures, tourism capital investment, travel and tourism personal income, sales taxes and other taxes. Travel and tourism total employment – direct, indirect and induced – was 124,680, or 10.9 percent of jobs in the state. These jobs generated $3 billion in total FY 2017 labor income.
Travel and tourism is one of Mississippi’s largest export industries and a major contributor to the state’s financial affairs and quality of life. If other sectors remained constant, Mississippi’s economy without travel and tourism would yield:
• $398.7 million less in General Fund revenues.• 124,680 fewer total jobs (direct, indirect and induced).• $3 billion less in total annual payroll associated with this industry and quality-of-life issues.
Subtracting the 87,335 direct statewide travel and tourism jobs from Mississippi’s economy would more than double the state’s annual unemployment rate from 5 percent to 11.8 percent. Most of the 87,335 direct and 37,345 secondary travel and tourism jobs cannot be outsourced.
Direct, indirect and induced employment in travel and tourism
generated $3 billion in total FY 2017
labor income.

3
MISSISSIPPI AS AN ATTRACTIONTRAVEL AND TOURISM EXPORTS AND IMPORTS
Travel and tourism is one of Mississippi’s largest export industries, generating economic benefits directly affecting the state. Out-of-state visitors to Mississippi spent more on travel and tourism than Mississippi residents spent on travel and tourism in other states or abroad. Travel and tourism is a composite industry, comprising different sectors of the economy.
Out-of-state visitors spent an estimated $4.9 billion in Mississippi, accounting for 77.3 percent of the $6.343 billion in statewide FY 2017 visitor spending. Mississippians traveling within the state – 50 miles or more, one-way – spent an estimated $1.44 billion on in-state trips, or 22.7 percent of $6.343 billion. An in-state visitor, on average, spent $195 on their entire Mississippi trip, versus $304 for an out-of-state domestic visitor. An international visitor, on average, spent $1,068 on their Mississippi trip.
HOUSEHOLD TAX RELIEF AND ESTIMATED EFFECTIVE TAX RATES
The $461.6 million collected in 2017 travel and tourism state tax revenues/fees, plus $184.7 million in city/county tax revenues and fees, were divided by 1,098,803 Mississippi households. The result was $588 in tax relief per household, or $420 in state tax relief and $168 in local tax relief. The 2016 tax relief estimate was $583 per household.
A CONSISTENT PRODUCER
Travel and tourism is a consistent producer in Mississippi. This includes real and personal property taxes paid by hotels/motels, bed-and-breakfasts, restaurants and casinos; 18.5 percent of the 7-percent state sales tax allocated to cities; motor vehicle rental taxes; and petroleum taxes, among others. Cities, counties and schools benefit from property taxes paid by lodging, food and beverage and other businesses.
Out-of-state visitors spent an estimated $4.9 billion in Mississippi in FY 2017.
2 0 1 7 E C O N O M I C I M P A C T R E P O R T | V I S I T M I S S I S S I P P I

4 2 0 1 7 E C O N O M I C I M P A C T R E P O R T | V I S I T M I S S I S S I P P I
EMPLOYMENT RANKINGS AND TRENDS
Travel and tourism was fourth in total estimated private FY 2017 direct nonfarm, establishment-based employment, behind manufacturing, private health care and social assistance and retail trade. Most of the direct FY 2017 statewide travel and tourism jobs – 85,365 of 87,335, or 97.7 percent – were private sector careers, including hotels/motels, restaurants, casinos and retail. The other 1,970, or 2.3 percent, were staff in state parks, federal parks, outdoor recreation, airports, historic sites, state/local tourism offices, museums, performing arts centers and spectator sports sites.
Statewide direct travel and tourism jobs in FY 2017 accounted for 7.6 percent of all establishment-based nonfarm jobs, while 86,600 statewide direct travel and tourism jobs in FY 2016 were 7.6 percent of all jobs.
Mississippi’s 87,335 direct travel and tourism jobs in FY 2017 were the most in 12 years and 2,035 more than the FY 2007, pre-“Great Recession,” number of 85,300. The 87,335 direct travel and tourism jobs in FY 2017
comprised 102.4 percent of the 85,300 pre-recession figure in FY 2007.
Statewide travel and tourism direct jobs averaged 86,295 per year during the 20 years from FY 1998 through FY 2017. Thus, 87,335 direct statewide travel and tourism jobs in FY 2017 were 1,040 more, or 1.2 percent higher, than the 20-year average. Direct travel and tourism jobs ranged from a low of 75,200 in FY 2006 in the aftermath of Hurricane Katrina to a high of 94,100 in FY 2000.
Mississippi’s 87,335 direct
travel and tourism jobs
in FY 2017 were the most in 12 years.
Natchez–Vidalia Bridge - Natchez, Mississippi

52 0 1 7 E C O N O M I C I M P A C T R E P O R T | V I S I T M I S S I S S I P P I
Local travel and tourism indicators include economic contributions from:
• Hotel/motel tax levies and restaurant taxes collected
• Petroleum tax distribution
• Motor vehicle rental tax diversions
• Alcohol beverage control
• Seawall taxes
• Real and personal property taxes paid by hotels/motels, restaurants and casinos
• Tourism capital investment permit fees
Mont Helena - Rolling Fork, Mississippi
CITY/COUNTY/STATE LEVEL INDICATORS

6 2 0 1 7 E C O N O M I C I M P A C T R E P O R T | V I S I T M I S S I S S I P P I
TRAVEL AND TOURISM EXPENDITURES/LODGING DATA
Mississippi had 701 total hotel/motel properties as of Dec. 31, 2017, per a countywide lodging census conducted by Visit Mississippi, plus census data from STR, a source for global data benchmarking, analytics and marketplace insights. From Dec. 31, 2016 to Dec. 31, 2017, statewide hotel/motel capacity jumped by 400 rooms, from 59,268 to 59,668, a 0.7-percent increase. An estimated 900 new statewide hotel/motel rooms were either under construction or could be finalized by Dec. 31, 2018. This would be an inventory increase of 1.5 percent, from 59,668 to 60,568. Mississippi’s inventory had 147 estimated bed-and-breakfast properties as of Sept. 30, 2017, with 797 total bed-and-breakfast rooms, 1,312 cabins, 13,910 recreational vehicle spaces with electricity and water, and 1,932 camp sites without hook-up.
In Calendar Year 2017, Mississippi noncasino lodging facilities achieved a statewide average daily rate of $85.42, based on STR research, a 0.9-percent increase versus $84.63 in CY 2016. Mississippi’s CY 2017
statewide occupancy was 56.9 percent using STR data for noncasino properties, identical to CY 2016. State-licensed casino hotels had a 77.5 occupancy percent in FY 2017, but many rooms at casino hotels were used free-of-charge by preferred customers or prize winners. Their FY 2017 average daily rate was $68.30. State-licensed casino hotel rooms totaled 11,520 as of Dec. 31, 2017, excluding 1,071 hotel rooms at two Pearl River Resort hotels.
CITY/COUNTY TAX REVENUES AND FEES ATTRIBUTED TO TRAVEL AND TOURISM
Travel and tourism’s contribution to the local economy includes city/county tax revenues and permit fees. Some $56.8 million, or 30.8 percent, of $184.7 million in city/county taxes and fees attributed to travel and tourism in FY 2017 came from the state-licensed casino city/county tax revenue portion of gross gaming revenues. Another $127.9 million, or 69.2 percent, were from room/restaurant special tax revenues, hotel/motel real and personal property taxes for casinos/
casino hotels, other hotels, restaurants, seawall taxes for coastal counties, Alcoholic Beverage Control permit license fees, petroleum taxes, motor vehicle rentals and tourism capital investment permit fees. These tax revenues do not include 18.5 percent of the state’s 7-percent tax rate originating at the state level.
Room/restaurant tax percentages range from 1 to 5 percent. Approximately $54.8 million, or 70.5 percent, of FY 2017 special tax revenues were from restaurant sales, with $23 million, or 29.5 percent, from lodging. FY 2017 special tax revenues totaled $77.8 million.
TRAVEL AND TOURISM ADVERTISING AND EMPLOYMENT BY PARTNERS
Thirty tourism partners – convention and visitors bureaus; tourism commissions; and partnerships – received FY 2017 advertising and employment/payroll mini-surveys from October 2016 to September 2017. Nineteen, or 63.3 percent, responded, including a convention center. FY 2017 travel and tourism
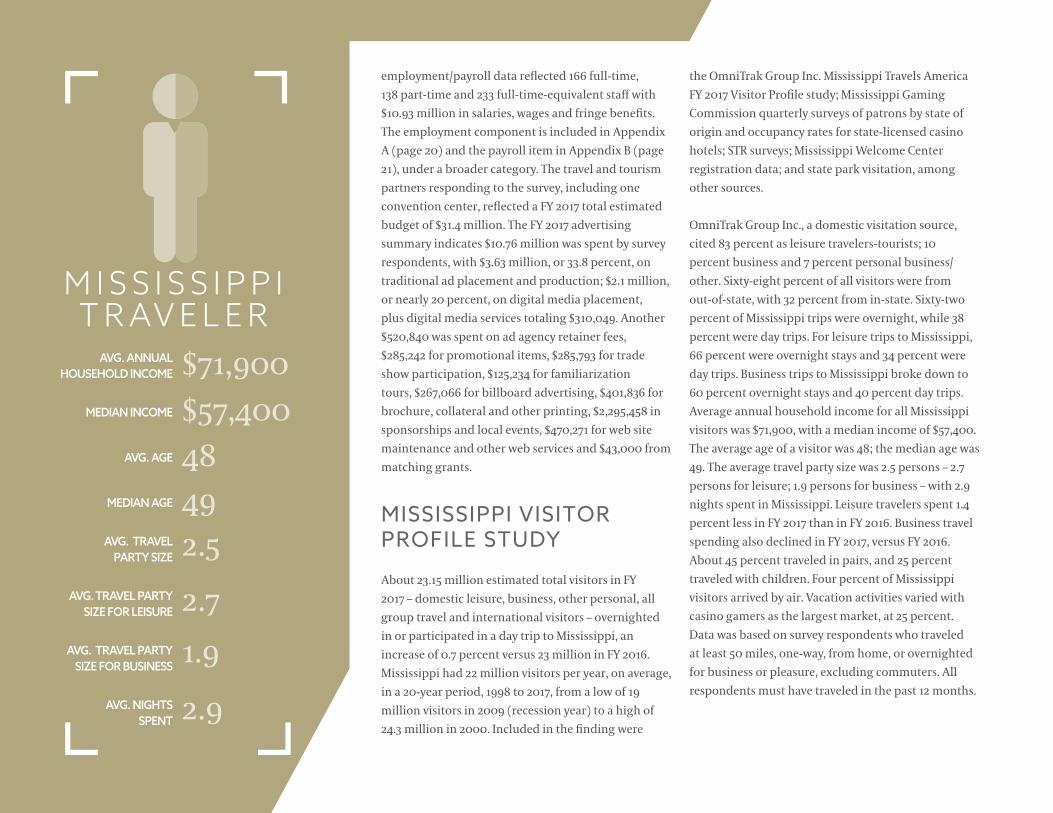
M I S S I S S I P P I T R AV E L E R
AVG. ANNUAL HOUSEHOLD INCOME
MEDIAN INCOME
AVG. AGE
MEDIAN AGE
AVG. TRAVEL PARTY SIZE
AVG. TRAVEL PARTY SIZE FOR LEISURE
AVG. TRAVEL PARTY SIZE FOR BUSINESS
AVG. NIGHTS SPENT
$71,900$57,40048492.5
2.7
1.9
2.9
employment/payroll data reflected 166 full-time, 138 part-time and 233 full-time-equivalent staff with $10.93 million in salaries, wages and fringe benefits. The employment component is included in Appendix A (page 20) and the payroll item in Appendix B (page 21), under a broader category. The travel and tourism partners responding to the survey, including one convention center, reflected a FY 2017 total estimated budget of $31.4 million. The FY 2017 advertising summary indicates $10.76 million was spent by survey respondents, with $3.63 million, or 33.8 percent, on traditional ad placement and production; $2.1 million, or nearly 20 percent, on digital media placement, plus digital media services totaling $310,049. Another $520,840 was spent on ad agency retainer fees, $285,242 for promotional items, $285,793 for trade show participation, $125,234 for familiarization tours, $267,066 for billboard advertising, $401,836 for brochure, collateral and other printing, $2,295,458 in sponsorships and local events, $470,271 for web site maintenance and other web services and $43,000 from matching grants.
MISSISSIPPI VISITOR PROFILE STUDY
About 23.15 million estimated total visitors in FY 2017 – domestic leisure, business, other personal, all group travel and international visitors – overnighted in or participated in a day trip to Mississippi, an increase of 0.7 percent versus 23 million in FY 2016. Mississippi had 22 million visitors per year, on average, in a 20-year period, 1998 to 2017, from a low of 19 million visitors in 2009 (recession year) to a high of 24.3 million in 2000. Included in the finding were
the OmniTrak Group Inc. Mississippi Travels America FY 2017 Visitor Profile study; Mississippi Gaming Commission quarterly surveys of patrons by state of origin and occupancy rates for state-licensed casino hotels; STR surveys; Mississippi Welcome Center registration data; and state park visitation, among other sources.
OmniTrak Group Inc., a domestic visitation source, cited 83 percent as leisure travelers-tourists; 10 percent business and 7 percent personal business/other. Sixty-eight percent of all visitors were from out-of-state, with 32 percent from in-state. Sixty-two percent of Mississippi trips were overnight, while 38 percent were day trips. For leisure trips to Mississippi, 66 percent were overnight stays and 34 percent were day trips. Business trips to Mississippi broke down to 60 percent overnight stays and 40 percent day trips. Average annual household income for all Mississippi visitors was $71,900, with a median income of $57,400. The average age of a visitor was 48; the median age was 49. The average travel party size was 2.5 persons – 2.7 persons for leisure; 1.9 persons for business – with 2.9 nights spent in Mississippi. Leisure travelers spent 1.4 percent less in FY 2017 than in FY 2016. Business travel spending also declined in FY 2017, versus FY 2016. About 45 percent traveled in pairs, and 25 percent traveled with children. Four percent of Mississippi visitors arrived by air. Vacation activities varied with casino gamers as the largest market, at 25 percent. Data was based on survey respondents who traveled at least 50 miles, one-way, from home, or overnighted for business or pleasure, excluding commuters. All respondents must have traveled in the past 12 months.
8 2 0 1 7 E C O N O M I C I M P A C T R E P O R T | V I S I T M I S S I S S I P P I
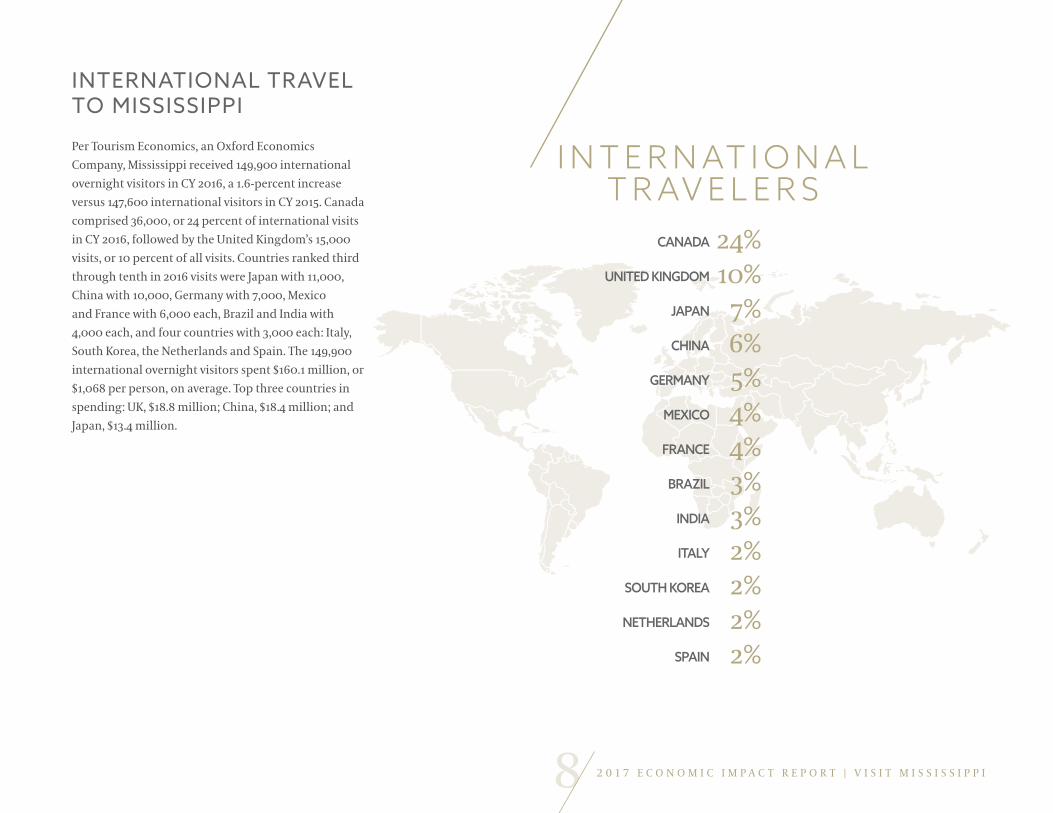
INTERNATIONAL TRAVEL TO MISSISSIPPI
Per Tourism Economics, an Oxford Economics Company, Mississippi received 149,900 international overnight visitors in CY 2016, a 1.6-percent increase versus 147,600 international visitors in CY 2015. Canada comprised 36,000, or 24 percent of international visits in CY 2016, followed by the United Kingdom’s 15,000 visits, or 10 percent of all visits. Countries ranked third through tenth in 2016 visits were Japan with 11,000, China with 10,000, Germany with 7,000, Mexico and France with 6,000 each, Brazil and India with 4,000 each, and four countries with 3,000 each: Italy, South Korea, the Netherlands and Spain. The 149,900 international overnight visitors spent $160.1 million, or $1,068 per person, on average. Top three countries in spending: UK, $18.8 million; China, $18.4 million; and Japan, $13.4 million.
Natchez–Vidalia Bridge - Natchez, Mississippi
CANADA
UNITED KINGDOM
JAPAN
CHINA
GERMANY
MEXICO
FRANCE
BRAZIL
INDIA
ITALY
SOUTH KOREA
NETHERLANDS
SPAIN
24%10%
7%6%5%4%4%3%3%2%2%2%2%
I N T E R N AT I O N A L T R AV E L E R S

92 0 1 7 E C O N O M I C I M P A C T R E P O R T | V I S I T M I S S I S S I P P I
TRANSPORTATIONTravel party registrants provide Welcome Centers with trip-related data. Registrants are asked to provide their zip code, age range of party, number of visitors in their party and the reason for their visit. Of the 2,390,882 people serviced at Welcome Centers in FY 2017, 1,912,901 – or 80 percent – registered. Most were U.S. residents. FY 2017 international travelers comprised 57,864, or 3 percent of registrants, versus 66,364 international registrants in FY 2016, or 3.4 percent of all registrants.
U.S. registrants at Mississippi Welcome Centers decreased from 1,890,855 in FY 2016 to 1,855,037 in FY 2017, or -1.9 percent. The international segment decreased by 12.8 percent; and total registrants decreased 2.3 percent. Mississippi, Louisiana, Alabama, Texas, Florida and Georgia held the top six spots for U.S. travelers in FY 2017. Canada had the most international registrants, 16,650, or 28.8 percent, in FY 2017.
WELCOME CENTER RESERVATION SERVICE
The Welcome Center reservation service enables travel counselors to make reservations for travelers/visitors in any hotel/motel, bed-and-breakfast or
campground accepting reservations. This service completed its 23rd year of operation in June 2017 with $43,188 in revenue, 391 reservations and 455 room nights booked.
REGIONAL AIRPORT/AIR PASSENGER DATA
Mississippi’s regional/international airports reported 874,226 scheduled passenger boardings, from January 2017 to December 2017, a 0.6-percent decrease versus 879,310 in CY 2016.
The Jackson-Medgar Wiley Evers International Airport boarded 455,267 passengers, or 52.1 percent, of all CY 2017 passengers boarded in Mississippi. Its daily nonstop flights to cities and airports included Atlanta, Charlotte, Chicago, Dallas/Ft. Worth, Houston and Washington, D.C.
Gulfport-Biloxi International Airport had 333,087 boardings, CY 2017. They reported 230,267 annual revenue boardings, 776 charter flights and 94,042 charter passenger boardings between October 2016 and September 2017. Their carriers are American Airlines, Delta, United, Allegiant and Sun Country. Cities served were Atlanta, Charlotte,
Dallas-Ft. Worth, Houston, Minneapolis (seasonal) and Orlando Sanford (twice a week). Some $9.56 million in FY 2017 net capital expenditures and improvements were made to the Gulfport-Biloxi International Airport. Other CY 2017 scheduled boardings for other regional airports: Golden Triangle (41,250), Meridian (19,594), Hattiesburg-Laurel (9,805), Tupelo (9,947) and Greenville Mid-Delta (5,276).
AMTRAK
Amtrak serves Mississippi with two long-distance trains: The City of New Orleans, with daily Chicago-New Orleans service via Jackson, and The Crescent, with daily New Orleans-Atlanta-New York service via Meridian. Ten Mississippi stations with Amtrak service include Brookhaven, Greenwood, Hattiesburg, Hazlehurst, Jackson, Laurel, McComb, Meridian, Picayune and Yazoo City. Total FY 2017 ridership in Mississippi was 101,542, down 2 percent from 103,562 in FY 2016. FY 2017 total U.S. Amtrak ridership was 31.7 million, or 1.5 percent above 31.3 million in FY 2016. Ridership is the sum of total passengers boarding and disembarking. Total Amtrak passenger FY 2017 revenue was $3.2 billion, a 1.1 percent increase versus FY 2016.
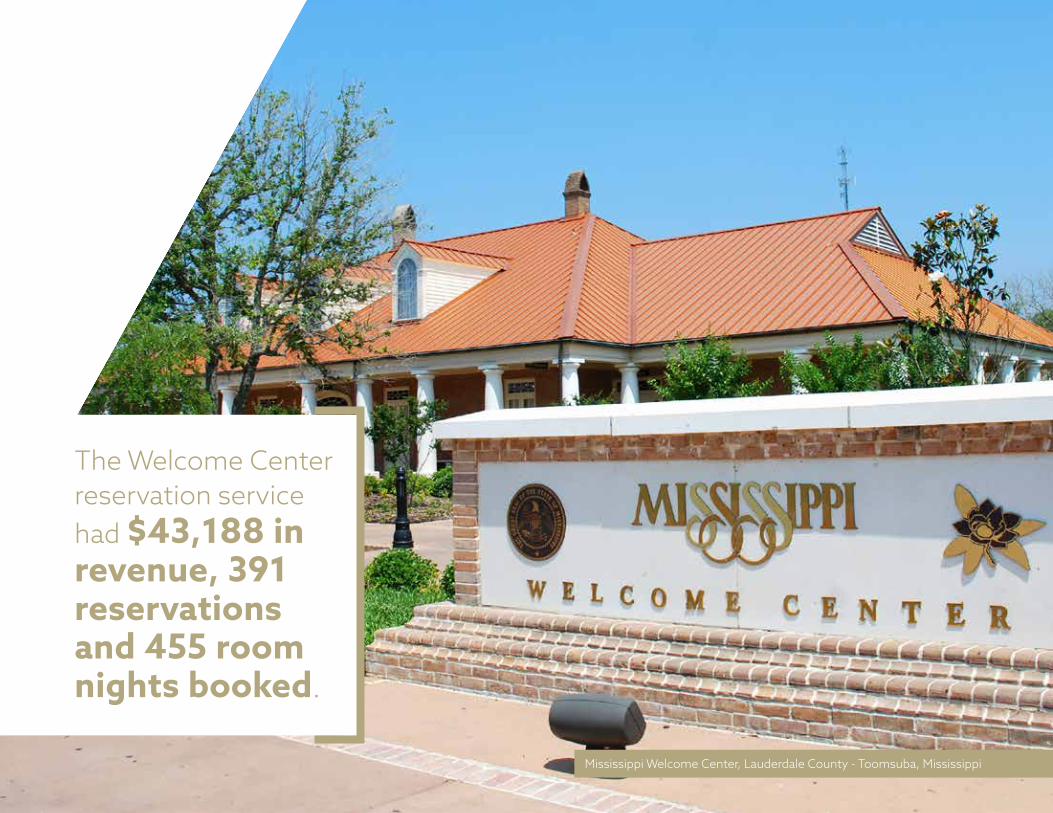
10 2 0 1 7 E C O N O M I C I M P A C T R E P O R T | V I S I T M I S S I S S I P P IMississippi Welcome Center, Lauderdale County - Toomsuba, Mississippi
The Welcome Center reservation service had $43,188 in revenue, 391 reservations and 455 room nights booked.

112 0 1 7 E C O N O M I C I M P A C T R E P O R T | V I S I T M I S S I S S I P P I
Mississippi had 28 state-licensed casinos on Feb.
1, 2018, including 12 on the Mississippi Gulf Coast;
nine in the Northern Region (Tunica and Coahoma
counties); seven in the Central Region (Greenville,
Washington County, Natchez and Vicksburg).
Total FY 2017 state-licensed casino gross gaming
revenues were $2.09 billion, with $1.395 billion, or
66.8 percent, as the estimated net traveler/visitor
share. The estimated net traveler/visitor share of gross
gaming revenue made up 22 percent of the $6.343
billion in statewide travel and tourism expenditures
by travelers.
Mississippi’s FY 2017 gaming tax revenues were $253.9
million: $169 million in state receipts and $84.9
million for cities/counties. Two-thirds of the total
state/local gaming tax revenues were generated by
tourism. Travel and tourism comprised $112.8 million
of $169 million of state tax receipts and $56.6 million
of $84.9 million of city/county tax receipts.
State tax receipts from gaming generated $133
million for the General Fund and $36 million to
the Mississippi Department of Transportation.
Gaming tax receipts generated via travel and
tourism totaled $88.5 million, accounting
GAMING State-licensed casino gross gaming revenues were $2.09 billion in FY 2017, with $1.395 billion, or 66.8 percent, as the estimated net traveler/visitor share.
Beau Rivage - Biloxi, Mississippi

12 2 0 1 7 E C O N O M I C I M P A C T R E P O R T | V I S I T M I S S I S S I P P I
for 66.5 percent of the gaming
tax receipts going into the General
Fund. Of travel and tourism’s $398.7 million
total contribution to the General Fund, 22.2 percent
came through gaming.
MISSISSIPPI GAMING
COMMISSION QUARTERLY
SURVEY TRENDS
Some 60.7 percent of all FY 2017 statewide gaming patrons reside out-of-state, primarily
Alabama, Arkansas, Florida, Georgia, Illinois, Louisiana, Oklahoma, Tennessee and Texas, per Mississippi Gaming Commission data. Tunica and Coahoma counties casinos in the Northern Region had 74.3 percent of out-of-state patrons, from Arkansas, Tennessee, Illinois, Missouri, Oklahoma and Alabama. About 28.1 percent of the Central Region – Greenville, Washington County, Natchez and Vicksburg – casino patrons came from out-of-state, e.g., Arkansas and Louisiana. Of the Coastal Region casino patrons, 63.4 percent lived out-of-state., e.g., Louisiana, Florida, Alabama, Georgia and Texas.
State-licensed casinos plus their hotels contributed an FY 2017 payroll of $676.8 million, down 0.4 percent
from FY 2016. FY 2017 advertising and promotional expenditures attributed to state-licensed casinos were $93.4 million, an 8.4 percent decrease versus FY 2016. State-licensed casino hotel rooms increased from 11,343 in FY 2016 to 11,432 in FY 2017, or 0.8 percent. Hotel and convention facilities hosted 1,354 conferences in FY 2017 with 202,289 total delegates. Total FY 2017 ticketed show/concert attendees was 224,961, a 2.1-percent increase over 220,323 in FY 2016.
GAMING EMPLOYMENT, REVENUE AND VARIOUS TRENDS IN OTHER STATES
The 22,228 state-licensed casino employees and casino hotel employees made up 25.5 percent of 87,335 direct travel and tourism jobs, per FY 2017 quarterly casino employment data from Mississippi Department of Employment Security, Labor Market Information Department surveys. Mississippi’s gaming expenditures by visitors declined by 3.8 percent in FY 2017, versus FY 2016.
New Jersey casinos, after losing money for a decade, now allow in-state bettors to log onto websites run by casinos. They were one of only three states, as of June 2017, which allowed this. Nevada and Delaware were the other two states. At least eight other states are considering legalizing casino-run online wagering. Gaming experts say this is a smart play for millennials, who prefer online gaming.
Per the UNLV Center for Gaming Research, these states
had gaming revenue declines for the first 10 months of 2017, versus the same period in 2016: Florida, -0.4 percent; Maine, -2.3 percent; Mississippi, -3.1 percent; Missouri, -0.6 percent; New York, -0.4 percent; Pennsylvania, -1.1 percent; Rhode Island, -1.1 percent; South Dakota, -0.2 percent; West Virginia, -7.2 percent. The U.S. overall showed a 2.8-percent increase in gaming revenue.
NON-GAMING SUMMARY OF REVENUE FOR STATE-LICENSED CASINOS
Room revenue at state-licensed casino hotels was $245.2 million in FY 2017, an increase of 1.2 percent versus FY 2016. FY 2017 food and beverage revenue totaled $301.4 million, flat versus $301.2 million in FY 2016. FY 2017 other non-gaming revenue was $109.4 million, or $2.9 million above the $106.5 million in FY 2016, a 2.7 percent increase. These non-gaming dollar amounts are significant, even though many lodging, food, beverage and other amenities/services are complimentary.

132 0 1 7 E C O N O M I C I M P A C T R E P O R T | V I S I T M I S S I S S I P P IReunion Lake - Madison, Mississippi
OUTDOORRECREATION

14 2 0 1 7 E C O N O M I C I M P A C T R E P O R T | V I S I T M I S S I S S I P P I
The Mississippi Department of Wildlife, Fisheries and Parks, U.S. Army Corps of Engineers, Vicksburgs National Military Park, Natchez National Historical Park, Natchez Trace Parkway, Shiloh National Military Park/Corinth Site and Mississippi Final Stands Interpretive Center employment, payroll and revenue figures are in Appendices A-C (pages 20-22). Vicksburgs National Military Park had 510,234 visitors in FY 2016, the most recent figures available. Natchez National Historical Park had 204,332 recreation visits in CY 2016. The U.S. Army Corps of Engineers’ 1.38 million total visits in FY 2016 were at Arkabutla, Enid, Grenada and Sardis Lakes. Shiloh National Military Park/Corinth Site had 21,000 visitors in FY 2017. Hunting, fishing and other wildlife-related activities entice visitors to Mississippi. Travel parties spend money on food, lodging, transportation, fuel, fishing and hunting equipment, auxiliary expenses and special equipment.
Camping and recreational vehicle travel play significant roles in Mississippi’s travel and tourism economy. Mississippi houses 13,910 RV spaces with electricity and water and 1,932 camp sites without hook-up, per a 2017 survey. The Pearl River Valley Water Supply District (parts of Hinds, Leake, Madison,
Rankin and Scott counties) reported 2.5 million visitors in FY 2017. Mississippi’s State Parks have 1,628 camp sites. State park visitation figures show a 12.4 percent decrease in FY 2017 visitation versus FY 2016. The Mississippi Department of Wildlife, Fisheries and Parks reported $9.7 million in FY 2017 nonresident licensing sales versus $9.24 million in FY 2016.
Camping and recreational vehicle travel play significant roles in Mississippi’s travel and tourism economy.
152 0 1 7 E C O N O M I C I M P A C T R E P O R T | V I S I T M I S S I S S I P P I
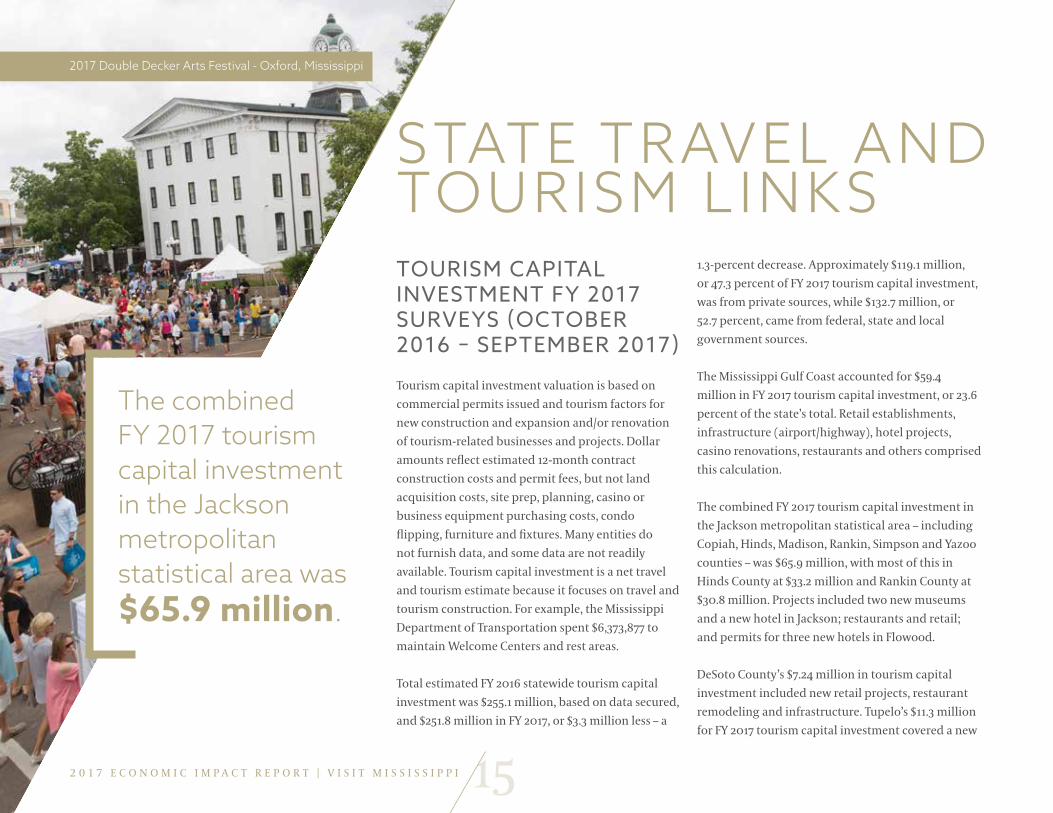
TOURISM CAPITAL INVESTMENT FY 2017 SURVEYS (OCTOBER 2016 – SEPTEMBER 2017)
Tourism capital investment valuation is based on commercial permits issued and tourism factors for new construction and expansion and/or renovation of tourism-related businesses and projects. Dollar amounts reflect estimated 12-month contract construction costs and permit fees, but not land acquisition costs, site prep, planning, casino or business equipment purchasing costs, condo flipping, furniture and fixtures. Many entities do not furnish data, and some data are not readily available. Tourism capital investment is a net travel and tourism estimate because it focuses on travel and tourism construction. For example, the Mississippi Department of Transportation spent $6,373,877 to maintain Welcome Centers and rest areas.
Total estimated FY 2016 statewide tourism capital investment was $255.1 million, based on data secured, and $251.8 million in FY 2017, or $3.3 million less – a
1.3-percent decrease. Approximately $119.1 million, or 47.3 percent of FY 2017 tourism capital investment, was from private sources, while $132.7 million, or 52.7 percent, came from federal, state and local government sources.
The Mississippi Gulf Coast accounted for $59.4 million in FY 2017 tourism capital investment, or 23.6 percent of the state’s total. Retail establishments, infrastructure (airport/highway), hotel projects, casino renovations, restaurants and others comprised this calculation.
The combined FY 2017 tourism capital investment in the Jackson metropolitan statistical area – including Copiah, Hinds, Madison, Rankin, Simpson and Yazoo counties – was $65.9 million, with most of this in Hinds County at $33.2 million and Rankin County at $30.8 million. Projects included two new museums and a new hotel in Jackson; restaurants and retail; and permits for three new hotels in Flowood. DeSoto County’s $7.24 million in tourism capital investment included new retail projects, restaurant remodeling and infrastructure. Tupelo’s $11.3 million for FY 2017 tourism capital investment covered a new
STATE TRAVEL AND TOURISM LINKS
The combined FY 2017 tourism capital investment in the Jackson metropolitan statistical area was $65.9 million.
2017 Double Decker Arts Festival - Oxford, Mississippi

16 2 0 1 7 E C O N O M I C I M P A C T R E P O R T | V I S I T M I S S I S S I P P I
hotel, retail renovations/new retail, restaurants, new convenience stores/gas stations and infrastructure.
Oxford-Lafayette County tourism capital investment was $10 million in restaurants, retail, recreation facilities and infrastructure. Starkville-Oktibbeha County tourism capital investment reached $15.9 million, most of which was for Mississippi State University’s Dudy Noble Field at Polk-DeMent Stadium. Marshall County had infrastructure-related work as part of $4.9 million in tourism capital investment.
The Hattiesburg area, including Forrest, Lamar and Perry counties, had $20.7 million in FY 2017 tourism capital investment, including midtown hotel development and restaurants. Meridian/Lauderdale County’s FY 2017 tourism capital investment of $12.5 million was mostly for the initial construction phase of the new Mississippi Arts and Entertainment Experience. Airport/highway infrastructure, restaurant and travel stop renovations comprised a much smaller construction portion.
Natchez had $1 million in FY 2017 tourism capital investment, with antique store, retail and restaurant renovations. Vicksburg’s $2.2 million in FY 2017 tourism capital investment was primarily infrastructure.
FY 2017 tourism capital investment data were updated with input from city/county building/permit departments, Dodge Data Analytics and state agencies.
FILM PRODUCTIONS, DOCUMENTARIES AND COMMERCIALS
Nine independent features were filmed in Mississippi in CY 2017, along with four reality-based television series, one feature documentary and four national commercials.
All of these projects amounted to 518 days of actual production activity across the state, from Corinth to Picayune, Gulfport to Canton and Batesville to Greenville. An additional 216 preproduction and postproduction days brought the total to 734 days of overall production activity. The film and commercial industries spent an estimated $5,651,000 with Mississippi businesses and had a combined payroll of $2,828,000.
Production was scattered throughout Mississippi, with the Gulf Coast and South Mississippi being especially busy with seven feature productions and two reality-based shows. Most of the productions stemmed from producers who have previously worked in the state. Active Entertainment brought three more features in 2017 for a total of five projects on the Gulf Coast. Leverage Entertainment returned to do another feature in South Mississippi for a total of four projects. Running Wild Films made two more features for a total of four in the state. “Bring It!” filmed in Jackson for a fourth and fifth season in 2017, and “Home Town” completed their second season in Laurel. Farm Bureau Insurance and Sanderson Farms also came back to film commercials in the state.
F I L M E D I N M I S S I S S I P P I9 F E AT U R E S
BLOOD COUNTRYCORNBREAD COSA NOSTRAGLASS TALONSCHRISTMAS IN MISSISSIPPIMISSISSIPPI RIVER SHARKSMY MOTHER’S MURDERTHE TEACHERULTRAURBAN COUNTRY
4 REALITY BASED SHOWS
BRING ITHOME TOWNML FISHINGNAKED & AFRAID
1 FEATURE DOCUMENTARY
UNTITLED CHAMBERS STORY
4 NATIONAL COMMERCIALS
COPPER FITFARM BUREAU INSURANCEHURST REVIEW SERIESSANDERSON FARMS

172 0 1 7 E C O N O M I C I M P A C T R E P O R T | V I S I T M I S S I S S I P P I
Film infrastructure diminished in 2017 with the closing of Mississippi Film Studios in Canton, Hollywood Trucks & Rentals and MBS Equipment. Red Planet Entertainment relocated to Georgia; Eyevox Entertainment/Mad Genius downsized their inventory; and freelance production crew members relocated.
The Mississippi Film Office supported the professional production alliances located in Jackson and on the Coast and provided programming support to statewide film festivals and related events. Indigenous filmmaking was directly supported by continuing to fund the Mississippi Emerging Filmmakers Grant Program administered by the Mississippi Film and Video Alliance.
STATE GROSS DOMESTIC PRODUCT, TOTAL VALUE ADDED
The state gross domestic product, part of the national GDP, is a comprehensive measure of economic output used by all 50 states, Washington D.C. and U.S. territories. Travel and tourism’s share of GDP can be estimated via state-level travel and tourism accounts, a broader view focusing on the circular flow of goods and services in the economy between tourism industry supply and the impact of tourism commodity demand. Estimates include travel and tourism’s statewide contribution as a direct percentage of state GDP, plus indirect and induced share of travel and tourism employment and labor income, effective tax rates for personal income tax, sales tax and other taxes, among other indicators.
The direct effects of total value added from Mississippi’s statewide travel and tourism data were matched to their description in IMPLAN – a nationally recognized economic contribution model to estimate the economic activity associated with the sale of a good or service – for gasoline stations, lodging, food services and drinking establishments and other codes to estimate its direct value added as a portion of state GDP. Mississippi’s GDP in current dollars was estimated at $110 billion in FY 2017, per the Bureau of Economic Analysis and University Research Center, Mississippi Institutions of Higher Learning. Travel and tourism’s 2.4 percent direct value added to GDP is lower than its 7.6 percent direct employment concentration and 7.4 percent share of General Fund revenues.
The direct portion only of food services and drinking establishments, lodging, casino gaming, gasoline stations/other retail, recreation and transportation were part of the travel and tourism industry GDP. Casino gaming, food services and drinking establishments and lodging were a major portion of this.
Mississippi had a 5 percent unemployment rate based on a 12-month moving average, January-December 2017, versus 5.9 percent for January - December 2016. December 2017 had a 4.6 percent seasonally adjusted unemployment rate, the lowest monthly rate at the time in the state’s recorded history, from January 1976 forward. The civilian labor force was 1.286 million, with an average of 64,700 unemployed, CY 2017. Metropolitan Statistical Areas for counties with major travel and tourism activity had unemployment rates of 5.2 percent for Gulfport-Biloxi-Pascagoula
(Hancock, Harrison and Jackson counties); 4.4 percent for Hattiesburg (Forrest, Lamar and Perry counties); and 4.3 percent for Jackson (Copiah, Hinds, Madison, Rankin, Simpson and Yazoo counties). DeSoto County’s CY 2017 unemployment rate was 3.8 percent, while Tunica County was 5.8 percent.
TRAVEL AND TOURISM EMPLOYMENT MULTIPLIERS
IMPLAN uses indirect (business or firm level) and induced (personal or individual level) multipliers. Together – direct plus indirect plus induced, then divided by the direct contribution – they estimate employment multipliers filtered through a social accounting matrix. Fiscal Year 2016 and FY 2017 employment multipliers for Mississippi were 1.43. The 86,600 statewide direct FY 2016 travel and tourism jobs resulted in an additional 37,580 indirect plus induced jobs. The 87,335 statewide FY 2017 direct travel and tourism jobs resulted in 37,345 indirect plus induced, or secondary, jobs. FY 2017 jobs associated with travel and tourism totaled 124,680, or 10.9 percent of nonfarm employment.
TRAVEL AND TOURISM LABOR INCOME MULTIPLIERS
Payroll or labor income earned by an employee results in additional money spent by the firm (indirect) and

18 2 0 1 7 E C O N O M I C I M P A C T R E P O R T | V I S I T M I S S I S S I P P I
individual (induced). The FY 2016 travel and tourism labor income multiplier for Mississippi was 1.61. The total labor income for FY 2016 was $2.99 billion, made up of $1.86 billion direct and $1.13 billion in indirect and induced income. Mississippi’s FY 2017 travel and tourism labor income multiplier was 1.58, with $1.91 billion in direct and $1.11 billion in indirect and induced or secondary income, for total labor income of $3.02 billion. IMPLAN codes were used to compute these multipliers.
December 2017 had a 4.6 percent seasonally adjusted unemployment rate, the lowest monthly rate at the time in the state’s recorded history from January 1976 forward.
Indianola, Mississippi

192 0 1 7 E C O N O M I C I M P A C T R E P O R T | V I S I T M I S S I S S I P P I
DELIMITATIONS
This study is delimited to travel and tourism businesses in Mississippi’s 82 counties. Private, public, nonprofit and quasi-public firms directly/indirectly affected by travel and tourism are represented.
LIMITATIONS
This study should be interpreted only for Mississippi, and it is limited by the challenges of providing a comprehensive and local view of travel and tourism expenditures. Travel and tourism businesses cover a broad range of North American Industry Classification System codes. Assumptions were made for certain employment and revenue categories based on their travel and tourism links. These assumptions may be adjusted in light of future research. The study is limited by not having access to automotive gasoline sales for 79 of the state’s 82 counties (statewide data are available and estimates are computed for some counties). The Department of Revenue’s Petroleum Tax Division provides disbursements for the Hancock, Harrison and Jackson County Seawall Tax. This facilitates revenue data for these counties from net taxable gallons sold.
This study uses statewide employment and labor income multipliers from IMPLAN, but not county-level multipliers. Multipliers from a statewide input-output model cannot be modified on a short-term basis for use by cities/counties. Limitations at the county level include the difficulty in assigning percent figures in traveler/visitor sales as a proportion of total sales in a given county.
METHODS
This report estimated travel and tourism’s FY 2017 statewide economic contribution, including the General Fund portion attributable to travel and tourism. County indicators include estimated travel and tourism jobs (direct only), expenditures and capital investment. Room/restaurant tax revenues are presented for pertinent cities and counties. Some counties have economies more geared to travel and tourism. Surveys, reports and other parameters were used to make these estimates.
Other trends – visitor profile/special survey data, Welcome Center highlights and airport passenger data – are covered. Surveys were secured for federal entities with an October to September fiscal year: Columbus office, Vicksburg headquarters-U.S. Army Corps of Engineers, Shiloh National Military Park/Corinth Site and Mississippi Final Stands Interpretive Center. Most of Mississippi’s convention and visitor bureaus are on an October-September fiscal year, but the Department of Revenue compiles tax revenue information on a monthly and state fiscal year basis. They provided most of the statewide and county revenue figures and facilitated sales and tax collections for food and beverage, lodging, retail trade, transportation, attractions, entertainment and recreation.
Mississippi Gaming Commission monthly surveys supply lodging data in state-licensed casino hotels and advertising expenditures. Other state agencies surveyed with a travel and tourism connection include the Mississippi Department of Wildlife, Fisheries and Parks, and the Pearl River Water Supply District.
FY 2017 employment and payroll data were calculated from quarterly figures compiled by the Mississippi Department of Employment Security, Labor Market Information Department. Other state, local and federal agencies, tourism offices and museums furnished employment/payroll survey data. Estimated statewide travel and tourism expenditures are included by category. Statewide petroleum purchases and revenues at the retail level were calculated via self-service unleaded gas price averages for regular, mid-grade and premium fuel reported by AAA’s website. Sources for sales of petroleum products into Mississippi were MDA Energy Division, the Mississippi Department of Revenue and the Mississippi Department of Transportation. The Petroleum Tax Division of the Mississippi Department of Revenue provided sales/collections data for gasoline and undyed diesel fuel at 18 cents per gallon.

APPENDIX AEstimated Travel and Tourism Direct Employment, FY 2016 and FY 2017
CATEGORY FY 2016 FY 2017 CHANGEFood services and drinking establishments (1) 30,082 30,800 2.4%
Lodging, excluding all casino hotels (2) 12,960 13,175 1.7%
Gaming, state-licensed casinos and hotels (3) 22,543 22,228 -1.4%
Retail trade (4) 10,067 10,139 0.7%
Support activities, air transportation (5) 1,583 1,719 8.6%
Air passenger, scheduled and chartered (5) 218 217 -0.5%
Scenic and sightseeing transportation 17 56 229.4%
Charter bus industry 112 114 1.8%
Taxi and limo service 40 48 20.0%
Amtrak, other bus transportation 73 70 -4.1%
Subtotal, transportation 2,043 2,224 8.9%
Travel arrangement/reservations 381 388 1.8%
Passenger car rental 400 388 -3.0%
Automotive repair and maintenance services 314 319 1.6%
Parking lots and garages 14 13 -7.1%
Advertising and related services 257 249 -3.1%
Laundry services 149 130 -12.8%
Subtotal, other services 1,515 1,487 -1.8%
Motion picture theaters 145 147 1.4%
Motion picture and video production 154 163 5.8%
Museums, historical sights and similar (6) 349 345 -1.1%
Performing arts, spectator sports and related 650 647 -0.5%
Amusement parks, bowling, golf courses, marinas 1,154 1,185 2.7%
Federal, state, local tourism agencies/offices (7) 726 652 -10.2%
Selected convention centers and arenas 92 92 none
Gaming, lodging, other at tribal resorts (8) 1,815 1,820 0.3%
Selected outdoor recreation (9) 520 516 -0.8%
Construction (10) 1,785 1,715 -3.9%
Total 86,600 87,335 0.8%
1. Alcohol/nonalcohol restaurants, drinking places, among other establishments.2. Estimates based on Mississippi Department of Employment Security
data for hotels/motels, other traveler accommodations and RV parks and recreational camps, some residential property managers. Excludes state-licensed casino and tribal casino/resort hotels.
3. Based on Mississippi Department of Employment Security, Labor Market Information Department and Mississippi Gaming Commission quarterly surveys; the data include state-licensed casinos and employees. 4. FY 2016 and FY 2017 Mississippi Department of Employment Security, Labor Market Information Department covered employment statewide data were used for the full-time equivalent figure. Includes gasoline stations; department stores; warehouse clubs and superstores; other general merchandise stores; gift, novelty and souvenir shops, antiques and secondhand stores; clothing and shoe stores; sporting goods and book stores; specialty food and grocery stores; tobacco stores; pharmacies and drug stores; tire dealers; florists; book stores and news dealers; RV dealers; motorcycle, boat and other motor vehicle dealers; automotive parts and accessory stores; tire dealers; jewelry, luggage and leather goods stores; electronics,camera and photographic stores.5. Reflects non-cargo jobs only. Includes some federal and local government support jobs. 6. Includes Mississippi Department of Archives and History and Natural Sciences Museum data. Data precedes the opening of two museums in Jackson, Mississippi, December 2017. 7. Includes U.S. Army Corps of Engineers figures, Columbus and Vicksburg districts, plus the Natchez Trace Parkway, Vicksburg National Military Park, Natchez National Historical Park, Shiloh National Military Park/Corinth, Mississippi Final Stands Interpretive Center. Includes Visit Mississippi and Welcome Center staff, local Tourism Offices, other state agencies - Mississippi Arts Commission, Mississippi Gaming Commission and Pearl River Water Supply District. Convention center data are also included. 8. Estimates reflect estimated gaming and non-gaming employment at the tribal resort. 9. Includes some estimated agricultural tourism employment, outfitters, hunting and fishing guides. Mississippi Department of Wildlife, Fisheries and Parks, Parks Unit, are included. 10. Only reflects estimated travel and tourism-related construction activity.
SOURCES: Convention and visitor bureaus and other tourism offices; Mississippi Arts Commission; Mississippi Department of Archives and History; Mississippi Department of Employment Security, Labor Market Information Department; Mississippi Department of Revenue; Mississippi Department of Wildlife, Fisheries and Parks; Mississippi Gaming Commission; Mississippi Museum of Natural Science; Pearl River Water Supply District; U.S. Army Corps of Engineers: Bay Springs Site; Columbus Office; Vicksburg headquarters; U.S. Department of the Interior, National Park Service; Mississippi Final Stands Interpretive Center, Natchez National Historical Park, Shiloh National Military Park/Corinth, Natchez Trace Parkway, Vicksburg National Military Park; Visit Mississippi.

212 0 1 7 E C O N O M I C I M P A C T R E P O R T | V I S I T M I S S I S S I P P I
APPENDIX B Estimated Travel and Tourism Direct Payroll, by Component, FY 2016 and FY 2017
CATEGORY FY 2016 FY 2017 CHANGEFood services and drinking establishments $414,570,794 $435,799,893 5.1%
Lodging (1) $207,568,017 $216,100,416 4.1%
Gaming (2) $679,541,480 $676,788,839 -0.4%
Retail trade (3) $201,122,295 $203,770,921 1.3%
Support activities, air transportation $68,333,180 $82,359,045 20.5%
Air passenger, scheduled and chartered $8,502,874 $8,349,490 -1.8%
Scenic and sightseeing transportation $574,872 $1,261,824 119.5%
Charter bus industry $2,920,269 $3,150,815 7.9%
Taxi and limo service $817,589 $841,495 2.9%
Amtrak transportation $5,118,755 $5,079,889 -0.8%
Subtotal, transportation $86,267,539 $101,042,558 17.1%
Travel arrangement/reservations $11,593,648 $11,260,578 -2.9%
Passenger car rental $9,291,254 $9,654,561 3.9%
Automotive repair and maintenance services $10,762,324 $11,211,753 4.2%
Parking lots and garages $204,666 $209,759 2.5%
Advertising and related services $9,321,479 $9,304,683 -0.2%
Laundry services $3,083,423 $2,866,100 -7.0%
Subtotal, other services $44,256,794 $44,507,434 0.6%
Motion picture theaters $1,524,774 $1,515,610 -0.6%
Motion picture and video production $6,481,374 $8,946,397 38.0%
Museums, historical sights and similar $10,014,091 $10,282,886 2.7%
Performing arts, spectator sports, related $14,181,536 $14,801,592 4.4%
Amusement parks, bowling, golf courses, marinas $19,158,666 $20,347,360 6.2%
Selected convention centers and arenas $2,274,000 $2,655,600 16.8%
Federal, state, local tourism agencies (4) $40,285,723 $40,229,677 -0.1%
Gaming, lodging, other at tribal resorts (5) $55,000,000 $56,000,000 1.8%
Selected outdoor recreation (6) $9,023,522 $9,246,071 2.5%
Construction (7) $69,734,006 $67,033,281 -3.9%
Total $1,861,004,611 $1,909,068,535 2.6%
Note: These are nominal dollar amounts NOT adjusted for inflation. 1. Does not include the payroll of state-licensed casino hotels, nor Pearl River
Resort casino hotels. 2. Includes the payroll of all work permitted and non-work permitted employees
at state-licensed casinos, plus casino hotels, but not the estimated payroll of Pearl River Resort casino employees. State-licensed casino payroll data reflect July 2015 - June 2016 and July 2016 - June 2017 timeframes.
3. Includes gasoline stations; department stores; warehouse clubs and superstores; other general merchandise stores; gift, novelty and souvenir shops, antiques and secondhand stores; clothing and shoe stores; sporting goods and book stores; specialty food and grocery stores; tobacco stores; pharmacies and drug stores; florists; book stores and news dealers; RV dealers; motorcycle, boat and other motor vehicle dealers; automotive parts and accessory stores; tire dealers; jewelry, luggage and leather goods stores; electronics, camera and photographic stores.
4. Includes U.S. Army Corps of Engineers figures, Columbus and Vicksburg districts, plus the Natchez Trace Parkway, Vicksburg National Military Park, Natchez National Historical Park, Shiloh National Military Park/Corinth, Mississippi Final Stands Interpretive Center. Includes Visit Mississippi and Welcome Center staff, local tourism offices, other State Agencies - Mississippi Arts Commission, Mississippi Gaming Commission, Pearl River Basin Development District and Pearl River Water Supply District. Mississippi Department of Archives and History data are also included.
5. Only reflects estimated payroll at tribal resort gaming and tribal non-gaming venues.
6. Includes some estimated agricultural tourism employment, campgrounds, hunting and fishing. Includes Mississippi Department of Wildlife, Fisheries and Parks - Parks Unit and Pat Harrison Waterway estimates.
7. Only reflects estimated travel and tourism-related construction activity.
SOURCES: Convention and visitor bureaus and other tourism offices; Mississippi Arts Commission; Mississippi Department of Archives and History; Mississippi Department of Employment Security, Labor Market Information Department; Mississippi Department of Revenue; Mississippi Department of Wildlife, Fisheries and Parks; Mississippi Gaming Commission; Mississippi Museum of Natural Science; Pearl River Water Supply District; U.S. Army Corps of Engineers: Bay Springs Site; Columbus Office; Vicksburg headquarters; U.S. Department of the Interior, National Park Service: Mississippi Final Stands Interpretive Center, Natchez National Historical Park, Shiloh National Military Park/Corinth, Natchez Trace Parkway, Vicksburg National Military Park; Visit Mississippi.

APPENDIX C Estimated Travel and Tourism Expenditures by Visitors, FY 2016 and FY 2017
CATEGORY FY 2016 FY 2017 CHANGEFood services and drinking establishments (1) $1,195,397,212 $1,234,810,711 3.3%
Specialty food, liquor stores and vending machines $132,620,778 $118,884,127 -10.4%
Lodging (2) $935,859,847 $960,970,032 2.7%
Gaming (3) $1,450,118,988 $1,395,229,616 -3.8%
All retail, excluding gasoline/service stations (4) $1,666,474,612 $1,683,215,185 1.0%
Gasoline/service stations, convenience stores with fuel $660,655,318 $718,759,839 8.8%
Fixed facilities, air transportation (5) $5,859,308 $5,813,890 -0.8%
Passenger car rental leasing $34,475,178 $54,536,302 58.2%
Auto repair shops, accessories, mechanics, car wash $57,171,215 $59,230,187 3.6%
Rail and water passenger transportation (6) $10,675,468 $11,260,036 5.5%
Entertainment/athletic events/outdoor recreation (7) $84,332,357 $95,285,437 13.0%
Consumer goods rental $56,882,547 NA NA
Advertising specialties $1,048,779 NA NA
Laundries, dry cleaning $5,278,286 $4,979,285 -5.7%
Total $6,296,849,893 $6,342,974,647 0.7%
Note: These are nominal dollar amounts NOT adjusted for inflation. 1. Includes all restaurants and drinking places. 2. The FY 2016 and FY 2017 lodging figures reflected some adjustments, based
on STR monthly survey data for Mississippi cities/regions. 3. Net travel/visitor gross gaming revenues for 28 state-licensed casinos in
FY2016 and 28 in FY 2017. 4. Includes department and general merchandise stores, warehouse clubs-
supercenters; apparel and accessories; miscellaneous retail; gift, novelty and souvenir; sporting goods; book and musical instrument stores; electronics, camera and photographic stores; antique (used merchandise) stores; cigar stores and stands; drug stores; gaming retail; specialty food, liquor stores, supermarkets and grocery stores; RV dealers, motorcycle, boat and other motor vehicle dealers; jewelry; florists; pharmacies and drugstores; tobacco stores; automotive parts and accessories stores; tire dealers. Excludes gasoline and diesel fuel at 18 cents; gasoline service stations/convenience stores.
5. Air transportation, air terminal, transportation services. Includes gross airport non-operating revenues for FY 2016 and FY 2017, based on scheduled/charter passenger service and passenger facility charges. Incomplete data for FY 2016 and FY 2017.
6. Amtrak ticket sales included for both FY2016 and FY2017. 7. The entertainment/recreation component includes: motion picture theaters;
museums; spectator sports; racetracks; zoos and botanical gardens; amusement and theme parks; golf courses; bowling centers; marinas; all other amusement and recreation industry, such as major university sporting events ticket sales to persons residing at least 50 miles or more from the venue.
SOURCES: American Automobile Association web site; Amtrak Station revenue e-searches; Mississippi Department of Revenue; Mississippi Department of Wildlife, Fisheries and Parks; Mississippi Development Authority Energy Division; Mississippi Gaming Commission; STR monthly survey data for Mississippi cities/regions; U.S. Army Corps of Engineers: Bay Springs Site; Columbus Office; Vicksburg Headquarters; U.S. Department of the Interior, National Park Service: Mississippi Final Stands Interpretive Center, Natchez National Historical Park, Shiloh National Military Park/Corinth Site, Vicksburg National Military Park; Visit Mississippi.

232 0 1 7 E C O N O M I C I M P A C T R E P O R T | V I S I T M I S S I S S I P P I
APPENDIX D Estimated Travel and Tourism General Fund Revenue, FY 2016 and FY 2017
CATEGORY FY 2016 FY 2017 CHANGEFood services and drinking establishments $50,028,000 $51,651,755 3.2%
Specialty food, liquor stores, vending machines $5,485,363 $4,989,165 -9.0%
Lodging (1) $37,900,000 $38,950,000 2.8%
State-licensed casino gaming (2) $92,000,000 $88,500,000 -3.8%
All retail, including convenience stores (3) $69,421,622 $70,210,260 1.1%
Rental and leasing, other transportation (4) $1,611,461 $2,192,276 36.0%
Auto repair shops, accessories, mechanics, car wash $2,399,840 $2,469,106 2.9%
Entertainment/outdoor recreation (5) $2,466,919 $3,227,195 30.8%
Advertising specialties $63,283 NA NA
Laundries, dry cleaning $221,658 $210,755 -4.9%
Construction activity tax (6) $4,963,350 $4,900,000 -1.3%
Personal income/sales tax (7) $103,699,334 $106,616,093 2.8%
Alcoholic beverages (8) $15,466,247 $15,499,623 0.2%
Use tax (9) $9,372,127 $9,233,893 -1.5%
Total $395,099,204 $398,650,121 0.9%
Note: All dollar amounts are the estimated “net” travel and tourism portion. 1. STR statewide and city data were used for this estimate. FY 2016 figure was
adjusted plus $800,000, or 2.2 percent. 2. Approximately $88 million, or 66.7 percent of the $132 million in General Fund
gaming fees and tax transfers, were the “net” travel and tourism portion. The other $44 million, or 33.3 percent, were not attributed to travel and tourism. This does not include $36 million diverted to MDOT’s Bond Sinking Fund, $3 million per month.
3. Includes department and general merchandise stores, warehouse clubs-supercenters; apparel and accessories; miscellaneous retail; gift, novelty and souvenir; sporting goods; book and musical instrument stores; electronics, camera and photographic stores; antique (used merchandise) stores; cigar stores and stands; drugstores; gaming retail; gasoline service stations/convenience stores; specialty foods, liquor stores, supermarkets and grocery stores; RV dealers, motorcycle, boat and other motor vehicle dealers; jewelry; florists; pharmacies and drugstores; tobacco stores; automotive parts and accessory stores; tire dealers.
4. Also includes: transportation services, fixed facilities-air transportation, water passenger transportation.
5. The entertainment/recreation component includes: motion picture theaters; museums; spectator sports; racetracks; zoos and botanical gardens; amusement and theme parks; golf courses; bowling centers; marinas; all other amusement and recreation industry.
6. The estimated travel and tourism-related portion of the General Fund based on tourism capital investment. The FY 2016 figure was adjusted downward.
7. The estimated travel and tourism-related portion of the General Fund amount, based on estimated effective tax rates for personal income, sales tax and all other taxes.
8. The FY 2017 estimate comprised 87.3 percent of the total transfers to the General Fund and also applying a travel and tourism factor.
9. The FY 2017 estimate comprised 75.4 percent of the total transfers to the General Fund and also applying a travel and tourism factor.
SOURCES: Mississippi Department of Employment Security, Labor Market Information Department; Mississippi Department of Revenue; Mississippi Development Authority Energy Division; STR monthly survey data for Mississippi cities/regions; University Research Center, Mississippi Public Universities; Visit Mississippi.

24 2 0 1 7 E C O N O M I C I M P A C T R E P O R T | V I S I T M I S S I S S I P P I
APPENDIX E
County
Travel and Tourism
Expenditures by Visitors (1)
Direct Travel and Tourism Employment
Travel and Tourism
Employment Percentage (2)
State/Local Taxes/Fees
Attributed to Tourism (3)
Tourism Capital
Investment
Issaquena $147,720 2 1.4 $15,084 $1,049
Itawamba $15,497,950 205 3.1 $1,358,248 $176,908
Jasper $3,316,358 45 1.2 $293,502 $287,494
Jefferson $1,031,210 14 1.1 $107,583 $151,774
Jefferson Davis $2,675,842 36 2.2 $239,307 $0
Jones $59,622,938 850 2.9 $5,351,927 $2,139,267
Kemper $1,636,335 23 0.8 $168,712 $14,137
Lafayette $153,666,553 2,000 8.9 $13,206,007 $21,913,805
Lamar (4)
Lauderdale $163,398,853 2,040 5.9 $14,397,098 $5,042,098
Lawrence $2,982,939 38 1.5 $264,824 $73,842
Leake $8,452,909 120 2.4 $688,559 $570,580
Lee $261,995,526 3,910 7.1 $23,219,899 $4,263,661
Leflore $50,580,536 745 5.4 $3,873,594 $1,789,768
Lincoln $38,021,187 510 4.3 $3,138,061 $192,770
Lowndes $118,402,730 1,545 6.0 $10,642,600 $2,033,507
Madison $231,632,182 3,000 5.2 $18,997,473 $3,623,595
Marion $12,610,416 155 1.9 $952,303 $39,158
Marshall $15,580,508 220 3.5 $1,196,473 $2,695,143
Monroe $17,316,945 240 2.4 $1,328,746 $1,021,891
Montgom-ery $10,765,000 150 5.9 $965,533 $1,239,136
Neshoba (6) $36,609,099 2,000 16.2 $2,845,027 $191,704
Newton $6,722,176 90 1.5 $510,901 $115,759
Noxubee $5,508,272 72 2.9 $471,630 $324,329
Oktibbeha $97,921,562 1,335 6.0 $8,748,349 $21,247,963
County
Travel and Tourism
Expenditures by Visitors (1)
Direct Travel and Tourism Employment
Travel and Tourism
Employment Percentage (2)
State/Local Taxes/Fees
Attributed to Tourism (3)
Tourism Capital
Investment
Adams $110,807,342 2,275 20.4 $11,424,161 $2,572,253
Alcorn $61,558,708 790 6.7 $5,076,778 $375,825
Amite $1,868,248 25 1.5 $184,851 $81,564
Attala $17,675,318 235 5.2 $1,321,853 $734,602
Benton $880,419 12 0.9 $83,401 $51,506
Bolivar $48,981,351 630 5.3 $4,488,641 $441,190
Calhoun $3,519,142 46 1.6 $302,244 $360,208
Carroll $867,557 12 1.1 $87,143 $293,884
Chickasaw $5,731,761 77 1.4 $450,643 $103,250
Choctaw $1,231,039 17 0.6 $107,977 $87,016
Claiborne $3,196,526 44 1.2 $297,217 $124,746
Clarke $4,303,407 60 2.0 $353,503 $215,525
Clay $19,179,765 260 5.0 $1,622,016 $445,624
Coahoma $65,990,487 955 12.0 $7,507,446 $815,365
Copiah $8,764,952 115 1.6 $677,450 $97,080
Covington $9,917,385 135 2.7 $800,248 $695,767
DeSoto $335,776,712 4,400 7.7 $31,835,325 $4,416,845
Forrest (4) $273,674,739 4,200 6.7 $24,324,678 $23,824,338
Franklin $1,233,772 17 1.1 $128,447 $128,926
George $10,458,310 145 2.9 $794,563 $276,193
Greene $2,102,830 28 1.5 $199,459 $254,588
Grenada $49,136,078 750 7.0 $4,231,610 $116,250
Gulf Coast (5)
$1,989,110,347 26,000 16.9 $225,915,187 $81,036,614
Hinds $361,697,251 6,940 5.3 $35,913,954 $39,847,928
Holmes $3,489,443 48 1.3 $310,009 $233,550
Humphreys $2,270,679 30 1.5 $206,573 $126,469
Estimated County Travel and Tourism Expenditures, Employment, Taxes, Tourism Capital Investment, FY 2016

252 0 1 7 E C O N O M I C I M P A C T R E P O R T | V I S I T M I S S I S S I P P I
County
Travel and Tourism
Expenditures by Visitors (1)
Direct Travel and Tourism Employment
Travel and Tourism
Employment Percentage (2)
State/Local Taxes/Fees
Attributed to Tourism (3)
Tourism Capital
Investment
Panola $49,384,366 660 5.9 $4,222,920 $334,121
Pearl River $31,178,230 415 4.1 $2,620,641 $520,940
Perry (4)
Pike $41,258,846 580 3.9 $3,718,974 $710,668
Pontotoc $11,177,078 135 1.1 $878,741 $182,407
Prentiss $7,918,218 105 1.4 $604,818 $198,390
Quitman $1,048,208 15 1.4 $111,224 $72,779
Rankin $252,209,181 3,400 5.1 $23,588,196 $16,338,493
Scott $20,805,875 280 2.2 $1,601,459 $731,642
Sharkey $1,431,026 20 1.9 $124,117 $0
Simpson $21,311,936 285 3.9 $1,619,841 $109,063
Smith $2,134,341 28 1.0 $174,559 $0
Stone $12,970,104 175 4.5 $1,048,890 $153,845
Sunflower $14,529,614 195 2.3 $1,293,842 $643,992
Tallahatchie $2,005,086 28 0.9 $194,782 $0
Tate $11,011,510 150 2.7 $914,699 $885,314
Tippah $7,980,882 105 1.8 $691,033 $505,775
Tishomingo $15,831,626 210 3.5 $1,228,413 $0
Tunica $556,989,166 5,800 62.2 $69,871,341 $483,542
Union $21,934,649 290 2.7 $2,035,860 $379,498
Walthall $2,498,077 34 1.4 $249,939 $129,894
Warren $203,822,874 3,950 19.2 $22,121,458 $1,415,522
Washington $87,070,747 1,465 8.5 $9,378,151 $2,237,396
Wayne $8,193,643 110 2.3 $636,727 $126,763
Webster $2,491,618 34 1.8 $219,320 $224,819
County
Travel and Tourism
Expenditures by Visitors (1)
Direct Travel and Tourism Employment
Travel and Tourism
Employment Percentage (2)
State/Local Taxes/Fees
Attributed to Tourism (3)
Tourism Capital
Investment
Wilkinson $3,086,200 45 2.5 $276,449 $272,964
Winston $17,364,225 240 5.2 $1,377,323 $518,815
Yalobusha $3,884,239 50 1.6 $302,381 $211,665
Yazoo $14,903,475 205 3.2 $1,417,803 $800,000
Other (7) $160,905,539 $14,833,287
Total $6,296,849,893 86,600 7.6% $638,984,005 $255,094,751
1. These are nominal dollar amounts; not adjusted for inflation. Appendix E reflects July 2015 - June 2016 data.
2. The travel and tourism employment percentage equals the estimated direct tourism jobs divided by the county level establishment based nonfarm employment. Data are based on where the employees work, not where they reside. Travel and tourism employment estimates are lower than the leisure and hospitality figures.
3. Estimated state/local travel and tourism taxes from travel/visitor expenditures and other activity. Includes 7 percent sales tax and 18.5 percent portion diverted to cities; state-licensed casinos; seawall and city/county taxes; state-licensed casino gaming tax revenues; room/restaurant special taxes; motor vehicle rental tax and petroleum tax diversions to counties; Alcohol Beverage Control county share of permit license fees and excise taxes; beer/wine taxes; use taxes; tourism capital investment local permit fees; real and personal property taxes (hotels/casinos and restaurants in some counties). Data attributable to travel and tourism.
4. Lamar and Perry counties data included with Forrest County as Hattiesburg Area. 5. Gulf Coast reflects combined data for Hancock, Harrison and Jackson counties. 6. Neshoba County employment figures reflect estimated Pearl River Resort employment from separate
sources. Pearl River Resort travel and tourism expenditures by visitors: not available. Estimated tourism capital investment is based on data from sources responding to the survey.
7. Other includes estimated gasoline sales and taxes for some Mississippi counties, diesel fuel sales, the nonresident license sales by the Mississippi Department of Wildlife, Fisheries and Parks (under fees) and use taxes. Sales and tax collections not traced to specific counties, are included. Appendix E has estimated travel and tourism expenditures at state-licensed casinos in these counties: Adams, Coahoma, Hancock, Harrison, Tunica, Warren and Washington.
SOURCES: Chambers of commerce and other economic development and tourism offices; county tax assessors and collectors; Dodge Data Analytics; Mississippi Department of Employment Security, Labor Market Information Department; Mississippi Department of Revenue; Mississippi Department of Transportation; Mississippi Department of Wildlife, Fisheries and Parks; Mississippi Gaming Commission.
APPENDIX E - CONTINUEDEstimated County Travel and Tourism Expenditures, Employment, Taxes, Tourism Capital Investment, FY 2016

26 2 0 1 7 E C O N O M I C I M P A C T R E P O R T | V I S I T M I S S I S S I P P I
APPENDIX FEstimated County Travel and Tourism Expenditures, Employment, Taxes, Tourism Capital Investment, FY 2017
CountyTravel and Tourism
Expenditures by Visitors (1)Direct Travel and
Tourism EmploymentTravel and Tourism
Employment Percentage (2)State/Local Taxes/Fees
Attributed to Tourism (3)Tourism Capital
Investment
Adams $110,283,299 2,275 20.8 $10,753,434 $1,000,959
Alcorn $60,927,617 785 5.4 $5,032,875 $37,706
Amite $1,652,526 24 1.5 $160,832 $131,354
Attala $17,267,583 235 5.1 $1,326,076 $978,634
Benton $855,253 12 0.9 $82,536 $1,384
Bolivar $51,644,321 650 5.4 $4,659,789 $3,351,961
Calhoun $3,278,989 45 1.6 $275,927 $271,937
Carroll $682,986 10 0.9 $74,933 $343,324
Chickasaw $5,309,438 75 1.4 $429,594 $103,250
Choctaw $1,068,520 15 0.7 $97,079 $0
Claiborne $3,018,967 44 1.2 $276,502 $0
Clarke $4,065,456 57 2.0 $330,931 $532,331
Clay $19,709,958 265 5.0 $1,671,939 $399,828
Coahoma $64,682,512 945 12.2 $7,457,946 $1,402,413
Copiah $7,979,159 110 1.5 $614,665 $272,130
Covington $9,846,643 135 2.7 $798,279 $1,270,674
DeSoto $344,489,848 4,475 7.4 $32,703,790 $7,240,581
Forrest (4) $278,090,099 4,270 6.7 $25,759,988 $20,714,714
Franklin $1,075,567 15 1.0 $115,564 $227,455
George $10,188,195 145 2.9 $763,286 $365,518
Greene $1,788,028 25 1.3 $170,089 $528,445
Grenada $49,622,844 760 6.9 $4,264,374 $210,362
Gulf Coast (5) $2,041,493,419 26,600 17.3 $233,063,095 $59,380,106
Hinds $361,888,895 6,940 5.3 $36,323,457 $33,210,372
Holmes $3,045,332 45 1.3 $271,270 $1,839,334
Humphreys $2,117,860 30 1.5 $189,821 $22,626
Issaquena $120,560 2 1.4 $11,673 $158,213
Itawamba $16,397,336 225 3.4 $1,373,939 $768,498

272 0 1 7 E C O N O M I C I M P A C T R E P O R T | V I S I T M I S S I S S I P P I
CountyTravel and Tourism
Expenditures by Visitors (1)Direct Travel and
Tourism EmploymentTravel and Tourism
Employment Percentage (2)State/Local Taxes/Fees
Attributed to Tourism (3)Tourism Capital
Investment
Jasper $2,944,815 40 1.1 $256,385 $185,285
Jefferson $945,209 13 1.0 $102,759 $38,640
Jefferson Davis $2,451,357 35 2.1 $216,821 $103,904
Jones $60,943,936 860 3.0 $5,405,948 $679,727
Kemper $1,461,956 22 0.8 $148,958 $21,432
Lafayette $174,182,732 2,200 9.2 $15,378,901 $10,066,499
Lamar (4)
Lauderdale $159,483,512 1,990 5.8 $14,764,730 $12,450,633
Lawrence $2,691,963 38 1.5 $227,641 $0
Leake $7,920,425 115 2.4 $656,151 $472,116
Lee $263,893,916 3,925 7.0 $23,231,894 $11,268,922
Leflore $50,702,657 745 5.4 $3,891,836 $1,183,727
Lincoln $37,447,390 500 4.2 $3,193,232 $0
Lowndes $114,237,534 1,525 5.9 $10,842,105 $527,318
Madison $236,112,378 3,040 5.2 $18,792,957 $1,270,701
Marion $12,056,334 155 1.9 $900,139 $82,945
Marshall $15,864,277 220 3.5 $1,316,993 $4,947,857
Monroe $16,979,463 235 2.4 $1,262,536 $1,254,598
Montgomery $11,556,775 155 6.2 $1,007,995 $93,058
Neshoba (6) $36,028,487 1,975 16.2 $3,059,943 $338,379
Newton $6,436,984 90 1.6 $506,396 $29,454
Noxubee $5,008,195 70 2.6 $425,535 $0
Oktibbeha $100,073,163 1,360 6.1 $8,838,992 $15,899,310
Panola $49,028,172 660 6.0 $4,162,688 $992,864
Pearl River $30,591,265 410 4.0 $2,524,390 $456,946
Perry (4)
Pike $41,824,777 585 4.0 $3,873,274 $1,555,702
Pontotoc $11,407,606 150 1.1 $864,998 $801,257
APPENDIX F - CONTINUEDEstimated County Travel and Tourism Expenditures, Employment, Taxes, Tourism Capital Investment, FY 2017

28 2 0 1 7 E C O N O M I C I M P A C T R E P O R T | V I S I T M I S S I S S I P P I
CountyTravel and Tourism
Expenditures by Visitors (1)Direct Travel and
Tourism EmploymentTravel and Tourism
Employment Percentage (2)State/Local Taxes/Fees
Attributed to Tourism (3)Tourism Capital
Investment
Prentiss $7,827,945 105 1.4 $592,126 $643,650
Quitman $901,515 13 1.3 $103,500 $1,410,053
Rankin $257,464,410 3,440 5.1 $25,242,796 $30,801,769
Scott $20,599,298 280 2.1 $1,568,580 $361,944
Sharkey $1,271,172 18 1.8 $113,415 $2,839,973
Simpson $21,680,018 285 3.9 $1,648,858 $365,609
Smith $1,957,983 28 1.0 $162,688 $163,692
Stone $13,680,875 185 4.7 $1,242,438 $486,076
Sunflower $15,808,380 220 2.7 $1,305,228 $187,747
Tallahatchie $1,854,131 26 0.8 $177,729 $636,382
Tate $10,962,750 150 2.6 $881,757 $1,263,357
Tippah $7,917,962 105 1.8 $650,137 $478,973
Tishomingo $15,682,845 210 3.3 $1,223,552 $279,010
Tunica $514,173,224 5,545 62.0 $62,975,893 $400,000
Union $21,974,822 290 2.7 $2,045,597 $426,284
Walthall $2,411,828 34 1.4 $207,629 $18,747
Warren $204,449,881 3,925 19.2 $22,721,631 $2,163,839
Washington $87,536,093 1,465 8.5 $9,548,680 $296,660
Wayne $7,750,256 110 2.3 $597,835 $742,971
Webster $2,356,433 34 1.8 $205,581 $33,344
Wilkinson $3,075,435 45 2.6 $272,376 $259,796
Winston $16,835,037 235 5.1 $1,307,167 $311,266
Yalobusha $3,576,080 50 1.6 $289,414 $595,568
Yazoo $15,362,621 210 3.2 $1,445,833 $763,771
Other (7) $160,997,165 $14,848,978 $6,373,877
Total $6,342,974,647 87,335 7.6% $646,287,298 $251,789,741

29
1. These are nominal dollar amounts not adjusted for inflation. Appendix F reflects July 2016 - June 2017 data. 2. The travel and tourism employment percentage equals the estimated direct tourism jobs divided by the county level establishment based nonfarm employment. Data are based on where the employees work, not
where they reside. Travel and tourism employment estimates are lower than the leisure and hospitality figures. 3. Estimated state/local travel and tourism taxes from travel/visitor expenditures and other activity. Includes 7 percent sales tax and 18.5 percent portion diverted to cities; state-licensed casinos; seawall and city/
county taxes; state-licensed casino gaming tax revenues; room/restaurant special taxes; motor vehicle rental tax and petroleum tax diversions to counties; Alcohol Beverage Control county share of permit license fees and excise taxes; beer/wine taxes; use taxes; tourism capital investment local permit fees; real and personal property taxes (hotels/casinos and restaurants in some counties). Data attributable to travel and tourism.
4. Lamar and Perry counties data included with Forrest County as Hattiesburg Area. 5. Gulf Coast reflects combined data for Hancock, Harrison and Jackson counties. 6. Neshoba County employment figures do reflect estimated Pearl River Resort employment - rough estimate - from separate sources. Pearl River Resort Travel and Tourism expenditures by visitors: not available.
Estimated tourism capital investment is based on data from sources responding to the survey. 7. Other includes estimated gasoline sales and taxes for some Mississippi counties, diesel fuel sales, the nonresident license sales by the Mississippi Department of Wildlife, Fisheries & Parks (under fees) and use
taxes. Sales and tax collections not traced to specific counties are included. Appendix F has estimated travel and tourism expenditures at state-licensed casinos in these counties: Adams, Coahoma, Hancock, Harrison, Tunica, Warren and Washington.
SOURCES: Chambers of commerce and other economic development and tourism offices; county tax assessors and collectors; Dodge Data Analytics; Mississippi Department of Employment Security, Labor Market Information Department; Mississippi Department of Revenue; Mississippi Department of Transportation; Mississippi Department of Wildlife, Fisheries and Parks; Mississippi Gaming Commission.
APPENDIX F - CONTINUEDEstimated County Travel and Tourism Expenditures, Employment, Taxes, Tourism Capital Investment, FY 2017
30 2 0 1 7 E C O N O M I C I M P A C T R E P O R T | V I S I T M I S S I S S I P P I
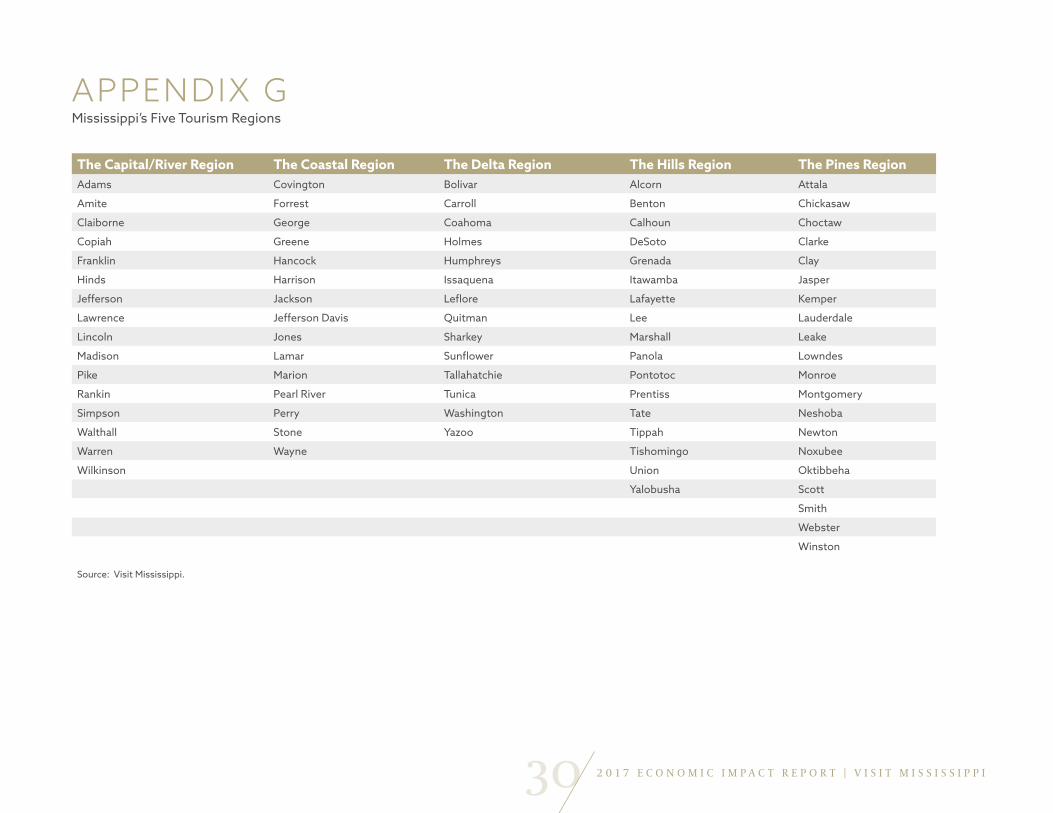
APPENDIX GMississippi’s Five Tourism Regions
The Capital/River Region The Coastal Region The Delta Region The Hills Region The Pines RegionAdams Covington Bolivar Alcorn Attala
Amite Forrest Carroll Benton Chickasaw
Claiborne George Coahoma Calhoun Choctaw
Copiah Greene Holmes DeSoto Clarke
Franklin Hancock Humphreys Grenada Clay
Hinds Harrison Issaquena Itawamba Jasper
Jefferson Jackson Leflore Lafayette Kemper
Lawrence Jefferson Davis Quitman Lee Lauderdale
Lincoln Jones Sharkey Marshall Leake
Madison Lamar Sunflower Panola Lowndes
Pike Marion Tallahatchie Pontotoc Monroe
Rankin Pearl River Tunica Prentiss Montgomery
Simpson Perry Washington Tate Neshoba
Walthall Stone Yazoo Tippah Newton
Warren Wayne Tishomingo Noxubee
Wilkinson Union Oktibbeha
Yalobusha Scott
Smith
Webster
Winston
Source: Visit Mississippi.

312 0 1 7 E C O N O M I C I M P A C T R E P O R T | V I S I T M I S S I S S I P P I
APPENDIX HCapital/River Region Travel and Tourism Expenditures, Employment, Taxes, Tourism Capital Investment, FY 2017
THE CAPITAL/RIVER REGION
Travel and Tourism
Expenditures by Visitors
Direct Travel and Tourism Employment
Travel and Tourism
Employment Percentage
(1)
State and Local Taxes Attributed
to Travel and Tourism (2)
Tourism Capital
Investment
Adams $110,283,299 2,275 20.8 $10,753,434 $1,000,959
Amite $1,652,526 24 1.5 $160,832 $131,354
Claiborne $3,018,967 44 1.2 $276,502 $0
Copiah $7,979,159 110 1.5 $614,665 $272,130
Franklin $1,075,567 15 1.0 $115,564 $227,455
Hinds $361,888,895 6,940 5.3 $36,323,457 $33,210,372
Jefferson $945,209 13 1.0 $102,759 $38,640
Lawrence $2,691,963 38 1.5 $227,641 $0
Lincoln $37,447,390 500 4.2 $3,193,232 $0
Madison $236,112,378 3,040 5.2 $18,792,957 $1,270,701
Pike $41,824,777 585 4.0 $3,873,274 $1,555,702
Rankin $257,464,410 3,440 5.1 $25,242,796 $30,801,769
Simpson $21,680,018 285 3.9 $1,648,858 $365,609
Walthall $2,411,828 34 1.4 $207,629 $18,747
Warren $204,449,881 3,925 19.2 $22,721,631 $2,163,839
Wilkinson $3,075,435 45 2.6 $272,376 $259,796
Regional Totals $1,294,001,702 21,313 6.2 $124,527,607 $71,317,073
Does not include diesel fuel sales, or nonresident licensing fees, or 83rd Division sales. Gasoline sales at the pump are included for some counties.
1. The travel and tourism employment percentage equals the estimated direct tourism jobs divided by the county level establishment based nonfarm employment. Data are based on where the employees work, not where they reside.
2. Estimated state/local travel and tourism taxes from travel/visitor expenditures and some other activity. Includes 7 percent sales tax and 18.5 percent portion diverted to cities; state-licensed casinos; city/county taxes; state-licensed casino gaming tax revenues; room/restaurant special taxes; motor vehicle rental and petroleum tax diversions to counties; Alcohol Beverage Control county share of permit license fees; use taxes; tourism capital investment local permit fees; real and personal property taxes (hotels/casinos and restaurants in some counties). Data attributable to travel and tourism.
SOURCES: Chambers of commerce and other economic development and tourism offices; county tax assessors and collectors; Dodge Data Analytics; Mississippi Department of Employment Security, Labor Market Information Department; Mississippi Department of Revenue; Mississippi Department of Transportation; Mississippi Department of Wildlife, Fisheries and Parks; Mississippi Gaming Commission.
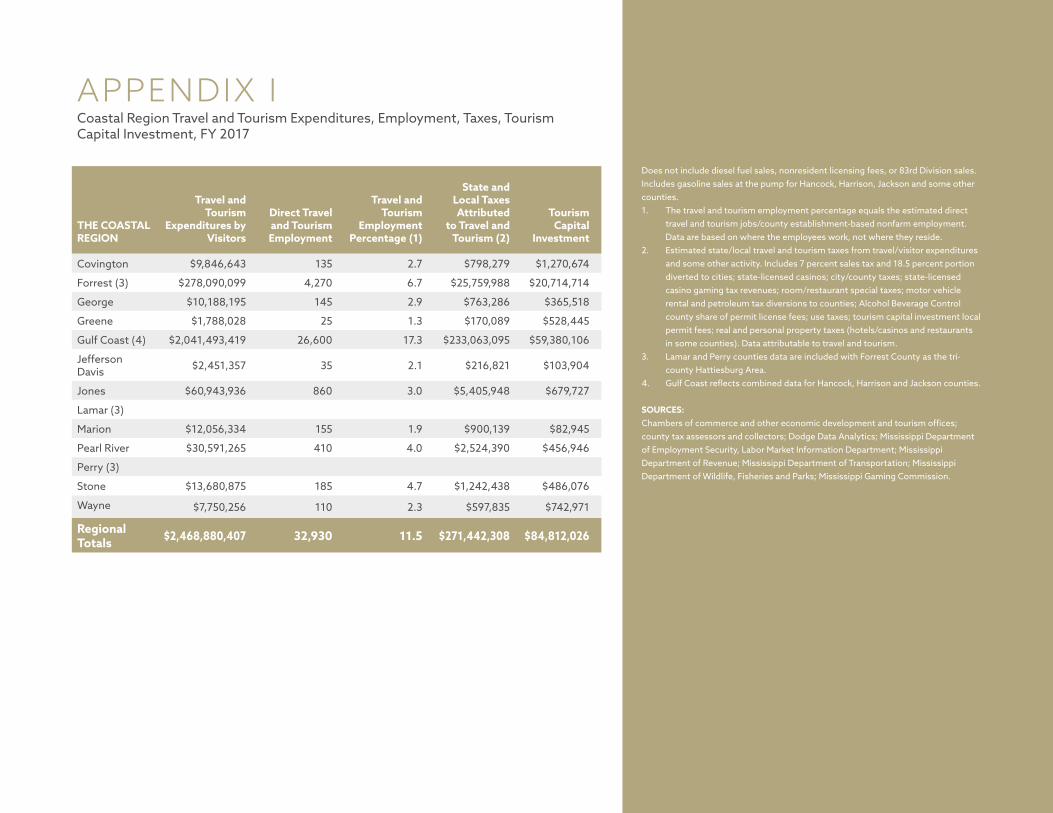
APPENDIX ICoastal Region Travel and Tourism Expenditures, Employment, Taxes, Tourism Capital Investment, FY 2017
THE COASTAL REGION
Travel and Tourism
Expenditures by Visitors
Direct Travel and Tourism Employment
Travel and Tourism
Employment Percentage (1)
State and Local Taxes Attributed
to Travel and Tourism (2)
Tourism Capital
Investment
Covington $9,846,643 135 2.7 $798,279 $1,270,674
Forrest (3) $278,090,099 4,270 6.7 $25,759,988 $20,714,714
George $10,188,195 145 2.9 $763,286 $365,518
Greene $1,788,028 25 1.3 $170,089 $528,445
Gulf Coast (4) $2,041,493,419 26,600 17.3 $233,063,095 $59,380,106
Jefferson Davis $2,451,357 35 2.1 $216,821 $103,904
Jones $60,943,936 860 3.0 $5,405,948 $679,727
Lamar (3)
Marion $12,056,334 155 1.9 $900,139 $82,945
Pearl River $30,591,265 410 4.0 $2,524,390 $456,946
Perry (3)
Stone $13,680,875 185 4.7 $1,242,438 $486,076
Wayne $7,750,256 110 2.3 $597,835 $742,971
Regional Totals $2,468,880,407 32,930 11.5 $271,442,308 $84,812,026
Does not include diesel fuel sales, nonresident licensing fees, or 83rd Division sales. Includes gasoline sales at the pump for Hancock, Harrison, Jackson and some other counties. 1. The travel and tourism employment percentage equals the estimated direct
travel and tourism jobs/county establishment-based nonfarm employment. Data are based on where the employees work, not where they reside.
2. Estimated state/local travel and tourism taxes from travel/visitor expenditures and some other activity. Includes 7 percent sales tax and 18.5 percent portion diverted to cities; state-licensed casinos; city/county taxes; state-licensed casino gaming tax revenues; room/restaurant special taxes; motor vehicle rental and petroleum tax diversions to counties; Alcohol Beverage Control county share of permit license fees; use taxes; tourism capital investment local permit fees; real and personal property taxes (hotels/casinos and restaurants in some counties). Data attributable to travel and tourism.
3. Lamar and Perry counties data are included with Forrest County as the tri-county Hattiesburg Area.
4. Gulf Coast reflects combined data for Hancock, Harrison and Jackson counties.
SOURCES: Chambers of commerce and other economic development and tourism offices; county tax assessors and collectors; Dodge Data Analytics; Mississippi Department of Employment Security, Labor Market Information Department; Mississippi Department of Revenue; Mississippi Department of Transportation; Mississippi Department of Wildlife, Fisheries and Parks; Mississippi Gaming Commission.
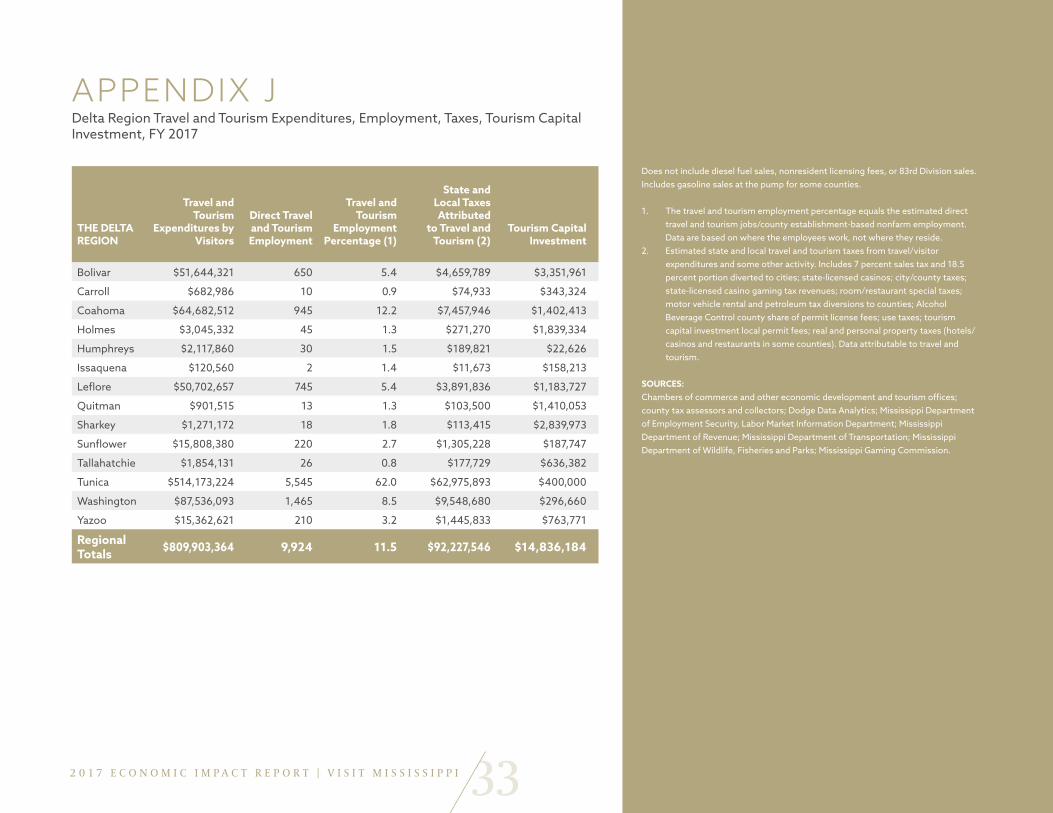
332 0 1 7 E C O N O M I C I M P A C T R E P O R T | V I S I T M I S S I S S I P P I
APPENDIX JDelta Region Travel and Tourism Expenditures, Employment, Taxes, Tourism Capital Investment, FY 2017
THE DELTA REGION
Travel and Tourism
Expenditures by Visitors
Direct Travel and Tourism Employment
Travel and Tourism
Employment Percentage (1)
State and Local Taxes Attributed
to Travel and Tourism (2)
Tourism Capital Investment
Bolivar $51,644,321 650 5.4 $4,659,789 $3,351,961
Carroll $682,986 10 0.9 $74,933 $343,324
Coahoma $64,682,512 945 12.2 $7,457,946 $1,402,413
Holmes $3,045,332 45 1.3 $271,270 $1,839,334
Humphreys $2,117,860 30 1.5 $189,821 $22,626
Issaquena $120,560 2 1.4 $11,673 $158,213
Leflore $50,702,657 745 5.4 $3,891,836 $1,183,727
Quitman $901,515 13 1.3 $103,500 $1,410,053
Sharkey $1,271,172 18 1.8 $113,415 $2,839,973
Sunflower $15,808,380 220 2.7 $1,305,228 $187,747
Tallahatchie $1,854,131 26 0.8 $177,729 $636,382
Tunica $514,173,224 5,545 62.0 $62,975,893 $400,000
Washington $87,536,093 1,465 8.5 $9,548,680 $296,660
Yazoo $15,362,621 210 3.2 $1,445,833 $763,771
Regional Totals $809,903,364 9,924 11.5 $92,227,546 $14,836,184
Does not include diesel fuel sales, nonresident licensing fees, or 83rd Division sales. Includes gasoline sales at the pump for some counties. 1. The travel and tourism employment percentage equals the estimated direct
travel and tourism jobs/county establishment-based nonfarm employment. Data are based on where the employees work, not where they reside.
2. Estimated state and local travel and tourism taxes from travel/visitor expenditures and some other activity. Includes 7 percent sales tax and 18.5 percent portion diverted to cities; state-licensed casinos; city/county taxes; state-licensed casino gaming tax revenues; room/restaurant special taxes; motor vehicle rental and petroleum tax diversions to counties; Alcohol Beverage Control county share of permit license fees; use taxes; tourism capital investment local permit fees; real and personal property taxes (hotels/casinos and restaurants in some counties). Data attributable to travel and tourism.
SOURCES: Chambers of commerce and other economic development and tourism offices; county tax assessors and collectors; Dodge Data Analytics; Mississippi Department of Employment Security, Labor Market Information Department; Mississippi Department of Revenue; Mississippi Department of Transportation; Mississippi Department of Wildlife, Fisheries and Parks; Mississippi Gaming Commission.

APPENDIX KHills Region Travel and Tourism Expenditures, Employment, Taxes, Tourism Capital Investment, FY 2017
THE HILLS REGION
Travel and Tourism
Expenditures by Visitors
Direct Travel and Tourism Employment
Travel and Tourism
Employment Percentage (1)
State and Local Taxes Attributed
to Travel and Tourism (2)
Tourism Capital
Investment
Alcorn $60,927,617 785 5.4 $5,032,875 $37,706
Benton $855,253 12 0.9 $82,536 $1,384
Calhoun $3,278,989 45 1.6 $275,927 $271,937
DeSoto $344,489,848 4,475 7.4 $32,703,790 $7,240,581
Grenada $49,622,844 760 6.9 $4,264,374 $210,362
Itawamba $16,397,336 225 3.4 $1,373,939 $768,498
Lafayette $174,182,732 2,200 9.2 $15,378,901 $10,066,499
Lee $263,893,916 3,925 7.0 $23,231,894 $11,268,922
Marshall $15,864,277 220 3.5 $1,316,993 $4,947,857
Panola $49,028,172 660 6.0 $4,162,688 $992,864
Pontotoc $11,407,606 150 1.1 $864,998 $801,257
Prentiss $7,827,945 105 1.4 $592,126 $643,650
Tate $10,962,750 150 2.6 $881,757 $1,263,357
Tippah $7,917,962 105 1.8 $650,137 $478,973
Tishomingo $15,682,845 210 3.3 $1,223,552 $279,010
Union $21,974,822 290 2.7 $2,045,597 $426,284
Yalobusha $3,576,080 50 1.6 $289,414 $595,568
Regional Totals $1,057,890,994 14,367 5.8 $94,371,498 $40,294,709
Does not include diesel fuel sales, nonresident licensing fees, or 83rd Division sales. Includes gasoline sales at the pump for some counties. 1. The travel and tourism employment percentage equals the estimated direct
travel and tourism jobs/county establishment-based nonfarm employment. Data are based on where the employees work, not where they reside.
2. Estimated state/local travel and tourism taxes from travel/visitor expenditures and some other activity. Includes 7 percent sales tax and 18.5 percent portion diverted to cities; state-licensed casinos; city/county taxes; state-licensed casino gaming tax revenues; room/restaurant special taxes; motor vehicle rental and petroleum tax diversions to counties; Alcohol Beverage Control county share of permit license fees; use taxes; tourism capital investment local permit fees; real and personal property taxes (hotels/casinos and restaurants in some counties). Data attributable to travel and tourism.
SOURCES: Chambers of commerce and other economic development and tourism offices; county tax assessors and collectors; Dodge Data Analytics; Mississippi Department of Employment Security, Labor Market Information Department; Mississippi Department of Revenue; Mississippi Department of Transportation; Mississippi Department of Wildlife, Fisheries and Parks; Mississippi Gaming Commission.

352 0 1 7 E C O N O M I C I M P A C T R E P O R T | V I S I T M I S S I S S I P P I
APPENDIX LPines Region Travel and Tourism Expenditures, Employment, Taxes, Tourism Capital Investment, FY 2017
THE PINES REGION
Travel and Tourism
Expenditures by Visitors
Direct Travel and Tourism Employment
Travel and Tourism
Employment Percentage (1)
State and Local Taxes Attributed
to Travel and Tourism (2)
Tourism Capital
Investment
Attala $17,267,583 235 5.1 $1,326,076 $978,634
Chickasaw $5,309,438 75 1.4 $429,594 $103,250
Choctaw $1,068,520 15 0.7 $97,079 $0
Clarke $4,065,456 57 2.0 $330,931 $532,331
Clay $19,709,958 265 5.0 $1,671,939 $399,828
Jasper $2,944,815 40 1.1 $256,385 $185,285
Kemper $1,461,956 22 0.8 $148,958 $21,432
Lauderdale $159,483,512 1,990 5.8 $14,764,730 $12,450,633
Leake $7,920,425 115 2.4 $656,151 $472,116
Lowndes $114,237,534 1,525 5.9 $10,842,105 $527,318
Monroe $16,979,463 235 2.4 $1,262,536 $1,254,598
Montgomery $11,556,775 155 6.2 $1,007,995 $93,058
Neshoba $36,028,487 1,975 16.2 $3,059,943 $338,379
Newton $6,436,984 90 1.6 $506,396 $29,454
Noxubee $5,008,195 70 2.6 $425,535 $0
Oktibbeha $100,073,163 1,360 6.1 $8,838,992 $15,899,310
Scott $20,599,298 280 2.1 $1,568,580 $361,944
Smith $1,957,983 28 1.0 $162,688 $163,692
Webster $2,356,433 34 1.8 $205,581 $33,344
Winston $16,835,037 235 5.1 $1,307,167 $311,266
Regional Totals $551,301,015 8,801 5.2 $48,869,361 $34,155,872
Does not include diesel fuel sales, nonresident licensing fees, or 83rd Division sales. Includes gasoline sales at the pump for some counties. 1. The travel and tourism employment percentage equals the estimated direct
travel and tourism jobs/county establishment-based nonfarm employment. Data are based on where the employees work, not where they reside.
2. Estimated state/ local travel and tourism taxes from travel/visitor expenditures and some other activity. Includes 7 percent sales tax and 18.5 percent portion diverted to cities; state-licensed casinos; city/county taxes; state-licensed casino gaming tax revenues; room/restaurant special taxes; motor vehicle rental and petroleum tax diversions to counties; Alcohol Beverage Control county share of permit license fees; use taxes; tourism capital investment local permit fees; real and personal property taxes (hotels/casinos and restaurants in some counties). Data attributable to travel and tourism.
SOURCES: Chambers of commerce and other economic development and tourism offices; county tax assessors and collectors; Dodge Data Analytics; Mississippi Department of Employment Security, Labor Market Information Department; Mississippi Department of Revenue; Mississippi Department of Transportation; Mississippi Department of Wildlife, Fisheries and Parks; Mississippi Gaming Commission.
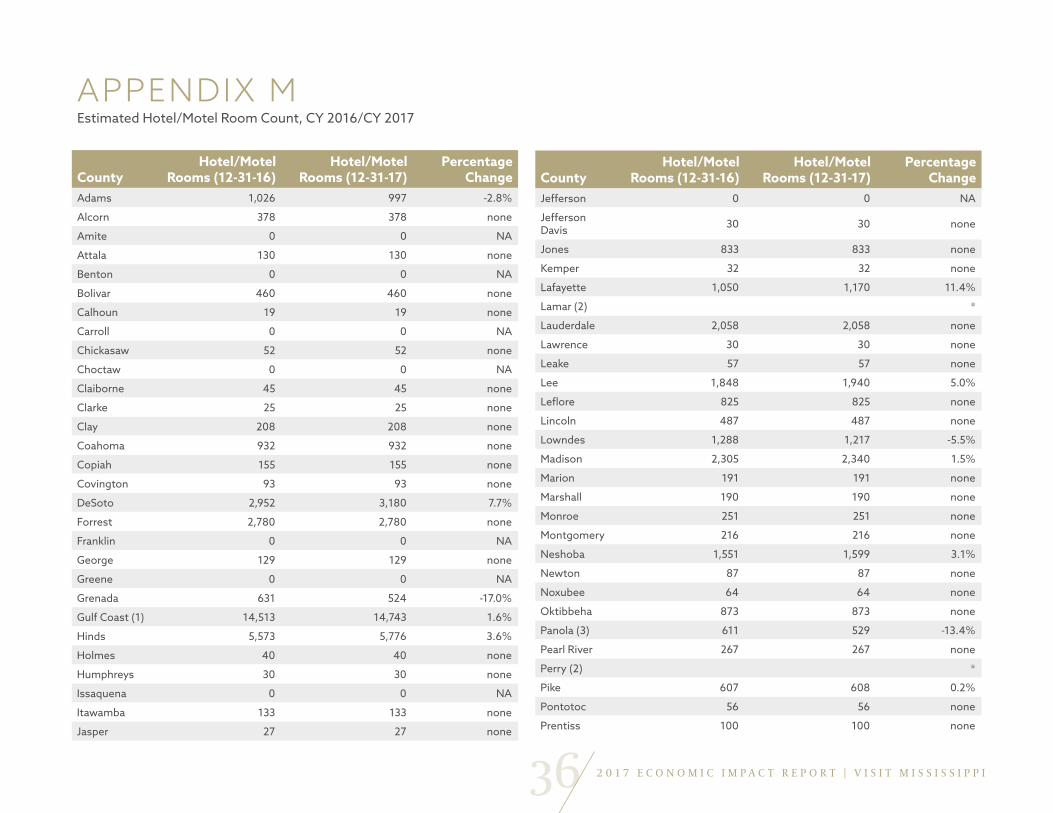
36 2 0 1 7 E C O N O M I C I M P A C T R E P O R T | V I S I T M I S S I S S I P P I
APPENDIX MEstimated Hotel/Motel Room Count, CY 2016/CY 2017
CountyHotel/Motel
Rooms (12-31-16)Hotel/Motel
Rooms (12-31-17)Percentage
ChangeAdams 1,026 997 -2.8%
Alcorn 378 378 none
Amite 0 0 NA
Attala 130 130 none
Benton 0 0 NA
Bolivar 460 460 none
Calhoun 19 19 none
Carroll 0 0 NA
Chickasaw 52 52 none
Choctaw 0 0 NA
Claiborne 45 45 none
Clarke 25 25 none
Clay 208 208 none
Coahoma 932 932 none
Copiah 155 155 none
Covington 93 93 none
DeSoto 2,952 3,180 7.7%
Forrest 2,780 2,780 none
Franklin 0 0 NA
George 129 129 none
Greene 0 0 NA
Grenada 631 524 -17.0%
Gulf Coast (1) 14,513 14,743 1.6%
Hinds 5,573 5,776 3.6%
Holmes 40 40 none
Humphreys 30 30 none
Issaquena 0 0 NA
Itawamba 133 133 none
Jasper 27 27 none
CountyHotel/Motel
Rooms (12-31-16)Hotel/Motel
Rooms (12-31-17)Percentage
ChangeJefferson 0 0 NA
Jefferson Davis 30 30 none
Jones 833 833 none
Kemper 32 32 none
Lafayette 1,050 1,170 11.4%
Lamar (2) *
Lauderdale 2,058 2,058 none
Lawrence 30 30 none
Leake 57 57 none
Lee 1,848 1,940 5.0%
Leflore 825 825 none
Lincoln 487 487 none
Lowndes 1,288 1,217 -5.5%
Madison 2,305 2,340 1.5%
Marion 191 191 none
Marshall 190 190 none
Monroe 251 251 none
Montgomery 216 216 none
Neshoba 1,551 1,599 3.1%
Newton 87 87 none
Noxubee 64 64 none
Oktibbeha 873 873 none
Panola (3) 611 529 -13.4%
Pearl River 267 267 none
Perry (2) *
Pike 607 608 0.2%
Pontotoc 56 56 none
Prentiss 100 100 none

372 0 1 7 E C O N O M I C I M P A C T R E P O R T | V I S I T M I S S I S S I P P I
CountyHotel/Motel
Rooms (12-31-16)Hotel/Motel
Rooms (12-31-17)Percentage
Change
Quitman 0 0 NA
Rankin 2,652 2,652 none
Scott 221 221 none
Sharkey 19 19 none
Simpson 230 230 none
Smith 32 32 none
Stone 184 184 none
Sunflower 234 234 none
Tallahatchie 0 0 NA
Tate 131 131 none
Tippah 77 49 -36.4%
Tishomingo 76 45 -40.8%
Tunica 4,744 4,664 -1.7%
Union 344 344 none
Walthall 30 30 none
Warren 2,216 2,087 -5.8%
Washington 1,172 1,172 none
Wayne 129 129 none
Webster 33 33 none
Wilkinson 18 18 none
Winston 243 243 none
Yalobusha 20 20 none
Yazoo 225 225 none
Total 59,268 59,668 0.7%
Appendix M does not include bed & breakfast rooms, hotel/motel rooms under construction January - March 2018, cabins, or condo/timeshare/cottage rooms. County room counts are based on figures provided by various sources. Data may come from different sources on successive years. STR inventory data were used for 2016 - 2017 updates. Some counties had room inventory changes: closings, additions or renovations.
STR lodging inventory as of December 31, 2017: 694 hotels/motels and 59,498 rooms. STR lodging inventory as of December 31, 2016: 690 hotels/motels and 59,206 rooms. 1. Gulf Coast is the combination of Hancock, Harrison and Jackson counties. 2. Lamar and Perry counties totals are included in Forrest County, as part of the
Hattiesburg Area. Perry County does not have any hotels/motels. 3. Panola County had a hotel closed for renovations in 2017. This property will
re-open in 2018. A separate new hotel was also built in Batesville in 2018.
SOURCES: Mississippi chambers of commerce, economic development offices, cities, convention and visitor bureaus, tourism offices and other local entities; STR.
APPENDIX M - CONTINUEDEstimated Hotel/Motel Room Count, CY 2016/CY 2017
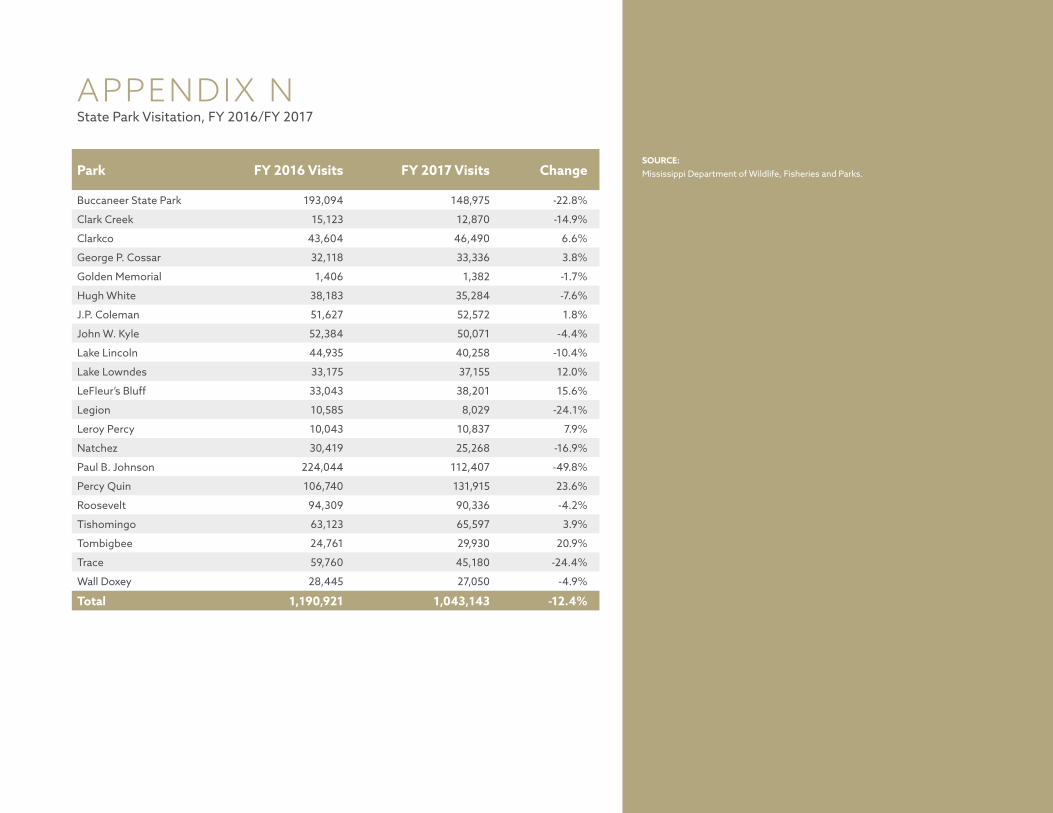
APPENDIX NState Park Visitation, FY 2016/FY 2017
Park FY 2016 Visits FY 2017 Visits Change
Buccaneer State Park 193,094 148,975 -22.8%
Clark Creek 15,123 12,870 -14.9%
Clarkco 43,604 46,490 6.6%
George P. Cossar 32,118 33,336 3.8%
Golden Memorial 1,406 1,382 -1.7%
Hugh White 38,183 35,284 -7.6%
J.P. Coleman 51,627 52,572 1.8%
John W. Kyle 52,384 50,071 -4.4%
Lake Lincoln 44,935 40,258 -10.4%
Lake Lowndes 33,175 37,155 12.0%
LeFleur’s Bluff 33,043 38,201 15.6%
Legion 10,585 8,029 -24.1%
Leroy Percy 10,043 10,837 7.9%
Natchez 30,419 25,268 -16.9%
Paul B. Johnson 224,044 112,407 -49.8%
Percy Quin 106,740 131,915 23.6%
Roosevelt 94,309 90,336 -4.2%
Tishomingo 63,123 65,597 3.9%
Tombigbee 24,761 29,930 20.9%
Trace 59,760 45,180 -24.4%
Wall Doxey 28,445 27,050 -4.9%
Total 1,190,921 1,043,143 -12.4%
SOURCE: Mississippi Department of Wildlife, Fisheries and Parks.

392 0 1 7 E C O N O M I C I M P A C T R E P O R T | V I S I T M I S S I S S I P P I
APPENDIX OMississippi Nonfarm Establishment-Based Employment Rankings, Direct Jobs, Top Sectors, FY 2017
Sector
FY 2017 Establishment
Based Employment
FY 2017 Employment
Percentage
Private Sector
Rank
Manufacturing (1) 142,525 12.4% 1
Health care and social assistance -private (2) 129,800 11.3% 2
Retail Trade (3) 129,795 11.3% 3
Travel and tourism (4) 87,335 7.6% 4
Administrative support and waste management 63,990 5.6% 5
Leisure accommodation and food services (5) 62,045 5.4% 6
Construction (6) 40,850 3.6% 7
Transportation and warehousing (7) 45,785 4.0% 8
Other services (8) 40,240 3.5% 9
Wholesale trade 34,960 3.1% 10
Finance and insurance 32,315 2.8% 11
Professional, scientific and technical services (9) 30,115 2.6% 12
Information (10) 11,415 1.0% 13
Education services 12,085 1.1% 14
Management of companies 11,100 1.0% 15
Real estate and rental (11) 10,810 0.9% 16
Utilities 8,015 0.7% 17
Mining and logging 6,825 0.6% 18
Leisure arts, entertainment and recreation (12) 2,500 0.2% 19
Government (13) 242,885 21.2% NA
Total statewide nonfarm direct employment 1,145,390 100.0% NA
1. Durable goods comprised 94,317 jobs, or 66.2 percent of manufacturing jobs. 2. Does not include any public sector health care jobs. Those are included under
government. 3. Does not include an estimated 10,139 travel and tourism jobs directly related
to retail trade. 4. Includes accommodations, food services, amusement, arts, entertainment,
state-licensed casino gaming and recreation, transportation, tourism construction, among other jobs. A portion of these jobs are not directly related to travel and tourism, based on the definition of a traveler/visitor in the Glossary. Those jobs not directly related to travel and tourism are included in the accommodations and food services; arts, entertainment and recreation sectors. Appendix A includes the direct FY 2017 statewide travel and tourism jobs.
5. Reflects portion of employment not directly related to travel and tourism, e.g., food services and drinking establishments.
6. Excludes travel and tourism-related construction jobs. 7. Excludes travel and tourism-related scheduled passenger and non-scheduled
charter air transportation; interurban and rural bus transportation; taxi, limousine service, charter bus; scenic and sightseeing transportation; support activities for air transportation.
8. Excludes travel and tourism-related laundry services and parking lots and garages.
9. Excludes travel and tourism-related advertising and travel arrangement and reservation services.
10. Excludes motion picture and video production and motion picture theaters related to travel and tourism.
11. Excludes travel and tourism-related residential property managers and passenger car rental.
12. Includes non-travel and tourism employment, estimated portion attributed to locals.
13. Excludes an estimated 1,970 travel and tourism jobs funded by public monies - state tourism office staff, regional/international airports, museums, historical sights, performing arts, state parks, etc. Includes all public sector employment - including health care and education.
Government is a super sector. SOURCE: Mississippi Department of Employment Security, Labor Market Information Department, in cooperation with the U.S. Department of Labor, Bureau of Labor Statistics.

40 2 0 1 7 E C O N O M I C I M P A C T R E P O R T | V I S I T M I S S I S S I P P I
APPENDIX PRoom/Restaurant Gross Special Tax Revenues by Tourism Office, City-County, FY 2017
Tourism Office, City/County Tourism Council, Bureau
Room Tax Percentage
Restaurant Tax
Percentage
Gross FY 2017 Room Tax
Revenue
Gross FY 2017 Restaurant Tax
RevenueGross FY 2017 Total Tax
Revenue
Aberdeen 1.0 1.0 $4,146 $84,545 $88,691
Baldwyn None 2.0 None $136,384 $136,384
Batesville 3.0 3.0 $228,728 $1,045,872 $1,274,600
Bay Springs 3.0 None $3,248 None $3,248
Brandon (1) 3.0 2.0 None $1,073,589 $1,073,589
Brookhaven 2.0 None $144,892 None $144,892
Byhalia 2.0 None $1,861 None $1,861
Canton 2.0 2.0 $120,327 $494,682 $615,009
Carthage (2) 2.0 2.0 $5,335 $171,107 $176,442
Cleveland 2.0 2.0 $120,292 $734,088 $854,380
Clinton 2.0 None $173,574 None $173,574
Coahoma County 2.0 1.0 $112,885 $279,326 $392,211
Columbus-Lowndes 2.0 2.0 $298,492 $1,922,744 $2,221,236
Como 2.0 2.0 $1,250 $70,044 $71,294
Corinth 2.0 2.0 $114,416 $1,232,589 $1,347,005
DeSoto County 2.0 2.0 $1,340,000 $7,173,588 $8,513,588
Florence None 2.0 None $316,790 $316,790
Flowood None 2.0 None $2,688,376 $2,688,376
Fulton 3.0 None $66,486 None $66,486
Greenwood 1.0 1.0 $92,047 $352,135 $444,182
Grenada 2.0 1.0 $151,800 $369,645 $521,445
Hancock County 2.0 None $130,358 None $130,358
Harrison County (3) 5.0 None $7,420,435 None $7,420,435
Hattiesburg 2.0 2.0 $692,881 $5,042,556 $5,735,437
Hernando 3.0 None $34,890 None $34,890
Holly Springs 2.0 2.0 $28,942 $308,496 $337,438
Horn Lake $2 per night None $326,521 None $326,521

412 0 1 7 E C O N O M I C I M P A C T R E P O R T | V I S I T M I S S I S S I P P I
Tourism Office, City/County Tourism Council, Bureau
Room Tax Percentage
Restaurant Tax
Percentage
Gross FY 2017 Room Tax
Revenue
Gross FY 2017 Restaurant Tax
RevenueGross FY 2017 Total Tax
Revenue
Houston (4) 2.0 2.0 $6,667 $147,079 $153,746
Indianola 2.0 2.0 $50,236 $399,308 $449,544
Jackson, City of (5) 4.0 2.0 $2,571,705 $6,070,271 $8,641,976
Jackson County (6) 2.0 None $523,069 None $523,069
Kosciusko 2.0 None $33,836 None $33,836
Lauderdale County 2.5 None $808,005 None $808,005
Laurel 2.0 2.0 $173,312 $1,329,429 $1,502,741
Louisville 2.0 None $40,913 None $40,913
Magee 1.0 1.0 $28,771 $232,221 $260,992
McComb 3.0 None $242,214 None $242,214
Meridian (7) None 2.0 None $1,580,335 $1,580,335
Montgomery County 2.0 None $97,293 None $97,293
Moss Point 3.0 None $253,019 None $253,019
Natchez 3.0 plus $2 1.5 $903,156 $789,167 $1,692,323
New Albany 2.0 2.0 $83,142 $743,027 $826,169
Newton $1/room night None $12,024 None $12,024
Ocean Springs 2.0 2.0 $43,517 $1,305,854 $1,349,371
Oxford 2.0 2.0 $463,808 $3,015,278 $3,479,086
Pascagoula (8) 3.0 2.0 $154,026 $463,040 $617,066
Pearl None 2.0 None $681,626 $681,626
Philadelphia 3.0 None $95,922 None $95,922
Picayune 2.0 1.0 $55,317 $406,957 $462,274
Pontotoc 2.0 2.0 $9,097 $419,881 $428,978
Rankin County 2.0 None $1,052,215 None $1,052,215
Richland None 2.0 None $416,784 $416,784
Ridgeland 1.0 1.0 $359,820 $1,305,119 $1,664,939
Ripley 2.0 2.0 $10,294 $290,400 $300,694
APPENDIX P - CONTINUEDRoom/Restaurant Gross Special Tax Revenues by Tourism Office, City-County, FY 2017

42
Tourism Office, City/County Tourism Council, Bureau
Room Tax Percentage
Restaurant Tax
Percentage
Gross FY 2017 Room Tax
Revenue
Gross FY 2017 Restaurant Tax
RevenueGross FY 2017 Total Tax
Revenue
Sardis 3.0 3.0 $11,205 $103,461 $114,666
Senatobia 2.0 2.0 $12,804 $454,210 $467,014
Southaven 1.0 1.0 $325,617 $1,538,373 $1,863,990
Starkville 2.0 2.0 $323,612 $1,964,563 $2,288,175
Stone County 2.0 2.0 $34,194 $401,663 $435,857
Tishomingo County 2.0 None $21,901 None $21,901
Tunica County 3.0 3.0 $716,616 $939,436 $1,656,052
Tupelo 2.0 2.0 $592,357 $3,702,314 $4,294,671
Vicksburg 3.0 1.0 $798,816 $912,446 $1,711,262
Washington County 3.0 1.0 $322,085 $609,695 $931,780
West Point 2.0 2.0 $52,545 $489,639 $542,184
Winona (9) None 2.0 None $136,452 $136,452
Yazoo County 2.0 2.0 $69,287 $457,777 $527,064
Total $22,966,223 $54,802,361 $77,768,584
NOTE: Tourism offices include CVBs, convention and visitor councils, tourism associations, tourism commissions, and councils, cities/counties and chambers. A portion of these gross revenues are attributed to locals. September 2016 - August 2017 Collections (July 2016 - June 2017 sales). 1. The 3 percent Brandon lodging tax went into effect August 1, 2017, or FY 2018. 2. Carthage’s 2 percent lodging and 2 percent restaurant tax became effective December 1, 2016. 3. The 5 percent lodging tax is broken down by 55 percent to the Board of Supervisors and 45 percent to the Mississippi Gulf Coast Regional CVB. 4. Houston’s 2 percent lodging and restaurant tax became effective September 1, 2016. 5. Includes a 75 cents per night charge per occupied room. 6. This Jackson County lodging tax goes to the Mississippi Gulf Coast Regional CVB. 7. Meridian’s 2 percent restaurant tax became effective September 1, 2016. 8. Pascagoula’s 2 percent restaurant tax became effective January 1, 2017. 9. Winona’s 2 percent restaurant tax became effective October 1, 2016. Some figures may reflect adjustments-overpayments. SOURCE: Mississippi Department of Revenue.

432 0 1 7 E C O N O M I C I M P A C T R E P O R T | V I S I T M I S S I S S I P P I
TABLE 1Origin of Highway Welcome Center Registrants by U.S. and International Travelers, FY 2016 and FY 2017
OriginFY 2016
RegistrantsFY 2017
RegistrantsPercentage
Change
States 1,890,855 1,855,037 -1.9%
Countries 66,364 57,864 -12.8%
Total 1,957,219 1,912,901 -2.3%
NOTE: Tables 1-3 only reflect those visitors who completed the registration forms
SOURCE: Visit Mississippi.
TABLE 3Highway Welcome Center Registrants, Top 10 Countries, FY 2017
Country RegistrantsPercentage of
CountriesPercentage of
Top Ten
Canada 16,650 28.8% 34.9%
England 8,832 15.3% 18.5%
Germany 6,346 11.0% 13.3%
Australia 4,417 7.6% 9.2%
France 3,569 6.2% 7.5%
Mexico 3,542 6.1% 7.4%
Holland 1,847 3.2% 3.9%
Switzerland 1,045 1.8% 2.2%
New Zealand 771 1.3% 1.6%
Belgium 741 1.3% 1.6%
Other 10,104 17.5% NA
Total 57,864 100.0% 100.0%
SOURCE: Visit Mississippi.
TABLE 2Highway Welcome Center Registrants, Top 10 States, FY 2016 and FY 2017
State FY 2016 FY 2017Percentage
ChangeState’s Share
of FY 2017
Mississippi 339,116 340,623 0.2% 18.4%
Louisiana 295,198 283,843 -3.8% 15.3%
Alabama 183,671 184,177 0.3% 9.9%
Texas 177,628 177,792 0.1% 9.6%
Florida 132,933 128,621 -3.2% 6.9%
Georgia 109,298 108,913 -0.4% 5.9%
Tennessee 108,724 106,733 -1.8% 5.8%
Arkansas 78,961 76,123 -3.6% 4.1%
Missouri 65,495 61,899 -5.5% 3.3%
Illinois 47,280 42,175 -10.8% 2.3%
Other 352,551 344,138 -2.4% 18.6%
Total 1,890,855 1,855,037 -1.9% 100.0%
SOURCE: Visit Mississippi.

44 2 0 1 7 E C O N O M I C I M P A C T R E P O R T | V I S I T M I S S I S S I P P I
TABLE 4Selected Casino Hotel Lodging Indicators by Region, FY 2016
RegionCasino Hotels
Number of Hotel
RoomsOccupancy Percentage
Average Daily Rate
Coastal 11 6,417 89.0 $73.95
Northern 9 4,226 64.8 53.77
Central 6 700 63.6 74.68
Quarterly Average 26 11,343 78.5 $67.85
Selected Casino Hotel Lodging Indicators by Region, FY 2017
RegionCasino Hotels
Number of Hotel
RoomsOccupancy Percentage
Average Daily Rate
Coastal 12 6,627 88.3 $73.28
Northern 8 4,079 62.1 55.68
Central 6 726 64.6 74.24
Quarterly Average 26 11,432 77.5 $68.30
NOTES: Coastal revenues are for cities in Hancock and Harrison counties. Northern revenue reflects Coahoma and Tunica counties. Central revenues comprise cities in Adams, Warren and Washington counties. Data reflect fiscal year quarterly averages. A large portion of casino hotel rooms are complimentary.
SOURCE: Mississippi Gaming Commission quarterly surveys.
452 0 1 7 E C O N O M I C I M P A C T R E P O R T | V I S I T M I S S I S S I P P I
Establishment-based employment: Nonfarm employment
at the state/county level by the establishment’s location, not
by the employee’s place of residence.
Federal and local government fiscal year: October 1 to
September 30.
General Fund: Travel and tourism’s contribution to
Mississippi’s General Fund includes a portion of these
revenues related to travel and tourism — sales tax, personal
income tax, gaming fees and taxes, impact of additional
labor income, construction activity tax and other taxes.
Government expenditures: Public expenditures from state
agency, city and county budgets allocated for travel and
tourism-related projects, or projects with some travel and
tourism linkages.
Gross gaming revenues: Net gains realized by a casino
after payment of all cash paid out as losses to patrons and
those amounts paid to purchase annuities to fund losses
paid to patrons during several years by independent
financial institutions.
IMPLAN: A nationally recognized economic contribution
model to estimate the economic activity associated with
a sale of a good or service. It is the basis for estimating
indirect and induced contributions. In the IMPLAN
model, indirect and induced impacts are filtered through
a Social Accounting Matrix (SAM) for total value added,
employment and labor income.
Indirect contribution: Secondary contribution of
purchase of production by the firm (business level),
holding everything else constant. Example: Hotels purchase
cleaning supplies.
Induced contribution: Secondary contribution from the
purchases made by the workers (consumer level), holding
everything else constant. Example: Hotel employee wages
contribute to the purchase of goods and services in the
local economy.
In-state traveler spending: Mississippians traveling within
the state, at least 50 miles one way.
Metropolitan Statistical Area: Have at least one urbanized
area of 50,000 or more population, plus adjacent territory
that has a high degree of social and economic integration
with the core as measured by commuting ties.
Multipliers: The direct contribution plus the indirect
contribution plus the induced contribution divided by the
direct contribution.
Net traveler/visitor sales and tax revenues: Estimated
portion of travel and tourism-related sales and tax revenues
after removing the estimated local components of the
estimated gross sales and General Fund revenues.
North American Industry Classification System (NAICS)
codes: Six-digit coding system using a
production-oriented approach to categorize economic
units, focusing on how products and services are created.
Secondary jobs and income: Those jobs outside the travel
and tourism business or entity. Example: Truck driver who
delivers linens to a hotel, or food and beverage products
to restaurants. The income component pertains to wages
earned by those with secondary jobs.
Sector: The broad two-digit NAICS category, e.g., sector;
44 - 45 retail trade (sector under trade, transportation and
utilities); 72 accommodation and food services (sector
under leisure and hospitality supersector).
State fiscal year: July 1 to June 30.
State gross domestic product: A measurement of a state’s
output – the sum of value added from all
industries in the state. State GDP measures the value added
to U.S. production by the labor and capital in each state.
GLOSSARY

46 2 0 1 7 E C O N O M I C I M P A C T R E P O R T | V I S I T M I S S I S S I P P I
State-level travel and tourism accounts: A system
encompassing travel and tourism’s broader view. It focuses
on the circular flow of goods and services in the economy
between travel and tourism industry supply and the impact
of travel and tourism commodity demand within a state.
Total value added: Payments to labor and capital by
industry, or gross output less intermediate
inputs. The total contribution (direct, indirect, induced) of
an industry or sector to GDP.
Tourism capital investment: New construction and
expansion/renovation of tourism-related businesses/
projects with public/private funding sources during a
fiscal year. Estimated tourism capital investment valuation
is based on commercial permits issued and the tourism
factor.
Travel and tourism: The science, art and business
of attracting and transporting travelers/visitors,
accommodating them and graciously catering to their
needs and wants. Travel and tourism is a “composite
industry” comprising different sectors of the economy.
Travel and tourism economy: Group, match and use
NAICS and IMPLAN codes to estimate travel and tourism’s
state/county contribution of value added, employment and
labor income associated with travel and tourism, tourism
capital investment, travel and tourism’s contribution to the
General Fund, travel expenditures, government spending,
travel and tourism exports and imports. Overlapping
elements exist between travel and tourism economy and
industry.
Travel and tourism exports: Travel expenditures by out-of-
state travelers/visitors in Mississippi.
Travel and tourism imports: Travel expenditures by
Mississippi residents outside the state.
Travel and tourism industry: Assembling and use of
NAICS codes to estimate travel and tourism’s statewide
contribution for direct employment, annual payroll for
direct jobs, travel expenditures, value added, state and city/
county tax revenues, General Fund revenues, etc.
Traveler/visitor: A 100-mile or more round trip (less for
overnight stays) from in-state or out-of-state households,
to enjoy the history, scenery and attractions of another
community. Includes in-state and out-of-state overnight
leisure, day leisure, day or overnight business, group
travelers, international visitors and combined business/
leisure travel segments.
Value added: Economic measure of production which
includes only goods and services produced in
Mississippi. It estimates the state’s direct travel and tourism
contribution to GDP. Total value added: total contribution
(direct, indirect and induced) of an industry sector to GDP.
472 0 1 7 E C O N O M I C I M P A C T R E P O R T | V I S I T M I S S I S S I P P I
Visit Mississippi acknowledges these agencies, associations, companies and individuals with heartfelt thanks and appreciation for providing timely data in areas of expertise. Some may work elsewhere or be retired by the time this report was published.
ACKNOWLEDGMENTS
• American Automobile Association and Amtrak-related web sites.
• Chambers of commerce, convention and visitor bureaus, development partnerships, tourism commissions and other city/county officials throughout the state.
• Coahoma County. Daniel Vassel, County Administrator; Donna McPherson, CPA.
• Greenville, City of. Amelia D. Wicks, City Clerk.• Hancock County. Kathleen Stieffel, Accounts
Receivable Clerk.• International and Regional Airports: Gulfport-
Biloxi International Airport. Stephen Oberlies, Director of Finance. Hattiesburg-Laurel Regional Airport. Thomas Heanue, Executive Director; Nancy Gibson. Meridian Airport Authority. Donna Huffmaster, Executive Assistant.
• London Tourism Publications, Jacksonville, Florida. Brian London, Publisher/CEO.
• Mississippi Department of Employment Security, Labor Market Information Department. Mary Willoughby, Chief Labor Market Information Officer.
• Mississippi Department of Revenue. Aaron Robinson, Agency Support; Frank Puryear,
Director, Accounting Bureau; Kathlene Jones and Jerrod Pitts, Accountants; Danielle Hughes, Deputy Director, and Michael Shore, Auditor, Petroleum Tax Division.
• Mississippi Department of Transportation. Jana Hadden, Administration; Heath T. Patterson, P.E., State Maintenance Engineer; Ken Hauser, Maintenance Management Coordinator; Thomas M. Booth, Jr., Director, Aeronautics Division.
• Mississippi Department of Wildlife, Fisheries & Parks. Michael McCrae, IT Division; Janice Scalf, Projects Officer.
• Mississippi Development Authority. Krista Greenwood and Ashley Jackson, contract workers.
• Mississippi Gaming Commission. Monica M. Barnes, Operations Analyst.
• MSU Riley Center for Education and Performing Arts. Ethel Ann McCoy, Sales Manager.
• Natchez, City of. James Johnston, Department of Planning and Community Development.
• National Travel and Tourism Office, U.S. Department of Commerce, Washington, D.C. Mark Brown, Senior Economist.
• OmniTrak Group Inc. Ruth Sharp, Consultant. • Pearl River Valley Water Supply District. Amy
Whiteley, Personnel Director. • Real and Personal Property Tax Collections for
Hotels, Restaurants and Casinos (via selected county tax collectors and/or tax assessors, in place as of Dec. 31, 2017): Adams County. Peter Burns, Jr., Tax Collector; Reynolds Atkins, Tax Assessor. Bolivar County. Nancy J. Havens, Tax Assessor and Collector; Tiffany White. Clay County. Paige Lamkin, Tax Assessor and Collector. Coahoma County. Hattie Shivers, Tax Assessor and Collector. Covington County. Cindy A. Sanford, Tax Assessor and Collector. DeSoto County. Erin Shook, Tax Collector’s Office, and web site. Forrest County. Delbert Dearman, Tax Collector; Terri Smith. Itawamba County. Debbie Ann Johnson, Tax Collector. Jones County. Lucky Holifield, Appraisal Office. Lafayette County. Sylvia Baker, Tax Assessor and Collector; Katie Kaiser, Visit Oxford. Lamar County. Jack Smith, Tax Assessor and

48 2 0 1 7 E C O N O M I C I M P A C T R E P O R T | V I S I T M I S S I S S I P P I
Collector; Robin Duncan. Leake County. Kim Withers, Tax Assessor and Collector. Oktibbeha County. Barbara Cubon, Deputy Clerk/Appraisal, Tax Office. Rankin County. Judy Fortenberry, Tax Collector. Tishomingo County. Jena P. McNatt, Tax Collector; David Wayne Crum, Tax Assessor. Washington County. Mark Seard, Tax Assessor. Yazoo County. Travis Crimm, Jr., Tax Collector.
• STR, Inc. Jennifer Foster, Director of Business Development, Destinations; Henry Sams.
• University Research Center, Mississippi Institutions of Higher Learning. Dr. Bob Neal, Senior Economist; Dr. Darrin Webb, State Economist; Corey Miller, Economic Analyst.
• Tourism capital investment: Dodge Data Analytics. Timothy Boothroyd, Economic Analyst. Flowood, City of. Melissa Malone, Building and Permit Department. Greenwood, City of. Penny Hodge, Code Enforcement Office. Pearl, City of. Lorraine Knight, Building Permit Specialist.
Tupelo, City of. Marilyn Vail, Zoning Administrator, Development Services.
• U.S. Army Corps of Engineers Columbus Office. Ralph Antonelli, Park Manager, Columbus Office. Vicksburg Headquarters. Lawran Richter, Outdoor Recreation Planner.
• U.S. Department of the Interior, National Park Service: Mississippi Final Stands Interpretive Center. Edwina Carpenter, Curator. Natchez Trace Parkway. Maggie Walker, Superintendent’s Office. Shiloh National Military Park/Corinth site. Ashley Berry, Supervising Ranger.
PREPARED BY:
Tom Van HyningTourism Economist and Data AnalystMarketing and Communications Division
Mississippi Development AuthorityP.O. Box 849 Jackson, Mississippi 39205-0849Telephone: (601) 359-3297 Fax: (601) 359-5757
visitmississippi.org

492 0 1 7 E C O N O M I C I M P A C T R E P O R T | V I S I T M I S S I S S I P P I
2017T O U R I S M E C O N O M I C I M P A C T R E P O R T
P.O. Box 849 Jackson, MS 39205-0849601.359.3297
visitmississippi.org


