Tourism as an International Traded Service – A Guide for - unwto
Upload
lambert-oliverCategory
view
219download
1
Tourism & Business Services
The role of services in job-creation
Traded versus locally focused services
• traded: tourism; producer services; port & some other transport services
• locally focused: retail, consumer services
• mixed markets: wholesale, health, government

Employment Change Northwest States 1980-1997
Total Change 1980-1997: 2,150,801
-100000
0
100000
200000
300000
400000
500000
600000
Farm
em
ploym
ent
Ag. s
erv.,
fore
stry
, fish
ingM
ining
Const
ruct
ion
Man
ufac
turin
g
Tran
spor
tatio
n an
d pu
blic
utilit
ies
Who
lesale
trad
e
Retail
trad
e
Financ
e, in
sura
nce,
& R
.E.
Servic
es
Gov
ernm
ent
Feder
al, c
ivilia
n
Milit
ary
State
and
loca
l
State
Loca
l
Idaho
Oregon
Washington

Share of Employment Change, Pacific Northwest1980-1997
Ag. serv., forestry,fishing
Construction
Manufacturing
Transportation andpublic ut.
Wholesale trade
Retail trade
F.I.R.E.
Services
Government andgovernment

Share of PNW Total Employment

Pacific Northwest Employment Change 1998-2011792,517 jobs or +12.9%

PNW Total Employment1980 1995 2011
Farm 186221 183853 188574Forestry, Fishing, Ag. Services, Mining72851 97102 97908Construction 213627 321001 347166Manufacturing 600268 617728 527542Transportation & Utilities 190834 230309 262871Wholesale Trade 201213 219390 245919Retail Trade 632564 979237 1104098Finance, Insurance, and Real Estate316254 421615 620366Producer Services 152413 680704 1016965Health Services 195559 473055 737645Other Services 470456 513025 733906Government 686222 876749 1046230Total 3918482 5613768 6929190

PNW Share of Earnings by Industry

Tourism? What is a tourist? Versus a “recreator?”
Tough to measure.
Varies by state, government agency, local promotional agencies (e.g. Chambers)
The National Travel Survey - Bureau of Transportation Services 1997Shares of Total Tourist Travel:
Idaho Oregon Washington
Nonresident 54.5% 48.0% 36.3%
Resident 45.5% 52.0% 63.7%
Total 100.0% 100.0% 100.0%

Source: Washington State Travel Impacts, January 2011
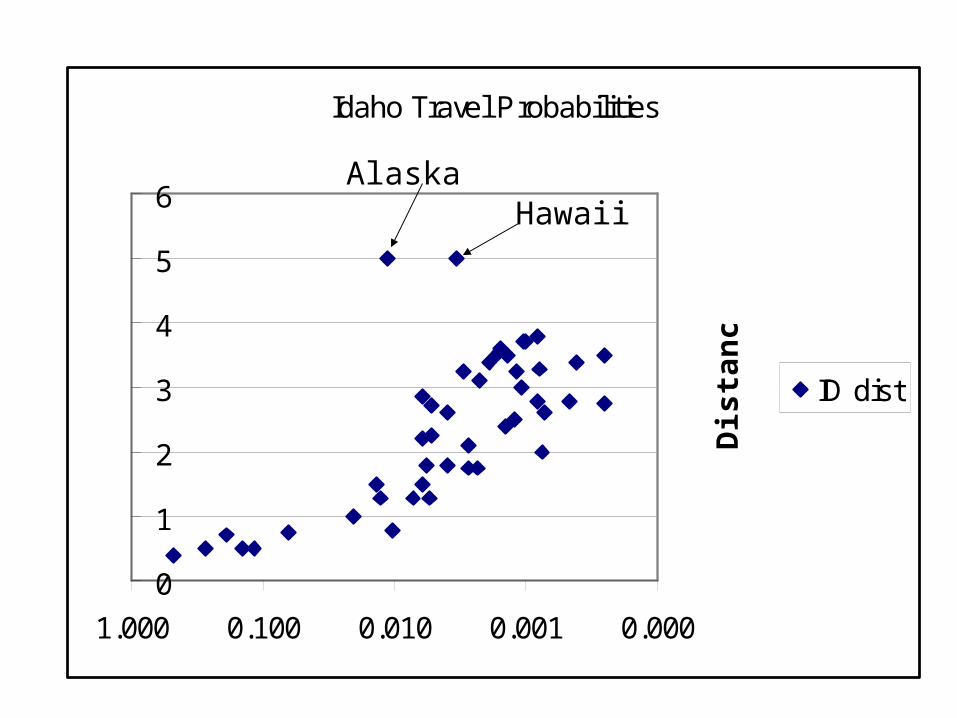
Idaho Travel Probabilities
0
1
2
3
4
5
6
0.0000.0010.0100.1001.000
Dis
tan
ce
ID dist
AlaskaHawaii

Oregon Travel Probabilities
0
1
2
3
4
5
6
0.00010.0010.010.11
dist
Alaska Hawaii

Washington Travel Probabilities
0
1
2
3
4
5
6
0.0010.010.11
Dis
tan
ce
Alaska Hawaii

United States (AK & HI Inset)by ID ratio
0.0114942528735632 to 0.485230024213075 (10)0.00392275196137598 to 0.0114942528735632 (10)0.00152951973080453 to 0.00392275196137598 (10)0.00079155672823219 to 0.00152951973080453 (10)0 to 0.00079155672823219 (11)
1997 Travel Probabilties to Idaho

United States (AK & HI Inset)by Column N
0.034 to 0.924 (9)0.018 to 0.034 (10)0.009 to 0.018 (10)0.006 to 0.009 (9)0 to 0.006 (13)
1997 Travel Probabilities to Washington

United States (AK & HI Inset)by ratio d/o (2)
1.6 to 13.5 (13)1.4 to 1.6 (2)1 to 1.4 (16)0.7 to 1 (7)0 to 0.7 (13)
Ratio Washington Destinations / Visitor Origins
> 1 - More Washington to the statethan travel here
< 1 - Less Out of state travel to WA than travel by Washingtonians

Idaho Oregon WashingtonBusiness 18.8% 19.0% 19.1%Visit Friends or Relatives 36.4% 29.0% 32.1%Leisure 29.0% 36.6% 32.6%Other 15.9% 15.5% 16.2%Total 100.0% 100.0% 100.0%
Characteristics of Northwest TouristsTrip Main Purpose
Idaho Oregon WashingtonPersonal Use Vehicle 87.2% 87.5% 79.8%Commercial Air 11.3% 10.8% 18.2%Intercity bus 0.0% 0.1% 0.3%Train 0.0% 0.4% 0.3%Other 1.4% 1.2% 1.4%Total 100.0% 100.0% 100.0%
Means of Transportation
Income: Idaho & Oregon: $25K-$50 K; Washington > $50 K

Tourist Expenditures
• Predominantly: lodging, meals, fuel/travel costs, souvenirs
• Level/capita inversely related to distance: Out-of-state at least $100/person/day; instate ca. $50/day
• Seasonality of local tourism - fiscal impacts; role in regional development
• Business versus tourist/leisure travel outlays

Washington State Average Travel Spending
Source: Washington State Travel Impacts, Jan 2011

Positioning the travel industry:
Source: Washington State Travel Impacts, January 2011

Tourism in the Northwest put in Perspective
• WA CTED Report: $15 Billion but out of a $300 Billion Local Economy: ? 3rd Largest Industry Status•No national “superstar” destinations, but a lot of hot spots--Oregon Coast, Culture like the Ring Cycle, Skiing, National Parks, and The Museum of Flight•Subergions with relatively strong non-business tourism dependence - amenity counties, Interstate corridors, federal lands, cities (see Map 16-16 in Atlas)

Port of Seattle Recent Cargo History
Source: Port of Seattle TEU = Twenty-Foot Equivalent Unit Cargo Container

Major West Coast Port TEU’s
TEU = Twenty Foot Equivalent Unit (Cargo container)Source: American Association of Port Authorities

Total Vessel Trade by Port - 2013


Port of Seattle Cruise Ship Passengers
0
50
100
150
200
250
1999 2000 2001 2002 2003 2004 2005 2006 2007 2008 2009 2010 2011 2012 2013 2014
# o
f V
esse
ls
0
100000
200000
300000
400000
500000
600000
700000
800000
900000
1000000
# o
f P
asse
ng
ers
Source: Port of Seattle Cruise Seattle 2014 Fact Sheet

Sea-Tac Airport Passenger Statistics
2012 – 33,223,111 passengers

A New Big Kid on the Block: Amazon• Part of the Non-store retailer industry, that also
includes REI & Nordstrom• Diversifying into selling everything – space on the
“cloud,” books & diverse retail, a wide variety of services
• Current Seattle area employment about 20,000, about 40% that of Microsoft, including a large research & development staff
• Growing rapidly, with huge real estate investment and construction impacts

Amazon South Lake Union Footprint
SeattleTimesJan. 25, 2014

Producer ServicesWhy the rapid growth?
(1) Growth in intermediate demands
(2) Growth in final demands
(3) Slow productivity improvement
(4) Trade in Services & Import Substitution
An An overview of some key trends
- Atlas: shows the concentrated nature of these services--but their growth is as rapid in rural as the urban Northwest.

Washington State Producer Services % Change 1998 - 2008
-50% 0% 50% 100% 150% 200% 250% 300% 350%
Software Publishers
Legal
Accounting
Architecture & Engineering
Specialized Design
Computer Systems
Consulting
Scientific R&D
Advertising & Pub.Rel.
Other Prof. Services
Management of Companies
Administrative & Support
Total
Average GrowthAll Industries

Washington State Producer Services
1998 2008 2011
% Self-Employed
2011Software Publishers 13241 53162 55308 3%Legal Services 23878 27079 27291 19%Accounting 21452 26869 26863 30%Architecture & Engineering 33607 42731 39124 14%Specialized Design 5123 8388 8280 71%Computer Systems 21127 36381 40468 22%Consulting 19339 30537 34441 47%Scientific R&D 9898 18279 18138 4%Advertising & Public Relations 10479 10569 10952 25%Other Professional Services 25850 35334 36639 63%Management of Companies 53616 62025 89996 0%Administrative & Support Services 132927 200993 172751 16%Total 370537 552347 560251 19%
Source: Census County Business Patterns and Nonemployer Statistics

2011 Wage & Salary and Self-Employment Producer Services

NSF NSF ERS ERSLone
Eagles& HighFliers
LocalizedEstablishments
LoneEagles& HighFliers
LocalizedEstablishments
Other Factors 47.6% 31.5% 41.8% 48.1%Proximity to major clients 21.0% 30.4% 24.5% 25.2%Owner/ founder/ manager'sresidence is nearby
42.7% 33.0% 58.2% 62.2%
Lower land/ energy/ occupancycosts
18.9% 20.0% 3.1% 0.0%
Prestige location/ high qualityspace
10.5% 15.2% 1.0% 2.2%
Presence of complementary firmwhose services assist you
6.3% 14.4% 4.1% 0.7%
High quality of life 11.2% 9.3% 65.3% 44.4%Presence of complementary firmwhose goods assist you
1.4% 3.0% 0.0% 0.0%
Presence of educated/ skilledlabor force
4.2% 0.7% 3.1% 0.7%
Low cost of living 1.4% 2.2% 7.1% 3.7%Lower local taxes 1.4% 0.7% 1.0% 0.0%Government assistance 0.0% 0.7% 0.0% 0.7%Presence of low cost labor force 0.7% 0.4% 2.0% 0.0%
sum 167.1% 161.5% 211.2% 188.1%(n) 143 270 98 135
Reasons for Producer Service Locations

Table 3 Reasons for Starting Business# of citations
Desire to be own boss 32.6% 309Market opportunity identified 25.8% 245To increase personal income 12.2% 116As an alternative to unemployment 6.3% 60Less Travel 0.7% 7Other 22.3% 211total 100.00% 948N=598
Startups are driven by a vision of business opportunities

Table 4 Examples of types of businesses in which the founder wished to pursue a marketopportunityIndustry Service description NicheMisc. BusinessServices
Fire equipment sales companies Consulting to fire equipment industryincluding management seminars for fireequipment management companies
Architecture &Engineering aswell asManagementConsulting
Engineering and scientific consulting Development of non-destructivemethod of constructing engineeringcomponent. Expert witness.
ManagementConsulting
Environmental dispute resolution Facilitation and mediation of policydisputes.
Temporary Help Temporary help company, specialist inlabor relations
Specialization in electric utilities.
ManagementConsulting
Public Relations Agriculture and natural resources;partners have expertise in agriculture.Main competition are large adagencies.
ComputerServices
Applications software forcollege/university and nonprofitorganizations.
Nonprofit foundation software andhigher education software
Niche Examples

Table 6 Percentage of establishments considering factor highly important as a reason forchanging their services.
Why Types of Services Have Changed: Total
Percent ofEstablishments
Citing OneFactor
Percent ofEstablishmentsCiting Multiple
FactorsChange in Market 44.5% 28.3% 52.7%Change in Client Expectations 36.1% 15.2% 45.2%Use of Computers and IT 31.1% 26.1% 31.5%Change in Government Regulations 23.9% 19.6% 21.9%Change in Employee Skills 18.9% 10.9% 20.5%
(Sample size) n=238 n=92 n=146
Most Companies are dynamic in changing their services,driven by changes in IT and a variety of related factors
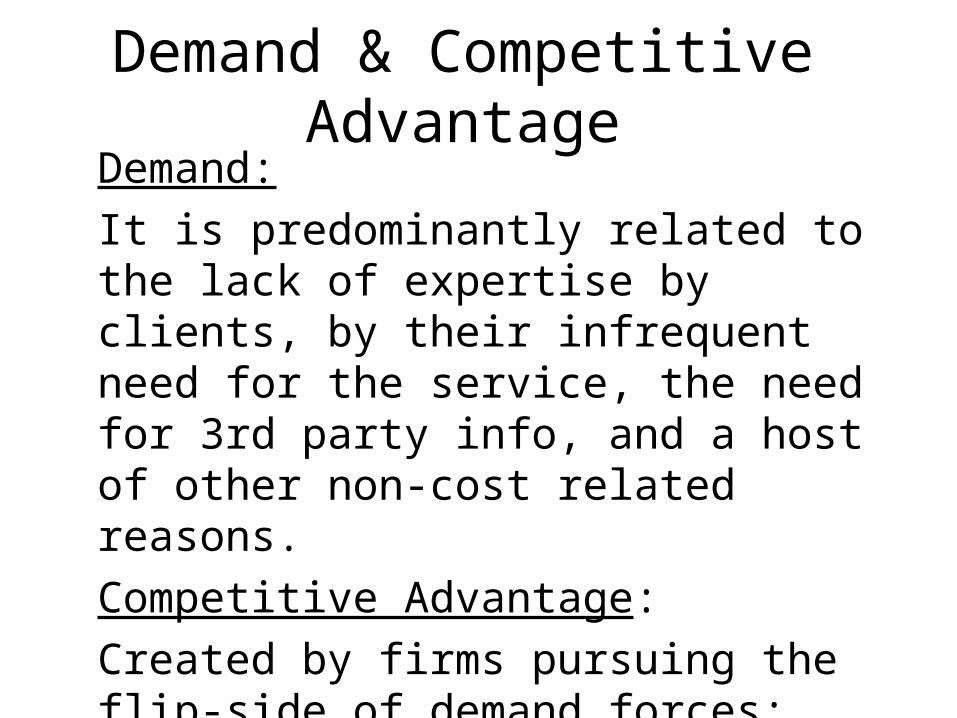
Demand & Competitive AdvantageDemand:
It is predominantly related to the lack of expertise by clients, by their infrequent need for the service, the need for 3rd party info, and a host of other non-cost related reasons.
Competitive Advantage:
Created by firms pursuing the flip-side of demand forces: Differentiation, specialization, niching, collaboration, use of specialized subcontractors, etc. Not Cost.

Table 9 Geographic Markets for Producer Service Establishments, Urban-OrientedSample
Market Location:WeightedAverage
UnweightedAverage
Local 44.55% 66.81%Elsewhere in State 8.14% 10.31%Elsewhere in Region 10.34% 7.65%Elsewhere in U.S. 31.00% 12.58%Canada 3.48% 0.63%Mexico 0.32% 0.23%Other Foreign 2.17% 1.79%
n=249 n=350
Aggregate sales - $1.5 billion for weighted estimate
Producer Services have considerable Nonlocal Markets,but….

Figure 3 Frequency of Export Market Percentages
0
20
40
60
80
100
120
140
96
-10
0
86
-95
76
-85
66
-75
56
-65
46
-55
36
-45
26
-35
16
-25
6-1
5
0-5
% Nonlocal Sales
# o
f o
bs
erv
ati
on
s
Rural
Urban
Producer Service Businesses have Bifurcated Markets:They Tend to be Local or Export

Recognition of Producer Services as a Part of the Economic Base
• Historic metro concentration
• Recent rural deconcentration
• Role in “Edge Cities”
• The “New Economy.”
• --Producer Services as a progenitor to the New Economy:
–now multimedia, online retail, .com,–.org, .edu; telemedicine, teleservices, tele?; content providers; media conduits; delivery agents, etc.

Figure 4 Lone Eagles and High Fliers: Exports Five Years Ago and Exports Today*
40
50
60
70
80
90
100
0 10 20 30 40 50 60 70 80 90 100
Export Percentage Five Years Ago
Cu
rre
nt
Ex
po
rt P
erc
en
tag
e
The Traded-Dimension of Producer Service Businesses is Expanding Over Time
Localized firms mirror the trend for Lone Eagles/High Fliers
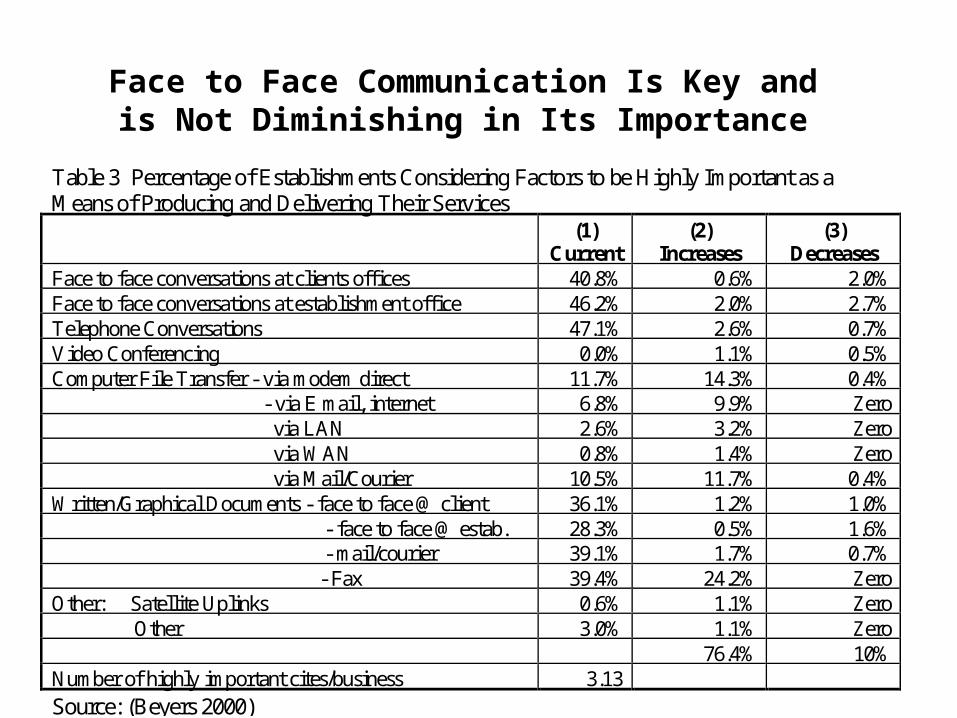
Table 3 Percentage of Establishments Considering Factors to be Highly Important as aMeans of Producing and Delivering Their Services (1)
Current (2)
Increases (3)
Decreases Face to face conversations at clients offices 40.8% 0.6% 2.0% Face to face conversations at establishment office 46.2% 2.0% 2.7% Telephone Conversations 47.1% 2.6% 0.7% Video Conferencing 0.0% 1.1% 0.5% Computer File Transfer - via modem direct 11.7% 14.3% 0.4% - via E mail, internet 6.8% 9.9% Zero via LAN 2.6% 3.2% Zero via WAN 0.8% 1.4% Zero via Mail/Courier 10.5% 11.7% 0.4% Written/Graphical Documents - face to face @ client 36.1% 1.2% 1.0% - face to face @ estab. 28.3% 0.5% 1.6% - mail/courier 39.1% 1.7% 0.7% - Fax 39.4% 24.2% Zero Other: Satellite Uplinks 0.6% 1.1% Zero Other 3.0% 1.1% Zero 76.4% 10% Number of highly important cites/business 3.13
Source: (Beyers 2000)
Face to Face Communication Is Key and is Not Diminishing in Its Importance

Implications for Settlements for the New Economy
? Will IT fuel decentralization of work?
? Or, will the power of agglomerations ?continue? To win out?
? What will happen to Edge Cities? Central Cities? What difference does it make where we focus on….Friday Harbor, Roslyn, Enterprise, Driggs, Missoula, Bellevue, Bend,
Beaverton, Darrington, Sun City, Corvallis
New Points?

So, where is Tourism, Producer Services and Other Services Headed
in the Northwest?
•Will we just be more urbanized?
•What will the impact of Growth Management Policies be on Geographical development Trends?
•Can regions really affect the “drivers” of their development?
• If not, what other forces are at play?

Old Slides Follow
• Left in for reference purposes only

Pacific Northwest Employment Change 1998-2006+910,381 jobs or +14.7%
-150000
-100000
-50000
0
50000
100000
150000
200000
Fa
rm
Fo
res
try
& F
ish
ing
Min
ing
Uti
ltie
s
Co
ns
tru
cti
on
Ma
nu
fac
turi
ng
Wh
ole
sa
le
Re
tail
Tra
ns
po
rta
tio
n S
erv
ice
s
Info
rma
tio
n
FIR
E
Pro
du
ce
r S
erv
ice
s
Ed
uc
ati
on
& O
the
r S
erv
ice
s
He
alt
h
Art
s, S
po
rts
, Ac
co
mm
od
ati
on
, Fo
od
Se
rvic
es
Go
ve
rnm
en
t

Pacific Northest Employment Change 2006-2010-205,084 jobs or -3.7%
-150000
-100000
-50000
0
50000
100000
Fa
rm
Fo
res
try
& F
ish
ing
Min
ing
Uti
litie
s
Co
ns
tru
cti
on
Ma
nu
fac
turi
ng
Wh
ole
sa
le
Re
tail
Tra
ns
po
rta
tio
n S
erv
ice
s
Info
rma
tio
n
FIR
E
Pro
du
ce
r S
erv
ice
s
Ed
uc
ati
on
& O
the
r S
erv
ice
s
He
alt
h S
erv
cie
s
Art
s, S
po
rts
, Ac
co
mm
od
ati
on
, Fo
od
Se
rvic
es
Go
ve
rnm
en
t

Shares of Wage & Salary + Proprietor Income (Excludes farms)
0
0.05
0.1
0.15
0.2
0.25
Ag
ricu
ltura
l
Min
ing
Co
nst
ruct
ion
Ma
nu
fact
uri
ng
Tra
nsp
ort
atio
n
Util
itie
s &
Wh
ole
sale
Tra
de
Re
tail
Tra
de
Fin
an
ace
,
Pro
du
cer
Co
nsu
me
r &
Go
vern
me
nt
1980
1997

Share of Total Employment Washington, Oregon & Idaho
0
0.05
0.1
0.15
0.2
0.25
0.3
0.35
0.4F
arm
Ag
Ser
vice
s, F
ore
stry
, F
ish
ing
,M
inin
g Co
nst
ruct
ion
Man
ufa
ctu
rin
g
Tra
nsp
ort
atio
n &
Uti
liti
es
Wh
ole
sale
Tra
de
Ret
ail
Tra
de
Fin
ance
, In
sura
nce
& r
eal
esta
te
Ser
vice
s
Go
vern
men
t
Sh
are
of
To
tal
Em
plo
ymen
t
1980
1997
2007


![Tourism as an international traded service...Travel 3.115 […] Travel [as a BoP and international trade in services item] is defined as : covering goods and services for own use or](https://static.fdocuments.net/doc/165x107/5fece2d3b2f99e736154007c/tourism-as-an-international-traded-service-travel-3115-travel-as-a-bop.jpg)