Tourism and Economic Growth - CORE
39
1 Prepublication version of: Du, Ding, Lew, A.A. and Ng, Pin. 2015. Tourism and Economic Growth. Journal of Travel Research. (forthcoming) Tourism and Economic Growth Ding Du W. A. Franke College of Business Northern Arizona University, Box 15066 Flagstaff, AZ 86011-5066 (Phone) +1 928 523-7274 (Fax) +1 928 523-7331 [email protected] Alan A. Lew Geography, Planning and Recreation Northern Arizona University, Box 15016 Flagstaff, AZ 86011-5016 (Phone) +1 928 523-6567 (Fax) +1 928 523-2275 [email protected] Pin T. Ng* W. A. Franke College of Business Northern Arizona University, Box 15066 Flagstaff, AZ 86011-5066 (Phone) +1 928 523-8726 (Fax) +1 928 523-7331 [email protected] and School of Economics Anhui University Hefei, Anhui 230601, China * Corresponding Author: Pin T. Ng brought to you by CORE View metadata, citation and similar papers at core.ac.uk provided by OpenKnowledge@NAU
Transcript of Tourism and Economic Growth - CORE
1
Prepublication version of: Du, Ding, Lew, A.A. and Ng, Pin. 2015. Tourism and Economic Growth. Journal of Travel Research. (forthcoming)
Tourism and Economic Growth
Ding Du W. A. Franke College of Business Northern Arizona University, Box 15066 Flagstaff, AZ 86011-5066 (Phone) +1 928 523-7274 (Fax) +1 928 523-7331 [email protected] Alan A. Lew Geography, Planning and Recreation Northern Arizona University, Box 15016 Flagstaff, AZ 86011-5016 (Phone) +1 928 523-6567 (Fax) +1 928 523-2275 [email protected] Pin T. Ng* W. A. Franke College of Business Northern Arizona University, Box 15066 Flagstaff, AZ 86011-5066 (Phone) +1 928 523-8726 (Fax) +1 928 523-7331 [email protected] and School of Economics Anhui University Hefei, Anhui 230601, China
* Corresponding Author: Pin T. Ng
brought to you by COREView metadata, citation and similar papers at core.ac.uk
provided by OpenKnowledge@NAU

2
Abstract
Whether international tourism can lead to economic growth is an important
macroeconomic question for both policy makers and investors. We extend the literature by
investigating if tourism development is an additional determinant of income in the presence of
the standard income determinants (such as capital accumulation), or if the effects of tourism
development on economic growth work through the standard income determinants, instead.
Empirically, we develop a tourism-growth model that is an extension of Solow (1956) and
estimate our model with a cross-section of 109 countries. Our findings indicate that investments
in tourism in and of itself appear to be insufficient for economic growth. Instead, tourism’s
contribution to the long term growth of an economy comes through its role as an integral part of
a broader development strategy that is more generally focused on standard income determinants.
Keywords: Long-term growth; Tourism development; Tourism-led growth hypothesis; TLGH,
Standard income determinants, Tourism impacts, Economic development

3
1 Introduction
Whether a country’s investments in international tourism can be used as an engine for
economic growth is an important question for policy and decision makers. Tourism boosters
consistently lobby for investments and support based on the assumption that tourism is an
effective mechanism for economic growth, whether through the creation of new attractions
(Waitt, 2001; Getz, 2008) or through infrastructure and enhancements (Briedenhann & Wickens,
2004; Becker & George, 2011; Liasidou, 2012). There is no doubt that international travel and
tourism comprises a major part of the global economy and is the largest service sector in
international trade (Lew, 2011). It is within the top five sources of international export income
for over 80% of countries in the world (UNWTO 2001a). International tourism has proven
relatively resilient to global economic downturns, continuing a healthy growth in international
arrivals despite retraction in other global sectors (Song & Lin, 2010; Abiven, 2012).
Destinations see tourism as a way to use their comparative advantages in natural and cultural
supply side resources to draw tourist money into the local economy, thereby generating foreign
exchange, creating jobs, and enhancing government tax revenues (Hindley & Smith, 1984;
Mihalič, 2002;). As an approach to economic growth, tourism may also have fewer
environmental and social impacts than extractive industries, such as timber and mining (Hall &
Lew, 2009).i From a macroeconomic perspective, international tourism contributes to the export
income of a destination.ii This is crucial because investment in export-led growth is major part of
the development objectives of most economies that see it as the most secure means of achieving
long-term economic growth and livelihood (Nowak et al., 2007). As a result, there is a growing
body of academic literature on the empirical relationship between tourism development and
economic growth.

4
The World Travel and Tourism Council (WTTC) succinctly summarized the important
role that travel and tourism play in the development and growth of the global economy as
follows:
In 2013, Travel & Tourism’s total contribution to the global economy rose to 9.5% of
global GDP (US $7 trillion), not only outpacing the wider economy, but also growing
faster than other significant sectors such as financial and business services, transport
and manufacturing. In total, nearly 266 million jobs were supported by Travel & Tourism
in 2013 - 1 in 11 of all jobs in the world. The sustained demand for Travel & Tourism,
together with its ability to generate high levels of employment continues to prove the
importance and value of the sector as a tool for economic development and job creation.
(WTTC, 2014, Foreword)
This statement hints at an important distinction that exists between economic growth and
economic development, which is more clearly explained by Cárdenas-García et al., (2013, 1-2):
The expansion of the economic activity influences positively the economic growth of a
country…Tourism is considered as an economic activity with the potential to stimulate
global economic growth because of its complementarity with other economic activities,
its contribution to gross domestic product (GDP), job creation, and foreign exchange
generation, etc… Nevertheless, the real importance of tourism lies not only in the fact
that it contributes to the growth of the economy, in general, but also in the fact that this
tourism growth can, given the right circumstances in its structural foundations, influence
the economic and cultural progress of society, improving the welfare of the resident
population.

5
Our focus in this paper is on the channel between tourism development and overall economic
growth, rather than that between economic growth and more specific economic development.
For the latter, readers may refer to Lee and Chang (2008), and Sánchez-Rivero, Pulido-
Fernández, and Cárdenas-García (2013).
The perceived importance of international tourism development on economic growth has
motivated a growing body of academic literature testing the tourism-led growth hypothesis
(TLGH) that underlies this approach (West, 1993; Uysal & Gitelson, 1994; Archer, 1995). Most
studies find a positive long-run association between tourism development and economic growth.
This has been suggested for Greece (Dritsakis, 2004), Italy (Massidda & Mattana, 2013),
Mauritius (Durbarry, 2002) Spain (Balaguer & Cantavella-Jorda, 2002), Taiwan (Kim et al.,
2006), Turkey (Gunduz & Hatemi-J, 2005; Ongan & Demiroz, 2005), four Pacific Island
countries (Narayan et al., 2010), seven major Mediterranean countries (Dritsakis, 2012), 21 Latin
American countries (Eugenio-Martin et al., 2004), 55 OECD and non-OECD countries (Lee &
Chang, 2008) , and 144 countries (Cárdenas-García et al., 2013).iii
The present paper intends to extend extant TLGH literature by investigating the economic
mechanism underlying the positive association between tourism and growth. Our main objective
in this paper is to investigate a fresh and important research question: Is tourism development an
additional determinant of income growth in the presence of standard income determinants (such
as capital accumulation) or do the effects of tourism development on economic growth work
through the standard income determinants, instead?
This question is important because the answer can lead to dramatically different policy
directions. If tourism is an additional determinant of income growth, the policy implication is
that “all governments should commit to helping their tourism industry expand as much as

6
possible” (Dritsakis 2012, p. 814). On the other hand, if the effect of tourism growth on
economic growth works through the standard income determinants, the policy implication is that
governments should help the tourism industry expand to the extent that it promotes growth in the
standard income factors (e.g., capital accumulation), because investment in tourism that does not
lead to growth in the standard income factors may be a less effective benefit for the economy in
the long term.
To answer our research question, we develop a tourism-growth model that takes into
account not only tourism development, but also standard income factors such as capital
accumulation as the potential factors (independent variables) that affect economic growth. We
estimate our tourism-growth model using data available from the World Development Indicators
database. Our expanded Cobb-Douglas based production model is estimated using ordinary least
squares regressions and the estimated results are checked for distributional robustness using
quantile regression and model misspecification robustness using an assortment of different proxy
variables.

7
2 A model of tourism and growth
The empirical specification of the relationship between tourism and growth in extant
literature typically takes the following form (e.g., Dritsakis, 2012):
0 1 2it i i it i it itGDP TOUR EXR (1)
where GDP is real GDP per capita, TOUR is either tourism receipts or the number of
international tourist arrivals, and EXR is the nominal effective exchange rate. TLGH
hypothesizes that 1i is greater than zero; increases in tourism activities are associated with
increases in GDP (i.e., economic growth). It is important to note that such a specification helps
estimate the association between tourism development and economic growth, but does not help
in understanding the economic mechanism underlying the association. More specifically, Eq. (1)
does not help answer the question: Is tourism development an additional determinant of income
in the presence of the standard income determinants (such as capital accumulation) or do the
effects of tourism development on economic growth work through the standard income
determinants instead? Motivated by this observation, we develop a tourism-growth model in this
section which is an extension of Solow (1956).
In his landmark work on economic growth, the 1987 Nobel laureate, Robert Solow
(1956), points out that an economy’s output/income over the long term depends on its supplies of
factors of production and available technology, which can be captured by the (aggregate)
production function. The Cobb-Douglas production function is the most commonly used
production function in macroeconomics because of its well-known and superior properties (see
Solow, 1956). For instance, the Cobb-Douglas production function is consistent with the law of
diminishing returns, which is an essential feature of modern growth theories. As a result, the
Cobb-Douglas production function remains the standard aggregate production function in

8
macroeconomics textbooks (e.g., Mankiw, 2013), and is still widely used (e.g., Nordhaus, 2006;
Horowitz, 2009; Ng & Zhao, 2011, and the references therein). Hence, following the growth
literature pioneered by Solow (1956), we assume that an economy’s output/income can be
described by a Cobb-Douglas production function:
1
ii i i iGDP A CAP POP e
(2)
where GDPi is the real GDP of country i, CAPi is its capital, POPi is its population, Ai is its
productivity, and i is a random disturbance term. Based on this, real GDP per capita (which
determines the living standard of a representative person) is
iePOP
CAPA
POP
GDP
i
ii
i
i
(3)
Eq. (3) implies that per capita GDP (or income) is primarily a reflection of capital per person and
productivity, which is the core concept of modern growth theory. To linearize the production
function for appropriate estimation, we perform logarithmic transformation on both sides:
ii
ii
i
i
POP
CAPA
POP
GDP )ln()ln()ln( (4)
Research and development (RND) and education (EDU) are well-known to have
important influence on productivity (e.g., Romer, 1990; Hall & Jones, 1999). Therefore, we
model productivity as a function of these relevant determinants as follows:
itii uRNDEDUA )ln()ln()ln( (5)
Combining Eqs. (4) and (5), we have
itii
i
i
i RNDEDUPOP
CAP
POP
GDP )ln()ln()ln()ln( (6)

9
where iii u . Eq. (6) summaries the growth theory model pioneered by Solow (1956), but
does not incorporate or allow international tourism to have separate effects on income per capita.
To test if tourism development is an additional determinant of income in the presence of these
standard income determinants, we extend Eq. (6) to the following:
itiii
i
i
i RNDEDUTOURPOP
CAP
POP
GDP )ln()ln()ln()ln()ln( (7)
to capture tourism development. Eq. (7) says that the log per capita GDP of a country is a
function of tourism activities (TOUR) in combination with other income factors. If tourism is an
additional determinant of income, we expect that > 0.
To capture the long-run relationship between tourism and growth, we focus on the cross-
sectional regression where data are averaged over the entire sample period for each country, as
according to the growth literature (e.g., Barro, 1991). Alternatively, one may use a structural
simultaneous equation approach to model and estimate all the direct, indirect, and induced
effects of tourism, in line with the concept of the tourism economy and inter-sectorial
connections within an economy, as in Cárdenas-García and et al. (2013). A fundamental
challenge for this structural approach is its complexity: the set of possible channels through
which tourism affects the economy can be many. Even if each channel could be enumerated and
its operation modelled, how they interact and aggregate to determine macroeconomic outcomes
raises additional analytic difficulties.
The major advantage of the structural system equation approach is its use of more
information, which may results in more precise parameter estimates. The major disadvantages
are that it requires more data and is sensitive to model misspecifications. In contrast, Eq. (7)
offers a simple, reduced-form approach, which has the advantage of requiring less data. While it

10
also provides less precise estimates of parameters, it is more robust in modeling GDP. In the end,
all the effects of tourism should be captured by GDP, which is the most comprehensive macro
performance measure. This type of reduced form regression approach is widely used in
econometrics (e.g., Ng & Zhao, 2011) and is complementary to the structural approach.

11
3 Data and empirical results
3.1 Data
The World Development Indicators (WDI) database is the primary World Bank (2014)
collection of development indicators, compiled from officially recognized international sources.
It represents the most current and accurate global development data available. WDI contains
more than 1,300 annual time series indicators for over 200 economies and more than 30 country
groups, with data for many indicators going back more than 50 years. WDI is widely used in the
modern economic growth literature for its high quality and international comparability (see e.g.,
Kim et al, 2012.) Also, we use the international tourism data from WDI not only because of its
credibility, but also due to their compatibility with the national income accounting data used in
this study. For instance, exports are measured the same way in GDP as in international tourism
receipts (% of total exports). Our sample, dictated by the availability of the international tourism
data from WDI, includes 109 countries over the period from 1995 to 2011.
Following Gunduz and Hatemi-J (2005), we use the number of international tourist
arrivals as our measure of tourism activity (TOUR). For robustness, we also report the results
based on international tourism receipts (% of total exports). We focus on international tourist
arrivals because such data are available for a larger number of countries over our sample period.
Following the economic growth literature, research and development expenditure (% of GDP) is
used to measure R&D, and average years of schooling (age 25+) is employed as a proxy for
education. Again, for robustness, we also present the results based on alternative measures of
R&D and education, namely, patent applications and adult literacy rate (% of people ages 15 and
above).

12
The macroeconomic data on GDP per capita (constant 2005 US$), international tourism,
gross capital formation (constant 2005 US$), R&D expenditure, patent applications, and adult
literacy rate are obtained from the WDI database. The data on average years of schooling (age
25+) are from Barro and Lee (2013). Table 1 presents our summary statistics for the variables
used in this study.
<< Table 1 About Here >>
3.2 Ordinary least-squares regressions
Empirical results from the cross-sectional regression are reported in Table 2. White's
(1980) procedure is used to calculate standard errors to take into account possible
heteroskedasticity. Panel A presents the main results. In Column (1), we only include the number
of international arrivals, which is our proxy for TOUR. Consistent with most previous studies,
tourism has a statistically significant positive association with GDP per capita. Our parameter
estimate suggests that a 1% increase in TOUR (i.e., international arrivals) can lead to an
estimated average of 0.562% increase in GDP per capital. The estimate is not only statistically
but also economically significant. Next, we examine the economic mechanism underlying the
tourism-growth association. If tourism is an addition determinant of income, we expect that
TOUR still remains statistically significant after we add the standard income determinants, such
as capital formation. If tourism works through the standard income determinants instead, we
expect that TOUR will lose its statistical significance as soon as the standard income
determinants are included.

13
In the next two columns, we include the standard income determinants in our model, Eq.
(7). As we can see, as soon as standard income factors are added, TOUR (i.e., international
arrivals) becomes statistically insignificant. When the standard income factors are included, the
adjusted 2R is also substantially higher than that in Column (1). Our results suggest that tourism
development affects income through the standard income determinants.
<< Table 2 About Here >>
To ensure that our results are not spurious, we carry out a number of robustness checks.
The results are reported in Panels B and C of Table 2. In Panel B, we divide the whole sample
period into two roughly equal sub-samples and repeat our exercises. As we can see, the sub-
sample evidence is consistent with that based on the whole sample. That is, as soon as standard
income determinants are included, TOUR (i.e., international arrivals) becomes statistically
insignificant.
In Panel C, we experiment with alternative model specifications as well as alternative
measures for international tourism, education and R&D. In the “Alternative model specification”
section, we differentiate tourism economies from other economies. Intuitively, tourism activity
should be more significant for economies that depend heavily on international tourism. Previous
studies cited above also mostly focus on tourism economies. We take this into account by adding
a dummy variable for tourism economy (Dummy) and an interaction term of the tourism dummy
and TOUR (log(TOUR)×Dummy). We define tourism economies as those with international
tourism receipts that make up at least 10% of the country’s total exports.

14
Consistent with the results in Panel A, if we do not include the standard income factors,
tourism is a statistically and economically significant factor of income growth. However, as soon
as we take into account capital accumulation, R&D, and education, tourism activity does not
show any marginal explanatory power. Furthermore, the tourism economy dummy variable
(Duumy) is statistically insignificant in all the models we investigate. The interaction between
the tourism economy dummy variable and TOUR is also statistically insignificant in all the
models. Hence, there is no statistically significant difference between tourism and non-tourism
economies regarding the impact of tourism activities on GDP per capita. Therefore, our findings
suggest that even within tourism economies, tourism development affects income through the
standard income determinants.
In the “Alternative measures” section, we try alternative measures of international
tourism, education and R&D. In Column (1), we use international tourism receipts to measure
tourism activity. In Column (2), we employ adult literacy rate as a proxy for education. In
Column (3), we utilize patent applications to measure R&D. Again, the results are consistent
with those in Panel A. As soon as we take into account capital accumulation, R&D and education,
tourism activity do not show any marginal explanatory power, implying that tourism
development affects income through the standard income determinants.
In Table 3, we present the partial correlation matrix among the variables that we use in
the study. The partial correlation coefficient between a pair of variables measures the correlation
between the pair of variables after removing (partialling out) the effect of the other variables
included in the model. Consistent with the results in Table 2, the partial correlation coefficient is
not significant between GDP per capita (log(GDP/POP)) and tourism activities (log(TOUR))

15
after taking into consideration the effect of other variables being considered, suggesting that
tourism development affects income through the standard income determinants.
<< Table 3 About Here >>
3.3 Quantile regressions
We also perform quantile regressions for the relevant models. The least squares
regression results reported in Tables 2 provide estimates of the average effects of the various
independent variables on the dependent variable, the logarithm of GDP per capita. They depict
the impact of the independent variables (tourism and standard income factors) on the dependent
variable near the center of the dependent variable distribution. However, the effects of the
various economic variables on lincome may not be the same across different portions of the GDP
per capita distribution, as suggested by Lanza and Pigliaru (2000a, 2000b), Eugenio-Martin et al.
(2004) and Dritsakis (2012). Least-squares regression is incapable of revealing this sort of
potential variation when focusing on the average of the GDP per capita distribution. Quantile
regression, on the other hand, is best for identifying these potential differential impacts (Koenker
& Bassett, 1978; Lew & Ng, 2012).iv
In terms of economic intuition, quantile regression can capture the heterogeneity across
countries in terms of their growth experience. As Eugenio-Martin et al. (2004) suggest, tourism
activity may impact income differently in nations that have low income (i.e., developing nations)
than those that have high income (i.e., developed nations). More generally, the insight of
Eugenio-Martin et al. (2004) is that, conditional on a particular level of tourism development, the
tourism-growth relationship could be different across countries depending on their growth

16
experience. Ignoring such heterogeneity would lead to inaccurate inferences. A natural way to
take into account such heterogeneity is to estimate the tourism-growth relationship by grouping
the countries with similar growth experience (i.e., within the countries with similar GDP per
capita, conditional on a particular level of tourism development), which is precisely what
quantile regression does.
The quantile regression results are presented in an Appendix to this paper, and are
consistent with those based on the OLS in Table 2. Thus, through all of these tests, the evidence
suggests that tourism development affects growth through the standard income determinants.

17
4 Discussion
We extend extant literature by showing that tourism development affects the economic
growth of destinations through the standard income determinants. Our findings have important
theoretical as well as practical implications. In terms of theoretical implication, our findings
suggest that future research should focus on how tourism development interacts with standard
income factors as part of an understanding of the association between tourism development and
economic growth. In terms of practical implications, our results suggest that governments should
help the tourism industry expand through mechanisms that concurrently support growth in the
standard income factors.
To some extent, this is often accomplished through the development process, though it is
not always done in an explicit and robust manner. Several growth studies have found that
tourism development grows, not independently, but in conjunction with other economic policies.
Sugiyarto et al. (2003) argued that the combination of international tourism development with
trade liberalization policies generated positive economic impact for Indonesia, including
increased economic production, reduced government deficits, and a lower national balance of
trade. This has also been seen in smaller destinations that have a high tourism image (Lanza &
Pigliaru, 2000b; Armstrong & Read, 2000). For example, Vanegas and Croes (2003) found that,
in the case of the Caribbean island of Aruba, international tourism has been the most successful
growth oriented sector of the economy since the late 1980s, in large part because it has been part
of a broader export oriented and neo-liberal economic policy strategy.v
A natural extension of our research is to investigate through which standard income
determinants tourism development most affects economic growth. To address this issue, one
needs to first develop a more detailed model. The model should describe not only how the

18
factors of production and technology determine the output of an economy, but also how the
factors of production and technology are determined by their relevant determinants, including
tourism development. Based on such a model, one then can estimate a system of equations to
track down the effects of tourism development. This line of future research will shed
considerable light on optimal tourism policies. For instance, if tourism development were found
to affects growth mainly through its effects on R&D, then an optimal tourism policy might be to
encourage business travel.

19
5 Conclusions
Whether international tourism can lead to economic growth is an important question.
Policy makers need to decide where to invest public revenues and how to allocate incentives to
encourage the long term economic livelihood of citizens. While exceptions exist, previous
studies have overwhelmingly supported the notion that there is a positive association between
international tourism and economic growth. Since the late 1990s, those findings have been
consolidated into the tourism-led growth hypothesis, which is widely accepted as a general
concept by tourism boosters, and has been tested by tourism researchers using a variety of
cointegration modeling approaches.
We extend the TLGH literature by investigating the economic mechanism underlying the
positive association between tourism and growth. In our analysis, we find that when we did not
control for standard income factors in our data, international tourism had a statistically
significant association with growth; however, as soon as we took into account the standard
income determinants, tourism no longer maintained its marginal explanatory power, even within
major international tourism economies, and even if heterogeneity across countries was allowed.
Our findings suggest that tourism development affects growth and income through the standard
income determinants.
Please note that our findings do not suggest that tourism has no role to play in national or
local economic development. It clearly does. However, our findings suggest a redirection of the
goals of tourism development from one of investing tourism for its own sake to one where
tourism investments are made to strategically support standard income determinants. Tourism
does not grow to success in isolation. It is dependent on efficient infrastructure that supports the
movement of goods and people; it is dependent on a skilled, creative and entrepreneurial labor

20
force that can react to new challenges and opportunities in innovative ways; and it is dependent
on a government and civil society that supports places that attract people both as residents and
tourists. Therefore, for most countries, a broad and diversified economic development strategy is
more likely to support international tourism development than a more narrow policy that focuses
primarily on tourism in isolation.
Our findings have important implications for future research on the macroeconomics of
tourism development. Most important is that studies of the economic significance of tourism to
country and regional economies must take into account standard income factors to ensure a more
complete understanding of the role and contribution of tourism to growth. Assuming our findings
are valid, a second implication is the need for finer detailed understandings of how tourism
would best support, and be supported by, standard income factors. Such analysis could help with
policy decisions on how to make the tourism investments most effective in supporting long term
growth for a destination economy.

21
References
Abiven, K. (2012). Tourism bright spot in global economy: UN body. AFP (27 September),
online at http://en-maktoob.news.yahoo.com/tourism-bright-spot-global-economy-un-
body-235837080.html, accessed 30 September 2012.
Alam, M.I. (2003). “Manufactured exports, capital good imports and economic growth:
experience of Mexico and Brazil.” International Economic Journal, 17 (4): 85–105.
Archer, B. (1995). “Importance of Tourism for the Economy of Bermuda.” Annals of Tourism
Research, 22 (4): 918-930.
Armstrong, H.W. and R. Read (2000). “Comparing the Economic Performance of Dependent
Territories and Sovereign Microstates.” Economic Development and Cultural Change,
48(2): 285-306. doi:10.1086/452459
Balaguer J. and M. Cantavella-Jorda (2002). “Tourism as a long-run economic growth factor: the
Spanish case.” Applied Economics, 34: 877–884.
Barro, R.J. (1991). “Economic growth in a cross section of countries.” Quarterly Journal of
Economics, 56(2): 407-443.
Barro, R.J., and J.W. Lee (2013). “A new data set of educational attainment in the world, 1950–
2010.” Journal of Development Economics, 104: 184–198.
Becker, C. and B.P. George (2011). “Rapid Rail Transit and Tourism Development in the United
States.” Tourism Geographies, 13(3): 381-397.
Belloumi, M. (2010). “The Relationship between Tourism Receipts, Real Effective Exchange
Rate and Economic Growth in Tunisia.” International Journal of Tourism Research, 12:
550–560.

22
Briedenhann, J. and E. Wickens (2004). “Tourism routes as a tool for the economic development
of rural areas—vibrant hope or impossible dream?” Tourism Management, 25(1): 71-79.
Cárdenas-García, P. J., M. Sánchez-Rivero, and J.I. Pulido-Fernández (2013). “Does tourism
growth influence economic development?” Journal of Travel Research, XX(X): 1–16.
Dritsakis, N. (2004). “Tourism as a long-run economic growth factor: an empirical investigation
for Greece using causality analysis.” Tourism Economics, 10(3): 305–316.
Dritsakis, N. (2012). “Tourism development and economic growth in seven Mediterranean
countries: a panel data approach.” Tourism Economics, 18(4): 801-816.
Durbarry, R. (2002). “The Economic Contribution of Tourism in Mauritius.” Annals of Tourism
Research, 29 (3): 862-865.
Eugenio-Martin, J.L., N.M. Morales, and R. Scarpa (2004). “Tourism and economic growth in
Latin American countries: a panel data approach.” FEEM Working Paper No. 26, online
at Social Science Research Network http://ssrn.com/abstract=504482, accessed 27
October 2012.
Fayissa, B., C. Nsiah, and B. Tadasse (2008). “Impact of tourism on economic growth and
development in Africa.” Tourism Economics, 14(4): 807–818.
Felipe, J. (2003). “Is export-led growth passé? Implications for developing Asia.” Economics
and Research Department Working Paper Series, Asian Development Bank, Manila.
Getz, D. (2008). “Event Tourism: Definitions, evolution, and research.” Tourism Management,
29: 403-428.
Gunduz, L., and A. Hatemi-J. (2005). “Is the tourism-led growth hypothesis valid for Turkey?”
Applied Economics Letters, 12: 499–504.
23
Hall, C.M and A.A. Lew (2009). Understanding and Managing Tourism Impacts. Oxford:
Routledge.
Hall, R.E., and C.I. Jones (1999). “Why do some countries produce so much more output per
worker than others?” Quarterly Journal of Economics, 114: 83-116.
Hindley, B., and A. Smith (1984). “Comparative Advantage and Trade in Services.” The World
Economy 7:369–390.
Horowitz, J. (2009). “The income-temperature relationship in a cross-section of countries and its
implications for predicting the effects of global warming.” Environmental & Resource
Economics, 44: 475-493.
Katircioglu, S.T. (2009). “Revisiting the tourism-led growth hypothesis for Turkey using the
bounds test and Johansen approach for cointegration.” Tourism Management, 30: 17–20.
Kim, H.J., M.H. Chen, and S.C. Jang (2006). “Tourism expansion and economic development:
the case of Taiwan.” Tourism Management, 27: 925–93.
Kim, Y.K., K. Lee, W.G. Park, and K. Choo (2012). “Appropriate Intellectual Property
Protection and Economic Growth in Countries at Different Levels of Development.”
Research Policy, 41: 358-375.
Koenker, R. and G. Bassett (1978). “Quantile regression.” Econometrica, 46: 33-51.
Lanza, A., and F. Pigliaru (2000a). “Tourism and economic growth: Does country’s size
matter?” Rivista Internazionale di Scienze Economiche e Commerciali, 47: 77-85.
Lanza, A., and F. Pigliaru (2000b). “Why are tourism countries small and fast-growing?” In
Tourism and Sustainable Economic Development, edited by A. Fossati and G. Panella.
Dordrecht: Kluwer Academic Publisher. Pp. 57–69.

24
Liasidou, S. (2012). “Decision-making for tourism destinations: Airline strategy influences.”
Tourism Geographies, (9 Oct), doi: 10.1080/14616688.2012.726266, online at
http://www.tandfonline.com/doi/abs/10.1080/14616688.2012.726266, accessed 27
October 2012.
Lee, C.C. and C.P. Chang (2008). “Tourism development and economic growth: A closer look at
panels.” Tourism Management, 29: 180-192.
Lew, A.A. (2011). “Tourism's role in the global economy.” Tourism Geographies, 13(1): 148-
151.
Lew, A.A. and P.T. Ng (2012). “Using quantile regression to understand visitor spending.”
Journal of Travel Research, 51(3): 278-288.
Mankiw, N.G. (2013). Macroeconomics, eight edition. New York: MacMillan.
Massidda, C., and P. Mattana (2013). “A SVECM Analysis of the Relationship between
International Tourism Arrivals, GDP and Trade in Italy.” Journal of Travel Research, 52:
93-105.,
Mihalič, T. (2002). “Tourism and economic development issues.” In Tourism and Development:
Concepts and Issues, edited by Sharply, R, and D.J. Telfer. Channel View Publications:
Clevedon. Pp 81–111.
Narayan, P.K., S. Narayan, A. Prasad, and B.C. Prasad (2010). “Tourism and economic growth:
a panel data analysis for Pacific Island countries.” Tourism Economics, 16(1): 169-183.
Nordhaus, W.D. (2006). “Geography and macroeconomics: new data and new findings.”
Inaugural Article, Proceedings of the National Academy of Sciences, 103: 3510-3517.
Ng, P., and X. Zhao (2011). “No Matter How It Is measured, Income Declines with Global
Warming.” Ecological Economics 70: 963-970.

25
Nowak, J.J., M. Sahli, and I. Cortés-Jiménez (2007). “Tourism, capital good imports and
economic growth: theory and evidence for Spain.” Tourism Economics, 2007, 13 (4):
515–536.
Oh, C.O. (2005). “The contribution of tourism development to economic growth in the Korean
economy.” Tourism Management 26(1): 39-44.
Ongan S. and D.M. Demiroz (2005). “The contribution of tourism to the long-run Turkish
economic growth.” Ekonomicky Casopis. Journal of Economics, 53: 880–894.
Parrilla, J.C., A.R. Font, and J.R. Nadal (2007). “Tourism and long-term growth: A Spanish
Perspective.” Annals of Tourism Research, 34(3): 709-726.
Romer, P. M. (1990). “Endogenous Technological Change.” Journal of Political Economy, 98:
S71-S102.
Sánchez-Rivero, M., J.I. Pulido-Fernández, and P.J. Cárdenas-García (2013). “Tourism Growth
versus Economic Development: An Analysis by Multivariate Techniques.” In
Quantitative Methods in Tourism Economics, edited by Matías, A., P. Nijkamp, and M.
Sarmento. Heidelberg: Physica Verlag. Pp. 235-51.
Sinclair, M.T. (1998). “Tourism and economic development: a survey.” Journal of Development
Studies, 34(5): 1-51.
Solow, R.M., (1956). “A contribution to the theory of economic growth.” Quarterly Journal of
Economics, February: 65-94.
Song, H., and S. Lin (2010). “Impacts of the Financial and Economic Crisis on Tourism in Asia.”
Journal of Travel Research 49: 16-30.
Sugiyarto, G., A. Blake, and M.T. Sinclair (2003). “Tourism and globalization: Economic impact
in Indonesia.” Annals of Tourism Research, 30(3): 683-701.

26
Uysal, M., and R. Gitelson (1994). “Assessment of Economic Impacts: Festivals and Special
Events.” Festival Management and Event Tourism, 2 (1): 3-10.
Vanegas, M., and R.R. Croes (2003). “Growth, development and tourism in a small economy:
Evidence from Aruba.” International Journal of Tourism Research, 5: 315-330.
Waitt, G. (2001). “The Olympic spirit and civic boosterism: The Sydney 2000 Olympics.”
Tourism Geographies, 3(3): 249-278.
West, G.R. (1993). “Economic Significance of Tourism in Queensland.” Annals of Tourism
Research, 20 (3): 490-504.
White, H. (1980). “A Heteroskedasticity-Consistent Covariance Matrix Estimator and a Direct
Test for Heteroskedasticity.” Econometrica, 48: 817-838.
World Bank (2014) World Development Indicators (WDI). Online at :
http://data.worldbank.org/data-catalog/world-development-indicators, accessed January
2014.
World Travel and Tourism Council, 2014, Travel and Tourism Economic Impact 2014,
http://www.wttc.org/research/economic-impact-research/.

27
Table 1 Summary statistics of the variables for the 109 countries
GDP per capita
(constant 2005
US$)
Tourism
Arrivals
Gross capital
formation
(constant 2005
US$)
Average years
of schooling
(age 25+)
R&D
expenditure
(% of GDP)
Min 140.6 17294 23.34 0.990 0.02
1st Quartile 1279.7 715118 364.56 6.050 0.19
Median 4773.2 1996118 1017.68 8.550 0.47
Mean 12661.7 6529708 2752.59 7.921 0.81
3rd Quartile 19706.8 6764588 4333.39 9.852 1.08
Max 74590.1 74115824 15954.38 13.000 4.12
Standard Deviation 15935.6 11448920 3363.53 2.721 0.90
The macroeconomic data on GDP per capita (constant 2005 US$), international tourism, gross capital formation
(constant 2005 US$), and R&D expenditure are obtained from WDI. The data on average years of schooling (age
25+) are from Barro and Lee (2013). Table 1 presents our summary statistics for the relevant variables.

28
Table 2. Ordinary least-squares regression results
Panel A: Main results
(1) (2) (3)
Constant 0.253 1.329*** 1.487***
(0.841) (0.000) (0.000)
Log(TOUR) 0.562*** 0.006 0.000
(0.000) (0.791) (0.987)
log(CAP/POP) 1.007*** 0.997***
(0.000) (0.000)
log(EDU) 0.009
(0.907)
log(RND) 0.025
(0.506)
Adjusted R2 0.314 0.974 0.974
N 109 109 109
Panel B: Sub-sample evidence
1995-2002 2003-2010
(1) (2) (1) (2)
Constant 0.633 1.494*** 0.624 1.267***
(0.567) (0.002) (0.643) (0.000)
Log(TOUR) 0.542*** 0.009 0.541*** 0.001
(0.000) (0.743) (0.000) (0.964)
log(CAP/POP) 0.933*** 1.031***
(0.000) (0.000)
log(EDU) 0.202 -0.025
(0.111) (0.753)
log(RND) 0.017 -0.036

29
(0.743) (0.193)
Adjusted R2 0.325 0.974 0.302 0.979
N 86 86 104 104
Panel C: Alternative model specification and measures
Alternative models Alternative measures
(1) (2) (3) (1) (2) (3)
Constant 2.105 1.636*** 1.863*** 1.328*** 1.418*** 1.286***
(0.304) (0.000) (0.000) (0.000) (0.000) (0.002)
log(TOUR) 0.451*** -0.017 -0.024 0.051 0.015 0.043
(0.000) (0.470) (0.317) (0.209) (0.522) (0.418)
log(CAP/POP) 1.101*** 1.007*** 1.011*** 0.977*** 0.902***
(0.000) (0.000) (0.000) (0.000) (0.000)
log(EDU) -0.026 -0.010 -0.010 0.196
(0.717) (0.893) (0.918) (0.383)
log(RND) 0.024 0.017 -0.006 -0.020
(0.523) (0.661) (0.877) (0.220)
Dummy -2.475 -0.861 -0.942*
(0.355) (0.089) (0.095)
log(TOUR)Dummy 0.135 0.055 0.061
(0.446) (0.101) (0.105)
Adjusted R2 0.307 0.977 0.977 0.976 0.955 0.944
N 105 105 105 105 97 112
Empirical results from the cross-sectional regression models. The numbers in parentheses are the p-values of the t
test statistics. White's (1980) procedure is used to calculate standard errors to take into account possible
heteroskedasticity. *Significant at 10%; **Significant at 5%; ***Significant at 1%.

30
Table 3. Partial correlation coefficient matrix
log(GDP/POP) log(TOUR) log(EDU) log(RND) log(CAP/POP)
log(GDP/POP) 1.0000
[0.0000]
(0.0000)
0.0626
[0.6392]
(0.5227)
0.1203
[1.2360]
(0.2168)
0.0672
[0.6873]
(0.4919)
0.9666
[38.4613]
(0.0000)
log(TOUR) 0.0626
[0.6392]
(0.5227)
1.0000
[0.0000]
(0.0000)
-0.1075
[-1.1031]
(0.2700)
0.3580
[3.9103]
(0.0001)
0.0120
[0.1225]
(0.9025)
log(EDU) 0.1203
[1.2360]
(0.2168)
-0.1075
[-1.1031]
(0.2700)
1.0000
[0.0000]
(0.0000)
0.3123
[3.3525]
(0.0008)
-0.0067
[-0.0678]
(0.9459)
log(RND) 0.0672
[0.6873]
(0.4919)
0.3580
[3.9103]
(0.0001)
0.3123
[3.3525]
(0.0008)
1.0000
[0.0000]
(0.0000)
0.0124
[0.1266]
(0.8993)
log(CAP/POP) 0.9666
[38.4613]
(0.0000)
0.0120
[0.1225]
(0.9025)
-0.0067
[-0.0678]
(0.9459)
0.0124
[0.1266]
(0.8993)
1.0000
[0.0000]
(0.0000)
The top number in each cell is the estimated partial correlation coefficient between the corresponding pair of
variables while the middle number inside the square brackets is the t test statistic for the significance of the partial
correlation coefficient and the bottom number inside the parentheses is the p-value of the t test statistic.

31
Appendix
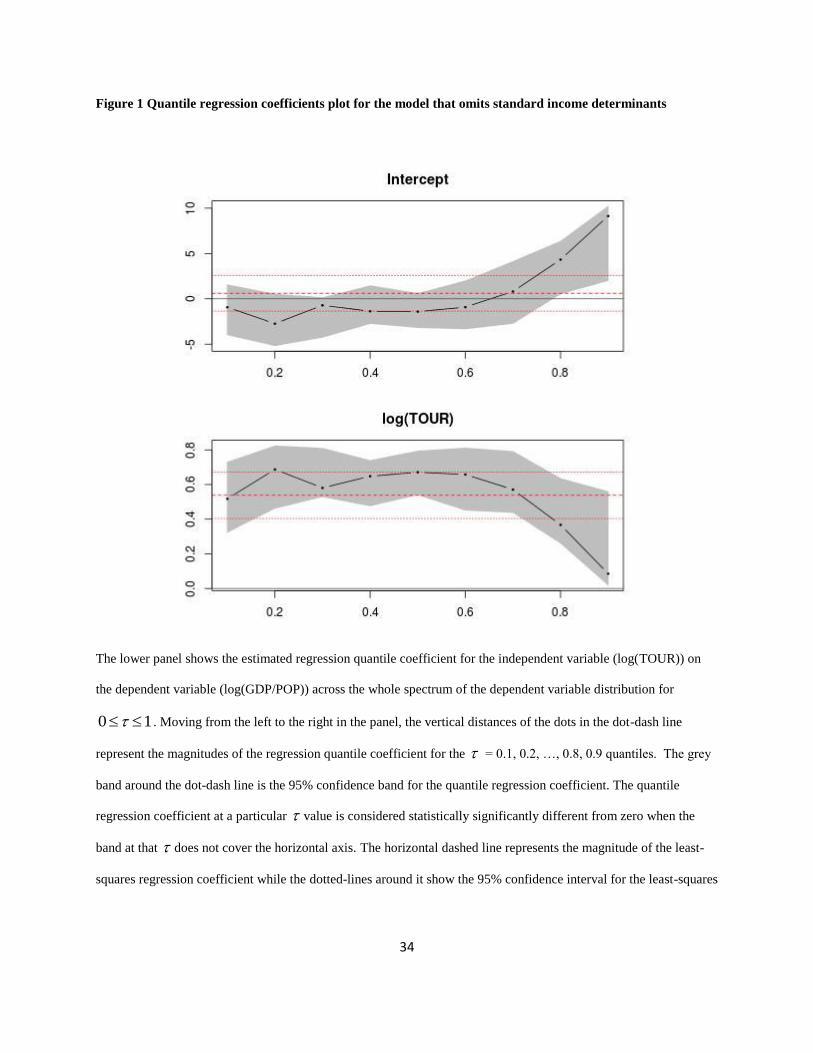
Figure 1 presents the regression quantile coefficients of the independent variable
log(TOUR) when the standard income determinants are excluded. The top and bottom panels
present the estimated regression quantile coefficients for the intercept and log(TOUR) across the
whole spectrum of the dependent variable distribution for the 0 1 presented on the
horizontal axis. For example, the vertical axis of the bottom panel in the figure represents the
magnitude of the regression quantile coefficients of log(TOUR) across ranging from 0.1 to 0.9
on the horizontal axis. Moving from the left to the right along the horizontal axis, the vertical
distances of the dots in the dot-dash line represent the magnitudes of the regression quantile
coefficients for = 0.1, 0.2, …, 0.8, 0.9. The grey band around the dot-dash line in each panel
represents the 95% confidence band for the quantile regression coefficients. Hence, the quantile
regression coefficient at a particular value is considered significantly different from zero when
the band at that does not cover the 0y axis. The horizontal solid line represents the
magnitude of the least-squares regression coefficient while the horizontal dash-lines around it
depict the 95% confidence interval for the least-squares coefficient.
<< Figure 1 About Here >>
The regression quantile coefficient for a particular measures the impact of a one unit
change in the corresponding independent variable on the -th quantile of the dependent variable,
holding constant (partialling out) the effects of all the other independent variables. For example,
from the lower panel of Figure 1, the quantile regression coefficient of log(TOUR) is around 0.7
for = 0.5 (the median regression), which implies that a 1% increase in tourism arrival will
induce an estimated 0.7% increase in the median GDP per capita. This estimate is quite a bit
higher than the least-squares regression estimate of 0.562 in Panel A of Table 2, which suggests

32
that there appear to be outliers in the data since the values of estimated average (least-squares
regression) and median ( = 0.5 quantile regression) effects of log(TOUR) on the dependent
variable are quite different from each other.
Figure 1 also shows that across different quantiles, the coefficient of log(TOUR) is
always significant and there is some quantile effect for log(TOUR) in the upper tail of the
distribution of log(GDP/POP) since the magnitude of the slope coefficient is fairly constant
across 0 0.7 and decreases as increases beyond 0.7. In addition, the intercept term in
Figure 1 exhibits strong quantile effect, especially in the upper tail, with increasing positive
values as increases from 0 to 1. This indicates that log(GDP/POP) rises as we move from the
left tail of the GDP per capita distribution towards the right tail when all the independent
variables have zero values, which is what we will expect. Taken all the evidence together, even
when the potential heterogeneity across countries is allowed through quantile regressions, there
is still a significant association between GDP per capita and tourism.
Next, we investigate the economic mechanism underlying the positive tourism-growth
the association by including the standard income determinants. The results are presented in
Figure 2. Figure 2 contains the regression quantile coefficients of the independent variables
log(TOUR), log(EDU), log(RND) and log(CAP/POP). Similar to the least-squares regression
findings, as soon as the standard income factors are included, the number of international arrivals
(log(TOUR)) becomes statistically insignificant across the whole spectrum of the dependent
variable distribution as we can see that the grey confidence band for the estimated coefficients
for log(TOUR) contains the whole horizontal axis. The magnitude of the estimated impacts of
the growth factors (log(EDU), log(RND) and log(CAP/POP)) on the different quantiles of
logarithm of GDP per capita across the whole range of 0 1 is very close to the average

33
impact estimated by the least-square regression. Therefore, even if the heterogeneity across
countries is allowed in the model, the significant association between international tourism and
income growth documented in Figure 1 disappears as soon as the standard income determinants.
This finding again suggests that tourism development affects economic growth through standard
income determinants.
34
Figure 1 Quantile regression coefficients plot for the model that omits standard income determinants
The lower panel shows the estimated regression quantile coefficient for the independent variable (log(TOUR)) on
the dependent variable (log(GDP/POP)) across the whole spectrum of the dependent variable distribution for
0 1 . Moving from the left to the right in the panel, the vertical distances of the dots in the dot-dash line
represent the magnitudes of the regression quantile coefficient for the = 0.1, 0.2, …, 0.8, 0.9 quantiles. The grey
band around the dot-dash line is the 95% confidence band for the quantile regression coefficient. The quantile
regression coefficient at a particular value is considered statistically significantly different from zero when the
band at that does not cover the horizontal axis. The horizontal dashed line represents the magnitude of the least-
squares regression coefficient while the dotted-lines around it show the 95% confidence interval for the least-squares

35
coefficient. Hence, the least-squares regression coefficient is statistically insignificant if the horizontal dotted-lines
envelope the horizontal axis.

36
Figure 2 Quantile regression coefficients plot for the model that includes standard income determinants
Each panel shows the estimated regression quantile coefficient for each of the independent variables (log(TOUR),
log(EDU), log(RND) and log(CAP/POP)) on the dependent variable (log(GDP/POP)) across the whole spectrum of
the dependent variable distribution for 0 1 . Moving from the left to the right in each panel, the vertical
distances of the dots in the dot-dash line represent the magnitudes of the regression quantile coefficient for the =
0.1, 0.2, …, 0.8, 0.9 quantiles. The grey band around the dot-dash line in each panel is the 95% confidence band for
the quantile regression coefficient. The quantile regression coefficient at a particular value is considered
statistically significantly different from zero when the band at that does not cover the horizontal axis. The
horizontal dashed line represents the magnitude of the least-squares regression coefficient while the dotted-lines

37
around it show the 95% confidence interval for the least-squares coefficient. Hence, the least-squares regression
coefficient is statistically insignificant if the horizontal dotted-lines envelope the horizontal axis.

38
i Criticisms of tourism include high leakages, low wages, and dependent economies (Sinclair,
1998; Hall & Lew, 2009).
ii Like manufactured goods that are sold abroad, tourism is an export industry to the degree that it
generates income and profits from money derived from sources outside of the destination. It is
unlike traditional export industries because the consumed goods are experiences and services
based on products that seldom leave the destination (Alam, 2003). Tourism’s export income
benefits can be limited in situations where leakages are high and Keynesian multipliers are low,
though this can also be the case for other exports based on foreign direct investments (Nowak et
al., 2007). Even in this situation, however, exports can still promote growth through the
accumulation of capital investments and goods in the exporting economy.
iii For more supporting evidence of the positive relationship between tourism development and
economic growth, see Vanegas and Croes (2003), Fayissa et al. (2009), and Belloumi (2010).
Alternatively, Oh (2005) and Katircioglu (2009) did not find supporting evidence in Korea and
Turkey. The long term growth potential of small, tourism-based economies has also been
questioned (Parrilla et al., 2007).
iv As a special case of quantile regression, at the 0.5 quantile (or 50th percentile), the median
regression also serves as a robust (to outliers) alternative to the least-squares regression.
v The neo-liberal export-led growth models rely on export (and therefore tourism) to encourage
entrepreneurial competition and efficiency, reduce internal monopolistic tendencies through

39
more open market structures, and increase knowledge accumulation, technology adoption, and
other innovations (Felipe, 2003).