Touch Sensor Transparent Conductor Optical Comparison · Touch Sensor Transparent Conductor Optical...
15
White Paper Touch Sensor Transparent Conductor Optical Comparison
Transcript of Touch Sensor Transparent Conductor Optical Comparison · Touch Sensor Transparent Conductor Optical...
White Paper
Touch Sensor Transparent Conductor
Optical Comparison

Touch Sensor Transparent Conductor Optical Comparison Paul Weindorf, Kong Lor, Soeren Lichtenberg, Steven Ponsock
Visteon Corporation, Michigan, USA & Karlsruhe, Germany
Abstract: Various transparent conductor materials utilized for touch sensors are compared for optical transmission and reflectance performance.
Keywords: transparent; conductor; ITO; transmission; reflectance; SCI; SCE; 2D; 3D
1. Introduction Several transparent conductor materials are currently being utilized in touch sensor manufacturing. These materials include but are not limited to:
Silver nanowire on Film
Copper mesh on Film
PEDOT on Film
Carbon nanotube on Film
ITO on Film
ITO on glass reference touch sensor
Furthermore with the desire to produce 2D and 3D touch sensors for automotive application it is important to recognize the limitations associated with each transparent conductor material type. Generally all of the materials may be “bent” to a certain degree, but 3D forming of most conductor materials is limited.
2. Background/Objective The objective of the study is to provide an optical comparison between the various transparent conductor materials. With all of the various transparent conductor materials on the market, it is difficult to understand the performance tradeoffs. In addition, since the carbon nanotube material may be the most 3D formable, it is important to understand the optical performance characteristics. Information provided by the various suppliers is included for reference.
2.1 Kodak PEDOT Eastman Kodak Company markets a portfolio of conductive polymer films under the KODAK HCF Film family. The KODAK HCF family are polyester (PET) films with a proprietary conductive PEDOT/PSS formulation coated in-line during the polyester manufacturing process. The unique manufacturing process produces an exceptionally uniform material, which is optically clear with excellent surface quality. The KODAK HCF films are available as single-sided and dual coated films at various resistivities [1].
The PEDOT/PSS complex shown in Figure 2.1-1 consists of polymeric cationic PEDOT and a polymeric counter anion derived from polystyrenesulfonic acid. Typically every third or fourth thiophene unit carries a positive
charge. The long loops and tails of PSS stabilize the particles against coagulation and precipitation. PEDOT:PSS dispersions are stable at room temperature under ambient conditions and can be coated to yield transparent, conductive films [2].
Figure 2.1-1. PEDOT/PSS [2]
Figure 2.1-2 shows a calculated transmission from the material supplier, Heraeus, of 84.4% when absorption is included.
Figure 2.1-2. PEDOT Transmission including Absorption [courtesy of Heraeus]
The absorption per PEDOT layer is about 4.1% per Table 2.1-1.

Material n R Absorption T
Air 1.00 0 1.000
glass 1.52 4.26E-02 0 0.957
OCA 1.55 9.55E-05 0 0.957
PEDOT 1.50 2.69E-04 0.041 0.918
PET 1.57 5.20E-04 0 0.917
PEDOT 1.50 5.20E-04 0.041 0.879
Air 1.00 4.00E-02 0 0.844Table 2.1-1. Transmission Calculation based on Kodak
Data
The reflectance, R, in Table 2.1-1 is determined per Equation 2.1-1 based on an index of refraction change from n1 to n2.
2
12
12
nn
nnR Eq 2.1-1
The absorption losses within the PEDOT:PSS layer are calculated per Lambert’s Law of Absorption equation as shown in Figure 2.1-3 provided by the material supplier, Heraeus.
Figure 2.1-3. PEDOT:PSS Absorption Equation [courtesy of
Heraeus]
An interesting observation is that PEDOT has an index of refraction that is well matched with most optical materials versus ITO which has an index of refraction of around 1.95 without the use of index matching layers. Even with the PEDOT absorption, PEDOT will have better optical performance. Therefore the PEDOT patterning will be much less visible. However Kodak/Heraeus only offers PEDOT on PET film which may have birefringence problems with polarized sunglasses. However other PEDOT suppliers may be available on alternative birefringent friendly materials.
2.2 Carbon Nanotube There are several carbon nanotube transparent conductor systems being proposed. Recently [3], Canatu described a carbon NanoBud® transparent conductor system that has a big benefit because it can be 3D formed (stretched) without a substantial change in resistivity as indicated in Figure 2.2-1. A depiction of the carbon NanoBud® is shown in Figure 2.2-2. Canatu Generation 6 material shows a dramatic transmission improvement per Figure 2.2-3 with potential for further improvements per the “Best lab results”. Per reference [3], Canatu describes that there is no reflection component from the transparent conductor and only an absorption component consistent with Figure 2.2-3 should be observed.
Figure 2.2-1. Carbon NanoBud® Stretchability [3]
Figure 2.2-2. Carbon NanoBud® Depiction [4]

Figure 2.2-3. Gen 6 Performance [4]
2.3 Copper Mesh Copper mesh systems are available that provide a type of transparent conductor system due to the small feature size of the metal mesh as shown in Figure 2.3-1. One big advantage of copper mesh is low resistance including the touch sensor tracking that can be low resistance copper which improves touch sensor response times. In addition, the low resistance minimizes sensor tracking edge dimensions.
Figure 2.3-1. Copper Mesh
In addition to the “normal” copper mesh, a lower reflectance absorbing type copper mesh is becoming available. Unipixel has recently begun sampling its XTouch™ copper metal mesh sensors with a secondary metal plating (called hybrid-metal) that replaces the previous chemical darkening process. This secondary metal plating not only reduces reflection, but is also expected to further enhance robustness of the sensor under environmental stress conditions. XTouch™ is also highly
appropriate for 2.5D curved and flexible designs. In addition, the use of copper allows the possibility of an integrated connection tail thereby eliminating a separate tail to sensor connection. Figure 2.3-1 shows a SEM picture of the hybrid-metal mesh.
Copper
Figure 2.3-1. XTouch™ Hybrid-Metal SEM (courtesy of Unipixel)
2.4 Silver Nanowire The use of silver nanowire conductor material such as Cambrios ClearOhm® is being used for touch sensor transparent conductor material. The silver nanowires as shown in Figure 2.4-1 are in the nanometer range and therefore should have minimal effect on the light transmission.
Figure 2.4-1. Silver nanowire SEM [5]
2.5 ITO Touch Screen ITO is the historical reference against which other transparent conductor alternatives should be compared. The best possible ITO touch screens utilize index matching (IM) materials to minimize reflection and maximize transmission since ITO is not well index matched to most substrate materials. In addition the index matching materials minimize the tracking pattern visibility. ITO may be deposited on glass and on film substrates.

3. Description The materials tested were:
Silver nanowire on PC
Index matched ITO on glass touch sensor (reference)
ITO on PC
Copper mesh on PET
Copper mesh on COC
Hybrid Copper Mesh on PET
Carbon Nanotube on PET (two resistances)
Kodak PEDOT on PET
The approach towards measuring the internal absorption and reflection characteristics was to optically bond the samples to a front glass surface and to laminate moth-eye film on the rear surface. The front glass surface holds the flexible sensor flat to the measurement system which is important to ensure that the specular component is properly reflected into the receiver. In addition the glass surface will not be scratched when touched to the integrating sphere input port. Dexerials SVME (Super View Moth Eye) film was laminated to the rear surface of the samples to simplify the analysis. The rear surface reflection of the moth-eye film is assumed negligible at about 0.28% which greatly simplifies the analysis and the system can be modeled per Figure 3-1. For reference, Figure 3-2 shows the reflectance characteristics of the Dexerials SVME film.
Motheye
Touch Sensor
Glass Figure 3-1. Optical Analysis Model
Figure 3-2. Dexerials SVME Spectral Reflectance
In order to assess the absorption and reflection of the soda lime carrier glass and moth-eye structure, data was taken as shown in Table 3-1. From Table 3-1, the Glass+PSA+PSA+Motheye transmission without a sensor is 93.94% and the total reflectance is 4.75%. Since the moth-eye film has a minimal reflectance of 0.28%, Equation 3-1 may be written. Equation 3-1 is simplified to account for the fact that most of the reflectance is from the front glass to air interface and that a negligible amount of reflection comes from the rear surface.
GARTTT 11 Eq 3-1
TT is the total sample transmittance (measured)
RT is the total sample reflectance (measured)
Specular Component Excluded (SCE) ID SCE
Glass 0.03 Glass w/Moth-eye 0.03
Glass w/PSA w/PSA w/Motheye 0.03
Specular Component Included (SCI) ID SCI
Glass 8.13 Glass w/Moth-eye 4.75
Glass w/PSA w/PSA w/Motheye 4.75
Transmission (TRAN)
ID Xmission Haze %
Glass 90.48 0.1Glass w/Moth-eye 93.96 0.1Glass w/PSA w/PSA w/Moth-eye 93.94 0.1
0.87% Standard Haze 91.65 0.8Table 3-1. Glass + Moth-Eye Optical Performance
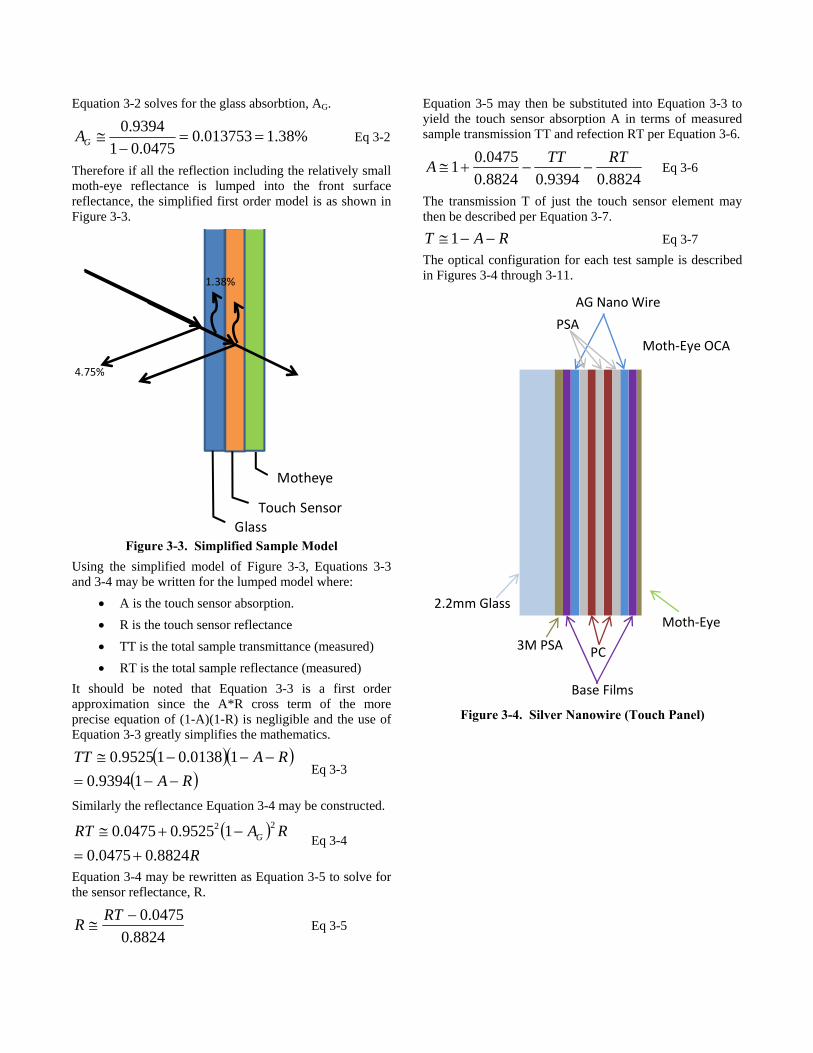
Equation 3-2 solves for the glass absorbtion, AG.
%38.1013753.00475.01
9394.0
GA Eq 3-2
Therefore if all the reflection including the relatively small moth-eye reflectance is lumped into the front surface reflectance, the simplified first order model is as shown in Figure 3-3.
Motheye
Touch Sensor
Glass
1.38%
4.75%
Figure 3-3. Simplified Sample Model
Using the simplified model of Figure 3-3, Equations 3-3 and 3-4 may be written for the lumped model where:
A is the touch sensor absorption.
R is the touch sensor reflectance
TT is the total sample transmittance (measured)
RT is the total sample reflectance (measured)
It should be noted that Equation 3-3 is a first order approximation since the A*R cross term of the more precise equation of (1-A)(1-R) is negligible and the use of Equation 3-3 greatly simplifies the mathematics.
RA
RATT
19394.0
10138.019525.0 Eq 3-3
Similarly the reflectance Equation 3-4 may be constructed.
R
RART G
8824.00475.0
19525.00475.0 22
Eq 3-4
Equation 3-4 may be rewritten as Equation 3-5 to solve for the sensor reflectance, R.
8824.0
0475.0
RTR Eq 3-5
Equation 3-5 may then be substituted into Equation 3-3 to yield the touch sensor absorption A in terms of measured sample transmission TT and refection RT per Equation 3-6.
8824.09394.08824.0
0475.01
RTTTA Eq 3-6
The transmission T of just the touch sensor element may then be described per Equation 3-7.
RAT 1 Eq 3-7
The optical configuration for each test sample is described in Figures 3-4 through 3-11.
PC
Moth‐Eye
Moth‐Eye OCA
AG Nano Wire
Base Films
PSA
2.2mm Glass
3M PSA
Figure 3-4. Silver Nanowire (Touch Panel)
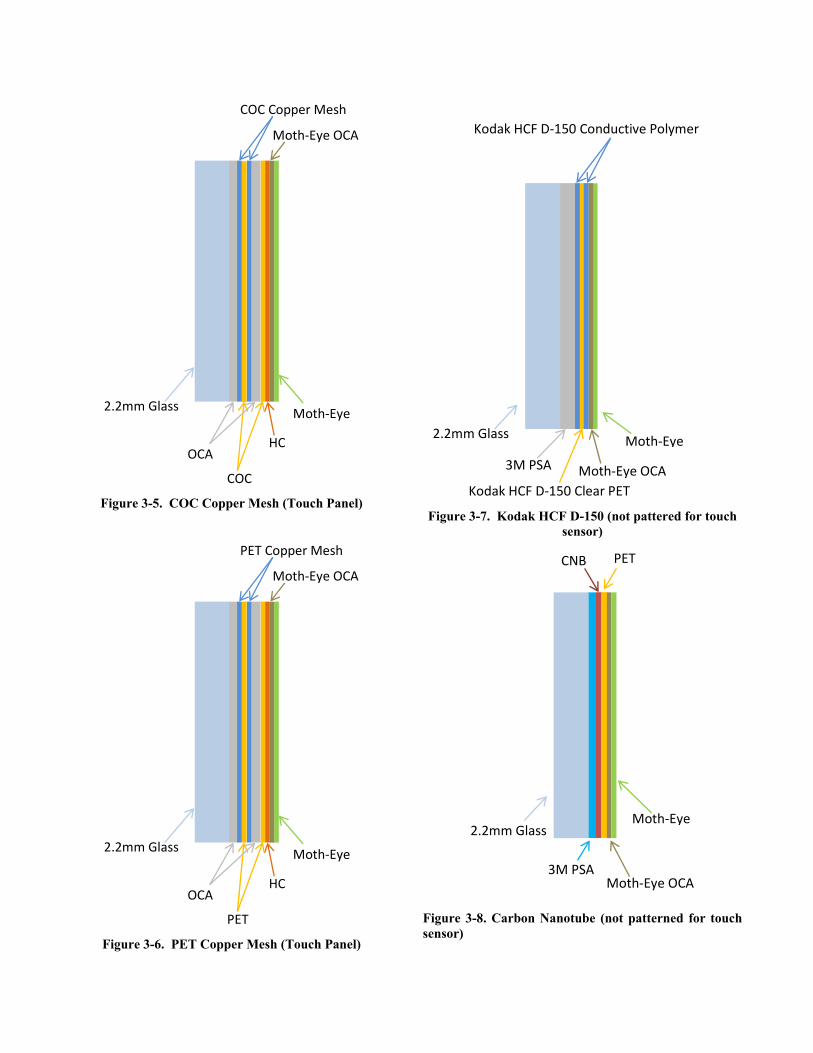
Moth‐Eye OCA
2.2mm Glass
OCA HC
Moth‐Eye
COC Copper Mesh
COC
Figure 3-5. COC Copper Mesh (Touch Panel)
Moth‐Eye OCA
2.2mm Glass
OCA HC
Moth‐Eye
PET Copper Mesh
PET Figure 3-6. PET Copper Mesh (Touch Panel)
2.2mm Glass
3M PSA Moth‐Eye OCA
Moth‐Eye
Kodak HCF D‐150 Conductive Polymer
Kodak HCF D‐150 Clear PET
Figure 3-7. Kodak HCF D-150 (not pattered for touch sensor)
CNB
Moth‐Eye
Moth‐Eye OCA
2.2mm Glass
3M PSA
PET
Figure 3-8. Carbon Nanotube (not patterned for touch sensor)

Figure 3-9. ITO on Glass Touch Sensor
Hardcoat
Moth‐Eye
Moth‐Eye OCA
2.2mm Glass
3M PSA
Copper Mesh
PMMA
PET
Figure 3-10. Unipixel XTouch™ Hybrid-Metal Copper
Mesh
PC ITO
Moth‐Eye
Moth‐Eye OCA
2.2mm Glass
3M PSA OCA
Figure 3-11. ITO on PC Touch Sensor
Figure 3-12. Hunter Lab Ultrascan Spectrophotometer
The data for each sample configuration was measured as shown in Table 3-2 by utilizing a Hunter Lab Ultrascan and shown in Figure 3-12.
Equations 3-5, 3-6 and 3-7 may be utilized to extract the absorption, reflectance and transmittance data associated with the touch sensor materials except for the PEDOT as summarized in Table 3-3. Since the PEDOT sample was not a patterned touch sensor and had two full unpatterned
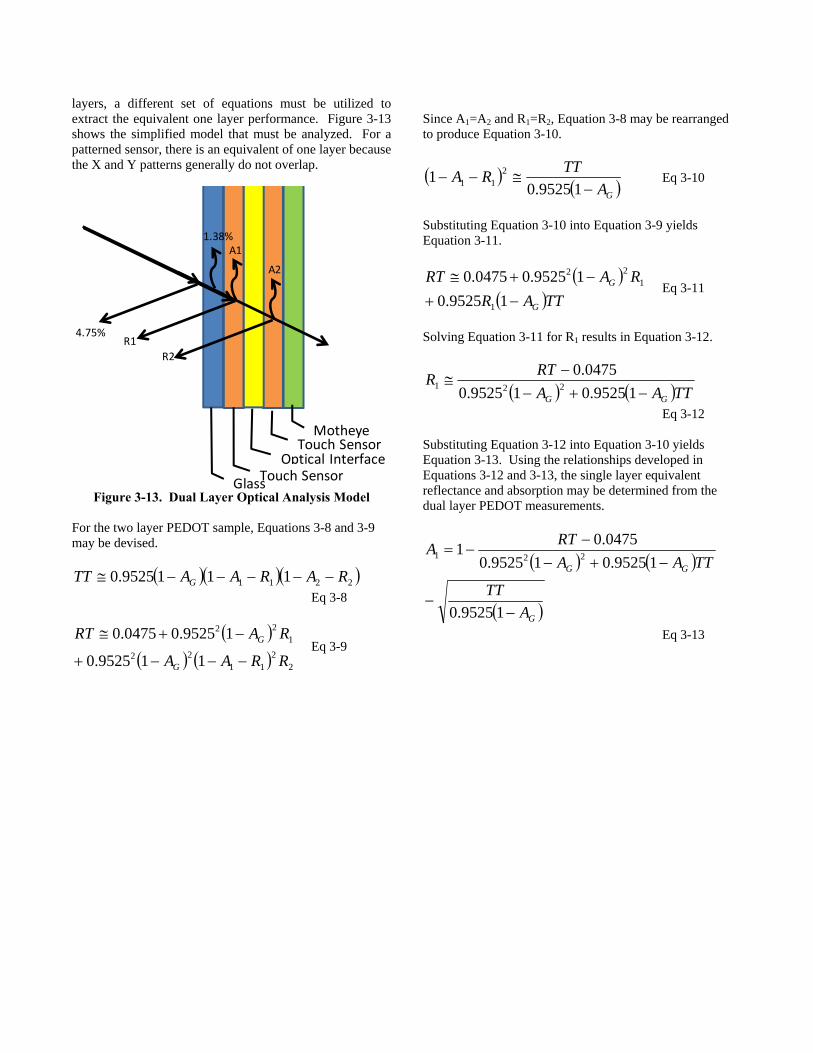
layers, a different set of equations must be utilized to extract the equivalent one layer performance. Figure 3-13 shows the simplified model that must be analyzed. For a patterned sensor, there is an equivalent of one layer because the X and Y patterns generally do not overlap.
Motheye
Touch SensorGlass
Touch SensorOptical Interface
A1
R1
A2
R2
4.75%
1.38%
Figure 3-13. Dual Layer Optical Analysis Model
For the two layer PEDOT sample, Equations 3-8 and 3-9 may be devised.
2211 1119525.0 RARAATT G
Eq 3-8
2
211
22
122
119525.0
19525.00475.0
RRAA
RART
G
G
Eq 3-9
Since A1=A2 and R1=R2, Equation 3-8 may be rearranged to produce Equation 3-10.
GA
TTRA
19525.01 2
11 Eq 3-10
Substituting Equation 3-10 into Equation 3-9 yields Equation 3-11.
TTAR
RART
G
G
19525.0
19525.00475.0
1
122
Eq 3-11
Solving Equation 3-11 for R1 results in Equation 3-12.
TTAA
RTR
GG
19525.019525.0
0475.0221
Eq 3-12 Substituting Equation 3-12 into Equation 3-10 yields Equation 3-13. Using the relationships developed in Equations 3-12 and 3-13, the single layer equivalent reflectance and absorption may be determined from the dual layer PEDOT measurements.
G
GG
A
TT
TTAA
RTA
19525.0
19525.019525.0
0475.01
221
Eq 3-13

SCI Data ID Y x y L* a* b* Glass 8.1 0.308 0.3257 34.2 -0.37 -0.94 Silver Nanowire/PC (Touch Panel) 6.26 0.2992 0.3118 30.05 0.64 -3.69 IM ITO/Glass (Touch Panel) 4.87 0.3044 0.3191 26.35 0.22 -1.98 ITO/PC (Touch Panel) 5.59 0.3079 0.3201 28.36 0.76 -1.68 Copper Mesh/COC (Touch Panel) 5.3 0.3167 0.3258 27.58 1.42 -0.2 Copper Mesh/PET (Touch Panel) 5.38 0.3073 0.3214 27.8 0.39 -1.5 Hybrid Copper Mesh/PET (XTouch™ Touch Panel) 4.95 0.3077 .0.3242 25.58 -0.09 -1.02 Carbon Nanotube/PET-105Ω/ (Non-Touch, 1 layer) 4.85 0.307 0.3242 26.31 -0.21 -1.07 Carbon Nanotube/PET-166Ω/ (Non-Touch, 1 layer) 4.85 0.3067 0.3232 25.29 0.1 -1.23
Kodak HCF D-150 PEDOT/PET (Non-Touch, 2 layer) 4.81 0.3051 0.3214 26.2 -0.08 -1.6
SCE ID Y x y L* a* b* Glass 0.03 0.2779 0.335 0.31 -0.17 -0.03
Silver Nanowire/PC (Touch Panel) 0.99 0.2726 0.2681 8.94 2.46 -7.02 IM ITO/Glass (Touch Panel) 0.04 0.2775 0.3246 0.38 -0.17 -0.08 ITO/PC (Touch Panel) 0.06 0.2392 0.2299 0.5 0.2 -0.97 Copper Mesh/COC (Touch Panel) 0.4 0.4118 0.3564 3.61 3.35 2.5 Copper Mesh/PET (Touch Panel) 0.2 0.3099 0.2822 1.83 1.23 -1.03 Hybrid Copper Mesh/PET (XTouch™ Touch Panel) 0.23 0.3113 0.3263 2.04 0.03 -0.07 Carbon Nanotube/PET-105Ω/ (Non-Touch, 1 layer) 0.19 0.2599 0.2591 1.75 0.42 -2.13 Carbon Nanotube/PET-166Ω/ (Non-Touch, 1 layer) 0.19 0.2492 0.2566 1.7 0.16 -2.25
Kodak HCF D-150 PEDOT/PET (Non-Touch, 2 layer) 0.08 0.2448 0.2588 0.74 -0.01 -0.97
TRAN ID Y x y L* a* b* Haze % Air 100 0.3127 0.3291 100 -0.01 0.02 0Glass 90.43 0.3123 0.3298 96.17 -0.59 0.24 0.1Silver Nanowire/PC (Touch Panel) 88.98 0.3158 0.3351 95.57 -1.35 2.81 1.5IM ITO/Glass (Touch Panel) 92.62 0.3128 0.3314 97.07 -1.14 0.91 0.4ITO/PC (Touch Panel) 91.62 0.314 0.3326 96.66 -1.08 1.59 0.2Copper Mesh/COC (Touch Panel) 86.18 0.3132 0.3312 94.39 -0.84 0.89 0.8Copper Mesh/PET (Touch Panel) 89.61 0.3135 0.3316 95.83 -0.86 1.09 1Hybrid Copper Mesh/PET (XTouch™ Touch Panel) 89.18 0.3134 0.3318 95.65 -0.97 1.16 1Carbon Nanotube/PET-105Ω/ (Non-Touch, 1 layer) 86.28 0.3148 0.3323 94.43 -0.51 1.59 0.4Carbon Nanotube/PET-166Ω/ (Non-Touch, 1 layer) 88.22 0.3142 0.3319 95.25 -0.64 1.34 0.4
Kodak HCF D-150 PEDOT/PET (Non-Touch, 2 layer) 80.53 0.3063 0.3264 91.92 -2 -2.06 0.3Table 3-2. Raw Data

ID Ω/ RT% TT% R% A% T% Haze%
Silver Nanowire/PC (Touch Panel) 80 6.26 88.98 1.711242 3.568724 94.72003 1.5
IM ITO/Glass (Touch Panel) 150 4.87 92.62 0.135993 1.269159 98.59485 0.4
ITO/PC (Touch Panel) 150 5.59 91.62 0.951949 1.517712 97.53034 0.2
Copper Mesh/COC (Touch Panel) 10 5.3 86.18 0.6233 7.637292 91.73941 0.8
Copper Mesh/PET (Touch Panel) 10 5.38 89.61 0.713962 3.895363 95.39067 1
Hybrid Copper Mesh/PET (XTouch™ Touch Panel) 10 4.95 89.18 0.226655 4.84041 94.93294 1
Carbon Nanotube/PET 105Ω (Non-Touch, 1 layer) 105 4.85 86.28 0.113327 8.040814 91.84586 0.4
Carbon Nanotube/PET 166Ω (Non-Touch, 1 layer) 166 4.85 88.22 0.113327 5.975666 93.91101 0.4
Kodak HCF D-150 PEDOT/PET (Non-Touch, 2 layer) 150 4.81 80.53 0.036611 7.373437 92.58995 0.3
Table 3-3. Performance Summary
Each parameter is compared in Figures 3-14 through 3-17.
00.20.40.60.81
1.21.41.61.8
Silver Nano Wire PC 80Ω
IM ITO ‐‐
Glass 150Ω
ITO ‐‐PC
150Ω
Copper Mesh
‐COC 10Ω
Copper Mesh
‐PET 10Ω
Hybrid Copper Mesh PET 10Ω
Carbon Nano Tube PET 105Ω
Carbon Nano Tube PET 166Ω
PEDOT ‐‐
PET 150Ω
% Reflectan
ce
Reflectance R%
Figure 3-14. % Reflectance
0123456789
Silver Nano Wire PC 80Ω
IM ITO ‐‐
Glass 150Ω
ITO ‐‐PC
150Ω
Copper Mesh
‐COC 10Ω
Copper Mesh
‐PET 10Ω
Hybrid Copper Mesh PET 10Ω
Carbon Nano Tube PET 105Ω
Carbon Nano Tube PET 166Ω
PEDOT ‐‐
PET 150Ω
% Absorption
Absorption A%
Figure 3-15. % Absorption
889092949698100
Silver Nano Wire PC 80Ω
IM ITO ‐‐
Glass 150Ω
ITO ‐‐PC
150Ω
Copper Mesh
‐COC 10Ω
Copper Mesh
‐PET 10Ω
Hybrid Copper Mesh PET 10Ω
Carbon Nano Tube PET 105Ω
Carbon Nano Tube PET 166Ω
PEDOT ‐‐
PET 150Ω
% Transm
ission
Transmission T%
Figure 3-16. % Transmission
00.20.40.60.81
1.21.41.6
Silver Nano Wire PC 80Ω
IM ITO ‐‐
Glass 150Ω
ITO ‐‐PC
150Ω
Copper Mesh
‐COC 10Ω
Copper Mesh
‐PET 10Ω
Hybrid Copper Mesh PET 10Ω
Carbon Nano Tube PET 105Ω
Carbon Nano Tube PET 166Ω
PEDOT ‐‐
PET 150Ω
% Haze
Haze%
Figure 3-17. % Haze
In the automotive application, reflectance performance is the most important parameter due to high ambient daytime lighting conditions. In addition, low haze means superior clarity performance. Therefore it appears that hybrid copper mesh, carbon nanotube and PEDOT are possibly good candidates for automotive applications from an optical aspect. Due to the carbon nanotube stretchability per Figure 2.2-1, it may be a possible candidate for automotive 3D touch screens. In addition, the next generations of Carbon NanoBud® will have higher transmission per Figure 2.2-3 which was not as good as ITO transmission.
4. Additional Carbon Nanotube Investigation Due to the attractive nature of the carbon nanotube system for 3D formed touch screens, additional samples were constructed to discover the carbon nanotube layer reflectance since the supplier, Canatu, asserts that there is no reflectance from the carbon nanotubes (CNT). Additional samples per Figures 4-1 and 4-2 were prepared that included clear PET film with no CNT deposition from the same substrate that the CNT samples were prepared from. The measurement results are shown in Table 4-1.

CNB
Moth‐Eye
Moth‐Eye OCA
2.2mm Glass
3M PSA
PET
Figure 4-1. CNB towards Front
PE
Moth‐Eye
Moth‐Eye OCA
2.2mm Glass
3M PSA
CNB
Figure 4-2. CNB towards Rear
ID SCE Glass 0.03Canatu 166Ω/ CNB → Rear Fig 4-2 0.19Canatu PET Only 0.2Canatu 166Ω/ CNB → Front Fig 4-1 0.19
ID SCI Glass 8.12Canatu 166Ω/ CNB → Rear Fig 4-2 4.86Canatu PET Only 4.98Canatu 166Ω/ CNB → Front Fig 4-1 4.98
ID Trans Haze %0.87% Haze Standard 91.67 0.9Canatu 166Ω/ CNB → Rear Fig 4-2 88.15 0.4Canatu PET Only 92.92 0.3Canatu 166Ω/ CNB → Front Fig 4-1 88.52 0.3
Table 4-1. With and Without CNT
The first thing to notice is that the reflectance with and without the CNT is almost identical at 4.98% and this result shows that all of the substrate interface and moth-eye plus the front glass surface reflectance is 4.98% and the CNB has little no reflectance component. Rounding the 4.98% to 5% and recognizing that the CNB has 0% reflectance yields Equations 4-1 and 4-2.
0195.08852.0 / CNTWA Eq 4-1
0195.09299.0 / OCNTWA Eq 4-2
Solving Equations 4-1 and 4-2 yields Equations 4-3 and 4-4.
%8211.6068211.0/ CNTWA Eq 4-3
%1158.2021158.0/ OCNTWA Eq 4-4
Equation 4-4 shows that the rest of the substrates are absorbing a significant amount of light at 2.11%. The difference between Equations 4-3 and 4-4 is the amount that the CNT is absorbing per Equation 4-5.
%7053.4047053.0 CNTA Eq 4-5
Note that this result is identical to that reported by Canatu.
The transmission of the CNT layer may then be determined
from Equation 4-6.
952947.00047053.01
1
RAT
Eq 4-6
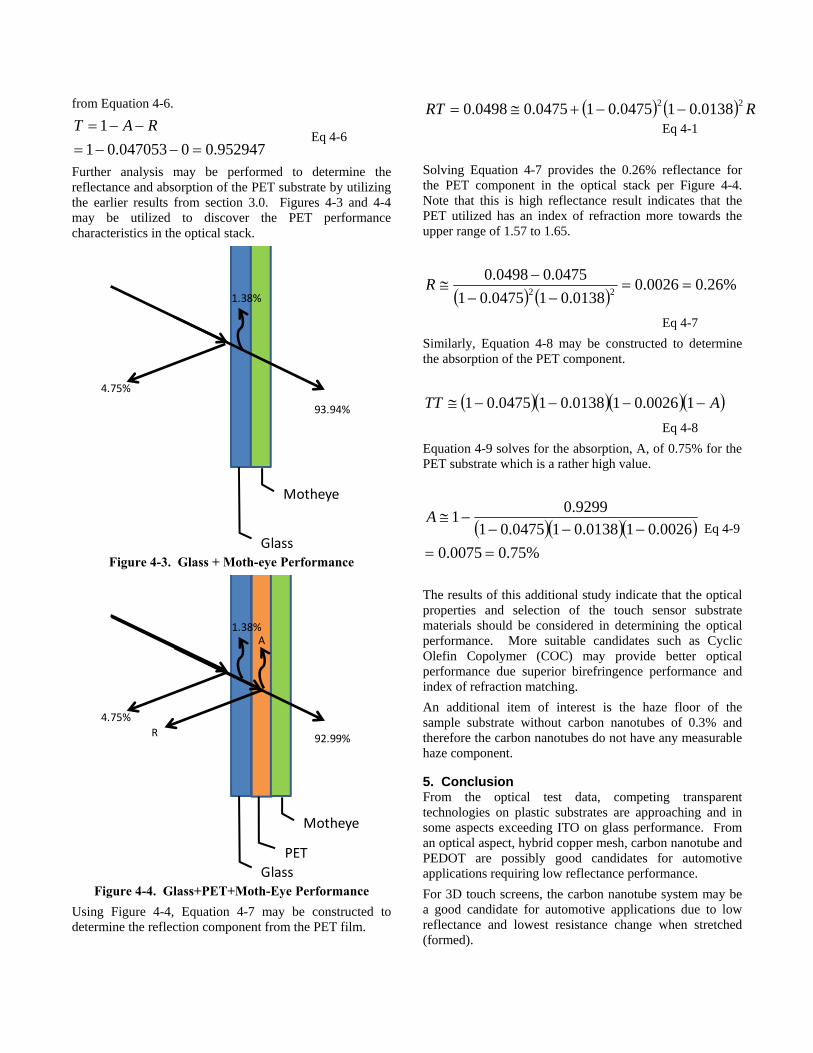
Further analysis may be performed to determine the reflectance and absorption of the PET substrate by utilizing the earlier results from section 3.0. Figures 4-3 and 4-4 may be utilized to discover the PET performance characteristics in the optical stack.
Motheye
Glass
1.38%
4.75%
93.94%
Figure 4-3. Glass + Moth-eye Performance
Motheye
PET
Glass
1.38%
4.75%
92.99%R
A
Figure 4-4. Glass+PET+Moth-Eye Performance
Using Figure 4-4, Equation 4-7 may be constructed to determine the reflection component from the PET film.
RRT 22 0138.010475.010475.00498.0 Eq 4-1
Solving Equation 4-7 provides the 0.26% reflectance for the PET component in the optical stack per Figure 4-4. Note that this is high reflectance result indicates that the PET utilized has an index of refraction more towards the upper range of 1.57 to 1.65.
%26.00026.0
0138.010475.01
0475.00498.022
R
Eq 4-7
Similarly, Equation 4-8 may be constructed to determine the absorption of the PET component.
ATT 10026.010138.010475.01
Eq 4-8
Equation 4-9 solves for the absorption, A, of 0.75% for the PET substrate which is a rather high value.
%75.00075.0
0026.010138.010475.01
9299.01
A Eq 4-9
The results of this additional study indicate that the optical properties and selection of the touch sensor substrate materials should be considered in determining the optical performance. More suitable candidates such as Cyclic Olefin Copolymer (COC) may provide better optical performance due superior birefringence performance and index of refraction matching.
An additional item of interest is the haze floor of the sample substrate without carbon nanotubes of 0.3% and therefore the carbon nanotubes do not have any measurable haze component.
5. Conclusion From the optical test data, competing transparent technologies on plastic substrates are approaching and in some aspects exceeding ITO on glass performance. From an optical aspect, hybrid copper mesh, carbon nanotube and PEDOT are possibly good candidates for automotive applications requiring low reflectance performance.
For 3D touch screens, the carbon nanotube system may be a good candidate for automotive applications due to low reflectance and lowest resistance change when stretched (formed).

For 2.5D curved touch screens, PEDOT, carbon nanotube and hybrid copper mesh may be good candidates for automotive applications. Not considering the almighty cost aspects, each candidate may be technically more suitable depending on the application requirements.
PEDOT – lowest reflectance and haze
Carbon Nanotube – low reflectance and haze with the potential for lower resistivities
Hybrid Copper Mesh – reasonably low reflectance and haze with higher transmission. In addition provides thin tracking borders, integrated tail, and the lowest resistivity for superior touch performance
6. References [1] KODAK HCF Film/ESTAR Base Technical
Datasheet, April 2015. Eastman Kodak Company [2] PEDOT Principles and Applications of an Intrinsically
Conductive Polymer by A. Elschner, S. Kirchmeyer, W. Lovenich, U. Merker and K. Rueter CRC Press
[3] Chandrakant Bhat, David P. Brown, Clement Chen, Bjørn F. Mikladal,Liam Ó Súilleabháin, Erkki L. Soininen, Dewei Tian, Ilkka Varjos, Xiaowei Zhan, Canatu, Helsinki, Finland, LITE-ON TECHNOLOGY CORPORATION, Taipei, Taiwan, R.O.C, 68.3 Curved Mobile Phone Cover with Carbon NanoBud Touch, SID 2015 Proceedings
[4] 2015 SID Symposium, Session 68.3, Power Point Presentation
[5] https://www.fusionuv.com/UV_In_The_News_Fall_2010.aspx

White Paper
Secure Virtualization for an Ever Increasing Vehicle Complexity 2
About Visteon
Visteon is a global company that designs, engineers and manufactures innovative cockpit electronics products and connected car solutions for most of the world’s major vehicle manufacturers. Visteon is a leading provider of driver information and controls, audio and infotainment, and domain controllers; its brands include Lightscape®, OpenAir® and SmartCore™. With corporate offices in Van Buren Township, Michigan, (U.S.); Shanghai, China; and Chelmsford, UK; Visteon has 50 facilities in 21 countries. Learn more at www.visteon.com.
Visteon Corporation One Village Center Dr. Van Buren Township, MI 48188 1-800-VISTEON www.visteon.com Copyright © 2015 Visteon Corporation