TOTVS S.A. - DFP 2016_ENG_final.pdf · TOTVS Digital is a completely new digital environment,...
77
(A free translation of the original in Portuguese) TOTVS S.A. Financial Statements December 31, 2016 and 2015
Transcript of TOTVS S.A. - DFP 2016_ENG_final.pdf · TOTVS Digital is a completely new digital environment,...

(A free translation of the original in Portuguese)
TOTVS S.A. Financial Statements
December 31, 2016 and 2015

2
Contents
Management report and comments on company’s performance ........................................ 3
Independent auditor’s report on the financial statements ..................................................13
Report of the audit committee ...........................................................................................19
Financial statements ........................................................................................................22
Balance sheets .............................................................................................................................. 22
Statement of income ...................................................................................................................... 23
Statement of comprehensive income ............................................................................................ 24
Statements of changes in shareholders’ equity ............................................................................ 25
Statements of cash flow ................................................................................................................ 26
Statements os value added ........................................................................................................... 27
Notes to the financial statements .................................................................................................. 28 1. Operations ............................................................................................................................................ 28
2. Basis of Preparation and Summary of the Main Accounting Practices ................................................. 28
3. Business combination ........................................................................................................................... 35
4. Financial instruments and sensitivity analysis of financial assets and liabilities .................................... 38
5. Cash and cash equivalents ................................................................................................................... 44
6. Trade accounts receivable .................................................................................................................... 45
7. Stocks ................................................................................................................................................... 46
8. Taxes recoverable ................................................................................................................................. 46
9. Income and social contribution taxes .................................................................................................... 46
10. Related-party balances and transactions ............................................................................................ 48
11.Investments .......................................................................................................................................... 51
12 .Property, plant and equipment ............................................................................................................ 53
13. Intangible assets ................................................................................................................................. 55
14. Payroll and labor obligations ............................................................................................................... 59
15. Loans and financing ............................................................................................................................ 59
16. Debentures ......................................................................................................................................... 61
17. Liabilities due to investment acquisition .............................................................................................. 62
18. Provision for contingencies related to legal proceedings .................................................................... 63
19. Equity .................................................................................................................................................. 68
20. Dividends and Interest on Equity......................................................................................................... 69
21. Stock option plan................................................................................................................................. 70
22. Segment information ........................................................................................................................... 72
23. Earnings per share ............................................................................................................................. 73
24. Gross sales revenue .......................................................................................................................... 74
25. Expenses by nature ............................................................................................................................ 74
26. Financial income and expenses .......................................................................................................... 75
27. Private pension plan – defined contribution ........................................................................................ 75
28. Commitments assumed ...................................................................................................................... 76
29. Non-cash items ................................................................................................................................... 76
30. Insurance coverage ............................................................................................................................. 77

3
MANAGEMENT REPORT AND COMMENTS ON COMPANY’S PERFORMANCE
Dear Shareholders,
Pursuant to legal provisions, TOTVS S.A., the largest developer of application software,
collaboration and productivity platforms, hardware and consulting services in Brazil and Latin
America, submits for the appreciation of its shareholders the Management Report and the
corresponding Financial Statements, accompanied by the independent auditor's opinion for the
fiscal years ended December 31, 2016 and 2015, prepared in accordance with the accounting
practices adopted in Brazil.
MESSAGE FROM THE CHAIRMAN OF THE BOARD OF DIRECTORS
In 2016, we reinforced the Company's corporate governance structure with the publication of our first Integrated Reporting and the creation of the Governance and Designation Committee. The main objectives of this committee are to evaluate the adoption of good corporate governance practices and evaluate the appointment of new members to the Board of Directors and to the Senior Executive Team of TOTVS.
We renewed a part of the vice-presidents and officers in 2016, with the hiring of new executives aligned to the culture of a subscription-based company, as part of the Company's succession plan. Today, we have a collaborative, digital and results-driven team that uses technology and business knowledge to promote innovation and understands that the client success is also our success.
We will continue our journey to turn TOTVS into a Single Subscription Company, developing solutions for clients of our clients and increasingly connecting people, things and businesses. As Brazil's leading technology provider, we aim to help companies to rethink the way they do business and how they can become more agile and competitive.
MESSAGE FROM THE CEO
TOTVS registered significant progress in its transition from the licensing model to the software
subscription model in 2016. This progress is evidenced by the 21.4% growth in subscription revenue,
which contributed to the stability of the software revenue in the year, despite the worsening
economic scenario observed throughout the period.
We made progress in integrating Bematech operations and expanded our market share in the
micro segment with the launch of Bemacash, a solution that combines the management software
Fly01 of TOTVS with Bematech’s hardware solutions, and Fly01 Start, an agnostic application that
functions as a point-of-sale integrated with the new generation of payment terminals. We also

4
intensified our investments in the specialization of our solutions, in mobile and cloud, developing
specialized solutions for clients of our clients, thus making the management of their businesses even
more efficient.
We evolved in the alignment of commercial incentives related to the subscription model, as
well as in the elaboration of a new marketing plan, increasingly digital, aiming to increase sales leads,
especially in the subscription model. We also made progress in the development of TOTVS Digital,
to be launched in the first quarter of 2017. TOTVS Digital is a completely new digital environment,
focused on the interaction between TOTVS, channels, salespeople, clients, prospects and partners.
The combination of these investments with the migration to subscription model and the
deterioration of the Brazilian economic scenario resulted in a decrease in the Company's
profitability, especially in the software and services businesses, leading to a reduction in the
contribution margins and, consequently, in the Company's EBITDA in 2016.
We will continue our journey to make TOTVS a “Single Subscription Company”, promoting the
digital transformation in our clients through specialized business solutions, digital platforms, cloud
infrastructure, mobility and the Internet of things. The progress made in the transition to
subscription over the last 18 months, combined with the Company’s investments and the
opportunities in Brazil, give us the confidence that TOTVS is on the right path to resume growth and
profitability in 2017.
ECONOMIC SCENARIO
The estimated global economic growth for 2016 indicated a deceleration compared to 2015,
especially due to the slowdown of the US economy and the growth deceleration in China, which
presented the lowest growth in the last 26 years.
In a context of growing uncertainties about the Brexit's success in June and the elections in
Germany and France in 2017, the growth in the Eurozone also slowed down in 2016, despite the
good performance of the economies of Germany and Spain. Latin America was negatively impacted
by the Mexican growth slowdown and the deterioration of the Brazilian economic scenario.
Brazilian GDP contracted again in 2016, contributing to the closure of 1.3 million formal jobs,
according to the General Register of Employed and Unemployed (Caged). Inflation measured by the
IPC-A closed the year at 6.29%, the lowest rate in the last three years and below the inflation target
set by the Central Bank. The Selic interest rate, which closed 2015 at 14.25%, reached 13.75% in
December 2016, while the US dollar depreciated 17.7% in the year against the Real, the first annual
decline since 2010.

5
The year was also marked by changes in the country's political landscape. In August, after a
nine-month process, President Dilma Rousseff was permanently removed from the Presidency and
replaced by the Vice-President Michel Temer. The appointment of Temer and the Lava-Jato
investigation triggered many changes in the Brazilian political-economic team. Henrique Meirelles
took over the Finance Ministry, replacing Nelson Barbosa, and Eduardo Cunha, then president of
the Chamber of Deputies, was removed from office and replaced by Rodrigo Maia.
Despite the negative effects of the economic crisis, Brazil continues to be a country with many
business opportunities, with a relevant consumer market and strong and independent institutions.
The reduction of internal political tensions, combined with the reduction of interest rates and
inflation, sustain the expectation of recovering from the recession and resume the Brazilian
economic growth for the next two years.
CONSOLIDATED OPERATING AND FINANCIAL PERFORMANCE
The comparability of the consolidated results for the years 2015 and 2016 is impacted by the
following events: (i) the corporate reorganization with Bematech, whose results were consolidated
by TOTVS in November 2015; and (ii) the sale of the wholly-owned subsidiary TOTVS Resultados em
Outsourcing Ltda. ("TOTVS RO"), which had its results consolidated by TOTVS until July 2016.
In 2016, net revenue totaled R$2,183,786 thousand, an increase of 14.4% over the previous
year. This growth was mainly due to the consolidation of Bematech's results in 2015. When
considering the 12-month Bematech result in 2015 (pro-forma), net revenue decreased by 3.5% in
2016, as shown in table below: Consolidated
2016
2015
(Pro-forma)
Variation
Licensing fees 167,759 245,937 -31.8%
Maintenance 1,000,753 965,949 3.6%
Subscription 229,235 188,790 21.4%
Services 541,848 593,571 -8.7%
Hardware 244,191 268,001 -8.9%
Net Revenues from services and sales 2,183,786 2,262,248 -3.5%
The reduction in revenues from licensing fees reflects the 25.8% decrease in the number of
sales. This reduction was mainly due to the following: (i) the downturn in economic activity in Brazil
in 2016, which lengthened the conversion period of the sales cycle, especially among large clients;
and (ii) the migration of a part of the sales pipeline of new clients to the subscription model,
especially smaller clients. In the other hand, the reduction in the average ticket is mainly associated
to sales to existing clients, because of the economic scenario.

6
The growth in maintenance revenue below the average IGP-M of 2016 was mainly due to the
following factors: (i) reduction of license sales in previous periods; (ii) contract cancellations due to
clients’ defaults; and (iii) partial contracts cancellations due to reductions in clients’ staff, especially
large clients.
The growth in subscription revenue was due to the higher share of sales to new small and
medium clients, especially under the TOTVS Intera model (subscription model launched in June
2015). In addition to TOTVS Intera subscription, Bemacash sales also contributed to the growth in
subscription revenue in 2016. Bemacash is a solution that combines TOTVS’ management software
for microenterprises (Fly01 line), contracted under the subscription model, and the automation and
tax hardware solutions from Bematech.
Services revenue in 2016 was negatively affected by: (i) the reduction in software
implementation services, due to the lower sales pace observed during the year; (ii) to the lower
level of sales of consulting services; and (iii) the sale of TOTVS RO in August 2016.
The reduction in hardware revenue in 2016 was mainly due to the downturn in the economic
activity in Brazil and the changes in tax legislation, especially in the state of São Paulo where fiscal
printer were replaced by S@T fiscal equipment, which has a lower unit value.
One of the key elements of the Company's strategy is to offer specialized business solutions by segment
and integrated with back office solutions and the management and business platform. Please find below
the revenue breakdown by industry sector.
The Manufacturing segment accounted for
24.4% of TOTVS’ total net revenue in 2016. This
segment contributes significantly to the
integration of value chains (Ex: Distribution &
Logistics, Retail and Credit). In addition, this
segment has significant opportunities for adoption
of digital technologies related to the era of
advanced manufacturing - the so-called Industry
4.0 - whose purpose is to encourage the digital
integration of different stages of the value chain of
industrial products, from the development to the
use of these products.
The Retail segment accounted for 23.5% of total revenue in 2016. After the corporate
reorganization with Bematech, TOTVS became the largest provider of business solutions to this
segment in Brazil, besides expanding its share of the microenterprises market with the Bemacash,
Fly01 and Fly01 Start solutions.

7
When considering Bematech's 12-month results in 2015 (pro-forma), operating costs and
expenses presented behavior as shown in the following table: Consolidated
2016
2015
(pro-forma)
Variation
Cost of Software (77,284) (83,472) -7.4%
Cost of Support (130,540) (112,248) 16.3%
Cost of Services (506,545) (545,771) -7.2%
Cost of Hardware (162,409) (170,151) -4.6%
Research and Development (326,546) (292,656) 11.6%
Advertising and Marketing Expenses (47,029) (57,261) -17.9%
Commercial Expenses (203,818) (188,386) 8.2%
Commissions Expenses (139,639) (160,111) -12.8%
General and Administrative Expenses (204,532) (228,453) -10.5%
Management Fees (19,176) (29,146) -34.2%
Depreciation and Amortization Expenses (128,350) (114,970) 11.6%
Allowance for Doubtful Accounts (49,197) (38,791) 26.8%
Government Subsidy 10,639 15,991 -33.5%
Other revenues (expenses) 12,893 (4,209) -406.3%
Custos e despesas operacionais (1,971,533) (2,009,634) -1.9%
The cost of software reduction in 2016 reflects the drop in licensing fees sales and the
transition to the subscription model, as partners for complementary solutions are remunerated
according to the business model that TOTVS practices to its clients.
The growth in support costs in the year is mainly due to the investments made in improving
the customer service and support processes, involving adjustments to routines, teams and the
Company's service tools.
The reduction in the cost of services in 2016 is mainly a result of the lower personnel
expenditure, including layoffs for the cost structure adjustments, net of the collective wage
increases that occurred during the year.
The decrease in hardware costs in 2016 is mainly due to the reduction in hardware sales in
the year and to the appreciation of the Brazilian Real against the US dollar, which is an important
variable in the cost formation of components used in the hardware production. It is worth
mentioning that the cost of hardware in 2016 also includes depreciation expenses, in the amount
of R$3,314 thousand (R$3,891 thousand pro-forma in 2015).
The growth in research and development expenses in the year mainly reflects the wage
adjustments resulting from collective bargaining agreements occurred during the year, the
investments in the integration of the solutions portfolio of Bematech to TOTVS.

8
The year-on-year reduction in advertising expenses mainly reflects the revision of the general
marketing plan of the Company and the synergies from integration of marketing activities of TOTVS
and Bematech.
Selling expenses and commissions jointly increased from 15.4% (pro-forma) to 15.7% of net
revenue. These expenses are directly related to the change in sales mix between franchises and own
branches, as well as related to the net revenue mix, due to the different levels of variable
remuneration and commissioning applied to the revenue lines.
The reduction in general and administrative expenses in 2016 is mainly due to the net effect
of wage increases for the period and the lower amount of supplementary provision for
contingencies made during the year, as a consequence of the review of the past outcomes of
lawsuits and the circumstances surrounding the new proceedings in which TOTVS is the defendant.
The decrease in management fees for the year resulted primarily from the optimization of
the Company's administrative structure, the integration of Bematech operations, as well as the
provisioning of bonuses associated to the achievement of the financial and individual goals for the
executives in the period.
The increase in depreciation and amortization expenses in 2016 resulted mainly from the
amortization of intangible assets from the corporate reorganization with Bematech and the
depreciation of investments made in infrastructure such as equipment and installations.
Allowance for doubtful accounts corresponded to 2.3% of net revenue in 2016, compared to
1.7% in 2015 (pro-forma). The increase in this provision is mainly due to the additional provision of
R$17,221 thousand related to the higher credit risk of a large client from the services segment.
Below is a reconciliation of the profit before financial effects and consolidated equity pick and
consolidated pro-forma for the year 2015:
CONCILIATION OF CONSOLIDATED PRO-FORMA PROFIT 2015
(A)
Consolidated
(B)
Bematech
(Nov-Dec)
(C)
Bematech
(Jan-Dec)
(A – B + C)
Consolidated
(pro-forma)
Net revenue from services and sales 1,908,737 80,483 433,994 2,262,248
Operational costs and expenses (1,680,354) (76,374) (405,654) (2,009,634)
Income before financial effects and
equity pick up 228,383 4,109 28,340 252,614
The variation of the financial result from positive R$26,526 thousand in 2015 to negative of
R$36,732 thousand in 2016 is mainly due to: (i) the change in the Company’s capital structure, from
a net cash position in 3Q15 to net debt in 4Q15, due to the payment of R$473,585 thousand in the
corporate reorganization with Bematech in the 4Q15; (ii) the gain from the sale of the minority

9
interest in ZeroPaper in 1Q15; and (iii) the higher Long-term Interest Rate (TJLP) in 2016, which is
used as the inflation adjustment index for the main financial costs of most financing lines and
debentures.
Income Tax and Social Contribution expenses decreased by 61.2% in 2016, totaling R$23,252
thousand. This reduction is mainly due to the decrease in the income before income tax and social
contribution and to the greater representativeness of interest on equity when compared to income
before tax and social contribution in the period.
Net Income decreased by 21.9% in 2016, mainly due to: (i) the 7.1% reduction in profit before
financial effects and equity pick up; (ii) the negative financial result for the year; and (iii) the
reduction of expenses with Income Tax and Social Contribution.
EBITDA(*) for 2016 totaled R$343,917 thousand, 7.4% lower than the Pro-forma EBITDA for
2015. Adjusted EBITDA for 2016 totaled R$358,728 thousand, 21.5% lower than the Pro-forma
Adjusted EBITDA for 2015. The Adjusted EBITDA margin ended 2016 at 16.4%, compared to 20.2%
in 2015. The evolvement of the subscription model, combined with labor inflation and investments
in portfolio integration and customer service, essentially explain this reduction in margin.
(*) EBITDA is a non-accounting measure prepared by the Company and consists of net income for the year, plus
income taxes, financial expenses net of financial revenues, and depreciation and amortization. Adjusted EBITDA represents
EBITDA, net of extraordinary effects related to layoffs from the organizational restructuring, additional provisions for
contingencies and doubtful accounts, reversal of provision for acquisitions, gain on the sale of equity interests, provision
for impairment and expenses related to the corporate reorganization with Bematech.
CAPITAL MARKETS
TOTVS ended the year with capital of R$541,374 thousand, same amount of 2015. At the end
of 2016, the capital stock of the Company was composed of 165,637,727 common shares, with
66.9% of free float, of which 97.4% was held by institutional investors and 92.9% by foreign
investors.
Free float is calculated as the total number of Company shares, excluding shares owned by
Management and related persons, Fundação Petrobras de Seguridade Social (PETROS) and BNDES
Participações (BNDESPar), and those held in treasury.
In 2016, TOTVS shares (BM&FBovespa:TOTS3) depreciated 22.5%, while the Bovespa Index
(IBovespa) increased 38.9%. Average financial volume in 2016 stood at R$18.6 million/day, versus
R$21.0 million registered in the last two years.

10
Dividends for 2015: proposed by the Board of Directors on March 15, 2016, and approved at
the Ordinary General Meeting on April 26, 2016, dividends for the year totaled R$66,579 thousand,
to shareholders of TOTVS as of April 26, 2016. The dividends were paid on May 11, 2016.
Interest on equity for 2016: On August 1, 2016, the board of directors approved the payment
of interest on equity of R$43,605 thousand to its shareholders related to the first semester of 2016,
having made entitled do the benefit the shareholders of TOTVS as such on August 4, 2016. The
interest on equity were paid on August 24, 2016.
On December 16, 2016, the board of directors approved the payment of interest on equity of
of R$40,615 thousand to its shareholders related to the second semester of 2016, having made
entitled do the benefit the shareholders of TOTVS as such on December 21, 2016. The interest on
equity were paid on May 10, 2017.
The payment regarding the fiscal year of 2016 and were imputed to the minimum mandatory
dividend in accordance with Article 34 of TOTVS’ Bylaws.
Interest on equity for 2015: On December 18, 2015, the board of directors approved the
payment of interest on equity of R$31,319 thousand for the second semester of 2015, having made
entitled do the benefit the shareholders of TOTVS as such on December 21, 2015. This interest on
equity was paid on January 13, 2016.
The payment is for the second half of 2015 and the amount was calculated towards the
minimum mandatory dividend in accordance with Article 34 of the Bylaws of TOTVS.
CORPORATE GOVERNANCE
Novo Mercado: TOTVS was the first Brazilian software company to join the segment that
meets the highest corporate governance standards of the São Paulo Stock Exchange
(BM&FBovespa).
Board of Directors: TOTVS’ Board of Directors is composed of 9 members, of which 8 of them
are external and independent members, in accordance with Novo Mercado regulations. 11 officers
compose the Executive Board. The list containing the names, position and a brief resume of the
Board members and Executive Officers is available on the Company´s Reference Form, in
http://ir.totvs.com.
Audit Committee: It is an advisory body to support the Board of Directors, and its mission is to monitor, evaluate and ensure the best operation of processes, management of internal and external audit mechanisms and controls related to risk management and consistency of financial policies with the strategic guidelines and business risk profile. Currently, the Audit Committee is composed

11
of 4 independent external members elected by the Board of Directors, chaired by an independent member of the Board of Directors.
Remuneration Committee: assists the Board in setting compensation policies and benefits
for directors, officers and participants. The company currently has 4 members elected by the Board
of Directors, of which 1 is external, and is chaired by an independent member of the Board of
Directors.
Governance and Designation Committee: Composed of 3 members of the Board of Directors,
its main duties are to promote changes in the Company's corporate governance, to evaluate the
adoption of good practices and to select and appoint members to the Board of Directors and the
Board of Executive Officers.
Arbitration: according to Novo Mercado Regulations and the Company’s Bylaws, the
controlling shareholder, administrators, the Company itself and the Fiscal Council members should
undertake to settle all and any dispute or controversy arising from or relating to Novo Mercado
Regulations, the Novo Mercado Adhesion Agreement, Arbitration Clauses, especially, regarding its
application, validity, effectiveness, interpretation, breach and their effects through arbitration.
Disputes regarding the sale of the Company’s control shall also be solved through arbitration.
Management Statement: in accordance with subparagraphs V and VI, Article 25 - CVM
Instruction 480/09, the officers of TOTVS declare that they discussed, reviewed and agreed with the
views expressed in the independent auditors' report and financial statements for the fiscal year
ended on December 31, 2016.
RELATIONSHIP WITH INDEPENDENT AUDITORS
The Company’s policy on engaging services not related to external audit by independent
auditors is grounded on the principles that preserve their autonomy. These principles consist of
internationally accepted standards, namely: (a) auditors must not audit their own work; (b) auditors
must not exercise management functions at their clients; and (c) auditors must not create conflicts
of interest with their clients.
Procedures adopted by the Company pursuant to item III, article 2 of CVM Instruction 381/03:
The Company and its subsidiaries adopt as a formal procedure, before hiring independent auditors
for professionals services not related to external audit, ensuring that the execution of these other
services does not affect their autonomy and objectivity necessary for the performance of
independent audit services, and obtaining the approval of their Audit Committee. In addition, formal
statements are requested from the auditors regarding their autonomy in the execution of services
not related to audit.
12
Other services were provided in addition to those related to the audit of financial statements
in 2016. The fees for these services totaled R$202,614 thousand and corresponded to 15.65% of
total fees related to external audit.
ACKNOWLEDGEMENTS
We thank all those who contributed to the success of TOTVS in 2016, especially our clients,
employees, partners and shareholders.

13
INDEPENDENT AUDITOR’S REPORT ON THE FINANCIAL STATEMENTS
To the Board of Directors and Stockholders TOTVS S.A. Opinion
We have audited the accompanying parent company financial statements of TOTVS S.A. ("Company"), which comprise the balance sheet as at December 31, 2016 and the statements of income, comprehensive income, changes in equity and cash flows for the year then ended, and notes to the financial statements, including a summary of significant accounting policies. We have also audited the accompanying consolidated financial statements of TOTVS S.A. and its subsidiaries ("Consolidated"), which comprise the consolidated balance sheet as at December 31, 2016 and the consolidated statements of income, comprehensive income, changes in equity and cash flows for the year then ended, and notes to the financial statements, including a summary of significant accounting policies. Opinion on the parent company financial statements In our opinion, the parent company financial statements referred to above present fairly, in all material respects, the financial position of TOTVS S.A. as at December 31, 2016, and its financial performance and cash flows for the year then ended, in accordance with accounting practices adopted in Brazil. Opinion on the consolidated financial statements In our opinion, the consolidated financial statements referred to above present fairly, in all material respects, the financial position of TOTVS S.A. and its subsidiaries as at December 31, 2016, and their financial performance and cash flows for the year then ended, in accordance with accounting practices adopted in Brazil and with the International Financial Reporting Standards (IFRS) as issued by the International Accounting Standards Board (IASB). Basis for opinion
We conducted our audit in accordance with Brazilian and International Standards on Auditing. Our responsibilities under those standards are further described in the Auditor's Responsibilities for the Audit of the Parent Company and Consolidated Financial Statements section of our report. We are independent of the Company and its subsidiaries in accordance with the ethical requirements established in the Code of Professional Ethics and Professional Standards issued by the Brazilian Federal Accounting Council, and we have fulfilled our other ethical responsibilities in accordance with these requirements. We believe that the audit evidence we have obtained is sufficient and appropriate to provide a basis for our audit opinion.

14
Key audit matters
Key audit matters are those matters that, in our professional judgment, were of most significance in our audit of the parent company and consolidated financial statements of the current period. These matters were addressed in the context of our audit of the parent company and consolidated financial statements as a whole, and in forming our opinion thereon, and we do not provide a separate opinion on these matters.
Why it is a key audit matter How the matter was addressed in the audit
Measurement of revenue from consulting services or implementation software services rendered (Notes 2.8 and 24)
We decided to focus on this area in our audit because the measurement of revenue from consulting or software implementation services, which represents 3% of the total revenues for 2016, requires management to use estimates and critical judgment that are mainly related to the identification of the hours to be incurred up to the conclusion of the contracted services. This matter affects the measurement of unrecognized revenue in the year, yet to be billed.
Regarding the recognition of unbilled revenue, we performed the following procedures during our audit:
• We obtained an understanding of the main controls related to the revenue recognition and tested their effectiveness;
• We analyzed related documents, such as contracts and bills, and the subsequent financial settlement, which are evidence that can support the effective performance of the service, the proper accrual basis, and the correct amount of the related revenue;
• For the tested controls, we confirmed that the management's calculations of recognized revenue included the relevant aspects of the contracts' terms; and
• We inquired the Company's management and the commercial team in order to assess (i) the reasonableness of the data and criteria adopted to estimate revenue, and (ii) the uniformity of the criteria in comparison with those adopted in the previous year. In addition, we tested the comparison of this estimate with the revenue billed in the following month.
We consider that the measurement of the unbilled revenue and the estimates involved in the recording in the proper period are supported by data and corresponding documents.

15
Why it is a key audit matter How the matter was addressed in the audit
Provision for contingencies (Note 18)
As disclosed in the parent company and consolidated financial statements, the Company and its subsidiaries are party to legal and administrative civil, labor, and tax proceedings filed mainly by former employees, service providers, tax and labor authorities, and customers. The total accounted for, related to proceedings whose likelihood of loss is probable, amounts to R$ 102,225 thousand. We decided to focus on this matter in our audit because of the critical judgment necessary to determine the likelihood of loss attributed to each proceeding and the estimated amount of loss for them. This judgment as well as the criteria used to establish these amounts involve consideration about the complexity of the Brazilian legislation, of the applicable case law, and of the legal system itself. Any change in projections, judgment, or criteria used to attribute the amount may significantly affect the financial statements.
Regarding the provision for contingencies, we performed the following procedures during our audit, among others:
• We obtained an understanding of the main related internal controls and tested their effectiveness;
• We reviewed documents, on a sample basis, containing information related to contingent matters and with the respective proceedings involved;
• We obtained a confirmation from external legal advisors in order to validate the amounts as well as the likelihood of positive and/or negative outcome for each proceeding; and
• When necessary, we obtained a second opinion from legal advisors other than those who are working on the matters in order to compare them as well as to analyze the defense's arguments and/or thesis.
Because of these procedures, we consider that the criteria used by management to measure the provision for contingencies are adequate, and that the opinions and judgment used are consistent with the assessment of legal advisors.
Intangible assets, including goodwill - Impairment (Note 13.2)
Management assess the impairment of intangible assets, including goodwill. This assessment requires critical judgment regarding the determination of the future cash flows, which is projected as from the business plan approved by the Board of Directors. We decided to focus on this area in our audit because this assessment involves judgment regarding the financial and economic assumptions.
Regarding the measurement and presentation of intangible assets, including goodwill, in the context of an audit, we performed the following procedures, with the support of our internal experts on assessment: • Understanding of the main related controls and
testing of their effectiveness;
• Obtaining of management's business plan, as approved by the Board of Directors, regarding the acquired entity, which is the object of the generation of intangible assets and goodwill, and comparison with the assumptions used in the assessment;
• Comparison of the base year's balances used in the projection with the historical accounting information;
• Inquiring about the reasonableness of the methodology and of the main financial and

16
Why it is a key audit matter How the matter was addressed in the audit
economic assumptions used, such as discount rates, inflation, growth of income and expenses, investment, among others;
• Recalculation tests involving the projections prepared by management.
Our audit procedures evidenced that the assumptions used by management are reasonable and consistent with observable data and information.
Other matters
Statements of Value Added
The parent company and consolidated Statements of Value Added for the year ended December 31, 2016, prepared under the responsibility of the Company's management and presented as supplementary information for IFRS purposes, were submitted to audit procedures performed in conjunction with the audit of the Company's financial statements. The presentation of these Statements of Value Added is required by the Brazilian corporate legislation for listed companies. For the purposes of forming our opinion, we evaluated whether these statements are reconciled with the financial statements and accounting records, as applicable, and if their form and content are in accordance with the criteria defined in Technical Pronouncement CPC 09 - "Statement of Value Added". In our opinion, these Statements of Value Added have been properly prepared in all material respects, in accordance with the criteria established in the Technical Pronouncement, and are consistent with the parent company and consolidated financial statements taken as a whole.
Other information accompanying the parent company and consolidated financial statements and the auditor's report
The Company's management is responsible for the other information that comprises the Management Report. Our opinion on the parent company and consolidated financial statements does not cover the Management Report, and we do not express any form of audit conclusion thereon. In connection with the audit of the parent company and consolidated financial statements, our responsibility is to read the Management Report and, in doing so, consider whether this report is materially inconsistent with the financial statements or our knowledge obtained in the audit or otherwise appears to be materially misstated. If, based on the work we have performed, we conclude that there is a material misstatement in the Management Report, we are required to report that fact. We have nothing to report in this regard.

17
Responsibilities of management and those charged with governance for the parent company and consolidated financial statements
Management is responsible for the preparation and fair presentation of the parent company financial statements in accordance with accounting practices adopted in Brazil and of the consolidated financial statements in accordance with accounting practices adopted in Brazil and with the IFRS as issued by the IASB, and for such internal control as management determines is necessary to enable the preparation of financial statements that are free from material misstatement, whether due to fraud or error. In preparing the parent company and consolidated financial statements, management is responsible for assessing the ability of the Company and its subsidiaries to continue as going concerns, disclosing, as applicable, matters related to going concern and using the going concern basis of accounting unless management either intends to liquidate the Company and its subsidiaries or to cease operations, or has no realistic alternative but to do so. Those charged with governance are responsible for overseeing the financial reporting process of the Company and its subsidiaries. Auditor's responsibilities for the audit of the parent company and consolidated financial statements
Our objectives are to obtain reasonable assurance about whether the parent company and consolidated financial statements as a whole are free from material misstatement, whether due to fraud or error, and to issue an auditor's report that includes our opinion. Reasonable assurance is a high level of assurance, but is not a guarantee that an audit conducted in accordance with Brazilian and International Standards on Auditing will always detect a material misstatement when it exists. Misstatements can arise from fraud or error and are considered material if, individually or in the aggregate, they could reasonably be expected to influence the economic decisions of users taken on the basis of these parent company and consolidated financial statements. As part of an audit in accordance with Brazilian and International Standards on Auditing, we exercise professional judgment and maintain professional skepticism throughout the audit. We also: • Identify and assess the risks of material misstatement of the parent company and consolidated financial
statements, whether due to fraud or error, design and perform audit procedures responsive to those risks, and obtain audit evidence that is sufficient and appropriate to provide a basis for our opinion. The risk of not detecting a material misstatement resulting from fraud is higher than for one resulting from error, as fraud may involve collusion, forgery, intentional omissions, misrepresentations, or the override of internal control.
• Obtain an understanding of internal control relevant to the audit in order to design audit procedures that
are appropriate in the circumstances, but not for the purpose of expressing an opinion on the effectiveness of the internal control of the Company and its subsidiaries.
• Evaluate the appropriateness of accounting policies used and the reasonableness of accounting
estimates and related disclosures made by management.
18
• Conclude on the appropriateness of management's use of the going concern basis of accounting and, based on the audit evidence obtained, whether a material uncertainty exists related to events or conditions that may cast significant doubt on the ability of the Company and its subsidiaries to continue as going concerns. If we conclude that a material uncertainty exists, we are required to draw attention in our auditor's report to the related disclosures in the parent company and consolidated financial statements or, if such disclosures are inadequate, to modify our opinion. Our conclusions are based on the audit evidence obtained up to the date of our auditor's report. However, future events or conditions may cause the Company and its subsidiaries to cease to continue as going concerns.
• Evaluate the overall presentation, structure and content of the parent company and consolidated
financial statements, including the disclosures, and whether the parent company and consolidated financial statements represent the underlying transactions and events in a manner that achieves fair presentation.
• Obtain sufficient appropriate audit evidence regarding the financial information of the entities or
business activities within the Group to express an opinion on the consolidated financial statements. We are responsible for the direction, supervision and performance of the group audit. We remain solely responsible for our audit opinion.
We communicate with those charged with governance regarding, among other matters, the planned scope and timing of the audit and significant audit findings, including any significant deficiencies in internal control that we identify during our audit. We also provide those charged with governance with a statement that we have complied with relevant ethical requirements regarding independence, and to communicate with them all relationships and other matters that may reasonably be thought to bear on our independence, and where applicable, related safeguards. From the matters communicated with those charged with governance, we determine those matters that were of most significance in the audit of the parent company and consolidated financial statements of the current period and are therefore the key audit matters. We describe these matters in our auditor's report unless law or regulation precludes public disclosure about the matter or when, in extremely rare circumstances, we determine that a matter should not be communicated in our report because the adverse consequences of doing so would reasonably be expected to outweigh the public interest benefits of such communication. São Paulo, February 20, 2017 PricewaterhouseCoopers Ricardo Novaes de Queiroz Auditores Independentes Contador CRC 1DF012332/O-2 "S" SP CRC 2SP000160/O-5

(A free translation of the original in Portuguese)
19
REPORT OF THE AUDIT COMMITTEE
Introduction
In accordance with its charter, approved by the Board of Directors on February 27, 2015, the Audit Committee
is charged with ensuring that the internal and external audit processes and management, as well as the risk
management mechanisms and controls are functioning, ensuring the alignment of financial policies with the
strategic guidelines and risk profile of the business, and ensuring the quality and integrity of the Company's
financial statements, making recommendations to the Management regarding the approval of financial
reports and actions to improve internal controls and reduce risks.
The Audit Committee is formed by four members (three independent members and one external
independent member), who are currently in full exercise of their terms of office.
Activities of the Audit Committee
The Committee held nine (9) ordinary meetings and three (3) extraordinary meetings in 2016 and one (1)
ordinary meeting in 2017 to approve the financial statements. In this period, the Audit Committee also
periodically conducted private meetings with the chief legal officer, the risk, internal controls and compliance
officer and internal audit, as well as meetings with the human resources officer, the independent audit firm
and meetings among its members, totaling ten (10) meetings. At each ordinary meeting of the Board of
Directors, a report on the Committee’s activities in the previous period was presented by the Committee
Chairman and discussed with the directors.
Topics discussed by the Audit Committee
The Audit Committee held meetings with vice presidents and executive officers of the Company, internal
auditors, independent auditors and external advisors to understand the processes, internal controls, risks,
possible weaknesses and plans for improvement, and submitted its recommendations to the Board of
Directors and Management of the Company. A total of eighty-three (83) meetings were conducted to discuss
forty-two (42) topics. The main aspects discussed were:
Independent Audit - Discussing the plan, scope and main conclusions from the quarterly reviews (ITR) and issuing a report
on the financial statements for fiscal year 2016 (DFP 2016);
- Weaknesses and recommendations for improvements mentioned in the internal controls report and
the respective action plans of internal areas to correct or improve the aspects;
- Monitoring the preliminary and final results for issuing the ISAE 3402/2016 report;
- Learning about new audit procedures, especially the new audit report format;
- Annual cycle of appraisal of the performance of independent auditor;
- Selecting and discussing proposals and making recommendations regarding the hiring of
independent auditors for next year.

(A free translation of the original in Portuguese)
20
Internal Audit - Discussing the risk matrix and approval of internal audit schedule for the 2016 cycle; - Monitoring the reports on the work of internal audit issued for own units and franchises, including
weaknesses, justifications and correction plans;
- Monitoring compliance with timetable, scope of hours and result of investigations carried out in
special tasks;
- Monitoring the assessment made by independent advisory on the quality of processes and sufficiency
of resources available to internal audit and subsequent monitoring of the implementation of
improvement actions recommended;
- Annual cycle of appraisal of the performance of the head of the internal audit department.
Internal controls, corporate risk management, compliance and ombudsman - Monitoring the internal controls plan to map processes, key controls and indicators; - Discussing and evaluating the new map of strategic risks of the company, monitoring the mitigation
plans together with those responsible for their execution, and the respective description of the risk
factors in the Reference Form;
- Monitoring action plans to improve the information technology general controls (ITGC), access
profiles and the segregation of functions;
- Discussing and monitoring the pilot project to reformulate the company’s management system by
processes and indicators;
- Monitoring the implementation of action plans to comply with the integrity program established by
the company’s management;
- Monitoring the adoption of compliance policies and practices by managers and employees to ensure
compliance with the anticorruption law;
- Monitoring the results of the assessment made by independent advisory to review the integrity
program in the companies acquired and the respective action plan for correcting the processes;
- Monitoring the results of the Net Promoter Score (NPS) survey and management’s initiatives to
improve client satisfaction with the services provided by the company.
Financial management, provisions and indicators - Discussing the model and standardization of the company’s budget management; - Discussing, streamlining and monitoring the application of the credit analysis policy, collections
procedures and estimates of losses on doubtful accounts;
- Monitoring the financial management model of the software and hardware businesses;
- Evaluating compliance with CVM Resolution 594 regarding provisions and contingent liabilities and
assets;
- Discussing and monitoring the main lawsuits and the management’s judgment on possible outcomes.
Monitoring the evolution of the environment of controls in the legal department, mainly related to
the management of lawsuits;
- Discussing and monitoring the procedures adopted to review annual impairment tests;
- Financial impacts caused by changes in law (Lei do Bem);
- Monitoring the methodology and controls for managing service projects.
Corporate Governance - Giving opinion for the Board of Directors approval of quarterly and annual financial statements;
- Evaluating and recommending approval of proposals for dividends and interest on equity;

(A free translation of the original in Portuguese)
21
- Discussing about improvements to the long-term incentive model for company executives from the
perspective of the risks of retention, motivation and alignment with the company’s vision and
strategy;
- Discussing the terms used in notices, material fact notices and earnings release to the market;
- Monitoring and making recommendations to the Board of Directors and the Management on
initiatives and operations involving mergers and acquisitions, as well as assessment of operating risks;
- Discussing and monitoring the process for updating the Reference Form;
- Discussing the content and making recommendations on the proposed Integrated Report of the
company;
- Monitoring the queries and management’s responses to letters from regulatory agencies;
- Reviewing and making improvements to rules for rolling out the crisis management plan;
- Reviewing and discussing about a new hierarchy for policies, standards, procedures, governance and
powers for approval of rules, as well as reviewing existing policies;
- Discussing the terms and scope of the policy on transactions with related parties;
- Monitoring the activities of the Conduct and Ethics Committee, evaluating the complaints received
by the channel and the measures adopted by Management.
- Taking stock of the activities and evaluating the topics discussed in the tax committee.
- Management and governance aspects of TOTVS franchise network;
- Annual self-assessment cycle of the audit committee.
Audit Committee Report
2016 Annual Financial Statements:
The members of the Audit Committee of TOTVS S.A., in the exercise of their legal duties and
responsibilities, pursuant to the Charter of the Audit Committee, examined and analyzed the financial
statements, accompanied by the independent auditors report and the annual management report for the
fiscal year ended December 31, 2016 (“2016 Annual Financial Statements”) and, considering the information
provided by the Company management and by PwC Auditores Independentes, as well as the proposed
allocation of the earnings from fiscal year 2016, unanimously concluded that these adequately reflect, in all
material aspects, the equity and financial position of the Company and its subsidiaries, and recommend the
Board of Directors of the Company to approve said documents and submit them to the Annual Shareholders
Meeting, in accordance with Brazilian Corporation Law.
São Paulo, February 20, 2017
Maria Helena Santana
Chair of the Audit Committee and member of the Board of Directors
Danilo Silva Member of the Audit Committee and the Board of Directors Gilberto Mifano
Member of the Audit Committee
Mauro Rodrigues da Cunha Member of the Audit Committee and the Board of Directors

(A free translation of the original in Portuguese)
22
(A free translation of the original in Portuguese)
TOTVS S.A.
Balance sheets as at December 31, 2016 and 2015 (In thousands of reais)
The accompanying notes are an integral part of these financial statements.
Parent Company Consolidated Parent Company Consolidated
Assets 2016 2015 2016 2015 Liabilities and equity 2016 2015 2016 2015
Current assets 565,602 731,220 951,736 1,157,673 Current liabilities 465,130 475,288 624,197 658,683
Cash and cash equivalents (Note 5) 112,504 314,405 214,772 426,415 Payroll and labor obligations (Note 14) 105,243 99,190 140,539 133,152 Marketable securities (Note 17) 32,165 17,488 74,027 75,213 Trade accounts payable 41,844 37,311 73,553 86,932 Trade accounts receivable (Note 6) 394,382 401,750 569,370 565,002 Loans and financing (Note 15) 180,294 168,643 196,012 177,514 Allowance for doubtful accounts (Note 6) (84,293) (56,551) (105,183) (75,860) Taxes payable 17,293 11,293 28,141 18,923 Stocks (Nota 7) - - 28,219 44,407 Commissions payable 38,343 52,172 43,198 56,579 Taxes recoverable (Note 8) 72,993 27,673 122,521 81,284 Dividends payable (Note 20) 41,097 32,428 41,561 32,885 Other assets 37,851 26,455 48,010 41,212 Liabilities from acquisition of investments (Note 17) 38,960 24,492 80,822 82,220 Debentures (Note 16) - 49,473 12,111 61,915 Other liabilities 2,056 286 8,260 8,563 Non-current assets 1,642,705 1,630,795 1,492,176 1,504,402
Marketable securities (Note 17) 4,676 28,780 11,137 39,534 Non-current liabilities 521,989 649,041 598,799 765,660
Trade accounts receivable (Note 6) 35,842 38,676 36,913 40,953 Loans and financing (Note 15) 339,207 466,532 365,729 500,795
Receivables from related parties (Note 10) 1,644 3,622 - - Debentures (Note 16) 58,784 49,429 78,550 82,371
Taxes recoverable (Note 8) - - 21,572 17,881 Provision for losses on investments (Note 11) 1,208 584 - - Deferred income and social contribution taxes
(Note 9) 30,449 16,954 88,658 63,507 Payables to related parties (Note 10) 13,247 15,023 - -
Financial assets at fair value (Note 4) - - 56,800 68,044 Provision for contingencies related to legal proceedings (Note 18) 85,323 70,392 102,225 90,507
Judicial deposits (Note 18) 29,846 31,688 40,903 43,407 Liabilities from acquisition of investments (Note 17) 17,828 47,065 45,886 88,272 Other assets 23,420 10,405 30,437 18,466 Other liabilities 6,392 16 6,409 3,715
Equity (Note 19) 1,221,188
1,237,686 1,220,916 1,237,732
Investments (Note 11) 976,201 1,001,473 1,350 - Capital 541,374 541,374 541,374 541,374 Property, plant and equipment (Note 12) 154,126 86,235 176,270 113,598 Treasury shares (73,443) (71,012) (73,443) (71,012) Intangible assets (Note 13) 386,501 412,962 1,028,136 1,099,012 Capital reserves 162,024 159,213 162,024 159,213 Other comprehensive income results 1,785 21,329 1,785 21,329 Retained profit reserve 582,073 520,203 582,073 520,203 Proposed additional dividend 7,375 66,579 7,375 66,579 Non-controlling interests - - (272) 46
Total assets 2,208,307 2,362,015 2,443,912 2,662,075 Total liabilities and equity 2,208,307 2,362,015 2,443,912 2,662,075

(A free translation of the original in Portuguese)
23
(A free translation of the original in Portuguese)
TOTVS S.A.
Statement of income Years ended December 31, 2016 and 2015 (In thousands of reais, except by the earnings per share)
Parent Company Consolidated
2016 2015 2016 2015
Licensing fees 125,873 198,511 167,759 239,979
Maintenance 853,505 828,741 1,000,753 918,556
Subscriptions 124,166 86,113 229,235 140,820
Services 416,144 444,480 541,848 557,718
Hardware - - 244,191 51,664
Net revenue from services and sales (Note 24) 1,519,688 1,557,845 2,183,786 1,908,737
Cost of software (66,772) (69,527) (77,284) (75,399)
Cost of support (75,448) (83,974) (130,540) (89,722)
Cost of services (401,760) (388,881) (506,545) (507,298)
Cost of hardware - - (162,409) (34,050)
Gross profit 975,708 1,015,463 1,307,008 1,202,268
Operating income (expenses)
Research and development (231,638) (224,041) (326,546) (267,013)
Advertising expenses (35,391) (38,243) (47,029) (49,281)
Selling expenses (121,547) (106,515) (203,818) (152,230)
Commissions (Note 25) (118,758) (138,075) (139,639) (155,981)
General and administrative expenses (140,729) (156,588) (204,532) (187,277)
Management fees (Note 10) (15,673) (19,280) (19,176) (23,476)
Depreciation and amortization (Notes 12 and 13) (79,278) (70,894) (128,350) (103,077)
Allowances for doubtful accounts (Note 6) (41,542) (30,192) (49,197) (34,562)
Government subsidy - - 10,639 794
Other net operating income (expenses) 9,776 (5,853) 12,893 (1,782)
Income before financial effects and equity pickup 200,928 225,782 212,253 228,383
Financial income (Note 26) 48,400 97,627 74,251 121,165
Financial expenses (Note 26) (80,029) (82,107) (110,983) (94,639)
Equity pick-up (Note 11) (4,737) (4,628) - (75)
Income before income tax and social contribution 164,562 236,674 175,521 254,834
Income tax and social contribution current (15,329) (47,025) (38,260) (69,250)
Income tax and social contribution deferred 3,425 5,880 15,008 9,362
Total of Income tax and social contribution (11,904) (41,145) (23,252) (59,888)
Net income for the year 152,658 195,529 152,269 194,946
Net income attributable to the owners of company 152,658 195,529 152,658 195,529
Net income attributable to non-controlling interest - - (389) (583)
Basic earnings per thousand shares (in Reais) 0.93 1.20 0.93 1.20
Diluted earnings per thousand shares (in Reais) 0.93 1.19 0.93 1.19
The accompanying notes are an integral part of these financial statements.

(A free translation of the original in Portuguese)
24
TOTVS S.A.
Statements of comprehensive income Years ended December 31, 2016 and 2015 (In thousands of Reais )
Parent Company
2016 2015
Net income for the year 152,658 195,529
Cumulative adjustment for currency exchange (29,610) 32,272
Deferred income tax 10,066 (10,972)
Cumulative adjustment for currency exchange, net of tax effects (19,544) 21,300
Comprehensive income for the year 133,114 216,829
Consolidated
2016 2015
Net income for the year 152,269 194,946
Cumulative adjustment for currency exchange (29,610) 32,272
Deferred income tax 10,066 (10,972)
Cumulative adjustment for currency exchange, net of taxes
effects (19,544) 21,300
Comprehensive income for the year 132,725 216,246
Net income for the year attributable to controlling shareholders 133,114 216,829
Attributable to non-controlling interest (389) (583)
The accompanying notes are an integral part of these financial statements.

(A free translation of the original in Portuguese)
25
TOTVS S.A. (A free translation of the original in Portuguese) Statements of changes in shareholders´ equity Years ended December 31, 2016 and 2015 (In thousands of reais)
Capital
Premium on
purchase
from non-
controlling
Capital Reserves
Other
Comprehensive
Income
Retained
earnings
Proposed
additional
dividend Equity
Non-
Controlling
Consolidated
Equity
Of
Capital Legal
Profit
retention
Treasury
Share
Balance at December 31, 2014 526,592 (25,518) 118,011 61,961 389,807 (52,212) 29 - 97,704 1,116,374 1,688 1,118,062
Capital transactions with partners -
14,782 - 67,703 - - - - - - 82,485 - 82,485
Stock option plan - - 3,992 - - - - - - 3,992 - 3,992
Dividends - - - - - - - - (97,704) (97,704) (339) (98,043)
Proposed Additional Dividend - - - - - - - (66,579) 66,579 - - -
Interest on capital – distributed - - - - - - - (60,515) - (60,515) - (60,515)
Treasury shares - - (4,975) - - (18,800) - - - (23,775) - (23,775)
Acquisitions of subsidiaries - - - - - - - - - - (1,021) (1,021)
Total comprehensive income - - - - - - - - - - 301 301
Net income for the year - - - - - - 21,300 195,529 - 216,829 (583) 216,246
Other comprehensive income - - - - - - - 195,529 - 195,529 (583) 194,946
Cumulative adjustment for currency
exchange - - - - - - 21,300 - - 21,300 - 21,300
Reserves set up - - - 9,776 58,659 - - (68,435) - - - -
Balance at December 31, 2015 541,374 (25,518) 184,731 71,737 448,466 (71,012) 21,329 - 66,579 1,237,686 46 1,237,732
Capital transactions with partners
Stock option plan - - 2,811 - - - - - - 2,811 - 2,811
Dividends from the previous year - - - - - - - - (66,579) (66,579) - (66,579)
Dividens and interest on capital
Prescribed - - - - - - - 807 - 807 - 807
Dividends - - - - - - - (7,375) 7,375 - - -
Interest on capital – distributed - - - - - - - (84,220) - (84,220) - (84,220)
Treasury shares - - - - - (2,431) - - - (2,431) - (2,431)
Acquisitions of non-controlling interests - - - - - - - - - - - -
Acquisitions of subsidiaries - - - - - - - - - - 71 71
Total comprehensive income - - - - - - (19,544) 152,658 - 133,114 (389) 132,725
Net income for the year - - - - - - - 152,658 - 152,658 (389) 152,269
Cumulative adjustment for currency
exchange - - - - - - (19,544) - - (19,544) - (19,544)
Reserves set up - - - 7,633 54,237 - - (61,870) - - -
Balance at December 31, 2016 541,374 (25,518) 187,542 79,370 502,703 (73,443) 1,785 - 7,375 1,221,188 (272) 1,220,916
The accompanying notes are an integral part of these financial statements.

(A free translation of the original in Portuguese)
26
TOTVS S.A. Statement of cash flow Years ended December 31, 2016 and 2015
(In thousands of Reais)
Parent Company Consolidated
2016 2015 2016 2015
Cash flow from operating activities
Profit before taxation income and social contribution 164,562 236,674 175,521 254,834
Adjustments for:
Depreciation and amortization ( Notes 12 and 13) 79,278 70,894 131,664 103,660
Stock option plan (Note 21) 2,811 3,992 2,811 3,992
Losses (gains) on disposal of fixed assets (7,169) 2,474 (8,005) (1,980)
Allowance for doubtful accounts ( Note 6) 41,542 30,192 49,197 34,562
Equity pick up (Note 11) 4,737 4,628 - 75
Provision for contingencies and legal obligations 32,635 59,538 32,616 56,833
Provision (reversal) for other obligations - (1,388) 2,376 (6,388)
Interest and monetary and exchange variations, net 65,080 63,868 68,400 57,015
Changes in operating assets and liabilities:
Trade accounts receivable (3,598) (24,261) (20,202) (42,110)
Stock - - 12,234 (2,018)
Other assets (20,013) (2,891) (14,447) 5,875
Judicial deposits 1,842 (9,877) 2,504 (9,046)
Labor and social security liabilities 6,053 1,965 7,387 (2,837)
Taxes recoverable (45,320) (26,258) (44,928) (37,886)
Suppliers 3,833 8,662 (14,079) 10,377
Commission payable (13,829) (3,959) (13,381) (2,816)
Taxes payable (2,810) (27,648) (11,946) (40,327)
Other accounts payable (16,325) (944) (27,020) 10,829
Cash flow provided by operations 293,309 385,661 330,702 392,644
Interest paid (43,725) (46,163) (53,098) (46,828)
Income tax and social contributions paid (6,519) (20,237) (17,096) (32,649)
Net cash provided by operating activities 243,065 319,261 260,508 313,167
Cash flow provided by investment activities
Capital increase in subsidiaries (Note 11) (34,211) (67,726) (1,439) -
Dividends received 24,438 15,027 - -
Purchases of intangible assets (Note 13) (34,061) (41,039) (49,938) (43,199)
Acquisitions of subsidiaries, net of cash obtained in the
acquisitions - (502,755) - (423,329)
Cash and cash equivalents of merged subsidiaries - 48,562 - -
Value of sales of fixed assets 1,127 1,448 1,560 845
Purchases of property, plant and equipment (Note 12) (49,725) (42,042) (55,209) (47,524)
Purchases of investments measured at fair value 6,277 - 6,277 6,088
Net cash used in investment activities (86,155) (588,525) (98,749) (507,119)
Cash flow from financing activities Payment of principal on loans and financing (166,262) (27,512) (175,013) (27,452)
Payment of principal on debentures (48,002) (32,002) (58,566) (33,908)
Payment of financial leasing (944) - (994) -
New loans and financing - 181,055 7,368 181,858
Repurchase of debentures - - (2,416) -
Receivables from related companies 202 (470) - -
Dividends and interest on capital paid (141,324) (172,863) (141,350) (174,257)
Treasury shares, net (2,431) (23,775) (2,431) (23,775)
Net cash used in financing activities (358,811) (75,567) (373,402) (77,534)
Increase (decrease) in cash and cash equivalents (201,901) (344,831) (211,643) (271,486)
Cash and cash equivalents at the beginning of the year 314,405 659,236 426,415 697,901
Cash and cash equivalents at the end of the year 112,504 314,405 214,772 426,415
The accompanying notes are an integral part of these financial statements.

(A free translation of the original in Portuguese)
27
TOTVS S.A. Statement of Value Added Years ended December 31, 2016 and 2015
(In thousands of Reais) Parent Company Consolidated
2016 2015 2016 2015
1 – REVENUES
1,678,839 1,674,463
2,437,985
2,062,599
1.1 Sales of goods, products and services
1,710,606 1,710,507
2,466,074
2,094,744
1.2 Other revenue 9,775 (5,852) 21,108 2,417
1.3 Allowance for doubtful accounts – recording (41,542) (30,192) (49,197) (34,562)
2 - RAW MATERIALS ACQUIRED FROM THIRD-PARTIES
(includes ICMS and IPI taxes) (540,518) (584,860) (874,117) (726,476)
2.1 Cost of goods and services sold (66,772) (69,527) (258,903) (113,220)
2.2 Materials, energy, outsourced services and other (473,746) (515,333)
(615,214) (613,256)
3 - GROSS VALUE ADDED ( 1-2 ) 1,138,321 1,089,603 1,563,868 1,336,123
4 - DEPRECIATION AND AMORTIZATION (79,278) (70,894) (131,664) (103,660)
5 - NET VALUE ADDED PRODUCED BY THE ENTITY (3-4) 1,059,043 1,018,709 1,432,204 1,232,463
6 - VALUE ADDED RECEIVED THROUGH TRANSFERS 43,663 92,999 74,251 121,090
6.1 Equity pick-up (4,737) (4,628) - (75)
6.2 Financial income 48,400 97,627 74,251 121,165
7 - TOTAL VALUE ADDED TO DISTRIBUTE (5+6) 1,102,706 1,111,708 1,506,455 1,353,553
8 - VALUE ADDED DISTRIBUTION 1,102,706 1,111,708 1,506,455 1,353,553
8.1 Personnel 610,791 586,644 847,305 742,803
8.1.1 Direct Compensation 495,244 472,671 689,552 602,430
8.1.2 Benefits 70,315 68,195 98,653 84,904
8.1.3 FGTS (worker’s severance fund) 45,232 45,778 59,100 55,469
8.2 Taxes and contributions 234,589 224,193 356,809 289,384
8.2.1 Federal 192,879 182,790 279,370 209,980
8.2.2 State 1 5 23,874 25,661
8.2.3 Municipals 41,709 41,398 53,565 53,743
8.3 Interest and rent 104,668 105,342 150,072 126,420
8.3.1 Interest 80,029 82,107 110,984 94,586
8.3.2 Rents 24,639 23,235 39,722 31,963
8.3.3 Others - - (634) (129) 8.4 Remuneration of equity capital 152,658 195,529 152,269 194,946
8.4.1 Interest on capital 84,220 60,515 84,220 60,515
8.4.2 Dividends paid or credited to shareholders 7,375 66,579 7,375 66,579
8.4.3 Retained profit / loss for the year 61,063 68,435 61,063 68,435
8.4.4 Minority interest in retained earnings - - (389) (583)
The accompanying notes are an integral part of these financial statements.
(A free translation of the original in Portuguese)
28
TOTVS S.A. Notes to the financial statements Years ended December 31, 2016 and 2015 (In thousands of Reais)
1. Operations
TOTVS S.A. (“TOTVS”, or “Company”) is a publicly held corporation, headquartered at Av. Braz Leme, 1631 – 2nd floor, in the city and state of São Paulo, whose shares are traded on the Novo Mercado of BM&FBOVESPA - the Securities, Commodities and Futures Exchange.
The Company’s business purpose is to provide business solutions for companies of all sizes,
through the development and sale of management software, productivity and collaboration platform, as well as the provision of implementation, consulting, assistance and maintenance services. With the corporate restructuring of Bematech in 2015, the Company included hardware manufacturing and sale activities, combining specialized solutions for system management, point of sale (POS), commercial automation, tax solutions, e-commerce, mobility and payment methods. The solutions developed by the Company and its subsidiaries are segmented according to the diverse sectors of the economy, resulting in greater importance of the solutions in our clients’ business.
The Financial Statements presented in this document were approved after recommendation
of the Audit Committee at the meeting held on February 15, 2017 and at the Board of Directors’ Meeting held on February 20, 2017.
Non-financial data included in this report, such as the number of clients, average ticket,
market share, and other, were not audited by our independent auditors.
2. Basis of Preparation and Summary of the Main Accounting Practices
The individual and consolidated financial statements were prepared and presented in accordance with the accounting practices adopted in Brazil, including the pronouncements issued by the Accounting Pronouncements Committee (“CPC”) and the rules issued by the Brazilian Securities Commission (“CVM”), as well as the International Financial Reporting Standards (“IFRS”) issued by the International Accounting Standards Board (“IASB”) and show all material information strictly relating to the financial statements, which are consistent with that used by the management.
The financial statements were prepared on the historical cost basis, except for the valuation
of certain assets and liabilities, such as financial instruments from business combinations, which are measured at their fair value.
The preparation of financial statements requires the use of certain critical accounting
estimates and the exercise of judgment by Company management in applying the accounting policies of TOTVS S.A.
Estimates and assumptions that show significant risk and that need a higher level of
judgment and have a great degree of complexity for the Company’s financial statements are:

(A free translation of the original in Portuguese)
29
(i) Allowance for doubtful accounts – Note 6;
(ii) Impairment of tangible and intangible assets, including goodwill – Note 13.2;
(iii) Deferred taxes – Note 9.3;
(iv) Provision for contingencies related to legal proceedings – Note 18.
More information on the estimates and assumptions used in the items mentioned above is provided in the respective notes.
The pronouncements, interpretations and reviews of CPCs / IFRS that came into effect from
2016 did not have any significant impact on the Company's financial statements. Below is a summary of key accounting practices adopted by the Company, highlighting only
information considered relevant by Management.
2.1. Consolidation
The consolidated financial statements include the operations of the Company and the
following subsidiaries. The percentages of the interests held by the Company on the balance sheet
date are summarized below:
Direct interest: % Interest
Corporate Name Head
office Name used 2016 2015
TOTVS Serviços Ltda. BRA TOTVS Serviços 100.00 100.00
TOTVS Nordeste Software Ltda. BRA TOTVS Nordeste 100.00 100.00
TOTVS Brasília Software Ltda. BRA TOTVS Brasília 100.00 100.00
TQTVD Software Ltda. BRA TQTVD 100.00 100.00
TOTVS Ventures Participações Ltda. BRA TOTVS Ventures 100.00 100.00
TOTVS Argentina S.A. ARG TOTVS Argentina 100.00 100.00
Datasul Argentina S.A. ARG Datasul Argentina 100.00 100.00
TOTVS México S.A. MEX TOTVS México 100.00 100.00
Datasul S.A. de CV. MEX Datasul México 100.00 100.00
TOTVS Corporation BVI TOTVS Corporation 100.00 100.00
TOTVS Incorporation USA TOTVS Inc. 100.00 100.00
Virtual Age Soluções em Tecnologia Ltda. BRA Virtual Age 100.00 100.00
Neolog Consultoria e Sistemas S.A. BRA Neolog 60.00 60.00
Ciashop - Soluções para Comércio Eletrônico S.A. BRA Ciashop 70.00 70.00
TOTVS Resultados em Outsourcing Ltda. (a) BRA RO - 100.00
Bematech S.A. BRA Bematech 100.00 100.00
Indirect Interest: % Interest
Corporate Name Head
office Name used Investor 2016 2015
DTS Consulting Partner, SA de CV MEX Partner TOTVS México 100.00 100.00
W&D Participações S.A. BRA W&D TOTVS Brasília - 100.00
PC Informática S.A. BRA PC Informática W&D 100.00 100.00

(A free translation of the original in Portuguese)
30
RMS Software S.A. BRA RMS TOTVS Nordeste 100.00 100.00
Webstrategie Software Ltda. BRA Webstrategie RMS 100.00 100.00
Kerina Software Ltda. BRA Kerina TQTVD 100.00 100.00
Bematech Ásia Co.Ltd. TWN Bematech Ásia Bematech S.A. 100.00 100.00
Bematech Argentina S.A. ARG Bematech Argentina Bematech S.A. e Bematech
Inter. Corp. 100.00 100.00
CMNet Soluções em Informática e Agência de
Viagens e Turismo S.A. BRA CMNet Soluções Bematech S.A. 100.00 100.00
Misterchef Sistemas de Automação Ltda. (b) BRA Misterchef Bematech S.A. - 100.00
Bematech Internacional Corp. EUA BIC Bematech S.A. 100.00 100.00
Logic Controls, Inc EUA Logic Controls BIC 100.00 100.00
FICE - Bematech Foshan Shunde Ltd. CHN FICE Logic Controls, Inc 100.00 100.00
CMNet Participações S.A. BRA CMNet Partipações Bematech S.A. 100.00 100.00
CM Soluciones – Argentina ARG CMNet Argentina CMNet Participações 100.00 100.00
CMDIR - Soluções Informática, Lda - Portugal PRT CMNet Portugal CMNet Participações 100.00 100.00
CM Soluciones – Chile CHL CMNet Chile CMNet Participações 100.00 100.00
CMNet España ESP CMNet Espanha CMDIR - Soluções 100.00 100.00
RJ Participações S.A. BRA RJ Participações Bematech S.A. 100.00 100.00
R.J. Consultores en Sistemas de Información S.C. MEX RJ México RJ Participações 100.00 100.00
R.J. Consultores e Informática Ltda. BRA RJ Consultores RJ Participações 100.00 100.00
National Computer Corporation (c) RUS JV Russia TOTVS México 19.00 -
(a) On August 1, 2016, TOTVS sold 100% of the capital stock of TOTVS Resultados em Outsourcing Ltda. (TOTVS RO), a company that provides Business Process Outsourcing (BPO) services for human resources, to Propay S.A. for R$10,675, of which R$6,277 was received in the first installment. The second installment, due in August 2019, is subject to clauses for price adjustments based on achievement of targets established in the agreement. The amount estimated on December 31, 2016 was R$4,398.
(b) Merger of Misterchef with Bematech S.A. on August 1, 2016 and W&D with TOTVS Brasília on November 1, 2016.
(c) On July 8, 2016, TOTVS México and TOTVS S.A. acquired, respectively, 18.5% and 0.5% of the shares of the Russian company National Computer Corporation (NCC). The investment in this new company envisages a partnership to develop and launch in the Russian market a management system that combines reliability, safety, data integrity, continuity, high performance and scalability already present in TOTVS solutions. On December 31, 2016, the investment was R$1,350.
The results of subsidiaries acquired and/or merged during the fiscal year ended December 31, 2016 and 2015 are included in the income statements from the date of their acquisition and/or merger. Hence, for the purpose of comparison of the parent company’s and consolidated results between 2016 and 2015, the dates of acquisition and merger of the results of each subsidiary must be considered.
All intercompany balances and transactions were eliminated in consolidation.

(A free translation of the original in Portuguese)
31
2.2. Translation of balances denominated in foreign currency
The functional currency of the Company and its subsidiaries domiciled in Brazil is the Brazilian real, the same currency used to prepare and present the parent company and consolidated financial statements.
With regard to subsidiaries located abroad considered independent by the Management as
they have administrative, financial and operating autonomy, their assets and liabilities are translated into Brazilian real at the foreign exchange rate on balance sheet closing dates and their profit or loss are translated into Brazilian real at the average monthly rates of the periods. Adjustments to investments arising from foreign exchange are recognized as cumulative translation adjustments under equity.
2.3. Financial Instruments
2.3.1 Classification
The Company classifies financial assets upon initial recognition into the following categories: at fair value through profit or loss and loans and receivables. The classification depends on the purpose for which the financial assets were acquired.
On December 31, 2016 and 2015, the Company had no financial assets classified as available
for sale.
(a) Financial assets at fair value through profit or loss TOTVS maintains investments in companies whose share of the interest is held indirectly
through venture capital organizations and which are measured at fair value through profit or loss.
(b) Loans and receivables The Company's loans and receivables are mainly composed of "Accounts receivable and
other receivables" and "cash and cash equivalents."
2.4. Accounts receivable from customers Accounts receivable from customers are shown at their net realizable value, and accounts
receivable from foreign customers are restated using the exchange rates in force at the date of the Financial Statements. Accounts receivable maturing after one year are discounted to present value.
Accounts receivable are recognized at nominal value and deducted from the allowance for
doubtful accounts, which is constituted based on the history of losses by maturity range, which the Company deems sufficient to cover any losses.

(A free translation of the original in Portuguese)
32
2.5. Stocks
Stocks are measured at the lowest value between cost and net realizable value. Stock costs
are based on the weighted average cost principle and include expenses with the acquisition of raw material, cost of production and transformation and other costs to transport goods to their current locations and under existing conditions. In case of manufactured stocks and Work in progress, the cost includes a portion of general manufacturing costs based on the normal operating capacity.
2.6. Provision for impairment of assets
Management annually reviews the net book values of assets with a view to evaluating the
impact of events or economic, operational and technological changes that may indicate deterioration or impairment. When such evidence is identified and the net book value exceeds the recoverable value, a provision is established for the impairment, adjusting the net book value to the recoverable value.
Goodwill paid for expected future profitability is tested annually for impairment or when
circumstances indicate a loss due to the depreciation of its book value.
2.7. Leases
Leases of property, plant and equipment, of which the Company and its subsidiaries hold
substantially all the risks and rewards of ownership, are classified as financial leases. These are capitalized at the start of the lease at the lowest value between the fair value of the leased asset and the present value of the minimum lease payments. The corresponding liabilities, net of financial charges, are included in loans. Property, plant and equipment acquired through financial lease is depreciated over the useful life of the asset.
Payments for operating leases (net of any incentives received from the lessor) are recognized
in profit or loss using the straight-line method during the lease period.
2.8. Revenues and expenses
The Company and its subsidiaries earn software license revenue, made up of licensing and subscription fees, revenue from services that includes consulting fees, revenue from support services, revenue from maintenance and revenue from hardware. Revenues are presented net of taxes, returns, allowances and discounts, when applicable.
Revenue related to software license is recognized in accordance with the following models: (i) Licensing rate, when the ownership of licenses for solutions is transferred to the client:
is recognized when all risks and rewards inherent to the license are transferred to the buyer through software delivery and when the amount can be measured reliably, as well as it is probable that economic benefits be generated for the benefit of the Company.
(ii) Subscription, when licenses are made available to the client upon subscription: are recognized on a monthly basis over the terms of the agreements with customers.

(A free translation of the original in Portuguese)
33
Revenue from services is billed separately and recognized as the services are performed. Billed revenue that does not meet the recognition criteria is not included in the balances of respective revenue account and accounts receivable.
Revenue from maintenance, comprising technological developments and technical support
services (phone or Internet service for inquiries) are recognized monthly over the terms of the agreements with customers.
Hardware revenue is recognized when there is reliable evidence that: (i) the risks and
rewards inherent to the product were transferred to the buyer; (ii) the economic benefits will flow to the entity; and (iii) the associated costs and possible return of goods may be estimated reliably. If a discount can probably be granted and the amount can be reliably measured, the discount is deducted from revenue as sales are recognized.
The costs related to revenue from licensing fees include the costs of acquisition of databases,
the costs of the media in which the products are delivered, and the price of licenses paid to third parties, in the case of resold software. Costs related to revenue from maintenance services consist mainly of the salaries of consulting and support personnel and other costs related to those areas.
Expenses with research and development incurred by the development (software
programming and manufacturing) area, linked to new software versions and upgrades of existing software are registered as expenses for the year in which they are incurred and are stated separately from selling costs, in operating expenses.
2.9. Taxation
Sales taxes Revenues from sales and services are subject to the following taxes and contributions at the
following basic rates:
Social Contribution on Gross Revenue for Social Integration Program (PIS) 0.65% and 1.65%;
Social Contribution on Gross Revenue for Social Security Financing (COFINS) 3.0% and 7.6%;
Service Tax (ISS) between 2% and 5%;
National Social Security Institute (INSS) 2% up to November 2015 and 4.5% as of December 2015.
These charges are accounted for as sales deductions in the income statement. Income and social contribution taxes – current and deferred The taxation on income includes Income and Social Contribution Taxes, which stand at the
nominal rate of 34% on taxable income recognized using the accrual basis of accounting. Income taxes are recognized in the income statement, except if related to items directly recognized in equity or comprehensive income. In this case, the tax is also recognized in equity or comprehensive income.
Deferred income tax and social contribution assets are recognized only when it is probable
that future taxable income is available and against which temporary differences can be used.

(A free translation of the original in Portuguese)
34
2.10. Government subsidy Bematech, a subsidiary of TOTVS S.A., enjoys the tax benefit established by State Decree
1,922/2011, which allows the appropriation of presumed State Goods and Services Tax ("ICMS") credit equivalent to the rate provided for in the respective output of goods listed in the Decree. This benefit applies to industrial plants manufacturing IT and automation products located in the state of Paraná and which meet the requirements of the Law of Information Technology. This credit is given as a subsidy for investments, for which the Company must:
a) have publications in Interministerial Decree (Finance, Development, Industry and Foreign
Trade, and Science and Technology); and b) invest in research and development activities according to item II, paragraph 2, of Article
1 of State Decree 1,922/2011.
2.11. New standards that have yet to take effect
IFRS 9/CPC48 – Financial Instruments, addresses the classification, measurement and recognition of financial assets and liabilities. The complete version of IFRS 9 was published in July 2014, to come into force on January 1, 2018, and replaces IAS 39 guidelines on the classification and measurement of financial instruments. The main changes introduced by IFRS 9 were: (i) new criteria for classifying financial assets; (ii) new impairment model for financial assets, a combination of expected and incurred losses, replacing the current model of losses incurred; and (iii) flexibility of requirements to adopt hedge accounting.
Management understands that the new IFRS 9 guidelines will not have a significant impact on classification and measurement of its financial assets, as well as on accounting of hedge relations. The Company has not yet concluded a detailed assessment of how the provisions for impairment will be affected by the new model. Although no significant impact is expected, its application will probably anticipate the recognition of losses.
IFRS 15/CPC47 - Revenue from Contracts with Customers, this new standard establishes the
principles that an entity shall apply to measure revenue and when it is recognized. It becomes effective on January 1, 2018 and replaces IAS 11 – Construction Contracts and IAS 18 – Revenue and related interpretations.
During 2016, the Company evaluated the impact of adopting this standard. In general, the
Company does not expect a significant impact and is improving internal procedures that will allow the recognition of revenue under the criteria required by the new standard, mainly for revenues from implementation, customization and consulting services.
IFRS 16 – Lease Operations, with this new standard, lesses have to recognize the liability of
future payments and the right to use leased assets in practically all lease agreements, including operating leases, possibly excluding certain short-term agreements or agreements of low amounts. The criteria for recognizing and measuring leases in financial statements of lessors are substantially maintained. IFRS 16 comes into effect in the years beginning on or after January 1, 2019 and replaces IAS 17 – Lease Operations and corresponding interpretations.
The standard will affect the recognition of the Company’s outstanding operating leases as
mentioned in Note 28.2 about commitments with operating leases. However, the Company has not yet determined to what extent these commitments will result in the recognition of an asset

(A free translation of the original in Portuguese)
35
and a liability for future payments, and the impact on its profit or loss and classification of cash flows. Note that some of the existing commitments may be included in the exceptions to the standard – short term and small amount. Additionally, some commitments may be related to agreements that will not be classified as leases under IFRS 16.
There are no other IFRS standards or IFRIC interpretations not yet effective and that may
have significant impact on the Company and its subsidiaries.
3. Business combination
Business combinations and acquisitions of interests are in line with the Company's strategy of specialization and consolidation of its position as a provider of solutions to different segments of the economy, and bringing new solutions to TOTVS’ customers through portfolio diversification with niche-specific solutions.
The Company uses the acquisition method to book business combinations. The Company
recognizes the noncontrolling interest in the company acquired, both at its fair value and in proportion to the noncontrolling interest in the fair value of the acquired company’s net assets.
3.1. Acquisition of subsidiaries
Corporate restructuring – Bematech S.A. On August 14, 2015, the boards of directors of the Company and Bematech S.A.
(“Bematech”) approved the corporate restructuring involving the companies to integrate their activities. At the extraordinary shareholders meeting held on September 3, 2015, the shareholders of both companies approved the corporate restructuring, as follows:
(i) Makira II Empreendimentos e Participações S.A. (“Makira II”) absorbs Bematech shares
at market value for R$549,900, resulting in the issue by Makira II of 749,863,050 common shares and 4,249,223,950 redeemable preferred shares in favor of Bematech shareholders who held the merged shares.
(ii) Redemption of the redeemable preferred shares of Makira II, issued in favor of the former shareholders of Bematech, in the total amount of R$467,415 (R$0.11 for each redeemed share), paid in cash by the Company as the successor to Makira II on November 10, 2015 for the inflation-adjusted amount of R$473,586. Makira II preferred shares were cancelled and deducted from capital reserve.
(iii) With the redemption of preferred shares, the shareholders resolved on the merger of Makira II with the Company, with the absorption of its net assets stated at book value, and the consequent dissolution of Makira II. As a result, a total of 2,170,656 Company's new common shares were issued in favor of Bematech's shareholders to replace Makira II’s common shares.
As a result of the merger of Makira II, the shareholders’ equity of the Company increased by
R$82,485, which corresponds to the book value of the net assets of Makira II. Of the equity increase reported by the Company, (a) R$14,782 were allocated to Company’s capital increase and (b) R$67,703 were allocated to capital reserve.

(A free translation of the original in Portuguese)
36
The acquisition price is summarized below:
The purpose of the corporate restructuring is to unify the efforts to strengthen the portfolio
of software and hardware platforms and solutions, given that the complementary nature of the current product portfolios will make the Company even more complete and valuable to its clients and shareholders. Moreover, the synergies from the integration of the companies will also generate lower combined expenses and economies of scale.
Restructuring transaction costs totaled R$6,190, recorded in the Company's statement of
income and included in other operating expenses. The above-mentioned restructuring was concluded on October 22, 2015, after approval by
Brazil’s antitrust agency (CADE) on October 6, 2015 and after 15 days during which appeals could be filed by third parties, which had conditions precedent. Only from this date on, did the Company take over Bematech’s operations.
Acquisition of remaining interest in capital of TOTVS Agroindústria S.A. and P2RX Soluções
em Software S.A. On May 11, 2015, the Company acquired the remaining interest of 40% in the capital of the
subsidiaries TOTVS Agroindústria S.A. and P2RX Soluções em Software S.A. for R$8,834, according to the share purchase agreement and other covenants entered into on April 18, 2013. With these acquisitions, TOTVS now holds 100% interest in these subsidiaries.
Acquisition of Neolog Consultoria e Sistemas S.A. On February 11, 2015, the Company acquired 60% of the capital of Neolog Consultoria e
Sistemas S.A. (“Neolog”) for R$16,223. Neolog develops software solutions in the software as a service (SaaS) model for the Logistics and Supply Chain Management market.
The agreement also establishes that the Company acquire the remaining interest in Neolog
between January 2018 and January 2020 for a variable amount based on Neolog’s performance metrics. The estimated amount relating to the acquisition of Neolog’s remaining interest at the present value on the acquisition date was R$9,992 and is recorded under liabilities due to investment acquisition.
3.2. Identifiable assets acquired and goodwill
The fair value of identifiable assets acquired in the business combinations mentioned above was measured and recognized on the acquisition date. The methods and assumptions used for fair value measurements were based on cash flow discounted to its present value and replacement cost. To estimate the amount using the discounted cash flow method, the rate used varied from 14.4% to 18.3% p.a. (in nominal terms). The amount of assets not identifiable from these business combinations was booked as goodwill based on technical studies of future profitability.
Consideration paid for redemption of preferred shares of Makira II R$473,586 Exchange of shares R$82,485
Total consideration R$556,071

(A free translation of the original in Portuguese)
37
The fair value, goodwill and the cost of holding interest on the acquisition date of the identifiable assets acquired that impacted the consolidated financial statements on December 31, 2016 and 2015 are shown below:
Acquisitions – 2015
Preliminary fair value Neolog Bematech (*) Total
Current Assets 1,421 272,299 273,720
Cash and cash equivalents 254 78,854 79,108
Trade accounts receivable 1,005 91,218 92,223
Inventories - 40,087 40,087
Other current assets 162 62,140 62,302
Non-current assets 13,833 249,934 263,767
Other non-current assets 638 58,609 59,247
Brands and patents - 25,630 25,630
Software 7,933 49,100 57,033
Client portfolio 4,226 116,595 120,821
Non-competition 1,036 - 1,036
Current liabilities 1,117 102,100 103,217
Non-current liabilities 184 126,705 126,889
Non-controlling interests 303 - 303
Net assets and liabilities 13,650 293,428 307,078
Acquisition cost 16,223 556,071 572,294 Remaining installment 9,992 - 9,992
Goodwill in transaction 12,565 262,643 275,208
(*) Goodwill from expected future profitability to be deducted for tax purposes after the merger totaled R$102,855, which refers to the amount paid less Bematech’s equity (before fair value adjustments).
3.3. Merged companies
Over the course of 2016 and 2015, the Company and its subsidiaries merged the net assets,
recorded at book value, of the subsidiaries shown in the table below:
2016
Balance Sheet Misterchef W&D Total
Base date 7.31.2016 9.30. 2016
Current Assets 4,682 243 4,925 Non-current assets 124 36,265 36,389
Long-term assets 3 - 3 Investments - 35,958 35.958 Property, plant and equipment 33 - 33 Intangible assets 88 307 395
Total assets 4,806 36,508 41,314
Current liabilities 1,355 209 1,564 Shareholders’ Equity 3,451 36,299 39,750
Total liabilities 4,806 36,508 41,314
In accordance with the merger protocols approved in the Extraordinary Shareholders
Meetings of Bematech and TOTVS Brasilia held on August 1,2016 for Misterchef and on November

(A free translation of the original in Portuguese)
38
1, 2016 for W&D, the net assets of the subsidiaries were valued by experts who issued their valuation reports of the companies, according to the base date mentioned above. Changes to equity after the base date until the effective merger date were absorbed by Bematech S.A. and TOTVS Brasília, respectively.
2015
Balance Sheet TOTVS
Agroindustria P2RX Makira II Total
Base date 9.30.2015 9.30.2015 5.31.2015
Current Assets 3,795 385 47,632 51,812
Non-current assets 403 3 - 406
Long-term assets 13 - - 13
Property, plant and
equipment 157 3 -
160
Intangible assets 233 - - 233
Total assets 4,198 388 47,632 52,218
Current liabilities 1,091 597 172 1,860
Shareholders’ Equity 3,107 (209) 47,460 50,358
Total liabilities 4,198 388 47,632 52,218
In accordance with the merger protocols approved in the Extraordinary Shareholders Meetings of the Company held on September 3, 2015 for Makira II and December 15, 2015 for TOTVS Agroindústria and P2RX, the net assets of the subsidiaries were valued by experts who issued their valuation reports of the companies, according to the base date mentioned above. Changes to equity after the base date until the effective merger date were absorbed by TOTVS S.A.
4. Financial instruments and sensitivity analysis of financial assets and
liabilities
4.1. Analysis of financial instruments
Through the information available and using the appropriate valuation methodologies, the Company and its subsidiaries valued their financial assets and liabilities in relation to market value.
However, the interpretation of market data and the selection of valuation methods require considerable judgment and estimates to calculate the most appropriate realizable value. Consequently, the estimates presented do not necessarily show the amounts that may be realized in the market. The use of different market assumptions and/or methods may have a material effect on the estimated realizable values.
The table below compares the Company’s financial instruments by class, as presented in its
financial statements:

(A free translation of the original in Portuguese)
39
Fair Value
through profit Loans and receivables Held to maturity
Financial liabilities measured at cost
2016 2015 2016 2015 2016 2015 2016 2015
Financial Instruments Assets Cash and cash equivalents - - 214,772 426,415 - - - - Investment guarantees - - - - 85,164 114,747 - - Accounts receivable, net - - 501,100 530,095 - - - - Investments at fair value 56,800 68,044 - - - - - - Other assets - - - - 78,447 59,678 - - Financial liabilities Loans and Financing - - - - - - 561,741 678,309 Debentures and non-conversion premium - - - - - - 90,661 144,286 Accounts payable and suppliers - - - - - - 186,369 214,328 Obligation for acquisition of investments 28,058 37,932 - - - - 98,650 132,560 Other liabilities - - - - - - 14,670 12,278
Total 84,858 105,976 715,872 956,510 163,611 174,425 952,091 1,181,761
The fair value of financial assets and liabilities is included in the amount for which the instrument could be exchanged in a transaction where the parties are willing to negotiate, and not in an enforced sale or settlement. The methods and assumptions below were used to estimate the fair value:
Investment guarantees, trade accounts receivable, trade accounts payable and other short-term liabilities approximate their respective book values mainly due to the short-term maturities of these instruments.
Financial assets at fair value not traded in an active market are estimated using a valuation technique.
Loans and financing and debentures are recognized initially at fair value, net of costs
incurred in the transaction and are subsequently stated at amortized cost.
4.2. Financial assets measured at fair value
Investments in startups made by the Company have a medium-term strategy in which the exit is planned for the moment when the expected financial returns are achieved and, therefore, are recognized as financial instruments. The value of these investments on December 31, 2016 was R$56,800 (R$68,044 on December 31, 2015).
On January 21, 2015, TOTVS Ventures announced the sale of its non-controlling interest in
ZeroPaper.
4.3. Measurement of fair value
It is assumed that the balances of accounts receivable and accounts payable to suppliers at book value, less loss (impairment) in the case of accounts receivable, approximate their fair values.
The table below presents the Group's consolidated assets and liabilities measured at fair
value on December 31, 2016 and 2015:

(A free translation of the original in Portuguese)
40
2016 2015
Level 1 Level 2 Level 3 Level 1 Level 2 Level 3
Financial Assets Financial investments - 154,631 - - 320,607 -
Financial assets at fair value through profit or loss - - 56,800 - - 68,044
Financial Liabilities
Loans and Financing - 561,741 - - 678,309 -
Debentures 31,877 - 58,784 45,384 - 98,902
There were no transfers between Levels 1 and 2 during the year.
4.4. Sensitivity analysis of financial assets and liabilities
The Company's financial instruments are represented by cash and cash equivalents, accounts receivable, payables, debentures, loans and financing, and are recorded at cost plus income or charges incurred and which, on December 31, 2016 and 2015 approximated their market values.
The key risks related to the Company’s operations are related to the variations in the long-
term interest rate (TJLP) and the extended consumer price index (IPCA) for funding from the Brazilian Development Bank (BNDES), and for the debentures issued, and the variation of the overnight interest rate (CDI) for financial investments.
Investments at fair value through profit or loss relate to startups privately held and which
do not have quoted prices in an active market. The fair values of these investments are measured by a valuation technique or multiple valuation techniques employed by the market considering the reasonableness the range of values shown by them. The fair value measurement is the point within that range that best represents the fair value in the circumstances. Additionally, the biggest investment – GoodData - refers to the D Series preferred shares, which have preference in case of liquidation.
To check the sensitivity of indexes for the financial investments that the Company was
exposed to on December 31, 2016, three different scenarios were created. Based on the forecast by financial institutions, we arrived at CDI forecast of 12.88% for 2017 and which was defined as the probable scenario (scenario I). From this rate, we calculated variations of 25% (scenario II) and 50% (scenario III).
For each of these scenarios the “gross financial revenue” was estimated, without including
taxes on investment yields. The reference date for the portfolio was December 31, 2016, with a one-year projection to check the sensitivity of the CDI to each scenario.
Operation Balances in 2016 Risk Probable
Scenario (I) Scenario (II) Scenario
(III)
Reduction
Financial investments R$ 154,631 CDI 12.88% 9.66% 6.44%
Financial income R$ 19,916 R$ 14,937 R$ 9,958
To check the sensitivity of the indexes to which the Company is exposed when estimating
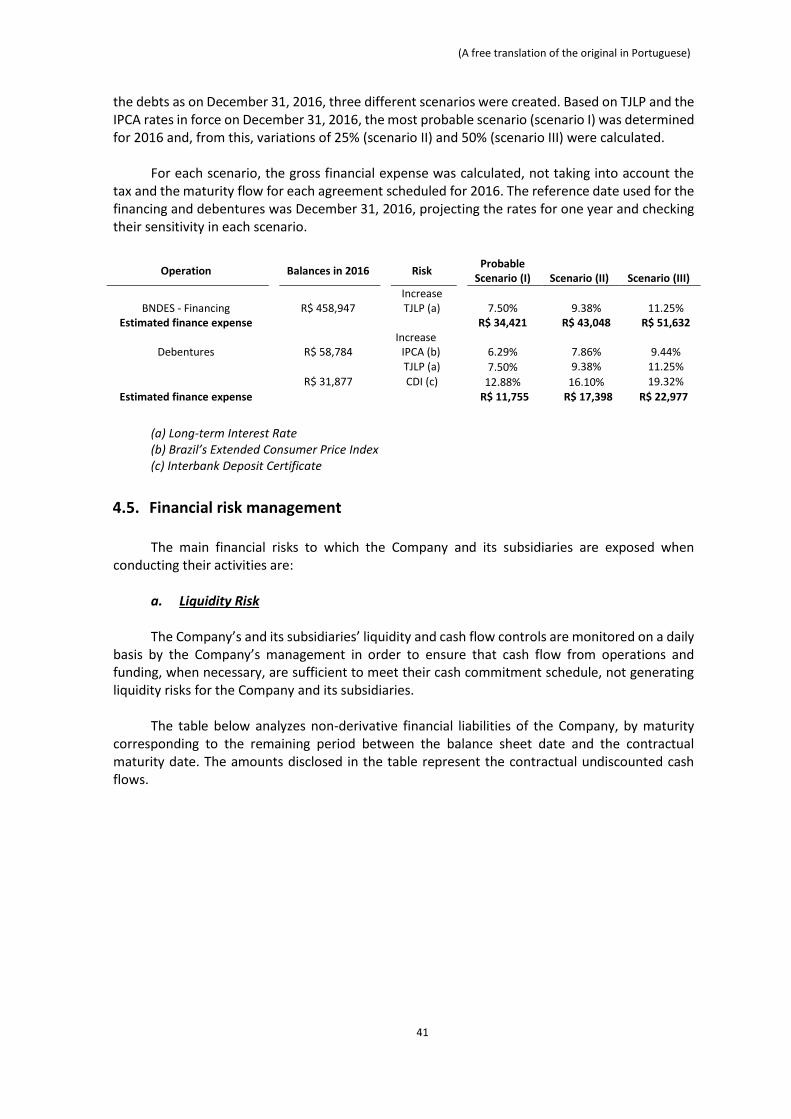
(A free translation of the original in Portuguese)
41
the debts as on December 31, 2016, three different scenarios were created. Based on TJLP and the IPCA rates in force on December 31, 2016, the most probable scenario (scenario I) was determined for 2016 and, from this, variations of 25% (scenario II) and 50% (scenario III) were calculated.
For each scenario, the gross financial expense was calculated, not taking into account the
tax and the maturity flow for each agreement scheduled for 2016. The reference date used for the financing and debentures was December 31, 2016, projecting the rates for one year and checking their sensitivity in each scenario.
Operation Balances in 2016 Risk Probable
Scenario (I) Scenario (II) Scenario (III)
Increase BNDES - Financing R$ 458,947 TJLP (a) 7.50% 9.38% 11.25%
Estimated finance expense R$ 34,421 R$ 43,048 R$ 51,632 Increase
Debentures R$ 58,784 IPCA (b) 6.29% 7.86% 9.44% TJLP (a) 7.50% 9.38% 11.25%
R$ 31,877 CDI (c) 12.88% 16.10% 19.32%
Estimated finance expense R$ 11,755 R$ 17,398 R$ 22,977
(a) Long-term Interest Rate (b) Brazil’s Extended Consumer Price Index (c) Interbank Deposit Certificate
4.5. Financial risk management
The main financial risks to which the Company and its subsidiaries are exposed when conducting their activities are:
a. Liquidity Risk The Company’s and its subsidiaries’ liquidity and cash flow controls are monitored on a daily
basis by the Company’s management in order to ensure that cash flow from operations and funding, when necessary, are sufficient to meet their cash commitment schedule, not generating liquidity risks for the Company and its subsidiaries.
The table below analyzes non-derivative financial liabilities of the Company, by maturity
corresponding to the remaining period between the balance sheet date and the contractual maturity date. The amounts disclosed in the table represent the contractual undiscounted cash flows.

(A free translation of the original in Portuguese)
42
Consolidated
Less than one year
Between
one and two years (i)
Between
two and five years (i)
Over five years (i)
On December 31, 2016 Suppliers 73,553 - - -
Loans and Financing 197,094 186,369 190,084 -
Debentures 12,111 7,651 70,899 -
Liabilities from investment acquisition 80,822 18,387 27,499 Other liabilities 8,260 - - -
On December 31, 2015 Suppliers 86,932 - - -
Loans and Financing 177,514 177,316 327,246 -
Debentures 61,915 40,707 51,338 -
Liabilities from investment acquisition 82,220 41,258 48,460 -
Other liabilities 8,563 - - -
(i) As the amounts included in the table represent undiscounted cash flows, these amounts will not be reconciled with the amounts reported in the balance sheet for loans, derivative financial instruments, suppliers and other obligations.
b. Credit risk Credit risk is the risk that the counterparty in a deal will not fulfill an obligation set forth in a
financial instrument or contract with a client, which would cause a financial loss. Regarding the credit risk associated with financial institutions, the Company and its
subsidiaries distribute this exposure among financial institutions with risk ratings of at least BBB. The credit risk related to services rendered and sale of licenses and hardware is minimized
by strict control of the customer base and active delinquency management through clear policies on provision of services and sale of software and hardware licenses. The subsidiary Bematech operates with distribution agreements and currently concentrates its distribution in a single distributor, with a low credit risk. On December 31, 2016, 3.9% of consolidated accounts receivable pertained to distributors.
c. Market risk i) Interest rate and inflation risk: interest rate risk arises from the portion of the debt related
to TJLP, IPCA and financial investments in CDI, which can adversely affect the financial income or expenses in the event of unfavorable changes in the interest rate and inflation.
ii) Exchange rate risk: this risk arises from the possibility of losses due to exchange rate
fluctuations that could increase the liabilities resulting from loans and foreign currency purchase commitments or that could reduce the assets resulting from trade accounts receivable in foreign currency.
Some subsidiaries have international operations and are exposed to exchange risk arising
from exposures in some currencies, such as the U.S. dollar (USD), Argentinian peso (ARS), Mexican peso (MXN), Taiwan new dollar (TWD), Chilean peso (CLP) and Russian rubles. The Company

(A free translation of the original in Portuguese)
43
ensures that its net exposure is maintained at an acceptable level in accordance with the policies and limits defined by the Management.
Below are the balances of each group company, showing a positive net exposure, since the
exchange gains exceed exchange losses: Consolidated net exchange exposure on December 31, 2016:
Company Accounts payable
Accounts receivable
Other assets
Net exposure
Currency
Bematech S.A. (2,004) 115 - (1,889)
Bematech International Corp. - - 14 14 USD
Logic Controls Inc. (1,575) 7,965 14,011 20,401 USD / CNY
Bematech Ásia Co. Ltd (14) 1,965 143 2,094 USD / TWD
RJ Consultores México - 7 685 692 Peso (MEX)
CMNet Participações S.A. (208) 1,007 932 1,731 EUR/ Peso (CHI and ARG)
TOTVS México (433) 4,649 - 4,216 Peso (MEX)
TOTVS Argentina (1,345) 6,547 - 5,202 Peso (ARG)
TOTVS Corporation (144) 298 56,800 56,954 USD
Total (5,723) 22,553 72,585 89,415
Consolidated net exchange exposure on December 31, 2015:
Company Accounts payable
Accounts receivable
Other assets
Other liabilities
Net exposure
Currency
Bematech S.A. (4,387) 4,568 - (2,380) (2,199) Bematech International Corp. - - 16 - 16 USD Logic Controls Inc. (1,319) 5,315 14,336 - 18,332 USD / CNY Bematech Ásia Co. Ltd (41) - 1,207 - 1,166 USD / TWD RJ Consultores México (887) 24 1,598 - 735 Peso (MEX) CMNet Participações S.A. (139) 1,086 877 (22) 1,802 EUR/ Peso (CHI and ARG) TOTVS México (1,712) 5,264 - - 3,552 Peso (MEX) TOTVS Argentina (620) 7,102 - - 6,482 Peso (ARG) TOTVS Corporation (83) 57 68,044 - 68,018 USD
Total (9,188) 23,416 86,078 (2,402) 97,904
d. Investments at fair value through profit and loss Investments at fair value through profit or loss consist of startup companies, as described in
Note 4.4. Startup companies could fail or not be able to raise additional funds when needed, or may
receive lower ratings than in previous investments. These events could cause the Company´ investments to become impaired. In addition, market volatility could negatively affect the Company´ability to realize its investments through liquidity events such as initial public offerings, mergers, and private sales.
e. Derivatives
The Company and its subsidiaries do not maintain derivative operations in the reported
periods.
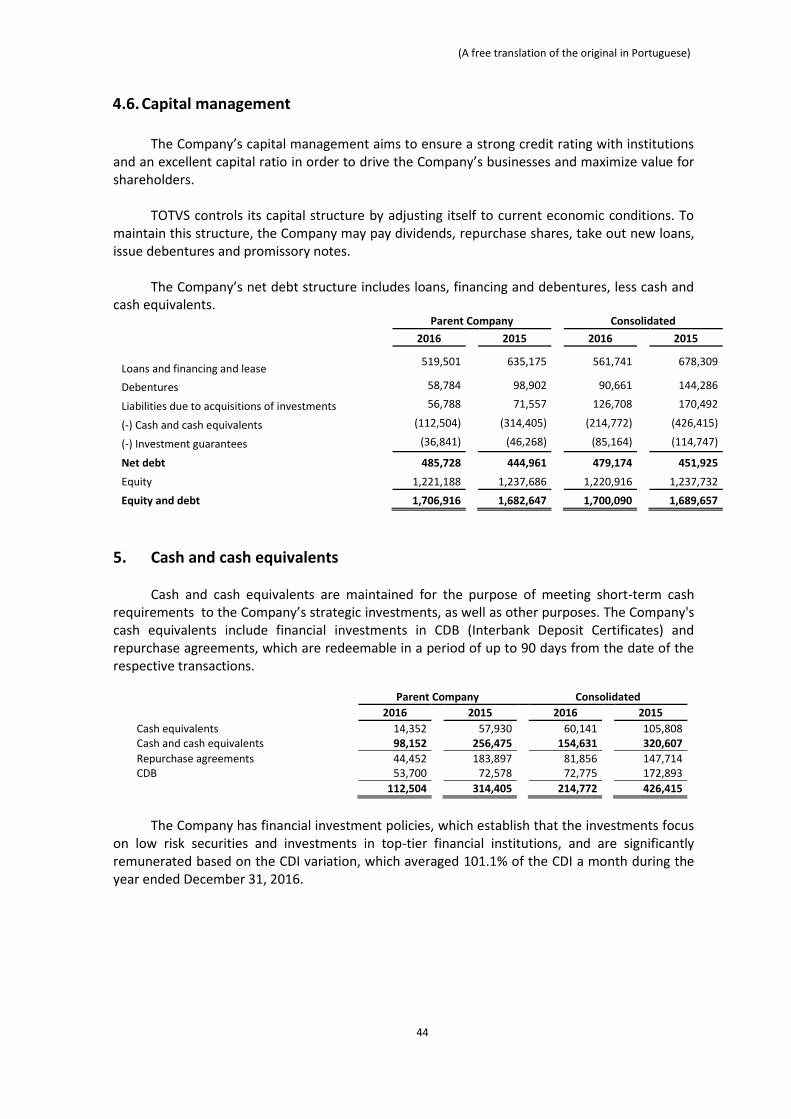
(A free translation of the original in Portuguese)
44
4.6. Capital management
The Company’s capital management aims to ensure a strong credit rating with institutions and an excellent capital ratio in order to drive the Company’s businesses and maximize value for shareholders.
TOTVS controls its capital structure by adjusting itself to current economic conditions. To
maintain this structure, the Company may pay dividends, repurchase shares, take out new loans, issue debentures and promissory notes.
The Company’s net debt structure includes loans, financing and debentures, less cash and
cash equivalents. Parent Company Consolidated
2016 2015 2016 2015
Loans and financing and lease 519,501 635,175 561,741 678,309
Debentures 58,784 98,902 90,661 144,286
Liabilities due to acquisitions of investments 56,788 71,557 126,708 170,492
(-) Cash and cash equivalents (112,504) (314,405) (214,772) (426,415)
(-) Investment guarantees (36,841) (46,268) (85,164) (114,747)
Net debt 485,728 444,961 479,174 451,925
Equity 1,221,188 1,237,686 1,220,916 1,237,732
Equity and debt 1,706,916 1,682,647 1,700,090 1,689,657
5. Cash and cash equivalents Cash and cash equivalents are maintained for the purpose of meeting short-term cash
requirements to the Company’s strategic investments, as well as other purposes. The Company's cash equivalents include financial investments in CDB (Interbank Deposit Certificates) and repurchase agreements, which are redeemable in a period of up to 90 days from the date of the respective transactions.
Parent Company Consolidated
2016 2015 2016 2015
Cash equivalents 14,352 57,930 60,141 105,808 Cash and cash equivalents 98,152 256,475 154,631 320,607
Repurchase agreements 44,452 183,897 81,856 147,714 CDB 53,700 72,578 72,775 172,893
112,504 314,405 214,772 426,415
The Company has financial investment policies, which establish that the investments focus
on low risk securities and investments in top-tier financial institutions, and are significantly remunerated based on the CDI variation, which averaged 101.1% of the CDI a month during the year ended December 31, 2016.

(A free translation of the original in Portuguese)
45
6. Trade accounts receivable The following are the amounts receivable in domestic and foreign markets:
Parent Company Consolidated 2016 2015 2016 2015 Domestic market 428,956 439,241 583,464 579,125 Foreign market 1,268 1,185 22,819 26,830 Gross trade accounts receivable 430,224 440,426 606,283 605,955 (-) allowances for doubtful accounts (84,293) (56,551) (105,183) (75,860) Net trade accounts receivable 345,931 383,875 501,100 530,095
Current assets 310,089 345,199 464,187 489,142 Non-current assets 35,842 38,676 36,913 40,953
Below are the receivables in connection with the net amount of allowance for doubtful
accounts by aging list on December 31, 2016 and 2015:
Parent Company Consolidated
2016 2015 2016 2015
Falling due 312,094 348,071 449,267 475,821
Overdue
1 to 30 days 21,263 19,949 28,841 30,226
31 to 60 days 8,711 5,492 11,782 8,076
61 to 90 days 5,743 5,347 7,938 6,899
91 to 180 days 10,563 7,069 13,723 10,346
181 to 360 days 23,007 16,413 27,058 20,836
more than 360 days 48,843 38,085 67,674 53,751
Gross accounts receivable 430,224 440,426 606,283 605,955
(-) Allowance for doubtful accounts (84,293) (56,551) (105,183) (75,860)
Net accounts receivable 345,931 383,875 501,100 530,095
Changes in the allowance for doubtful accounts are as follows:
Parent Company Consolidated 2016 2015 2016 2015 Balance at the beginning of the year 56,551 53,652 75,860 58,864
Acquisition of subsidiary - - - 15,082
Additional provision in the year 41,542 30,192 49,197 34,562
Written off from the provision: (13,800) (27,293) (19,874) (32,648)
Balance at the end of the year 84,293 56,551 105,183 75,860
Management believes that the risk related to trade accounts receivable in general is
minimized by the fact that the Company’s customer portfolio is diluted, except for the distributor of Bematech and certain large clients, cumulatively representing 7.4% of accounts receivable in consolidated statements on December 31, 2016.
The Company does not require any guarantee on installment sales. Exceptionally during the third quarter of 2016, an allowance for doubtful accounts was
recorded for a certain project in the amount of R$17,221 due to the risk involving a large client in the services segment.

(A free translation of the original in Portuguese)
46
7. Stocks The breakdown of stocks of Bematech on December 31, 2016 is as follows:
Consolidated Consolidated 2016 2015
Finished products 6,360 15,305 Work in progress 142 - Raw material 15,640 22,924 Products for resale and others 5,675 6,190 Parts for technical assistance 1,346 2,536 (-) Provision for adjustment to realization
value (944) (2,548)
28,219 44,407
8. Taxes recoverable
Parent Company Consolidated 2016 2015 2016 2015
State Goods and Services Tax (ICMS) (a) - -
46,324 47,972
Tax on manufactured products (IPI) - - 2,555 3,413
Withholding income tax 51,431 21,273 62,364 33,157
33,157
Withholding social contribution tax 21,561 6,399 24,992 8,057
Withholding PIS and COFINS taxes - - 4,032 3,612
Other 1 1 3,826 2,954
72,993 27,673 144,093 99,165
Current 72,993 27,673 122,521 81,284
Non-current - - 21,572 17,881
(a) Bematech uses ICMS tax benefit for investments granted by the state of Paraná, which aim to foster the
development of technological products, provided the requirements included in the Federal Law are met, especially regarding research and development expenditure. There is the concession of ICMS presumed credit equivalent to the amount due on the outflow of products and, starting from September 1, 2015, is limited to the ICMS debit amount of the respective period, pursuant to Decree 2,175/2015 of the State of Paraná. The Company and its subsidiary maintain studies jointly with their legal counsel to realize these credits.
9. Income and social contribution taxes Income and social contribution taxes, current and deferred, were recorded pursuant to the
current rates in force. Deferred income tax and social contribution are calculated over temporary differences and accrued tax losses/negative social contribution base.
9.1. Reconciliation of income and social contribution tax expenses
The reconciliation of expenses calculated by applying the Income and Social Contribution
Tax rates is as follows:

(A free translation of the original in Portuguese)
47
Parent Company Consolidated
2016 2015 2016 2015
Income before taxes 164,562 236,674 175,521 254,834 Income and social contribution taxes at combined nominal rate of 34% (55,951) (80,469) (59,677) (86,644) Adjustments for the statement of effective rate
Equity pick-up 4,934 3,359 - (26) Law No. 11,196/05 (Incentive for research and
development) (a) 11,439 16,567 12,273 17,501 Interest on equity 28,574 20,575 28,574 20,575 Subsidy for incentives - - 3,617 - Effect of subsidiaries subject to special rates - - (7,880) (10,178) Management stake (578) (352) (715) (363) Accounts receivable deemed uncollectible (18) (146) (270) (426) Workers' Food Program 274 845 587 1,185 Other (578) (1,524) 239 (1,512)
Income tax and social contribution expense (11,904) (41,145) (23,252) (59,888)
Current income tax and social contribution (15,329) (47,025) (38,260) (69,250) Deferred income tax and social contribution 3,425 5,880 15,008 9,362
Effective rate 7.2% 17.4% 13.2% 23.5%
(a) The Brazilian tax legislation provides a mechanism to encourage the technological
development of the country, which grants tax incentives to companies that carry out
technological research and development (R&D).
9.2. Breakdown of deferred income and social contribution taxes
Parent Company Consolidated
2016 2015 2016 2015
Deriving from temporary differences:
Tax losses and social contribution tax losses carried forwards - - 61,251 53,794
Difference between fiscal base and book value from goodwill 51,517 69,942 73,182 91,283
Amortization of fiscal benefit (71,567) (63,136) (99,478) (89,744) Intangible asset allocation (35,461) (51,131) (46,039) (68,109) Allocation of intangible assets – after Law 12.973 5,244 1,194 5,244 1,194 Provision for commissions 13,326 18,144 14,400 19,133 Anticipated income or revenues 2,243 (5,542) 2,879 (4,599) Allowance for doubtful accounts 28,660 19,227 31,904 20,317 Provision for contingencies and other liabilities 29,010 23,933 34,632 30,764 Provision for losses in inventories and guarantees - - 1,834 2,541 Present value adjustment 1,090 1,802 2,382 2,592 Other 6,387 2,521 6,467 4,341
Net deferred income and social contribution tax 30,449 16,954 88,658 63,507
The net deferred income tax and social contribution of the Company and its subsidiaries are
presented under non-current assets.
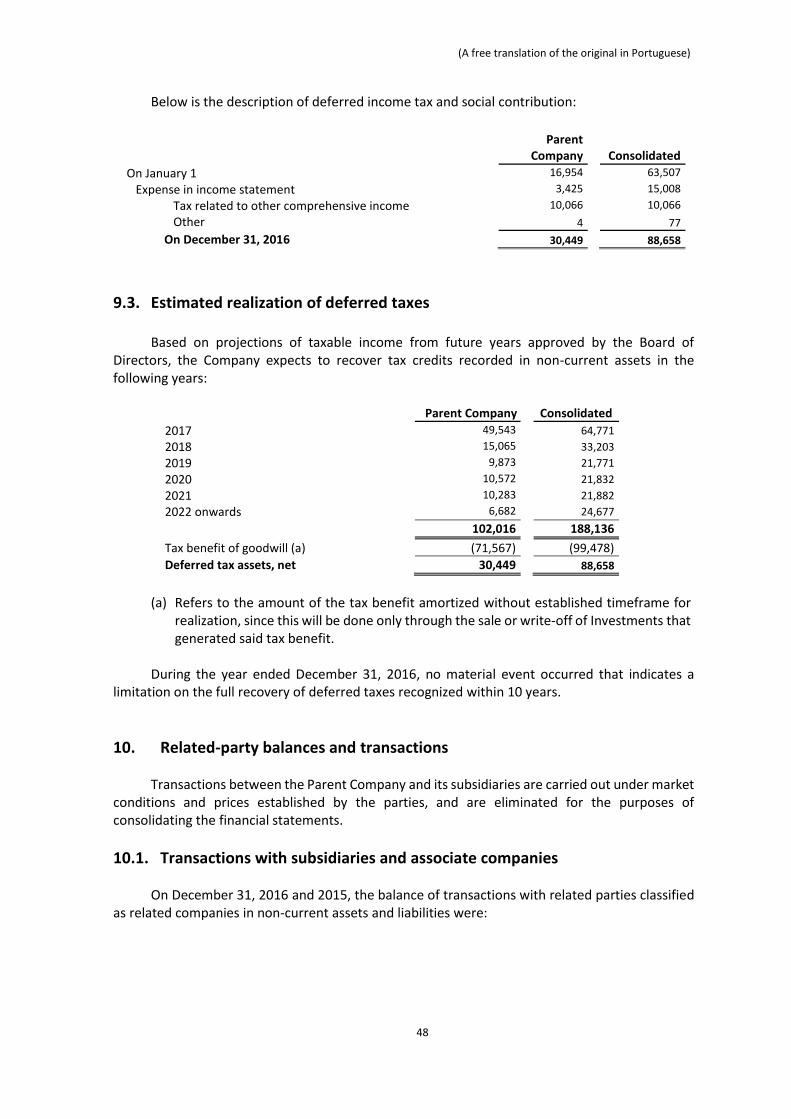
(A free translation of the original in Portuguese)
48
Below is the description of deferred income tax and social contribution:
Parent
Company Consolidated
On January 1 16,954 63,507
Expense in income statement 3,425 15,008
Tax related to other comprehensive income 10,066 10,066
Other 4 77
On December 31, 2016 30,449 88,658
9.3. Estimated realization of deferred taxes
Based on projections of taxable income from future years approved by the Board of Directors, the Company expects to recover tax credits recorded in non-current assets in the following years:
Parent Company Consolidated
2017 49,543 64,771
2018 15,065 33,203
2019 9,873 21,771
2020 10,572 21,832
2021 10,283 21,882
2022 onwards 6,682 24,677
102,016 188,136
Tax benefit of goodwill (a) (71,567) (99,478)
Deferred tax assets, net 30,449 88,658
(a) Refers to the amount of the tax benefit amortized without established timeframe for
realization, since this will be done only through the sale or write-off of Investments that generated said tax benefit.
During the year ended December 31, 2016, no material event occurred that indicates a
limitation on the full recovery of deferred taxes recognized within 10 years.
10. Related-party balances and transactions Transactions between the Parent Company and its subsidiaries are carried out under market
conditions and prices established by the parties, and are eliminated for the purposes of consolidating the financial statements.
10.1. Transactions with subsidiaries and associate companies On December 31, 2016 and 2015, the balance of transactions with related parties classified
as related companies in non-current assets and liabilities were:

(A free translation of the original in Portuguese)
49
The amounts refer to accounts payable and receivable among subsidiaries, without
remuneration and/or forecast maturity. There was no purchase and sale or provision of services between the subsidiaries and the parent company. Credits are related to loan transactions.
10.2. Transactions or relationships with shareholders and key management personnel
a) Shareholders The Company maintains property lease agreements with companies, some of which are
owned by shareholders of TOTVS. Rental paid was R$9,121 for the year ended December 31, 2016 (R$8,352 for the year ended December 31, 2015), in line with market rates. The agreements are effective for 60 months and are adjusted by IGP-M (General Price Index – Market) every 12 months.
Additionally, as mentioned in Note 28.2, the Company executed an agreement in 2013 to
build its new headquarters to be concluded in March 2017. Throughout 2016, during the execution of the built, the Company paid R$2,093 related to management services for Inovalli – Administração de obras, engenharia e empreendendorismo, company whose shareholders have, directly and indirectly, TOTVS shares.
Some Company shareholders and officers, directly or indirectly, hold 17.6% of the Company’s shares on December 31, 2016 (17.4% on December 31, 2015), and the indirect interest was held through LC-EH Empreendimentos e Participações S.A.
The Company and its subsidiary Bematech also have loans and financing operations (Note
15) and debentures (Note 16), substantially with the BNDES, which held 4.49% of the Company’s capital on December 31, 2016 (Note 19) and have indicated a member of the Board of Directors.
b) Key management personnel Itaú Unibanco is a related party of the Company, since one of the independent members on
the Board of Directors is part of the controlling group of that financial conglomerate. On December 31, 2016, the amounts and transactions involving the Itaú Unibanco Group companies are R$20,821 (R$29,156 on December 31, 2015) relating to financial investments, R$1,259 (R$1,095
Parent Company
ASSETS 2016 2015
Ciashop 1,599 1,550
TQTVD 45 -
TOTVS Brasília - 1,921
TOTVS RO - 32
PC Sistemas - 119
1,644 3,622
LIABILITIES TOTVS Serviços (7,073) (5,435)
TOTVS Ventures (5,760) (4,502)
TOTVS Nordeste (378) (2,808)
TOTVS Brasília (36) -
TQTVD - (2,278)
(13,247) (15,023)

(A free translation of the original in Portuguese)
50
on December 31, 2015) relating to bank-issued guarantee, bookkeeping of shares, insurance policies and others, and R$7,296 (R$15,623 on December 31, 2015) relating to assignment of rights for using systems and technical support provided by TOTVS. All agreements are conducted under usual market conditions.
In 2016, the Company also signed a payroll exclusivity agreement with Itaú for the next five
years, in the amount of R$7,740. The Company has an agreement, for no consideration, relating to the management of the
pension plan with Itaú Vida e Previdência S.A.
10.3. Management fees
Expenses related to fees of managers of the Company and subsidiaries are summarized
below:
Parent Company Consolidated
2016 2015 2016 2015
Short-term benefits to officers Salaries, fees and payroll charges 12,448 14,990 15,571 18,978 Private pension plan 442 459 466 483 Variable bonus 1,228 1,036 1,584 1,220
14,118 16,485 17,621 20,681 Share-based payments 1,555 2,795 1,555 2,795
15,673 19,280 19,176 23,476
The Company does not have any additional post-employment liabilities, nor does it provide
other long-term benefits, such as paid leave based on years of service and other benefits for years of service at the Company. It also does not provide other benefits when members of its management quit, in addition to those established by Brazilian laws.

(A free translation of the original in Portuguese)
51
11. Investments The investments of the Company and its subsidiaries are assessed based on the equity
method. The breakdown of investments in subsidiaries and affiliate companies is shown below:
Summarized financial statements of affiliate companies and subsidiaries on December 31, 2016
Equity pick-up (parent Company) for years ended:
Balance of investments as of:
Assets Liabilities Net
Equity Gross profit
Profit or loss for the year 2016 2015 2016 2015
Bematech (a) (b) 633,468 176,049 457,419 482,6166
19,908 10,068 437 550,513 556,391 TOTVS Brasília 138,632 9,146 129,486 5,900 8,530 8,530 6,197 129,486 117,538 TOTVS Nordeste 102,767 34,255 68,512 6,942 (2,106) (2,106) 3,982 68,512 72,618 TOTVS Serviços 24,888 205 24,683 17,298 4,054 4,054 7,659 20,630 20,629 TOTVS Inc. 61,265 165 61,100 566 (9,749) (9,749) (8,924) 61,100 80,370
Virtual Age (b) 22,348 7,207 15,141 51,179 8,608 3,150 (5,586) 74,626 77,476
Neolog (a) (b) 1,977 1,363 614 7,767 (126) (2,133) (1,868) 22,186 24,319 TQTVD 17,015 2,661 14,354 7,800 (2,514) (2,514) 2,045 14,354 16,868 TOTVS Ventures 11,073 - 11,073 - (57) (57) 5,550 11,073 11,130 Ciashop (b) 1,491 3,217 (1,726) 7,580 (1,131) (2,682) (2,284) 8,226 10,117 TOTVS México 10,884 2,724 8,160 13,297 (11,059) (11,059) (11,381) 8,160 953 TOTVS Argentina 12,399 5,318 7,081 24,265 (2,002) (2,002) 15 7,081 10,994 Datasul Argentina 216 - 216 - (8) (8) (11) 216 325
NCC (c) - - - - - - - 38 - TOTVS Agroindústria (d)
- - - - - - (865) - - P2RX (d) - - - - - - (1,910) - - TOTVS RO - - - 12,652 1,771 1,771 1,735 - 1,745
Makira II (d) - - - - - - 581 - -
(4,737) (4,628) 976,201 1,001,473
(a) Business combinations in 2015, see note 3.1. (b) Goodwill from acquired companies is recorded under Investments in the parent company's profit or loss. The
difference between the results from acquired companies and equity pick-up refers to the amortization of intangible assets in the determination of fair value of assets of the respective acquired companies.
(c) Investment and partnership as per Note 2.1. (d) Companies merged during 2015, see note 3.3.
2015 Addition Dividends Equity Pick-
up Foreign
Exchange Write-off
Reclassification 2016
Bematech 556,391 - (1,793) 10,068 (14,153) - - 550,513 TOTVS Brasília 117,538 11,818 (8,400) 8,530 - - - 129,486 TOTVS Nordeste 72,618 - (2,000) (2,106) - - - 68,512 TOTVS Serviços 20,629 - (4,053) 4,054 - - - 20,630
TOTVS Inc. 80,370 4,307 - (9,749) (13,828) - - 61,100 Virtual Age 77,476 - (6,000) 3,150 - - - 74,626 Neolog 24,319 - - (2,133) - - - 22,186
TQTVD 16,868 - - (2,514) - - - 14,354 TOTVS Ventures 11,130 - - (57) - - - 11,073 Ciashop 10,117 - - (2,682) - - 791 8,226 TOTVS México 953 15,906 - (11,059) 2,360 - - 8,160 TOTVS Argentina 10,994 2,140 - (2,002) (4,051) - - 7,081 Datasul Argentina 325 - - (8) (101) - - 216 NCC - 38 - - - - - 38 TOTVS RO 1,745 - (2,192) 1,771 - (1,324) - -
Sum of Investments 1,001,473 34,209 (24,438) (4,737) (29,773) (1,324) 791 976,201

(A free translation of the original in Portuguese)
52
Ciashop (584) 167 - - - - (791) (1,208)
Sum of provision for losses (584) 167 - - - - (791) (1,208)
Total investments 1,000,889 34,376 (24,438) (4,737) (29,773) (1,324) - 974,993
2014
Addition (Write-
off) Business
Combination Dividends Equity Pick-
up Foreign
Exchange Merger Reclassifi
cation 2015
Bematech - - 556,071 - 437 (117) - - 556,391 TOTVS Brasília 111,341 - - - 6,197 - - - 117,538 TOTVS Nordeste 68,092 544 - - 3,982 - - - 72,618 TOTVS Serviços 24,934 - - (11,964) 7,659 - - - 20,629
TOTVS Inc. 57,360 5,022 - - (8,924) 26,912 - - 80,370 Virtual Age 83,062 - - - (5,586) - - - 77,476 Neolog - - 26,215 (28) (1,868) - - - 24,319 TOTVS Ventures 6,120 2,015 - (2,555) 5,550 - - - 11,130 Ciashop 14,541 - (2,536) - (2,284) - - 396 10,117
TQTVD 14,823 - - - 2,045 - - - 16,868 TOTVS Argentina 8,632 1,262 - - 15 1,085 - - 10,994 TOTVS México - 8,065 - - (11,381) 4,375 - (106) 953 TOTVS RO - 10 - - 1,735 - - - 1,745 Datasul Argentina 338 - - - (11) (2) - - 325 EuroTOTVS 316 (334) - - - 18 - - - TOTVS Agroindústria 2,241 2,806 - (271) (865) - (3,911) - - P2RX 411 1,456 - (209) (1,910) - 252 - - Makira II - 46,880 - - 581 - (47,461) - -
Sum of Investments 392,211 67,726 579,750 (15,027) (4,628) 32,271 (51,120) 290 1,001,473
TOTVS México (106) - - - - - - 106 - Ciashop (188) - - - - - - (396) (584)
Sum of provision for losses (294) - - - - - - (290) (584)
Total investments 391,917 67,726 579,750 (15,027) (4,628) 32,271 (51,120) - 1,000,889
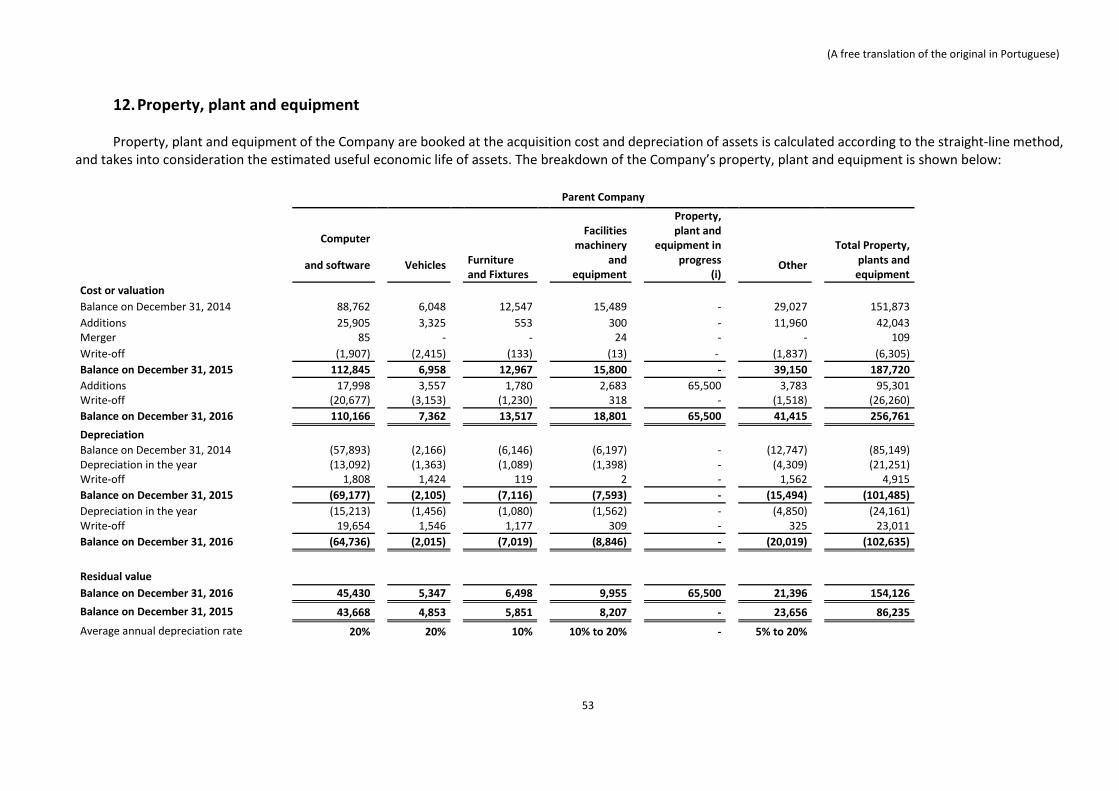
(A free translation of the original in Portuguese)
53
12. Property, plant and equipment
Property, plant and equipment of the Company are booked at the acquisition cost and depreciation of assets is calculated according to the straight-line method,
and takes into consideration the estimated useful economic life of assets. The breakdown of the Company’s property, plant and equipment is shown below:
Parent Company
Facilities
machinery and
equipment
Property, plant and
equipment in progress
(i)
Total Property, plants and
equipment
Computer
Furniture and Fixtures
and software Vehicles
Other
Cost or valuation
Balance on December 31, 2014 88,762 6,048 12,547 15,489 - 29,027 151,873
Additions 25,905 3,325 553 300 - 11,960 42,043 Merger 85 - - 24 - - 109
Write-off (1,907) (2,415) (133) (13) - (1,837) (6,305)
Balance on December 31, 2015 112,845 6,958 12,967 15,800 - 39,150 187,720
Additions 17,998 3,557 1,780 2,683 65,500 3,783 95,301 Write-off (20,677) (3,153) (1,230) 318 - (1,518) (26,260)
Balance on December 31, 2016 110,166 7,362 13,517 18,801 65,500 41,415 256,761
Depreciation Balance on December 31, 2014 (57,893) (2,166) (6,146) (6,197) - (12,747) (85,149) Depreciation in the year (13,092) (1,363) (1,089) (1,398) - (4,309) (21,251) Write-off 1,808 1,424 119 2 - 1,562 4,915
Balance on December 31, 2015 (69,177) (2,105) (7,116) (7,593) - (15,494) (101,485)
Depreciation in the year (15,213) (1,456) (1,080) (1,562) - (4,850) (24,161) Write-off 19,654 1,546 1,177 309 - 325 23,011
Balance on December 31, 2016 (64,736) (2,015) (7,019) (8,846) - (20,019) (102,635)
Residual value Balance on December 31, 2016 45,430 5,347 6,498 9,955 65,500 21,396 154,126
Balance on December 31, 2015 43,668 4,853 5,851 8,207 - 23,656 86,235
Average annual depreciation rate 20% 20% 10% 10% to 20% - 5% to 20%

(A free translation of the original in Portuguese)
54
Consolidated
Facilities
machinery and equipment
Property, plant and
equipment in progress (i)
Total Property, plants and equipment
Computers Furniture
and
and software Vehicles Fixtures Other
Cost or valuation Balance on December 31, 2014 100,421 7,998 15,752 18,032 - 33,521 175,724 Additions 27,525 4,363 1,225 1,024 - 13,387 47,524 Acquisition of subsidiary 5,123 128 1,709 6,143 - 1,691 14,794 Write-off (2,716) (2,608) (243) (638) - (2,552) (8,757) Exchange variation 826 156 200 92 - 284 1,558
Balance on December 31, 2015 131,179 10,037 18,643 24,653 - 46,331 230,843
Additions 19,306 4,773 2,248 3,889 65,500 5,069 100,785 Write-off (21,367) (4,361) (1,553) (323) - (1,954) (29,558)
Exchange variation (1,302) (54) (353) (287) - (472) (2,468)
Balance on December 31, 2016 127,816 10,395 18,985 27,932 65,500 48,974 299,602
Depreciation Balance on December 31, 2014 (64,833) (2,969) (7,441) (7,219) - (14,141) (96,603) Depreciation in the year (15,446) (1,862) (1,546) (2,180) - (5,390) (26,424)
Write-off 2,441 1,536 214 46 - 2,212 6,449 Exchange variation (402) (70) (100) (38) - (57) (667)
Balance on December 31, 2015 (78,240) (3,365) (8,873) (9,391) - (17,376) 117,245)
Depreciation in the year (18,552) (2,009) (1,849) (4,254) - (6,531) (33,195) Write-off 20,359 2,305 1,409 842 - 527 25,442 Exchange variation 940 75 202 295 - 154 1,666
Balance on December 31, 2016 (75,493) (2,994) (9,111) (12,508) - (23,226) (123,332)
Residual value Balance on December 31, 2016 52,323 7,401 9,874 15,424 65,500 25,748 176,270
Balance on December 31, 2015 52,939 6,672 9,770 15,262 - 28,955 113,598
Average annual depreciation rate 20% 20% 10% 10% to 20% - 5% to 20%
(i) The column “Property, plant and equipment in progress” includes assets related to the construction of the new headquarters in the amount of R$24,390, as well as assets acquired through lease that are still being used in the amount of R$41,110. On December 31, 2016, the Company executed an agreement of R$45,491 for the acquisition of assets, which was not recognized in the Company’s cash flow.

(A free translation of the original in Portuguese)
55
13. Intangible assets Intangible assets acquired separately are measured at cost at the time of their initial recognition, whereas the cost of intangible assets acquired in a business
combination corresponds to the fair value on the date of acquisition. Intangible assets and changes in this account are as follows:
Parent Company
Software Trademarks
& patents Customer
portfolio Other Goodwill
Total Intangible
assets
Cost or valuation Balance on December 31, 2014 196,069 63,149 208,969 16,337 368,025 852,549 Additions 41,039 - - - - 41,039 Merger 188 - - - - 188 Reclassification (i) - - - - (134,214) (134,214)
Balance on December 31, 2015 237,296 63,149 208,969 16,337 233,811 759,562
Additions 28,717 - - - - 28,717 Write-off (88) - - - - (88)
Balance on December 31, 2016 265,925 63,149 208,969 16,337 233,811 788,191
Amortization Balance on December 31, 2014 (120,328) (27,020) (136,113) (13,496) (134,214) (431,171) Amortization in the year (22,154) (4,201) (21,634) (1,654) - (49,643) Reclassification (i) - - - - 134,214 134,214
Balance on December 31, 2015 (142,482) (31,221) (157,747) (15,150) - (346,600)
Amortization in the year (28,881) (4,200) (21,372) (665) - (55,118) Write-off 28 - - - - 28
Balance on December 31, 2016 (171,335) (35,421) (179,119) (15,815) - (401,690)
Residual value
Balance on December 31, 2016 94,590 27,728 29,850 522 233,811 386,501
Balance on December 31, 2015 94,814 31,928 51,222 1,187 233,811 412,962
Average annual amortization rates 10% to 20% 6.7% to 8% 10% to 12.5% 10% to 50%

(A free translation of the original in Portuguese)
56
(i) Goodwill net of accumulated amortization recorded up to 2008.
Consolidated
Software
Trademarks & patents
Customer portfolio
R&D
Other Goodwill
Total intangible assets
Cost or valuation Balance on December 31, 2014 216,687 74,570 236,071 - 45,004 551,369 1,123,701 Additions 43,048 148 - - 3 414,216 457,415 Allocation of intangible assets 30,949 20,597 113,275 - 3,449 (168,270) - Acquisition of subsidiary 10,781 5,031 11,561 42,665 - - 70,038 Write-off (1,759) (3) - - 721 (3,973) (5,014) Reclassification (i) - - - - - (134,299) (134,299) Exchange variations 388 71 (12) - 444 - 891
Balance on December 31, 2015 300,094 100,414 360,895 42,665 49,621 659,043 1,512,732
Additions 33,939 83 (5) - - 1,720 35,737 Write-off (225) (3) - (4) - - (232) Exchange variations (364) (1,054) - - (98) (7,267) (8,783)
Balance on December 31,2016 333,444 99,440 360,890 42,661 49,523 653,496 1,539,454
Amortization Balance on December 31, 2014 (127,731) (31,456) (144,245) - (33,884) (134,299) (471,615) Amortization in the year (33,806) (7,356) (27,500) (1,306) (7,268) - (77,236) Write-off 1,090 3 - - (238) - 855 Reclassification (i) - - - - - 134,299 134,299 Exchange variations (19) (18) 12 - 2 - (23)
Balance on December 31, 2015 (160,466) (38,827) (171,733) (1,306) (41,388) - (413,720)
Amortization in the year (42,084) (8,078) (35,629) (8,377) (4,301) - (98,469) Write-off 107 - - - - - 107 Exchange variations 355 339 - (28) 98 - 764
Balance on December 31, 2016 (202,088) (46,566) (207,362) (9,711) (45,591) - (511,318)
Residual value
Balance on December 31, 2016 131,356 52,874 153,528 32,950 3,932 653,496 1,028,136
Balance on December 31, 2015 139,628 61,587 189,162 41,359 8,233 659,043 1,099,012
Average annual amortization rate 10% to 20% 6,7% to 8,00% 10% to 12,5% 20% 10% to 50%

(A free translation of the original in Portuguese)
57
The amortization of intangible assets is based on their estimated useful lives. Intangible assets identified,
the amounts recognized and useful lives of assets resulting from a business combination are based on a technical study by an independent specialized Company.
The “Other” column in the table above consists basically of non-competition rights arising from the
allocation of the purchase price of business combinations.
13.1. Goodwill and intangible assets identified in business combinations The breakdown and addition/write-off of goodwill in the fiscal years ended December 31, 2016 and 2015
is shown below:
2014
Addition /(write-off)
Purchase price allocation 2015
Foreign exchange
(c) Purchase price
allocation 2016
Bematech (b) - 388,456 (127,533) 260,923 (7,267) 1,720 255,376 RM 90,992 - - 90,992 - - 90,992 W&D 64,070 - - 64,070 - - 64,070 Virtual Age (a) 74,039 - (27,542) 46,497 - - 46,497 RMS 35,740 - - 35,740 - - 35,740 SRC 33,688 - - 33,688 - - 33,688 Datasul 30,084 - - 30,084 - - 30,084 Gens FDES 16,340 - - 16,340 - - 16,340 Seventeen 15,463 - - 15,463 - - 15,463 TOTVS Agroindústria 13,128 - - 13,128 - - 13,128 Neolog (a) - 25,760 (13,195) 12,565 - - 12,565 BCS 11,821 - - 11,821 - - 11,821 TotalBanco 6,008 - - 6,008 - - 6,008 Logo Center 5,703 - - 5,703 - - 5,703 Ciashop (d) 7,001 (2,536) - 4,465 - - 4,465 Hery 2,927 - - 2,927 - - 2,927 IOSSTS 2,643 - - 2,643 - - 2,643 TOTVS BMI 2,053 - - 2,053 - - 2,053 Midbyte 1,765 - - 1,765 - - 1,765 Mafipa 1,195 - - 1,195 - - 1,195 Setware 961 - - 961 - - 961 M2S 12 - - 12 - - 12 uMov.me (e) 1,437 (1,437) - - - - -
417,070 410,243 (168,270) 659,043 (7,267) 1,720 653,496
(a) Conclusion of allocation of intangible assets in 2015. (b) Conclusion of allocation of intangible assets in 2016. (c) Exchange variation of goodwill recognized in overseas subsidiary. (d) Write-off due to impairment in 2015. (e) Write-off of goodwill due to the sale of interest in the company.
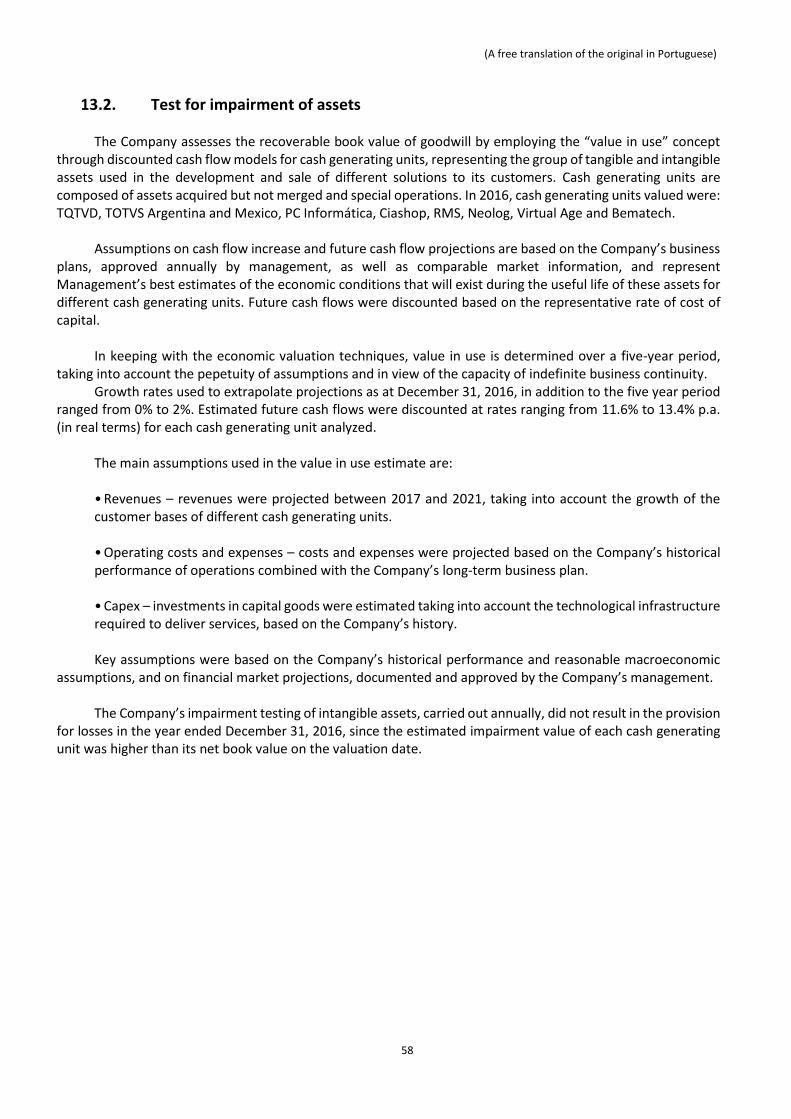
(A free translation of the original in Portuguese)
58
13.2. Test for impairment of assets The Company assesses the recoverable book value of goodwill by employing the “value in use” concept
through discounted cash flow models for cash generating units, representing the group of tangible and intangible assets used in the development and sale of different solutions to its customers. Cash generating units are composed of assets acquired but not merged and special operations. In 2016, cash generating units valued were: TQTVD, TOTVS Argentina and Mexico, PC Informática, Ciashop, RMS, Neolog, Virtual Age and Bematech.
Assumptions on cash flow increase and future cash flow projections are based on the Company’s business
plans, approved annually by management, as well as comparable market information, and represent Management’s best estimates of the economic conditions that will exist during the useful life of these assets for different cash generating units. Future cash flows were discounted based on the representative rate of cost of capital.
In keeping with the economic valuation techniques, value in use is determined over a five-year period,
taking into account the pepetuity of assumptions and in view of the capacity of indefinite business continuity. Growth rates used to extrapolate projections as at December 31, 2016, in addition to the five year period
ranged from 0% to 2%. Estimated future cash flows were discounted at rates ranging from 11.6% to 13.4% p.a. (in real terms) for each cash generating unit analyzed.
The main assumptions used in the value in use estimate are: • Revenues – revenues were projected between 2017 and 2021, taking into account the growth of the customer bases of different cash generating units.
• Operating costs and expenses – costs and expenses were projected based on the Company’s historical performance of operations combined with the Company’s long-term business plan. • Capex – investments in capital goods were estimated taking into account the technological infrastructure required to deliver services, based on the Company’s history. Key assumptions were based on the Company’s historical performance and reasonable macroeconomic
assumptions, and on financial market projections, documented and approved by the Company’s management. The Company’s impairment testing of intangible assets, carried out annually, did not result in the provision
for losses in the year ended December 31, 2016, since the estimated impairment value of each cash generating unit was higher than its net book value on the valuation date.

(A free translation of the original in Portuguese)
59
14. Payroll and labor obligations
Balances of salaries and charges payable are broken down as follows:
Parent Company Consolidated
2016 2015 2016 2015
Labor liabilities: Salaries payable 17,710 17,666 20,682 20,281 Pension plan payable 524 721 546 763 Vacations payable 55,971 51,071 75,954 69,686 Profit sharing and bonus 6,860 8,677 9,290 11,193 Other 14,795 13,236 17,753 18,274 95,860 91,371 124,225 120,197
Payroll liabilities FGTS (Government Severance Indemnity Fund for
Employees) payable 4,474 3,965 5,818 5,294 INSS (Brazilian Social Security Institute) payable 4,909 3,854 10,496 7,661
9,383 7,819 16,314 12,955
Total 105,243 99,190 140,539 133,152
15. Loans and financing
Loans are initially recognized at fair value, net of transaction costs incurred, and are shown at amortized cost. Any difference between the borrowed amounts (net of transaction costs) and the total amount payable is recognized in the income statement during the period when the loans are due, using the effective interest rate method.
The loan and financing operations are as follows:
Parent Company Consolidated
Annual financial charges 2016 2015 2016 2015
BNDES PROSOFT TJLP + 1.5 to 1.52% p.a. 431,756 575,877 451,214 594,285
BNDES PSI 3.5% to 4.0% p.a. 41,477 56,116 55,170 69,194
Financial lease 15.12% to 17.24% 43,882 - 44,017 -
BNDES – Social TJLP 2,386 3,182 2,386 3,182
BNDES Inovação TJLP + 0.52% p.a. - - 5,347 5,053
BNDES EXIM Banco do Brasil 5.5% to 8% p.a. - - 1,523 2,457
FINAME 7% p.a. - - 1,008 697
BNDES Internacionalização UMBND + 1.82% p.a. - - - 2,380
Secured accounts and other - - 1,076 1,061
519,501 635,175 561,741 678,309
Current liabilities 180,294 168,643 196,012 177,514
Non-current liabilities 339,207 466,532 365,729 500,795
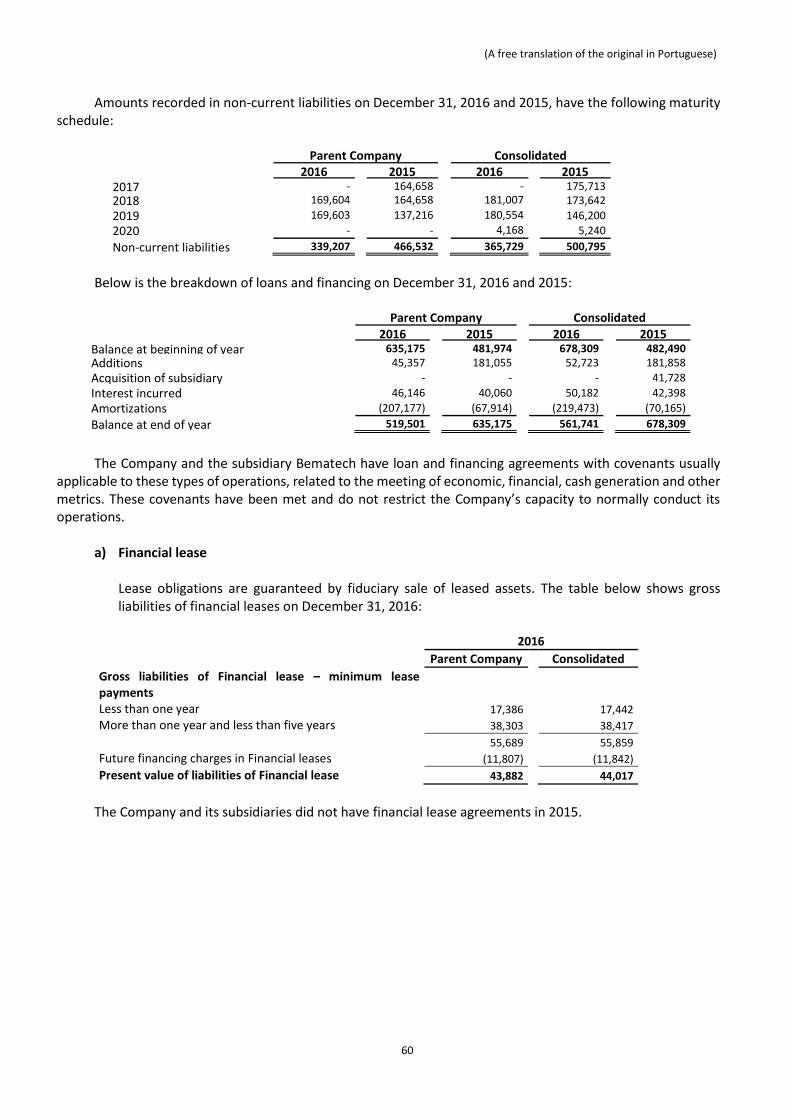
(A free translation of the original in Portuguese)
60
Amounts recorded in non-current liabilities on December 31, 2016 and 2015, have the following maturity schedule:
Parent Company Consolidated 2016 2015 2016 2015 2017 - 164,658 - 175,713
2018 169,604 164,658 181,007 173,642
2019 169,603 137,216 180,554 146,200
2020 - - 4,168 5,240
Non-current liabilities 339,207 466,532 365,729 500,795
Below is the breakdown of loans and financing on December 31, 2016 and 2015:
Parent Company Consolidated 2016 2015 2016 2015 Balance at beginning of year 635,175 481,974 678,309 482,490 Additions 45,357 181,055 52,723 181,858 Acquisition of subsidiary - - - 41,728 Interest incurred 46,146 40,060 50,182 42,398 Amortizations (207,177) (67,914) (219,473) (70,165)
Balance at end of year 519,501 635,175 561,741 678,309
The Company and the subsidiary Bematech have loan and financing agreements with covenants usually
applicable to these types of operations, related to the meeting of economic, financial, cash generation and other metrics. These covenants have been met and do not restrict the Company’s capacity to normally conduct its operations.
a) Financial lease
Lease obligations are guaranteed by fiduciary sale of leased assets. The table below shows gross liabilities of financial leases on December 31, 2016:
2016
Parent Company Consolidated
Gross liabilities of Financial lease – minimum lease payments
Less than one year 17,386 17,442
More than one year and less than five years 38,303 38,417
55,689 55,859
Future financing charges in Financial leases (11,807) (11,842)
Present value of liabilities of Financial lease 43,882 44,017
The Company and its subsidiaries did not have financial lease agreements in 2015.

(A free translation of the original in Portuguese)
61
16. Debentures On December 31, 2016 and 2015, the balance was broken down as follows:
Parent Company Consolidated
Issue Debentures Annual financial charges Unit price
2016 2015
2016 2015
1st series 40,002 IPCA + 3.5% limited to TJLP + 1.5% 0.60 - 24,737 - 24,737
2nd series 40,002 TJLP + 1.5% 0.60 - 24,737 - 24,737
Sole series 450 CDI + 2.25% 100.00 - - 31,877 45,384
Subtotal - 49,474 31,877 94,858
Premium due to non-conversion 58,784 49,428 58,784 49,428
Total 58,784 98,902 90,661 144,286
Current liabilities - 49,473 12,111 61,915
Non-current liabilities 58,784 49,429 78,550 82,371
Maturity of non-current amounts is as follows:
Parent Company Consolidated
2016 2015 2016 2015
2017 - 24,714 - 35,688
2018 - 24,715 7,651 35,689
2019 58,784 - 70,899 10,994
58,784 49,429 78,550 82,371
The changes occurred in the years considered was as shown below: Parent Company Consolidated
Debentures and premiums from non-conversions 2016 2015 2016 2015
Balance at beginning of year 98,902 112,854 144,286 112,854
Acquisition of subsidiary - - - 46,049
Interest incurred 12,169 23,810 17,468 25,026
Amortization (52,287) (37,762) (68,677) (37,762)
Debenture repurchase - - (2,416) (1,881)
Balance at end of year 58,784 98,902 90,661 144,286
a) Description of operations On August 19, 2008, shareholders approved raising R$200,000 through the issue of up to 100,000 Units,
represented by Brazilian Depositary Receipts, comprised by two non-detachable debentures, one of which is 1st series convertible and the other 2nd series convertible. On December 31, 2016, of the total Units issued by the Company, 60% were converted into common shares during 2010 through 2013, due to the attainment of the conditions described in the indenture. On August 19, 2016, the remaining principal and interest relating to debentures of the 1st and 2nd series totaling R$51,250 were amortized. The issue was not filed with the Brazilian Securities and Exchange Commission as the debentures issued by the Company were privately issued exclusively to the Company’s shareholders on the issue date, with no general market placement efforts.
In 2014, Bematech issued unsecured non-convertible debentures in a single series, which was placed through a public offer with restricted placement efforts, in the amount of R$50,000, composed of 500 debentures with unit value of R$100 each. The debentures will mature in July 2019 and have been amortized in nine half-yearly installments since July 2015. Interest is paid in half-yearly installments, with the first payment made on

(A free translation of the original in Portuguese)
62
January 10, 2015. With the corporate restructuring involving the two companies, TOTVS became the guarantor of all obligations assumed by Bematech with regard to debentures.
The debenture indenture have early maturity clauses if certain financial and non-financial covenants and
other ancillary obligations are not met. On December 31, 2016 and 2015, the Company and its subsidiaries were in full compliance with all covenants.
b) “Non-conversion of debentures” clause
In case of non-conversion, Company’s debentures will be entitled to a non-conversion premium, which for
the 1st series debentures will be equivalent to the difference between IPCA plus 8.0% p.a. and the interest effectively paid, and for the 2nd series debentures, interest of 3.5% p.a.
Premium for non-conversion of 1st series debentures will be restated by IPCA plus 8.0% p.a., while the 2nd
series debentures will be restated at TJLP plus 5.0% p.a. The premium for non-conversion will be paid in at most six installments until August 19,2019.
17. Liabilities due to investment acquisition These refer to installments payable due to acquisition of investments by the Company and its subsidiaries,
negotiated with installment payments, recorded in current and non-current liabilities, as follows:
Parent Company Consolidated 2016 2015 2016 2015
RMS - - 33,828 29,639 Virtual Age 25,650 33,247 25,650 33,247
RJ Participações - - 21,038 21,527
Neolog 12,998 12,859 12,998 12,859
W&D Participações - - 8,033 31,365
Seventeen 7,718 8,070 7,718 8,070
Bematech Sistemas - - 7,021 14,680
TOTVS Agroindústria 3,297 4,742 3,297 4,742
Datasul MG 3,265 2,884 3,265 2,884
Mafipa 1,326 1,174 1,326 1,174
Ciashop 982 1,186 982 1,186
Datasul Saúde MG 628 641 628 641
TotalBanco 110 99 110 99
Hery 602 545 602 545
SRC 212 196 212 196
Gens FDES - 5,914 - 5,914
GSR7 - - - 1,724
Total 56,788 71,557 126,708 170,492
Current liabilities 38,960 24,492 80,822 82,220
Non-current liabilities 17,828 47,065 45,886 88,272

(A free translation of the original in Portuguese)
63
Installments recorded as non-current liabilities mature as follows:
Year Parent Company
Consolidated 2018 17,828 18,387 2019 - 27,499 Non-current liabilities 17,828 45,886
On December 31, 2016 and 2015, the liabilities for acquisition of investments had secured accounts
consisting of CBD operations in the amounts mentioned below: Parent Company Consolidated 2016 2015 2016 2015
Investment guarantees in current liabilities 32,165 17,488 74,027 75,213
Investment guarantees in non-current liabilities 4,676 28,780 11,137 39,534
Total 36,841 46,268 85,164 114,747
18. Provision for contingencies related to legal proceedings
18.1. Ongoing proceedings with recorded provision for contingencies and legal liabilities related to legal proceedings
The Company and its subsidiaries, during the regular course of their operations, are parties in several legal
proceedings related to tax, social security, labor and civil matters. A provision for contingencies was set up by management, supported by its legal counsel and analysis of pending judicial proceedings, in an amount considered sufficient to cover probable losses. The provision amount reflects the best current estimate of the Company’s Management and its subsidiaries.
The assessment of the probability of loss includes the analysis of available evidence, the hierarchy of laws,
the current jurisprudence, the latest decisions of courts of law on each subject matter, as well as the opinion of external legal advisers. The assessments are continuously reviewed.
The amount of provisions constituted on December 31, 2016 and 2015 is as follows:
Parent Company Consolidated
2016 2015 2016 2015
Tax 2,259 1,323 13,879 12,965 Labor 54,513 40,070 58,816 45,466 Civil 28,551 28,999 29,530 32,076
85,323 70,392 102,225 90,507
The summary of main proceedings in progress is presented below.

(A free translation of the original in Portuguese)
64
Tax In December 2006, Bematech filed for a writ of mandamus against the District Director of the Federal
Revenue Service in Curitiba for the recognition of illegality/unconstitutionality of the inclusion of ICMS amounts in the PIS and COFINS calculation base. The lawsuit is currently in the Regional Federal Appellate Court of the 4th Region until the final decision of the full bench of the Federal Supreme Court on the matter. The updated amount for this lawsuit was R$8,203 on December 31, 2016 (R$7,645 on December 31, 2015).
Others lawsuits classified as probable loss deal with recovering tax dues that the Company and its
subsidiaries consider improper. These lawsuits amounted to R$5,676, on a consolidated basis, on December 31, 2016 (R$5,320 on December 31, 2015).
Labor Labor lawsuits classified as probable losses refer to lawsuits filed by former employees of the Company
requiring labor dues, as well as service provider companies, seeking recognition of employment relationship and other labor dues.
These lawsuits totaled R$58,816 on December 31, 2016 (R$45,466 on December 31, 2015), there being no
individually significant case.
Civil
Civil lawsuits classified as probable loss refer mainly to lawsuits filed by clients alleging certain problems with the delivery of products and/or services, application of the default increment, grace period in terminated contracts and undue collections.
Notable among the individually significant cases are: (i) Civil lawsuit filed by a client alleging problems resulting from the product implemented, which
would have caused direct and indirect damages to the client. The updated amount on December 31, 2016 was R$6,778 (R$5,644 on December 31, 2015). The Company has appealed against the merits of the unfavorable decision and the amount involved.
(ii) Action for damages due to alleged pain and suffering and pecuniary loss and filed by a client alleging problems in delivery of services. The updated amount claimed is R$6,336 on December 31, 2016 (R$5,663 on December 31, 2015), deemed as probable loss. The Company has appealed against the merits of the unfavorable decision and the amount involved.
Other lawsuits amounted to R$16,416 on December 31, 2016 (R$20,769 on December 31, 2015), there
being no other individually significant cases.

(A free translation of the original in Portuguese)
65
a) Changes in provision The breakdown of provisions in the year ended December 31, 2016 and 2015 is as follows:
At the end of 2015, the Company complemented its provisions by R$59,022 in General and Administrative
Expenses, due to the change in accounting estimate related to the calculation of contingent losses deemed as probable associated to legal proceedings, totaling R$64,450 in the year. During 2016, the Company added R$43,599 to provisions for contingencies associated with lawsuits.
The provisions reflect management’s best current estimate, which is based on information, external
counsel’s updated analyses and outcomes of previous legal proceedings in which the Company was defendant. This estimate is constantly reviewed by TOTVS’s risk monitoring and control.
Parent Company
Tax Labor Civil Total
Balances on December 31, 2014 78 9,537 1,239 10,854 (+) Additional provision 1,763 35,624 27,047 64,434 (+) Monetary restatement (12) 130 808 926 (-) Payment/Reversal (506) (5,221) (95) (5,822)
Balances on December 31, 2015 1,323 40,070 28,999 70,392 (+) Additional provision 2,223 22,850 14, 783 39,856 (+) Monetary restatement 146 3,656 2,964 6,766 (-) Reversal of provision not used (1,236) (4,298) (1,687) (7,221) (-) Write-off due to payment (197) (7,765) (16,508) (24,470)
Balances on December 31, 2016 2,259 54,513 28,551 85,323
Consolidated
Tax Labor Civil Total
Balances on December 31, 2014 78 9,537 2,903 12,518
(+) Acquisition of subsidiary 12,691 5,415 2,943 21,049 (+) Additional provision 1,763 35,637 27,050 64,450 (+) Monetary restatement 134 206 980 1,320 (-) Payment/Reversal (1,701) (5,329) (1,800) (8,830)
Balances on December 31, 2015 12,965 45,466 32,076 90,507 (+) Additional provision 3,255 25,124 15,220 43,599 (+) Monetary restatement 917 4,285 3,415 8,617 (-) Reversal of provision not used (1,567) (6,355) (3,061) (10,983) (-) Write-off due to payment (1,691) (9,704) (18,120) (29,515)
Balances on December 31, 2016 13,879 58,816 29,530 102,225

(A free translation of the original in Portuguese)
66
b) Court deposits The court deposits bound and not bound to provisioned lawsuits are stated below and are recorded under
non-current assets in the Company’s financial statements:
Parent Company Consolidated
Judicial deposits 2016 2015 2016 2015
Tax 4,713 5,557 13,457 13,723 Labor 23,155 17,119 25,085 19,282 Civil 1,978 9,012 2,361 10,402
29,846 31,688 40,903 43,407
18.2. Possible contingencies In addition, the Company and its subsidiaries are involved in other lawsuits, in which the risk of loss,
according to external lawyers and management, is possible, for which no provision has been recognized, as follows:
Parent Company Consolidated
Nature 2016 2015 2016 2015
Tax 119,384 79,204 163,310 97,861 Labor 94,069 69,022 143,842 76,717 Civil 252,984 237,312 276,985 248,788
466,437 385,538 584,137 423,366
The summary of the main proceedings in progress is presented below.
Tax As a result of inspection procedures of the Federal Revenue Service in 2006, the same issued a tax-
deficiency notice for understanding that the company made payments to unidentified beneficiaries, levying the withholding income tax (IRRF) on said amounts, and identified expenses allegedly not proved, adding the respective amounts to taxable income. The tax deficiency notice was challenged and is currently awaiting judgment of voluntary appeal. The updated amount for this lawsuit was R$10,580 on December 31, 2016 (R$10,021 on December 31, 2015).
In 2014, a tax deficiency notice was issued against the Company due to alleged joint liability for payment
of ICMS on untaxed outflows for installing outflow control software at the taxpayer (client). TOTVS was considered jointly liable because the Company installed at the taxpayer a software that controls outflow of goods. The tax deficiency notice was challenged, with decision partially favorable to TOTVS, and currently awaits judgment in the higher administrative court. The updated amount for this lawsuit on December 31, 2016 was R$14,385 (R$16,638 on December 31, 2015).
In 2016, a tax deficiency note issued by the Federal Revenue Service of Brazil requiring payment of IRPJ
and CSLL on presumed ICMS credits granted as subsidy by the State Government of Paraná in the years 2007 through 2009 to the subsidiary Bematech was reclassified from remote to possible loss. The change in the opinion of Company´legal counsel is explained by a jurisprudential dissent, and the updated amount of the proceeding on December 31, 2016 was R$28,224 (R$27,679 on December 31, 2015). This proceeding was deemed a remote loss in 2015.
The remaining tax cases classified as possible losses deal with recovering debt which the Company
considers improper. These cases totaled R$110,121 on December 31, 2016 (R$43,523 on December 31, 2015).

(A free translation of the original in Portuguese)
67
Labor Labor lawsuits classified as possible losses refer to lawsuits filed by former employees of the Company
requiring labor dues, as well as service provider companies, seeking recognition of employment relationship and other labor dues.
One of the individually significant tax cases is a lawsuit filed by the labor union challenging the application
of labor routines. The amount claimed by the plaintiff updated on December 31, 2016 is R$16,386. The Company filed its defense challenging the merits of the allegation of the union and the amount involved. The lawsuit is in the lower court.
The other labor lawsuits totaled R$127,456 on December 31, 2016 (R$76,717 on December 31, 2015),
there being no other individually significant cases.
Civil The civil lawsuits classified as possible losses relate mainly to lawsuits filed by customers alleging problems
in the provision of services offered to clients, application of standard price increase, and application of grace period in agreements rescinded and improper charges.
Notable among the individually significant cases are: (i) Action for damages due to information filed against agency agreement, in addition to moral and
material damages. The action, which involves the updated amount of R$64,233 on December 31, 2016 (R$52,569 on December 31, 2015), is in the initial stage and was deemed as possible loss.
(ii) Action for damages due to alleged problems in delivery of services, for the amount of R$63,101 on December 31, 2016 (R$51,835 on December 31, 2015). The lawsuit is in the initial stage.
(iii) Action for alleged emotional distress and pecuniary damage was filed due to commercial problems
with former franchisees. The updated amount claimed on December 31, 2016, deemed as possible loss, is R$11,370 (R$9,176 on December 31, 2015). The action is in evidentiary stage and the Company has already filed due defense.
(iv) Civil lawsuit filed by a client alleging problems resulting from the product implemented, which would have caused damages. The updated amount claimed on December 31, 2016, deemed as possible loss, is R$16,228 (R$18,706 on December 31, 2015). The lawsuit is in the trial stage and the Company has already filed due defense.
The other suits totaled R$122,053 on December 31, 2016 (R$116,502 on December 31, 2015), there being
no other individually significant cases.

(A free translation of the original in Portuguese)
68
19. Equity
a) Capital On December 31, 2016, the Company’s capital was composed of 165,637,727 (165,637,727 on December
31, 2015) issued and fully paid common registered shares, with no par value, as follows:
2016 2015
Shareholders Shares % Shares %
LC-EH Empreendimentos e Participações S.A. 26,760,990 16.16% 26,760,990 16.16% Fundação Petrobrás de Seguridade Social - Petros 16,042,359 9.69% 16,042,359 9.69% Genesis Asset Managers LLP 8,436,429 5.09% 8,436,429 5.09% BNDES Participações S/A 7,444,986 4.49% 7,444,986 4.49% Laércio José de Lucena Cosentino 1,916,118 1.16% 1,910,618 1.15% CSHG Senta Pua Fia 43,500 0.03% 43,500 0.03% Ernesto Mário Haberkorn 32,710 0.02% 38,810 0.02% Others 102,667,860 61.98% 102,760,760 62.04%
Outstanding shares 163,344,952 98.62% 163,438,452 98.67% Treasury Shares 2,292,775 1.38% 2,199,275 1.33%
Total in units 165,637,727 100.00% 165,637,727 100.00%
The authorized capital on December 31, 2016 was R$800,000. Additionally, within the authorized capital
limit, and pursuant to the plans approved by the Shareholders Meeting, the Board of Directors may grant stock options to the Company’s executives and employees, and to executives and employees of other companies that are direct or indirect subsidiaries of the Company, with no preemptive right to shareholders.
b) Capital reserves
The balance of capital reserves on December 31, 2016 and 2015 was broken down as follows:
2016 2015
Goodwill reserve (a) 99,260 99,260 Goodwill reserve for merger 14,330 14,330 Premium on acquisition of non-controlling interest (25,518) (25,518) Debentures converted into shares (fair value) (note 16) 44,629 44,629 Stock option plan (note 21) 29,323 26,512
162,024 159,213
(a) The goodwill reserve amount of R$99,260 is composed of R$31,557 relating to payments made in 2005 and R$67,703 relating to
corporate restructuring with Bematech occurred in October 2015.
c) Treasury shares As at September 28, 2016, the Company had a share buyback program for the acquisition of shares issued
by it, without capital reduction, for subsequent cancellation, disposal or to be held in treasury, for the purpose of increasing value for shareholders. On December 31, 2016, there was no share repurchase plan in effect.
On December 31, 2016 and 2015, the "Treasury Shares" item was as follows:

(A free translation of the original in Portuguese)
69
Number of shares (units)
Value (in
thousand)
Average price per share (in reais)
Balance on December 31, 2014 1,433,010 R$52,212 R$36.44
Acquired 1,600,005 R$48,872 R$30.54
Used (833,740) (R$30,072) R$36.07
Balance on December 31, 2015 2,199,275 R$71,012 R$32.29
Acquired 143,500 R$4,033 R$28.10
Used (50,000) (R$1,602) R$32.03
Balance on December 31, 2016 2,292,775 R$73,443 R$32.03
During the year ended December 31, 2016, the use of 50,000 treasury shares by the stock options plan
consumed R$187 from the capital reserve.
20. Dividends and Interest on Equity The Annual Shareholders Meeting held on April 26, 2016 decided on the distribution and payment of
dividends related to fiscal year 2015, in the amount of R$66,579 paid starting from May 11, 2016. On August 1, 2016, the Company’s Board of Directors authorized distribution and payment of interest on
equity amounting to R$43,605 relating to the 1st half of 2016 paid as of August 24, 2016. On December 16, 2016, the Board of Directors authorized the distribution and payment of interest on
equity to the Company’s shareholders, in the amount of R$40,615, to be calculated towards to the minimum mandatory dividend for the year ended December 31, 2016 to be paid as of May 10, 2017.
Parent Company
2016 2015
Net income for the year - Company 152,658 195,529 Accrual of legal reserve (article 193 of Law No. 6.404) (7,633) (9,776)
Net income after legal reserve allocation 145,025 185,753 Minimum mandatory dividend – 25% 36,256 46,438 Additional dividends proposed by management 55,339 80,656 Dividends proposed by management 91,595 127,094
Payment: Interest on capital 84,220 60,515 Dividends 7,375 66,579
91,595 127,094
Number of outstanding shares on December 31 163,344,952 163,438,452
Dividends and interest on equity per thousand shares - in reais 0.56 0.78
The balance of dividends and interest on equity payable of R$41,097 on December 31, 2016 (R$32,885 on
December 31, 2015) includes the distribution of the year, as presented above, as well as the residual balance of previous years.
Interest on equity is a part of dividends, which is deductible for purposes of Brazilian tax law. It is,
therefore, reported in different lines in order to show the income tax effect.

(A free translation of the original in Portuguese)
70
Mandatory minimum dividends are shown in the balance sheet as legal obligations (provisions in current
liabilities), and dividends in excess of this minimum as reserve in a special line in the statement of equity. The capital budget proposed by the Executive Board of the Company on December 31, 2016 allocates the
balance in the amount of R$54,237 from the reserve account to retained earnings, for the following investiments:
Investments: 2016
Investments in fixed and intangible assets 37,790 Investments in strategic projects 13,624 Payment of liabilities due to investments acquisitions 5,586
Total investments 57,000
Sources: Retained earnings at December 31, 2016 54,237 Operating resources to be generated in the operating and financial activities of the next year (unaudited) 2,763
Total sources 57,000
21. Stock option plan
The Company measures the cost of transactions settled with shares to its employees based on the fair
value of the shares on the grant date. The Incentive Plan based on Shares of the Company establishes rules for certain employees and directors
of TOTVS or other companies under its control so they can acquire shares of the Company through the grant of stock options, thereby aligning over the medium and long terms, interests of the beneficiaries and shareholders’ interests, broadening the sense of ownership and commitment of the executives through the concept of investment and risk, tying the granting of long-term incentives to the short-term results of the Company and the executives, and introducing the concept of a "Partners Program" which strengthens the power of retention of select strategic group. The Plan is administered by the Board of Directors of the Company, which establishes grant programs annually.
On December 15, 2015, the Company approved the new share-based compensation plan. This new plan
grants to beneficiaries the right to restricted shares that are divided into two programs:
(i) Regular restricted shares: the participants (employees subject to the Consolidation of Labor Laws (CLT) or the Bylaws) must acquire Company shares using 50% or 100% of net amount received as bonus, based on the profit or loss for the immediate preceding year. Participants opting to use 50% or 100% of the bonus to acquire Company shares will receive, respectively, 100% or 150% of a matching number of restricted shares.
(ii) Partner program: participants in this plan will be elected by the Company’s Board of Directors based on
performance appraisal and invest 100% of the net amount received as bonus for acquisition of Company shares in the regular restricted share plan. In this program, participants will receive, in addition to regular restricted shares and their corresponding matching shares, as per item (i) above, an additional number of Company restricted shares corresponding to 2/3 of its target bonus, multiplied by the percentage of individual targets met in the immediately preceding year. Additionally, the Board of Directors may grant to participants of the Partner Program a number of restricted shares corresponding to a portion or total of the target bonus pool without the need for respecting any proportion among participants.

(A free translation of the original in Portuguese)
71
The fair value of each option granted is estimated at the grant date based on the Black-Scholes option pricing model. For restricted shares, the fair value is the market value of each restricted share on the grant date. The main events relating to plans in force, the variables used in the calculations and the results are:
Grant Fair Value Assumptions
Expectation: Free interest
rate risk Term Maturity
No. Date
Number of options/shares
Exercise price in reais
Fair value of shares in reais
Dividends Volatility
8th 02.20.13 683,423 R$42.63 11.97 1.70% 30.09% 7.25% 3 years
9th 02.20.13 96,791 - 41.60 1.70% 30.09% 7.25% 3 years
10th 02.20.14 276,496 R$ 33.05 8.93 2.20% 29.51% 10.75% 3 years
11th 02.20.14 29,633 - 29.93 2.20% 29.51% 10.75% 3 years
12th 02.20.15 225,425 R$35.60 11.36 2.60% 29.61% 12.75% 3 years
13th 02.20.15 28,161 - 33.27 2.60% 29.61% 12.75% 3 years
14th 04.02.15 33,751 R$35.60 12.12 2.60% 29.61% 13.00% 3 years
15th 04.02.15 9,468 - 34.06 2.60% 29.61% 13.00% 3 years
16th 03.18.16 59,281 - 29.02 2.80% - - 3 years
17th 03.18.16 117,015 - 29.02 2.80% - - 3 years
18th 03.18.16 272,142 - 28.37 2.80% - - 3 years and 10
months
Changes in options during the year are shown below:
Parent Company and Consolidated
December 31, 2016 December 31, 2015
Amount (units)
Average Price (in reais)
Amount (units)
Average Price
(in reais)
Balance of options at beginning of year 1,048,340 33.36 1,732,518 32.14 Transactions: Acquisition of subsidiary (*) - - 13,895 41.94 Exercised (50,000) 28.30 (788,804) 29.80 Granted 448,438 0.01 296,805 31.09 Cancelled (123,497) 30.32 (206,074) 32.81 Expired (75,716) 34.99 - -
Balance of shopping options at end of year 1,247,565 21.87 1,048,340 33.36
(*) As a result of the corporate restructuring referred to in Note 3.1, the Company absorbed the options
granted and not exercised relating to Bematech’s share-based compensation plan, which became effective under the same conditions and characteristics of TOTVS’ plan.
On December 31, 2016, there were 419,634 vested options, since the period of 36 months from the date
of the 8th and 9th grants had already elapsed. The cumulative effect in the year ended December 31, 2016 was R$2,811 (R$3,992 on December 31, 2015),
recorded as share-based compensation expenses.
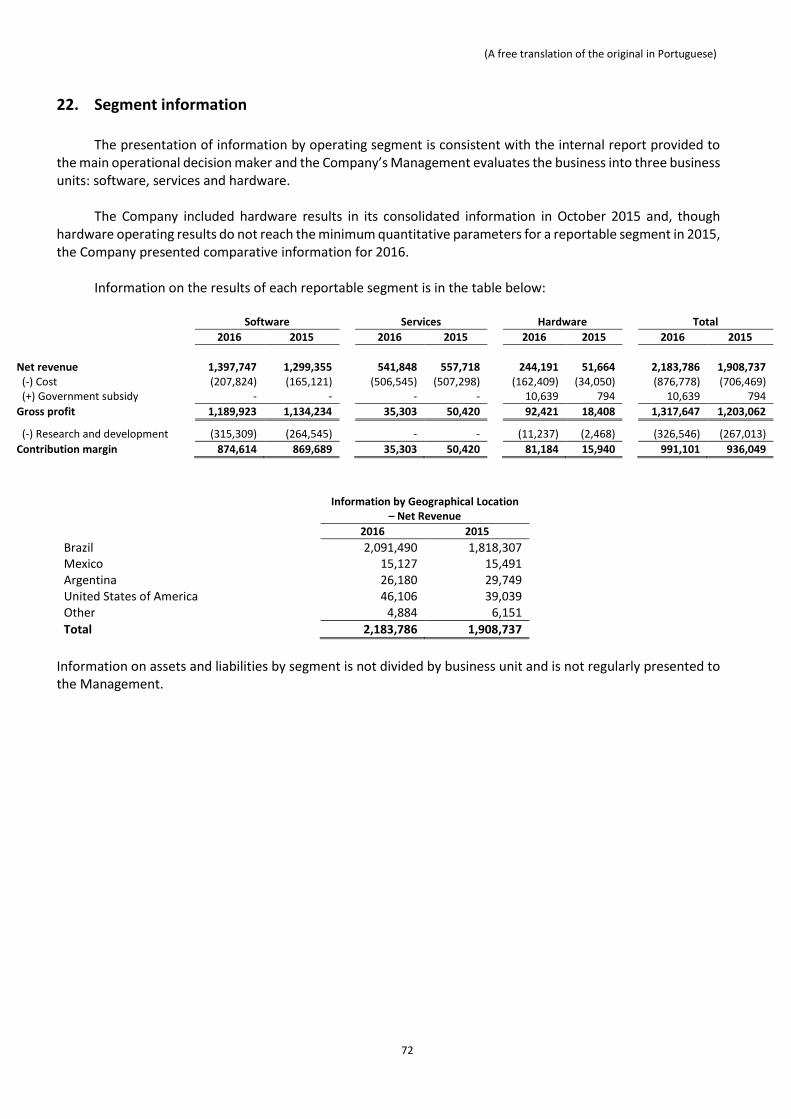
(A free translation of the original in Portuguese)
72
22. Segment information The presentation of information by operating segment is consistent with the internal report provided to
the main operational decision maker and the Company’s Management evaluates the business into three business units: software, services and hardware.
The Company included hardware results in its consolidated information in October 2015 and, though
hardware operating results do not reach the minimum quantitative parameters for a reportable segment in 2015, the Company presented comparative information for 2016.
Information on the results of each reportable segment is in the table below:
Software Services Hardware Total
2016 2015 2016 2015 2016 2015 2016 2015
Net revenue 1,397,747 1,299,355 541,848 557,718 244,191 51,664 2,183,786 1,908,737 (-) Cost (207,824) (165,121) (506,545) (507,298) (162,409) (34,050) (876,778) (706,469) (+) Government subsidy - - - - 10,639 794 10,639 794
Gross profit 1,189,923 1,134,234 35,303 50,420 92,421 18,408 1,317,647 1,203,062
(-) Research and development (315,309) (264,545) - - (11,237) (2,468) (326,546) (267,013)
Contribution margin 874,614 869,689 35,303 50,420 81,184 15,940 991,101 936,049
Information by Geographical Location – Net Revenue
2016 2015
Brazil 2,091,490 1,818,307 Mexico 15,127 15,491 Argentina 26,180 29,749 United States of America 46,106 39,039 Other 4,884 6,151
Total 2,183,786 1,908,737
Information on assets and liabilities by segment is not divided by business unit and is not regularly presented to the Management.

(A free translation of the original in Portuguese)
73
23. Earnings per share Basic earnings per share is calculated by dividing net income for the year (attributed to the parent
Company’s common shareholders) by the weighted average number of common shares outstanding in the year. Diluted earnings per share is calculated by dividing net income attributed to the holders of the Parent
Company’s common shares by the weighted average number of common shares available during the year plus the weighted average number of common shares that would be issued if all the potentially diluted common shares were converted into common shares:
Consolidated
2016 2015
Basic earnings per share Numerator
Net income for the year assigned to the Company’s shareholders 152,658 195,529
Denominator (in thousands of shares) Weighted average number of common shares outstanding 163,370 162,570
Basic earnings per share – in reais 0.93 1.20
Diluted earnings per share
Numerator Net income for the year assigned to the Company’s shareholders 152,658 195,529
Denominator (in thousands of shares)
Weighted average number of common shares outstanding 163,370 162,570 Weighted average number of stock options 939 1,443 Weighted average number of common shares adjusted according to
dilution effect 164,309 164,013 Diluted earnings per share – in reais 0.93 1.19
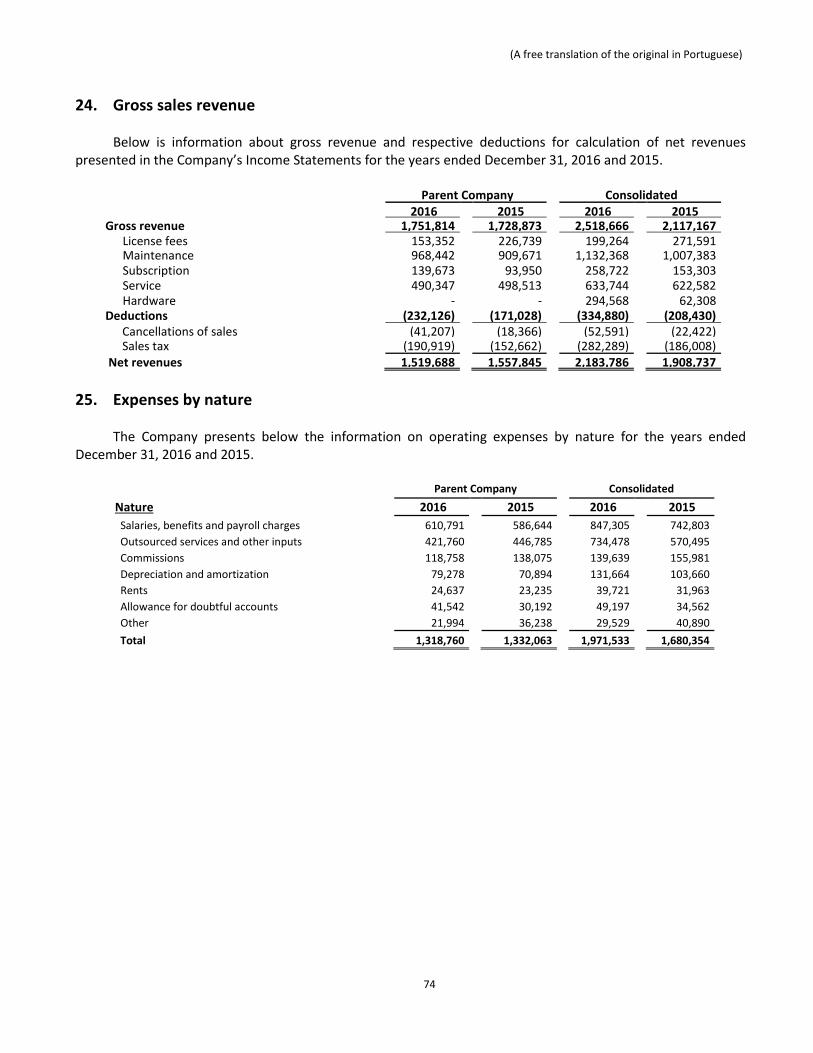
(A free translation of the original in Portuguese)
74
24. Gross sales revenue Below is information about gross revenue and respective deductions for calculation of net revenues
presented in the Company’s Income Statements for the years ended December 31, 2016 and 2015.
Parent Company Consolidated 2016 2015 2016 2015 Gross revenue 1,751,814 1,728,873 2,518,666 2,117,167
License fees 153,352 226,739 199,264 271,591 Maintenance 968,442 909,671 1,132,368 1,007,383 Subscription 139,673 93,950 258,722 153,303 Service 490,347 498,513 633,744 622,582 Hardware - - 294,568 62,308
Deductions (232,126) (171,028) (334,880) (208,430) Cancellations of sales (41,207) (18,366) (52,591) (22,422) Sales tax (190,919) (152,662) (282,289) (186,008)
Net revenues 1,519,688 1,557,845 2,183,786 1,908,737
25. Expenses by nature The Company presents below the information on operating expenses by nature for the years ended
December 31, 2016 and 2015. Parent Company Consolidated
Nature 2016 2015 2016 2015
Salaries, benefits and payroll charges 610,791 586,644 847,305 742,803
Outsourced services and other inputs 421,760 446,785 734,478 570,495
Commissions 118,758 138,075 139,639 155,981
Depreciation and amortization 79,278 70,894 131,664 103,660
Rents 24,637 23,235 39,721 31,963
Allowance for doubtful accounts 41,542 30,192 49,197 34,562
Other 21,994 36,238 29,529 40,890
Total 1,318,760 1,332,063 1,971,533 1,680,354

(A free translation of the original in Portuguese)
75
26. Financial income and expenses The financial income and expenses incurred for the years ended December 31, 2016 and 2015 were:
Parent Company Consolidated
2016 2015 2016 2015
Financial income Short-term investments yield 27,508 81,504 43,425 94,360 Interest received 7,505 6,441 12,524 7,494 Inflation adjustment gains 5,445 1,809 8,804 3,684 Adjustment to present value 6,268 6,249 6,275 6,271 Exchange gains - - 948 237 Other financial income 1,674 1,624 2,275 9,119
48,400 97,627 74,251 121,165
Financial expenses Interest incurred (63,440) (70,202) (80,854) (76,998) Inflation adjustment losses (7,747) (3,918) (10,883) (5,998) Bank expenses (4,024) (2,314) (5,698) (2,976) Discounts granted (526) (714) (3,428) (1,508) Adjustment to present value of liabilities (2,289) (2,749) (3,772) (3,044) Exchange losses (116) - (1,422) (759) Other financial expenses (1,887) (2,210) (4,926) (3,356)
(80,029) (82,107) (110,983) (94,639)
Net financial income (expenses) (31,629) 15,520 (36,732) 26,526
27. Private pension plan – defined contribution
The Company offers the TOTVS Private Pension Plan, managed by Itaú Vida e Previdência, which receives
contributions from the employees and the Company, described in the Program Membership Agreement. The three types of contribution are:
Basic Contribution – corresponds to 2% of the employee’s salary; in the case of executive officers, the contribution ranges from 2% to 5%.
Voluntary Contribution – made exclusively by employees, with no matching contribution by the Company;
Company Contribution – corresponds to 100% of the basic contribution. The Company is allowed to make extraordinary contributions, in the amounts and with the frequency it chooses.

(A free translation of the original in Portuguese)
76
28. Commitments assumed
28.1 Investments in Research and Development Bematech has a commitment to invest annually in information technology research and development
activities in Brazil. These commitments are required by the law on IPI tax benefits and government subsidy. The amount to be invested must correspond to 3% to 4% of net sales in the domestic market of IT goods
and services subject to incentives under the law. In this regard, Bematech must maintain the Basic Production Process (PPB) of the products authorized by Interministerial Decrees 770/05 and 109/02. On December 31, 2016, the amount invested was R$4,924 (R$5,534 on December 31, 2015), with an unrealized balance of R$34, which will be realized in the first quarter of 2017.
28.2 Operating lease The Company and its subsidiaries have diverse operating lease agreements for offices, as well as its current head office, as mentioned in Note 10.2, in addition to sheds for the plant and warehouses. These lease agreements have an average duration between 5 and 10 years, with each of them renewable at the end of the lease period at market rates. Most of the agreements can be canceled upon notice sent between 90 and 180 days in advance.
a) Commitments assumed In 2013, the Company signed an agreement with VIP VII – Empreendimentos e Participações Ltda., company formed by some direct or indirect members of TOTVS’ board of directors, that is, a group’s related party, to build and lease the new head office, with the purpose of integrating the company’s facilities in the city of São Paulo, for at least 10 years from the date of delivery, which is expected in March 2017. The estimated amount for payment of rents in the first 10 years is R$215,688, agreed under usual market conditions.
29. Non-cash items
Parent Company Consolidated
2016 2015 2016 2015
Exchange variation of investments abroad (19,544) 21,300 (19,544) 21,300
Acquisition of assets through lease (Note 12) 45,357 - 45,491 -
Total 25,813 21,300 25,947 21,300

(A free translation of the original in Portuguese)
77
30. Insurance coverage The Company and its subsidiaries, based on the opinion of their advisors, maintain insurance coverage at
amounts deemed sufficient to cover risks on their own and leased assets, and civil liability risks. Insured assets include own and leased vehicles, as well as buildings where the Company and its subsidiaries operate.
On December 31, 2016, the main insurances taken out were:
Type Insurance Company
Effective Maximum limit of Responsibility From To
Comprehensive corporate AIG + ACE June/2016 June /2017 R$298,992 General civil liability ACE June /2016 June /2017 R$8,000 Vehicles Itaú Seguros S.A. January/2016 January /2017 (*)Fipe Table D&O - Liability insurance of directors ACE June /2016 June /2017 R$60,000 E&O – Liability insurance of professionals XL Catlin June /2016 June /2017 R$10,000 International transportation Allianz November/2016 November /2017 R$1,000 Engineering risk Tokio Marine March/2016 March/2017 R$104,339
(*) Market value determined by FIPE - Institute of Economic Research.
* * *