
Total Viable Count and Concentration of Enteric Bacteria ...pjoes.com/pdf/7.5/295-306.pdf · Total...
12
Polish Journal of Environmental Studies Vol. 7, No. 5 (1998), 295-306 Total Viable Count and Concentration of Enteric Bacteria in Bottom Sediments from the Czarna Hańcza River , Northeast Poland S. Niewolak Olsztyn University of Agriculture and Technology, Department of Ecology, Sanitary Microbiology Unit, 10-957 Olsztyn-Kortowo, Poland Received 10 March, 1998 Accepted 8 June, 1998 Abstract Studies were carried out to determine counts of TVC 20°C, TVC 37°C, TC, FC, FS and Clostridium perfringens in bottom sediments of the Czarna Haricza River, from about 1 cm layer, at 10 stations located in Suwatki region (stations 1 and 2), in the villages Sobolewo (stations 3 and 4), the old river bed of the Czarna Hancza and its inflow to Lake Wigry (stations 5 and 6), and in the villages Czerwony Folwark, Mackowa Ruda, Buda Ruska and Wysoki Most (stations 7-10) east of Lake Wigry. Bottom sediments from stations 1 -4 and 7-10 were mostly sandy, while at stations 5 and 6 they dominated by silty clay. Studies were carried out in 1995 and 1996, at monthly intervals with the exception of winter. Water was examined at the same time. All groups of indicatory bacteria were 100-1000 times more numerous in the bottom sediments than in water. They were usually least numerous in sandy bottom sediments, especially in the villages Buda Ruska and Wysoki Most (stations 9 and 10), and the highest in silty clay sediments in the region of the old Czarna Hancza bed and its inflow to Lake Wigry (stations 5 and 6). Minimal and maximal counts of indicatory bacteria were noted in different months upon particular sampling stations. Only sometimes curves of their numbers corresponded to the respective courves of bacteria counts in water. It is suggested that sanitary and bacteriological studies of water should be supplemented by respective studies of the surface layer of bottom sediments. Keywords: River, bottom sediments, pollution, sanitary evaluation, indicatory microorganisms, bacteria. Introduction Sanitary and bacteriological evaluation of river also co- mprises bacteria indicatory of water pollution and its sani- tary state, and of enteric pathogenic bacteria present in the surface layers of bottom sediment [1, 2, 3]. It has been shown [23, 26, 29, 31, 39, 41] that bottom sediments in rivers and other water bodies contain at least 100-1000 times more of these bacteria than water above these sediments. Hence, they should be taken into account in determining the sources of aquatic epidemics. The presence of these bacteria in bottom sediments reflects faecal pollution even when at the given moment there are no such bacteria in the water [5] they can also cause secondary bacteriological pollution of water. The results of bacteriological examina- tion of river water reflect water quality only at the moment of sample collection. Determination of the numbers of bac- teria indicatory of sanitary state and of possible enteric pathogens in the bottom sediments makes it possible to predict possible water pollution in the nearest future, due to heavy rainfall and other causes [1, 2, 3]. The sedi- ment/water phases are not permanently separated. Mineral and organic particles of the bottom sediments, and enteric and other bacteria adsorbed by these particles, can pass to water column as a result of diving, rowing, walking in water, use of motor boats, navigation, sand extraction etc. [17, 29, 30]. Passage of bacteria from bottom sediment to water may also take place as a result of changes in salinity or concentration of organic matter [15]. It is belived [18, 19] that enteric bacteria are able to metabolize eluates of bottom sediments, and develop and multiply in such aquatic ecosystems free of predators [14]. In addition, survival of these micro-organisms in bottom sediments, in this from Salmonella genus, is higher than in
Transcript of Total Viable Count and Concentration of Enteric Bacteria ...pjoes.com/pdf/7.5/295-306.pdf · Total...

Polish Journal of Environmental Studies Vol. 7, No. 5 (1998), 295-306
Total Viable Count and Concentration of
Enteric Bacteria in Bottom Sediments from the
Czarna Hańcza River , Northeast Poland
S. Niewolak
Olsztyn University of Agriculture and Technology, Department of Ecology, Sanitary Microbiology Unit, 10-957 Olsztyn-Kortowo, Poland
Received 10 March, 1998 Accepted 8 June, 1998
Abstract
Studies were carried out to determine counts of TVC 20°C, TVC 37°C, TC, FC, FS and Clostridium perfringens in bottom sediments of the Czarna Haricza River, from about 1 cm layer, at 10 stations located in Suwatki region (stations 1 and 2), in the villages Sobolewo (stations 3 and 4), the old river bed of the Czarna Hancza and its inflow to Lake Wigry (stations 5 and 6), and in the villages Czerwony Folwark, Mackowa Ruda, Buda Ruska and Wysoki Most (stations 7-10) east of Lake Wigry. Bottom sediments from stations 1 -4 and 7-10 were mostly sandy, while at stations 5 and 6 they dominated by silty clay. Studies were carried out in 1995 and 1996, at monthly intervals with the exception of winter. Water was examined at the same time. All groups of indicatory bacteria were 100-1000 times more numerous in the bottom sediments than in water. They were usually least numerous in sandy bottom sediments, especially in the villages Buda Ruska and Wysoki Most (stations 9 and 10), and the highest in silty clay sediments in the region of the old Czarna Hancza bed and its inflow to Lake Wigry (stations 5 and 6). Minimal and maximal counts of indicatory bacteria were noted in different months upon particular sampling stations. Only sometimes curves of their numbers corresponded to the respective courves of bacteria counts in water. It is suggested that sanitary and bacteriological studies of water should be supplemented by respective studies of the surface layer of bottom sediments.
Keywords: River, bottom sediments, pollution, sanitary evaluation, indicatory microorganisms, bacteria.
Introduction
Sanitary and bacteriological evaluation of river also co-mprises bacteria indicatory of water pollution and its sani-tary state, and of enteric pathogenic bacteria present in the surface layers of bottom sediment [1, 2, 3]. It has been shown [23, 26, 29, 31, 39, 41] that bottom sediments in rivers and other water bodies contain at least 100-1000 times more of these bacteria than water above these sediments. Hence, they should be taken into account in determining the sources of aquatic epidemics. The presence of these bacteria in bottom sediments reflects faecal pollution even when at the given moment there are no such bacteria in the water [5] they can also cause secondary bacteriological pollution of water. The results of bacteriological examina-tion of river water reflect water quality only at the moment of sample collection. Determination of the numbers of bac-
teria indicatory of sanitary state and of possible enteric pathogens in the bottom sediments makes it possible to predict possible water pollution in the nearest future, due to heavy rainfall and other causes [1, 2, 3]. The sedi-ment/water phases are not permanently separated. Mineral and organic particles of the bottom sediments, and enteric and other bacteria adsorbed by these particles, can pass to water column as a result of diving, rowing, walking in water, use of motor boats, navigation, sand extraction etc. [17, 29, 30]. Passage of bacteria from bottom sediment to water may also take place as a result of changes in salinity or concentration of organic matter [15].
It is belived [18, 19] that enteric bacteria are able to metabolize eluates of bottom sediments, and develop and multiply in such aquatic ecosystems free of predators [14]. In addition, survival of these micro-organisms in bottom sediments, in this from Salmonella genus, is higher than in

296 Niewolak S.
water, and bottom sediments may be a reservoir of these bacteria [5, 27, 40].
In view of this, examination of bottom sediments for the presence of bacteria indicatory of sanitary state and of pat-hogenic enteric bateria may supply information on water quality in the nearest future [1, 2, 3]. So far there is no legislation requiring that sanitary-bacteriological examina-tions comprised also bottom sediments of rivers and other waters important for recreation and aquaculture. There are also no standard methods of collecting bottom sediments for such studies, although the first steps have already been made in this direction [1, 2, 3].
This paper presents the results of sanitary and bacterio-logical studies determining the counts of bacteria indicato-ry of water pollution (TVC 20°C, TVC 37°C) and sanitary state (TC, FC, FS, Clostridium perfringens) in the surface (0-1 cm) layer of bottom sediments of the Czarna Haricza River in the region of Suwalki and Wigry National Park. Studies were carried out in 1995 and 1996, together with water examinations.
Material and Methods
Czarna Haricza River
The Czarna Haricza River has its sources at height of 230 m above sea level, in a little Lake Jegliszki in the north part of Suwalki Lake District. This is the major river in the Niemen River catchment basin, and the biggest river of Wigry National Park. It flows through Lake Hancza (over 100 m deep) in its upper course; the middle course mean-ders considerably, the lower is regulated and included in the system of Augustowski Canal. The river is characteri-zed by considerable slope from its sources to Lake Wigry (1.9%o on the average) and looks like a typical mountain stream. Below the lake, the river flows in a post-glacial deep valley. This is where it gets water from the sources from the post-glacial plateau and valley sander. Just above the border of Wigry National Park, annual river flow is 3.7 m/sec ± 0.8 m. The highest water levels are observed in April and then either September or October, the lowest in January and February, and in August-September. During high spring waters, the river flow at its inlet to the lake is 2-3 times higher than the average annual value. During low water in winter and summer it amounts to some 55% of the annual average. The river section from Lake Wigry to the state border is a typical lowland one. Snow melting in April usually increases water flow in this section 1-2-fold com-pared to the annual average, which amounts here to 4.7 m/sec. The lowest flow (January and Febuary and August-September) reaches 60% of the annual average. Unit outflow from the catchment in this part of the Czarna Hari-cza River is 8.9 m3/sec/km2. Only north part of Lake Wigry participates in the river outflow [6]. The inlet of the Czarna Hancza River to Lake Wigry is classified as a strict nature reserve, with one of the biggest beaver colonies in the whole area of Wigry National Park.
A small Marycha rivulet is the major tributary of the Czarna Haricza. In the section below Suwalki the river is
Fig. 1. Situational sketch of Czarna Hancza in the region of Suwa-lki and the area of the Wigry National Park 1, 2, 3... 10 sites for collecting bottom sediment samples
connected with a covered canal discharging effluents (16,000-18,000 m3/d) from the treatment plant in Suwalki, in which all 3 degrees of purification take place [32].
Sample collection
Samples of bottom sediments from the Czarna Haricza River were collected at monthly intervals from May 1995 till November 1996 except the winter period. Surface sedi-ment layer (0-1 cm) was collected with a sampler of my own design, made of stainless steel, cone-shaped and at-tached to a stick. It collected both sandy-gravel (stations 1-4 and 7-10) sediments as well as silty-clay (stations 5-6). About 100 g were collected each time, placed into 300 cm3
sterile glass vessels with a twist-on cap. The samples were collected in the river current: 1) at 6 sites in the upper part of Czarna Haricza, from the village Stary Brod (station 1) to the river outlet into Lake Wigry (station 6), and 2) at 4 sites located in the lower river part, east of Lake Wigry, from the village Czerwony Folwark (station 7) to the vil-lage Wysoki Most (station 10) (Fig. 1).
Location of the sampling stations was as follows: station 1 - in the village Stary Brod, above Suwalki;
sandy bottom; station 2 - below Suwalki, 10 m before the discharge of
treated effluent from the municipal treatment plant in Su-walki; gravel bottom;
station 3 - in Sobolewo, at the first bridge along the Krzywe-Sobolewo road; gravel botoom;
station 4 - in Sobolewo, at the second bridge along the Krzywe-Sobolewo road; sandy bottom;
station 5 - in the region of the old river-bed of the Czarna Haricza River, on a forested and wet area; silty clay bottom;
station 6 - at a bridge about 100 m before the inflow of Czarna Haricza to Lake Wigry, in the region of Haricza Bay; silty-clay bottom;
station 7 - in Czerwony Folwark, at the bridge near Postaw Lake; sandy bottom;
station 8 - in Mackowa Ruda at the bridge; sandy bot-tom;
station 9 - in Buda Ruska at the bridge; sandy bottom; station 10 - in Wysoki Most, at the bridge; sandy bot-
tom.

Total Viable Count... 297
Microbiological studies
Microbiological studies of the collected bottom sedi-ment samples of the Czarna Haricza River comprised the following estimations:
1. the total number (CFU/1 GWW) of bacteria on broth agar after 72 h incubation at 20°C (TVC 20°C);
2. the total number (CFU/1 GWW) of bacteria on broth agar after 24 h incubation at 37°C (TVC 37°C);
3. the total number (MPN/1 GWW) of bacteria from Escherichia coli group (TC) on the Eijkman medium after 48 h incubation at 37°C;
4. the number (MPN/1 GWW) of faecal bacteria from Escherichia coli group (FC) on the Eijkman medium after 24 h incubation at 44.5°C;
5. the number (MPN/1 GWW) of faecal streptococci (FS) on the Slanetz and Bartley medium with sodium azide and crystal violet after 72h incubation at 37°C;
6. the number (MPN/1 GWW) of anaerobic spore-for ming bacteria reducing sulphites (Clostrifium perfringes) on the Wilson-Blair medium in pasteurised (80°C/10 min) samples of bottom sediments, after 18 h incubation at 37°C.
Total numbers of TVC 20°C and TVC 37°C were deter-mined according to the usual bacteriological technique for the examination of drinking water. The most probable nu-mber of TC, FC and FS was determined according to the Standard Methods [4]. The most probable number of Clost-ridium perfringens was determined with the method of di-lution, inoculating high column agar medium in test tubes. All determinations were made in 3 parallel repetitions. The results of examining TC, FC, FS and Clostridium perfrin-gens number were read from the MacCrady tables. A phy-siological solution of NaCL was used for sample dilution. Positive results for the presence of coliforms (TC) and fae-cal coliforms (FC) in the fermentation test on the Eijkman medium were checked on the Endo medium, on the lau-ryl-tryptone broth, and in biologicals stained with the Gram method. Positive results for the presence of faecal strepto-cocci (FS) obtained on Slanetz and Bartley media were checked on the m-Enterococcus agar. Typical colonies which grew on this medium were dark red; they were graf-ted into the broth to determine growth ability at 44.5°C, pH 9.6, and in the presence of 6.5% NaCI, as well as on skim-med milk with an addition of 0.01% methylene blue. Posi-tive results for the presence of Clostridium perfringens we-re checked in a fermentation sample on skimmed milk. Difco and Merck media were used.
Results
Numbers of bacteria indicatory of pollution and sanitary state found in the bottom sediments from Czarna Hancza River, along the section between Stary Brod above Suwalki and river inflow to Lake Wigry (Tables 1-5 and Figs 1-6).
Bacteria indicatory of pollution. Total numbers of TVC 20°C found in the sediments of this river section ranged from 2.7 thousand CFU/1 GWW in Stary Brod (sta-tion 1) to 4.65 milion CFU/1 GWW in the region of river inflow to Lake Wigry (station 6) (Table 1). Their lowest
Fig. 2. Seasonal changes of the number TVC 20°C in the bottom sediments of the Czarna Hancza from Stary Brod above Suwalki to its inflow to Wigry Lake 1, 2, 3...6 sites for collecting bottom sediment samples
numbers were usually found in the bottom sediments col-lected in Stary Brod (station 1) above Suwalki and in Sobo-lewo (station 3), the highest - at river inflow to lake Wigry (station 6). The highest numbers of these bacteria in Stary Br6d above Suwalki (station 1) and in the region of a waste treatment plant, 10 m above the discharge of the effluents from this plant (station 2) were observed at the beginning of September 1995 and 1996; in Sobolewo village the hig-hest numbers of these bacteria were recorded in November 1995 and 1996 (station 3), and in April 1996 (station 4). In the region of the old river-bed, and close to river inflow to Lake Wigry (stations 5 and 6), the highest TVC 20°C num bers were recorded in different periods of spring and sum mer 1995 and 1996 (Fig. 2).
Total numbers of TVC 37°C ranged from 600 CFU/1 GWW in the region of sewage treatment plant in Suwalki (station 2A) and in Sobolewo (station 3) to 468 thousand CFU/1 GWW at the outlet of Czarna Hancza River to Lake Wigry (station 6) (Table 1). Their mean values for the whole period of studies were the lowest in Sobolewo (sta-tion 4) and in the old river-bed of Czarna Hancza (station 5), and the highest at the river outlet to Lake Wigry (station 6). Bottom sediments collected in Stary Brod above Suwa-lki (station 1), and in the area of the treatment plant, 10 m above the effluent (station 2) contained the highest num-bers of these bacteria at the beginning of September 1995 and 1996. High numbers were also recorded in bottom sediments collected in Sobolewo in November 1995 and 1996 (station 3), and in April 1996 (station 4), in the samp les collected in the old river-bed and at the river outlet to Lake Wigry (stations 5 and 6) in spring and summer 1995 and 1996 (Fig. 3).
Bacteria indicatory of sanitary state. Total coliforms (TC) and numbers of faecal coliforms (FC) ranged, respec-tively, from 20 and 7 MPN/1 GWW in bottom sediments of Czarna Hancza River collected in Stary Brod (station 1)

298 Niewolak S.
Fig. 3. Seasonal changes of the number TVC 37°C in the bottom sediments of the Czarna Haricza from Stary Brod above Suwalki to its inflow to Wigry Lake. Explanations as in Figure 2.
above Suwalki, to 4500 and 1500 MPN/1 GWW at the river outflow to Lake Wigry (station 6) (Table 2). Average numbers in the study period were the lowest in bottom sediments collected in Stary Brod (station 1), the highest at
Fig. 5. Seasonal changes of the number FC in the bottom sedi-ments of the Czarna Haricza from Stary Br6d above Suwalki to its inflow to Wigry Lake. Explanations as in Figure 2.
the river inlet to Lake Wigry (station 6). In 1995 the two groups of bacteria were usually more numerous in July, in 1996 - in different months and stations (Figs 4 and 5). Number of faecal streptococci (FS) ranged from 9 MPN/1 GWW in the sediments collected in Stary Br6d (station 1) and in the region of sewage treatment plant in Suwalki (station 2) 10 m above the effluent discharge, to 14,000
Fig. 4. Seasonal changes of the number TC in the bottom sedi-ments of the Czarna Hancza from Stary Brod above Suwalki to its inflow to Wigry Lake. Explanations as in Figure 2.
Fig. 6. Seasonal changes of the number FS in the bottom sediments of the Czarna Hancza from Stary Brod above Suwatki to its inflow to Wigry Lake. Explanations as in Figure 2.

Total Viable Count... 299
Table 1. Mean (for study period) and range for the numbers of total viable counts at 20°C and 37°C in bottom sediments of particular sites in the Czarna Hancza River, 1995-1996.
Table 2. Mean (for study period) and range for the number of total coliforms (TC), faecal coliforms (FC) and faecal streptococci (FS) in bottom sediments of particular sites in the Czarna Hancza River, 1995-1996.

300 Niewolak S.
Table 3. Percentage distribution of the values of ratio FC:FS in the bottom sediments of particular sites in the Czarna Haricza River (1995-1996).
Table 4. Number of anaerobic spore-forming, sulphite reducing bacteria (Clostridium perfringens) in bottom sediments of particular sites in the Czarna Haricza River (1996).
Table 5. Analysis of sediment quality of the Czarna Hancza River using criteria given by Kavka [24] and Kohl [25], after Albinger [2], Percent distribution of samples relevant to the given class.

Total Viable Count... 301
MPN/1 GWW at the same station 2 and at the river inlet to Lake Wigry (station 6) (Table 2). The mean bacteria num-bers for the whole period of studies were the lowest in the bottom sediments collected in Sobolewo (stations 3 and 4), and the highest in the sediments collected at the outflow of Czarna Hancza to Lake Wigry (station 6). In 1995 there were usually more bacteria in July, September, October and November, in 1996 - in May and/or June; in Stary Brod above Suwalki (station 1) and in the region of sewage treatment plant in Suwalki, 10 m above the discharge of treated effluents (station 2) - also in August and September (Fig. 6). Ratio of FC:FS numbers ranged from 0.01 in the bottom sediment collected in Stary Brod above Suwalki (station 1) to 55.0 in the sediments collected at the outlet of Czarna Hancza River to Lake Wigry (station 6). In 22-69% of the examined sediment samples, FC:FS ratio was lower than 0.7; in 16-64% of the samples it ranged from 0.7 to 4.0, and in 7-36% of the examined samples it was higher than 4.0 (Table 3). At the subsequent stations the percen-tage of bottom sediment samples with FC:FS ratio lower than 0.7 decreased, while the per cent of samples with FC:FS ratio of 0.7-4.0 (stations 2-4) and more (stations 4-6) - increased.
Numbers of anaerobic sporeforms reducing sulphites (Clostridium perfringens) ranged in 1996 from <3 to 250 MPN/1 GWW. Their maximum numbers were usually re-corded in the sediments collected from the old bed of Czar-na Hancza River and at its inflow to Lake Wigry (stations 5 and 6) (Table 4). Numbers of bacteria indicatory of pol-lution (TVC 20°C, TVC 37°C) and of the sanitary state (TC, FC, FS, Clostridium perfringens), recalculated to 1 GDW of the bottom sediments, were about 20% higher in Stary Brod above Suwalki (station 1), in the region of Su-walki sewage treatment plant, 10 m above effluent dischar-ge (station 2), and in Sobolewo (stations 3 and 4), while they were, respectively, 6 and 11 times higher in the region the of the old river bed and the Czarna Hancza outlet to Lake Wigry (stations 5 and 6).
Numbers of bacteria indicatory of pollution and sanita-ry state, found in bottom sediments from the Czarna Han-cza River along the section between Czerwony Folwark and Wysoki Most, east of Lake Wigry (Tables 1-5 and Figu-res 7-12).
Bacteria indicatory of pollution. Total numbers of TVC 20°C in the bottom sediments of the Czarna Hancza River along the section from Czerwony Folwark to Wysoki Most ranged from 4 thousand CFU/1 GWW in Mackowa Ruda village (station 8) to 3.2 million/1 GWW in Buda Ruska village (station 9) (Table 1). Mean values for the study period were the lowest in the sediment samples col-lected in Czerwony Folwark and Wysoki Most (stations 7 and 10), and the highest in Buda Ruska (station 9). Maxi-mal numbers in particular years were recorded at different stations and months (Fig. 8).
Total TVC 37°C numbers ranged from 200 CFU/1 GWW in the sediments collected in Buda Ruska (station 9) to 890 thousand/1 GWW in the sediments collected in Cze-rwony Folwark (station 7) and 900 thousand/1 GWW in Buda Ruska (station 9). Mean values for the study period were the lowest in the sediments collected in Mackowa Ruda and Wysoki Most (stations 8 and 10), and the highest in the villages Czerwony Folwark and Buda Ruska (sta-tions 7 and 9) (Table 1). In 1995 the highest numbers were recorded in the sediments collected in June or July, and in
Fig. 7. Seasonal changes of the number TVC 20°C in the bottom sediments of the Czarna Hancza from Czerwony Folwark to Wysoki Most towards the east from Wigry Lake 7, 8, 9, 10 sites for collecting bottom sediment samples.
September and/or October; in 1996 they were recorded from August to November (Fig. 7).
Bacteria indicatory of the sanitary state. Numbers of total coliforms (TC) ranged from 0.7 MPN/1 GWW in the sediments collected in Czerwony Folwark (station 7) to 2500 MPN/1 GWW in those collected in the village Wysoki Most (station 10) (Table 2). The lowest mean values for the study period were recorded in sediments collected in the villages Mackowa Ruda and Buda Ruska (stations 8 and 9), the highest in the sediments in Czerwony Folwark (station 7). Seasonal changes of TC numbers were charac-terized by maximal values in different months at particular stations (Fig. 9). In the case of samples collected in Czer-
Fig. 8. Seasonal changes of the number TVC 37°C in the bottom sediments of the Czarna Hancza from Czerwony Folwark to Wy-soki Most towards the east from Wigry Lake. Explanations as in Figure 7.
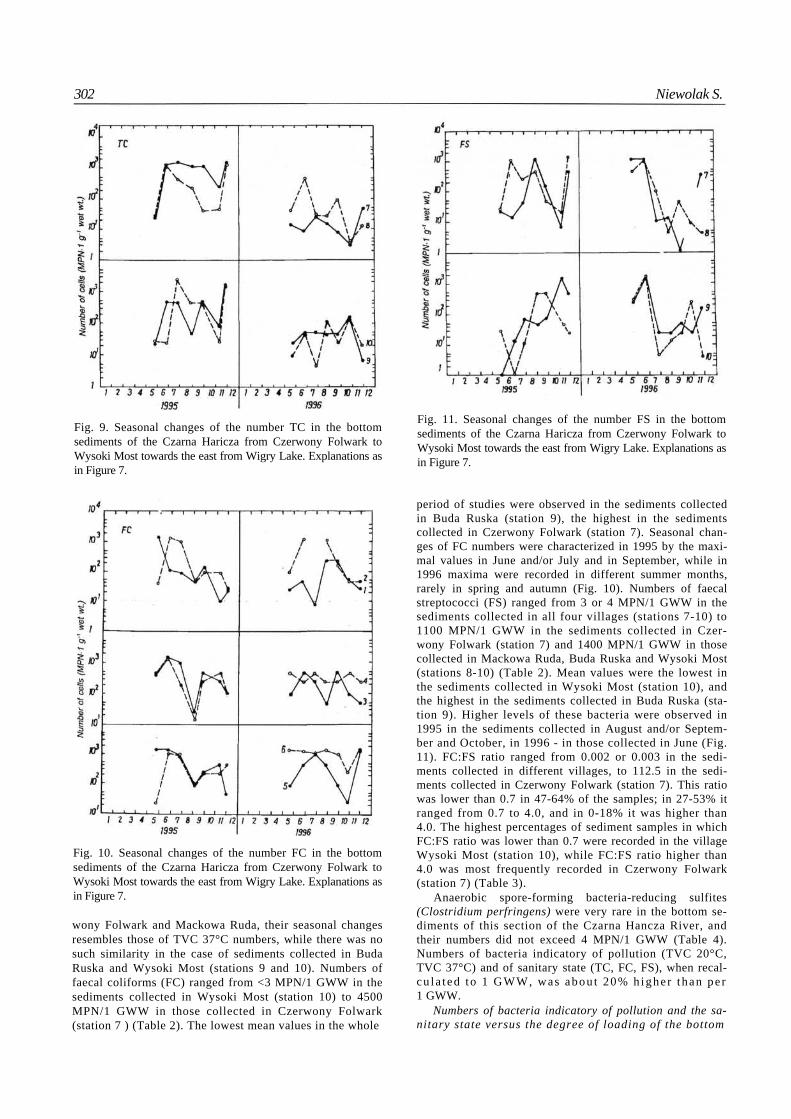
Fig. 11. Seasonal changes of the number FS in the bottom sediments of the Czarna Haricza from Czerwony Folwark to Wysoki Most towards the east from Wigry Lake. Explanations as in Figure 7.
period of studies were observed in the sediments collected in Buda Ruska (station 9), the highest in the sediments collected in Czerwony Folwark (station 7). Seasonal chan-ges of FC numbers were characterized in 1995 by the maxi-mal values in June and/or July and in September, while in 1996 maxima were recorded in different summer months, rarely in spring and autumn (Fig. 10). Numbers of faecal streptococci (FS) ranged from 3 or 4 MPN/1 GWW in the sediments collected in all four villages (stations 7-10) to 1100 MPN/1 GWW in the sediments collected in Czer-wony Folwark (station 7) and 1400 MPN/1 GWW in those collected in Mackowa Ruda, Buda Ruska and Wysoki Most (stations 8-10) (Table 2). Mean values were the lowest in the sediments collected in Wysoki Most (station 10), and the highest in the sediments collected in Buda Ruska (sta-tion 9). Higher levels of these bacteria were observed in 1995 in the sediments collected in August and/or Septem-ber and October, in 1996 - in those collected in June (Fig. 11). FC:FS ratio ranged from 0.002 or 0.003 in the sedi-ments collected in different villages, to 112.5 in the sedi-ments collected in Czerwony Folwark (station 7). This ratio was lower than 0.7 in 47-64% of the samples; in 27-53% it ranged from 0.7 to 4.0, and in 0-18% it was higher than 4.0. The highest percentages of sediment samples in which FC:FS ratio was lower than 0.7 were recorded in the village Wysoki Most (station 10), while FC:FS ratio higher than 4.0 was most frequently recorded in Czerwony Folwark (station 7) (Table 3).
Anaerobic spore-forming bacteria-reducing sulfites (Clostridium perfringens) were very rare in the bottom se-diments of this section of the Czarna Hancza River, and their numbers did not exceed 4 MPN/1 GWW (Table 4). Numbers of bacteria indicatory of pollution (TVC 20°C, TVC 37°C) and of sanitary state (TC, FC, FS), when recal-cu la t ed to 1 GWW, was abou t 20% h ighe r t han pe r 1 GWW.
Numbers of bacteria indicatory of pollution and the sa-nitary state versus the degree of loading of the bottom
302 Niewolak S.
Fig. 9. Seasonal changes of the number TC in the bottom sediments of the Czarna Haricza from Czerwony Folwark to Wysoki Most towards the east from Wigry Lake. Explanations as in Figure 7.
Fig. 10. Seasonal changes of the number FC in the bottom sediments of the Czarna Haricza from Czerwony Folwark to Wysoki Most towards the east from Wigry Lake. Explanations as in Figure 7.
wony Folwark and Mackowa Ruda, their seasonal changes resembles those of TVC 37°C numbers, while there was no such similarity in the case of sediments collected in Buda Ruska and Wysoki Most (stations 9 and 10). Numbers of faecal coliforms (FC) ranged from <3 MPN/1 GWW in the sediments collected in Wysoki Most (station 10) to 4500 MPN/1 GWW in those collected in Czerwony Folwark (station 7 ) (Table 2). The lowest mean values in the whole

Total Viable Count... 303
sediments in the Czarna Haiicza River with easily decom-posing organic matter and human and animal faeces.
Taking into account the numbers of TVC 20°C and FC in the bottom sediments of the two sections of the Czarna Hancza River (from Stary Brod above Suwalki to the out-flow of Czarna Hancza to Lake Wigry, and from Czerwony Folwark to Wysoki Most, east of Lake Wigry), as well as the bacteriological criteria for bottom sediment loading gi-ven by Kavka [24] and Kohl [25] and modified by Albinger [2] (Table 5), the degree of sediment loading with organic matter and human and animal faeces in the Czarna Hancza River may be assessed as follows:
1. Bottom sediments of the river in the village Stary Brod (station 1) above Suwalki were characterized by very low loading with organic matter easily decomposed by he terotrophic bacteria, and by very low, moderate, moderate ly high or high loading with human and animal faeces.
2. Bottom sediments of Czarna Hancza River in the region of the sewage treatment plant in Suwalki (station 2), 10 m above the effluent discharge, were characterised by low or exceptionally low loading with organic matter deco mposed by heterotrophic bacteria, and by low, moderate or moderately high loading with human and animal faeces.
3. Bottom sediments of the river in the village Sobole- wo (stations 3 and 4) were characterized by very low loa ding with organic matter easily decomposed by heterotrop hic bacteria, and by usually low or moderate loading with human and animal faeces.
4. Bottom sediments of the Czarna Hancza River in the region of the old river bed and its inflow to Lake Wigry (stations 5 and 6) were usually characterized by very low, rarely low or moderate loading with organic matter easily decomposed by heterotrophic bacteria, and by low, mode rate or moderately high loading with human and animal faeces.
5. Bottom sediments of Czarna Hancza, in the river section from Czerwony Folwark to Wysoki Most (stations 7-10), were characterized by very low, exceptionally low (in the village Buda Ruska) and moderate loading with organic matter easily decomposed by heterotrophic bacte ria, and by very low, low and moderate (in the villages Buda Ruska and Wysoki Most, stations 9 and 10), and by moderately high (in the villages Czerwony Folwark and Mackowa Ruda, stations 7 and 8) loading with human and animal faeces (Table 5).
Discussion
Numbers of indicatory bacteria in the bottom sedi-ments of the Czarna Hancza River
Diversified bottom character in the examined sections of the Czarna Hancza River (sandy, gravel, loamy) as well as varying degree of water pollution [31] were reflected in different numbers of TVC 20°C, TVC 37°C, TC, FC, FS and Clostridium perfringens at particular sampling stations and in different villages. Lower numbers of all these bac-teria indicatory of pollution and sanitary state were found in the sediment samples collected in Stary Brod above Su-walki (station 1), in the area of sewage treatment plant, 10 m above the effluent discharge in Suwalki (station 2), in Sobolewo village (stations 3 and 4) and in the river section from Czerwony Folwark to Wysoki Most (stations 7-10)
compared to samples collected in the region of the old river bed and river inflow to Lake Wigry (stations 5 and 6). This was probably due to sandy or gravel bottom at the first stations. Contrary to this, higher numbers of the respective indicatory bacteria were found in the bottom sediments of Czarna Hancza River collected at river inflow to Lake Wi-gry and in the old river bed (stations 5 and 6), where the bottom was muddy.
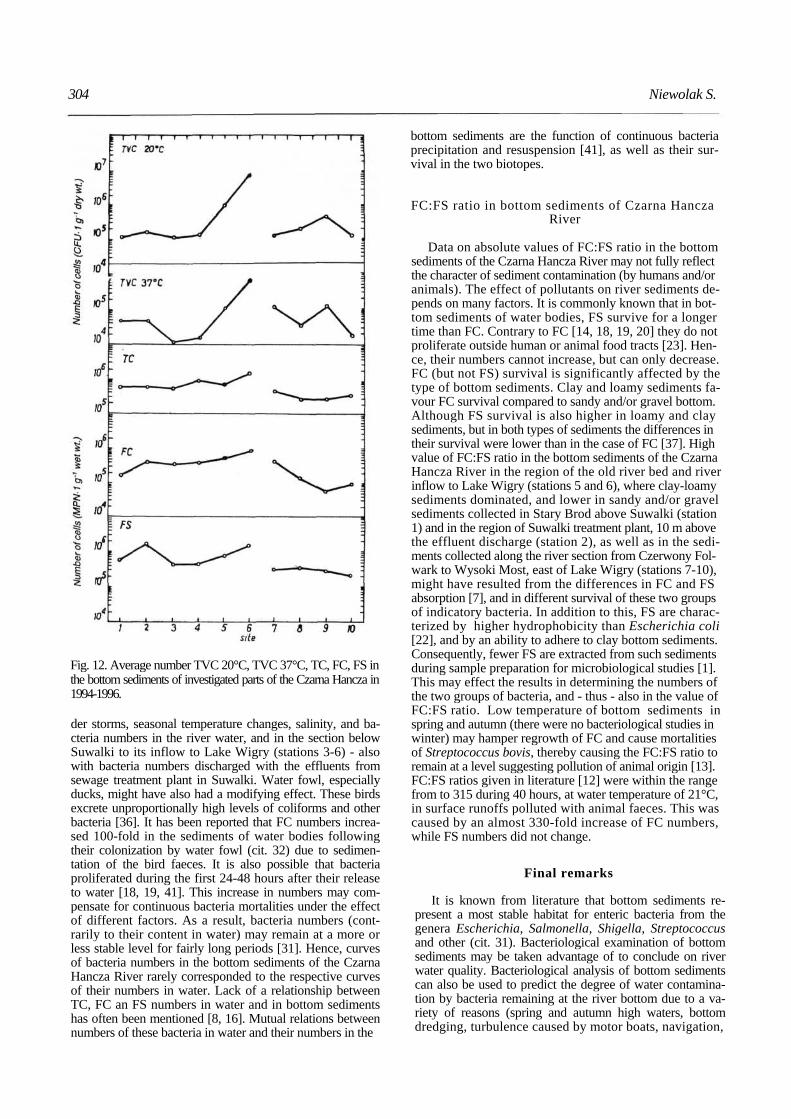
Sandy and/or gravel bottom of the Czarna Hancza River at the majority of stations, with low organic matter content (dry weight after 24 h heating in 105°C amounted to about 80% of wet weight), does not favour nutrient absorption or colonization and survival of bacteria. Smaller or greater differences in the numbers of indicatory bacteria, found in the samples collected at Stary Brod, in the region of Suwalki sewage treatment plant, in Sobolewo (stations 1-4), and in the river section from Czerwony Folwark to Wysoki Most (stations 7-10), might have been due to a variety of reasons. Slightly higher numbers of these bacteria were found in the sediments collected in the vicinity of the sewage treatment plant in Suwalki (station 2), 10 m above effluent discharge to the river compared to the samples collected in Stary Brod above Suwalki (station 1); this was probably due to higher numbers of these bacteria in the river water [3]. On the other hand, low numbers of the respective indicatory bacteria in the sediments of Czarna Hancza River in Sobolewo (especially at station 3) notwithstanding their high numbers in the river water [33] may be explained by specific hydrologic conditions. Station 3 was located 2-3 m below a waterfall which had once been constructed at a water mill sluice. The waterfall prevented sedimentation and absorption of nutrients and organic matter by sand and gravel particles, thereby preventing absorption of indicatory bacteria from the water. Quite the opposite: turbulence and relocation of the bottom sediments caused by the waterfall must have enhanced liberation of these bacteria from the sediments. It is known from literatue [18, 19] that sand grains adsorb bacteria in a very loose way. Consequently, cascade water flow at this station might have played a similar role as river bed dredging, or high and low tides [8, 17, 28, 30, 34, 35]. Higher numbers of indicatory bacteria in the sediments of the Czarna Hancza River in the region of the old river bed and its inflow to Lake Wigry (stations 5 and 6) are explained by their higher numbers in the river water, and by bottom sediment, where clay-muddy sediments dominated (dry weight of the sediments after 24 h heating in 105°C was, respectively, 1.6 and 0.95% of their wet weight), favoring bacteria survival [3, 10, 11, 42] and ensuring physical protection against grazing [9, 21, 38], In addition to this, nutrient composition in such sediments is different than in water [14], probably more assimilable by the enteric bacteria. The discussed changes of the numbers of indicatory bacteria are presented in Fig. 12. This figure presents mean numbers of TVC 20°C, TVC 37°C, TC, FC and FS for the whole period of studies and consecutively for each of the 10 stations.
Seasonal changes of the numbers of indicatory bacteria in bottom sediments of the Czarna Hancza
River.
Seasonal changes of indicatory bacteria in the bottom sediments of the Czarna Hancza River could have been connected with atmospheric conditions, precipitation, thun-
304 Niewolak S.
Fig. 12. Average number TVC 20°C, TVC 37°C, TC, FC, FS in the bottom sediments of investigated parts of the Czarna Hancza in 1994-1996.
der storms, seasonal temperature changes, salinity, and ba-cteria numbers in the river water, and in the section below Suwalki to its inflow to Lake Wigry (stations 3-6) - also with bacteria numbers discharged with the effluents from sewage treatment plant in Suwalki. Water fowl, especially ducks, might have also had a modifying effect. These birds excrete unproportionally high levels of coliforms and other bacteria [36]. It has been reported that FC numbers increa-sed 100-fold in the sediments of water bodies following their colonization by water fowl (cit. 32) due to sedimen-tation of the bird faeces. It is also possible that bacteria proliferated during the first 24-48 hours after their release to water [18, 19, 41]. This increase in numbers may com-pensate for continuous bacteria mortalities under the effect of different factors. As a result, bacteria numbers (cont-rarily to their content in water) may remain at a more or less stable level for fairly long periods [31]. Hence, curves of bacteria numbers in the bottom sediments of the Czarna Hancza River rarely corresponded to the respective curves of their numbers in water. Lack of a relationship between TC, FC an FS numbers in water and in bottom sediments has often been mentioned [8, 16]. Mutual relations between numbers of these bacteria in water and their numbers in the
bottom sediments are the function of continuous bacteria precipitation and resuspension [41], as well as their sur-vival in the two biotopes.
FC:FS ratio in bottom sediments of Czarna Hancza River
Data on absolute values of FC:FS ratio in the bottom sediments of the Czarna Hancza River may not fully reflect the character of sediment contamination (by humans and/or animals). The effect of pollutants on river sediments de-pends on many factors. It is commonly known that in bot-tom sediments of water bodies, FS survive for a longer time than FC. Contrary to FC [14, 18, 19, 20] they do not proliferate outside human or animal food tracts [23]. Hen-ce, their numbers cannot increase, but can only decrease. FC (but not FS) survival is significantly affected by the type of bottom sediments. Clay and loamy sediments fa-vour FC survival compared to sandy and/or gravel bottom. Although FS survival is also higher in loamy and clay sediments, but in both types of sediments the differences in their survival were lower than in the case of FC [37]. High value of FC:FS ratio in the bottom sediments of the Czarna Hancza River in the region of the old river bed and river inflow to Lake Wigry (stations 5 and 6), where clay-loamy sediments dominated, and lower in sandy and/or gravel sediments collected in Stary Brod above Suwalki (station 1) and in the region of Suwalki treatment plant, 10 m above the effluent discharge (station 2), as well as in the sedi-ments collected along the river section from Czerwony Fol-wark to Wysoki Most, east of Lake Wigry (stations 7-10), might have resulted from the differences in FC and FS absorption [7], and in different survival of these two groups of indicatory bacteria. In addition to this, FS are charac-terized by higher hydrophobicity than Escherichia coli [22], and by an ability to adhere to clay bottom sediments. Consequently, fewer FS are extracted from such sediments during sample preparation for microbiological studies [1]. This may effect the results in determining the numbers of the two groups of bacteria, and - thus - also in the value of FC:FS ratio. Low temperature of bottom sediments in spring and autumn (there were no bacteriological studies in winter) may hamper regrowth of FC and cause mortalities of Streptococcus bovis, thereby causing the FC:FS ratio to remain at a level suggesting pollution of animal origin [13]. FC:FS ratios given in literature [12] were within the range from to 315 during 40 hours, at water temperature of 21°C, in surface runoffs polluted with animal faeces. This was caused by an almost 330-fold increase of FC numbers, while FS numbers did not change.
Final remarks
It is known from literature that bottom sediments re-present a most stable habitat for enteric bacteria from the genera Escherichia, Salmonella, Shigella, Streptococcus and other (cit. 31). Bacteriological examination of bottom sediments may be taken advantage of to conclude on river water quality. Bacteriological analysis of bottom sediments can also be used to predict the degree of water contamina-tion by bacteria remaining at the river bottom due to a va-riety of reasons (spring and autumn high waters, bottom dredging, turbulence caused by motor boats, navigation,

Total Viable Count... 305
rowing). Bacteriological examination of water reflects wa-ter pollution only at the moment of sampling. Sampling and analyses of water along the whole river length, in the middle of current and close to the banks, above and below pollution discharge seems impractical due to high costs and considerable time demand. If bacteriological analyses of bottom sediments were included in the examination of river quality, this problem would be solved [3]. Time needed to perform bacteriological analysis of water is an important factor that must be taken into consideration in establishing sampling sites. So far there is no legislation requiring bac-teriological examination of bottom sediments for the con-tent of bacteria indicatory of pollution and sanitary state. Moreover, there are no standard methods of sample collec-tion ensuring representative results of analyses. As num-bers of bacteria indicatory of sanitary state and of enteric bacteria decrease with depth; it has been suggested [1] that the surface sediment layer (0-1 cm) be sampled. Examina-tion of deeper layers may yield underestimated results. This is especially important in determining FC numbers.
Conclusions
1. Bottom sediments of the Czarna Hancza River differed with respect to the numbers of bacteria indicatory of pollution (TVC 20°C, TVC 37°C) and sanitary state (TC, FC, FS, Clostridium perfringens). The lowest nu mbers were found in the case of sandy and/or gravel bottom, the highest in clay-loamy sediments.
2. Lower numbers of indicatory bacteria found in the san dy and gravel bottom of the Czarna Hancza River in Sobolewo (station 3) compared to other villages in which river bottom was of the same character (stations 1, 2a, 4, 7-10) were due to cascade water flow and bacteria and nutrient washing out from sand and gravel particles.
3. Seasonal changes in the numbers of indicatory bacteria in different types of bottom sediments of the Czarna Hancza River may be caused by thunderstorms, changes in bacteria numbers in the effluents discharged from the local sewage treatment plant, temperature in water and sediments, or survival of bacteria.
4. Sandy and/or gravel bottom of the Czarna Hancza River at the majority of sampling stations, and loose attach ment of indicatory bacteria to sand grains results in the fact that even small movements (dredging, motor boats, rowing boats) may liberate to water bacteria indicatory of sanitary state and enteric bacteria.
Acknowledgments
I am very grateful to M. Kamiński DSc, L. Krzysz-tofiak DSc. and J. Woźnica MSc. (Wigry National Park at Krzywe) for help in carrying out the present research in the area of the Wigry National Park and its surroundings. I am also very grateful to D. Krajewska MSc, J. Makowska MSc, Z. Marcinkowska MSc. and S. Szczepkowska MSc, for technical help in realization of this research.
This study was financially supported under Project KBN 05.030.207 and in part by the Wigry National Park at Krzywe near Suwalki.
References
1. ALBINGER O. Saprophytic and faecal coliform bacteria in the sediment of the impoundment Altenworth. Verh. Internat. Verein Limnol., 24, 1324, 1991.
2. ALBINGER O. Bacteriological investigation of water and se diment of the River Danube between Streamkilometers 16 and 1868 from March 13rd-17th Arch. Hydrobiol., Suppl. 84 (Ve- rbff. Arbeitsgemeinschaft Donauforschung 8), 2-4, 115, 1992.
3. ALBINGER O. Relationship between number of saprophytic and faecal coliform bacteria and particle size of river sedi ment. Arch. Hydrobiol., Suppl 101, Large Rivers 9, 1, 23, 1993.
4. A.P.H.A. (American Public Health Association), Standard Methods for the Examination of Water and Wastewater, 18 Ed., Eds.: G. E. Greenberg, L. S. Clesceri, A. D. Eaton, Publ. Office American Public Health Association. Washington, D. C, 9-1-9-147, 1992.
5. BABINCHAK J. A., GRAIKOSKI J. T., DUDLEY S., NIT KOWSKI M. F. Effect of dredge spoil deposition on fecal coliform counts in sediments at a disposal site. Appl. Environ. Microbiol., 34, 38, 1977.
6. BAJKIEWICZ-GRABOWSKA E. Siec hydrograficzna, wa- runki doplywu i wymiany w6d w jeziorach. (In): Jeziora Wi- gierskiego Parku Narodowego. Stan Eutrofizacji i kierunki Ochrony. Oprac. zbiorowe pod redakcja. B. Zdanowskiego. PAN. Komitet Naukowy przy Prezydium PAN. Czlowiek i Srodowisko. Zeszyty Naukowe 3. Wroclaw - Warszawa - Krakow. Zaklad Narodowy im. Ossolinskich, 21, 1992.
7. BISKIE H. A., SHERER B. M., MOORE J. A. Fate of or ganisms from manure point loading into rangeland stream. ASAE Paper, 80-2081, ASAE, St. Joseph, MI, 1988.
8. BOTHNER M. H., TAKADA H., KNIGHT I. T., HILL R. T., BUTMAN B., FARRINGTON J. W., COLLWELL R. R., GRASSIE J. F. Sewage contamination in sediments beneath a deep-ocean dump site off New York. Marine Environmental Research, 38, 43, 1994.
9. BRETTAR I., HOFFLE M. Influence of ecosystematic factors on survival of Escherichia coli after large scale release into lake water mesocosms. Appl. Environ. Microbiol., 58, 2201, 1992.
10. BURTON G. A. Jr., GUNNISON D., LANZA G. R. Survival of pathogenic bacteria in various freshwater sediment. Appl. Environ. Microbiol., 53, 633, 1987.
11. CHAN K. Y., WONG S. H., MAK C. Y. Effects of bottom sediments on the survival of Enterobacter aerogenes in seawa- ter. Mar. Pollut. Bull., 10, 205, 1979.
12. DORAN J. W., LINN D. M. Bacteriological quality of runoff water from pastureland. Appl. Environ. Microbiol. 37, 985, 1979.
13. GELDREICH E. E. Applying bacteriological parameters to recreational water quality. J. Am. Wat. Works Assoc, 62, 113, 1970.
14. GERBA C. P., McLEOD J. S. Effect of sediments on the survival of Escherichia coli in marine waters. Appl. Environ. Microbiol., 32, 114, 1976.
15. GERBA C. P. SCHAIBERGER G. E. Effect of particulates on virus survival in seawater. J. Wat. Pollut. Control Fed., 47, 93, 1975.
16. GOYAL S. M., GERBA C. P., MELNICK J. I. Occurrence and distribution of bacterial indicators and pathogens in Canal communities along the Texas Coast. Appl. Environ. Micro biol., 34, 139, 1977.

306 Niewolak S.
17. GRIMES D. J. Release of sediment-bound fecal coliforms by dredging. Appl. Microbiol. 29, 109, 1975.
18. HENDRICKS C. W. Enteric bacterial metabolism of sediment eluates. Can. J. Microbiol., 17, 551, 1971.
19. HENDRICKS C. W. Increased recovery rate of Salmonellae from stream bottom sediments versus surface waters. Appl. Microbiol. 21, 379, 1971.
20. HENDRICKS C. W., MORRISSON S. M. Multiplication and growth of selected enteric bacteria in clear mountain stream water. Water Res. 1, 567, 1967.
21. HOWELL J. M., COYNE M. S., CORNELIUS P.L. Effect of sediment particle size and temperature on fecal bacteria mor tality rates and the fecal coliform/fecal streptococci ratio. J. Environ. Qual., 25, 1215, 1996.
22. HUYSMAN P., VERSTRAETE W. Water-facilitated trans port of bacteria in unsaturated soil columns: Influence of ino culation and irrigation methods. Soil. Biol. Biochem., 25, 91, 1993.
23. IRVINE K. N., PETTIBONE G. W. Dynamics of indicator bacteria populations in sediment and river near a combined sewer outfall. Environmental Technology, 14, 531, 1993.
24. KAVKA G. Die bakteriologische Beschaffenheit der 6'sterrei- chischer Donau. Wasser und Abwasser, 31, 305, 1987.
25. KOHL W. Uber die Bedeutung bakteriologischen Untersu- chungen fur die Beurteilung von Fliessgewassern, dargestelt am Beispiel der osterreichischen Donau. Arch. Hydrobiol., Suppl., 44, 392, 1975.
26. LIN S., EVANS R. L., An analysis of coliform bacteria in the Upper Illionis waterway. Water Resources Bulletion, 10, 1198, 1974.
27. LOUTIT M. W., LEWIS G. Faecal bacteria from sewage ef fluent in sediments around an ocean outfall. New Zealand Journal of Marine and Freshwater Research, 19, 179, 1985.
28. MAR P. Clean Up Rural Beaches Report, Report to the On tario Ministry of Environment from the Metropolitan Toronto and Region Conservation Authority, 1991.
29. MATSON E.A.S., HORNER S. G., BUCK J. D. Pollution indicators and other microorganisms in river sediment. J. Wa ter Pollut. Control Fed. 50, 13, 1978.
30. McDONALD A., KAY D., JENKINS A. Generation of fecal and total coliform surges by stream flow manipulation in the absence of normal hydrological stimuli. Appl. Environ. Mic robiol., 44, 292, 1982.
31. NIEWOLAK S. Badania porownawcze nad przezywalnoscia.
niekorych bakterii jelitowych w wodzie i osadach dennych jezior roznych typow. Zeszt. Nauk. ARTOlszt., 10, 71, 1980.
32. NIEWOLAK S. Sanitary and bacterial analysis of water and bottom sediments of a heavilly polluted hypertrophic lake. Ekologia Polska (Ekol. pol.), 37, 3, 1989.
33. NIEWOLAK S. The evaluation of the contamination degree and the sanitary and bacteriological state of the waters in the Czarna Haricza River in the region of Suwalki and the Wigry National Park. Polish Journal of Environmental Studies, 7, 229, 1998.
34. PETTIBONE G. W., IRVINE K. N. Levels and sources of indicator bacteria associated with the Buffalo River ,,Area od Concern", Buffalo, New York. Great Lakes Res., 22, 896, 1996.
35. PETTIBONE G. W., IRVINE K. N., MONAHAN K. M. Im pact of a ship passage on bacteria levels and suspended sedi ment characteristics in the Buffalo River, New York. Water Res., 30, 2517, 1996.
36. ROLL B. M., FUJIOKA R. S. Sources of faecal indicator bacteria in a brackish tropical stream and their impact on recreational water quality. Wat. Sci. Tech.,. 35, 179, 1997.
37. SCHERER B. M., MINER J. R., MOORE J. A., BUCKHOU- SE J. C. Indicator bacterial survival in stream sediments. J. Environ. Qual., 21, 591, 1992.
38. SCHILLINGER J. E., GANNON J. J. Bacterial association and suspended particles in urban stormwater. J. Water Pollut. Control Fed., 57, 184, 1985.
39. SHIARIS M. P., REX A. C, PETTIBONE G. W., KEAY K., McMANUS P., REX M. EBERSOLE J., GALLGHER E. Dis tribution of indicator bacteria and Vibrio parahaemolyticus in sewage polluted intertidal sediments. Appl. Environ. Micro biol., 53, 1756, 1987.
40. SMITH E. M., GERBA C. P., MELNICK J. L. Role of sedi ment in the persistence of enteroviruses in the estuarine en vironment. Appl. Environ. Microbiol., 35, 685, 1978.
41. VAN DONSEL D. J., GELDREICH E. E. Relationships of salmonallae to fecal coliform in bottom sediments. Water Res., 5, 1079, 1971.
42. ZIBISCHKA F. Untersuchungen zur bakterielles Besiedlung der Bettsedimente in Fliessgewassern, dargestellt am Beispiel des Ritrodat Areals des Lunzer Seebaches und der Ferschnitz. Wasserwirtschaft Wasserversorge, Forschungsarbeiten, Bundesministerium fur Land - und Forstwirtschaft, Wien. 1983.


