Total Quality Management CS3300 Fall 2015. A long time ago Made in Japan – then and now W. Edwards...
26
Total Quality Management CS3300 Fall 2015
-
Upload
mildred-patience-morgan -
Category
Documents
-
view
213 -
download
0
Transcript of Total Quality Management CS3300 Fall 2015. A long time ago Made in Japan – then and now W. Edwards...

Total Quality Management
CS3300Fall 2015

A long time ago Made in Japan – then and now W. Edwards Demming We improve product by improving the process, not by testing the
product
YOU DO NOT TEST QUALITY IN, YOU DESIGN IT IN.

Total Quality Management
TQM
Customer Satisfaction100% Compliance with Expectations
Con
tinuo
us P
roce
ss Im
prov
emen
tStatistical Process Control

Red Bead Experiment
https://www.youtube.com/watch?v=ckBfbvOXDvU

Deming's 14 Points Create a constancy of purpose for improvement of product and
service. Adopt the new philosophy. Cease dependence on mass inspection Do not award business on price alone Improve constantly and forever the system of production and
service Institute training Adopt and institute leadership

Demings 14 Points Drive out fear Break down barriers between staff areas Eliminate slogans, exhortations, and targets for the work force Remove barriers that rob people of pride of workmanship Encourage education and self-improvement for everyone Take action to accomplish the transformation

Continuous Process Improvement
Shewart Cycle Plan – Do – Check – Act (PDCA) Too often – ACT...

Statistical Process ControlSeven Basic Tools
Pareto Charts Ishikawa Diagrams Control (Run) Charts Histograms Scatter Charts Checksheets Flow Charts

Raw Data (Ordered)
Module Time Cumul Percent
icongen 42.2 42.2 34
hud_ipc 40.8 83.0 67
huddsply 18.5 101.5 82
hud_proc 15.0 116.5 94
hud_boot 7.0 123.5 100

Pareto ExampleTim
e W
ork
ed
(H
ou
rs)
42.2
icongen
40.8
18.515
7
hud_ipc huddsply
N=123.5
Perce
nt o
f Tota
l
34%
67%
hud_proc hud_boot
82% 96%100%

Using all that PSP defect data
First plot the defects by category on the pareto chart We always want to work on the most problematic area first. We are trying to id the 20% of things that are causing us 80% of the
trouble

10 Documentation problem
20 Syntax
30 Build
40 Assignment
50 Interface
60 Error Handling
70 Data
80 Function
90 System
100 Environment
Defect Categories

Ishikawa Diagrams
AKA Cause-Effect, fishbone Diagram Root Cause Analysis Don’t treat symptoms! Uses diagram plus brainstorming 4 M’s: Manpower, Machines, Methods,Materials 4 P’s: Policies, Procedures, People, Plant

Basic Syntax
Symptom/Problem
People
Process
Equipment
Environment WHY???
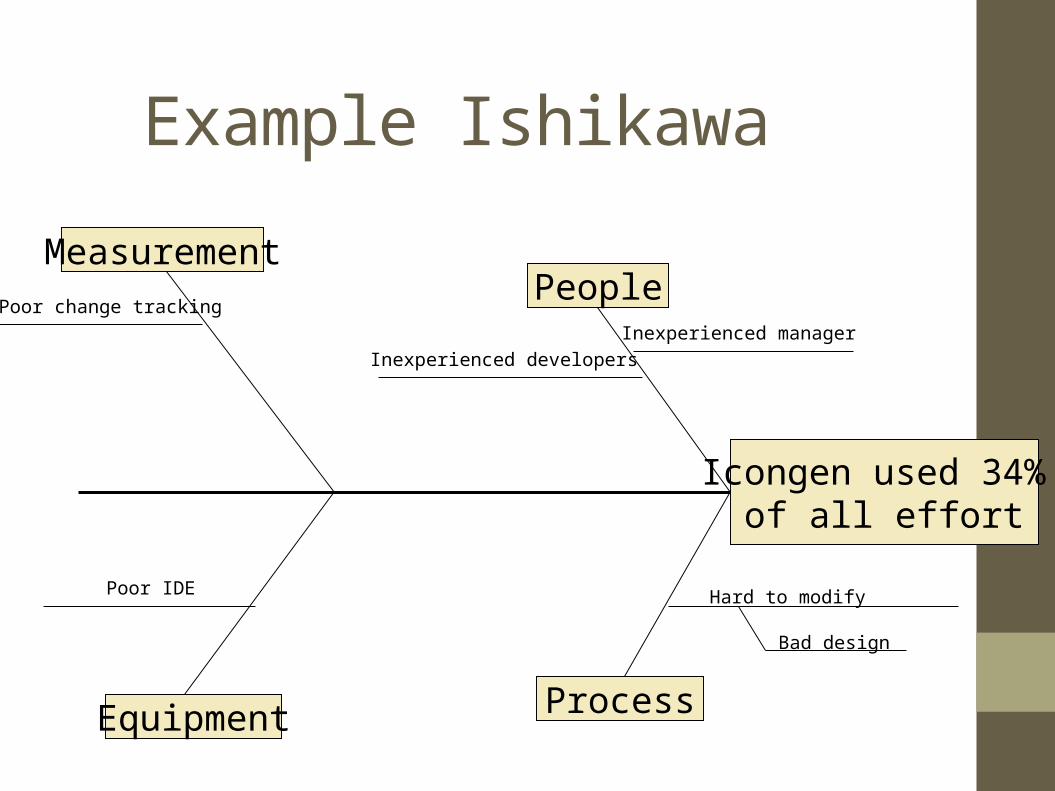
Example Ishikawa
Icongen used 34% of all effort
People
ProcessEquipment
Poor IDE
Inexperienced manager
Hard to modify
Bad design
Inexperienced developers
MeasurementPoor change tracking

Formulate the PDCA Plan Look at the Ishikawa diagram and select the most probable root
cause Make a plan to eliminate that issue Try it on a small scale Take more measurements If improved, then adopt, otherwise reject

Processes and control To be improved a process must be repeatable To be repeatable it must produce the same results each time Variation must be predictable

Histograms Graphical representation of variation and distribution Determine range of values (highest – lowest) Divide data into groups Width of group = range / number of groups Draw table of all values

Interpretation Normal distribution – expected in usual case. Bi-modal – two process at work or a process that has changed over
time, or input from 2 sources like different shifts. Skewed – there is a limit to the process – artificial or natural Truncated – outside limit (usually from a supplier)

Control Charts• Variation of run chart• Plot data first (run chart)• Draw in control limits at 3*standard deviation

Control Chart Signals• Point outside UCL/LCL• 2 out of 3 successive values are on same side and more than 2
sd from centerline• 4 out of 5 successive values are on same side and more than 1
sd from centerline• 8 successive values on same side of centerline

From 4320 Homework• You boss is concerned about the number of defects found by QA. He has
tasked you to look at improving the implementation process so that defect rates are reduced. You currently track defects in the 10 PSP categories. You gather raw defect counts and time to fix defects by category. The following data is available:
Total Defects by Category: Time Spent in Correction(Minutes):
10 Documentation 35 50020 Syntax 140 20030 Build 23 6040 Assignment 81 30050 Interface 100 100060 Error Handling 200 46770 Data 74 65780 Function 79 132490 System 32 326100 Environment 56 23

CS4320 HomeworkSelect the area from part b, and determine the most likely probable root cause.You are still unsure of the defect rates in your current process. You look at the raw defect numbers for the last 150 weeks to see if a pattern exists.
Last 150 week numbers:47 51 52 48 47 65 65 65 65 65 41 4144 46 42 10 10 05 09 09 52 52 51 5147 18 18 19 22 22 48 48 51 51 52 5454 57 57 56 49 49 49 47 47 11 16 1516 11 58 58 58 53 53 15 15 16 11 1157 57 57 58 58 61 62 62 64 64 18 1819 22 21 28 28 28 27 23 49 47 48 5252 63 64 64 63 59 18 21 21 21 21 5252 51 51 52 60 60 60 64 64 43 43 4241 41 34 33 32 34 34 48 47 49 51 5258 57 58 57 53 23 24 25 26 23 38 3536 40 40 43 44 45 46 46 57 56 55 5458 47 48 51 51 52You decide to draw a histogram to determine if a normal distribution exists. (Use K=10). What does this data tell you about defects in your organization?
Use the last 10 weeks of data from part d to draw a control chart of the total defects by week. Use a 2 Sigma control band. What does this chart tell you?
Six Sigma Developed by Motorola in 1986 Famous after Jack Welch used at GE in 1995 Process:
Define Phase (id customer, critical quality requirement) Measure Phase (Define goals, Data Collection plan, Collect needed
data, Variation in current process) Analyze Phase (analyze data) Improve Phase (id solutions, pilot solution) Control Phase (implement process control)

The Big Problem -- Systems• We don’t actually live in a linear world where cause and effect
is easy to see.• Peter Senge : The Fifth Discipline
• Today’s problems are caused by yesterday’s solutions• The easy way out is often the way back in• The harder you push, the harder the System pushes back• Behavior grows better before it gets worse• The cure can be worse than the disease• Faster is slower• Cause and effect are not closely related in time and space• Small change can produce big results, but the leverage areas are
not always obvious• You can have your cake and eat it too – but not all at once.• Dividing an elephant in half does not make 2 small elephants• There is no outside enemy, no one to blame
System Archetypes• Balancing Process with Delay• Limits to Growth• Shifting the Burden• Eroding Goals• Escalation• Success to the Successful• Tragedy of the Commons• Fixes that Fail• Growth and Underinvestment