Torsional Vibration of Turbine Generator by Variable Speed Drives · 2012-10-24 · Torsional...
16
H I G H - P O W E R E D R E S E A R C H F O R T H E R E A L W O R L D June 2008 Issue… 1 Torsional Vibration of Turbine Generator by Variable Speed Drives 4 Fast Front Grid Substation Insulation Coordination Studies 7 Inter-connected Offshore Power System Energization Studies 10 Comparison of PSCAD ® /EMTDC ™ and RTDS-based Simulations of Pitch Controlled Wind Power Generation System 13 Magnetic Radiation of Low Frequency Installations 15 Research – A Business Necessity 16 PSCAD ® 2008 Training Sessions June 2008 Torsional Vibration of Turbine Generator by Variable Speed Drives For studies investigating torsional vibration of turbine generators, a time-domain PSCAD ® / EMTDC ™ analysis provides important informa- tion on the magnitude and damping of oscil- lations, as well as the existence of torsional resonance at frequencies traditionally calcu- lated using a frequency domain or eigenvalue analysis. Mott MacDonald has used PSCAD ® / EMTDC ™ to perform a number of such studies. The work presented here discusses the potential of the inter-harmonic currents produced by variable speed Load Commutated Inverter (LCI) drives to excite a torsional resonance mode of the gas and steam turbine generators in a combined cycle power plant typically used in remote gas compression facilities. Building the Model Inter-harmonic torsional studies require modelling various elements of the system. For the studies described here, the major modelling efforts were devoted to the variable speed LCI drives, and the gas and steam turbine generators and their torsional characteristics. Other components, such as interconnecting cables and transformers were modelled using standard components available in the PSCAD ® master library. Variable Speed LCI Drives The purpose-built model of the LCI drives implemented in PSCAD ® consists of the following components: (i) A six-phase wound field synchronous motor (WFSM) which is used to provide the same harmonic performance as that of a twelve pulse inverter driven motor. The six phase WFSM was implemented in PSCAD ® with two three-phase voltage sources and two two- winding transformers. Each fictitious three-phase synchronous motor of the actual six-phase synchro- nous motor was represented by its Thevenin equiva- lent circuit, using sub-transient impedances. Two identical three-phase, zero-impedance, two-winding transformers were used to achieve the desired 30° phase shift between the two winding groups. (ii) A twelve pulse LCI drive comprising four, six- pulse thyristor bridges, was implemented using the PSCAD ® six pulse bridge model. The control inputs to both the rectifier and inverter are their firing delay angles relative to their respective transformer HV AC busbars. By varying these firing angles, the power factor at the rectifier and inverter and DC power transfer can be adjusted. Different DC link inter-harmonic options can be investigated. (iii) A four winding input transformer, represented using a standard built-in PSCAD ® model. The fourth winding was connected to a harmonic filter unit com- prising a number of high-pass and single tuned filters. To allow the PSCAD ® /EMTDC ™ study to be performed, it is necessary to determine the steady-state operat- ing conditions of the drive and program these into the model. The key parameter to be varied is the power transferred across the DC link. In the model, the magnitude and frequency of the voltage source representing the Thevenin equivalent circuit of the driven machine was varied so that a constant Dr. Babak Badrzadeh, Dr. Kenneth Smith, and Mr. Roddy Wilson Mott MacDonald – Transmission & Distribution Division
Transcript of Torsional Vibration of Turbine Generator by Variable Speed Drives · 2012-10-24 · Torsional...
H I G H - P O W E R E D R E S E A R C
H F
OR
TH
E R
EA
L W
OR
LD
June 2008 Issue…
1 Torsional Vibration of Turbine Generator by Variable Speed Drives
4 Fast Front Grid Substation Insulation Coordination Studies
7 Inter-connected Offshore Power System Energization Studies
10 Comparison of PSCAD®/EMTDC™ and RTDS-based Simulations of Pitch Controlled Wind Power Generation System
13 Magnetic Radiation of Low Frequency Installations
15 Research – A Business Necessity
16 PSCAD® 2008 Training Sessions
June 2008
Torsional Vibration of Turbine Generator by Variable Speed Drives
For studies investigating torsional vibration of turbine generators, a time-domain PSCAD®/EMTDC™ analysis provides important informa-tion on the magnitude and damping of oscil-lations, as well as the existence of torsional resonance at frequencies traditionally calcu-lated using a frequency domain or eigenvalue analysis. Mott MacDonald has used PSCAD®/ EMTDC™ to perform a number of such studies. The work presented here discusses the potential of the inter-harmonic currents produced by variable speed Load Commutated Inverter (LCI) drives to excite a torsional resonance mode of the gas and steam turbine generators in a combined cycle power plant typically used in remote gas compression facilities.
Building the Model Inter-harmonic torsional studies require modelling various elements of the system. For the studies described here, the major modelling efforts were devoted to the variable speed LCI drives, and the gas and steam turbine generators and their torsional characteristics. Other components, such as interconnecting cables and transformers were modelled using standard components available in the PSCAD® master library.
Variable Speed LCI Drives The purpose-built model of the LCI drives implemented in PSCAD® consists of the following components:
(i) A six-phase wound field synchronous motor (WFSM) which is used to provide the same harmonic performance as that of a twelve pulse inverter driven motor.
The six phase WFSM was implemented in PSCAD® with two three-phase voltage sources and two two-winding transformers. Each fictitious three-phase synchronous motor of the actual six-phase synchro-nous motor was represented by its Thevenin equiva-lent circuit, using sub-transient impedances. Two identical three-phase, zero-impedance, two-winding transformers were used to achieve the desired 30° phase shift between the two winding groups.
(ii) A twelve pulse LCI drive comprising four, six- pulse thyristor bridges, was implemented using the PSCAD® six pulse bridge model. The control inputs to both the rectifier and inverter are their firing delay angles relative to their respective transformer HV AC busbars. By varying these firing angles, the power factor at the rectifier and inverter and DC power transfer can be adjusted. Different DC link inter-harmonic options can be investigated.
(iii) A four winding input transformer, represented using a standard built-in PSCAD® model. The fourth winding was connected to a harmonic filter unit com-prising a number of high-pass and single tuned filters.
To allow the PSCAD®/EMTDC™ study to be performed, it is necessary to determine the steady-state operat-ing conditions of the drive and program these into the model. The key parameter to be varied is the power transferred across the DC link. In the model, the magnitude and frequency of the voltage source representing the Thevenin equivalent circuit of the driven machine was varied so that a constant
Dr. Babak Badrzadeh, Dr. Kenneth Smith, and Mr. Roddy Wilson Mott MacDonald – Transmission & Distribution Division
2 P U L S E T H E M A N I T O B A H V D C R E S E A R C H C E N T R E J O U R N A L
V/f ratio was achieved. The firing angle of the inverter was assumed to remain constant with changes in the drive output frequency and voltage, but the rectifier firing angle was varied to adjust the DC-link power.
Combined Cycle Power Plant The electrical charac-teristics of the gas and steam synchronous generators were represented using built-in synchronous machine models. A dedicated model was developed in PSCAD® for a typical heavy-duty single-shaft gas turbine. The governor maintains the generator speed after the machine was released in the model and the torsional dynamics were enabled. Instability would have been experienced if no generator controller was modelled. No governor was assumed for the steam turbine as the gas turbine provides the primary frequency control in the system. For the purposes of the steady-state inter-harmonic studies, the excitation system of the gas and steam turbine generators were omitted.
Torsional characteristics of the turbogenerators were represented using a built-in PSCAD® multi-mass model. The original higher order torsional models provided by manufacturers were simplified into a two mass model. One is associated with the synchronous generator and
the other provides a lumped representation of the turbine sections. It was observed that the mutual damping between the two masses is a key factor which has to be determined accurately. The damping data provided by manufacturer was provided in a form that was not suitable as direct input to the spring-mass model in the PSCAD®. The data was therefore converted into mutual damping values prior to use.
Results The individual gas and steam turbine and the LCI drive models were combined into a single integrated model. This was used to investigate operating conditions at which there is a potential of an LCI drive to excite a torsional resonance on a gas or a steam turbine generator. As an example, two PSCAD® case studies comprising a single gas tur-bine-generator connected to a single LCI drive via the generator and drive transformers are discussed here and the results are shown in Figure 2 and Figure 3.
The critical drive output frequencies associated with the inter-harmonic components that can develop an air gap electromagnetic torque at first (most dominant) mechanical torsional resonance frequency
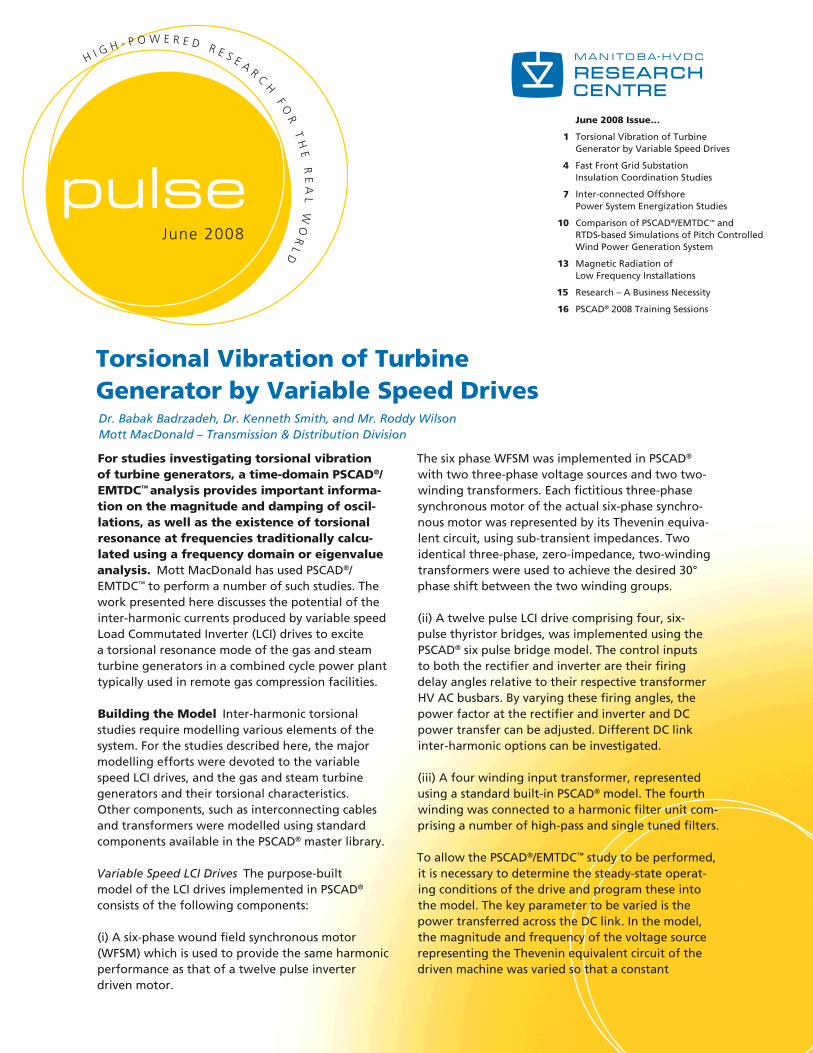
Figure 1 PSCAD® circuit diagram for the drive system (the LCI drive, four winding transformer, harmonic filter and six-phase motor) used for the inter-harmonic torsional study.
BK
OA
MGMA
.moCsuB
egdirBesluP 6
BK
OA
MGMA
.moCsuB
egdirBesluP 6
RR_AHPLA
RR_AHPLA
R_BANE
R_BANE
BK
OA
MGMA
.moCsuB
egdirBesluP 6
II_AHPLA
I_BANE
BK
OA
MGMA
.moCsuB
egdirBesluP 6
II_AHPLA
I_BANE
1#2#
]AVM[ 09]Vk[ 5.7 / ]Vk[ 5.7
1#2#
]AVM[ 09]Vk[ 5.7 / ]Vk[ 5.7
1.0
E6 [o
hm
]
1.0
E6
[ohm
]
2cdV
1cdI
2cdI
cerV
I_AMMAG3cdV
1cdV
4cdV
2S_L
+
VF
Ph
0.0
0179
[ohm
]
12s_V
2s_hP
po_2s_f
cd_R
+
cdL
+
esahP 3SMR
4#
1#
2#
3#
1.0
E6 [o
hm
]
]mho[ 6E0.1
]mho[ 6E0.1
retliFcinomraH
]mho[ 6E0.1
esahP 3SMR up_9V
esahP 3SMR up_1crsV
2S_L
+
VF
Ph
0.0
0179
[ohm
]
12s_V
2s_hP
po_2s_f
esahP 3SMR up_2crsV
84.23 = P17.62 = Q
VA
61.23 = P66.72 = Q
VA
76.13 = P22.61- = Q
VA
86.13 = P50.71- = Q
VA
78.13 = P83.61- = Q
VA
78.13 = P12.71- = Q
VA
VH_rtI
COP
1crsV
slortnoC : A_RMP
)WM(cdP
8570.46
FPD_CER
938338.0
FPD_VNI
606488.0
M_1cdV
78017.8
M_3cdV
70407.8
AMMAG_VNI
2953.52
up_231V
85210.1
J U N E 2 0 0 8 3
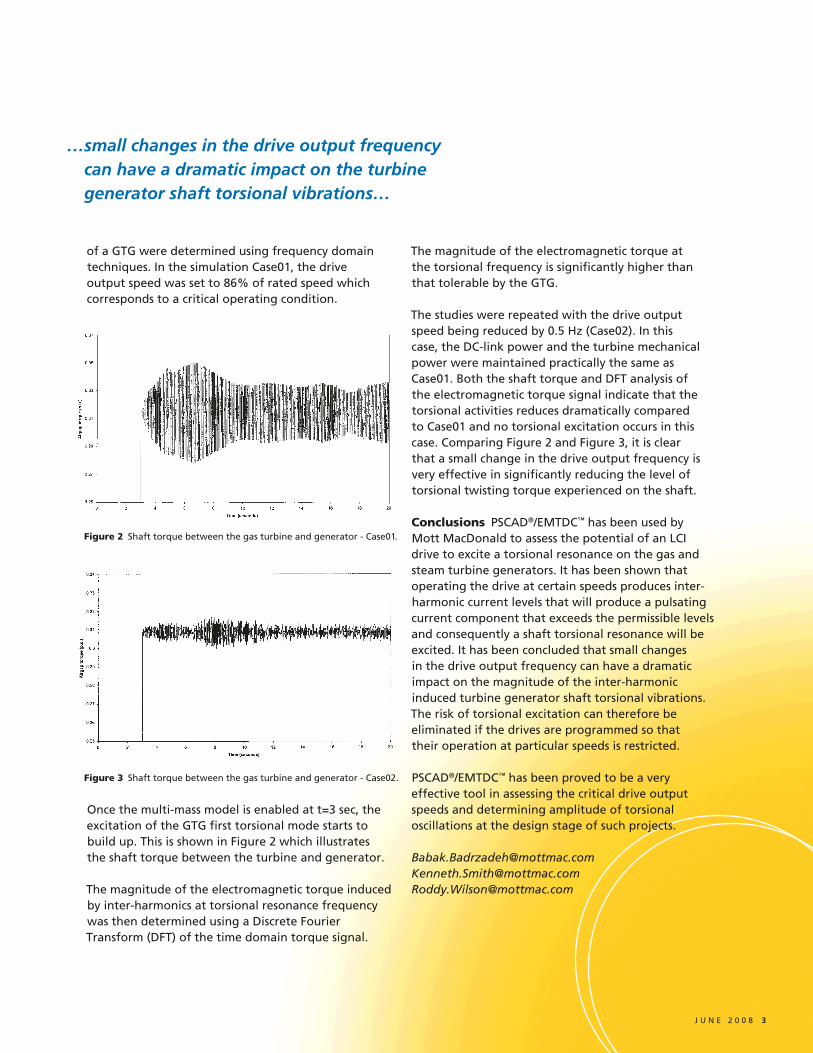
The magnitude of the electromagnetic torque at the torsional frequency is significantly higher than that tolerable by the GTG.
The studies were repeated with the drive output speed being reduced by 0.5 Hz (Case02). In this case, the DC-link power and the turbine mechanical power were maintained practically the same as Case01. Both the shaft torque and DFT analysis of the electromagnetic torque signal indicate that the torsional activities reduces dramatically compared to Case01 and no torsional excitation occurs in this case. Comparing Figure 2 and Figure 3, it is clear that a small change in the drive output frequency is very effective in significantly reducing the level of torsional twisting torque experienced on the shaft.
Conclusions PSCAD®/EMTDC™ has been used by Mott MacDonald to assess the potential of an LCI drive to excite a torsional resonance on the gas and steam turbine generators. It has been shown that operating the drive at certain speeds produces inter-harmonic current levels that will produce a pulsating current component that exceeds the permissible levels and consequently a shaft torsional resonance will be excited. It has been concluded that small changes in the drive output frequency can have a dramatic impact on the magnitude of the inter-harmonic induced turbine generator shaft torsional vibrations. The risk of torsional excitation can therefore be eliminated if the drives are programmed so that their operation at particular speeds is restricted.
PSCAD®/EMTDC™ has been proved to be a very effective tool in assessing the critical drive output speeds and determining amplitude of torsional oscillations at the design stage of such projects.
[email protected]@[email protected]
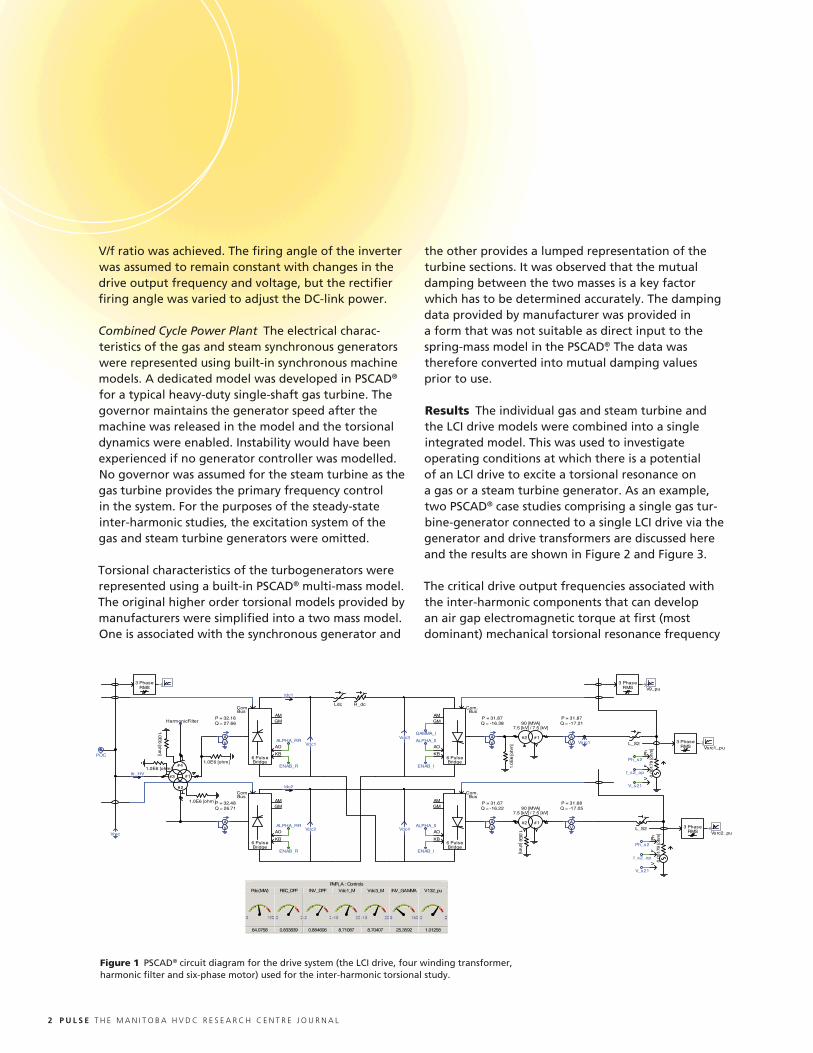
of a GTG were determined using frequency domain techniques. In the simulation Case01, the drive output speed was set to 86% of rated speed which corresponds to a critical operating condition.
Once the multi-mass model is enabled at t=3 sec, the excitation of the GTG first torsional mode starts to build up. This is shown in Figure 2 which illustrates the shaft torque between the turbine and generator.
The magnitude of the electromagnetic torque induced by inter-harmonics at torsional resonance frequency was then determined using a Discrete Fourier Transform (DFT) of the time domain torque signal.
Figure 3 Shaft torque between the gas turbine and generator - Case02.
Figure 2 Shaft torque between the gas turbine and generator - Case01.
…small changes in the drive output frequency can have a dramatic impact on the turbine generator shaft torsional vibrations…
4 P U L S E T H E M A N I T O B A H V D C R E S E A R C H C E N T R E J O U R N A L
For fast front studies, such as predicting the transient performance of transmission lines under lightning impulse conditions, a time domain calculation using an electromagnetic transient analysis program is required. PSCAD®/EMTDC™ provides all the tools necessary to develop and complete a detailed fast front insula-tion coordination study. Mott MacDonald has used the software to perform a number of such studies, including assessing the need for surge arresters on a 400/132 kV autotransformer and its associated 132 kV cable as described here.
Building the Model Undertaking fast front insula-tion coordination studies requires modelling various elements of the system. For the studies described here, the model included the 400 kV overhead line, air-insulated bus work in the substation, the 400/132 kV transformer and its cable, and surge arrestors.
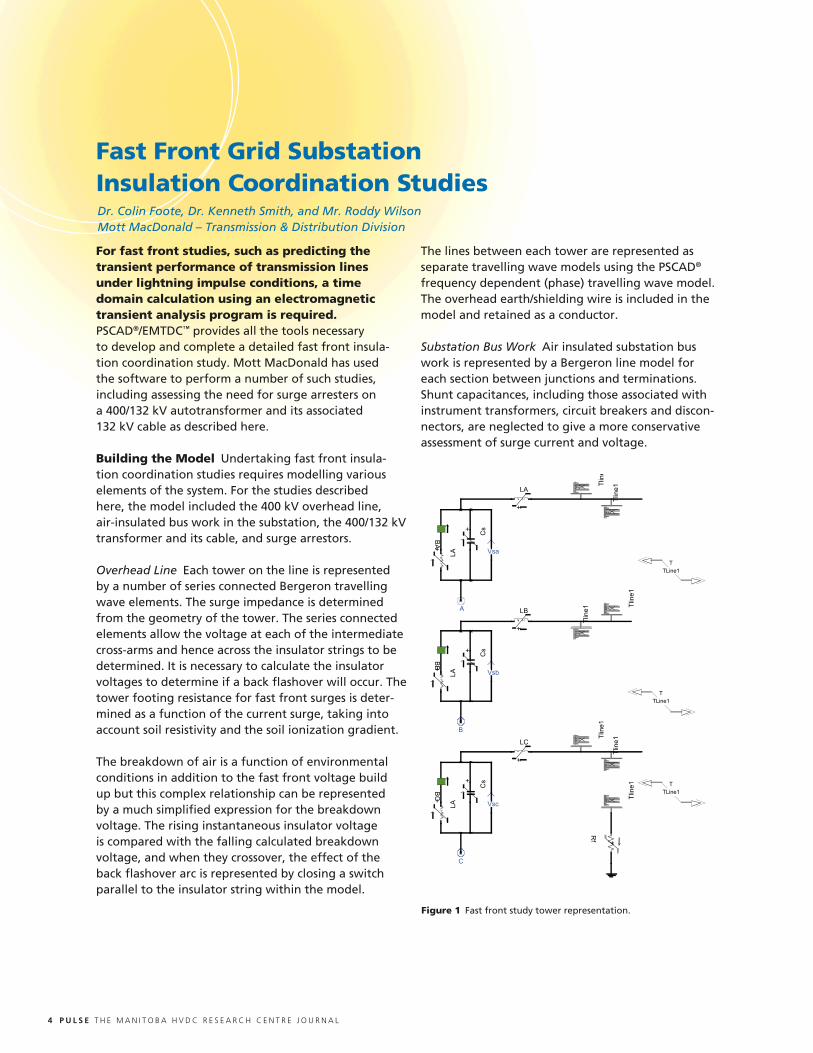
Overhead Line Each tower on the line is represented by a number of series connected Bergeron travelling wave elements. The surge impedance is determined from the geometry of the tower. The series connected elements allow the voltage at each of the intermediate cross-arms and hence across the insulator strings to be determined. It is necessary to calculate the insulator voltages to determine if a back flashover will occur. The tower footing resistance for fast front surges is deter-mined as a function of the current surge, taking into account soil resistivity and the soil ionization gradient.
The breakdown of air is a function of environmental conditions in addition to the fast front voltage build up but this complex relationship can be represented by a much simplified expression for the breakdown voltage. The rising instantaneous insulator voltage is compared with the falling calculated breakdown voltage, and when they crossover, the effect of the back flashover arc is represented by closing a switch parallel to the insulator string within the model.
Fast Front Grid Substation Insulation Coordination StudiesDr. Colin Foote, Dr. Kenneth Smith, and Mr. Roddy Wilson Mott MacDonald – Transmission & Distribution Division
The lines between each tower are represented as separate travelling wave models using the PSCAD® frequency dependent (phase) travelling wave model. The overhead earth/shielding wire is included in the model and retained as a conductor.
Substation Bus Work Air insulated substation bus work is represented by a Bergeron line model for each section between junctions and terminations. Shunt capacitances, including those associated with instrument transformers, circuit breakers and discon-nectors, are neglected to give a more conservative assessment of surge current and voltage.
Figure 1 Fast front study tower representation.
J U N E 2 0 0 8 5
Transformer and Cable In fast front studies, trans-former behaviour is dominated by its capacitance. To give the correct initial voltages on both sides of the transformer, the model has two capacitors in parallel with the standard PSCAD® autotransformer model. When the current impulse is applied in the model, the autotransformer presents a very high impedance path compared with the capacitors and all the surge current passes through the capacitors, giving the correct representation for fast front studies.
Where cable cross-section information is available, frequency dependent travelling wave models can be derived from the cable geometry. The conductor, sheath, armour and insulating layer parameters are considered, as well as soil conditions to ensure accurate calculation of earth return currents.
Surge Arresters For fast front insulation coordination studies, an accurate surge arrester model is essential. Numerous studies have shown that the simple piece-wise variable resistance model of a surge arrester is suitable for determining the response of the arrester to temporary switching over-voltages, but it is not accurate when fast front studies are considered. This is due to the voltage across the arrester increasing as the time to crest of the arrester current decreases, and the arrester voltage reaches its peak before the arrester currents. Such frequency dependent charac-teristics cannot be represented by a simple piecewise variable resistance model. These limitations can be overcome by adopting the representation recom-mended by the IEEE Working Group 3.4.11, which gives good results for current surges with times to crest from 0.5 micro-s to 40 micro-s, making it suitable for lightning surges. The IEEE model can be readily implemented using the library components in PSCAD®.
Lightning Impulse Current The multi-run feature of PSCAD® was used to perform studies with a range of lightning magnitudes. For strikes to the earth wire, peak magnitudes of 100 kA to 150 kA were studied, representing the high end of the range for lightning magnitudes. For direct strikes to a phase conductor, peak magnitudes of 10 kA to 20 kA were studied.
Results The PSCAD®/EMTDC™ fast front models were used to assess the impact on the autotransformer and 132 kV cable of lightning strikes on the overhead line. The transient overvoltages observed in the simulation are compared against the BIL values for the transformer and cable. The ability of the surge arrestors to absorb energy from lightning impulses is also assessed.
When there is a lightning strike to the earth wire, the majority of the current flows down through the tower to ground while a much smaller share flows in the earth wires towards adjacent towers. If the voltage difference between the tower cross arms and phase voltages rise high enough, then there will be back flashover on the insulator strings. This results in high currents flowing in the phase conductor. The current surge will travel along the overhead line, into the substation bus work and reach the transformer.
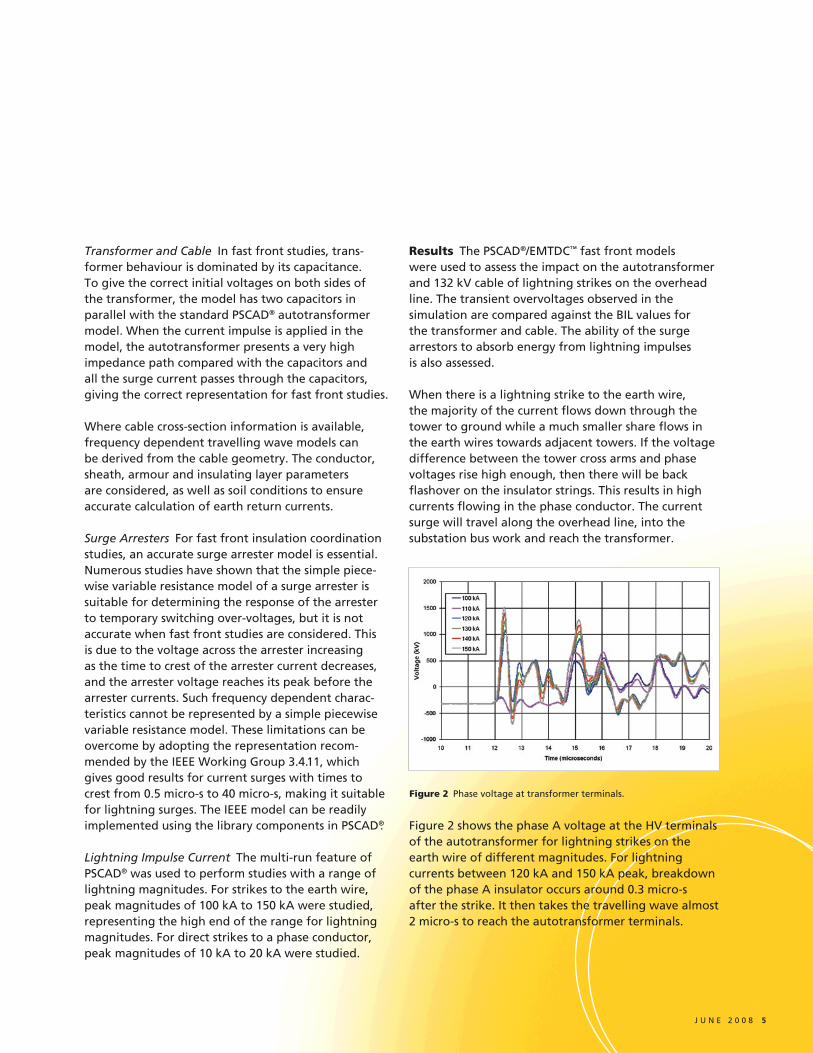
Figure 2 shows the phase A voltage at the HV terminals of the autotransformer for lightning strikes on the earth wire of different magnitudes. For lightning currents between 120 kA and 150 kA peak, breakdown of the phase A insulator occurs around 0.3 micro-s after the strike. It then takes the travelling wave almost 2 micro-s to reach the autotransformer terminals.
Figure 2 Phase voltage at transformer terminals.
6 P U L S E T H E M A N I T O B A H V D C R E S E A R C H C E N T R E J O U R N A L
With a lower lightning current, it takes longer for breakdown to occur. The BIL of the transformer HV terminals is 1425 kVp. The studies show that lightning currents with a peak magnitude above 140 kA may result in transient overvoltages that exceed this limit.
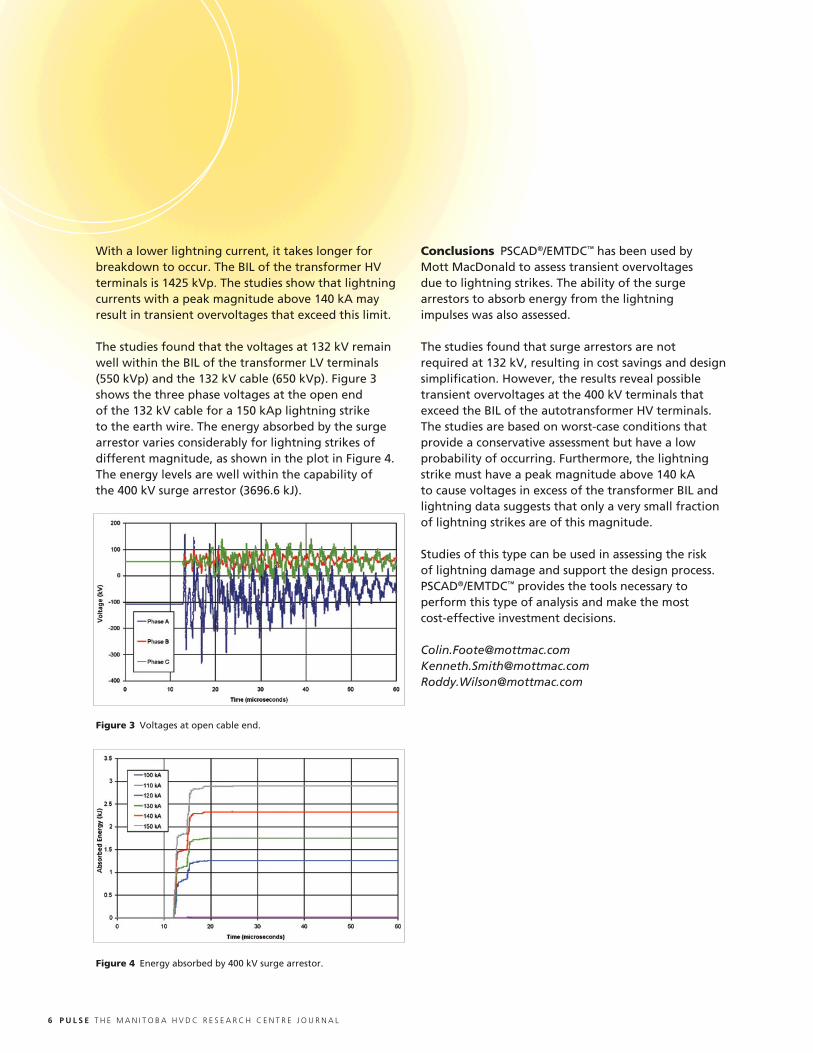
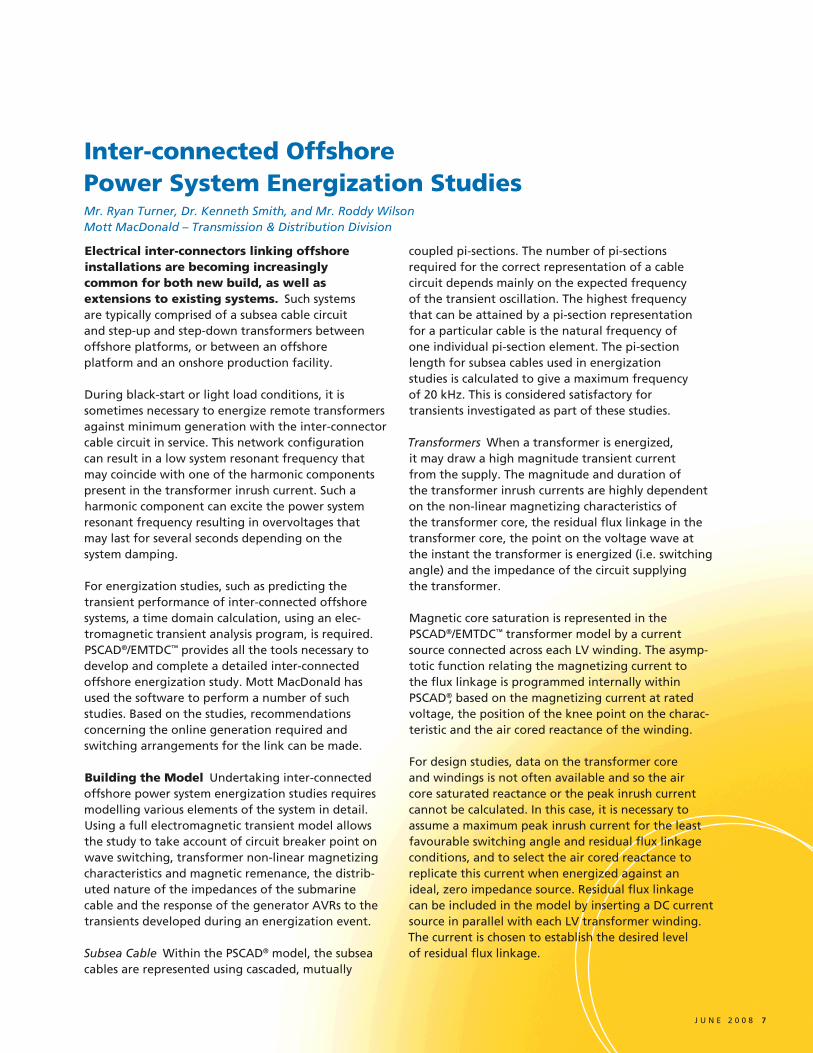
The studies found that the voltages at 132 kV remain well within the BIL of the transformer LV terminals (550 kVp) and the 132 kV cable (650 kVp). Figure 3 shows the three phase voltages at the open end of the 132 kV cable for a 150 kAp lightning strike to the earth wire. The energy absorbed by the surge arrestor varies considerably for lightning strikes of different magnitude, as shown in the plot in Figure 4. The energy levels are well within the capability of the 400 kV surge arrestor (3696.6 kJ).
Conclusions PSCAD®/EMTDC™ has been used by Mott MacDonald to assess transient overvoltages due to lightning strikes. The ability of the surge arrestors to absorb energy from the lightning impulses was also assessed.
The studies found that surge arrestors are not required at 132 kV, resulting in cost savings and design simplification. However, the results reveal possible transient overvoltages at the 400 kV terminals that exceed the BIL of the autotransformer HV terminals. The studies are based on worst-case conditions that provide a conservative assessment but have a low probability of occurring. Furthermore, the lightning strike must have a peak magnitude above 140 kA to cause voltages in excess of the transformer BIL and lightning data suggests that only a very small fraction of lightning strikes are of this magnitude.
Studies of this type can be used in assessing the risk of lightning damage and support the design process. PSCAD®/EMTDC™ provides the tools necessary to perform this type of analysis and make the most cost-effective investment decisions.
[email protected]@[email protected]
Figure 3 Voltages at open cable end.
Figure 4 Energy absorbed by 400 kV surge arrestor.
J U N E 2 0 0 8 7
Electrical inter-connectors linking offshore installations are becoming increasingly common for both new build, as well as extensions to existing systems. Such systems are typically comprised of a subsea cable circuit and step-up and step-down transformers between offshore platforms, or between an offshore platform and an onshore production facility.
During black-start or light load conditions, it is sometimes necessary to energize remote transformers against minimum generation with the inter-connector cable circuit in service. This network configuration can result in a low system resonant frequency that may coincide with one of the harmonic components present in the transformer inrush current. Such a harmonic component can excite the power system resonant frequency resulting in overvoltages that may last for several seconds depending on the system damping.
For energization studies, such as predicting the transient performance of inter-connected offshore systems, a time domain calculation, using an elec-tromagnetic transient analysis program, is required. PSCAD®/EMTDC™ provides all the tools necessary to develop and complete a detailed inter-connected offshore energization study. Mott MacDonald has used the software to perform a number of such studies. Based on the studies, recommendations concerning the online generation required and switching arrangements for the link can be made.
Building the Model Undertaking inter-connected offshore power system energization studies requires modelling various elements of the system in detail. Using a full electromagnetic transient model allows the study to take account of circuit breaker point on wave switching, transformer non-linear magnetizing characteristics and magnetic remenance, the distrib-uted nature of the impedances of the submarine cable and the response of the generator AVRs to the transients developed during an energization event.
Subsea Cable Within the PSCAD® model, the subsea cables are represented using cascaded, mutually
coupled pi-sections. The number of pi-sections required for the correct representation of a cable circuit depends mainly on the expected frequency of the transient oscillation. The highest frequency that can be attained by a pi-section representation for a particular cable is the natural frequency of one individual pi-section element. The pi-section length for subsea cables used in energization studies is calculated to give a maximum frequency of 20 kHz. This is considered satisfactory for transients investigated as part of these studies.
Transformers When a transformer is energized, it may draw a high magnitude transient current from the supply. The magnitude and duration of the transformer inrush currents are highly dependent on the non-linear magnetizing characteristics of the transformer core, the residual flux linkage in the transformer core, the point on the voltage wave at the instant the transformer is energized (i.e. switching angle) and the impedance of the circuit supplying the transformer.
Magnetic core saturation is represented in the PSCAD®/EMTDC™ transformer model by a current source connected across each LV winding. The asymp-totic function relating the magnetizing current to the flux linkage is programmed internally within PSCAD®, based on the magnetizing current at rated voltage, the position of the knee point on the charac-teristic and the air cored reactance of the winding.
For design studies, data on the transformer core and windings is not often available and so the air core saturated reactance or the peak inrush current cannot be calculated. In this case, it is necessary to assume a maximum peak inrush current for the least favourable switching angle and residual flux linkage conditions, and to select the air cored reactance to replicate this current when energized against an ideal, zero impedance source. Residual flux linkage can be included in the model by inserting a DC current source in parallel with each LV transformer winding. The current is chosen to establish the desired level of residual flux linkage.
Inter-connected Offshore Power System Energization StudiesMr. Ryan Turner, Dr. Kenneth Smith, and Mr. Roddy Wilson Mott MacDonald – Transmission & Distribution Division
8 P U L S E T H E M A N I T O B A H V D C R E S E A R C H C E N T R E J O U R N A L
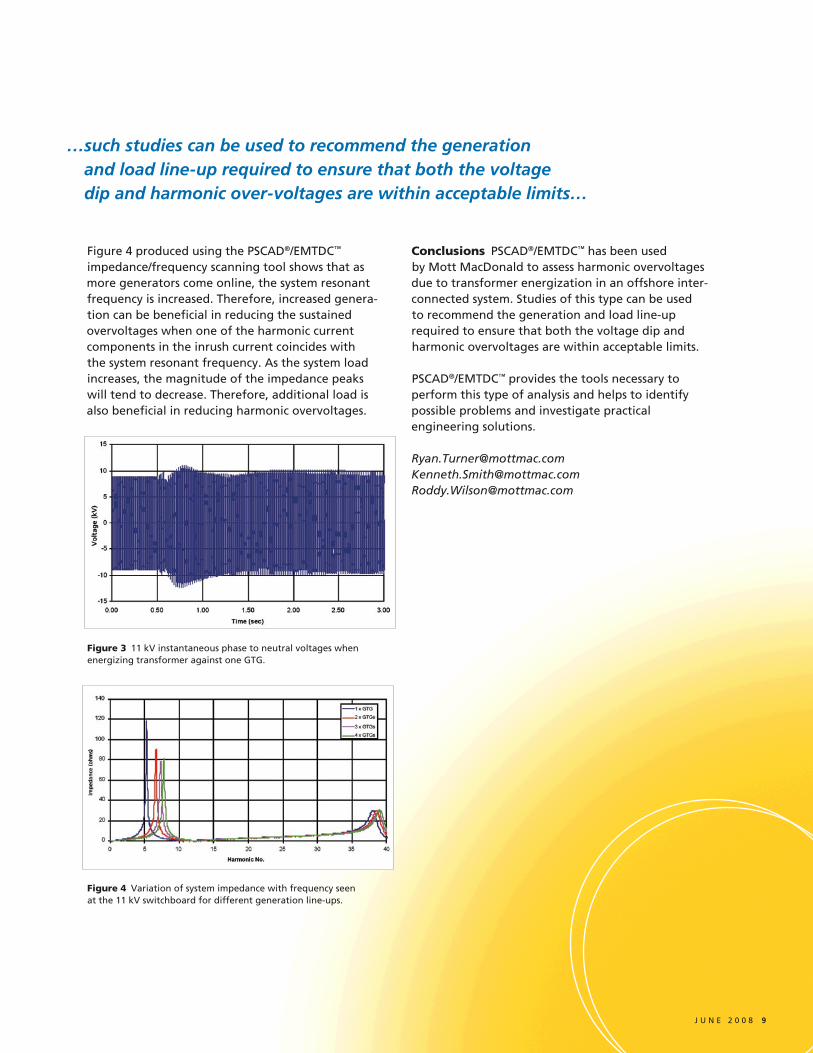
Figure 3 shows the initial 11 kV system voltage waveshape after switching in the 4.5 MVA transformer at the offshore platform for least favourable point on wave switching against one GTG. The system is un-loaded and the transformer initially had 80% residual flux linkage. High levels of distortion are present on the 11 kV voltage waveshape. The harmonic voltage components present in the 11 kV voltage waveform were calculated using a travelling sample window DFT. During the inrush transient, the largest voltage components are at the 5th and 6th harmonics of the supply frequency.
The peak overvoltages are dependent on the amount of system damping present and the system impedance itself. Using the PSCAD®/EMTDC™ harmonic impedance scanning tool, a plot of the variation of the system impedance for different generation line-ups looking into the 11 kV switchboard is given in Figure 4. This shows a parallel resonance close to the 5th harmonic when one GTG is connected. When the transformer at the remote installation is energized, the 5th harmonic current component of the inrush current injected into the system excites the resonant frequency resulting in a sustained 5th harmonic overvoltage.
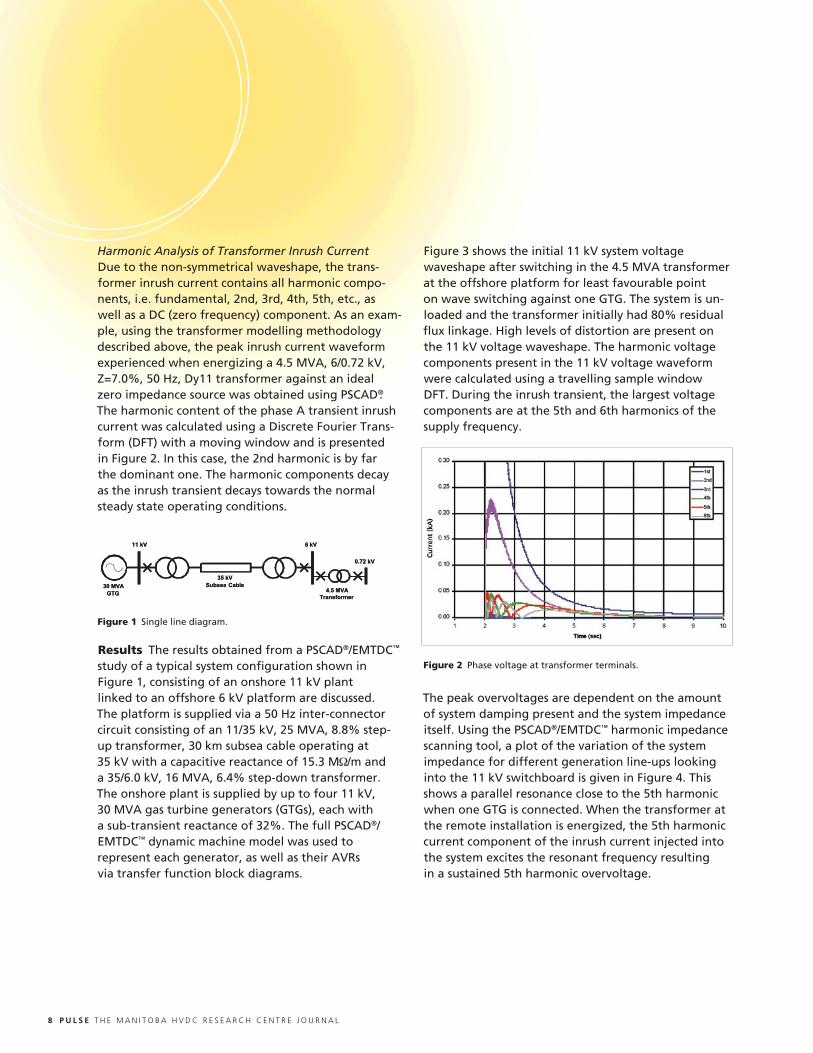
Harmonic Analysis of Transformer Inrush CurrentDue to the non-symmetrical waveshape, the trans-former inrush current contains all harmonic compo-nents, i.e. fundamental, 2nd, 3rd, 4th, 5th, etc., as well as a DC (zero frequency) component. As an exam-ple, using the transformer modelling methodology described above, the peak inrush current waveform experienced when energizing a 4.5 MVA, 6/0.72 kV, Z=7.0%, 50 Hz, Dy11 transformer against an ideal zero impedance source was obtained using PSCAD®. The harmonic content of the phase A transient inrush current was calculated using a Discrete Fourier Trans-form (DFT) with a moving window and is presented in Figure 2. In this case, the 2nd harmonic is by far the dominant one. The harmonic components decay as the inrush transient decays towards the normal steady state operating conditions.
Results The results obtained from a PSCAD®/EMTDC™ study of a typical system configuration shown in Figure 1, consisting of an onshore 11 kV plant linked to an offshore 6 kV platform are discussed. The platform is supplied via a 50 Hz inter-connector circuit consisting of an 11/35 kV, 25 MVA, 8.8% step-up transformer, 30 km subsea cable operating at 35 kV with a capacitive reactance of 15.3 M /m and a 35/6.0 kV, 16 MVA, 6.4% step-down transformer. The onshore plant is supplied by up to four 11 kV, 30 MVA gas turbine generators (GTGs), each with a sub-transient reactance of 32%. The full PSCAD®/EMTDC™ dynamic machine model was used to represent each generator, as well as their AVRs via transfer function block diagrams.
Figure 2 Phase voltage at transformer terminals.
Figure 1 Single line diagram.
J U N E 2 0 0 8 9
Conclusions PSCAD®/EMTDC™ has been used by Mott MacDonald to assess harmonic overvoltages due to transformer energization in an offshore inter-connected system. Studies of this type can be used to recommend the generation and load line-up required to ensure that both the voltage dip and harmonic overvoltages are within acceptable limits.
PSCAD®/EMTDC™ provides the tools necessary to perform this type of analysis and helps to identify possible problems and investigate practical engineering solutions.
[email protected]@[email protected]
Figure 4 produced using the PSCAD®/EMTDC™ impedance/frequency scanning tool shows that as more generators come online, the system resonant frequency is increased. Therefore, increased genera-tion can be beneficial in reducing the sustained overvoltages when one of the harmonic current components in the inrush current coincides with the system resonant frequency. As the system load increases, the magnitude of the impedance peaks will tend to decrease. Therefore, additional load is also beneficial in reducing harmonic overvoltages.
Figure 3 11 kV instantaneous phase to neutral voltages when energizing transformer against one GTG.
Figure 4 Variation of system impedance with frequency seen at the 11 kV switchboard for different generation line-ups.
…such studies can be used to recommend the generation and load line-up required to ensure that both the voltage dip and harmonic over-voltages are within acceptable limits…
10 P U L S E T H E M A N I T O B A H V D C R E S E A R C H C E N T R E J O U R N A L
This article presents a novel pitch controlled wind power generation system (WPGS) simulation using RTDS and EMTDC™. A 3MW WPGS connected to power grid is modelled in both programs. For the purpose of accurate simulation, real wind speed data gathered by an anemometer is used for both RTDS and EMTDC™ simulations. The results demonstrate the effectiveness of the proposed RTDS and EMTDC™ based simulations of WPGS. Similar results are obtained using EMTDC™ and RTDS.
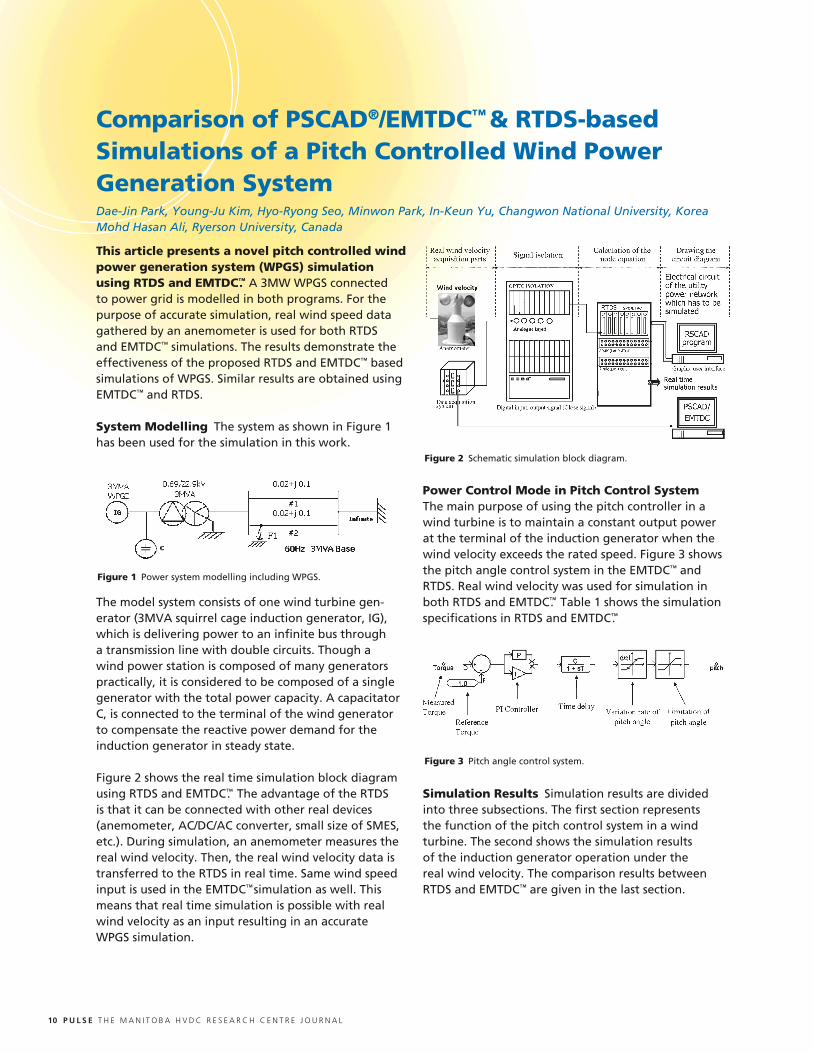
System Modelling The system as shown in Figure 1 has been used for the simulation in this work.
The model system consists of one wind turbine gen- erator (3MVA squirrel cage induction generator, IG), which is delivering power to an infinite bus through a transmission line with double circuits. Though a wind power station is composed of many generators practically, it is considered to be composed of a single generator with the total power capacity. A capacitator C, is connected to the terminal of the wind generator to compensate the reactive power demand for the induction generator in steady state.
Figure 2 shows the real time simulation block diagram using RTDS and EMTDC™. The advantage of the RTDS is that it can be connected with other real devices (anemometer, AC/DC/AC converter, small size of SMES, etc.). During simulation, an anemometer measures the real wind velocity. Then, the real wind velocity data is transferred to the RTDS in real time. Same wind speed input is used in the EMTDC™ simulation as well. This means that real time simulation is possible with real wind velocity as an input resulting in an accurate WPGS simulation.
Comparison of PSCAD®/EMTDC™ & RTDS-based Simulations of a Pitch Controlled Wind Power Generation SystemDae-Jin Park, Young-Ju Kim, Hyo-Ryong Seo, Minwon Park, In-Keun Yu, Changwon National University, KoreaMohd Hasan Ali, Ryerson University, Canada
Power Control Mode in Pitch Control System The main purpose of using the pitch controller in a wind turbine is to maintain a constant output power at the terminal of the induction generator when the wind velocity exceeds the rated speed. Figure 3 shows the pitch angle control system in the EMTDC™ and RTDS. Real wind velocity was used for simulation in both RTDS and EMTDC™. Table 1 shows the simulation specifications in RTDS and EMTDC™.
Simulation Results Simulation results are divided into three subsections. The first section represents the function of the pitch control system in a wind turbine. The second shows the simulation results of the induction generator operation under the real wind velocity. The comparison results between RTDS and EMTDC™ are given in the last section.
Figure 1 Power system modelling including WPGS.
Figure 2 Schematic simulation block diagram.
Figure 3 Pitch angle control system.
J U N E 2 0 0 8 1 1
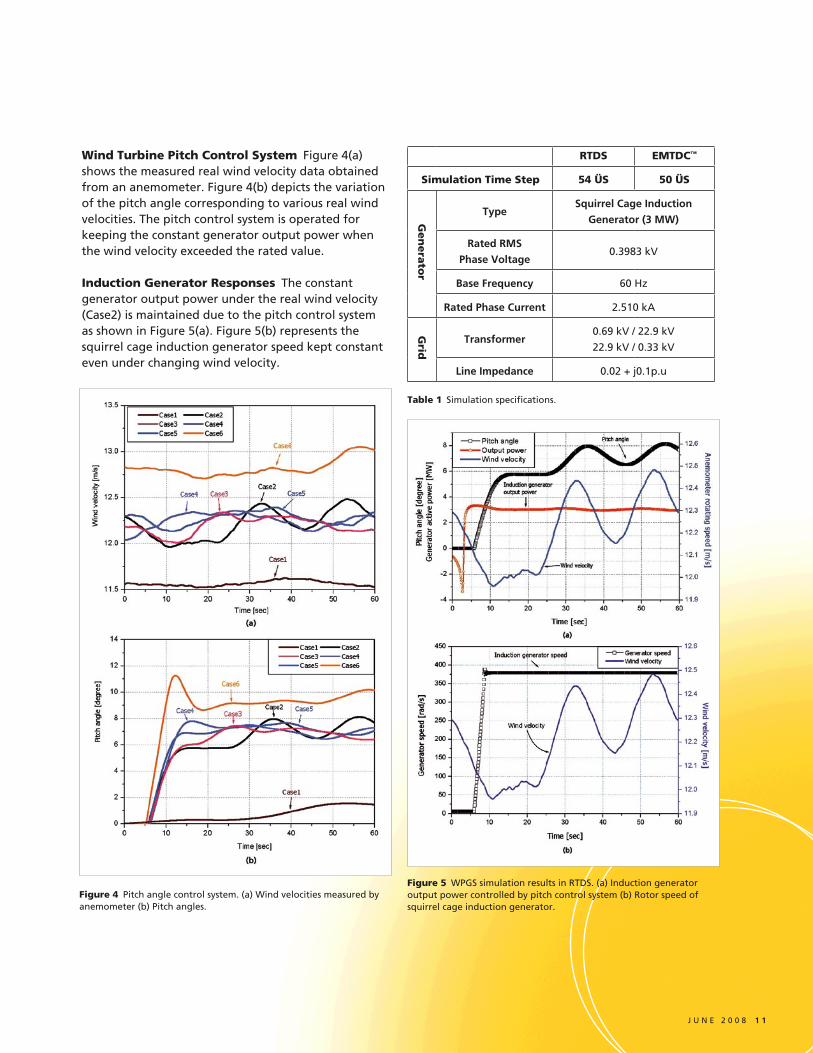
Wind Turbine Pitch Control System Figure 4(a) shows the measured real wind velocity data obtained from an anemometer. Figure 4(b) depicts the variation of the pitch angle corresponding to various real wind velocities. The pitch control system is operated for keeping the constant generator output power when the wind velocity exceeded the rated value.
Induction Generator Responses The constant generator output power under the real wind velocity (Case2) is maintained due to the pitch control system as shown in Figure 5(a). Figure 5(b) represents the squirrel cage induction generator speed kept constant even under changing wind velocity.
Table 1 Simulation specifications.
Figure 4 Pitch angle control system. (a) Wind velocities measured by anemometer (b) Pitch angles.
Figure 5 WPGS simulation results in RTDS. (a) Induction generator output power controlled by pitch control system (b) Rotor speed of squirrel cage induction generator.
RTDS EMTDC™
Simulation Time Step 54 ÜS 50 ÜS
Gen
era
tor
TypeSquirrel Cage Induction
Generator (3 MW)
Rated RMS
Phase Voltage0.3983 kV
Base Frequency 60 Hz
Rated Phase Current 2.510 kA
Grid
Transformer0.69 kV / 22.9 kV
22.9 kV / 0.33 kV
Line Impedance 0.02 + j0.1p.u
1 2 P U L S E T H E M A N I T O B A H V D C R E S E A R C H C E N T R E J O U R N A L
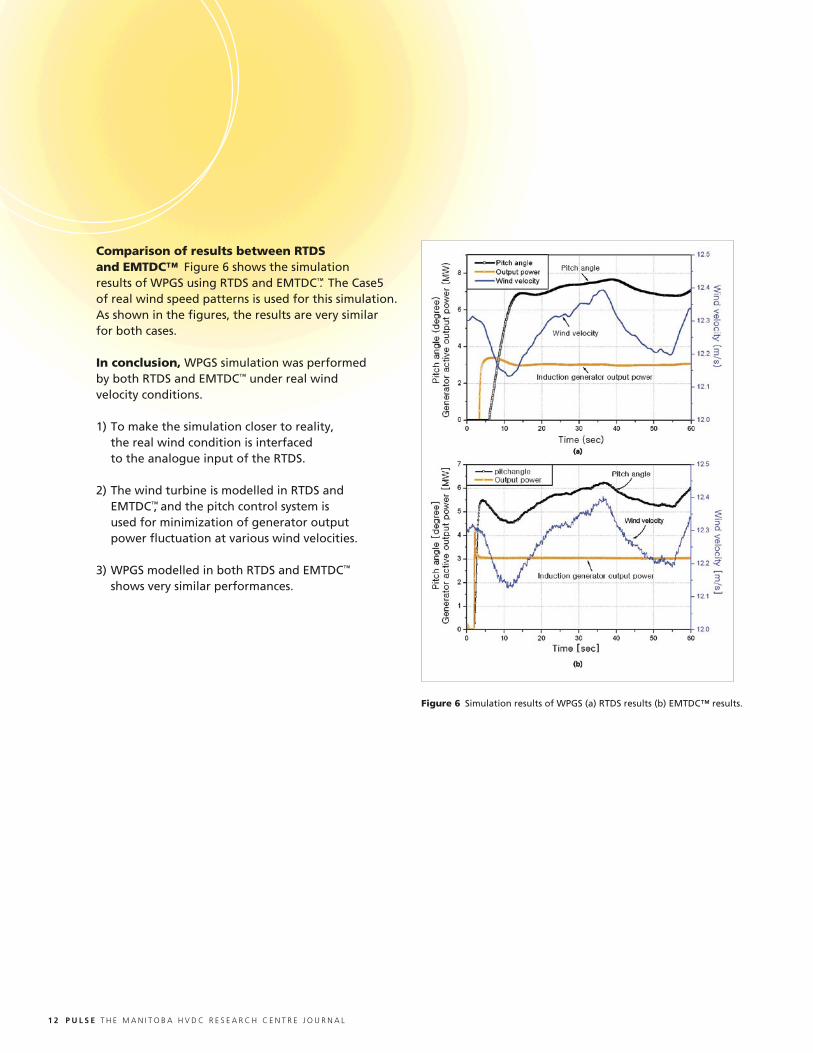
Comparison of results between RTDS and EMTDC™ Figure 6 shows the simulation results of WPGS using RTDS and EMTDC™. The Case5 of real wind speed patterns is used for this simulation. As shown in the figures, the results are very similar for both cases.
In conclusion, WPGS simulation was performed by both RTDS and EMTDC™ under real wind velocity conditions.
1) To make the simulation closer to reality, the real wind condition is interfaced to the analogue input of the RTDS.
2) The wind turbine is modelled in RTDS and EMTDC™, and the pitch control system is used for minimization of generator output power fluctuation at various wind velocities.
3) WPGS modelled in both RTDS and EMTDC™ shows very similar performances.
Figure 6 Simulation results of WPGS (a) RTDS results (b) EMTDC™ results.

J U N E 2 0 0 8 1 3
This article is a summary of presentations ([1] and [2]) of Daho Taghezout (Applied Magnetics, Switzerland), Nadia Nibbio and Philippe Chollet (Romande Energie, Switzerland). For complete presentations, email: [email protected]
FLUX is a finite element software application used for electromagnetic and thermal simulation, both in 2D and 3D. It can handle the design and analysis of any electromagnetic device. Based on 30 years of experience, FLUX is reliable and accurate, featuring a large number of functionalities: multi-parametric analysis, extended import capabilities (STEP, IGES...), and mixed meshed generation [3]. FLUX is developed by CEDRAT Group in France. The Manitoba HVDC Research Centre has been in partnership with CEDRAT since 2002, and has been investigating co-simulation possibilities and model parameter extraction for PSCAD® based transient simulations.
Regulations in Switzerland ONIR (Order on Non-Ionising Radiation protection) defines exposure limit values for electric and magnetic fields. They can be found on the website: www.umwelt-schweiz.ch. A brief summary is given in Table 1. In order to meet these restrictive regulations, simulations and measure-ments have been carried out to evaluate the efficiency of actual equipment. Thanks to those measurements and simulations, improvements have been made to equipment to comply with current regulations.
Magnetic field simulations with FLUX FLUX [3] has been used to model various configurations of electrical equipment and evaluate radiated magnetic and electric fields: three-phase overhead lines, power cables, distribution transformers and a complete MV-LV distribution station. Results are presented for overhead line and distribution station. Two configurations of overhead line have been modelled as presented in Figure 1. The field distribution proves to be very dependant of the phase distribution as shown in Figure 2.
Table 1 Exposure Limits.
Sébastien Cadeau-Belliard, CEDRAT
Magnetic Radiation of Low Frequency Installations
Figure 1 Modelled configuration (uniform and optimized phase distribution).
Figure 2 Magnetic field distribution for uniform and optimized phase distribution.
Exposure limit values for the frequency ranges of selected installations:
Installation Exposure limit value
Railways 16 2/3 Hz 300 µT; 10 000 V/m
High-voltage power lines 50 Hz 100 µT; 5 000 V/m
Radio broadcasting transmitters 10-400 MHz 28 V/m
Mobile telephone 900 MHz 41 V/m
Base stations 1800 MHz 58 V/m
UMTS base stations 2100 MHz 61 V/m
Installation limit values within the frequency ranges of selected installations:
Installation Installation limit value
Railways 1 µT (24 hr mean)
High-voltage power lines 1 µT
Radio broadcasting transmitters 3 V/m
Mobile telephone 900 MHz 4 V/m
Base stations 1800 MHz 6 V/m
UMTS base stations 2100 MHz 6 V/m
1 4 P U L S E T H E M A N I T O B A H V D C R E S E A R C H C E N T R E J O U R N A L J U N E 2 0 0 8 1 41 4 P U L S E T H E M A N I T O B A H V D C R E S E A R C H C E N T R E J O U R N A L
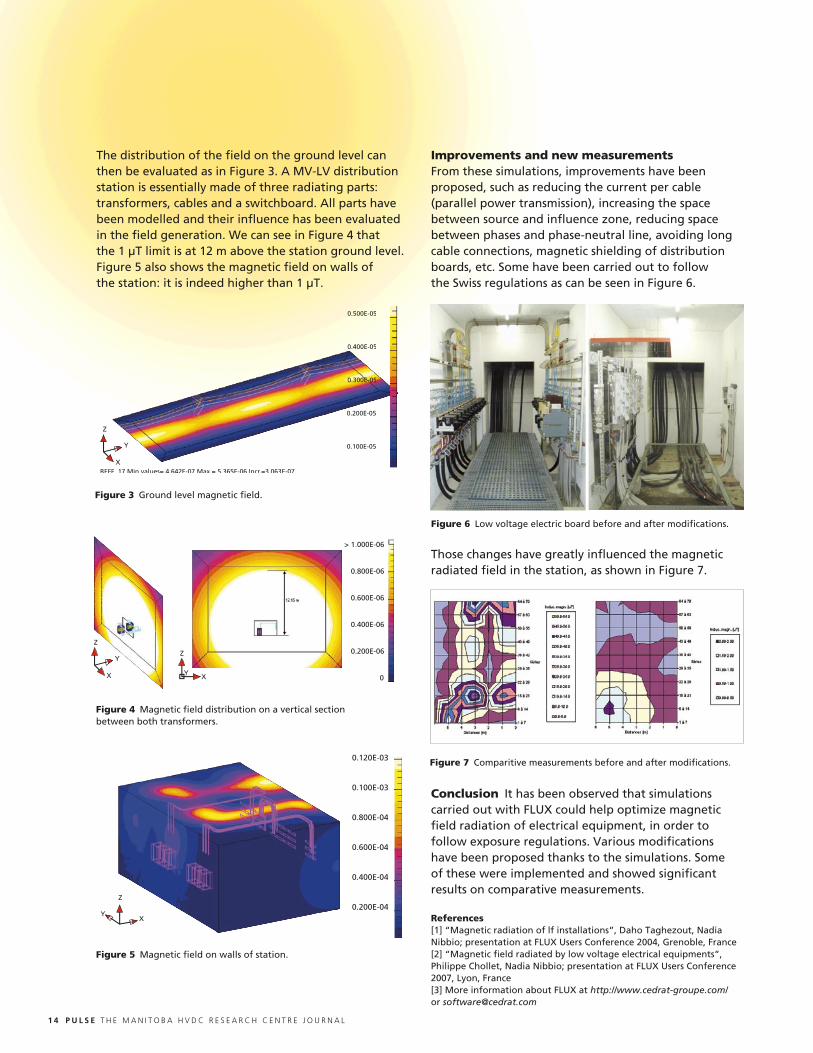
The distribution of the field on the ground level can then be evaluated as in Figure 3. A MV-LV distribution station is essentially made of three radiating parts: transformers, cables and a switchboard. All parts have been modelled and their influence has been evaluated in the field generation. We can see in Figure 4 that the 1 µT limit is at 12 m above the station ground level. Figure 5 also shows the magnetic field on walls of the station: it is indeed higher than 1 µT.
Improvements and new measurements From these simulations, improvements have been proposed, such as reducing the current per cable (parallel power transmission), increasing the space between source and influence zone, reducing space between phases and phase-neutral line, avoiding long cable connections, magnetic shielding of distribution boards, etc. Some have been carried out to follow the Swiss regulations as can be seen in Figure 6.
Those changes have greatly influenced the magnetic radiated field in the station, as shown in Figure 7.
Conclusion It has been observed that simulations carried out with FLUX could help optimize magnetic field radiation of electrical equipment, in order to follow exposure regulations. Various modifications have been proposed thanks to the simulations. Some of these were implemented and showed significant results on comparative measurements.
References[1] “Magnetic radiation of lf installations”, Daho Taghezout, Nadia Nibbio; presentation at FLUX Users Conference 2004, Grenoble, France[2] “Magnetic field radiated by low voltage electrical equipments”, Philippe Chollet, Nadia Nibbio; presentation at FLUX Users Conference 2007, Lyon, France[3] More information about FLUX at http://www.cedrat-groupe.com/ or [email protected]
Figure 4 Magnetic field distribution on a vertical section between both transformers.
Figure 5 Magnetic field on walls of station.
Figure 6 Low voltage electric board before and after modifications.
Figure 7 Comparitive measurements before and after modifications.
Figure 3 Ground level magnetic field.

PUBLICATION AGREEMENT # 41197007RETURN UNDELIVERABLE CANADIAN ADDRESSES TO
MANITOBA HVDC RESEARCH CENTRE INC. 244 CREE CRESCENT
WINNIPEG MB R3J 3W1 CANADA
T +1 204 989 1240 F +1 204 989 [email protected]
J U N E 2 0 0 8 1 5
The U of M has a strong postgraduate program in the Faculty of Engineering and this has had a positive impact on the undergraduate program. Growing interest in power systems has resulted in one third of students now taking a Power Systems elective, and 25% of final year projects are in the power area [1].
Power systems are inherently complex; utilizing many technologies for their operations. The science of modelling various devices in a simulation program is equally complex requiring fundamental understanding of the physics of each device, advanced mathematics and computer science skills. You also require the knowledge of how to model large and complex systems, as well as, the knowledge and experience of how electrical utility business operates in the energy market.
The market for simulation tools is relatively small when compared to the gaming or communications industry, thus the investment in these tools is low. This market reality forces us to find novel ways to maintain competencies in the required areas. Jointly undertaking these complex problems challenges our staff and provides a rich environment to grow professionally. The relationship with the University of Manitoba is one based on trust and has become a business necessity for our organization. Without this relationship, PSCAD®/EMTDC™ would not be the program it is today.
References:
[1] Innovative Strategies to Address Human Resource Demands for
Graduate Engineers in the 21st Century Canadian Power Sector,
CIGRE Canada, 2007, Calgary.
The Manitoba HVDC Research Centre has been active in research since its founding in 1981. Many notable developments have occurred including the creation of the world’s first real time digital simulator and the popular PSCAD®/EMTDC™ Power System Simulation Software. The organization has been devoted to excellence in simulation and now these tools help to facilitate continued innovation in power systems and simulation. Our close partnership with the University of Manitoba, Power Systems group remains a key strategic advantage for us.
Our relationship with the U of M is a definite win-win with benefits on several fronts:• Students work on projects of value to industry and at the same time obtain their degrees,• Researchers perform work that is relevant to industry and challenging in the academic world,• Researchers become an extension of our own research team providing new ideas and exceptional skilled labour which complements and expands knowledge base,• Funding from government is leveraged with contributions from industry,• Results are published and peer reviewed, providing a mechanism to ensure excellence, and foster technology and brand recognition through media that is widely read and respected.
The need for new advanced research in Power System Simulation was identified as a priority by the various stakeholders in Manitoba. To achieve this vision, the sponsors applied for an Industrial Research Chair from the Canadian National Sciences and Engineering Research Council (NSERC). Industrial Research Chairs are highly prestigious appointments on a major research endeavour of interest to industry. Collaboration between the Chairs' sponsors develops new technologies that are fed back into commercial offerings. In addition to new products, students and researchers gain the knowledge and experience.
Research – A Business NecessityPaul Wilson, Manitoba HVDC Research Centre

Puls
e is
dis
trib
ute
d f
ree
of
char
ge
and
is p
ost
ed e
lect
ron
ical
ly a
t ww
w.h
vdc.
ca I
f yo
u w
ou
ld li
ke t
o r
ecei
ve a
co
py
of P
uls
e,p
leas
e se
nd
us
an e
mai
l to
info
@h
vdc.
ca A
rtic
les
and
su
bm
issi
on
s ad
dre
ssin
g t
he
use
of
PSC
AD
® in
th
e re
al w
orl
d a
re a
lway
s w
elco
me.
©20
08 M
anit
ob
a H
VD
C R
esea
rch
Cen
tre
Inc.
Pri
nte
d in
Can
ada
Expanding KnowledgeThe following courses are available, as well as custom training courses – please contact [email protected] for more information.
Introduction to PSCAD® and Applications Includes discussion of AC transients, fault and protection, transformer saturation, wind energy, FACTS, distributed generation, and power quality with practical examples. Duration: 3 Days
Advanced Topics in PSCAD® Simulation Training Includes custom component design, analysis of specific simulation models, HVDC/FACTS, distributed generation, machines, power quality, etc. Duration: 2–4 Days
HVDC Theory & Controls Fundamentals of HVDC Technology and applications including controls, modelling and advanced topics. Duration: 4–5 Days
AC Switching Study Applications in PSCAD® Fundamentals of switching transients, modelling issues of power system equipment, stray capacitances/inductances, surge arrester energy requirements, batch mode processing and relevant standards, direct conversion of PSS/E files to PSCAD®. Duration: 2–3 Days
Distributed Generation & Power Quality Includes wind energy system modelling, integration to the grid, power quality issues, and other DG methods such as solar PV, small diesel plants, fuel cells. Duration: 3 Days
Wind Park Modelling Includes wind models, aero-dynamic models, machines, soft starting and doubly fed connections, crowbar protection, low voltage ride through capability. Duration: 3 Days
Industrial Systems Simulation & Modelling Includes motor starting, power quality, capacitor bank switching, harmonics, power electronic converters, arc furnace, protection issues. Duration: 1–2 Days
Lightning Coordination & Fast Front Studies Substation modelling for a fast front study, representing station equipment, stray capacitances, relevant standards, transmission tower model for flash-over studies, surge arrester representation and data. Duration: 2 Days
Modelling and Application of FACTS Devices Fundamentals of solid-state FACTS systems. System modelling, control system modelling, converter modelling, and system impact studies. Duration: 2–3 Days
Connect with Us!July 20–24, 2008IEEE PES General MeetingPittsburgh, USA
August 25–29, 200842nd CIGRE 2008 Technical Session and ExhibitionParis, France
September 28–October 1, 2008ICHQP 2008 ConferenceWollongong, Australia
More events are planned! Please see www.pscad.com for more information.
PSCAD® 2008 Training SessionsHere are a few of the training courses currently scheduled. Additional opportunities will be added periodically, so please see www.pscad.com for more information about course availability.
September 2008Introduction to PSCAD® and Applications
October 2008Introduction to PSCAD® and Applications
November 2008HVDC Training Course
All training courses mentioned above are held at the Manitoba HVDC Research Centre Inc.Winnipeg, Manitoba, [email protected] www.pscad.com
Please visit Nayak Corporation's website www.nayakcorp.com for courses in the USA.
August 2008Introduction to PSCAD® and ApplicationsPrinceton, New Jersey, USA
For more information on dates, contact [email protected] today!