Torsional Strength of Prestressed Concrete Bridge Girders
76
TORSIONAL STRENGTH OF PRESTRESSED CONCRETE BRIDGE GIRDERS by Eugene Buth, Assistant Research Engineer Howard L. Furr, Research Eng.ineer Research Report 150-lF Technk:al Reports Center Texas Transportation Institute Torsional Strength of Prestressed. Concrete Bridge Girders Research Study Number 2-5-70-150 Sponsored by The Texas Highway Department In Cooperation with the U. S. Department of Transportation, Federal Highway Administration August 1971 TEXAS TRANSPORTATION INSTITUTE Texas A&M University College Station, Texas
Transcript of Torsional Strength of Prestressed Concrete Bridge Girders
TORSIONAL STRENGTH OF PRESTRESSED CONCRETE BRIDGE GIRDERS
by
Eugene Buth, Assistant Research Engineer
Howard L. Furr, Research Eng.ineer
Research Report 150-lF
Technk:al Reports Center Texas Transportation Institute
Torsional Strength of Prestressed. Concrete
Bridge Girders
Research Study Number 2-5-70-150
Sponsored by
The Texas Highway Department In Cooperation with the
U. S. Department of Transportation, Federal Highway Administration
August 1971
TEXAS TRANSPORTATION INSTITUTE Texas A&M University
College Station, Texas

DISCLAIMER
The opinions, findings and conclusions expressed in this publication
are those of the authors and not necessarily those of the Federal Highway
Administration.
ii

ABSTRACT
Two Texas Highway Department type B prestressed concrete bridge
girders were tested to determine their torsional strength. Applied
torque, angle of twist and strains in the concrete were determined.
The theoretical strength and torque-rotation relationships were
calculated by classical elastic theory.
Experimental and theoretical torque-rotation relationships were
found to agree very closely. The theoretical torsional strength was on
the average about 75 percent of the experimentally determined torsional
strength.
iii

· SUMMARY
Two Texas Highway Department Type B prestressed concrete bridge
girders were loaded to failure in torsion to determine their torsion
strength. One girder was made of normal weight concrete and the other
of lightweight concrete. The torsional loading was applied to each
end of the beam through loading yokes with hydraulic jacks. The angle
of twist was measured with a precise level and two ~cales hanging from
cross bars attached to each end of the girder. Strains on the surface
of the girder were measured with electrical resistance strain gauge
rosettes on cross sections at mid span and 15 ft. either side of mid
span.
St. Venant's elastic theory was used to calculate the torsional
stiffness and torsional strength of each of the girders.
6 The effective values of shearing modulus, G, of 2.30 and 1.65xl0
psi found in the full scale torsion tests, compare well with values of
2.44 and 1.56 psi determined by ASTM C215 for the normal weight and
lightweight girders respectively. Theoretically derived torsional
capacity using 10~ as the ultimate tensile strength was about 75% c
of the experimental torsional capacity, which is on the conservative
side. If splitting tensile strength was used as the ultimate strength,
the theoretical torsional capacity was about 50% of the experimental
torsional capacity.
iv
IMPLEMENTATION
The test results of the two girders investigated indicate that
the present practice of cantilevering forms a maximum distance of
3 feet from the edge girder is sufficiently conservative even if
no additional bracing is provided for the girder. On the basis of
a maximum unsupported length of 50 ft. the maximum torque created in
the forms and deck concrete is in the range of 12 to 16 ft-kips.
Ignoring the effect of the presence of flexural stress created by
the same load, the torsional load is about 25% of the capacity of
the girder indicated by tests in this investigation. This indicated
factor of safety of 4 compares well with that of the overall design.
Since this was a limited type B study it was not intended to
be a comprehensive and conclusive study. Highway engineers may de
sire to conduct additional experimental and theoretical work. This
study included only the effects of torsional loading, dead load and
prestress but no attempt was made to include flexural live loads
or restraints offered by diaphragms.
v
TABLE OF CONTENTS
INTRODUCTION.
NOTATION .
THEORETICAL INVESTIGATION
EXPERIMENTAL INVESTIGATION •
DISCUSSION OF RESULTS.
CONCLUSION
REFERENCES
APPENDIX A
APPENDIX B
APPENDIX C
vi
Page No.
1
2
3
8
12
33
34
35
56
64
INl'RODUCTION
Present construction practice in casting concrete bridge decks is
to cantilever. the deck forms from the edge girders on either side of
the structure. These deck forms are braced to the boftom of the edge
girders which creates a torsional 'loading on the girders. Existing codes
do not specify criteria or methods of analysis for determining the tor-
sional strength of such girders.
The objective of the study was to determine the torsional strength
·'
of Texas Highway Department standard type B pretensioned prestressed
bridge girders.
Two existing type B girders were available for use in this study.
One of these was made of normal weight concrete and the other of light-
weight concrete. The girders were tested in an existing loading frame
in the Texas Highway Department District 14 Headquarters in Austin, Texas.
1
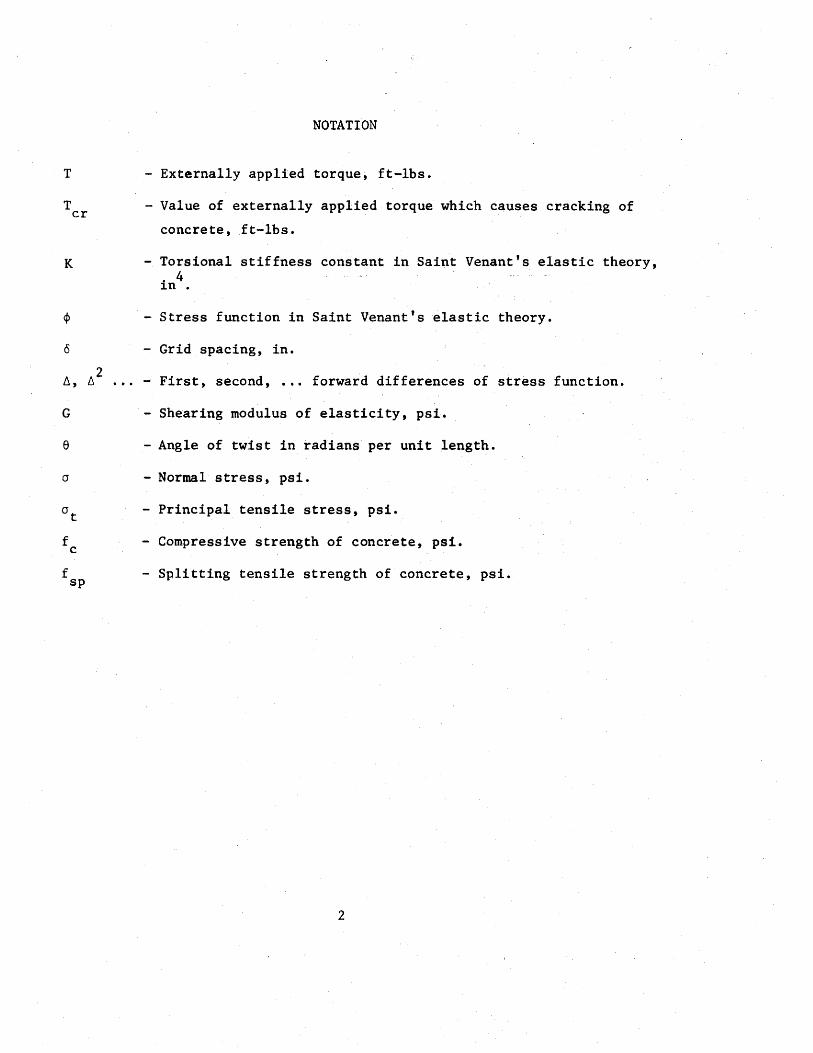
NOTATION
T - Externally applied torque, ft-lbs.
T - Value of externally applied torque which causes cracking of cr concrete, ft-lbs.
K Torsional stiffness constant in Saint Venant's elastic theory, . 4 l.n •
¢ -Stress function in Saint Venant's elastic theory.
o - Grid spacing, in.
2 ~' ~ .•. -First, second, ••. forward differences of stress function.
G - Shearing modulus of elasticity, psi.
6 - Angle of twist in radians per unit length.
a - Normal stress, psi.
at Principal tensile stress, psi.
fc - Compressive strength of concrete, psi.
f - Splitting tensile strength of concrete, psi. sp
2
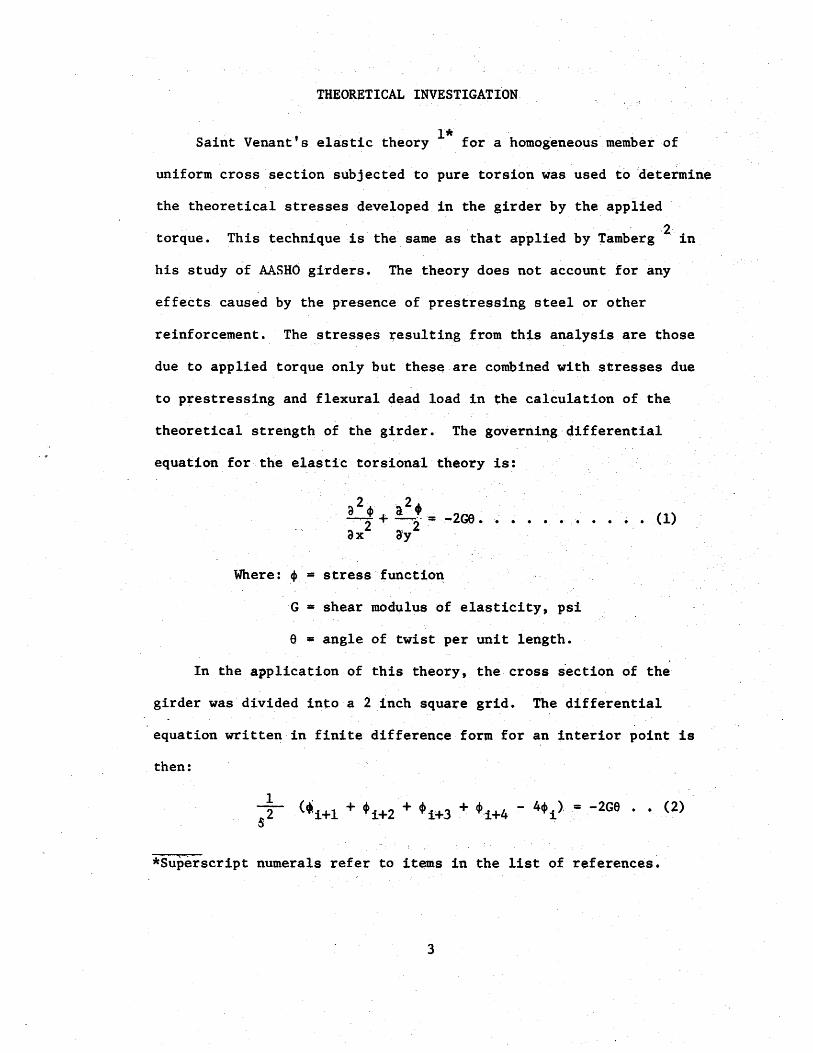
THEORETICAL INVESTIGATION
1* , Saint Venant's elastic theory for a homogeneous member of
uniform cross section subjected to pure torsion was used to 'determine
the theoretical stresses developed in the girder by the applied
torque. .. 2
This technique is the same a$ that applied by Tamberg in
his study of AASHO girders. The theory does not account for any
effects caused by the presence of prestressing steel or other
reinforcement. The stresses ~esulting from this analysis are those
due to applied torque only but thes~ are combined with stresses due
to prestressing and flexural dead load in the calculation of the
theoretical strength of the girder. The governing differential
equation for th~ elastic torsional theory is:
Where: 4> = stress function
G = shear modulus of elasticity, psi
e = angle of twist per unit length.
In the application of this theory, the cross s'ection of the
girder was divided into a 2 inch square grid. The differential
equation written in finite difference form for an interior point is
then:
-2G6 • • (2)
*Superscript numerals refer to items in the list of references.
3

For points near the boundary where the grid pattern is not complete,
the finite difference equation is modified. The finite difference equation
can be written for each point in the grid. This will result in a system
of equations which can be solved simultaneously to yield values of <f> for
each point in the grid.
The·shear stress attributable to the applied torque only can then be
determined by the relationship:
- - (3)
This first partial derivative is evaulated using the forward differences
method. The equation is:
T = ~2 (f.~- ¥2~ + ~t\3,P - !t\4~ + • • ,) - -- - - - (4)
2 Where ll, ll • = the first, second, etc. forward difference.
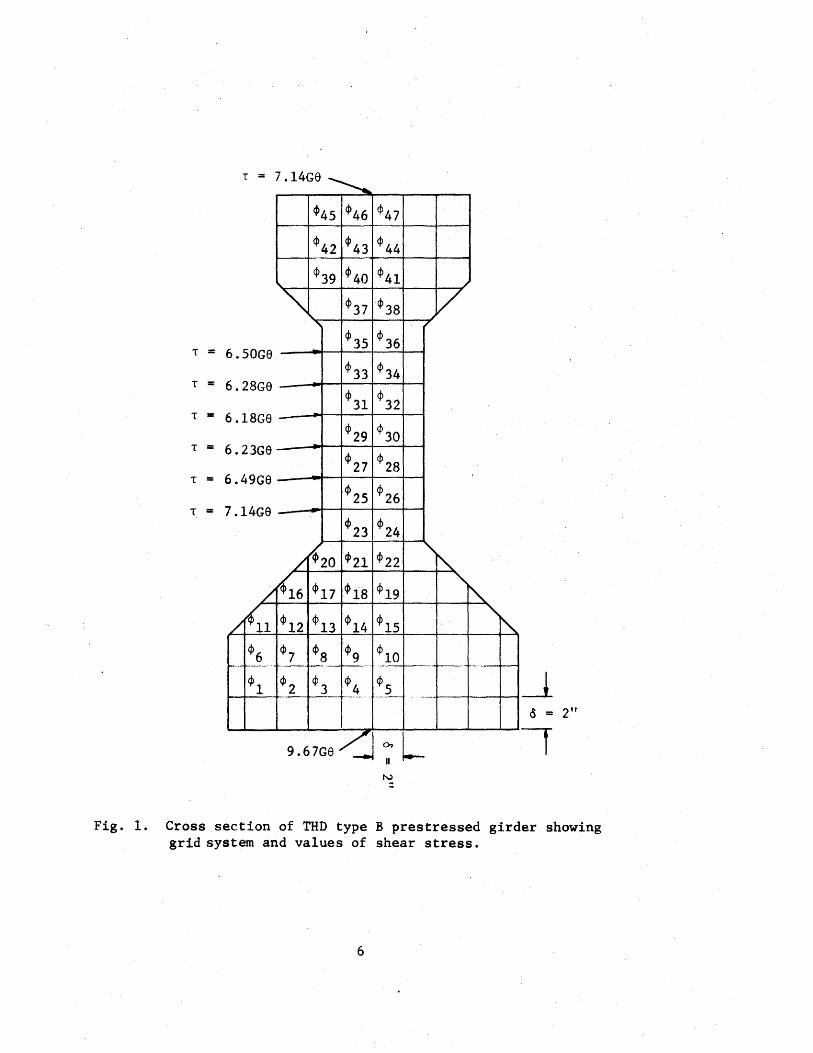
The same values of shear stress can be determined by plotting a cross
section of the stress function surface through the point in question and
evaluating the slope of this curve at that point. Values of <f> for the
cross section of a type B girder are given in Table 1. Values of the shear
stress, in terms of Ge, at various points on the boundary of the cross sec-
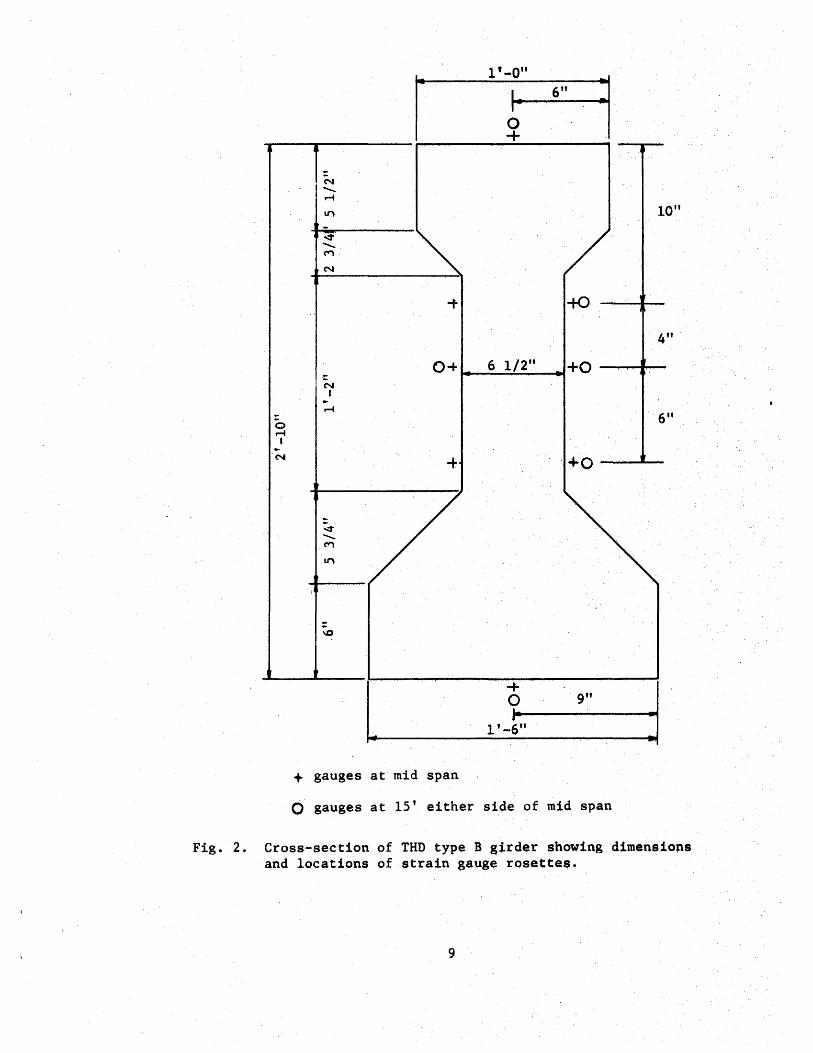
tion are shown in Figure 1. These values of shear stress can be expressed
in another very useful form by replacing GS with ~·
The relationship between applied torque and angle of twist per unit
length is given by:
T = KGS - - - - - - - - - - - - - - - - - - (5)
Where: T = applied torque in-lbs,
K torsional stiffness in 4
= constant, '
G = shear modulus of elasticity, psi, and
e = angle. of twist, radians/in.
4

Detailed example calculations illustr~ting the application of this
theory are presented in Appendix A.
5
T =
T =
T =
T =
T =
T =
T - 7 14G6 - . ~
4>45 ¢>46 ¢47
¢42 4>43 ¢44
4>39 ¢>40 cp41
~' 4>37 ¢>38
6.50Ge ¢>35 ¢>36
4>33 4>34 6.28Ge
4>31 <1>32 6 .18Ge -
<1>29 <1>30 6.23Ge
<1>27 <1>28 6.49Ge
<1>25 ¢>26 7.14Ge
<1>23 <1>24
/ ~20 <1>21 ct>22
/~6 ¢>17 ct>is cp 19
/~1 <1>12 4>13 4>14 ¢>15
<1>6 4>7 <Pg <Pg <1>10
<Pl 4>2 <1>3 4>4 cps ---·- 1-----
9.67Ge /I en l _J"
N
../ v
~
' ~ _j_
0 = 2"
Fig. 1. Cross section of THD type B prestressed girder showing grid system and values of shear stress.
6
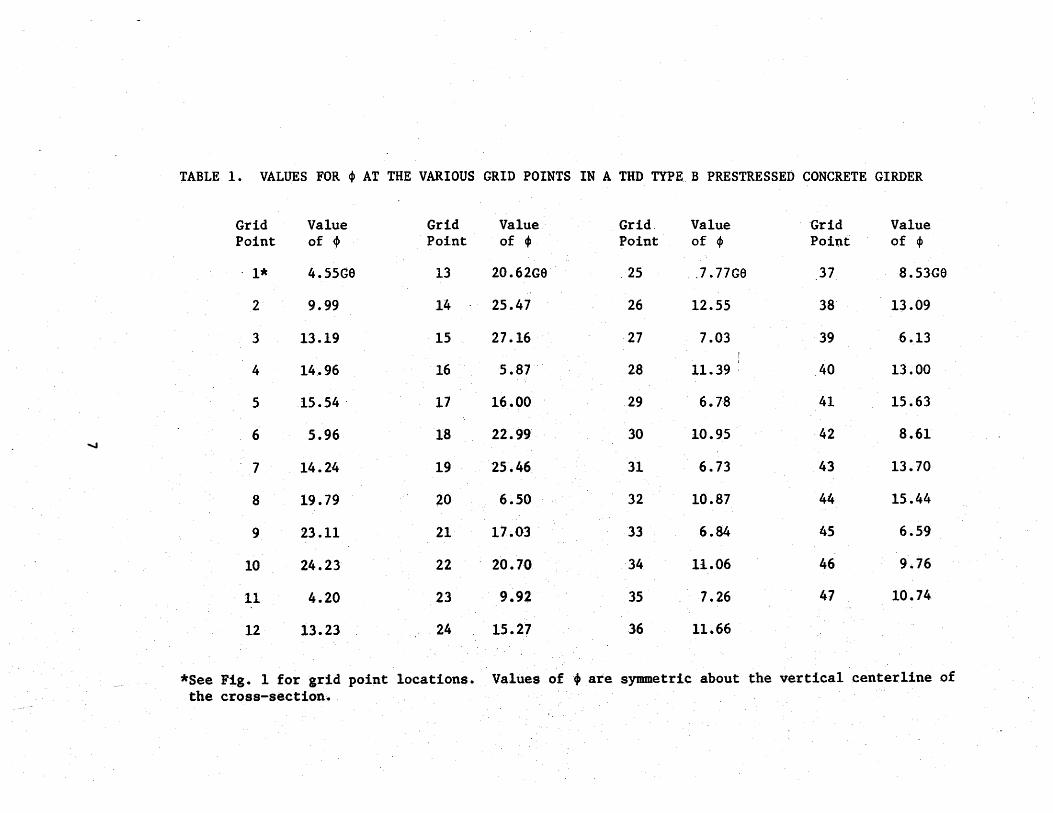
TABLE 1. VALUES FOR ~ AT THE VARIOUS GRID POINTS IN A THD TYPE B PRESTRESSED CONCRETE GIRDER
Grid Value Grid Value Grid Value Grid Value Point of ' Point of ~ Point of ~ Point of ~
1* 4.55G6 13 20.62Ge . 25 . 7. 77Ge 37 8.53G6
2 9.99 14 - 25.47 26 12.55 38 13.09
3 13.19 15 27.16 27 7.03 39 6.13
4 14_. 96 16 5.87. 28 11.39 : 40 13.00
5 15.54 . 17 16.00 29 6.78 41 15.63
6 5.96 18 22.99 30 10.95 42 8.61 ......
7 14.24 19 25.46 31 6.73 43 13.70
8 19.79 20 6.50 32 10.87 44 15.44
9 23.11 21 17.03 33 6.84 45 6.59
10 24.23 22 20.70 34 11.06 46 9 .. 76
11 4.20 23 9.92 35 7.26 47 10.74
12 13.23 24 15.27 36 11.66
*See Fig. 1 for grid point locations. Values of + are symmetric about the vertical centerline of the cross-section.
EXPERIMENTAL· INVESTIGATION
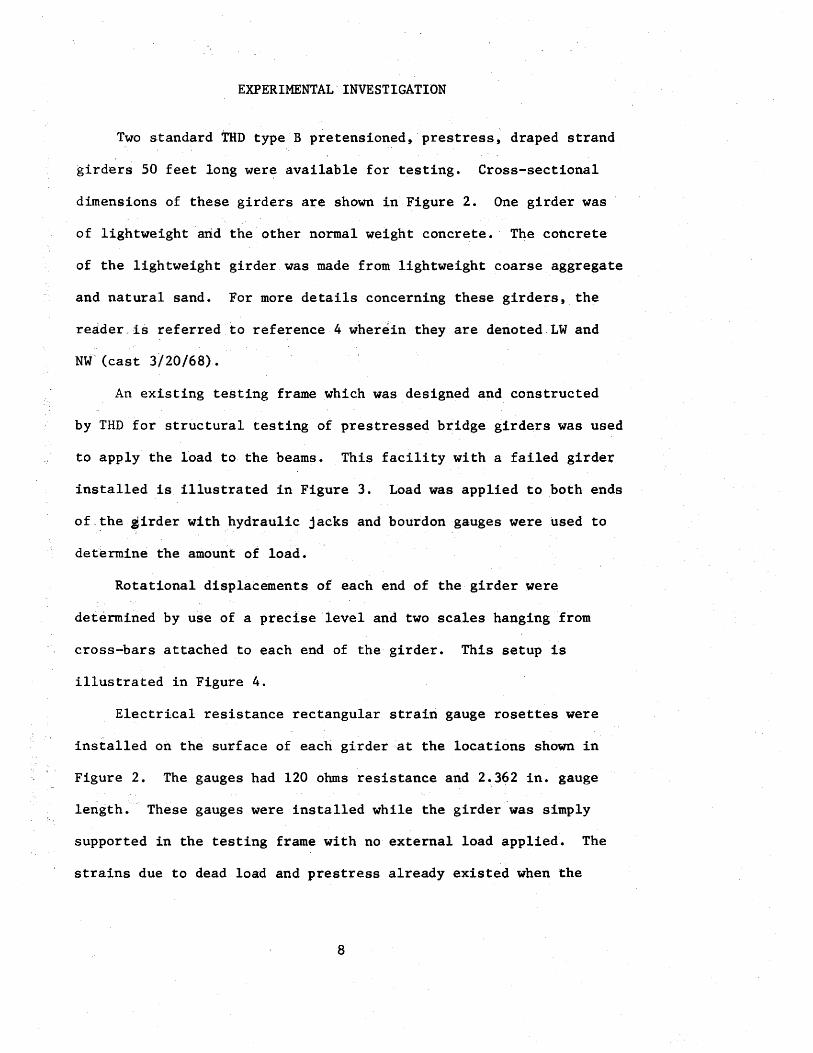
Two standard THD type B pretensioned, prestress, draped strand
girders 50 feet long were available ·for testing. Cross-sectional
dimensions of these girders are shown in Figure 2. One girder was
of lightweight arid the other normal weight concrete. The concrete
of the lightweight girder was made from lightweight coarse aggregate
and natural sand. For more details concerning these girders, the
reader is referred to reference 4 wherein they are denoted.LW and
NW (cast 3/20/68).
An existing testing frame which was designed and constructed
by THD for structural testing of prestressed bridge girders was used
to apply the load to the beams. This facility with a failed girder
installed is illustrated in Figure 3. Load was applied to both ends
of.~he girder with hydraulic jacks and bourdon gauges were used to
determine the amount of load.
Rotational displacements of each end of the girder were
determined by use of a precise level and two scales hanging from
cross-bars attached to each end of the girder. This setup is
illustrated in Figure 4.
El-ectrical resistance rectangular strain gauge rosettes were
installed on the surface of each girder at the locations shown in
Figure 2. The gauges had 120 ohms resistance and 2.362 in. gauge
length. · These gauges were installed while the girder was simply
supported in the testing frame with no external load applied. The
strains due to dead load and prestress already existed when the
8
N -... M
II')
~ -... M
N
N I -M
0 M I -N
l + gauges at
0 gauges at
Fig. 2. Cross-section of and locations of
r
-t
0-+
-+
mid span
15' either
1'-0"
6
J· 0 +
1/2''
+ 0
side of
6" l
-tO
+0
+o
9"
mid span
THD type B girder showing strain gauge rosette$.
9
10"
4"
6"
dimensioflS
gauges were installed and the strains measured by these gauges were
those due to the applied torque only. The orientation of the gauges
was such that the three arms made angles of zero, 45 and 90 degrees
with the longitudinal axis of the girder. Switching and balancing
units and digital readout equipment were used to read these gauges.
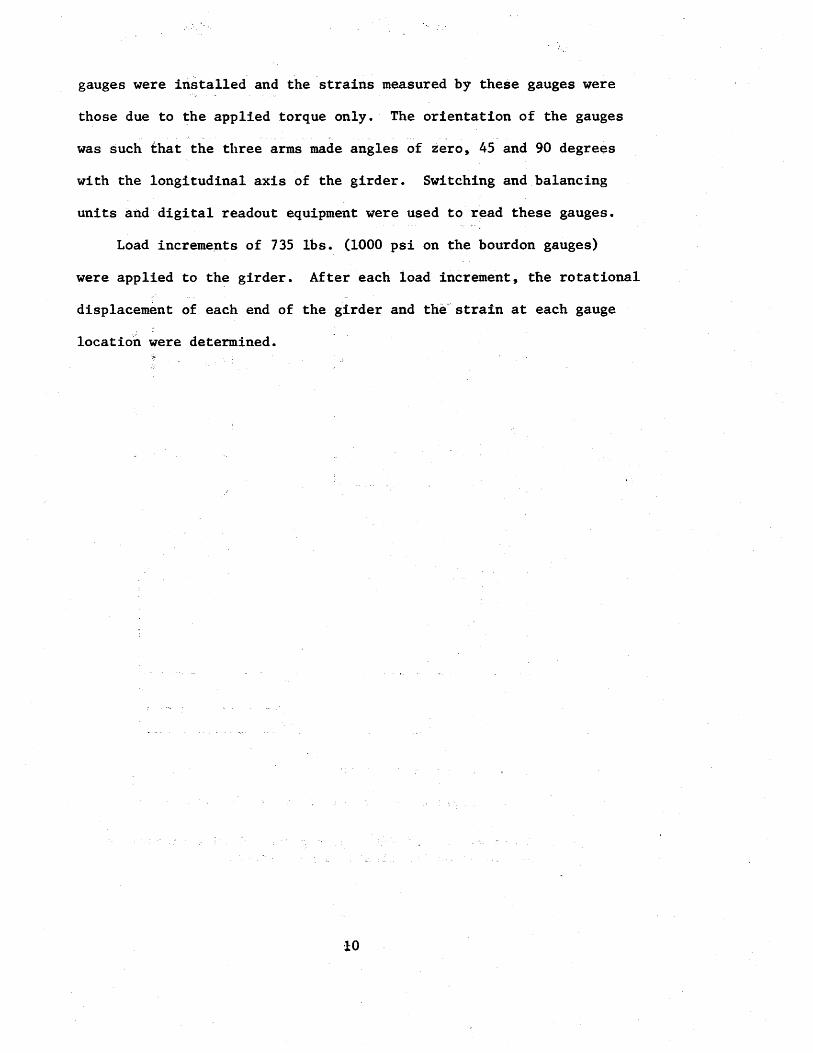
Load increme~ts of 735 lbs. (1000 psi on the bourdon gauges)
were applied to the girder. After each load increment, the rotational
displacement of each end of the girder and the-'strain at each gauge
location were determined.
10

Fig. 3. Testing frame with failed specimen.
Fig. 4. End view of testing frame showing scales used to determine rotational displacements of end of specimen.
11
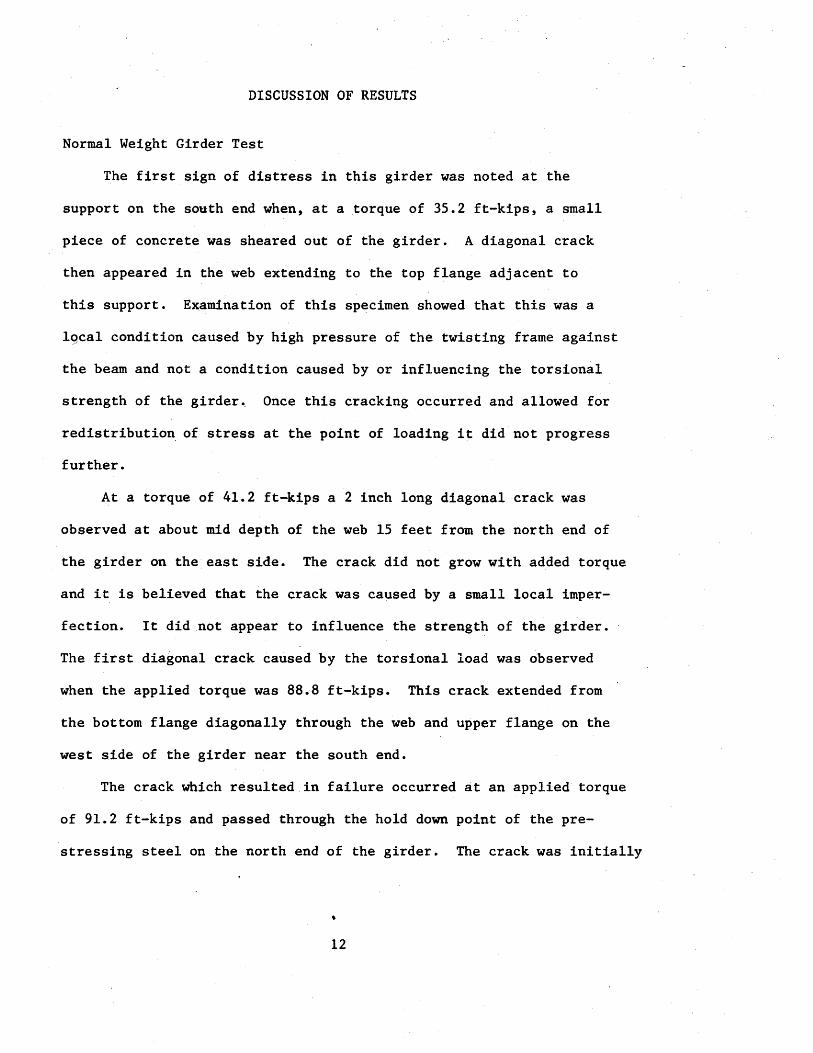
DISCUSSION OF RESULTS
Normal Weight Girder Test
The first sign of distress in this girder was noted at the
support on the south end when, at a torque of 35.2 ft-kips, a small
piece of concrete was sheared out of the girder. A diagonal crack
then appeared in the web extending to the top flange adjacent to
this support. Examination of this specimen showed that this was a
lgcal condition caused by high pressure of the twisting frame against
the beam and not a condition caused by or influencing the torsional
strength of the girder~ Once this cracking occurred and allowed for
redistribution of stress at the point of loading it did not progress
further.
At a torque of 41.2 ft-kips a 2 inch long diagonal crack was
observed at about mid depth of the web 15 feet from the north end of
the girder on the east side. The crack did not grow with added torque
and it is believed that the crack was caused by a small local imper
fection. It did not appear to influence the strength of the girder.
The first diagonal crack caused by the torsional load was observed
when the applied torque was 88.8 ft-kips. This crack extended from
the bottom flange diagonally through the web and upper flange on the
west side of the girder near the south end.
The. crack which resulted in failure occurred at an applied torque
of 91.2 ft-kips and passed through the hold down point of the pre
stressing steel on the north end of the girder. The crack was initially
12
..... w
WEST SIDE
TOP
EAST SIDE
BOTTOM
5'
r---- ~----....___
J 20'
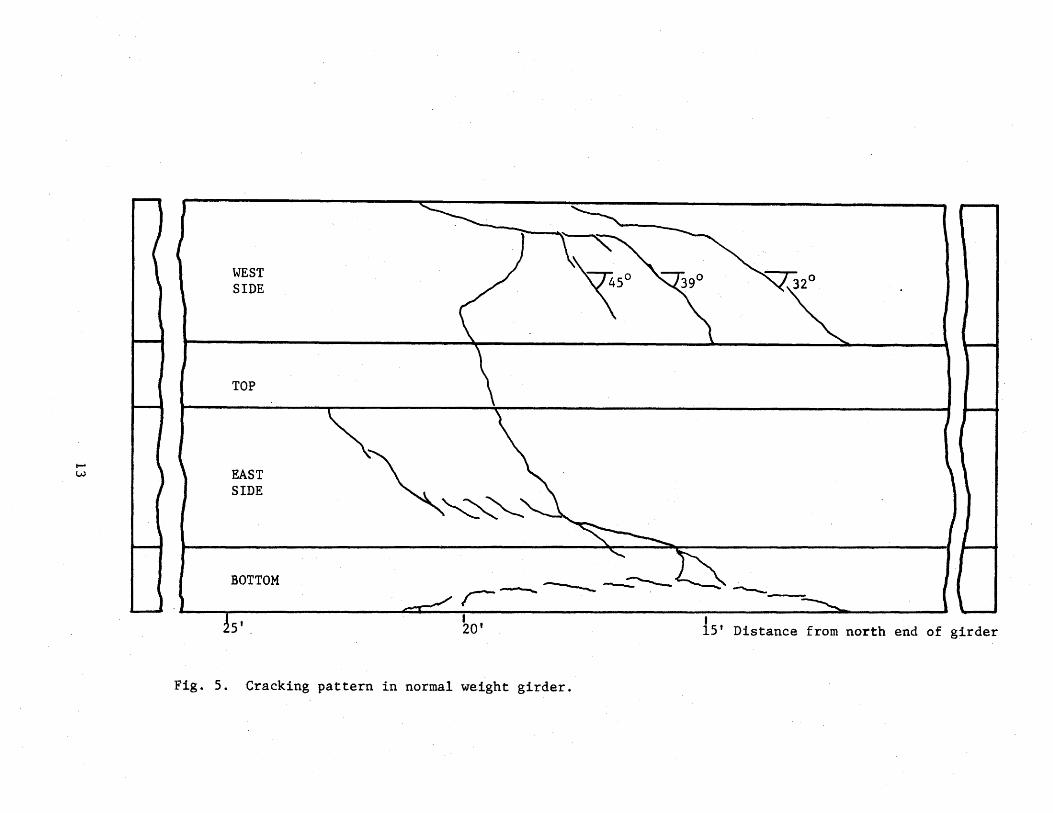
Fig. 5. Cracking pattern in normal weight girder.
~-
I 15' Distance from north end of girder

Fig. 6. Photo of failure in normal weight girder.
14

observed to extend from a point where the bottom flange joins the
web diagonally to the top of the girder. The crack projected across
the top flange and diagonally down the other side of the girder
forming a helical shape. The two ends of the helix were connected
by a longitudinal crack in the bottom flange. The crack pattern
developed in this girder is illustrated in Figure 5 and the failure
crack is illustrated in Figure 6.
Lightweight Girder Test
The same type of local cracking occurred at the loading frame
on the south end as it did with the normal weight girder. This
distress occurred at torques below 41.2 ft-kips. At a torque of
41.2 ft-kips a diagonal crack occurred adjacent to the support at
the south end but neither of these cracks grew any further as ·
loading continued. At 82.3 ft-kips of torque diagonal cracking began
to occur in the top flange and web. These cracks developed at several
locations along the length of the girder while the torque was being
held at 82.3 ft-kips. The girder failed while the strain gauges were
being read at this level of torque. The crack pattern developed in
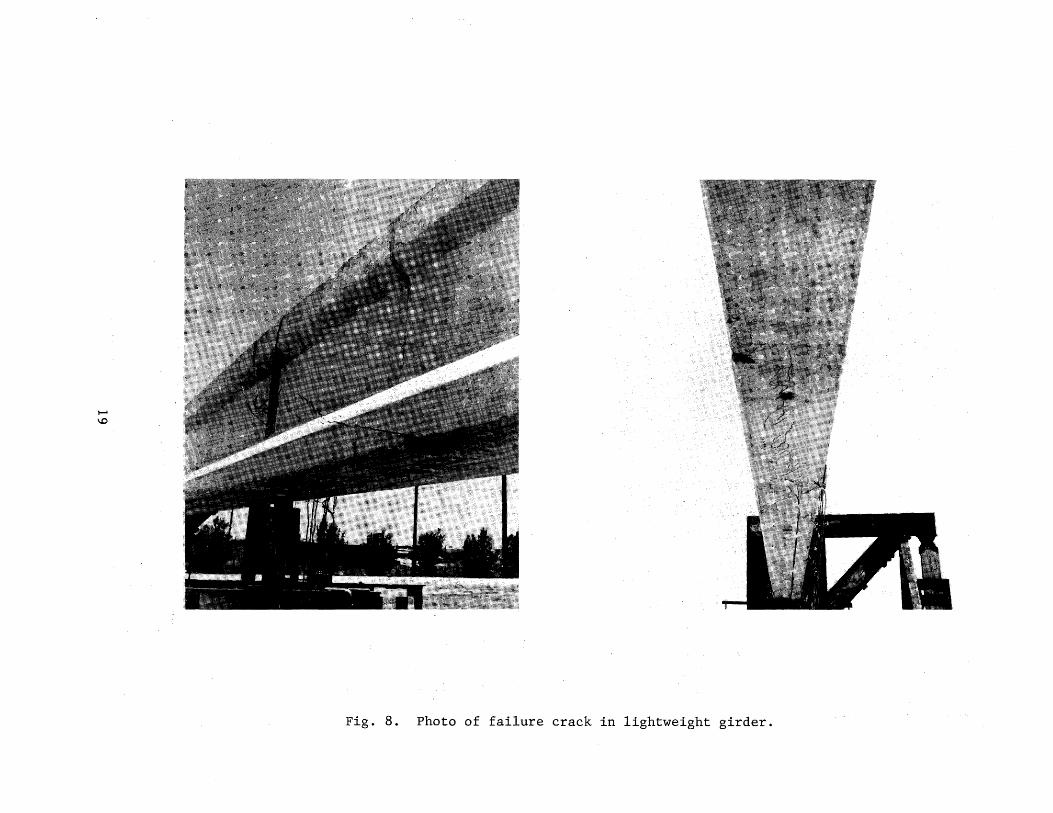
this girder is illustrated in Figure 7 and the failure crack is
illustrated in Figure 8.
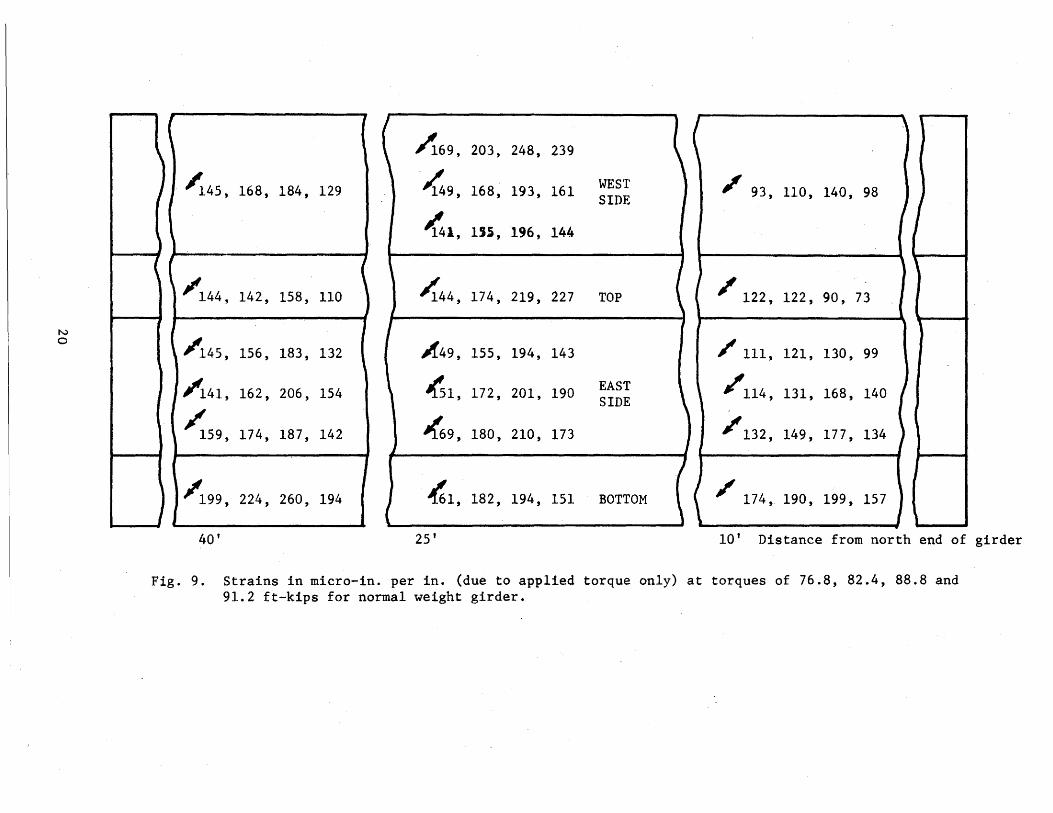
Experimental Strains
The strains measured by the arms of the strain gauge rosettes
0 which were at 45 angles to the longitudinal axis of the girder were
the principal strains due to the applied torque. This fact was verified
15
experimentally~~~ the nil strains measured in the longitudinal .and
transverse directions. The magnitude of these strains at levels of
torque of 76.8, 82.4, 88.8 and 91.2 ft-kips for the normal weight
girder are given in Figure 9 and at levels of torque at 64.8, 70.4,
76.8 and 82.4 ft-kips for the lightweight girder in Figure 11.
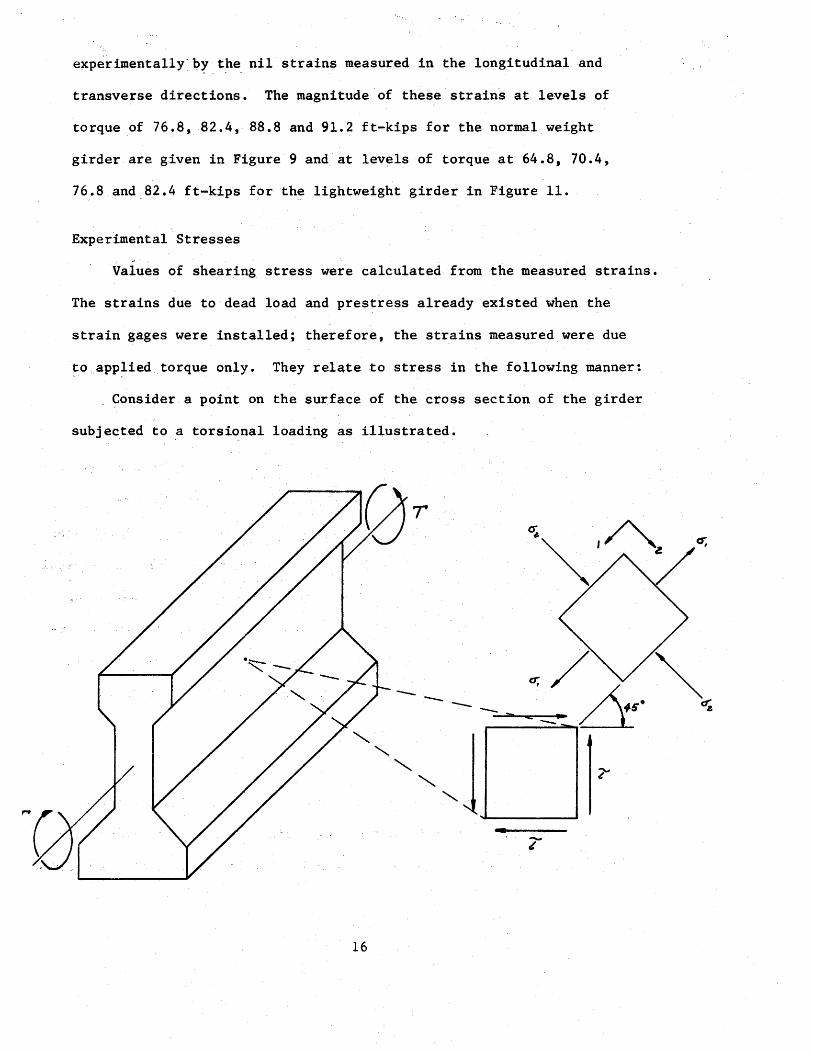
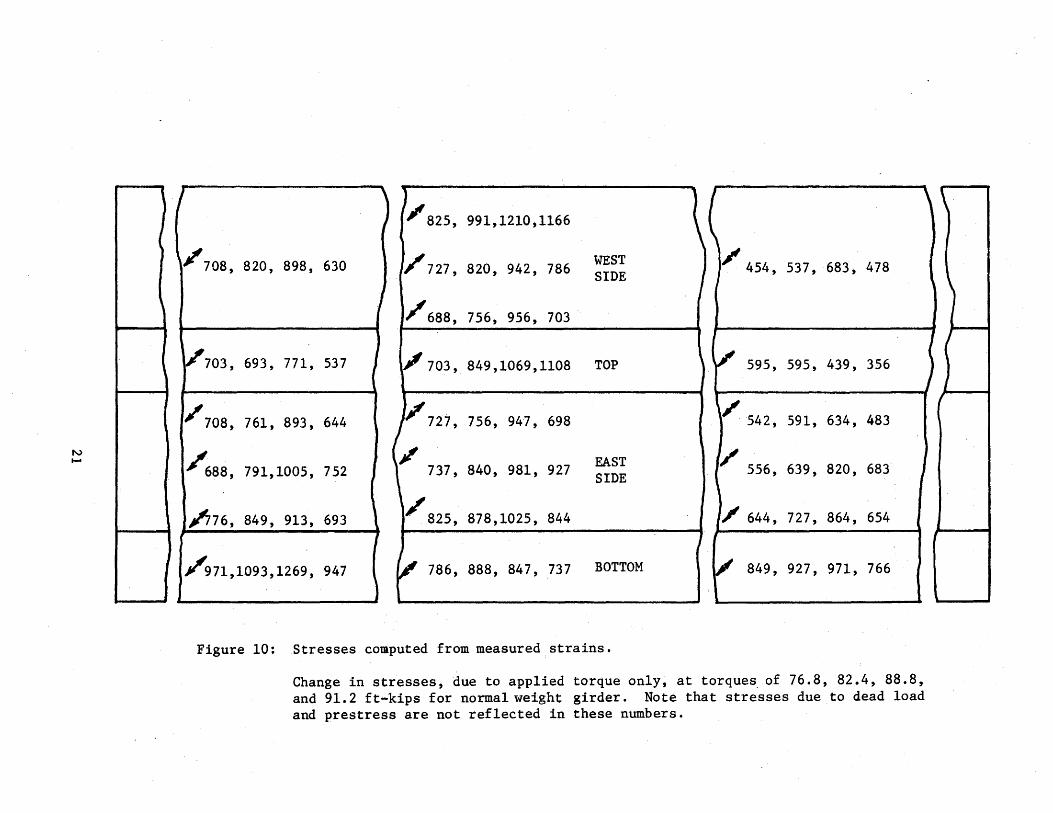
Experimental.Stresses ~
Values of shearing stress were calculated from the measured strains.
The strains due to dead load and prestress already existed when the
strain gages were installed; therefore, the strains measured were due
toapp~ied torque only. They relate to stress in the following manner:
Consider a point on the surface of the cross section of the girder
subj ect.ed to a torsional loading as illustrated.
-- -- --
16
For a point subjected to pure shear the following three equations
are valid.
E 1 = (o 1 - l.la2)/E
E 2
= (a 2
... 1J a 1
) /E
These equations and G = 2 ( 1!1J) will yield:
T = 2GE - - - - - - - - - - - - (6)
The shear stress was calculated, using equation 6, for each point where
the strain was experimentally measured. These values of shear stress,
which are equal in magnitude to the principal tensile stress at that
point, are presented in Figures 10 and 12.
17

...... CX)
WEST
41~ SIDE
J
TOP
40~~~ 38, EAST SIDE
J BOTTOM
t
I
45' 30' 25'
Figure 7. Cracking pattern in lightweight girder.
20' Distance from north end of girder.
...... \0
Fig. 8. Photo of failure crack in lightweight girder.
N 0
I
)
~
~45, 168, 184, 129
I
l .
~69, 203, 248, 239
~9, 168, 193, 161
~
WEST J SIDE
~ 141, lJS, 196, 144
'
( ~
~ 93, 110, 140, 98 I J
I
J
I
I
I ( I ~
;'144, 142, 158, 110 )
I
Jf.i44, 174, 219, 227 TOP ~ J
l I' .
122, 122, 90, 73 . l I
I ;'145, 156, 183, 132 I I
~49, 155, 194, 143 ~ 111, 121, 130, 99
I ~41, 162, 206, 154
I ~s9, 174, 187, 142 ' ~1, 172, 201, 190 EAST SIDE
~9, 180, 210, 173 ]
I
,?'114, 131, 168, 140 I
t /132, 149, 177, 134 )
J
I
I
;'199, 224, 260, 194 J
I ( ' ~1, 182, 194, 151 BOTTOM { ~
( / 174, 190, 199, 157 I \ j \
40' 25' 10' Distance from north end of girder
Fig. 9. Strains in micro-in. per in. (due to applied torque only) at torques of 76.8, 82.4, 88.8 and 91.2 ft-kips for normal weight girder.
N ....
I
\ ' ' ) ,
,825, 991,1210,1166 ~ j ~
Ji'708, 820, 898, 630 )1'727, 820, 942, 786 WEST ) SIDE
/454, 537, 683, 478
J /688, 756, 956, 703 .
~703, 693, 771, 537 I
/ 703' 849' 1069' 1108 TOP ) 595, 595, 439, 356
)'708, 761, 893, 644
~688, 791,1005, 752
' '/727, 756, 947, 698
/ 737, 840, 981, 927 EAST
SIDE
/ I . 542, 591, 634, 483
)I 556, 639, 820, 683
I ~76, 849, 913, 693 /825, 878,1025, 844 )' 644, 727, 864, 654
I
)1'971,1093,1269, 947 } ~ 786, 888, 847, 737 BOTTOM 849, 927, 971, 766
Figure 10: Stresses computed from measured.strains.
Change in stresses, due to applied torque only, at torques of 76.8, 82.4, 88.8, and 91.2 ft-kips for normalweight girder. Note that stresses due to dead load and prestress are not reflected in these numbers.

N N
1 I
I I ~ 187, 201, 208, 220 \ I
~07, 232, 254, 269 ' ~
~ 177, 199, 217, 236 WEST
' ~ SIDE
I I' 182' 202' 213' 233
~91, 207, 226, 278, I
I l I ~ I AlB, 242. 257. 271 I
~ / 160, 167' 175, 182
t } TOP )
I ~172, 190, 210, 207
I I
l
)~237, 259, 272, 293
~90, 204, 232, 251 I ~239, 270, 287, 298
I / 200, 212, 224, 238
~157, 181, 197, 219 EAST SIDE
/ 202' 224' 240' 264
I ~215, 237, 260, 237
' ~46, 168, 181, 165
: ~18, 240, 224, 299
I ~
~271, 303, 341, 391 ~312, 369, 425, 520 BOTTOM
\ ~269, 292, 334, 391
j --25 10' Distance from north end of girder
Fig. 11. Strains in micro-in. per in. (due to applied torque only) at torques of 64.8, 70.4 76.8 and 82.4 ft~kips for lightweight concrete girder.

N w
t
, J
~
I /584, 627, 649, 686
~46, 723, 792, 839 ~552, 621, 677, 736
Jl'568, 630, 665, 727
680, 755, 802, 846 /499, 521, 546, 568
~40, 808, 849, 914 ~624, 661, 699, 743
~93, 636, 724, 783 ~ 490, 565, 615, 683
' A6 /630, 699, 749, 824
~46, 945,1064,1220 ~ 973,1151,1326,1622
40' 25'
) l
WEST ' SIDE
TOP ~
EAST SIDE
I
BOTTOM I
I
~ 596, 646, 705, 867
~37, 593, 655, 635
-~71, 739, 811, 739
/ 456, 524, 565, 515
<so, 749, 699, 924
~39, 911,1042,1220
10' Distance from north end of girder.
Figure 12: Stresses computed from measured strains
Change in stresses, due to applied toruqe only, at torques of 64.8, 70.4, 76.8 and 82.4 ft-kips for lightweight girder. Note that stresses due to dead load and prestress are not reflected in these numbers.

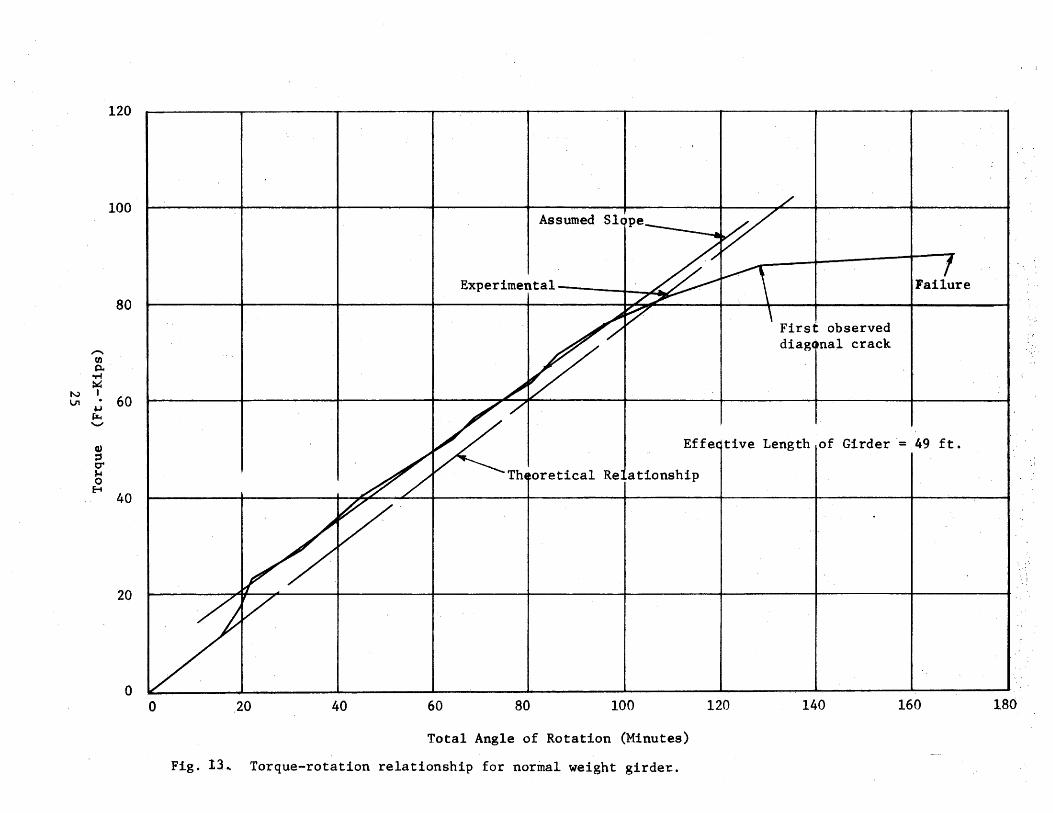
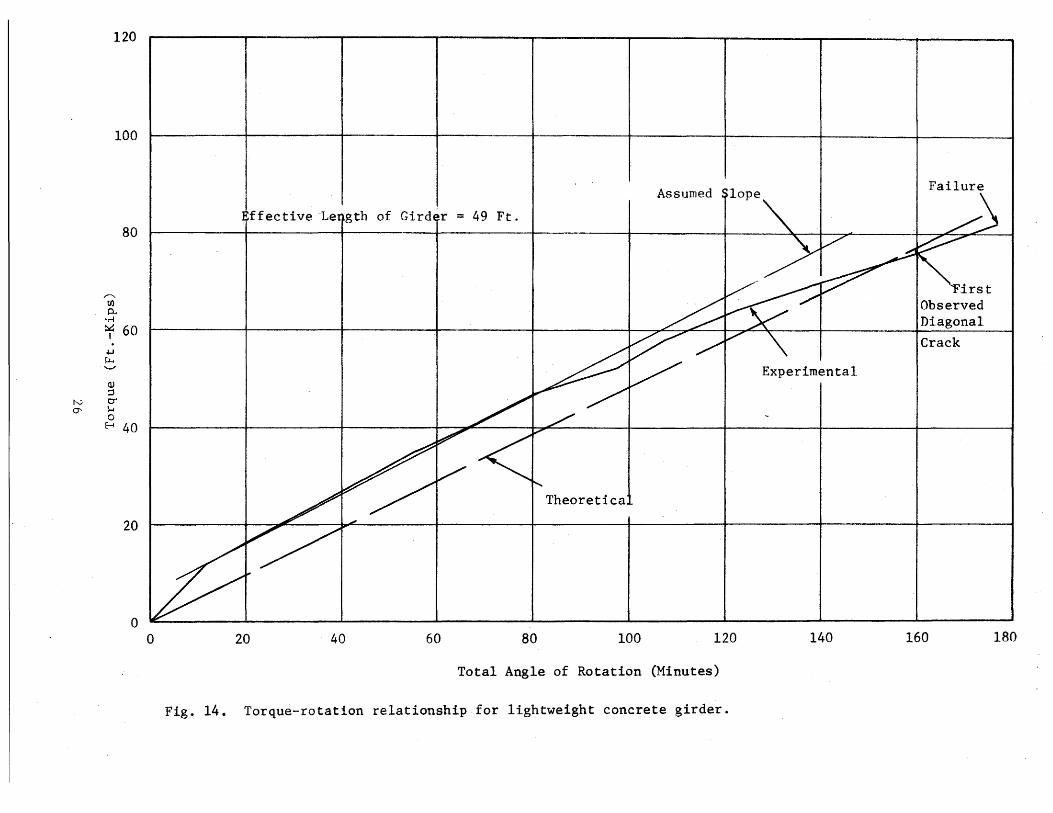
Comparison of theoretical with experilnental results
The relationships between the torque and angle·of twist for the two
girders are illustrated in Figures 13 and 14. On each graph a line has
beendrawn through the portion of the curve most nearly approximating a
straight line. This line is assumed to be the slope of the torque-rotation
4 ' relationship. Using these data with K = 7,600 in the expression T =KGB
1 T 6 or K 0 = G, one finds G to be 2.30 and 1.65Xl0 psi for the normal weight and
lightweight girders respectively. This compares with values of G = 2.44
and 1.56Xl06 psi determined by ASTM C215, "Test for Fundamental Transverse,
Longitudinal, and Torsional Frequencies of Concrete Specimens", for the two
girders.
If the stresses due to the applied torque are combined with those due to
prestress and dead load the resulting principal stresses (neglecting stress
concentrations at the reentrant corners) are greatest in the middle of the
face of the top flange at points 5 ft. on either side of midspan of the girder.
The expressions relating maximum tensile stress to applied torque are:
cr = 68.5 + ~ /4 700 ~ 127.3 T2 1
-t \1 cr
(8)
and
cr = 116.6 + \./13,6000 + 127.3 T21
- (9) t \1 cr
for the normal weight and lightweight girders respectively. A more detailed
treatment of these relationships is given in Appendix C. If the tensile
strength of the concrete is taken as 10 f' , the resulting torques necessary c
to cause cracking of the concrete as 66.1 ft-kips for the normal weight and
66.5 ft-kips for the lightweight girder.
Two standard 6Xl2 cylinders were available for each of the girders.
24
N U1
-til p.. or-f ~ I
120
100
80
~ 60 ILl .._,
cu =' 0" 1-1 0
E-t 40
20
0 0
Assumed Slope
Experimental 1 ~
First observed diagqnal crack
Failure
Effective Length~of Girder= 49ft.
ationship
20 40 60 80 100
Total Angle of Rotation (Minutes)
Fig. 13, Torque-rotation relationship for normal weight girder.
120 140 160 180
120
100
,........, (J) p.
•rl
80
~ 60 ~ ~ ..._,
<1)
:J N 0" 0" )-I
0 ~ 40
20
0 0
Assumed
ffective ~ength of Gird~r = 49 Ft.
Theoretica
20 40 60 80 100 120
Total Angle of Rotation (Minutes)
Fig. 14. Torque-rotation relationship for lightweight concrete girder.
Experimental
140
Failure
irst Observed Diagonal
Crack
160 180
Splitting tensile tests·w.ere conducted.on these cylinders in the Texas
Transportation Institute laboratory. The splitting tensile streng~h was
540 psi for the lightweight concrete and 560 psi for the normal weight
concrete. If these values are used in the above expressions, the torques
necessary to cause cracking are 36.1 ft-kips for the lightweight and
44.1 ft-kips for the normal weight girders. For the normal weight girder
the first observed diagonal crack, other than the 2 in. long diagonal
crack observed at 41.2 ft-kips and whose origin is not known, occurred at
a torque of 88.5 ft-kips. However, the shape of the torque rotation curve
indicates that some unobserved cracking may have occurred at a torque·as
low as 76.5 ft-kips. The torque-rotation curve for the lightweight
·girder indicates that unobserved cracking may have occurred at 65.0
ft-kips and some as low as 47.0 ft-kips. Computations were made for
selected points on the two girders at selected values of applied
torque for comparisons between theoretical and experimental shear
stresses. The experimental values were calculated using equation 6 and
the theoretical values were determined using the relationships given in
Figure 1, with G0 replaced by T/K. These values are presented and
compared in Table 3 and 4.
27
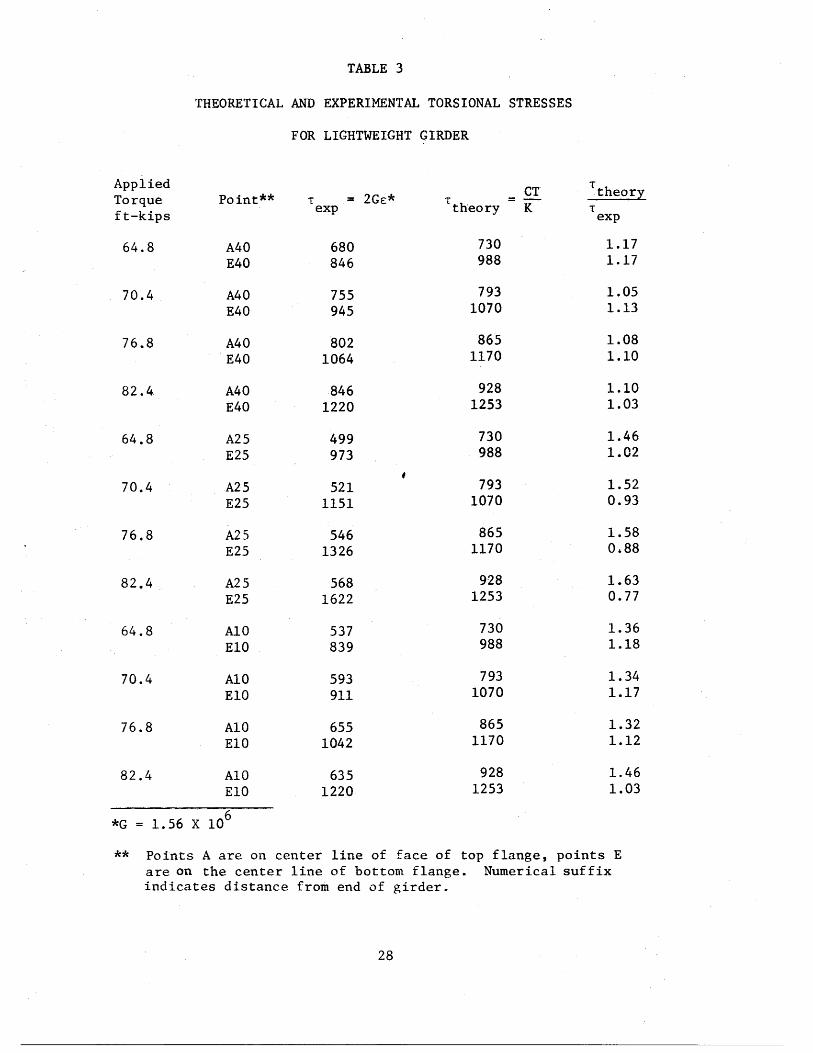
TABLE 3
THEORETICAL AND EXPERIMENTAL TORSIONAL STRESSES
FOR LIGHTWEIGHT GIRDER
Applied CT T
Torque Point** T 2GE* T =-theory
ft-kips exp theory K T exp
64.8 A40 680 730 1.17 E40 846 988 1.17
70.4 A40 755 793 1.05 E40 945 1070 1.13
76.8 A40 802 865 1.08 E40 1064 1170 1.10
82.4 A40 846 928 1.10 E40 1220 1253 1.03
64.8 A25 499 730 1.46 E25 973 988 1.02
70.4 A25 521 793 1.52 E25 1151 1070 0.93
76.8 A25 546 865 1.58 E25 1326 1170 0.88
82.4 A25 568 928 1.63 E25 1622 1253 0.77
64.8 A10 537 730 1.36 E10 839 988 1.18
70.4 A10 593 793 1.34 E10 911 1070 1.17
76.8 A10 655 865 1.32 E10 1042 1170 1.12
82.4 AlO 635 928 1.46 ElO 1220 1253 1.03
*G = 1.56 X 10⁶
** Points A are on center line of face of top flange, points E are on the center line of bottom flange. Numerical suffix indicates distance from end of girder.
28
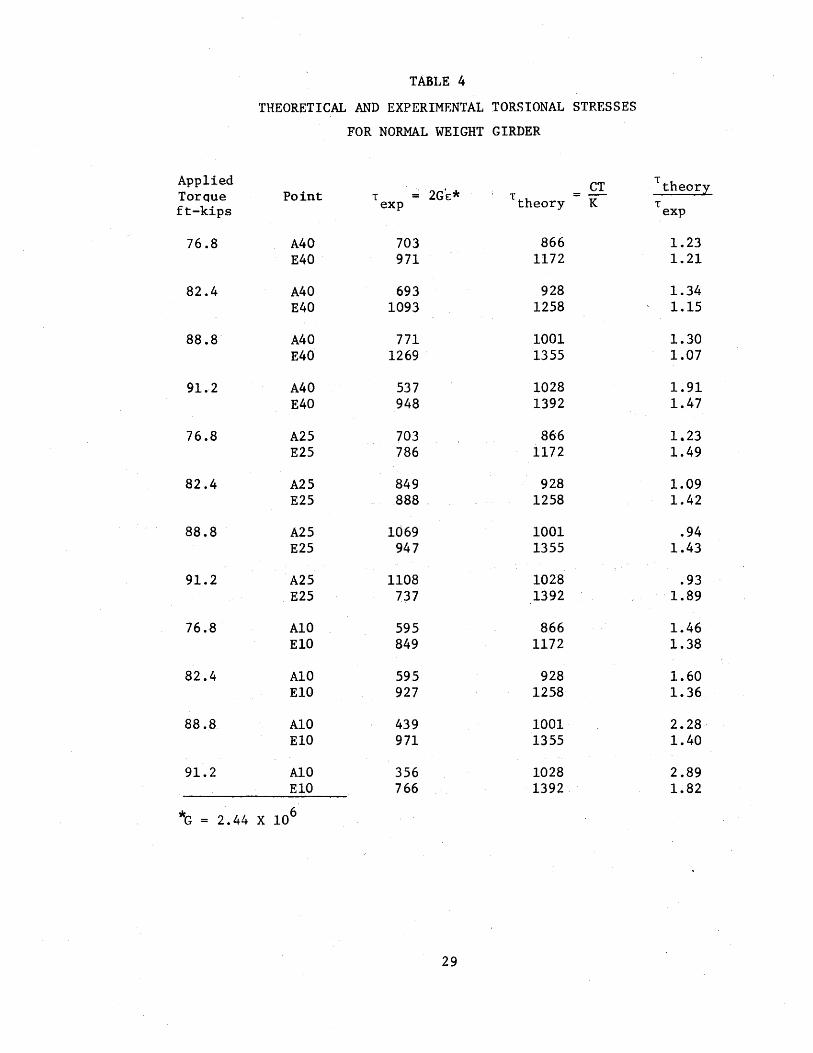
TABLE 4
THEORETICAL AND EXPERIMENTAL TORSIONAL STRESSES
FOR NORMAL WEIGHT GIRDER
Applied CT T
TorQue Point T 2G£* T =-theory
ft-kips exp theory K T exp
76.8 A40 703 866 1.23 E40 971 1172 1.21
82.4 A40 693 928 1.34 E40 1093 1258 1.15
88 .8· A40 771 1001 1.30 E40 1269 1355 1.07
91.2 A40 537 1028 1.91 E40 948 1392 1.47
76.8 A25 703 866 1.23 E25 786 1172 1.49
82.4 A25 849 928 1.09 E25 888 . 1258 1.42
88.8 A25 1069 1001 .94 E25 947 1355 1.43
91.2 A25 1108 1028 .93 E25 737 1392 1.89
76.8 A10 595 866 1.46 E10 849 1172 1.38
82.4 A10 595 928 1.60 E10 927 1258 1.36
88.8 A10 439 1001 2.28· E10 971 1355 1.40
91.2 AlO 356 1028 2.89 ElO 766 1392 1.82
*G = 2.44 X 10⁶
29
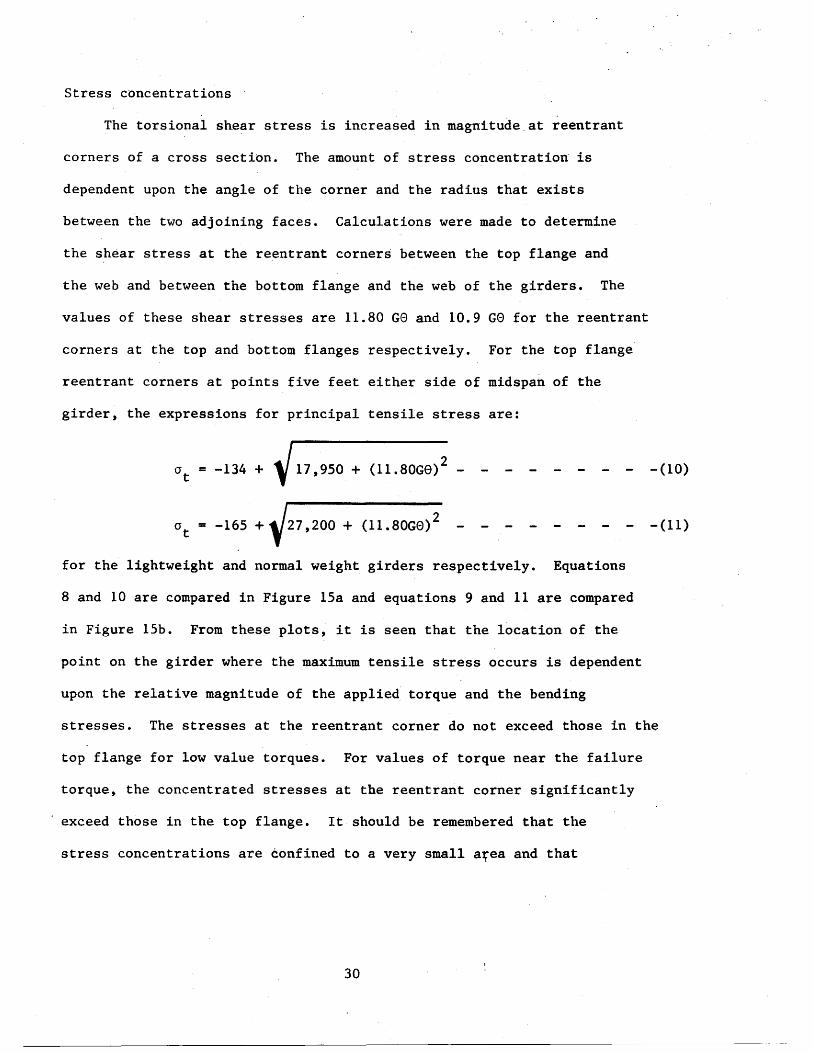
Stress concentrations
The torsional shear stress is increased in magnitude.at reentrant
corners of a cross section. The amount of stress concentration· is
dependent upon the angle of the corner and the radius that exists
between the two adjoining faces. Calculations were made to determine
the shear stress at the reentrant corners between the top flange and
the web and between the bottom flange and the web of the girders. The
values of these shear stresses are 11.80 Ge and 10.9 G8 for the reentrant
corners at the top and bottom flanges respectively. For the top flange
reentrant corners at points five feet either side of midspah of the
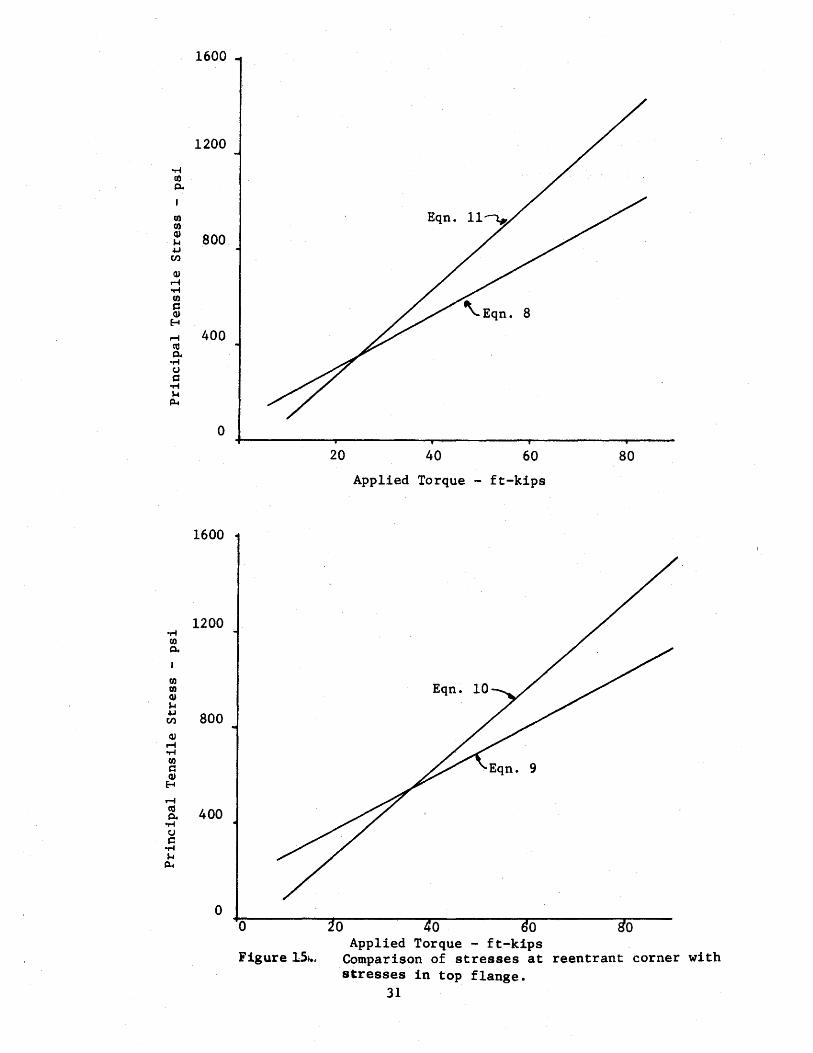
girder, the expressions for principal tensile stress are:
cr = -134 + t
at = -165 +
17,950 + (11.80Ge) 2 -
27,200 + (11.80Ge) 2
for the lightweight and normal weight girders respectively. Equations
8 and 10 are compared in Figure 15a and equations 9 and 11 are compared
in Figure 15b. From these plots, it is seen that the location of the
point on the girder where the maximum tensile stress occurs is dependent
upon the relative magnitude of the applied torque and the bending
-(10)
-(11)
stresses. The stresses at the reentrant corner do not exceed those in the
top flange for low value torques. For values of torque near the failure
torque, the concentrated stresses at the reentrant corner significantly
exceed those in the top flange. It should be remembered that the
stress concentrations are confined to a very small atea and that
30
~ Cl)
0.
I
Cl) Cl) Q) .,... ~ (/.)
Q) ,.... of"'4 Cl)
t::: Q) ~ ,.... co 0.
of"'4 (J
t::: of"'4 ~ ~
•r-f Cl)
0.
Ul CD Q) ,... ~ (/.)
QJ ...... of"'4 (I)
t::: QJ
E-1
...... co 0. ~ (J s:: ~ ,... ~
1600
1200
800
400
0
1600
1200
800
400
0 0
Figure 1St..
20 40 60 80
Applied Torque - ft-kips
0 0 0 0 Applied Torque - ft-kips
Comparison of stresses at reentrant corner with stresses in top flange.
31
significantly lower stresses exist either side of the corner. Localized
plastic yielding could account for the fact that pronounced early
failure did not occur at the reentrant corner in the tests.
32
CONCLUSION
On the basis of the two tests and the analysis conducted in
this study the following conclusions are indicated.
(1) When subjected to a torsional load, the prestressed concrete
girders failed in tension along a diagonal line which made an angle of
approximately 40 degrees on the sides and. 50 degrees on the top flange.
The ends of this crack were connected by a line on the bottom flarige
running longitudinally with the axis of the girder.
(2) The effective values of shearing modulus, G, of 2.30 and 1.65X
106 psi found in the full scale torsion tests compare well with values
of 2.44 and 1.56Xl06 psi determined by ASTM C215 for the normal weight and
lightweight girders respectively~
(3) Theoretically derived torsional capacity using 10~ as the c
ultimate tensile strength was about 75 percent of the experimental
torsional capacity, which is on the conservative side. If strengths
obtained from split cylinder tests· are used as the ultimate strength the
theoretical torsional capacity is about 50 percent of the experimental
torsional capacity.
33
REFERENCES
1. Timoshenko, S. and Goodier, J. N., Theory of Elasticity, Second Edition, McGraw-Hill, New York, 1951.
2. Tamberg, K. G., "Elastic Torsional Stiffness of Prestressed Concrete AASHO Girders," Journal of American Concrete Institute, Proceedings, V. 62, No. 4, April 1965.
3. Gersch, B. c. and Moore, Willard H., "Flexure, Shear and Torsion Tests on Prestressed Concrete !-Beam," Highway Research Board· Bulletin 339, Washington, D. C., 1962.
4. Furr, H. L., Sinno, R., and Ingram, L. I., "Prestress Loss and Creep Camber in Highway Bridge with Reinforced Concrete Slab on Pre tensioned Pres tressed Concrete Beams," Research Report No. 69-3 (Final) Texas Transportation Institute, Texas A&M University, Oct. 1968.
5. Zia, Paul, "Torsional Strength of Prestressed Concrete Members," Journal of the American Concrete .Insti'tute, Proceedings, V. 57, April 1961.
6. Gesund, Hans, and Boston, L. A •. , "Ultimate Strength in Combined Bending and Torsion of Concrete Beams Containing Only Logitudinal Reinforcement," Journal of the American Concrete Institute, Proceedings, V. 61, November 1964.
7. Walsh, et. al, . "The Ul ti'mate Strength· Design of Rectangular Reinforced Concrete Beams Subjected to Combined Torsion, Bending and Shear," Civil Engineering Transactions, The Institute of Engineers, Australia, October 1966.
B. Hsu, T. T. C., "Torsion of Structural Concrete-Uniformly Prestressed Rectangular Members without ·Web Reinforcement," Journal of Pres tressed Concrete Institute, April 1968.
9. Higdon, A., Ohlsen, E. H., Stiles, W. B., and Weese, J. A., Mechanics of Materials, Second Edition, John Wiley and Sons, Inc.,. New York, 1968.
34
APPENDIX A
35
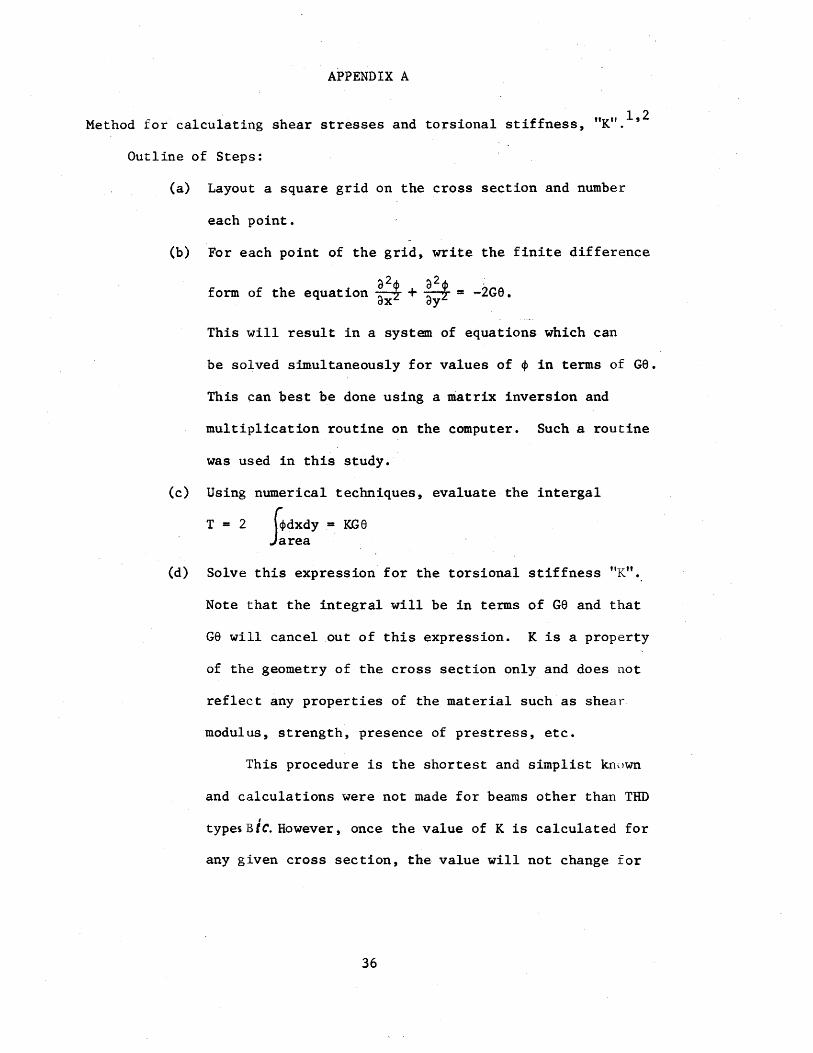
APPENDIX A
Method for calculating shear stresses and torsional stiffness, "K".1
'2
Outline of Steps:
(a) Layout a square grid on the cross section and number
each point.
(b) For each point of the grid, write the finite difference
a2<!> a2<!> , form of the equation aiZ + ayz = -2G6.
This will result in a system of equations which can
be solved simultaneously for values of ~ in terms of Ge.
This can best be done using a matrix inversion and
multiplication routine on the computer. Such a routine
was used in this study.
(c) Using numerical techniques, evaluate the intergal
T = 2 4dxdy = KGB J~rea ·
(d) Solve this expression for the torsional stiffness ''K".
Note that the integral will be in tenns of Ge and that
Ge will cancel out of this expression. K is a property
of the geometry of the cross section only and does not
reflect any properties of the material such as shear
modulus, strength, presence of prestress, etc.
This procedure is the shortest and simplist known
and calculations were not made for beams other than THD
I
typesBtC. However, once the value of K is calculated for
any given cross section, the value will not change for
36
that cross section. Values of K for AASHO girders. given
by Tamberg are: 4 900 . 4 8 30 . 4 Type I - , in. , Type II - , 0 1n. ,
. Type III - 19,000 in. 4 and Type IV - 34,500 in. 4
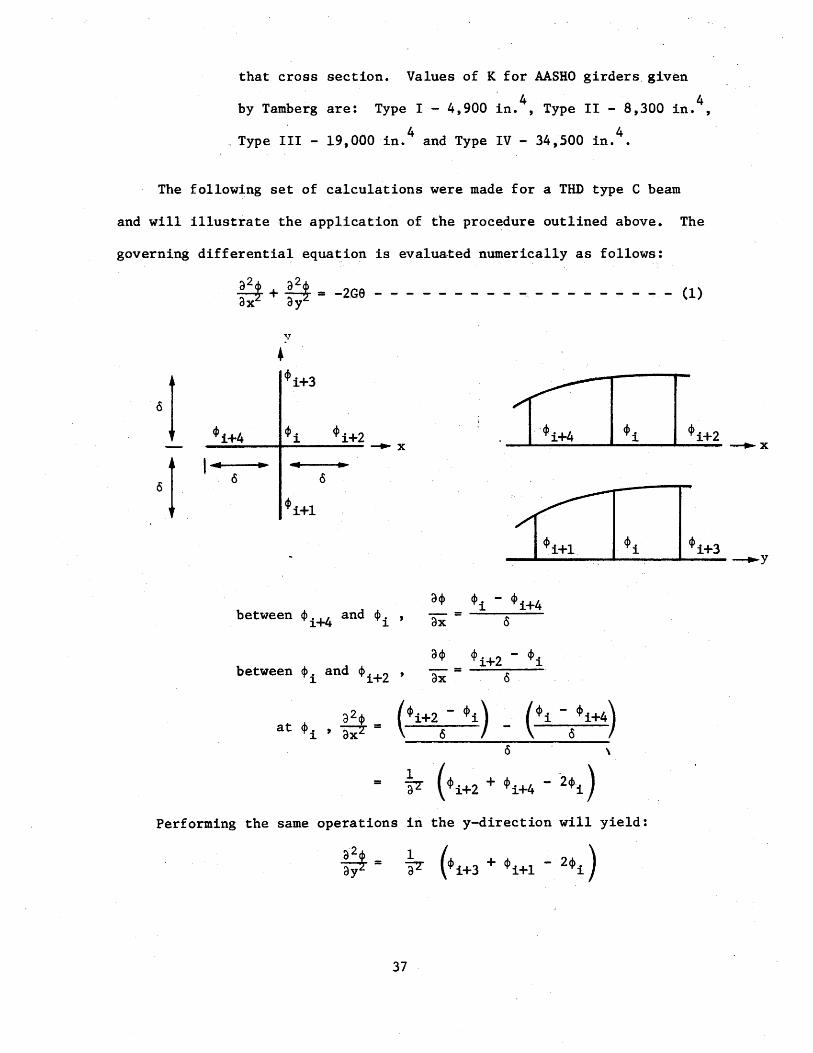
The following set of calculations were made for a THD type C beam
and will illustrate the application of the procedure outlined above. The
governing differential equation is evalua-ted numerically as follows:
.g + .g = -2Ge - - - - - - - - - - - - - - - - - - - (1) ax ay
y
• 0 I 4>1+3
4>1+4 4>i 4>i+2 - ..,..X
0 I , .. ... .. .. . 0 0
4>i+l
between 4>.+4 and 4>. , 1 . 1
between 4>i and 4>i+2 ,
at 4>. , a24> - ('"i+\- ~i) - ei -/i+4) 1 ax2 -
0 \
1 ( ~i+2 + ~i+4 - 2~i) = F
Performing the same operations in the y-direction will yield:
37

Equation 1 then bec~mes:
For points along the boundary where the grid pattern for a given point
is not complete, the differential equation is evaluated as follows:
Case I:
and
boundary of cross section
<Pi+3
<P. - 0 1
F,:4 0
01 = 02
___,. X
2 [ <Pi+l + ct>i+2 +. ct>i+3 _ <Pi _ <Pi] = -ZGa ~ .. 2 l+t;4 2 t;4
38
= 03
t;4
= 04 = 0
04 =-
0
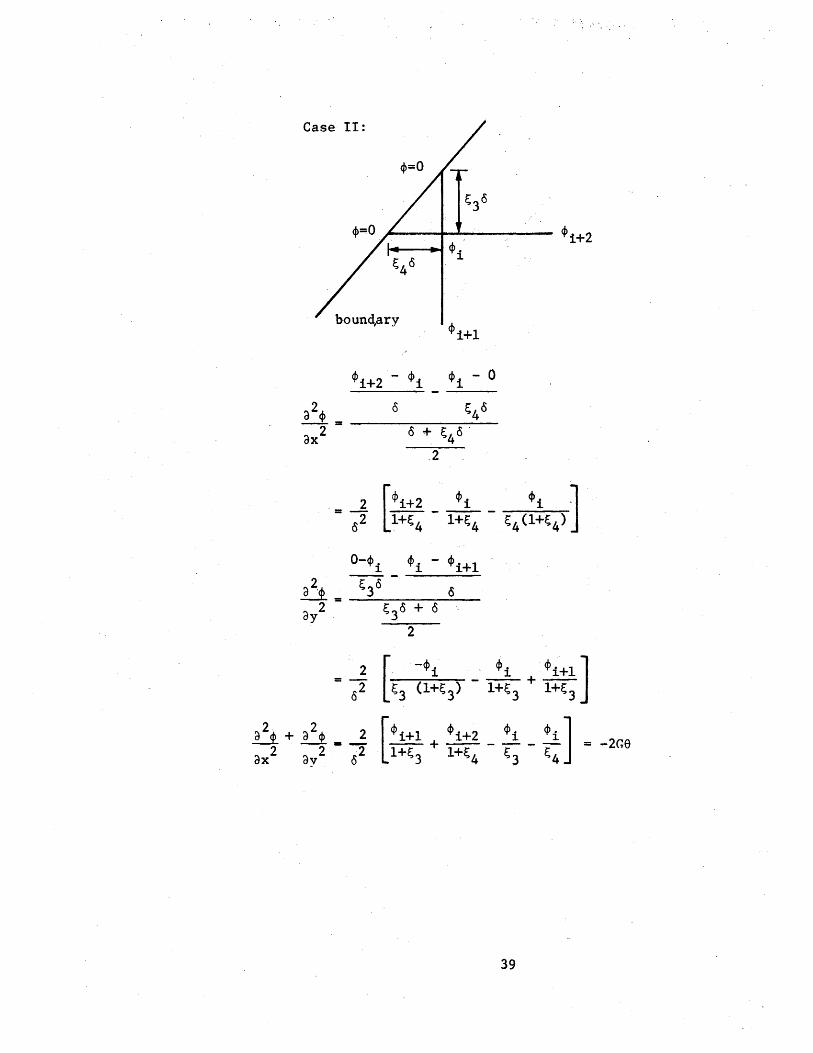
Case II:
~--~~--------- ~1+2 14----1~ ~i
~i+l
~i+2 - ~i ~i - 0
0 ~40
0 + ~4 0'
.2
39

Case III:
Q>=O
boundary
0 ( 1+~1)
2
<Pi+3
a 2 c~> + D_ = _1. [<Pi+2 + <Pi+3 _ <i>i _ <Pi J = _2Ge ax2 ay2 o2 1+~4 1+~1 ~4 ~1
40
, .. ....!__..,
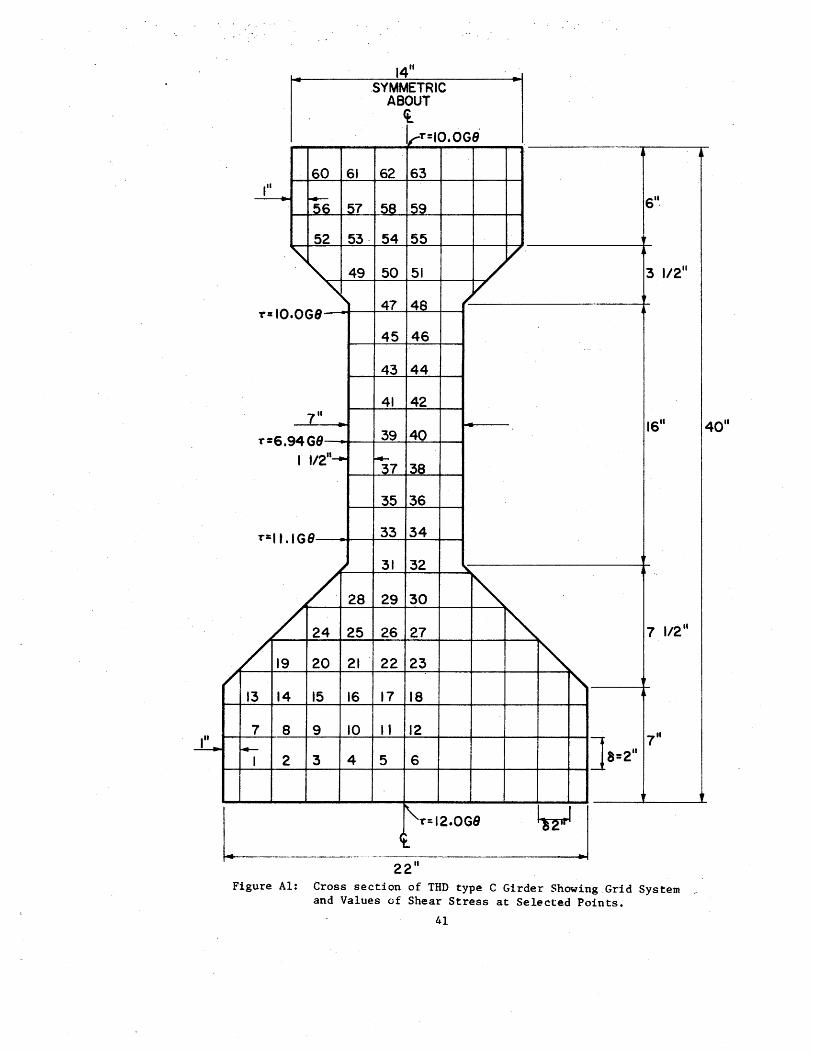
60 61 , .. ~
__:____.., 57
52 53. ., 49
"', T=IQ.OGB
7"
-r=6.94GB I 1/2"_.,
-r=l t.IGB
I
/ 28
/ 24 25
/ 19 20 21 /
13 14 15 16
7 8 9 10 ~
I 2 3 4
1411
.SYMMETRIC ABOUT ~ I T 10 OG8. 1,.-·= •
62 63
58 59
54 55
50 51
47 48 /v
45 46
43 44
41 42 ~
39 40
~7 38
35 36
33 34
31 32 '" 29 30 "" 26 27
22 23
17 18
II 12
5 6
~-r=I2.0GB <t.
22 11
6 ...
v· 3 1/211
1611
~ 7 1/2 11
"" '' ]s=2" 7"
~·
Figure Al: Cross section of THD type C Girder Showing Grid System _ and Values of Shear Stress at Selected Points.
41
4011
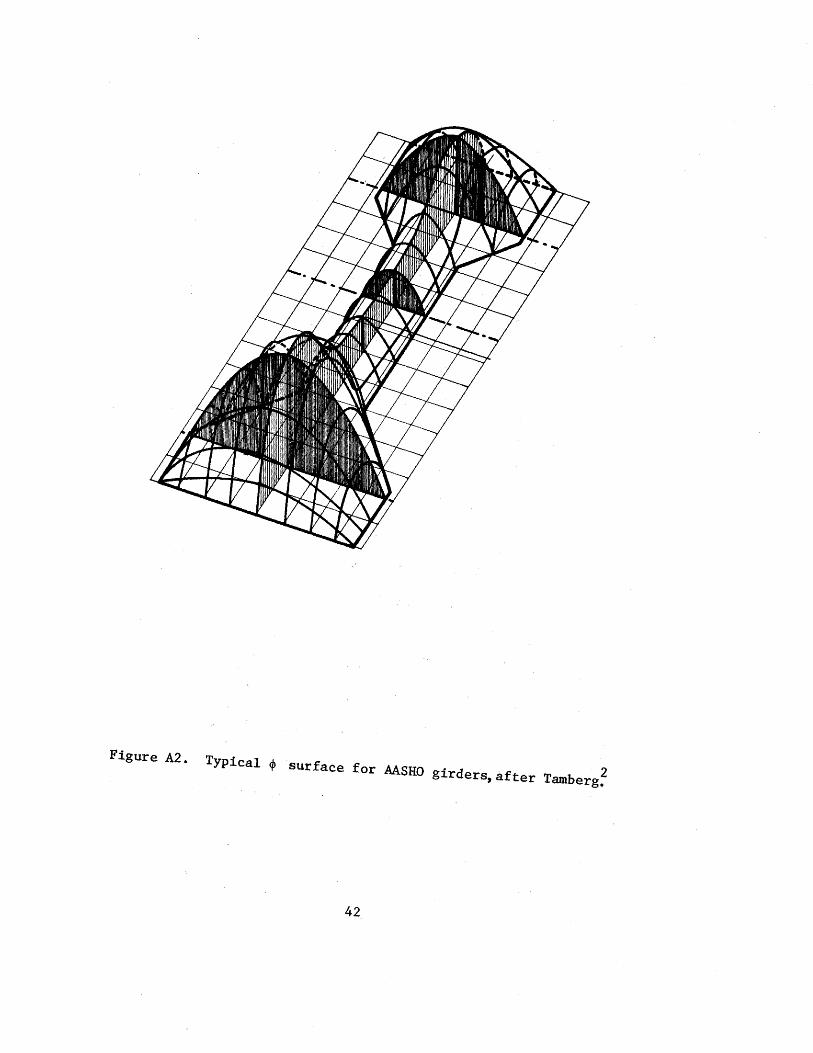
Figure A2. 2 Typical$ surface for AASHO girders,after Tamberg,
42
Grid point
1
2
3
4
5
6
7
8
9
10
11
12
13
14
15
16
17
18
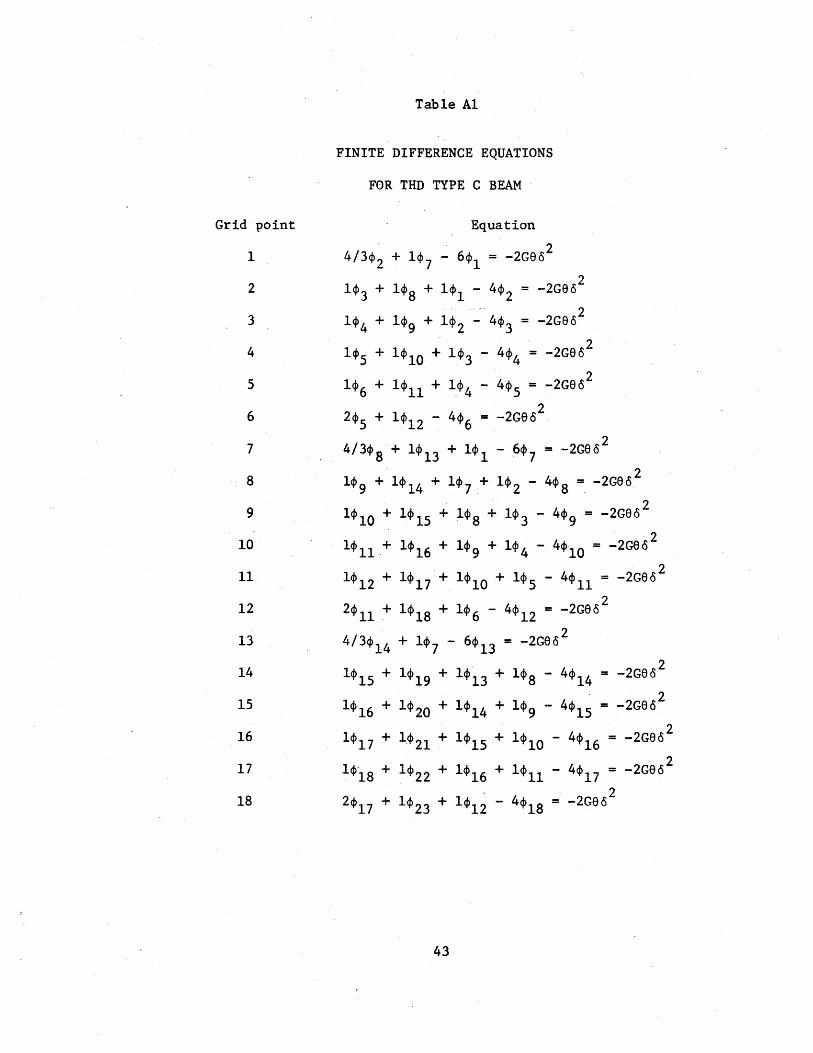
Table A1
FINITE DIFFERENCE EQUATIONS
FOR THD TYPE C BEAM ·
Equation
4/3$2 + 1$ 7 - 6$1 = -2Gao 2
2 1$3 + 1$8 + 1$1 - 4$2 = -2Geo
. . .. -- 2 1$4 + 1$9 + 1$2 - 4$3 = -2Gao
2 1$5 + 1$10 + 1$3 - 4~4 = -2Gao
2 1$6 + 1$11 + 1$4 - 4$5 = -2Gao
2$5 + 1$12 - 4~6 = -2Gao 2
2 4/3$8
+ 1$13 + 1$ 1 - 6$ 7 = -2Gao
2 1$9
+ 1~ 14 + 1$ 7 + 1$ 2 - 4~ 8 =. -2Geo
2 1$10 + 1~ 15 + 1$8 + 1$ 3 - 4$9 = -2Gao
2 1$11 _+ 1~ 16 + 1$9 + 1$ 4 - 4+10 = -2Geo
2 1+12 + 1$17 + 1$10 + 1$5 - 4~11 = -2Gao
2$11 + 1$18 + 1$6 - 4+12 = -2Geo 2
4/3~ 14 + 1$ 7 - 6$13 = -2Geo 2
1$15 + 1~19 + 1$13 + 1$8 - 4~14 = -2Gao2 . 2
1+16 + 1$20 + 1~14 + 1+9 - 4~15 = -2Geo 2 1$11 + 1~21 + 1~15 + 1~10 - 4~16 = - 2Gao 2
1~i8 + 1~22 + 1•16 + 1~11 - 4~17 = - 2Geo - 2
2+17 + 1~23 + 1$12 - 4+18 = -2Gao
43

Grid point ·Equation
19
20
21
22
23
24
25
26
27
28
29
30
31
32
33
34
35
36
37
38
39
40
41
44
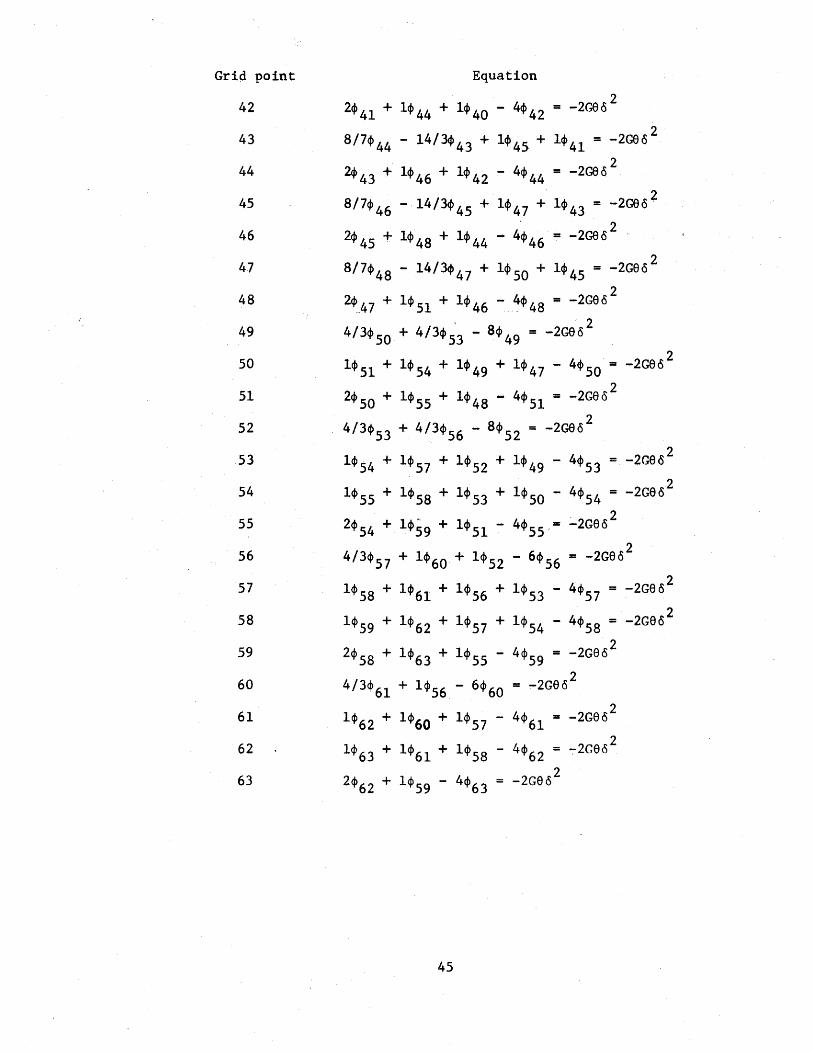
Grid point Equation
42
43
44
45
46
47
48
49
50
51
52
53
54
55
56
57
58
59
60
61
62
63
45
This system of equations can be expressed in· matrix notation a.s.:
or
(K] {4>} = {-2G8}
{~} = [K] -l {-2G8}
In order to solve this eq.uation one must invert the coefficient matrix,
[K], and multiply that inverse by the column matrix, {-2G8}. For these
operations, a comnuter program is used. The resulting values of 4> are
tabulated in table A3.
46
~ -...J
1
2
3
4
5
6
7
8
9
10
11
12
13
14
15
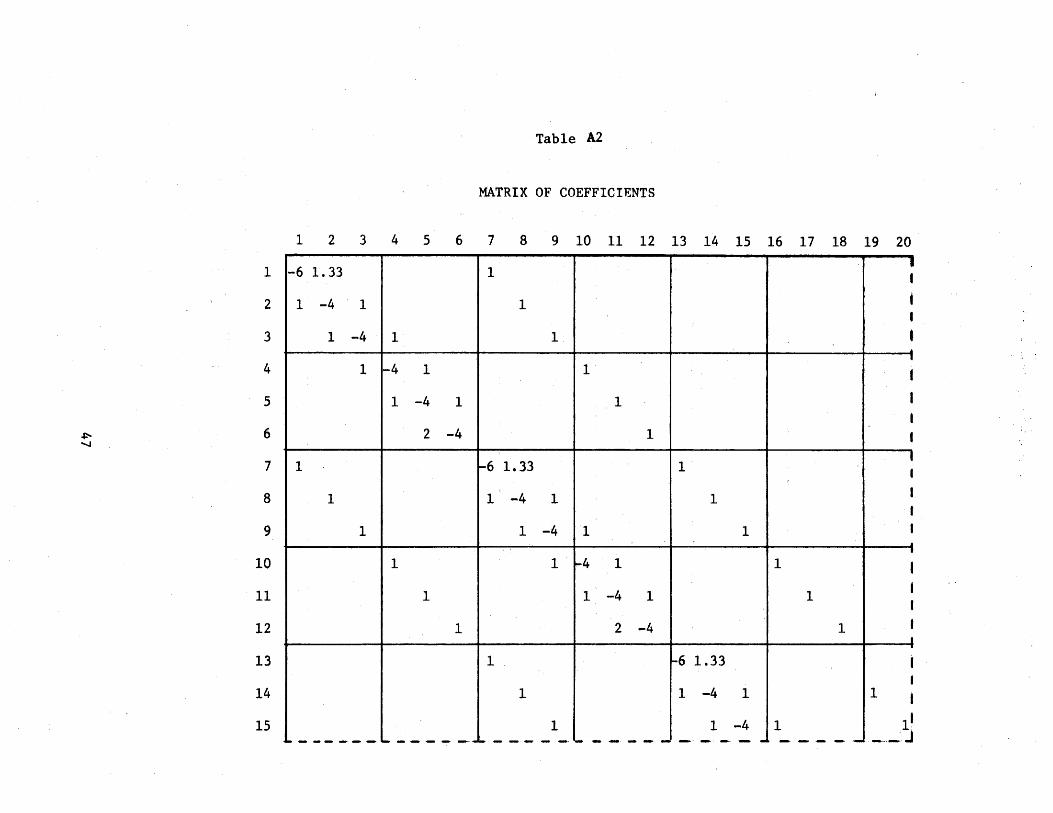
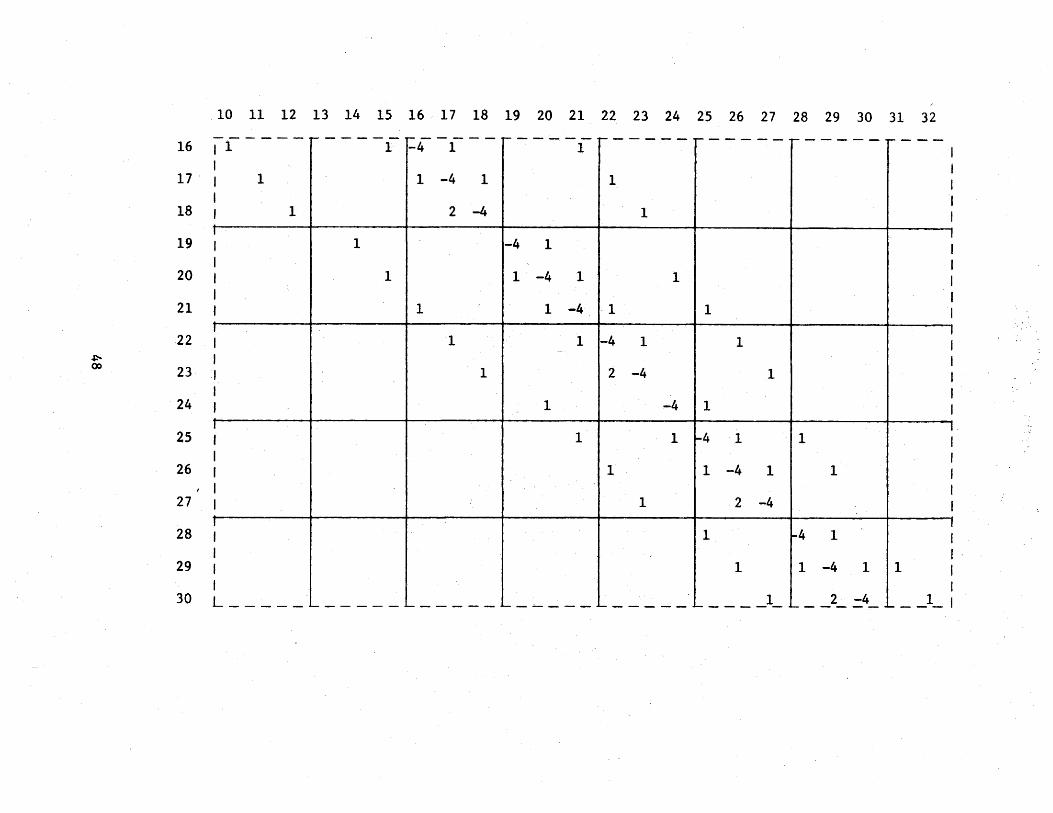
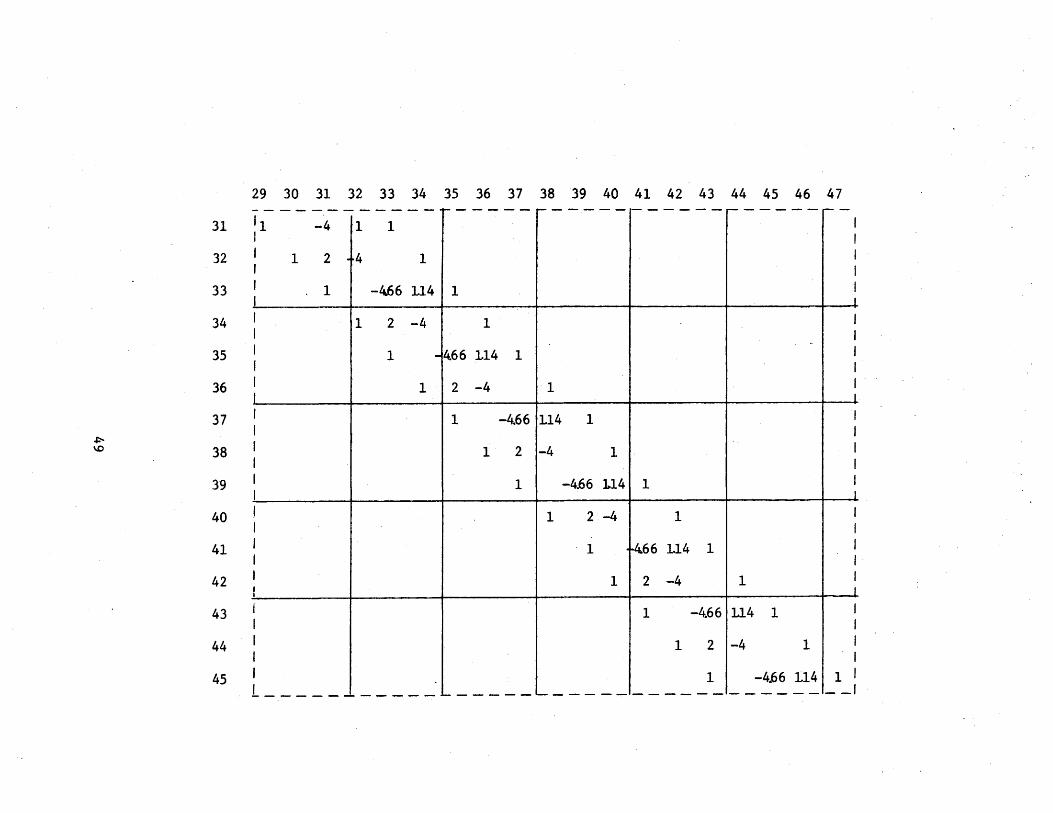
Table A2
MATRIX OF COEFFICIENTS
1 2 3 4 5 6 7 8 9 10 11 12 13 14 15 16 17 18 19 20
-6 1.33 1 l I
1 -4 1 1 I I
1 -4 1 1. ' ~
1 -4 1 1 t
1 -4 1 1 I t
2 -4 1 I
1 ~6 1.33 1 1 I
1 1 -4 1 1 I I
1 1 -4 1 1 I . ~
1 1 t-4 1 1 I
1 1 -4 1 1 t I
1 2 -4 1 I I .
1 ~6 1.33 i I
1 1 -4 1 1 I
1 1 -4 1 11 .. - -- -- - ._ - - - - ___ ...... - --- - -- - - -- - - - -- -· - - - - -- - -- - ___ _:_ . .J
10 11 12 13 14 15 16 ' 17 18 19 20 21 22 23 24 25 26 27 28 29 30 31 32
16 ------ r------r------ r------ r------r-------r------~---I 1 1 -4 1 1 I
17' I I I 1 1 -4 1 1 I
18 I I I 1 2 -4 1 I I . I
19 I 1 -4 1 I
20 I I I 1 1 -4 1 1 I
21 I I t 1 1 -4 1 1 I I I
22 I 1 1 -4 1 1 I ~ 00 23
I I I 1 2 -4 1 I I I
24 I 1 -4 1 I I I
25 I 1 1 t-4 1 1 I I I
26 I 1 1 -4 1 1 I I I
27 I 1 2 -4 I I I
28 I 1 ~4 1 I I I
29 I 1 1 -4 1 1 I I I
30 L _____ -..._ _____ ..._ _______ ..._ ___ ~ _____ · _____ 1 ____ 2_ -4 ____ 1_ 1
::-\0
31
32
33
34
35
36
37
38
39
40
41
42
43
44
45
29 30 31 32 33 34 35 36 37 38 39 40 41 42 43 44 45 46 47 ------------~-----------------~-----~-11 -4 1 1 l I I I 1 2 4 1 I I I I 1 -4.66 L14 1 I I I
I 1 2 -4 1 I I I I 1 -4.66 L14 1 - I I I I 1 2 -4 1 I I I
I 1 -4.66 114 1 I I I I 1 2 -4 1 I I I I 1 -4.66 1.14 1 I I I
I 1 2 ~ 1 I I I I 1 4.66 L14 1 I I I I 1 2 -4 1 I I I
I 1 -466 L14 1 I I • I
I 1 2 -4 1 I I I I . 1 -4/J6 114 1 I L-----------~-----~-------------------1

44 45 46 47 48 49 50 51 52 53 54 55 56 57 58 59 60 61 62 63 ,.------------~----------r-~---~-----~----
46 I 1 2 -4 1 I
47 I 1 -4.66 1.14 1 I
48 I 1 2 -4 1 l
49 I -8 33 l33 I
50 I 1 1 -4 1 1 I
51 I 1 2 -4 1 I
52 I -8 ~33 133 I
53 I 1 -4 1 1 IJl 0 I
54 I 1 1 -4 1 1 I
55 I 1 2 -4 1 I
56 I 1 -6 133 1 I
57 I 1 '1 -4 1 1 I
58 I 1 1 -4 1 1 I
59 I 1 2 -4 1 I
60 I 1 -6 133 I
61 I 1 1 -4 1 I
62 I 1 1 -4 1 I
63 I 1 2 -4 I

VI t-'
"!'
Table A3 VALUES FOR <f> AT THE VARIOUS GRID P~INTS IN A THD TYPE C PRESTRESSED CONCRETE GIRDER
Grid Value Grid Value Grid Value Grid Value Point of 4> Point of 4> Point of 4> Point of 4>
1* 4.97GG 17 . 36.33 33 11.35 49 5.66 2 11.16 18 37.68 34 16.61 50 15.51 3 15.01 19 12.00 35 9.50 51 18.88 4 17.47 20 22.76 36 14.18 52 4.02 5 18.87 21 31.18 37 8.79 53 12.43 6 19.34 22 36.59 38 13.12 54 18.68 7 6.92 23 38.45 39 8.54 55 20.90 8 16.68 24 13.94 40 12.72 56 5.70 9 23.40 25 25.00 41 8.51 57 13.36
10 27.98 26 32.39 42 12.68 58 17.86 11 30.70 27 34.96 43 8.70 59 19.37 12 31.60 28 14.50 44 12.96 60 4.38 13 6.32 29 24.99 45 9.28 61 9.45 14 17.23 30 28.62 46 13.78 62 12.04 15 25.94 31 16.47 47 10.84 63 12.87 16 32.36 32 21.54 48 15.59
*See Figure Al for grid point locations. Values of q, are symmetric about the vertical centerline of the cross-section.
\.11 N
~ ~
'
40
~0
201
10
II
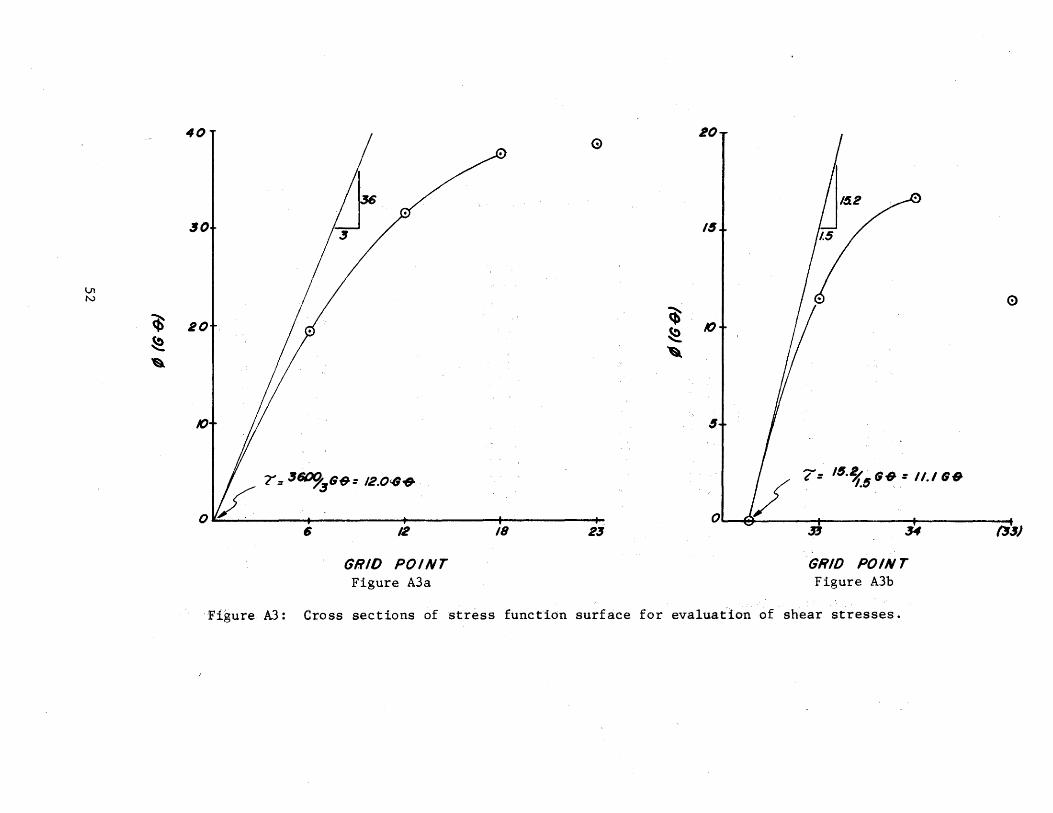
r = -'~_,se = t2.0r.flof!J
6 12
GRID POINT Figure A3a
0
~ ~
"
18 2~
20
1$
I I ~ 0
10
$
7= 1$.~5 G-9 = II. I S-9
0~~------+---------~--------~ s 34
GRID POINT Figure A3b
(3))
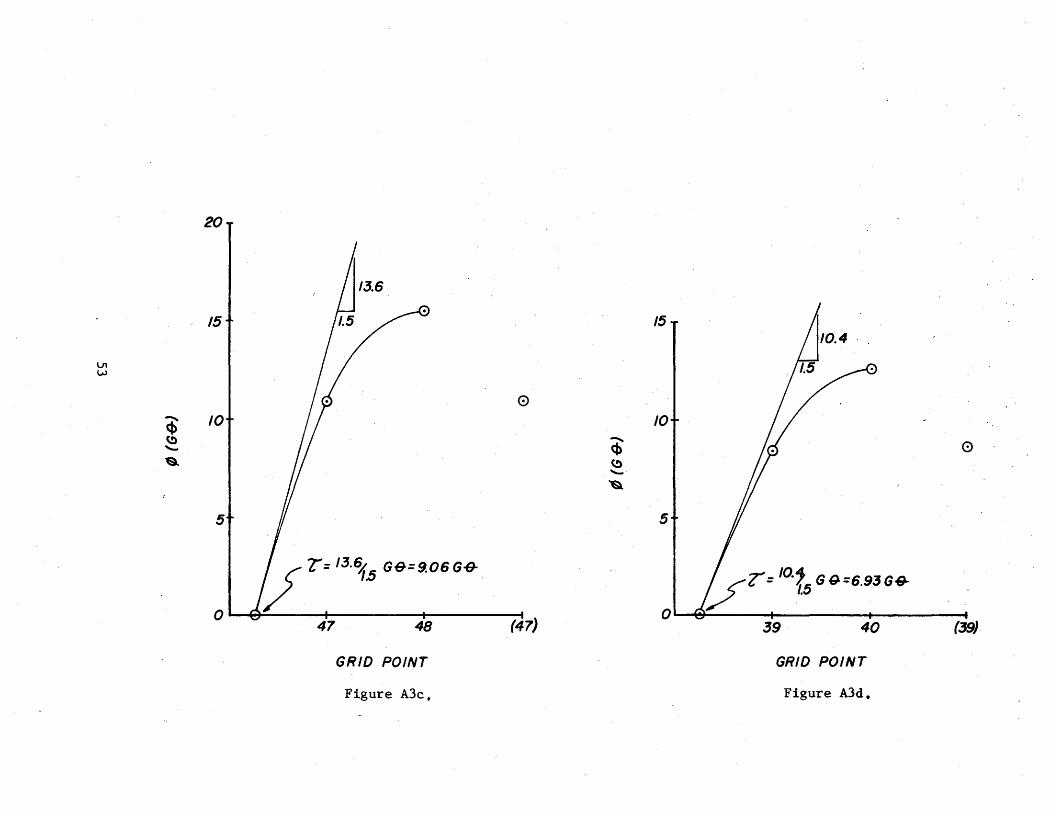
Figure A3: Cross sections of stress function surface for evaluat-ion of shear stresses.
20
15+ /1.5 ~ - IS
V1 w
0
~ /0 10 ~ (j) I /r;{ 0 '-'Q. ~
'-" 'Q.
St II 5
o ~n 47 48 0--~----~--------~------~
39 (39). 40
GRID POINT GRID POINT
Figure A3c, Figure A3d.

At any given point on the cross section, the torsional shear stress in
any direction is equal to the slooe of the ~ surface in a perpendicular
d$ = di.rection, i.e. (lx T y
and .ll ay T • X
ValueR of shear stress on the surface
can be obtained by plotting the cross section of the ~ surface along a grid
line that is perpendicular to the surface at the point of interest and
graphically measuring its slope of the edge of the cross section of the
beam. Values of shearing stress obtained in this manner are listed in
Figure Al.
54

The magnitude of the torque tr~nsmitted is equal to twice the volume
under the $ surface, i.e.
T = 2 f$dxdy area of x-sect.
This integral can best be evaluated using numerical techniques since no
equation describing the $ surface has been written and woul~ be difficult
if not impossible to obtain. Since the torque, T, is also equal to KGS,
K can be evaluated as follows:
= 2 f*~~gy K GS
or 2 (vol. under p) K::: GS
Evaluation off$dxdy using Simpson's rule yields the volume under the area
3 . 4 surface to be 7308 GS in •. and K is found to be 14,600 in ••
55


APPENDIX B
56

APPENDIX B
Calculation of Stresses Induced During Construction
The following is a method of approach for calculating the stresses
induced by cantilevered forms and other torque-producing loads during
construction.
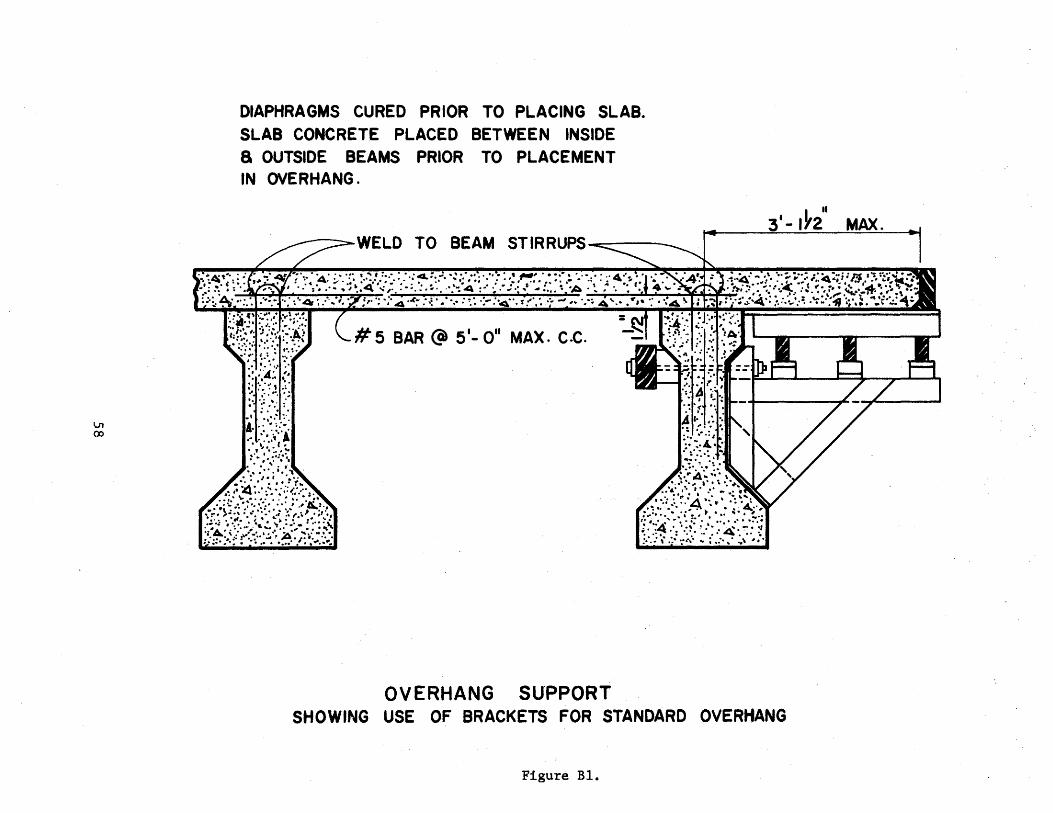
A typical type of form for the overhanging deck is illustrated in
Figure Bl. The loads due to the forms, plastic deck, and any other
torque-producing loads can be represented a~ in figures B2 and B3.
57
IJ1 (X)
DIAPHRAGMS CURED PRIOR TO PLACING SLAB. SLAB CONCRETE PLACED BETWEEN INSIDE 8 OUTSIDE BEAMS PRIOR TO PLACEMENT IN OVERHANG.
BEAM
#5 BAR@ 5 1- o•• MAX. c.c.
OVERHANG SUPPORT SHOWING USE OF BRACKETS FOR STANDARD OVERHANG
Figure Bl.
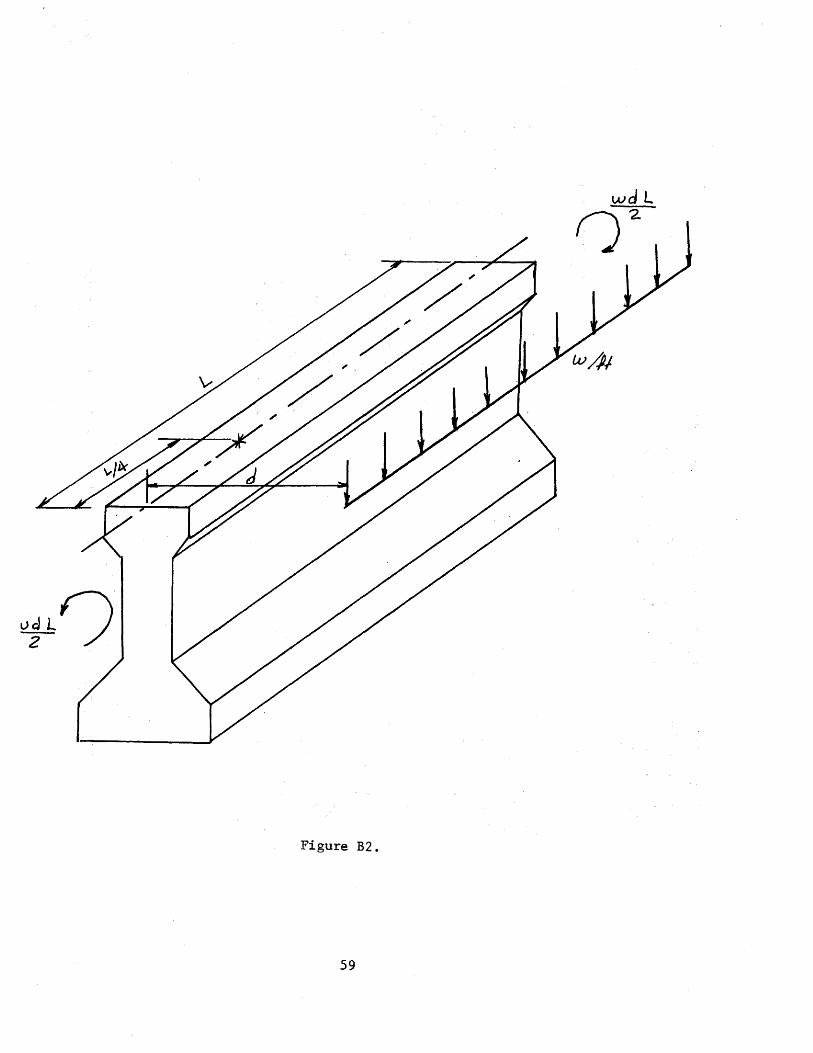
Figure B2 •
59

!
"' Cent·er Of gravity of ~4r---------d~(_i_n~)----------~~ forms, plastic deck, etc.
w (lb/ft) from over-hanging slab, forms, etc.
THO Type B beam
w - weight of overhanging parts in pounds per linear foot of beam
d - distance in inches from center line of beam to center of gravity of load, w.
Figure B3: Cross-section of beam and torque producing load.
60
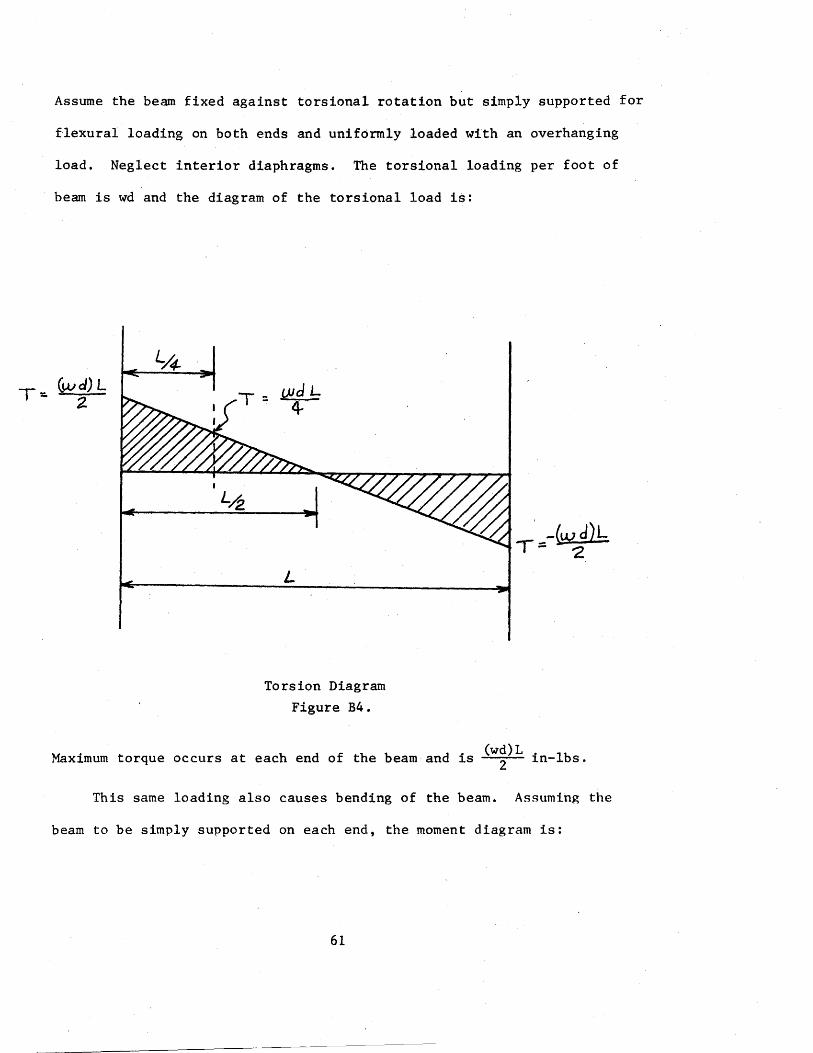
Assume the beam fixed against torsional rotation but simply supported for
flexural loading on both ends and uniformly loaded with an overhanging
load. Neglect interior diaphragms. The torsional loading per foot of
beam is wd and the diagram of the torsional load is:
T - (wd)L - 2.
__ l)Jd L
-r
L
Torsion Diagram
Figure B4.
·_-{wd)L T- '2
Maximum torque occurs at each end of the beam and is (w~)L in-lbs.
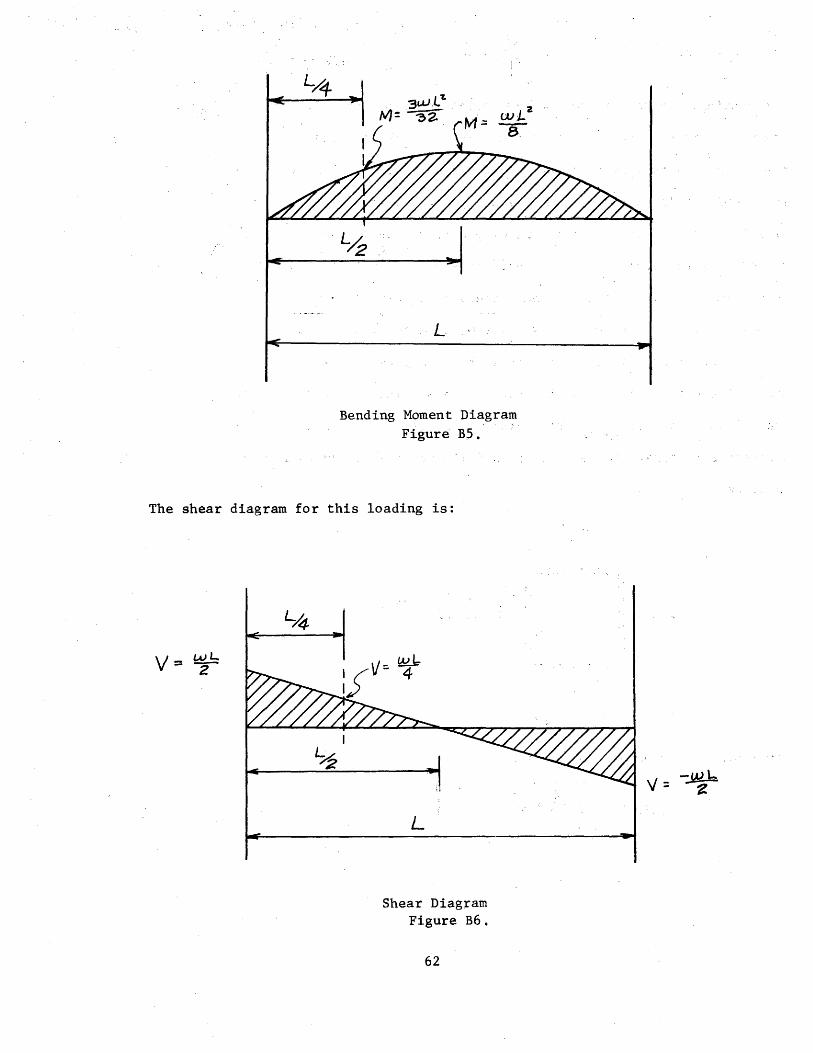
This same loading also causes bending of the beam. Assuming the
beam to be simply supported on each end, the moment diagram is:
61
L
. 2 wL a-
Bending Moment Diagram Figure B,S.
The shear diagram for this loading is:
V wL=z-
~
V {&1. :s ~ 4
I
L
Shear Diagram Figure B6.
62
v = -~1-

The particular cross section and the point_on that cross section
that is most critical can not be located directly. The stresses at
a number of points must be calculated to determine. the location of
the point which will experience the highest principal tensile
stresses for a given set of conditions of prestress, deal load,
torque and flexural loadings. For the purpose of this illustration,
a single point will be chosen and the procedure for determining
the principal tensile stress at.this point will be outlined. The point
chosen is in the middle of the top flange at a distance of L/4 from
the end of the beam. The flexural stress at this point is fb' the prestress
plus dead load stress is f p+dl, the torsional stress is T, and the
flexural shear is zero. These stresses are illustrated on the following
stress block.
ay=O
t T -======:....
Figure B7.
The principal tensile stress is given by:
63
APPENDIX C
64
APPENDIX C
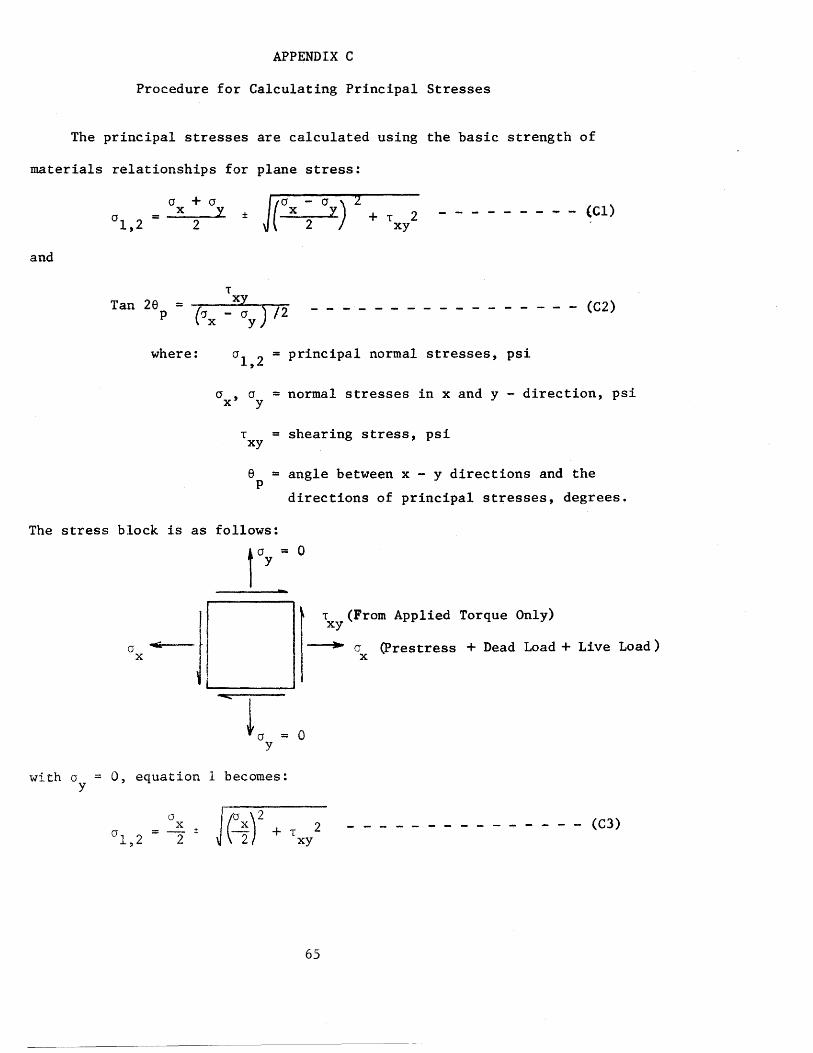
Procedure for Calculating Principal Stresses
The principal stresses are calculated using the basic strength of
materials relationships for plane stress:
and
a + a X y
2
T
+ T 2 xy (Cl)
Tan 26 = ( xy ) /Z _ - - _ - - - - - - - - - - - - - (C2) P !Jx - cry .
where: 0 1 2 = principal normal stresses, psi '
a x' a = normal stresses in x and y - direction, psi y
T = shearing stress, psi xy
e = angle between x - y directions and the p
directions of principal stresses, degrees.
The stress block is as follows: ry = 0
I 0x~ ...c--J
with a 0, equation y
a X
± 0 1 2 2 '
....._ ____ ~ L =
y
1 becomes:
J(~r + T
0
T (From Applied Torque Only) xy
~ c (Prestress + Dead Load + Live Load) X
2 - - - - - - - - - - - - - - - (C3) xy
65
-1869
-1824
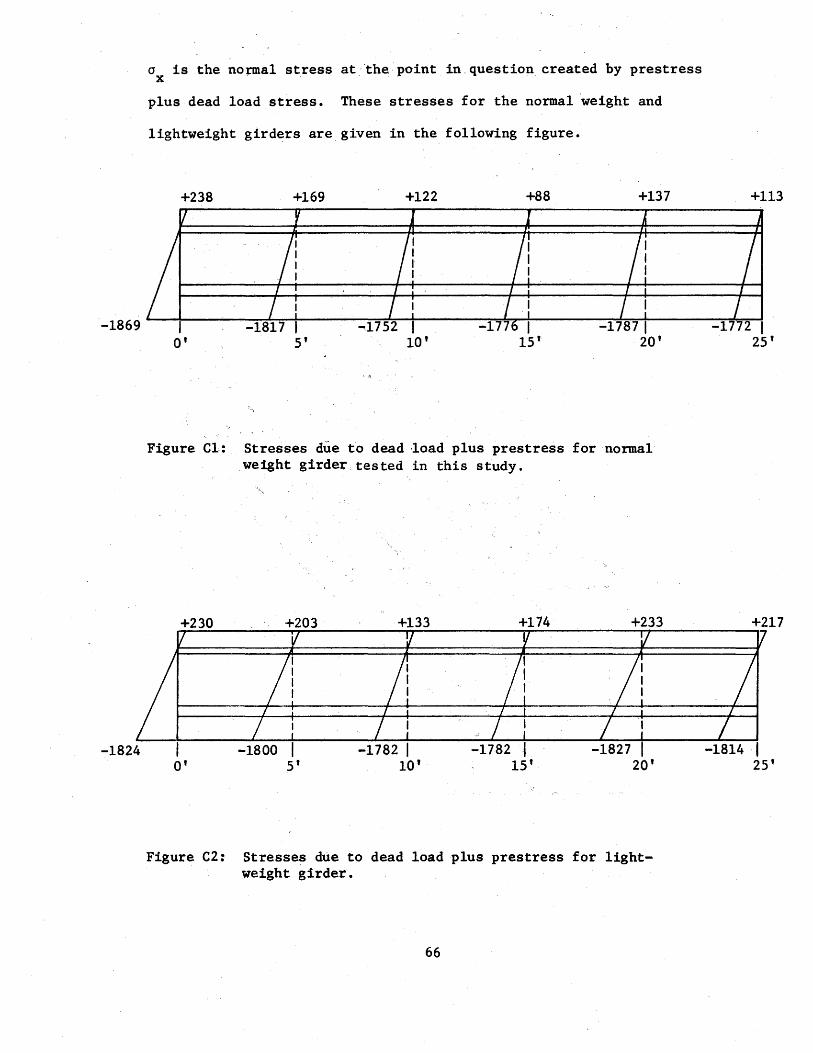
a is the normal stress at ·the.-· point in. question created by prestress X
plus dead load stress. These stresses for the normal ·weight and
lightweight girders are given in the following figure.
+238 +169 +122 +88 +137
Figure Cl: Stresses due to dead load plus prestress for normal weight girdertested in this study.
-1800 O'
-1782 I 10'
-1827 I 20'
Figure C2: Stresses due to dead load plus prestress for lightweight girder.
66
+113
-1a14 I 25'

The states of stress at selected· points on the girder are
calculated as follows:
Figure C3.
67
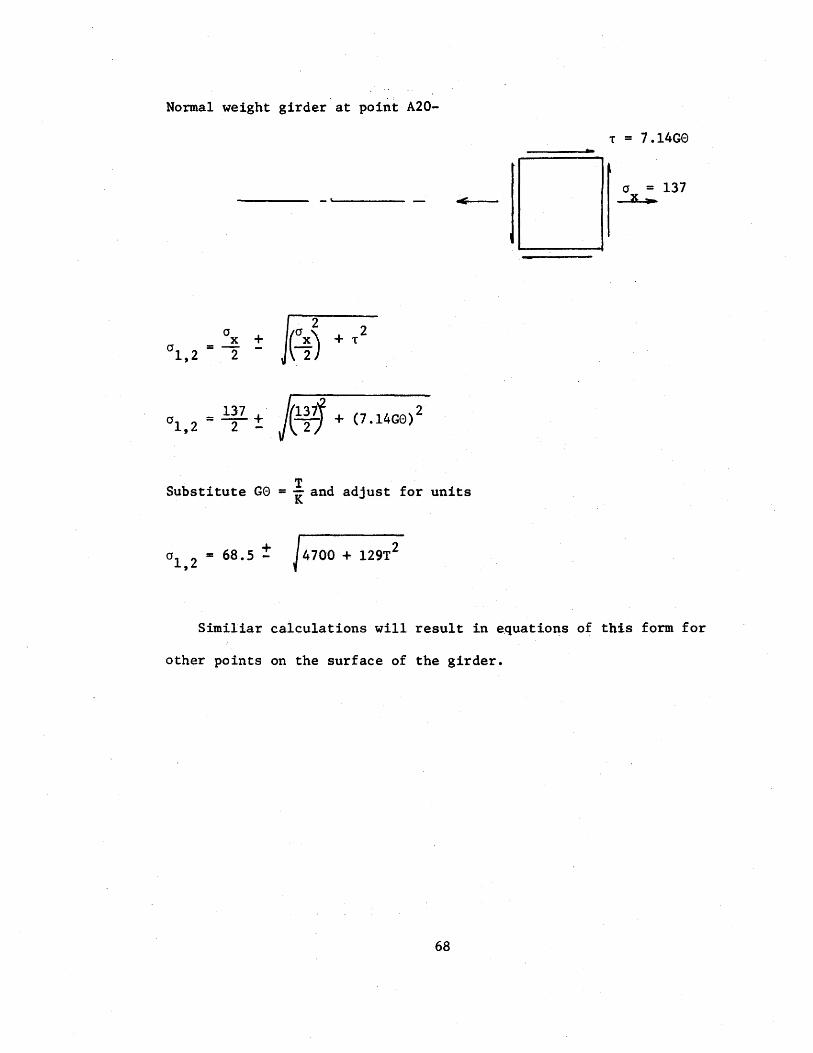
Normal weight girder.at point A20-
137 0 1 2 = -2- ±
'
2
((f~)
(:~~ + (7.14G0)2
T Substitute G0 = K and adjust for units
+ = 68.5
T = 7.14G0
0 = 137 --X....,..
Similiar calculations will result in equations of this form for
other points on the surface of the girder.
68