TORSIONAL PERFORMANCE OF WIND TURBINE BLADES – PART I ... · 2.1.2 Flapwise bending with torsion...
10
16 TH INTERNATIONAL CONFERENCE ON COMPOSITE MATERIALS 1 Abstract The complete 3D static responses of two different eight meter long wind turbine blade sections were tested. To experimentally investigate the 3D response, an advanced 3D digital optical deformation measuring system (ARAMIS 2M and 4M) was applied in this work. This system measures the full-field displacements (u x , u y and u z ) of the blade surface. A least squares algorithm was developed, which fits a plane through each deformed cross section, and defines a single set of displacements and rotations (three displacements and rotations) per cross section. This least squares algorithm was also used to accommodate problems with a flexible boundary condition by determining the displacements and rotations for a cross section near the boundary. These displacements and rotations are subtracted from all other cross sections along the blade and thereby making the blade section fully fixed at the chosen cross section near the boundary. 1 Introduction Modern wind turbine blades are constructed using a combination of different materials. Typically glass fiber reinforced plastic is used for most of the structure, with most of the fibers in the longitudinal direction to limit tip deflections. As wind turbines increase in size the torsional eigenfrequency becomes lower and the torsional mode may couple with some of the lower bending modes. This can lead to catastrophic collapse due to the flutter instability. For larger wind turbines it therefore becomes gradually more important to be able to make reliable prediction of the torsional behavior of the blade and to calculate any structural couplings that may exist, such as the bend-twist coupling. However, correct modeling of torsional stiffness and bend-twist couplings based on FEM is subjected to some uncertainties, when numerical results are compared with experimental modal analyses of blades. In [1] the response of a shell finite element (FE) model was compared with a number of measured modal modes and the correlation related to torsional response was limited, including the 1 st torsional mode and especially for the higher modes. To investigate these uncertainties regarding the torsional stiffness and the bend-twist couplings, a number of static tests applying different load cases have been performed on a section of a full- scale wind turbine blade provided by Vestas Wind Systems A/S. Fig. 1. A flapwise bending test performed on a wind turbine blade section. This blade section was furthermore modified by adding some additional angled UD layers on the suction and pressure side of the blade. These UD layers introduce measurable bend-twist couplings, which the original blade did not have. The primary aim of this experimental testing was to validate a FE-model design of the two blade sections (the original and modified). The TORSIONAL PERFORMANCE OF WIND TURBINE BLADES – PART I: EXPERIMENTAL INVESTIGATION Peter Berring*, Kim Branner*, Christian Berggreen** and Henrik W. Knudsen** *Wind Energy Department, Risø National Laboratory, Technical University of Denmark **Department of Mechanical Engineering, Technical University of Denmark Keywords: Experimental testing, wind turbine blade, torsion, 3D response A static flapwise bending test created by a point load applied in the center of the spar.
Transcript of TORSIONAL PERFORMANCE OF WIND TURBINE BLADES – PART I ... · 2.1.2 Flapwise bending with torsion...

16TH INTERNATIONAL CONFERENCE ON COMPOSITE MATERIALS
1
Abstract
The complete 3D static responses of two different eight meter long wind turbine blade sections were tested. To experimentally investigate the 3D response, an advanced 3D digital optical deformation measuring system (ARAMIS 2M and 4M) was applied in this work. This system measures the full-field displacements (ux, uy and uz) of the blade surface. A least squares algorithm was developed, which fits a plane through each deformed cross section, and defines a single set of displacements and rotations (three displacements and rotations) per cross section. This least squares algorithm was also used to accommodate problems with a flexible boundary condition by determining the displacements and rotations for a cross section near the boundary. These displacements and rotations are subtracted from all other cross sections along the blade and thereby making the blade section fully fixed at the chosen cross section near the boundary.
1 Introduction Modern wind turbine blades are constructed
using a combination of different materials. Typically glass fiber reinforced plastic is used for most of the structure, with most of the fibers in the longitudinal direction to limit tip deflections.
As wind turbines increase in size the torsional eigenfrequency becomes lower and the torsional mode may couple with some of the lower bending modes. This can lead to catastrophic collapse due to the flutter instability. For larger wind turbines it therefore becomes gradually more important to be able to make reliable prediction of the torsional behavior of the blade and to calculate any structural couplings that may exist, such as the bend-twist coupling. However, correct modeling of torsional stiffness and bend-twist couplings based on FEM is
subjected to some uncertainties, when numerical results are compared with experimental modal analyses of blades. In [1] the response of a shell finite element (FE) model was compared with a number of measured modal modes and the correlation related to torsional response was limited, including the 1st torsional mode and especially for the higher modes.
To investigate these uncertainties regarding the torsional stiffness and the bend-twist couplings, a number of static tests applying different load cases have been performed on a section of a full-scale wind turbine blade provided by Vestas Wind Systems A/S.
Fig. 1. A flapwise bending test performed on a
wind turbine blade section. This blade section was furthermore modified
by adding some additional angled UD layers on the suction and pressure side of the blade. These UD layers introduce measurable bend-twist couplings, which the original blade did not have.
The primary aim of this experimental testing was to validate a FE-model design of the two blade sections (the original and modified). The
TORSIONAL PERFORMANCE OF WIND TURBINE BLADES – PART I: EXPERIMENTAL INVESTIGATION
Peter Berring*, Kim Branner*, Christian Berggreen** and Henrik W. Knudsen**
*Wind Energy Department, Risø National Laboratory, Technical University of Denmark **Department of Mechanical Engineering, Technical University of Denmark
Keywords: Experimental testing, wind turbine blade, torsion, 3D response
A static flapwise bending test created by a point load applied in the center of the spar.

PETER BERRING, Kim Branner, Christian Berggreen and Henrik W. Knudsen
2
comparison of the experimental and numerical results is used to set up guidelines for modeling wind turbine blades, which can be used to carry out reliable determination of different stiffness parameters, including the bend-twist coupling.
This paper is based on the experimental work and the analysis tools developed in [2]. The comparison between the experimental and numerical results is presented in PART II of this paper [3].
2 The test setup A test rig was developed and used to apply
five different load configurations. These configurations are adopted to capture the complete 3D response of the blade section.
Fig. 2. The test rig.
The five load configurations are the following:
• Flapwise bending • Flapwise bending with torsion • Edgewise bending • Pure torsion • Locked torsion
The fixed end of the blade section is made up
of two clamps which are bolted to the steel columns of the test rig. The loads are applied at the tip end, where a movable clamp is mounted. Fig. 2 shows three hydraulic presses, but no more than two presses are used in any of the above mentioned load configurations. At the tip end a locking device is furthermore mounted which can be used to force
the movable clamp to be rotated about a given point.
To ensure a sufficient transfer of the loads from the movable clamp to the blade section, the trailing edge and the spar are stiffened as shown in Fig. 3. This strengthening of the cross section is especially important for the load configurations where the cross section is twisted, as the trailing part of blade is quite flexible/soft.
Fig. 3. Close-up picture of the tip end of the blade section, where the strengthening of cross section is
visible inside the spar and trailing edge. 2.1 The Five static test methods
For all five load configurations the blade is pre-bended/deformed which eliminates the effect of the mass of the movable clamp and the blade section. The measuring equipment is then tarred in the pre-bended/deformed condition. Furthermore, the blade section is only loaded in the linear-elastic regime.
In the above mentioned five load configurations only hydraulic presses equipped with spherical bearings in both ends were applied, thus reducing constraints introduced by the hydraulic presses. In the following, the five load configurations are described shortly.
2.1.1 Flapwise bending test At the tip end, a point load is applied at the
center of the spar. The center of gravity for the load clamp (movable clamp) is located at the center of the spar and the mass of the clamp will therefore not introduce at torsional moment.
The load configuration is uncomplicated to establish, since the point load is simple to introduce using a hydraulic press set-up. However, the shear force in the present load case may result in shear-extension couplings (though probably of limited size), due to the shear force.
The location of the shear center is not readily known, thus the shear-force will result in a torsional moment of an unknown magnitude (the torsional
Movable clamp
Locking device
Hydraulic press
Fixed clams
z x
y

3
TORSIONAL PERFORMANCE OF WIND TURBINE BLADES – PART I: EXPERIMENTAL INVESTIGATION
moment is equal to the shear force multiplied with the distance to the shear center).
Mx
x
y
z
Qy
F
F
T
Fig. 4. Flapwise bending set up.
2.1.2 Flapwise bending with torsion test This load configuration is a combination of
flapwise bending and torsion. The point load is applied at a distance of 0.695 m from the center of the spar, thus introducing both a bending and torsional moment.
The load configuration is again uncomplicated to establish, and the load case may likewise result in shear-extension couplings due to the shear force. Furthermore, again the location of the shear center is not known and therefore the exact magnitude of the applied torsional moment is not known.
Qy
T
Mx
F
F
z x
y
T
Fig. 5. Flapwise bending wit torsion set up.
2.1.2 Edgewise bending test In this load configuration the load is applied
horizontally at the center of the spar at the blade tip. Fig. 6 depicts three hydraulic presses, however only the horizontal press is active. The edgewise bending test is carried out by placing the press head in a special fixture which ensures a constant horizontal position during the deformation of the blade section.
The advantages and disadvantages of this load configuration are similar to the latter described above. However, additionally the test rig is not sufficiently rigid in the horizontal plan which may
result in complications with regards to the boundary conditions.
The sandwich panels in the trailing part of the blade are relative soft and reaction forces in the two fixing clamps can therefore become critical. Thus, to avoid crushing of the panels, the magnitude of the edgewise point load has to be relative small, resulting in relative limited edgewise displacement, which consequently may result in measuring uncertainties.
y
T
My
Qx
F
z xF
Fig. 6. Edgewise bending set up.
2.1.3 Pure torsion test The pure torsion test is performed by applying
two hydraulic presses creating a force couple. The two point loads are placed at a distance of 0.695 m from the center of the spar, thus resulting in a torsional moment.
This test configuration is in theory assumingly the most optimal method for determining the torsional stiffness and bend-twist couplings, due to the fact that this load configuration does not create a shear force. Furthermore, the measurement of the twist induced bending, generated by the bend-twist coupling, will be uncomplicated. However, the torsional moment is difficult to apply in practice, since the blade tip must be able to move freely, which is required in order to measure the induced bending deflections.
T
T
T
y
z x
Fig. 7. Pure torsion set up

PETER BERRING, Kim Branner, Christian Berggreen and Henrik W. Knudsen
4
2.1.4 Locked torsion test In the locked torsion test configuration the
clamp is locked in a given position which cannot move in the vertical plane. However, the clamp can rotate and translate in the horizontal plane, since the vertical steel bars, indicated in Fig. 8, are able to rotate in both ends. The movement in the horizontal plane is not entirely free since the movement is restricted to a circular arc. The point load is again applied at a distance of 0.695 m from the center of the spar, which results in a torsional moment.
Unlike the pure torsion configuration the present test configuration is uncomplicated to establish, since the blade tip is locked in a given position. Additionally, if the bend-twist couplings are of limited magnitude, the present approach is attractive in order to determine the torsional stiffness. On the other hand, if the flapwise bend-twist coupling is of a considerable magnitude, the blade tip will attempt to move in the vertical plan. However, the applied locking-system will restrict such a movement, resulting in an induced reaction force to be absorbed in the two steel bars, thus complicating the analysis.
T
T
T
z
y
x
Mx
Fig. 8. Locked torsion set up.
2.2 Experimental measuring method
An advanced 3D digital optical deformation measuring system (ARAMIS 2M and 4M) was applied in this work. The system records the surface of an object throughout the entire load history using two CCD cameras. The digital images are used to measure the full-field 3D displacements and surface strains of the object by digital image processing. As an aid for the digital image processing, a speckle pattern (typically black spray paint on a white background) has to be applied to the surface of the object. As the system measures a full-field displacements and surface strains, the system is highly suitable for validating FE calculations.
Since the surfaces of the blade section are of a considerable size, the random speckle pattern could not be created by simply spraying small dots of black paint on the surface using an aerosol can. A harsher pattern was needed, and the best result was obtained by applying dim black spots of a size around 6 x 6 mm on the surface using a specially designed tool, which can be seen in Fig. 9.
In order for the optical system to capture as much of the blade surface as possible, the two cameras had to be positioned pointing downwards on the blade surface. The arrangement can likewise be seen in Fig. 9.
Fig. 9. Measuring pattern on the blade surface and
the camera setup.
Fig.10. An undeformed (top) and deformed (bottom) measuring area obtained with the 3D
digital optical deformation measuring equipment.

5
TORSIONAL PERFORMANCE OF WIND TURBINE BLADES – PART I: EXPERIMENTAL INVESTIGATION
Furthermore, the cameras were not capable of spanning the entire 6 m cantilever blade part and the blade section was therefore divided into four measuring areas. One of these measuring areas is presented in Fig. 10.
The forces from the hydraulic presses were obtained from a digital signal from the hydraulic pump station, which was loaded into the deformation measuring system. The pressure/force signals and the deformation results for the four areas were then assembled to create a complete measuring area/surface of 6 m (the entity cantilever blade section). Each measuring area/surface was divided into 3-5 cross sections from which the displacements were obtained (see Fig.10).
For each load configuration, five image sets were generated per measuring area, where images set 1 corresponds to the undeformed area, and image set 2, 3, 4 and 5 corresponds respectively to the deformed area with 25%, 50%, 75% and 100% of the maximum load.
Each load configuration was performed three times to ensure data consistency.
3 Experimental determinations of deflections and rotations
A number of cross sections along the cantilever blade section were selected for data extraction. Each of these cross sections consists of a large number of measuring points, and in order to simplify the analysis of the measured data, a least squares algorithm was applied to determine a single set of displacements and rotations (three displacements and rotations) for each cross section. The least squares algorithm was likewise applied in the FE-analysis. The procedure effectively simplifies the comparison of experimental and numerical results, as only a single set of displacements and rotations per cross section can be compared.
The least squares algorithm consists of the following three steps:
• Computation of displacements (ux, uy and uz) • Computation of twist angle (rz) • Computation of bending slopes (rx and ry)
3.1 Cross sectional displacements (ux, uy and uz)
The three displacements were calculated as average values, meaning that all the relative nodal/point displacements are summed up and
divided by the number of nodes/points. (∆x, ∆y and ∆z = relative displacements). This is illustrated in Eq. 1.
n
zu
n
yu
n
xu
n
ii
z
n
ii
y
n
ii
x
∑∑∑===
∆=
∆=
∆= 111 ,,
(1)
3.2 Angle of twist (rz)
The cross sectional rotation about the z-axis (twist-angle (rz)) is determined by fitting a linear least squares regressions curve through the deformed x-coordinates and the relative displacements in the y-direction (dy = ydeformed – yundeformed). The slope of the curve is then equal to the twist-angle. The curve is given as:
cxrxy z +⋅=)( (2)
The line is fitted by determining the rz and c
values which minimize the squared residuals (vertical distance between the points and the line).
The theory of linear least squares regression is shown in Eq. 3 (note that dy is equal to the relative displacement in the y-direction):
⎟⎟⎟⎟⎟
⎠
⎞
⎜⎜⎜⎜⎜
⎝
⎛
⎟⎟⎠
⎞⎜⎜⎝
⎛
⎥⎥⎥⎥⎥
⎦
⎤
⎢⎢⎢⎢⎢
⎣
⎡
⋅⋅−⋅==
ndy
dy
dy
TPPTPzr
c
nx
x
x
P..
2
1
1)(,
1
..1
21
11
(3)
Fig.11. The twist angle: Plot of an undeformed and deformed cross section, a vector consisting of the relative displacements in the y-direction and the
deformed x-coordinates and the least squares regressions curve.
PETER BERRING, Kim Branner, Christian Berggreen and Henrik W. Knudsen
6
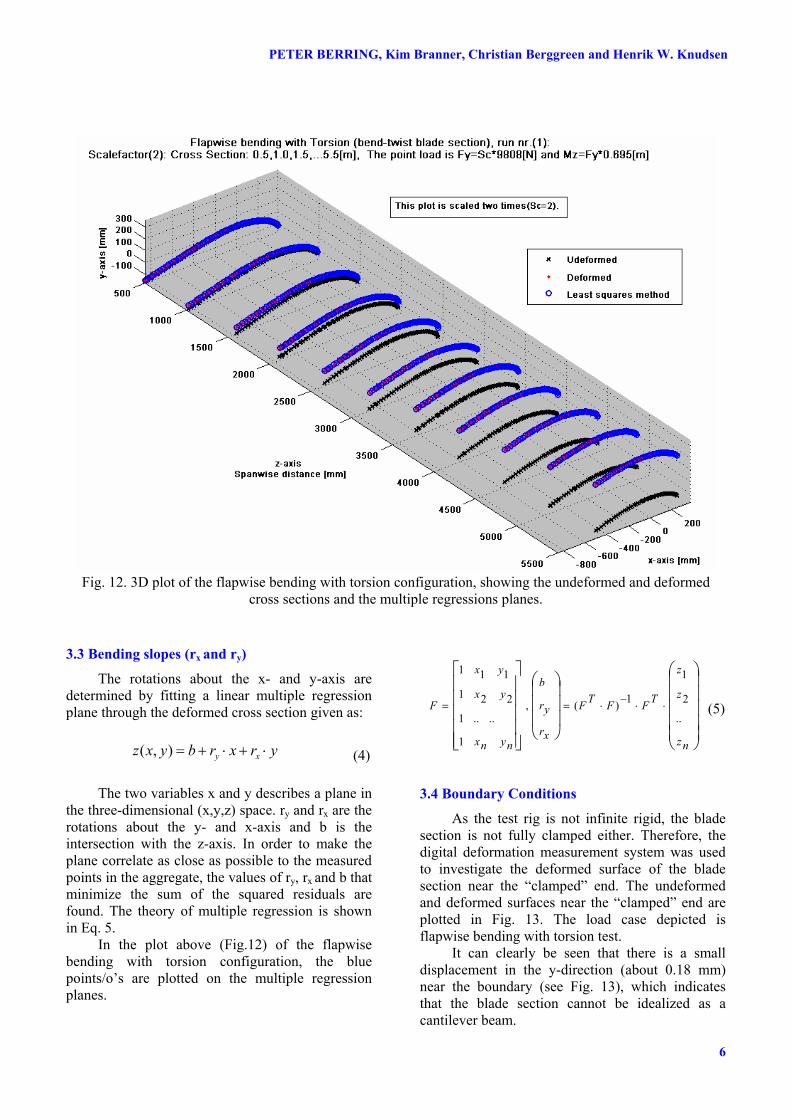
Fig. 12. 3D plot of the flapwise bending with torsion configuration, showing the undeformed and deformed
cross sections and the multiple regressions planes.
3.3 Bending slopes (rx and ry)
The rotations about the x- and y-axis are determined by fitting a linear multiple regression plane through the deformed cross section given as:
yrxrbyxz xy ⋅+⋅+=),( (4)
The two variables x and y describes a plane in
the three-dimensional (x,y,z) space. ry and rx are the rotations about the y- and x-axis and b is the intersection with the z-axis. In order to make the plane correlate as close as possible to the measured points in the aggregate, the values of ry, rx and b that minimize the sum of the squared residuals are found. The theory of multiple regression is shown in Eq. 5.
In the plot above (Fig.12) of the flapwise bending with torsion configuration, the blue points/o’s are plotted on the multiple regression planes.
⎟⎟⎟⎟⎟
⎠
⎞
⎜⎜⎜⎜⎜
⎝
⎛
⎟⎟⎟
⎠
⎞
⎜⎜⎜
⎝
⎛
⎥⎥⎥⎥⎥
⎦
⎤
⎢⎢⎢⎢⎢
⎣
⎡
⋅⋅−⋅==
nz
z
z
TFFTF
xr
yr
b
nynx
yx
yx
F..
2
1
1)(,
1
....1
221
111
(5)
3.4 Boundary Conditions
As the test rig is not infinite rigid, the blade section is not fully clamped either. Therefore, the digital deformation measurement system was used to investigate the deformed surface of the blade section near the “clamped” end. The undeformed and deformed surfaces near the “clamped” end are plotted in Fig. 13. The load case depicted is flapwise bending with torsion test.
It can clearly be seen that there is a small displacement in the y-direction (about 0.18 mm) near the boundary (see Fig. 13), which indicates that the blade section cannot be idealized as a cantilever beam.

7
TORSIONAL PERFORMANCE OF WIND TURBINE BLADES – PART I: EXPERIMENTAL INVESTIGATION
Fig.13. Investigation of the boundary condition: An Undeformed surface (top) and a deformed surface showing the displacements in the y-direction (bottom), measured with the digital deformation measurement system.
The experimental and numerical results can only be compared if the experimental and numerical boundary conditions are the same. The problem with the boundary conditions can be solved applying one of following procedures:
• The actual measured boundary conditions of the
test rig can be reused in the numerical model by measuring the deflections of the clamps throughout the test. A similar approach was chosen in [4].
• The two clamps can be included in the FE-
model, in order to get a realistic structural behavior of the clamps. In detail the plywood plates and steel profiles should be included and contact elements should be applied to model the contact between the clamps and the blade section.
• Finally, the problems with the flexible
boundary conditions can be accommodated by determining the displacements and rotations for a cross section near the boundary via the least squares algorithm. These displacements and rotations are then subtracted from all other
cross sections along the blade and thereby making the blade section fully fixed in the chosen cross section near the boundary.
The last method was chosen, since it is the
simplest and assumingly also the most precise method. The method furthermore involves only uncomplicating FE-modeling, since idealized fixed boundary conditions, where all nodal displacements and rotations are restricted, can be applied. Furthermore, the chosen method is flexible, because an arbitrary location of the fixed end can be selected from the measured cross sections along the blade section. However, for all load cases presented, the cross section at 0.5 m from the clamp was chosen, since the displacements and rotations at this distance from the boundary were well defined.
When the blade section is subjected to torsion the cross section does not remain plane unless restrained to do so. This out-of-plane displacement is known as warping, and the restraints to these deformations, such as a fully fixed end will result in an increasing torsional stiffness. By moving the fixed end 0.5 m, the boundary effect is minimized and the validity of comparison between experimental and numerical results increased.
The modified cross sectional deflections and rotations are determined according to Eq. 6, where Le is the length of the beam elements (distance between the cross sections) and rx,y,z 1 and ux,y,z 1 the rotations and displacements at the new fixed end (cross section 0.5 m).
1,1,1
1,111
111
)(......1
zrzirziryryiryirxrxirxir
zuziuziui
i ieLxryuyiuyiu
i
i ieLyrxuxiuxiu
eLrowsi
−=−=−=
−=∑=
⋅+−=
∑=
⋅−−=
=
(6)
The effect of moving the fixed boundary
condition to a cross section 0.5 m from the geometrically fixed end can be seen in Fig. 14, where the modified blade section is subjected to the flapwise bending test with torsion. Note that the last half meter of the cantilever blade section is not considered, and the displacements and rotations are calculated as average values of the three runs.

PETER BERRING, Kim Branner, Christian Berggreen and Henrik W. Knudsen
8
The reason for not considering the last half meter is that this part of the blade section is affected by the load boundary conditions.
Fig.14. Effect of moving the fixed end 0.5 m.
As illustrated in Fig. 14 the effect of moving
the fixed boundary condition is of great importance for the deflection in the y-direction. 4 Experimental results
In the present paper only a limited part of the experimental results are presented in detail. However, the remaining results of the different test configurations will be illustrated in part II of this paper [2], where the numerical and experimental results are compared. Eleven cross sections along the cantilever blade part were selected and for each of these cross sections a single set of displacements and rotations were determined via the least squares algorithm. 4.1 Experimental results for the original blade section
As mentioned earlier, one of the primary aims of this work is to determine if the original blade section has a bend-twist coupling or not. This is achieved by analyzing the experimental results from the flapwise bending and the flapwise bending test with torsion and applying the principle of superposition.
4.1.1 Experimental results of the flapwise bending test for the original blade section.
The flapwise bending was performed with a point load of 3923 N placed 5.607 m from the cross section at 0.5 m. This results in a bending moment and a shear force distribution as described earlier.
Each load case was performed 3 times (indicated as run 1, 2 and 3) to ensure data consistency.
Fig. 15. Flapwise bending.
The results from the three runs are reasonable
consistent, as one can see in Fig. 15 for the displacements and rotations. The test exclusively results in nearly pure displacements in the y-direction and a rotation about the x-axis (bending slope).
As mentioned earlier, the location of the shear center is not readily known, which means that the shear force placed in the center of the spar can result in a small torsional moment. If it is assumed that the shear center is placed in the middle of the spar, then the flapwise bending configuration indicates that the bend-twist coupling is equal or close to zero, since the bending moment do not result in a twist angle (rotation about the z-axis) of the blade section.
4.1.2 Bend-twist coupling for the original blade section
By applying the principle of superposition, it is determined if the blade section has a measurable bend-twist coupling, by subtracting the results of the flapwise bending configuration from the results of the flapwise bending with torsion configuration and the result of that is pure torsion. If a bend-twist coupling exists, then the blade will twist but also bend, because of the bend-twist coupling (twist induced bending).

9
TORSIONAL PERFORMANCE OF WIND TURBINE BLADES – PART I: EXPERIMENTAL INVESTIGATION
The response of the blade must be linear in order for the principle of superposition to be valid. It was therefore investigated whether the response of the two load configurations were indeed linear by investigating the load-displacement relation. The result of both load configurations showed that the response were indeed linear.
Fig. 16. Result of superposition for the
original blade section. In Fig. 16 it can see that the section is twisting
but not bending, which indicates that the bend-twist coupling is close to zero. This was also expected as most of fibers are placed in the longitudinal direction and only a very limited amount of fibers are placed off-axis, which are necessary to create a bend-twist coupling.
4.2 Experimental results for the modified blade section
One of the primary aims of this work was to create a FE-model capable of modeling correct bend-twist coupled behavior. The FE- response was validated by experimental static testing. The original blade section was modified with four layers of UD1200, which were laminated on the pressure and suction side of the blade to create a measurable flapwise bend-twist coupling. The additional layers were laminated as indicated in Fig. 17.
The extra layers were laminated onto the blade section by a vacuum infusion process. Furthermore, the area between the two clamps was not laminated with extra UD-layers, since only the behavior of the cantilever part of the blade section is of interest in this study. The optimal fiber angle of 25° was determined by trial and error using FEM.
4x UD1200, fibre angle = 25°
Trailing edge
Leading edge
Suction side
25°
Fig. 17. Fiber orientation of the extra UD material
4.2.1 Experimental results of the flapwise bending test for modified blade section.
The flapwise bending was performed with a point load of 9808 N placed 5.607 m from the cross section at 0.5 m.
Fig. 18. Flapwise bending (modified blade
section). The data for the three runs are consistent, as
one can see from the displacements and rotations in Fig. 18. The interesting part of the plot in Fig. 18 is the subplot of the rotation about the z-axis. The z-rotation was almost equal to zero for the original blade section, however, the z-rotation for the modified blade section indicates that the section now has a measurable bend-twist coupling.

PETER BERRING, Kim Branner, Christian Berggreen and Henrik W. Knudsen
10
4.2.1 Bend-twist coupling for the modified blade section
The principle of superposition is again applied in order to determine if the blade section has a measurable bend-twist coupling.
Fig. 19. Result of superposition for the
modified blade section. If it is assumed that the shear center is located
in the center of the spar, it can now be concluded from the result of the superposition analysis that the pure torsional moment induces bending of the blade section. It can therefore be concluded that the bend-twist coupling is of a measurable size. The twist-induced bending is of the magnitude of 5 mm and the twist-induced bending slope (rotation about the x-axis) is about -0.003 rad at the tip end (illustrated in Fig. 19).
5 Conclusion
It can be concluded that the least squares algorithm developed and applied in this work was a strong tool when the experimental results were analyzed. Furthermore, it can be concluded that problems with the flexible boundary conditions were accommodated by determining the displacements and rotations for a cross section near the boundary (the cross section at 0.5 m) via the least squares algorithm. These displacements and rotations were subtracted from all other cross sections along the blade and thereby making the blade section fully fixed at the chosen cross section near the boundary.
The least squares algorithm can also be applied in the FE-analysis, which simplifies the comparison between the experimental and
numerical results as only a single set of displacements and rotations has to be compared per cross section.
It is found that the original blade section did not have a measurable bend-twist coupling. As one of the primary aims of this work was to develop a FE-model capable of modeling correct bend-twist coupling behavior, the original blade section was modified. Thus, four UD layers were laminated on the pressure and suction side of the blade section to establish a measurable flapwise bend-twist coupling.
By applying the principle of superposition it was found that this modification of the blade section induced a measurable bend-twist coupling which can be exploited in the validation process of the numerical models.
6 Acknowledgements
Vestas Wind Systems A/S has provided and modified the blade sections presented in this study. The support is gratefully acknowledged and highly appreciated.
References [1] Larsen G.C. “Modal analysis of wind turbine
blades”. Risø-R-1181(EN), Risø National Laboratory, Roskilde, Denmark, 2002.
[2] Berring P. and Knudsen H.W., “Torsional performance of large wind turbine blades – experimental and numerical analysis”. Master’s thesis, Department of Mechanical Engineering, Technical University of Denmark, September, 2006.
[3] Branner K., Berring P., Berggreen C. and Knudsen H.W., “Torsional performance of wind turbine blades – part II: Numerical verification”. 16th International Conference of Composite Materials, Kyoto, Japan, July, 2007.
[4] Berggreen C., Jensen C. and Hayman B., “Buckling strength of square composite plates with geometrical imperfections – preliminary results”. MARSTRUCT International Conference on “Advancements in Marine Structures”, Glasgow, UK, March, 2007.