Tore Bertilsson Executive Vice President and CFO - csfb. · PDF fileSKF Automotive Bearing Co....
34
Tore Bertilsson Executive Vice President and CFO
Transcript of Tore Bertilsson Executive Vice President and CFO - csfb. · PDF fileSKF Automotive Bearing Co....

1
Tore Bertilsson
Executive Vice President
and CFO

2
SKF - a truly global company
• Established: 1907
• Sales 2004: MSEK 44 826
• Employees: 39 867
• Factory locations: 100 in 24 countries
• Countries with SKF presence: more than 130

3
Net sales per geography, 2004
North America, 20 %
Latin America, 5 %
Sweden, 5 %
Western Europe excl.
Sweden, 48 %
Central and Eastern
Europe, 4%
Asia, 15 %
Middle East and Africa, 3%

4
Net sales per Division, 2004
Industrial Division, 24 %
Service Division, 32 %
Automotive Division, 31%
- OEM 23 %
- VSM 8 %
Electrical Division, 4 %
Aero and Steel Division
- Aero 4%
- Steel 5%

5
Transportation

6
Industrial Applications

7
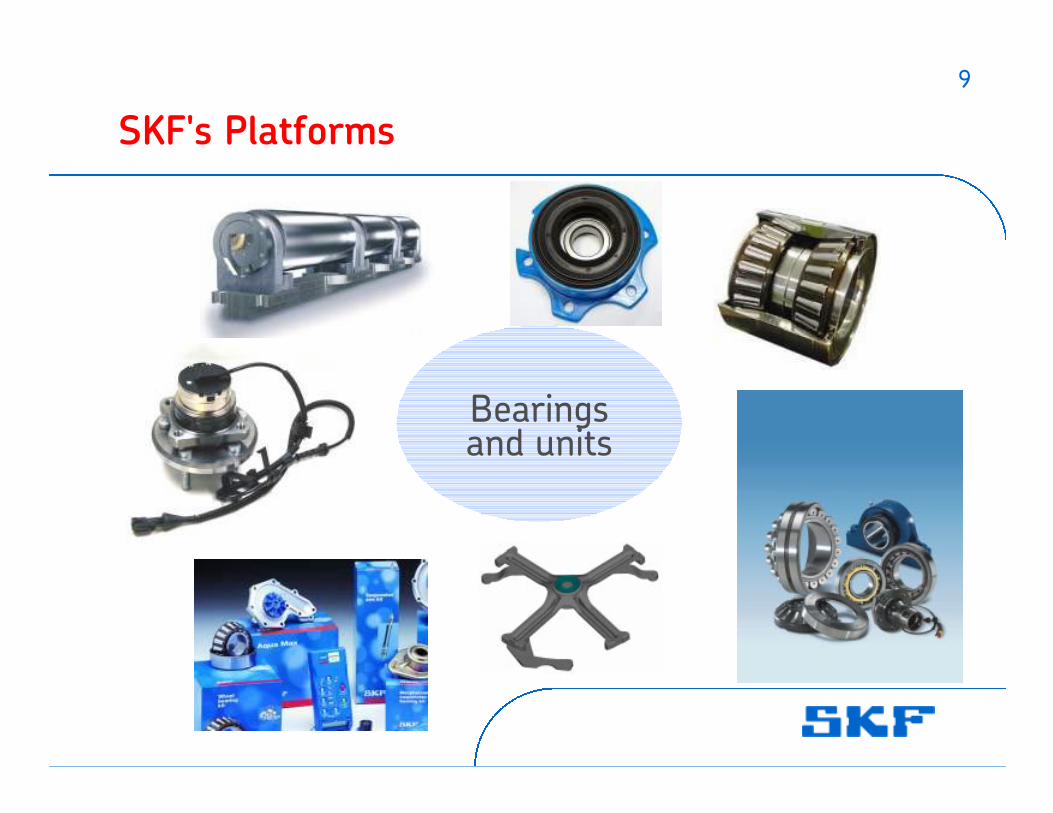
SKF's Platforms

8
The five platforms
- cover SKF's technology and capabilities around
rotating and linear motion equipment.
- enable SKF to develop the optimal solution for the
customer.
- make SKF unique.
No competitor has this combined competence.
9
SKF's Platforms
Bearingsand units
9

10
DGBB Unit
2.6 T
imes
Plastic Drum SupportTop loadedSales factor 2.6-4.6*
DGBB/HUBSales factor 1
* Depending on the selected bearing
Bearing units for washing machines

11
SKF's Platforms
Seals
11

12
Mechatronics
SKF's Platforms
12

13
Jaeger Industrial Co Ltd.
• Turnover year 2004, MSEK 320
• 750 employees
• ~50% sales volume in Asia
• Leading supplier in Asia-Pacific
• Complete range of actuation systems
• Low cost manufacturing and high volume capabilities

14
Services
SKF's Platforms
14

15
Service contracts
IMS contract in Brazil
Baosteel, China
TFO contract

16
Lubrication systems
SKF's Platforms
SYSTEM 24
LAGD 125
SYSTEM MultiPoint
LAGD 400
SYSTEM 24
LAGD 125
SYSTEM MultiPoint
LAGD 400

17
Vogel integration
Railway customer - Alstom METROPOLIS -
metro vehicles for Barcelona
2000 axleboxes equipped with tapered roller
bearing units plus 500 slewing bearings
equipped with Vogel lubrication systems.

18
Segment 1
Segment 2
Segment 3
Segment 4
Value
proposition
Bearings/Units Seals Mechatronics Services
Lubrication systems
X X X X
X X X X
X X X X X
X X X
Value
proposition
Value
proposition
Value
proposition
SKF Platforms
19
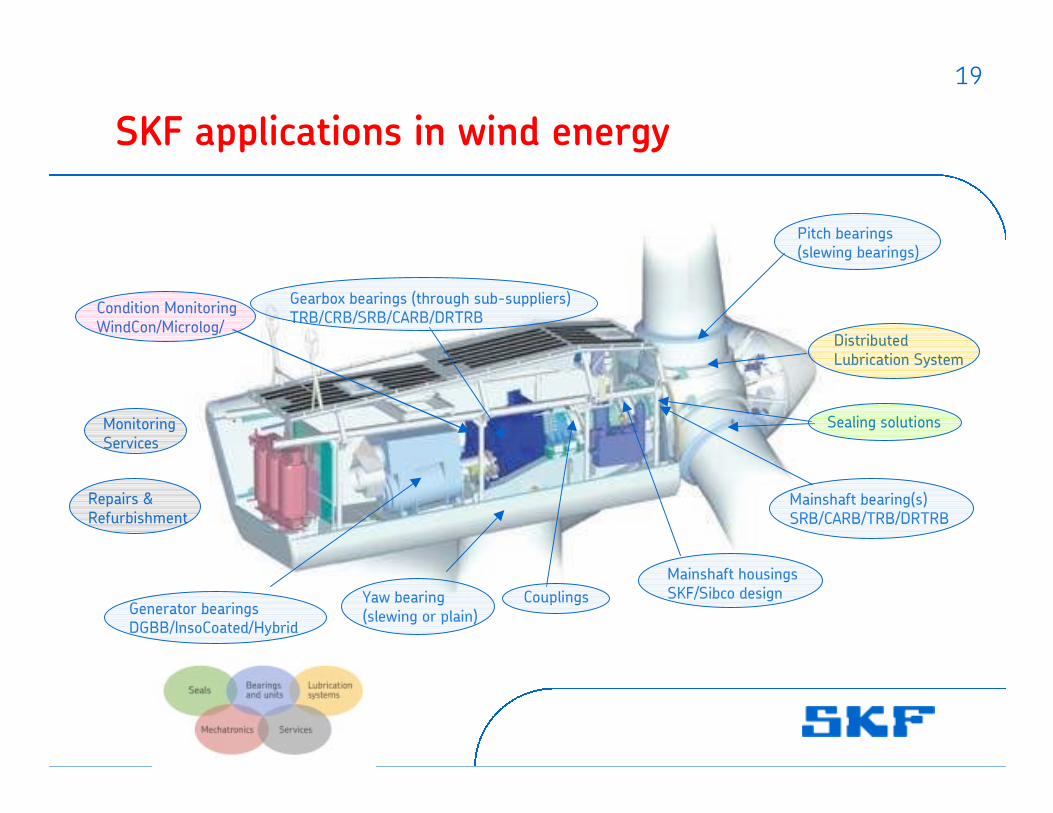
SKF applications in wind energy
Pitch bearings
(slewing bearings)
Yaw bearing
(slewing or plain)
Mainshaft bearing(s)
SRB/CARB/TRB/DRTRB
Mainshaft housings
SKF/Sibco design
Gearbox bearings (through sub-suppliers)
TRB/CRB/SRB/CARB/DRTRB
Generator bearings
DGBB/InsoCoated/Hybrid
Condition Monitoring
WindCon/Microlog/
Couplings
Distributed
Lubrication System
Sealing solutionsMonitoring
Services
Repairs &
Refurbishment

20
SKF Group targets
• 10% Operating margin level
• 6% Growth per annum
• 20% ROCE
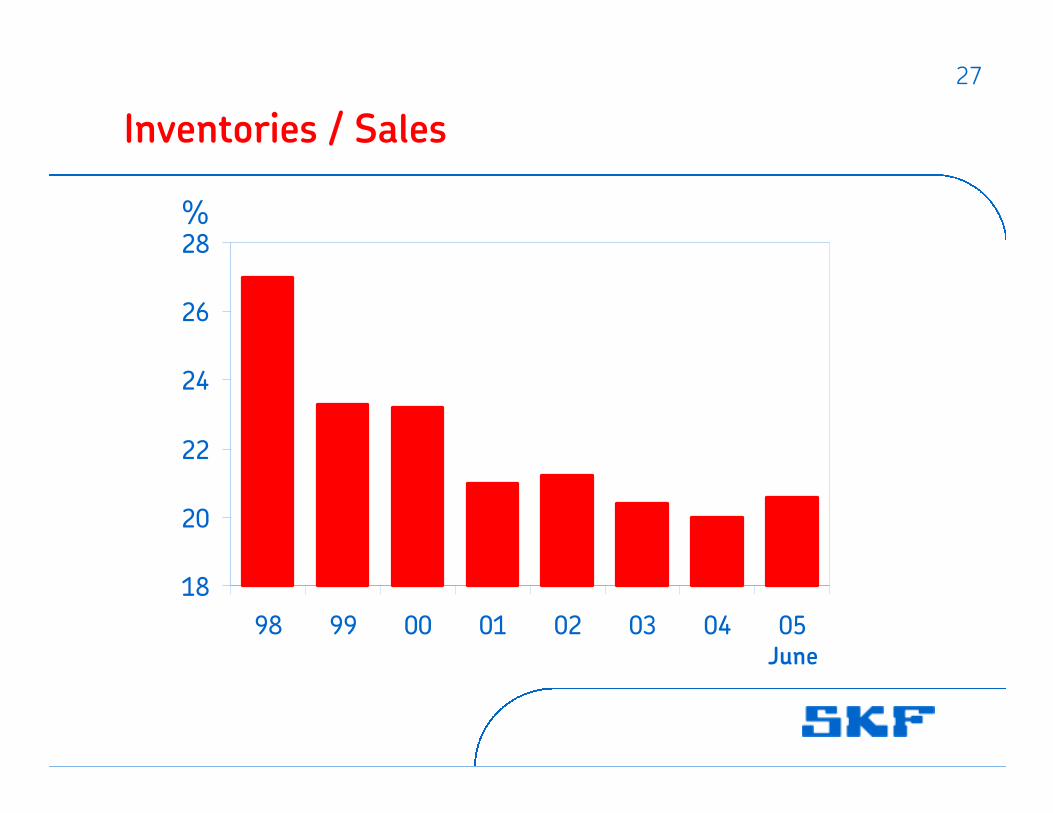
• 18% Inventory / sales
2006
2007

21
22 10624 610Net sales
9.3%10.4%Operating margin
20042005MSEK
1 094406Cash flow after investments before financing
2.803.60Earning per share, SEK
1 4021 684Net profit
1 8642 443Profit before taxes
2 0622 571Operating profit
Half-year 2005

22
Major events during the second quarter
• Merger of long-steel operations, Oy Ovako Ab
• Share split and redemption
• Launch of a 350 million euro dual-tranche bond
• Acquisition of Jaeger Industrial Ltd.
• Announcement of the closure of two plants in the USA

23
Operating margin*
%
2002 2003 2004
0
1
2
3
4
5
6
7
8
9
10
11
* excluding restructuring and impairment in Q4 2003
2005

24
Growth development / local currency10 BSEK additional sales = 6 % annual growth rate
% Y-o-Y
0
2
4
6
8
10
12
14
16
2002 2003 2004 2005
Growth by acquisitions
Organic growth
6% total growth
4% organic growth
Up to June

25
SKF in China
Wuhu
Beijing
Wuhan
Guangzhou
Wafangdian
Hong Kong
Tianjin
Xi'an
Nanjing
Dalian
ShanghaiChengdu
Qingdao
SKF (China) Investment Co.
SKF (China) Sales Co.
SKF Reliability Systems Co.
SKF Automotive Bearing Co.
Dalian SKF Wazhou Co.
Anhui CR Seals Co.
Beijing Nankou SKF Railway Co.
Shenyang
Chongqing
SKF China Ltd.
SKF China Ltd. Sales Offices
SKF China Ltd. New Offices (2005 Plan)
Wholly-owned companies
Joint Ventures
SKF Shanghai Bearing Co.
+22

26
-4
-2
0
2
4
6
8
10
12
14
16
18
20
22
24
Q1 Q1 Q1 Q1 Q1 Q1 Q1
Return on capital employed*
%
2002 2003 2004 2005
* Operating profit plus interest income,as a
percentage of twelve months average of total
assets. As of 2003, according to IFRS
200120001999
27
Inventories / Sales
18
20
22
24
26
28
98 99 00 01 02 03 04 05
%
June

28
Fixed assets / Sales
20
22
24
26
28
30
32
34
36
38
40
98 99 00 01 02 03 04 05
%%
Up to June

29
Performance management
The link between…
Shareholder value
• Earnings per
share
• Cash flow
Operational
performance
• TVA
Focus on
- revenue growth
- margin improvement
- capital efficiency

30
TVA - The key performance measure
0
40
80
120
160
200
240
1600 1200 800 400
Cost of Capital
• Grow
• Develop
• Invest
• Restructure
• Run for cash
• Exit
TVA = Operating profit - Cost of capital
Capital
employed
Profit

31
Cash flow after investments before financing
(excl. the acquisition of Willy Vogel AG in 2004, and Jaeger Industrial Co Ltd. in 2005)
0
1 000
2 000
3 000
4 000
2000 2001 2002 2003 2004 2005
• Accumulated free cash flow generated since January 2000, MSEK >15 000
• Cash conversion this period, 120% of Net profit (Target 100%)
Up to June

32
Volume trend for the third quarter 2005
Europe 57%
20%
15%
5%
North America
Asia Pacific
Latin America
Net sales 2004 July 2005
Total
April 2005
Note: This is the sequential
development

33
Summary
• Truly global company
• Global market leader
• Growth ahead of market
• Share holder value driven
• Strong cash flow and solid financial position