Topographic Maps. Understanding Topographic Maps Topographic maps are two-dimensional...
30
Topographic Maps
-
Upload
charlotte-dalton -
Category
Documents
-
view
238 -
download
4
Transcript of Topographic Maps. Understanding Topographic Maps Topographic maps are two-dimensional...
Topographic Maps
Understanding Topographic Maps
• Topographic maps are two-dimensional representations of a portion of the three-dimensional surface of the earth.
• Topography is the shape of the land surface, and topographic maps exist to represent the land surface.
Understanding Topographic Maps
• Topographic maps are tools used in geologic studies because they show the configuration of the earth’s surface.
• Cartographers solve the problem of representing the three-dimensional land surface on a flat piece of paper by using contour lines, thus horizontal distances and vertical elevations can both be measured from a topographic map.
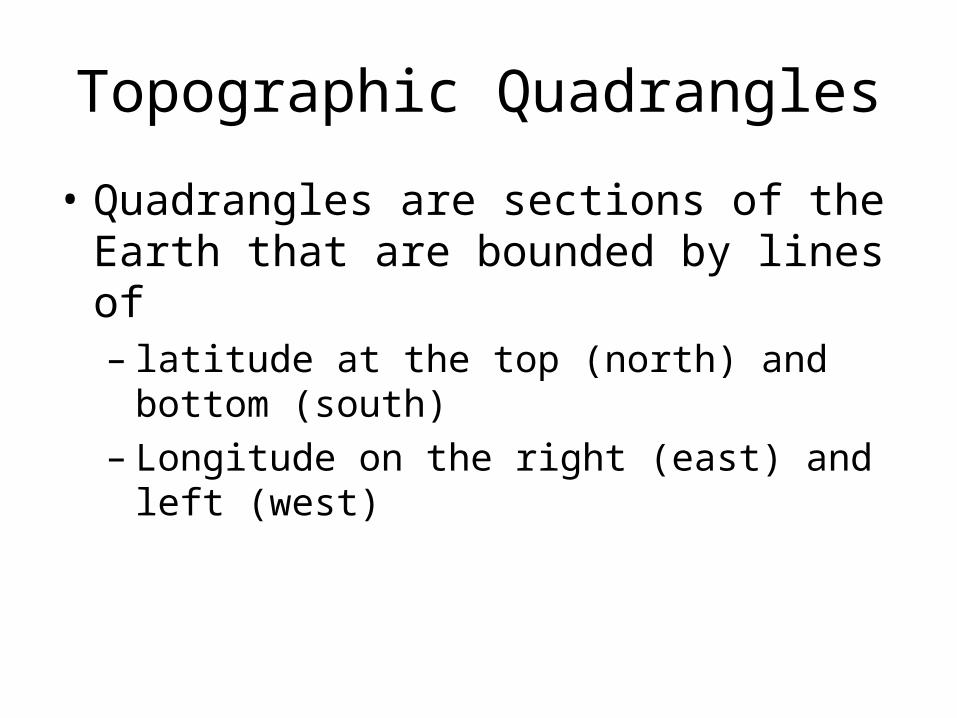
Topographic Quadrangles
• Quadrangles are sections of the Earth that are bounded by lines of – latitude at the top (north) and bottom (south)– Longitude on the right (east) and left (west)
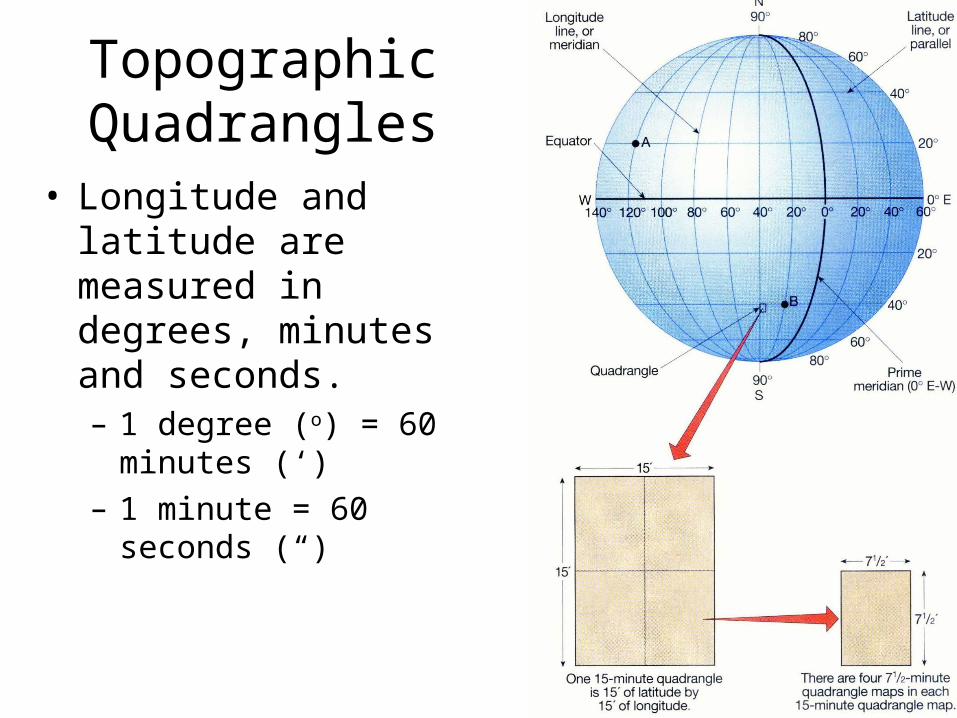
Topographic Quadrangles
• Longitude and latitude are measured in degrees, minutes and seconds.– 1 degree (o) = 60 minutes
(‘)– 1 minute = 60 seconds (“)
Compass Bearing
• A bearing is the direction from one point to another
• If direction is expressed in degrees east or west of north, it is called a “quadrant bearing.”
• If direction is expressed in degrees between 0 and 360, it is called “azimuth bearing.”
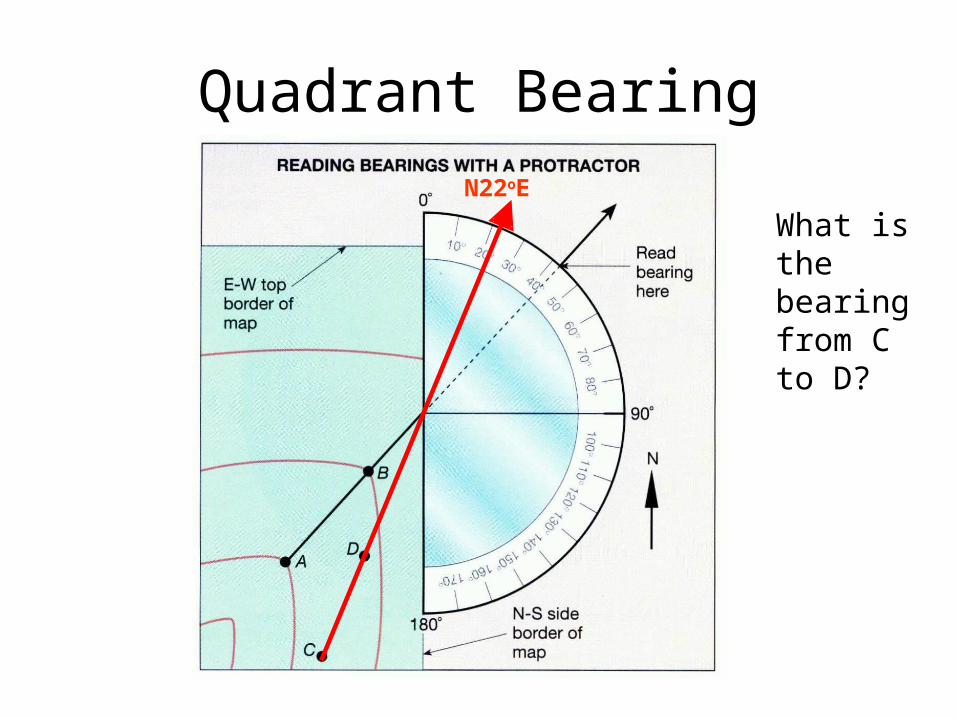
Quadrant Bearing
What is the bearing from C to D?
N22oE
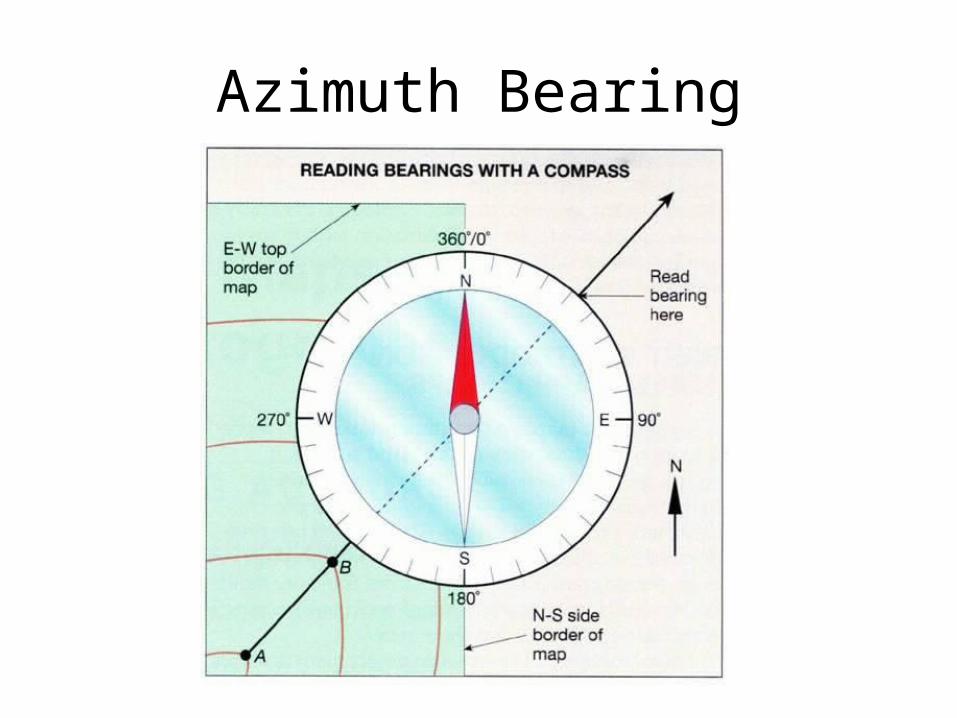
Azimuth Bearing
General Information
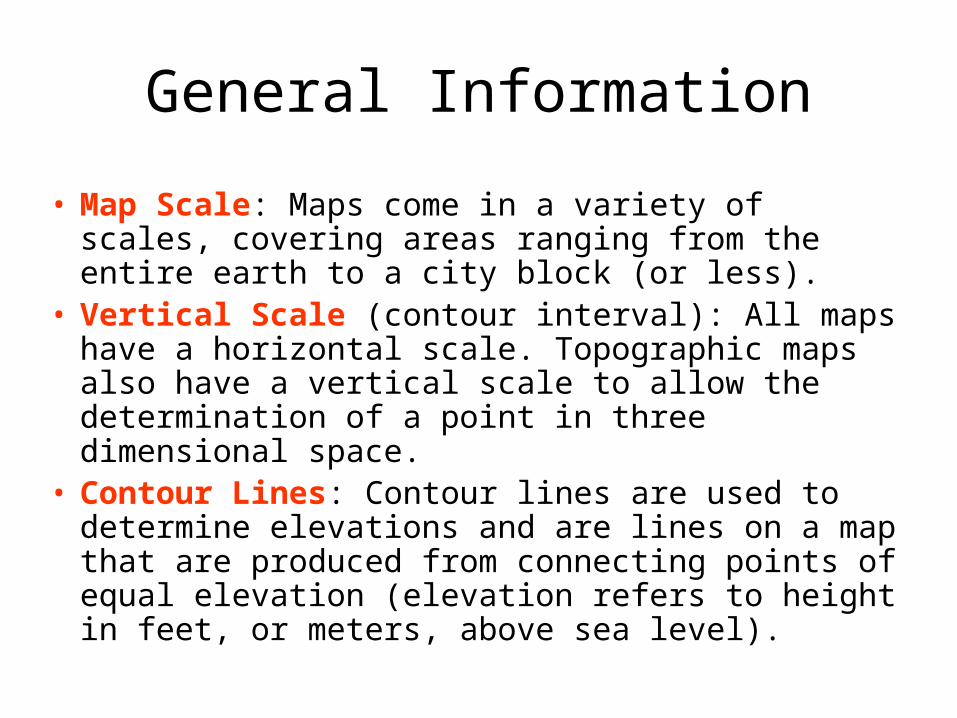
• Map Scale: Maps come in a variety of scales, covering areas ranging from the entire earth to a city block (or less).
• Vertical Scale (contour interval): All maps have a horizontal scale. Topographic maps also have a vertical scale to allow the determination of a point in three dimensional space.
• Contour Lines: Contour lines are used to determine elevations and are lines on a map that are produced from connecting points of equal elevation (elevation refers to height in feet, or meters, above sea level).
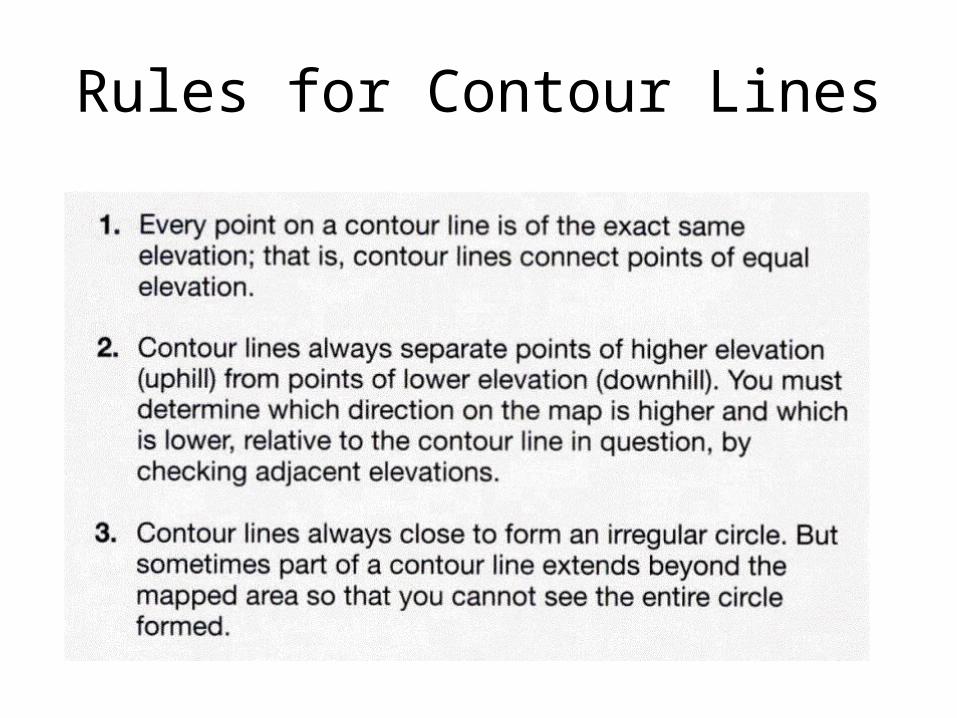
Rules for Contour Lines
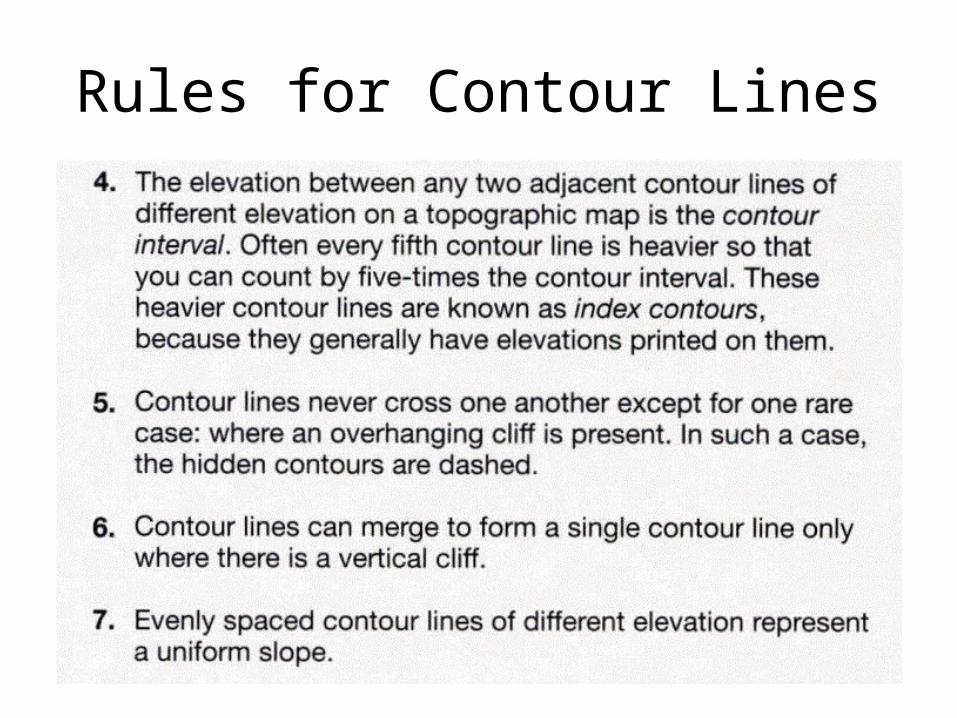
Rules for Contour Lines
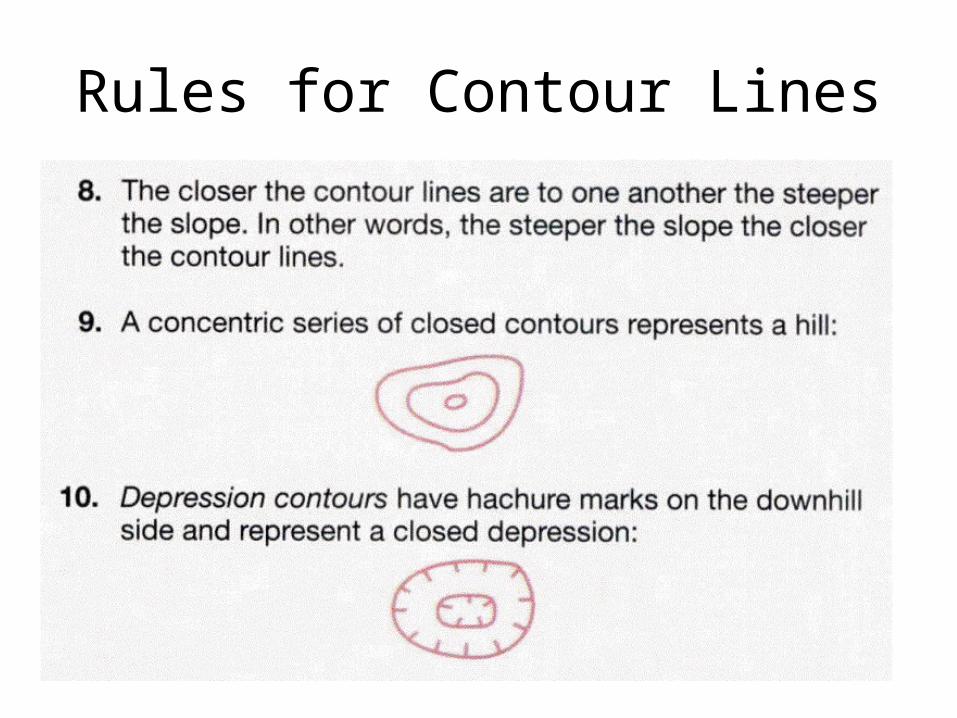
Rules for Contour Lines
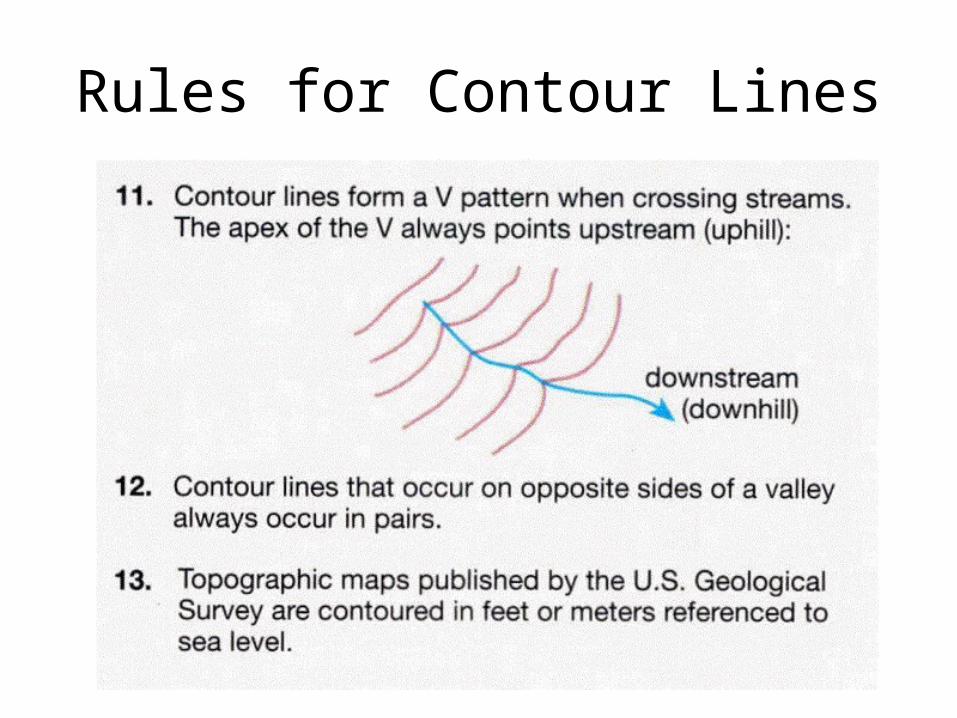
Rules for Contour Lines
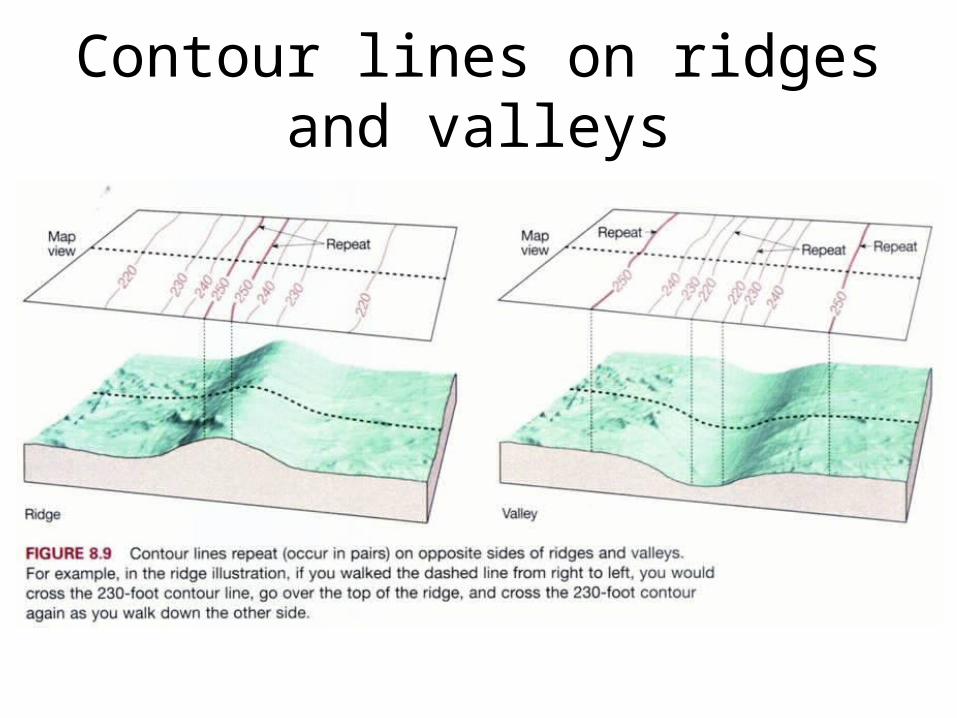
Contour lines on ridges and valleys
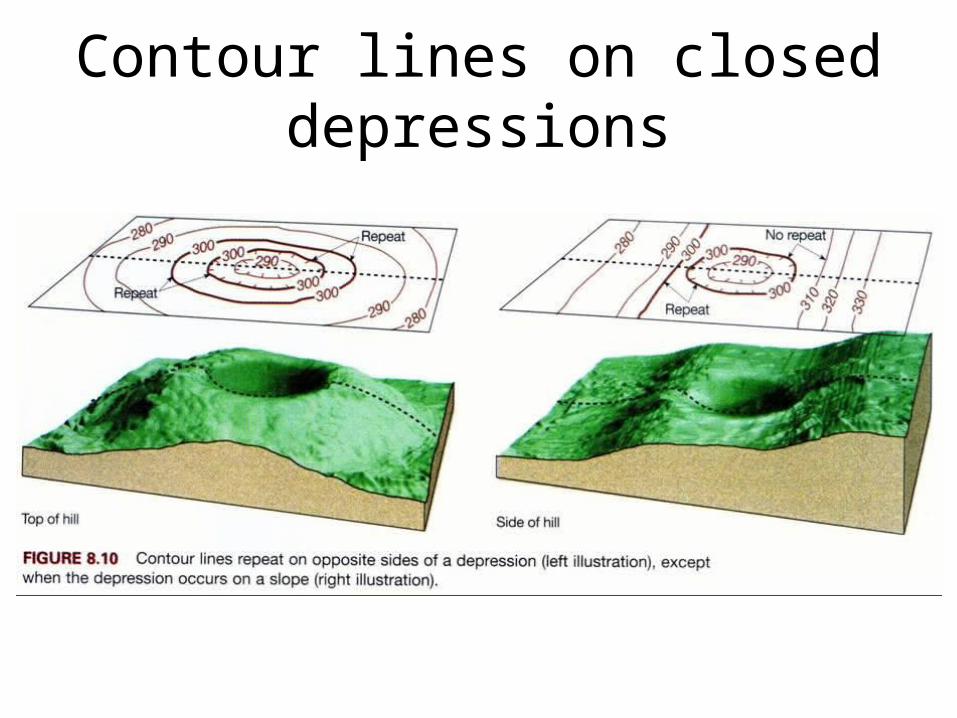
Contour lines on closed depressions
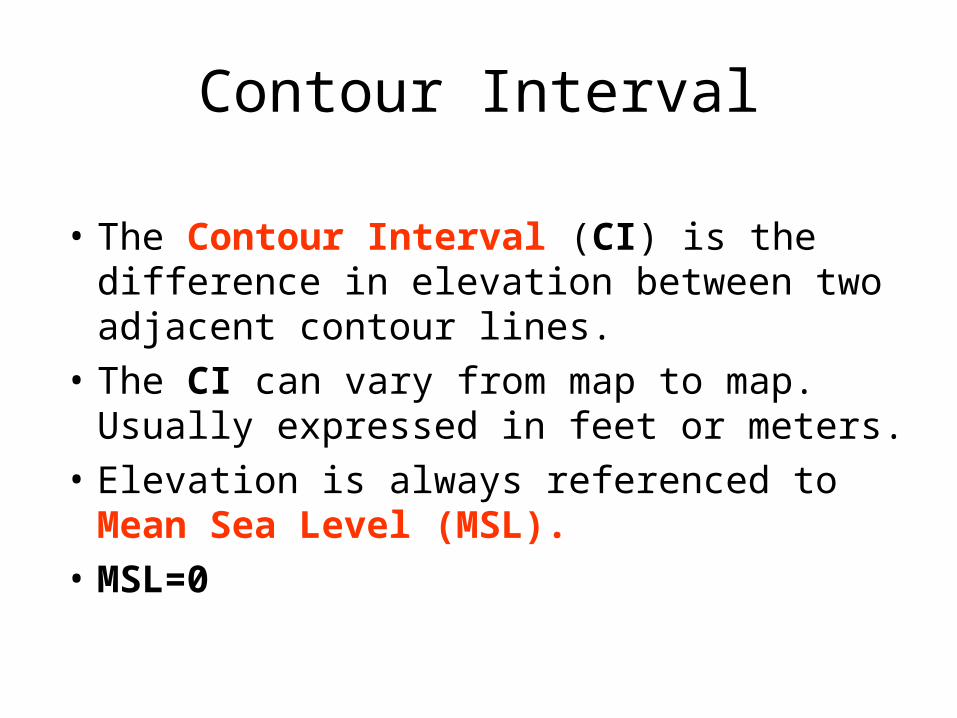
Contour Interval
• The Contour Interval (CI) is the difference in elevation between two adjacent contour lines.
• The CI can vary from map to map. Usually expressed in feet or meters.
• Elevation is always referenced to Mean Sea Level (MSL).
• MSL=0
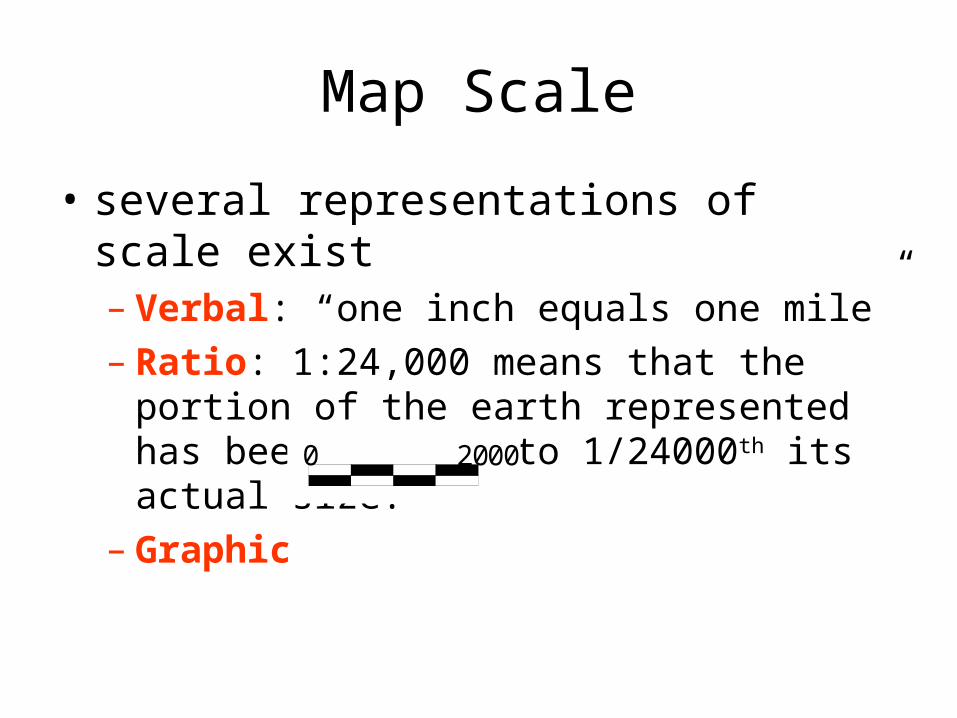
Map Scale
• several representations of scale exist – Verbal: “one inch equals one mile”– Ratio: 1:24,000 means that the portion of the
earth represented has been reduced to 1/24000th its actual size.
– Graphic 0 2000
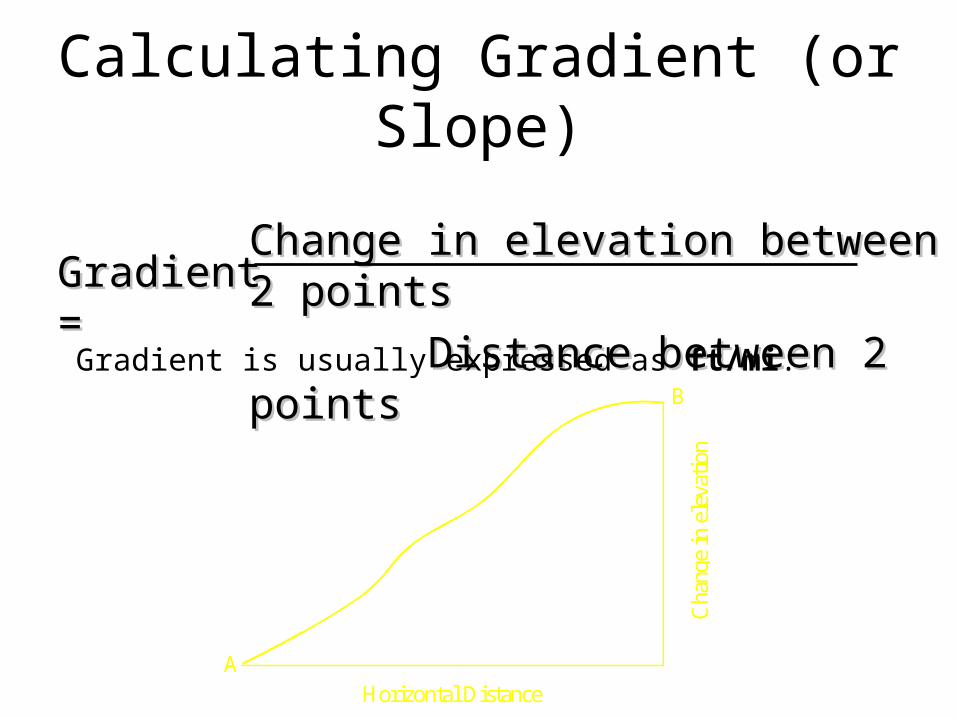
Change in elevation between 2 pointsChange in elevation between 2 points
Distance between 2 pointsDistance between 2 points
Calculating Gradient (or Slope)
Gradient is usually expressed as ft/mi.
Gradient =Gradient =
Horizontal DistanceC
hang
e in
ele
vatio
n
A
B
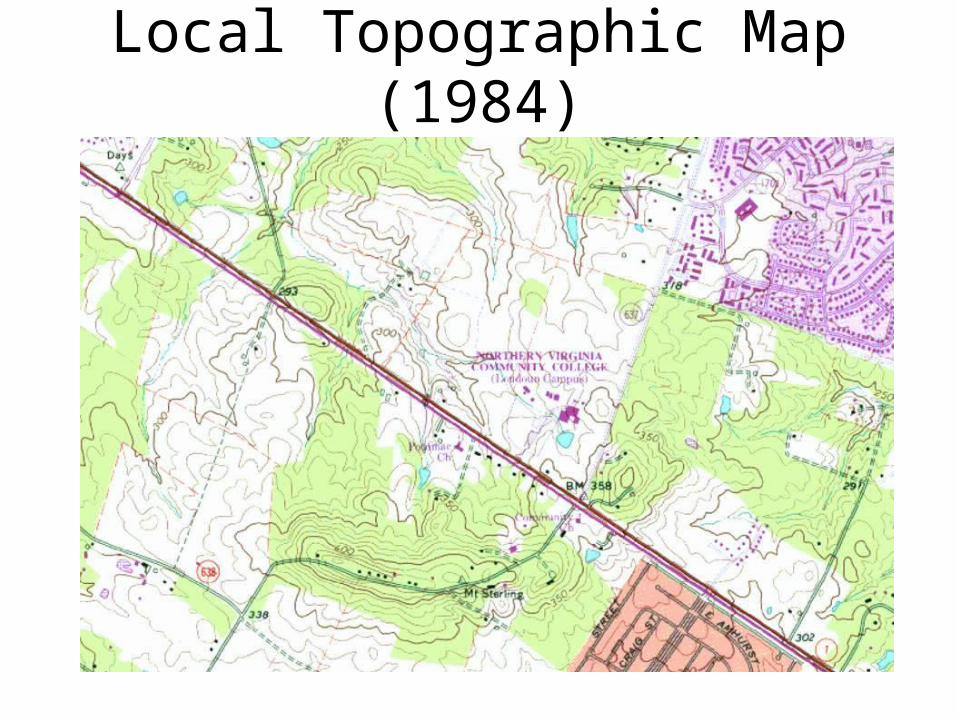
Local Topographic Map (1984)
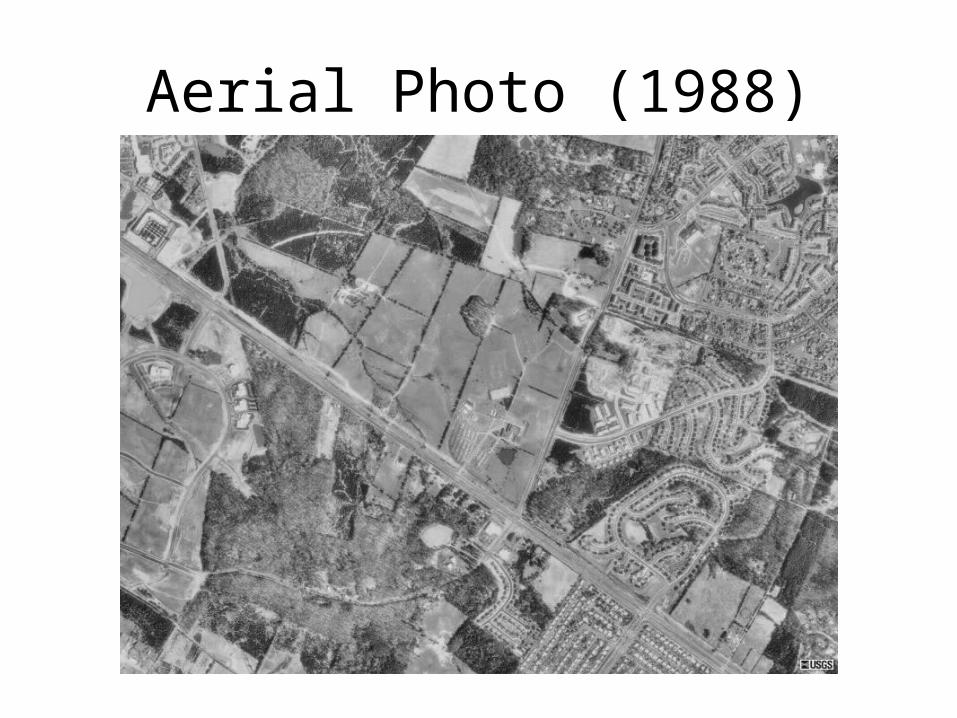
Aerial Photo (1988)
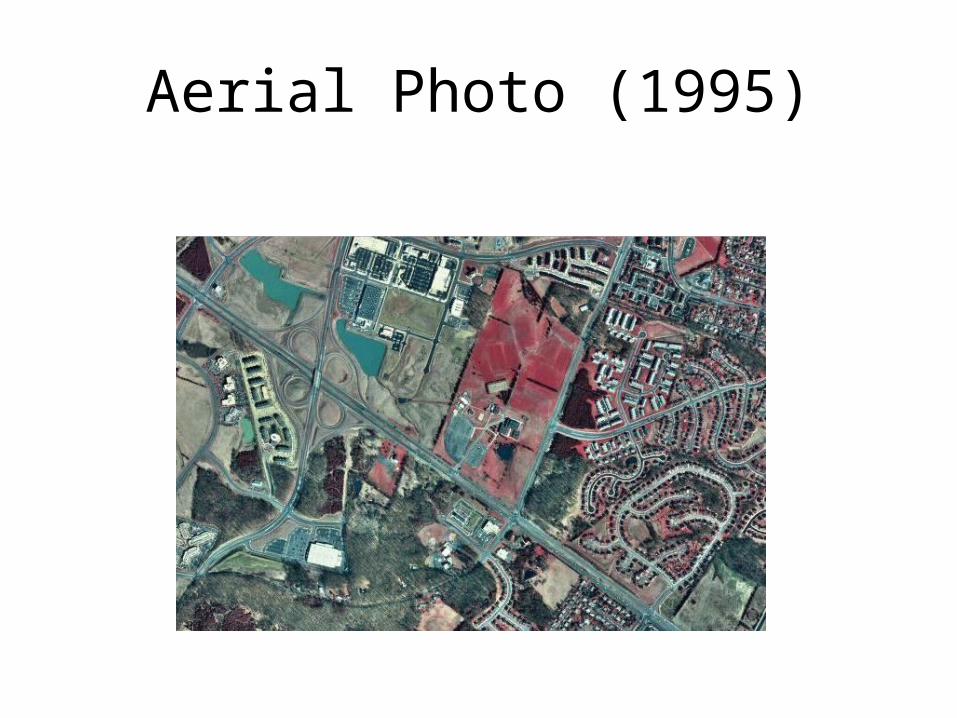
Aerial Photo (1995)
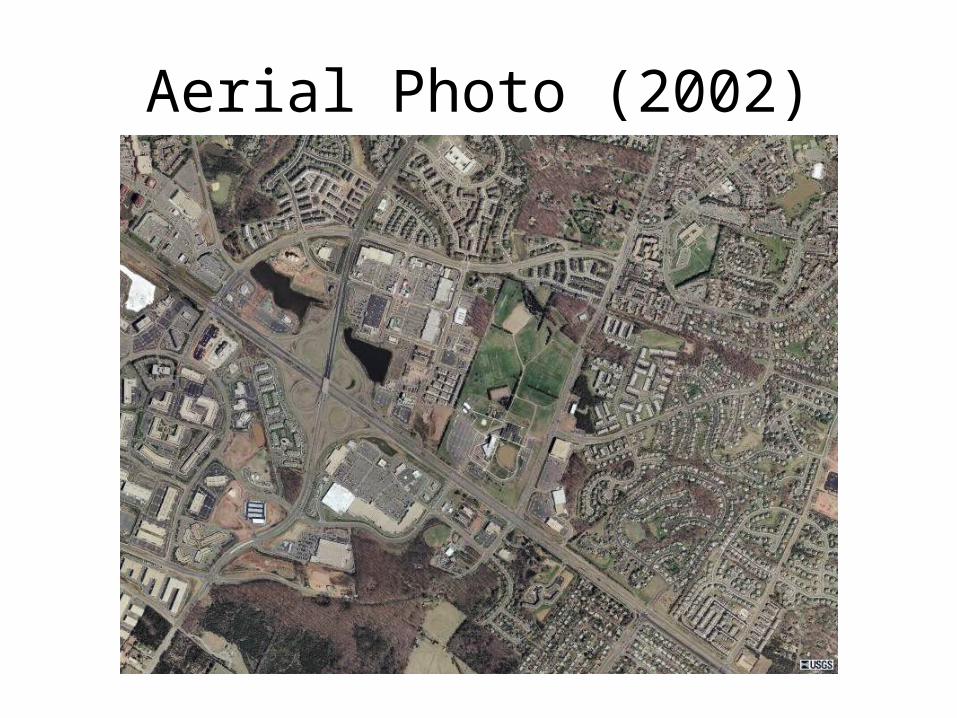
Aerial Photo (2002)
Topographic Profiles
• topographic maps represent a view of the landscape as seen from above (called “map view”)
• for producing a detailed study of a landform it is necessary to construct a topographic profile
• a topographic profile is a cross-sectional view along a line drawn through a portion of a topographic map
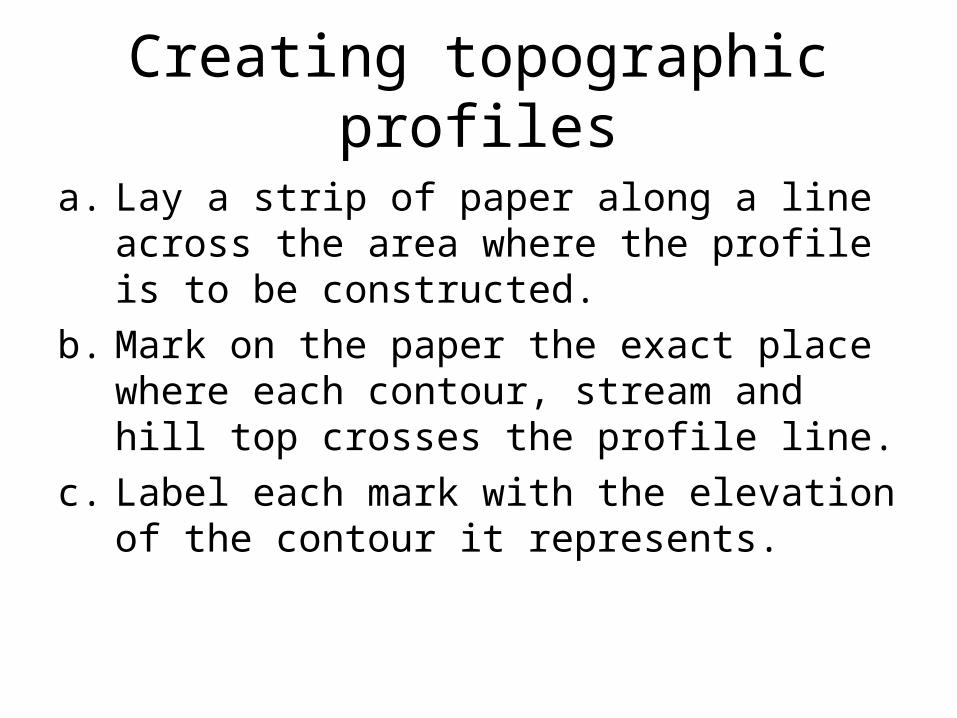
Creating topographic profiles
a. Lay a strip of paper along a line across the area where the profile is to be constructed.
b. Mark on the paper the exact place where each contour, stream and hill top crosses the profile line.
c. Label each mark with the elevation of the contour it represents.
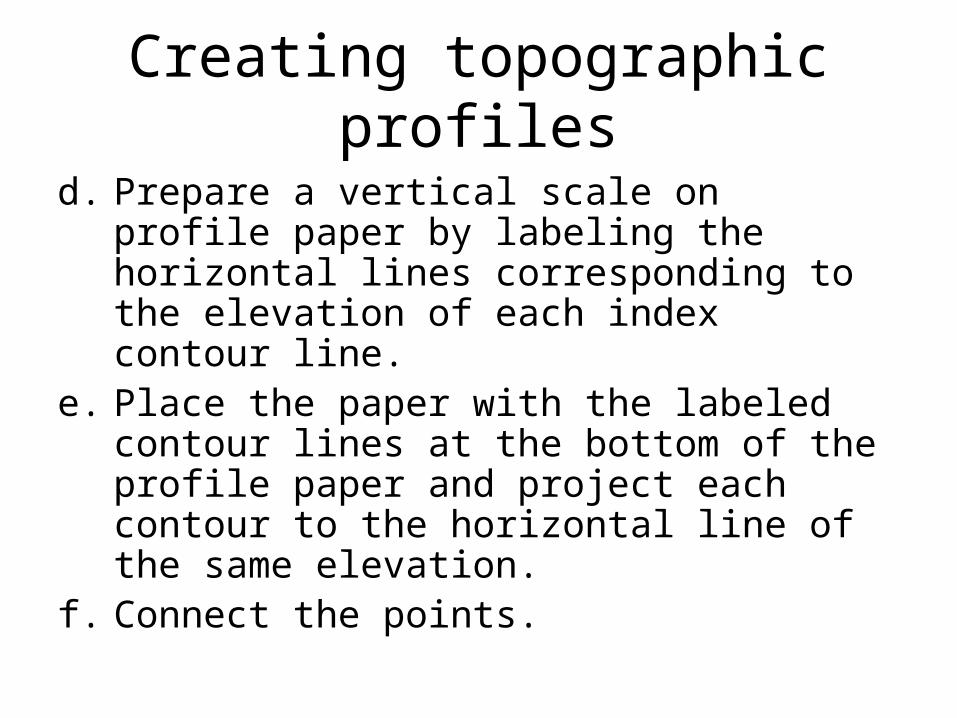
Creating topographic profiles
d. Prepare a vertical scale on profile paper by labeling the horizontal lines corresponding to the elevation of each index contour line.
e. Place the paper with the labeled contour lines at the bottom of the profile paper and project each contour to the horizontal line of the same elevation.
f. Connect the points.
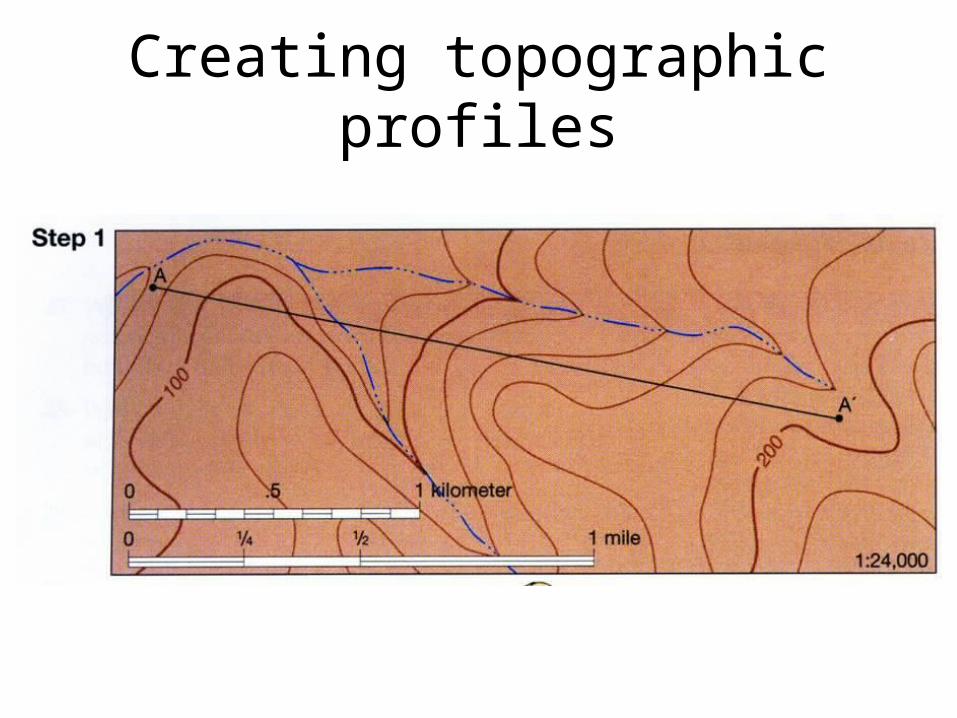
Creating topographic profiles
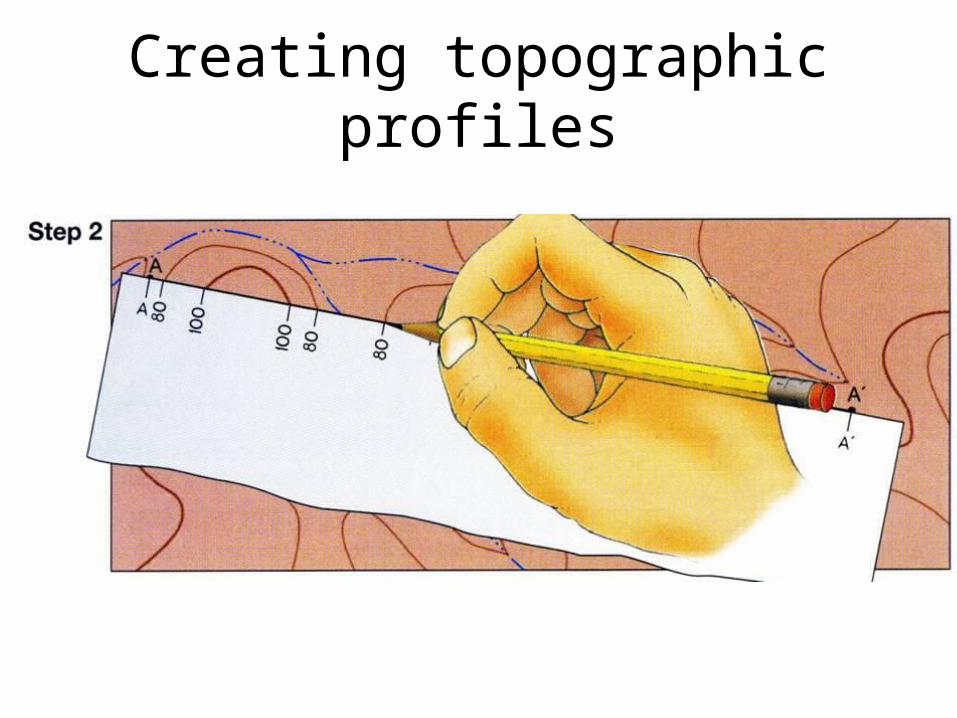
Creating topographic profiles
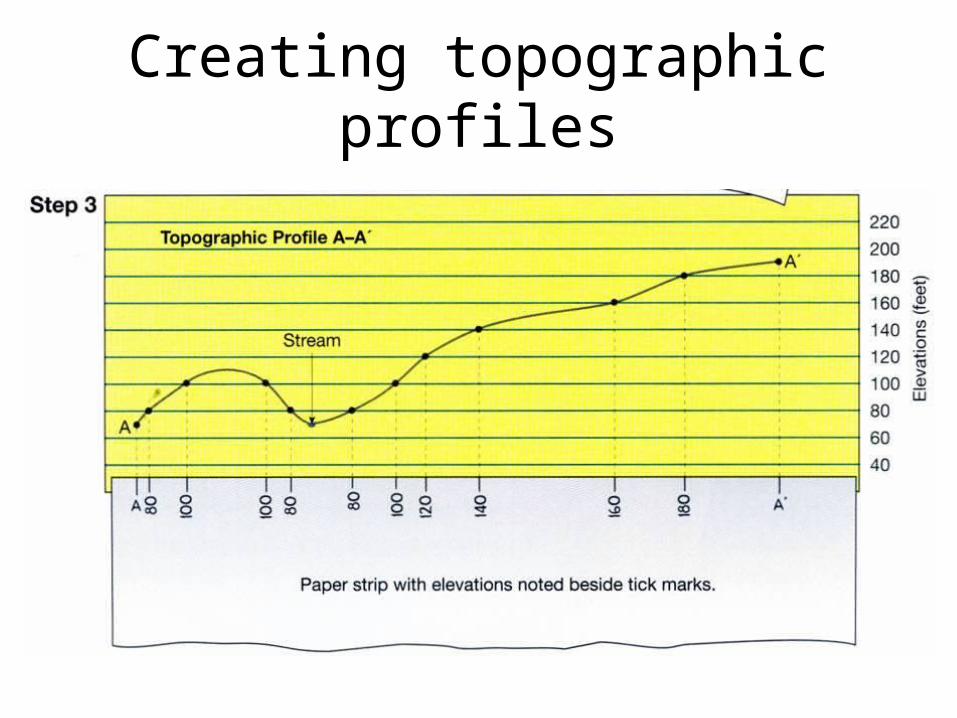
Creating topographic profiles
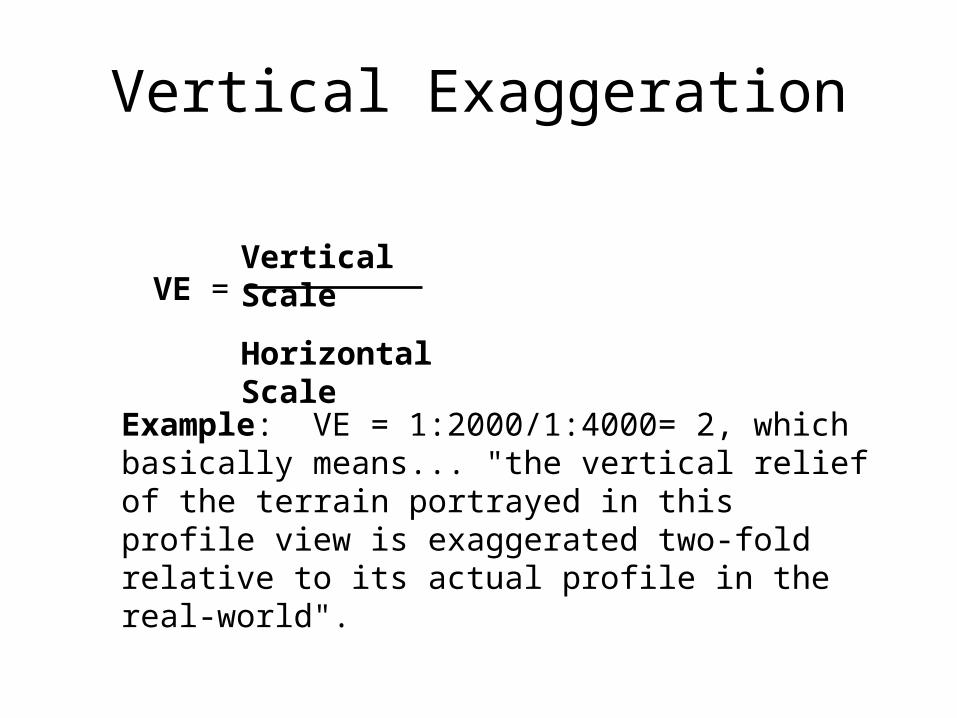
Vertical Exaggeration
VE =Vertical Scale
Horizontal Scale
Example: VE = 1:2000/1:4000= 2, which basically means... "the vertical relief of the terrain portrayed in this profile view is exaggerated two-fold relative to its actual profile in the real-world".
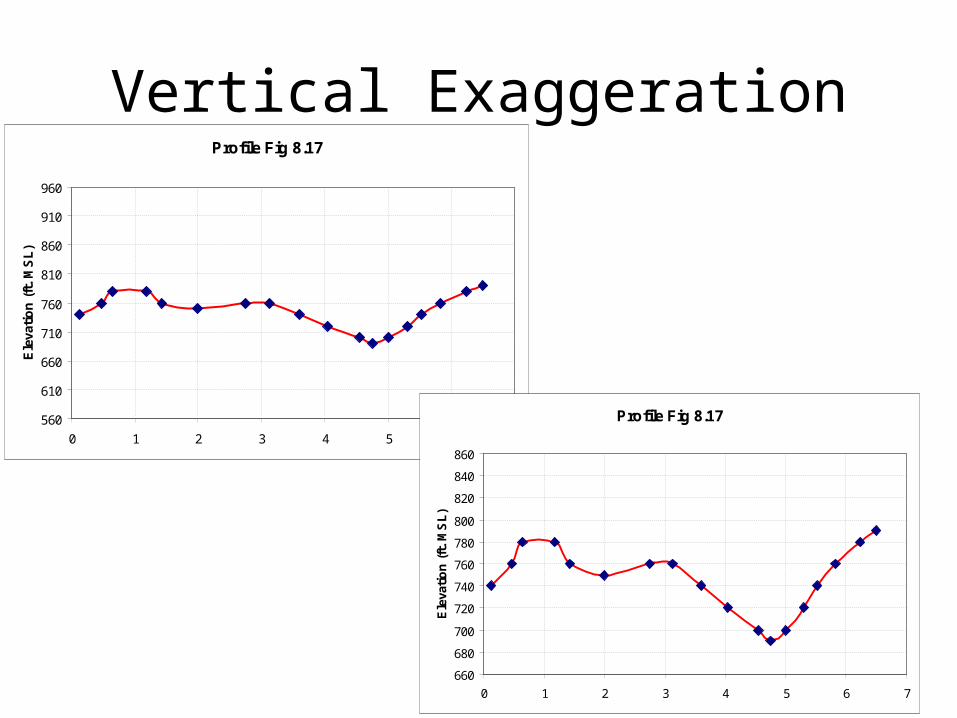
Vertical ExaggerationProfile Fig 8.17
560
610
660
710
760
810
860
910
960
0 1 2 3 4 5 6 7
Ele
vati
on
(ft
. M
SL
)
Profile Fig 8.17
660
680
700
720
740
760
780
800
820
840
860
0 1 2 3 4 5 6 7
Ele
vati
on
(ft
. M
SL
)