Topics in Fluorescence Spectroscopy · 2013-07-19 · Fluorescence Spectroscopy series. We have...
30
Topics in Fluorescence Spectroscopy Volume 10 Advanced Concepts in Fluorescence Sensing Part B: Macromolecular Sensing
Transcript of Topics in Fluorescence Spectroscopy · 2013-07-19 · Fluorescence Spectroscopy series. We have...

Topics inFluorescenceSpectroscopyVolume 10Advanced Concepts inFluorescence SensingPart B: Macromolecular Sensing

Topics in Fluorescence Spectroscopy
Edited by JOSEPH R. LAKOWICZ and CHRIS D. GEDDES
Volume ]:
Volume 2:
Volume 3:
Volume 4:
Volume 5:
Volume 6:
Volume 7:
Volume 8:
Volume 9:
Volume 10:
Techniques
Principles
Biochemical Applications
Probe Design and Chemical Sensing
Nonlinear and Two-Photon-Induced Fluorescence
Protein Fluorescence
DNA Technology
Radiative Decay Engineering
Advanced Concepts in Fluorescence Sensing
Part A: Sn1all Molecule Sensing
Advanced Concepts in Fluorescence Sensing
Part B: Macromolecular Sensing

Topics inFluorescenceSpectroscopyVolume 10Advanced Concepts inFluorescence SensingPart B: Macromolecular Sensing
Edited by
CHRIS D. GEDDESThe Institute of FluorescenceMedical Biotechnology CenterUniversity of Maryland Biotechnology InstituteBaltiJnore, Maryland
and
JOSEPH R. LAKOWICZCenter for Fluorescence Spectroscopy andDepartment of Biochelnistry and Molecular BiologyUniversity of Maryland School of MedicineBaltimore, Maryland
~ Springer

The Library of Congress cataloged the first volume of this title as follows:
Topics in fluorescence spectroscopy/edited by Chris D. Geddes and Joseph R. Lakowicz.p. cm.Includes bibliographical references and index.Contents: v.I. TechniquesI. Fluorescence spectroscopy. 1. Geddes. Chris D. II. Lakowicz, Joseph R.
QD96.F56T66 1991543' .0858-dc20
ISSN: 1574-1036ISBN 0-387-23644-9 Printed on acid-free paper
91-32671CIP
©2005 Springer Science+ Business Media, Inc.All rights reserved. This work may not be translated or copied in whole or in part without thewritten permission of the publisher (Springer Science+ Business Media, Inc., 233 Spring Street,New York, NY 10013, USA), except for brief excerpts in connection with reviews or scholarlyanalysis. Use in connection with any form of information storage and retrieval, electronicadaptation, computer software, or by sinlilar or dissimilar methodology now known or hereafterdeveloped is forbidden.The use in this publication of trade names, tradenlarks, service marks and similar terms, even ifthey are not identified as such, is not to be taken as an expression of opinion as to whether or notthey are subject to proprietary rights.
Printed in the United States of America
9876543 2
springeronline.com
SPIN 11333586

CONTRIBUTORS
Caleb Behrend. Department of Chemistry, University of Michigan, Ann Arbor,Michigan, 48109-1055.
Murphy Brasuel. Department of Environmental Health Sciences, University of Michigan,Ann Arbor, Michigan, 48109-1055.
Sarah M Buck. Raoul Kopelman. Department of Chemistry, University of Michigan,Ann Arbor, Michigan, 48109-1055.
Eun Jeong Cho. Department of Chemistry and Biochemistry, Institute for Cellular andMolecular Biology, The University of Texas at Austin, Austin, TX 78712.
Sonja Draxler. Institut fur Experimentalphysik, Karl-Franzens-Universitat Graz, A-80 10Graz Austria.
Andrew D. Ellington. Department of Chemistry and Biochemistry, Institute for Cellularand Molecular Biology, The University of Texas at Austin, Austin, TX 78712.
Peter M Haggie. Departments of Medicine and Physiology, Cardiovascular ResearchInstitute, University of California, San Francisco, CA, 94143-0521.
Tony D James. Department of Chemistry, University of Bath, Bath BA2 7AY UK.
Hui Jiang. Boston University, Chemistry Department and Photonics Center, Boston, MA02215.
Guilford Jones. II. Boston University, Chemistry Department and Photonics Center,Boston, MA 02215.
Yong-Eun Lee Koo. Department of Chemistry, University of Michigan, Ann Arbor,Michigan, 48109-1055.
Robert Masse. Applied Research and Development, MDS Pharma Services, 2350 CohenStreet, Montreal, QC, Canada.
Eric Monson. Department of Chemistry, University of Michigan, Ann Arbor, Michigan,48109-1055.
Martin A. Philbert. Department of Environmental Health Sciences, University ofMichigan, Ann Arbor, Michigan, 48109-1055.
v

vi CONTRIBUTORS
William S. Powell. Meakins-Christie Laboratories, McGill University, 3626 St. UrbainStreet, Montreal, QC, Canada.
Manjula Rajendran. Department of Chemistry and Biochemistry, Institute for Cellularand Molecular Biology, The University of Texas at Austin, Austin, TX 78712.
Alnawaz Rehemtulla.Molecular Therapeutics Inc., Ann Arbor, Michigan, 48109.
Brian Ross. Molecular Therapeutics Inc., Ann Arbor, Michigan, 48109
Seiji Shinkai. Department of Chemistry and Biochemistry, Graduate School ofEngineering, Kyushu University, Fukuoka 812-8581 JAPAN.
Richard B. Thompson. Department of Biochemistry and Molecular Biology, School ofMedicine and Center for Fluorescence Spectroscopy, University of Maryland, Baltimore,Maryland 21201.
Petra Turkewitsch. Applied Research and Development, MDS Pharma Services, 2350Cohen Street, Montreal, QC, Canada.
A.S. Verkman. Departments of Medicine and Physiology, Cardiovascular ResearchInstitute, University of California, San Francisco, CA, 94143-0521.
Valentine 1. Vullev. Boston University, Chemistry Department and Photonics Center,Boston, MA 02215.
Hao Xu. Department of Chemistry, University of Michigan, Ann Arbor, Michigan,48109-1055.

PREFACE
Over the last decade fluorescence has become the dominant tool inbiotechnology and medical imaging. These exciting advances have been underpinned bythe advances in time-resolved techniques and instrumentation, probe design, chemical /biochemical sensing, coupled with our furthered knowledge in biology.
Ten years ago Volume 4 of the Topics in Fluorescence Spectroscopy seriesoutlined the emerging trends in time resolved fluorescence in analytical and clinicalchemistry. These emerging applications of fluorescence were the result of continuedadvances in both laser and computer technology and a drive to develop red/near-infraredfluorophores. Based on the advancements in these technologies, it was envisaged thatsmall portable devices would find future common place in a doctor's office or for homehealth care.
Today, these past emerging trends in fluorescence sensing are now widely usedas either standard practices in clinical assessment or commercialized health care products.Miniature lasers in the form of laser diodes and even light emitting diodes are widelyused in applications of time-resolved fluorescence. Computer clock-speed is now notconsidered a hurdle in data analysis. Even our choice of fluorophores has changeddramatically in the last decade, the traditional fluorophore finding continued competitionby fluorescent proteins and semi-conductor quantum dots, to name but just a few.
This volume "Advanced Concepts in Fluorescence Sensing: MacromolecularSensing" aims to summarize the current state of the art in fluorescence sensing. For thisreason we have invited chapters, encompassing a board range of macromolecularfluorescence sensing techniques. Chapters in this volume deal with macromolecularsensing, such as using GFP, Aptamers and fluorescent pebble nano-sensors. This volumedirectly compliments volume 9 of the Topics in Fluorescence Spectroscopy series, whichdeals with advanced concepts in small molecule fluorescence sensing.
While many of the changes in recent fluorescence have been well received, itscontinued growth in the world has created a challenge in trying to archive and documentits use. Subsequently Chris D. Geddes has now become co-series editor of the Topics inFluorescence Spectroscopy series. We have also recently launched the Reviews inFluorescence series, which co-edited also by Dr's Geddes and Lakowicz and publishedannually, is meant to directly compliment the Topics in Fluorescence Spectroscopyseries, with small chapters summarizing the yearly progress in fluorescence.
Finally we would like to thank all the authors for their excellent contributions,Mary Rosenfeld for administrative support and Kadir AsIan for help in typesetting bothvolumes 9 and 10.
Chris D. GeddesJoseph R. Lakowicz
Baltimore,Maryland, US.August 2004
vii


CONTENTS
1. PROTEIN-BASED BIOSENSORS WITH POLARIZATIONTRANSDUCTION .
Richard B. Thompson
1.1. INTRODUCTION 11.2. PRINCIPLES OF OPERATION 11.3. ADVANTAGES OF ANISOTROPY-BASED SENSING 31.4. FLUORESCENCE POLARIZATION IMMUNOASSAy............................ 41.5. ANISOTROPY-BASED METAL ION BIOSENSING 91.6. ANISOTROPY-BASED SENSING OF OTHER ANALYTES USING
PROTEINS AS TRANSDUCERS 151.7. CONCLUSIONS 161.8. ACKNOWLEDGMENTS 171.9. REFERENCES 17
2. GFP SENSORS 21
Peter M. Haggie and A.S. Verkman
2.1. INTRODUCTION 212.2. GENERAL PRINCIPLES OF ENGINEERING FLUORESCENT PROTEIN
SENSORS 212.3. NEW GREEN AND RELATED FLUORESCENT PROTEINS 23
2.3.1. GFP Mutants 232.3.2. Novel Fluorescent Proteins 24
2.4. GFP-BASED SENSORS 242.4.1. pH Sensors ~............................................................ 242.4.2. Chloride/Halide Sensors 262.4.3. Sensors of Protease Activity 282.4.4. Calcium Sensors 282.4.5. Sensors of Calcium-Calmodulin 302.4.6. Sensors of Other Second Messengers 30
ix

x CONTENTS
2.4.7. Sensors ofProtein Kinase Activity....................................................... 312.4.8. Sensors ofG proteins 322.4.9. Metabolite Sensors 332.4.10. Sensors of Reduction-Oxidation (Redox) Potentia1............................. 332.4.11. Nitration Sensors 342.4.12. Voltage Sensors 34
2.5. PERSPECTIVE AND FUTURE DIRECTIONS 352.6. ACKNOWLEDGMENTS 352.7. REFERENCES 36
3. FLUORESCENT SACCHARIDE SENSORS 41
Tony D James and Seiji Shinkai
3.1. INTRODUCTION REFERENCES 413.2. READ-OUT 43
3.2.1. Internal Charge Transfer (ICT) 433.2.2. Photoinduced electron transfer (PET) 45
3.2.3. Others 463.3. INTERFACE 47
3.3.1. Internal Charge Transfer (ICT) 473.3.2. Photoinduced electron transfer (PET) 483.3.3. Others 54·
3.4. FLUORESCENT ASSAY 563.5. POLYMER SUPPORTED SENSORS 603.6. CONCLUSIONS 623.7. REFERENCES 62
4. FLUORESCENT PEBBLE NANO-SENSORS AND NANOEXPLORERSFOR REAL-TIME INTRACELLULAR AND BIOMEDICALAPPLICATIONS 69
Hao Xu , Sarah M. Buck, Raoul Kopelman, Martin A. Philbert, Murphy Brasuel, EricMonson, Caleb Behrend, Brian Ross, Alnawaz Rehemtulla, and Yong-Eun Lee Koo
4.1. INTRODUCTION 694.1.1. Background and History 69
4.2. PEBBLE MATRICES: DESIGN, PRODUCTION, AND QUALITYCONTROL 724.2.1. Polyacrylamide PEBBLEs 734.2.2. Poly (decyl methacrylate) PEBBLEs 744.2.3. Polyethylene Glycol-Coated Sol-Gel Silica PEBBLEs 76
4.3. CLASSIFICATION AND CHARACTERIZATION OF PEBBLESENSORS 794.3.1. Ion Sensors 79
CONTENTS xi
4.3.2. Gas Sensors and Biosensors 914.4. PEBBLE SENSORS AND CHEMICAL IMAGING INSIDE LIVE
CELLS 984.4.1. PEBBLE Delivery Methods 984.4.2. Typical Examples of Biological Applications of PEBBLE
Nanosensors 1004.5. ADVANTAGES AND LIMITATIONS OF PEBBLE SENSORS 1054.6. NEW PEBBLE DESIGNS AND FUTURE DIRECTIONS 111
4.6.1. Free Radical Sensors 1114.6.2. MOONs, Tweezers, and Targeting 1124.6.3. Nano-explorers and Nano-actuators 120
4.7. ACKNOWLEDGMENTS 1224.8. REFERENCES 123
5. APTAMERS AS EMERGING PROBES FOR MACROMOLECULARSENSING 127
Eun Jeong Cho, Manjula Rajendran, and Andrew D. Ellington
5.1. INTRODUCTION 1275.2. IN VITRO SELECTION 1275.3. ADAPTATION OF APTAMERS AS SIGNALING TRANSDUCTION
REAGENTS FOR MACROMOLECULAR SENSING 1295.3.1. Signaling Aptamers Based on Fluorescence Intensity Changes 1305.3.2. Aptamer Beacons Based on Fluorescence Resonance Energy
Transfer 1345.3.3. Signaling Aptamers Based on Fluorescence Anisotropy Changes 142
5.4. APPLICATION OF APTAMERS TO ARRAY FORMATS 1435.4.1. Aptamer Chips for High-Throughput Screening 1435.4.2. Sample Processing with Microwell-Based Aptamer Arrays 1455.4.3. Chip-Based Detection of Changes in Aptamer Anisotropy 150
5.5. CONCLUSIONS AND FUTURE ASPECTS 1515.6. ACKNOWLEDGMENTS 1515.7. REFERENCES 151
6. MOLECULAR IMPRINTING 157
Petra Turkewitsch, Robert Masse, and William S. Powell
6.1 INTRODUCTION 1576.2 SYNTHESIS AND EVALUATION OF MIPS 160
6.2.1. Components of MIPs 1616.2.2. Preparation of MIPs 1676.2.3 Evaluation of MIPs 171
6.3 DETECTION OF MIP-TARGET INTERACTIONS BYFLUORESCENCE 174

xii CONTENTS
6.3.1 Nonfluorescent MIPs 1746.3.2 Fluorescent MIPs 183
6.4 FLUORESCENT MIP-BASED BIOMIMETIC SENSORS 1976.5 CONCLUSIONS AND FUTURE DIRECTIONS 1986.6 ACKNOWLEDGEMENTS 2006.7 REFERENCES 201
7. EXCIMER SENSING 211
Valentine I. Vullev, Hui Jiang, and Guilford Jones, II
7.1. INTRODUCTION 2117.2. PYRENE EXCIMER AS A SENSORY STRUCTURE PROBE OF THE
ASSOCIATION OF BIOMOLECULES 2127.2.1. Excimers ofPyrene Derivatives on Macromolecular Templates 2127.2.2. Considerations Regarding Pyrene Derivatives as Emission Probes
for Macro-molecules 2157.2.3. Application ofPyrene Fluorescence Probes to Studies of Proteins
and Peptides 2167.2.4. Pyrene-Iabeled DNA Strands Used for Molecular Recognition 2187.2.5. Pyrenyl-containing Lipid Membranes 219
7.3. PYRENE EXCIMER EMISSION IN ENVIRONMENTAL ANDCHEMICAL SENSING 2217.3.1. Sensing of Temperature, Pressure and pH 2217.3.2. Sensing of Oxygen 2247.3.3. Sensing of Organic Guests by Modified y-Cyclodextrins 2257.3.4. Sensing of Metal Cations 2287.3.5. Other Miscellaneous Sensing Systems 235
7.4. CONCLUDING REMARKS 2367.5. ACKNOWLEGEMENT 2367.6. REFERENCES 237
8. LIFETIME BASED SENSORS / SENSING 241
Sonja Draxler
8.1. INTRODUCTION 2418.2. PHOTOPHYSICAL BACKGROUND 242
8.2.1. Luminescence Lifetime 2428.2.2. Quantum Efficiency and Fluorescence Intensity 246
8.3. LIFETIME BASED SENSOR DEVICES AND INSTRUMENTATION 2478.3.1. Optical Chemical Sensors 2478.3.2. Advantages and Drawbacks of Lifetime-Based Sensors 2478.3.3. Transduction Schemes 2488.3.4. Sensor Elements 258
8.4. LIFETIME MEASUREMENT METHODS AND INSTRUMENTATION .. 265

CONTENTS xiii
8.4.1. Time-Domain Methods 2658.4.2. Frequency-Domain Methods 268
8.5. SUMMAR.Y ~ 2728.6. ACKNOWLEDGEMENT 2738.7. REFERENCES 273
COLOR INSERTS 275
INDEX 277


PROTEIN-BASED BIOSENSORS WITHPOLARIZATION TRANSDUCTION
Richard B. Thompson!
1.1. INTRODUCTION
Fluorescence-based biosensors employing biological recognition molecules such asproteins offer unmatched selectivity and sensitivity for real time determination and imagingof analytes such as metal ions. In some cases the analyte can be quantitated by changes influorescence anisotropy (polarization) which offers all the advantages ofclassical ratiometrictechniques, as well as certain optical advantages, especially for microscopy. This chapterintroduces the principles of such sensors and displays some examples of the results whichmay be obtained by their use.
1.2. PRINCIPLES OF OPERATION
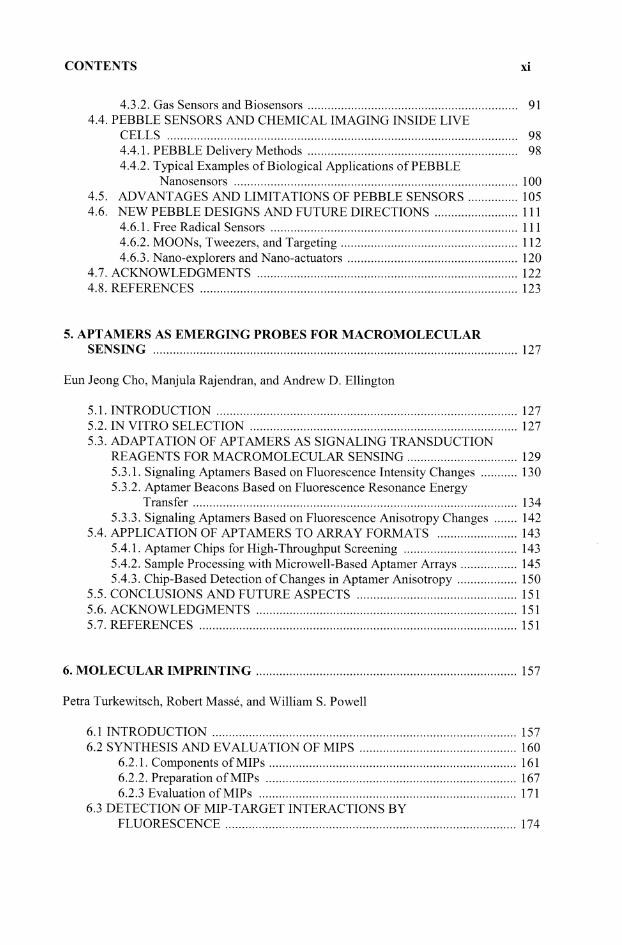
The operating principles of anisotropy-based sensors are fairly straightforward, whichis perhaps unsurprising given the relatively simple physics of fluorescence polarization andits measurement (Joseph R. Lakowicz, 1999). Fluorescence emission may be polarized, thedegree ofwhich can be described quantitatively by the polarization, p, or the anisotropy, r.The polarization and anisotropy are calculated from observed fluorescence intensitiesthrough polarizer(s) oriented parallel (III) and perpendicular (1-1) to the plane ofpolarizationof the excitation Figure 1.1 ):
1 Departlnent of Biochemistry and Molecular Biology, School of Medicine and Center for Fluorescence
Spectroscopy, University of Maryland, Baltimore, Maryland 21201
EMISSION IS
DEPOLARIZED
2
.... SO-
~~~H
3C/
N'CH3
ROTATIONBEFORE
EMISSION ?503
~ "$-~,H3C- N,
CH3
R. B. THOMPSON
Iu - IJ.rE---
III +211
<i, EXCITATION
, POLARIZER
}I5R~~()~~III LpOLARIZERS-' 11
Figure 1.1. Principle of fluorescence anisotropy I polarization.
Anisotropy and polarization are calculated:
r = (III - 1-1) / (III + 2 1-1) = [(III / 1-1) - 1] / [(III / 1-1) + 2] (1)
(2)
The terms "polarization" and "anisotropy" are synonymous in this context and algebraicallyinterconvertibIe, but the theory of polarized fluorescence is much simpler in terms ofanisotropy than polarization, thus we shall employ the former term herein. Note that the termpolarization appears in much of the older literature and currently in the high throughputscreening and clinical immunoassay literature. Polarization of fluorescence is observedwhen fluorophores excited with plane polarized light do not rotationally diffuse significantlybefore emitting. Quantitatively, the degree ofpolarization may be predicted by the PerrinWeber equation:
(3)
where ro is the (excitation wavelength-dependent) limiting anisotropy in the absence ofdiffusion, r is the observed anisotropy, 1" is the fluorescence lifetime, and 8c is the rotationalcorrelation time of the fluorophore, the inverse of the rotational rate. Rigorous treatmentsof the time-resolved decay ofanisotropy, particularly ofnon-symmetrical fluorophores, arebeyond the scope of this article and have been disclosed elsewhere (Joseph R. Lakowicz,1999; Steiner, 1991). The rotational correlation time can be estimated:
(4)
where T is temperature, 11 is viscosity, R is the gas constant, and V is the volume of the

PROTEIN BASED ANISOTROPY BIOSENSORS 3
rotating unit. For more or less spherical macromolecules this can be approximated by thedimensions of the macromolecule, corrected for hydration. Thus a reasonably spherical45,000 Dalton protein might exhibit roughly a 21 nsec rotational correlation time. For mostof the assays it is unnecessary to know 8c' rather one only need know it approximately tochoose a fluorophore with the appropriate lifetime (see below).
To a first approximation, one can thus imagine assaying or detecting an analyte bychanges in fluorescence anisotropy if the analyte somehow changes the rotational rate orlifetime ofthe fluorophore. While the shape and size ofthe fluorophore would appear to beproperties of the molecule and therefore immutable, it is in fact commonplace to attach thefluorophore to a macromolecule and perturb the macromolecule's shape or size to change theanisotropy. Similarly, although the intrinsic lifetime of the fluorophore is a property of themolecule, many means are known for reducing the lifetime by quenching, and they result inmeasurable changes in anisotropy as well. The basic theory ofthe effects ofchanging eitherrotational or apparent lifetimes is presented below. Although fluorescence anisotropy hasbeen used to look at "microviscosity" of lipid bilayers and micelles as a means ofunderstanding their dynamics (Shinitzky & Barenholz, 1978), as well as assessing fetal lungmaturity by the microviscosity of the surfactant, these essentially are studies of the bulkproperties of the fluorophore's surroundings, and not of analytes per se, and will not beconsidered further. Similarly, there are many well-known enzyme assays based onfluorescence polarization, which usually rely on a change in size between substrate andproduct (e.g., protease assays) to provide signal. For the most part, these cannot provide acontinuous readout of the level of the analyte, and also will not be considered further.
1.3. ADVANTAGES OF ANISOTROPY-BASED SENSING
Among fluorescence-based sensing approaches, anisotropy-based sensing has a uniqueportfolio of advantages. First, it is a steady-state (as opposed to a time-resolved)measurement, which requires only simple instrumentation. It can be readily configured inthe "T-format"as a true ratiometric measurement (see Figure 1.1) as described by Webernearly fifty years ago to avoid the no~sy excitation sources then available (Weber,1956)(Equations 1 and 2). The advantages of fluorescence ratiometric measurements arewidely appreciated based on the use ofratiometric calcium and pH indicators. They include(to a first approximation) immunity from fluctuations in the light source, variations inindicator amount due to bleaching or washout (but see Dinely, et aI., for an important caveatregarding indicator amounts) (Dinely, Malaiyandi, & Reynolds, 2002), variations in cellthickness or indicator distribution, and potentially facile calibration in situ (Nuccitelli, 1994).Several groups have constructed fluorescence polarization microscopes (Axelrod, 1989; Dix& Verkman, 1990)including confocal microscopes (Bigelow, Conover, & Foster, 2003)anddemonstrated images with contrast based on variations in fluorescence polarization. Whilepolarization can be measured merely by changing polarizers in a filter wheel apparatus,electrooptic devices offer the prospect of changing polarization at faster than video framerates. An important potential advantage is that polarization requires no change ofexcitation
4 R. B. THOMPSON
or emission wavelength, making it particularly well-suited for laser-excited microscopiessuch as confocal microscopy and multiphoton excitation microscopy. While few reports haveappeared describing multiphoton excited fluorescence anisotropy sensing (Thompson,Maliwal, & Zeng, 2000), this technique could potentially be incorporated into an imagingapplication as well. While filtration to avoid scattered light is important, it is a furtheradvantage that one may use the entire emission band for anisotropy measurements insteadof a narrow band for wavelength ratiometric measurements. Finally, anisotropy-basedsensing offers the possibility (in suitable cases) of an expanded dynamic range (seebelow)(Thompson, Maliwal, & Fierke, 1998).
One of the strengths of anisotropy-based sensing is its simplicity, since relatively fewphenomena perturb the rotational diffusion rate ofa molecule: changes in medium viscosityor temperature, as well as changes in molecular size or shape. It is usually trivial to controlthe temperature and bulk composition of the assay medium, or at least assure they do notchange significantly during the short time of the assay. Similarly, few things can influencethe lifetime of fluorescence, as this is an inherent property of the molecule. The importantexception, as we will see, is fluorescence quenching, but under ordinary conditions mostquenchers must be present at near millimolar concentrations to perturb the anisotropy oftypical fluorophores with nanosecond lifetimes.
1.4. FLUORESCENCE POLARIZATION IMMUNOASSAY
The earliest example ofdetermination ofa chemical analyte by fluorescence anisotropyis the fluorescence polarization immunoassay introduced by Dandliker for antigens that arenot macromolecules (Dandliker, Kelly, Dandliker, Farquhar, & Levin, 1973) In its simplestform this is configured as a competition assay wherein a sample containing an unknownamount ofanalyte is mixed with known amounts ofantibody and a fluorescent-labeled analogof the analyte. The fluorescent-labeled analyte competes with the unlabeled for the bindingsite on the antibody; the bound fluorophores (molecular weight < 1000 Daltons) have theirrotational diffusion substantially reduced by tight association with the relatively massiveantibody (molecular weight of an IgG is c. 150,000 Daltons) Figure 1.2.

PROTEIN BASED ANISOTROPY BIOSENSORS
COMPETITIVE FLUORESCENCE ANISOTROPYIMMUNOASSAY
{@ 0.4
IgG ~>- 0.3G-O0::
0.2FITC t-O(f)
z« 0.1
0.0 '-------f--------J
5
Ko
[Ag]
[FITC-Ag] HELD FIXED
Figure 1.2. Principle of fluorescence polarization itnmunoassay. Antigen (Ag) in the satnple cotnpetes with afixed atnount of fluorescent-labeled antigen (FITC-Ag) to bind to a fixed amount of antibody IgG.
For a label like fluorescein with roughly a four nanosecond lifetime, one can calculate usingEquations 1 and 2 that the free labeled analyte should exhibit an anisotropy ofroughly 0.05and the bound form, 0.36. As the analyte concentration in the sample increases theproportion ofbound fluorescent-labeled analyte decreases, and with it the anisotropy, whichis just the arithmetic sum of the anisotropies of the labeled antigen in each form:
(5)
where robs is the observed anisotropy; rf and rb are the anisotropies of the free and boundforms, respectively; and ff and fb are the fractions of fluorophore free and bound. If theapparent quantum yield changes upon binding, a small correction is necessary (Joseph R.Lakowicz, 1999).
The results ofsuch an immunoassay are depicted in Figure 1. 3. Evidently such analytescan be quantified by fluorescence polarization immunoassay at the micromolar level andbelow with good accuracy, if a fluorescent analog of the antigen can be made with similaraffinity for the antibody. This technique is still in wide clinical use, particularly for analysisof drugs of abuse in urine specimens. The advantages of such immunoassays are that theyare much faster than ELISA'a or RIA's because washing is unnecessary, that the sameinstrument can be used for a variety of analytes (if the fluorophores are spectrally similar),calibration is straightforward, and for analytes such as drugs of abuse it is difficult toadulterate specimens to produce a false negative. An important advantage is that no

6 R. B. THOMPSON
modification or purification ofthe antibody is necessary, such that even antisera can be used,with significant cost savings.
POLARIZATION (mP)190
180
170
160
150
140
130
120
110
100
90
80
70
60
50 +--~.----...--.---y-...,
012345678
GENTAMICIN CONCENTRATION (mg/L)
Figure 1.3. Fluorescence polarization itmnunoassay results for gentamicin; reproduced with petmission [rotn(Jolley et aI., 1981).
Until recently, such immunoassays were unsuited for macromolecule antigens becausethe ratios of rotational correlation time to lifetime for free vs. bound antigen were notsignificantly different for typical nanosecond fluorophores see Figure 1.4. The figuredepicts the expected anisotropies for a macromolecule antigen (serum albumin in thisexample, molecular weight 65,000) in the free form and bound to a high molecular weightantibody such as an IgM (molecular weight about one million) for two different labellifetimes. Ifthe label lifetime is relatively short ( 4 nsec), the long rotational correlation timeof the labeled antigen differs little in the free and antibody-bound states (0.02); however, ifthe label lifetime is longer (400 nsec), the anisotropy difference between free and bound islarge enough (0.165) to be really useful. Evidently the anisotropy change will be significantonly if the label lifetime is upwards of 100 nanoseconds. Fortunately, the Lakowicz group(Guo, Castellano, Li, & Lakowicz, 1998; Terpetschnig, Szmacinski, & Lakowicz, 1995)introduced the use of long-lived metal to ligand charge transfer (MLCT) probes toimmunoassay, many ofwhich have lifetimes approaching one microsecond. With such labelsdetermination of macromolecule antigens can be done by fluorescence anisotropyimmunoassay; the results of such an assay are depicted in Figure 1.5

PROTEIN BASED ANISOTROPY BIOSENSORS
0.30
T =4 ns 4000sI
>-
~(~)Q.
0 t0:::
{)l- 0.150(/)
Z<i
Ar=0.165
MW==65 000 I MW=1-10'0
10 3 10 4 105 106 107
MW (Daltons)
7
Figure 1.4. Silnulated anisotropy as a function of tnolecular weight for two different fluorescence lifetimes: witha 4 nsec lifetime HSA exhibits a 0.02 anisotropy change upon binding to IgM; with a 400 nsec lifetime it exhibitsa 0.165 change. Reproduced with pennission frotn (Terpetschnig et aI., 1995).
In this assay a solution ofserum albumin labeled with a long lifetime (average lifetime in air= 2.75 microseconds) Re (I) complex is mixed with an anti-serum albumin IgG (mol. wt150,000 Daltons), and challenged with samples containing varying concentrations ofunlabeled serum albumin. The unlabeled antigen competes with the labeled antigen,effectively displacing it from the IgG, and resulting in an increasing proportion ofthe labeledantigen exhibiting the reduced rotational correlation time of the free form. The longerlifetime ofthis label and the smaller size ofthe IgG compared with the IgM in the simulation(Figure 1.4) results in reduced anisotropies ofboth forms, and more particularly a reduceddifference (0.04) in the anisotropy between free and bound. Nevertheless, the difference inanisotropy is certainly usable, and these results indicate what the technique is capable of. .

8 R. B. THOMPSON
[Re(bcp)(CO),(4rCOOHPy)}-HSA (2.5 \1M )... Anti-HSA ( 4.5 J.IM )
Ex.= 400 nm, Em.= 550 nm, 20°C
0.08----------------,
0.07
~ 0.06
~In
~ 0.05
0.04
2.01.51.0
[HSA}().LM)0.5
0.03 -I--....----r---....---.,---~-..--.,.-----10.0
Figure 1.5. Fluorescence polarization immunoassay using a long-lived fluorescent label. Reproduced withpennission froln (Guo et aI., 1998)
For applications requiring continuous measurements such immunoassays are notveryuseful, for two reasons. First, the fluorescent labeled analyte must be free to diffuse awayfrom its binding site and diffuse rotationally. This makes it difficult to use in a continuousmode because ofthe risk of the small molecule diffusing away when the probe is exposed tothe analyte. Also troublesome are the very slow dissociation rate constants of typicalantibodies for their cognate antigens. The very slow offrate means that the binding reactionis often effectively irreversible. For instance, an antibody might have an affinity (Kd) for itscognate antigen ofone picomolar (10-12 molar); the Kdis merely the ratio ofassociation anddissociation rate constants for the antigen binding reaction. For a small molecule antigen(hapten) the association rate constant might be 107 to 108 M- 1 sec-1 (nearly diffusioncontrolled) whereas for a macromolecule antigen, it might be 100-fold slower (105 M-1 sec-I).Thus the dissociation rate constant in the former case would be 10-4 to 10-5 sec-I, and for themacromolecule 10-7 sec-I. The half-time of these antibody:antigen complexes is then just0.693/kdissoc , or 1.9 to 19 hours for the hapten, and more than eleven weeks for themacromolecule antigen. One example exists of a recognition protein in a biosensor(carbonic anhydrase) being engineered to obtain more rapid association and dissociationconstants to improve response times (Huang, Lesburg, Kiefer, Fierke, & Christianson, 1996),but to date we know of no antibody which has been molecularly engineered to improvebinding kinetics.

PROTEIN BASED ANISOTROPY BIOSENSORS
1.5. ANISOTROPY-BASED METAL ION BIOSENSING
9
In general, it would appear difficult to detennine the concentrations ofmost metal ionsin solution by fluorescence anisotropy, since most metal ions of interest are not evenphotoluminescent in solution, and it clearly is difficult to raise antibodies to, for instance, freezinc or copper ions (but see (Darwish & Blake, 2002)). Fortunately, many metal ions canserve as quenchers by various mechanisms, and consequently can be made to report theirpresence by changes in fluorescence intensity (Fernandez-Gutierrez & Munoz de la Pena,1985; White & Argauer, 1970), and in some cases, lifetime and anisotropy. For manyclassical metallofluorescent indicators such as hydroxyquinolines, interactionwith metal ionsmay result in increases in quantum yield and lifetime (Szmacinski & Lakowicz, 1994).However, the lifetime ofthe indicator with either metal bound or in the absence ofmetal willtypically be in the nanosecond range whereas its rotational correlation time is likely to be lessthan 100 psec, such that there is a negligible difference in anisotropy between the free andbound fonns. Similarly, metallofluorescent indicators that detect analyte by collisionalquenching exhibit decreased fluorescence lifetimes as well, but again the decline results ina negligible change in anisotropy for the same reason. Note that using an indicator with avery short lifetime confers no advantage because only very high concentrations ofquencherare able to diffuse to and quench the indicator during its brieflifetime. Indicators which fonna complex with the analyte are much more sensitive (Grynkiewicz, Poenie, & Tsien, 1985),but indicators of this sort which are quenched typically are completely quenched by theligand, and consequently the bound fonn does not contribute to the emission.
We found that the issue ofthe rapid rotation of the fluorophore compared to its lifetimecould be dealt with by attaching it to a macromolecule; moreover, the macromolecule couldbe chosen to bind particular metal ions with unmatched affinity and selectivity (Fierke &Thompson, 2001), and by judicious choice of the fluorophore, to provide high sensitivity,and even an enhanced dynamic range.

10 R. B. THOMPSON
ANISOTROPY -BASED METAL ION SENSING
SCHEME I
APO-CA HOLO-CAZn 2 +
~ nn.HNo,s-@-8In'· U
+
H,NO,S-©--SNO METAL, FLUOR NOT BOUND
ec OF FLUOR « 7;
LOW ANISOTROPY
FLUOR BINDING IS METAL-DEPENDENT
FLUOR HAS Sc OF HOLO-CA
Sc> T
HIGH ANISOTROPY
Figure 1.6. Schematic of zinc binding assay by fluorescence anisotropy. Binding of zinc prOlTIotes binding of afluorescent aryl sulfonalnide to the protein, increasing its rotational correlation tilne and anisotropy.
We have devised two methods for determining metal ions by fluorescence anisotropy.The first is based on metal-dependent binding ofa fluorescent ligand to a protein, changingits rotational correlation time, the second by having the metal ion change the fluorescencelifetime of a fluorescent labeled protein. One can imagine elaborating either method toligands other than metal ions. The first method takes advantage of the fact that arylsulfonamide inhibitors ofcarbonic anhydrase exhibit much higher affinity for the protein inthe zinc-containing holo form than the metal-free apo form. This is unsurprising inasmuchas much ofthe binding free energy comes from the (weakly acidic) aryl sulfonamide bindingto the active site zinc ion as a fourth ligand, in the form of the sulfonamide anion (Maren,1977). Thus in the presence of zinc dansylamide binds relatively tightly (Kd ",0.8 uM) toholo carbonic anhydrase, but does not bind measurably to the apoprotein (Chen & Kernohan,1967; Thompson & Jones, 1993). By binding to the protein the rotational diffusion of thefluorescent aryl sulfonamide is reduced and its anisotropy increases Figure 1.6.
Because the increase in rotational correlation time can be substantial (e.g., from perhaps100 psec for a 500 Dalton inhibitor to 15 nsec for its complex with 30,000 Dalton protein),the increase in anisotropy can be dramatic: an example is shown for the sulfonamide BTCSFigure 1.7. In this case the fluorophore exhibits nearly a five-fold increase in its anisotropyupon binding, resulting in an anisotropy increase of 0.20. In terms of polarization this is0.27, or 270 mP (a nomenclature used in describing polarization immunoassays). This is asubstantial change, indicating that the assay can be very accurate. The detection limit

PROTEIN BASED ANISOTROPY BIOSENSORS 11
achieved for free zinc concentration in this example is a few picomolar, much better than hasbeen achieved with small molecule indicators (Kimura & Aoki, 2001; Thompson et al., 2002;Walkup, Burdette, Lippard, & Tsien, 2000).
0.26
~~ 0.22
~~ 0.18
w~ 0.14wUVI~ 0.10o::::>
~ 0.06
arcs capo CAnEXC.460nmEM. 504 om30·C
-13 -12 -11 -10
Log [zn21 , MOLAR
-9
Figure 1.7. Zinc-dependent anisotropy of BTCS (benzothiazolyl coumarin sulfonaInide) in the presence ofapocarbonic anhydrase without (open circles) and with DOPC:Cholesterol unilalnmelar vesicles. Reproduced from(Thompson et aI., 2000) with permission.
In some sense this approach has the defects of its virtues: of the metal ions which bindto the active site only Zn strongly promotes the binding of sulfonamides, which makes theassay quite specific. Cobalt(II) is much less effective in this regard (Sven Lindskog &Thorslund, 1968) and generally quenches most fluorophores, making it inaccessible for thistype ofassay. Other metals which bind to the protein do not promote sulfonamide binding,and cannot be measured by this approach; consequently, it is very specific for zinc.. Anotherissue is that several of the fluorescent aryl sulfonamides we and others (Chen & Kernohan,1967) have developed for carbonic anhydrase-based Zn sensing exhibit large increases intheir fluorescence lifetimes upon binding to the protein, which largely offset the increases inrotational correlation time, and therefore lead to only modest increases in anisotropy. ThusDapoxyl sulfonamide exhibits a nearly twenty-fold increase in quantum yield and lifetime,which more than offsets the increase in rotational correlation time, leading to a negligiblechange in anisotropy. For best results the fluorescent sulfonamide should have only a smallchange in lifetime accompanying binding.
Some fluorescent aryl sulfonamides exhibit a substantial shift in their excitation oremission wavelengths, which allows the dynamic range ofthe assay to be expanded by choiceof wavelength excited or observed (Thompson, Maliwal, & Fierke, 1998). Thus thesulfonamide ABD-M exhibits a sixty nanometer blue shift in its emission upon binding to theprotein, enabling one to selectively observe the emission ofa small proportion of the boundfonn in the presence of a large excess of the free fonn by looking on the blue side of the

12 R. B. THOMPSON
emission, and vice versa. Therefore the range of ana1yte concentration which can bedetermined with a given level of accuracy may be adjusted by choice of excitation oremission wavelength. In the example illustrated Figure 1.8, free zinc concentrations rangingfrom 0.003 to 0.3 nM may be quantitated by observing emission at 450 nm, whereasconcentrations from 0.2 to 3.0 nMmay be accurately quantitated at emission wavelength 590nm. This is an advantage anisotropy-based sensing shares with lifetime-based sensing(Szmacinski & Lakowicz, 1993; Thompson & Patchan, 1995) which does not obtain withwave1ength-ratiometric determinations.
apo HCAII +ABD-M
0.30 pH 7.0 MOPS/NTA
A.xc =390nm>a..
~o~ 0.20<t:
wuzw
~ 0.10
~0.0 L-..L.....l-...L..J...l.,;L.l.10.L01--1-....l-L.-1....U-.Ll0.L-.l--L.~~~1.0---'-~ ...............-:-;:10
( Z n 2+] , NANOMOLAR
Figure 1.8. Zinc-dependent fluorescence anisotropies of apo-carbonic anhydrase plus ABD-N observed atdifferent emission wavelengths. Reproduced from (Tholnpson, Maliwal, & Fierke, I998)with pennission.
One of the drawbacks of this particular approach is the difficulty of configuring theseassays as sensors: e.g., capable ofbeing inserted into a solution and continuously measuringthe ana1yte. The issue arises in that the aryl sulfonamide and zinc ion must both be free todiffuse to and from their respective binding sites on the protein, but the zinc ion must comefrom the aqueous matrix in which the transducer is inserted. The problem is that whereas theana1yte may diffuse into and out ofthe transducer vicinity, the sulfonamide may do the samething, with irretrievable loss (Thompson & Jones, 1993). While ionophores capable ofselectively transporting the zinc ion through membranes are known (Ammann, 1986), the ionflux through these membranes in the absence of an applied potential is modest. Attachingthe sulfonamide to a macromolecule to co-entrap it within a dialysis membrane perforcereduces its rotational diffusion and increases its anisotropy, reducing or eliminating theanisotropy change upon binding to the protein.
A related approach which does not use a separate, diffusible molecule takes advantageof the fact that ana1yte-induced quenching of a fluorophore may reduce its lifetime, andthereby increase its anisotropy. If the fluorophore is attached to a macromolecule (whichmay also selectively bind to the ana1yte, for instance), the rotational correlation time of themacromolecule may more closely match the (nanosecond) lifetime of the fluorophore,resulting in a sizable change in anisotropy upon binding of the ana1yte (and quenching).Figure 1.9.

PROTEIN BASED ANISOTROPY BIOSENSORS
ANISOTROPY - BASED SENSING
13
SCHEME mAPO-CA
Co"
(( '>..'y Co
A (ALSO Cu,Ni)
~
FLUOR COVALENTLY
ATTACHED, ROTATES
INDEPENDENTLY OF CA
SO 8 c « T
Co 2+ NOT BOUND, NO
ENERGY TRANSFER
LOW ANISOTROPY
Co-CA
noY~~ENERGY~ . TRANSFER
~
METAL BINDS t CREATES
COLORED COMPLEX;
ENERGY TRANSFER
OCCURS, DECREASES
LIFETIME. Sc ::::: 't
HIGH ANISOTROPY
Figure 1.9. Principle of anisotropy-based sensing of tnetal ions employing quenching by the tnetal ion.
It is important that the quenching of the label emission not be quantitative; e.g., there mustbe some emission from the bound form or no change in the anisotropy will be observed. Itis convenient that the quenching in these cases is by Forster energy transfer (Forster, 1948),which is a through-space interaction. For instance, when Co, Cu, or Ni bind to apocarbonicanhydrase, they exhibit weak d-d absorption bands in the visible and near-IR which can serveas energy transfer acceptors for fluorophores whose emission overlaps the absorption (S.Lindskog et aI., 1971). Using the theory of Forster transfer, we can predict the change inlifetime of the fluorophore upon binding of the metal ion based on the known absorbance ofthe metal ion in the bound state and the position of the fluorescent label with respect to themetal center, and thus the anisotropy response of a sensor transducer given the (known)rotational correlation time (Thompson, Maliwal, Feliccia, Fierke, & McCall, 1998). Theresults of such a prediction using carbonic anhydrase are shown in Figure 1.10. Evidently,very usable changes in anisotropy can be expected for a properly positioned fluorescent label(which may be accomplished by site-selective mutagenesis of the protein and selectivelabeling (Thompson, Ge, Patchan, & Fierke, 1996) with the right lifetime (in comparison tothe rotational correlation time ofthe protein). We note that there is a tradeoff in response ofthe system due to efficient quenching: greater quenching efficiency upon analyte bindingreduces the lifetime more and increases the change in anisotropy, but also the relativecontribution ofthe bound form to the total emission decreases. A happy medium is about 75% quenching, which in this case results in a 55 % increase in anisotropy, and which iscontrolled by the positioning of the label with respect to the metal center.

14
0.25
-r.- "r -15 nsec
QYr - 1.0
ro =0.4
¢c - 15nsec
r - 0.2
R. B. THOMPSON
-1.5 -1.0 -0.5 0.0 0.5
log ( [M") /K~)
Figure 1.10. Simulated metal-dependent anisotropy ofa 30 kD protein when binding of the tnetal results in 25%(+), 50 % (circles), 75% (triangles), or 90% (squares) decline in the lifetitne of a 15 nsec lifetitne label.Reproduced from (Thompson, Maliwal, Feliccia et aI., 1998)with permission.
This approach works very well in practice, as illustrated in Figure 1.11, which illustratesthe anisotropy response ofa fluorescent-labeled apocarbonic anhydrase to a series ofmetalions. The substantial changes in anisotropy indicate that the assay can be quite accurate. Inthis case the quenching of the fluorophore does not take place by energy transfer alone, asCd and Zn do not exhibit d-d absorbance bands upon binding to the protein, but thequenching need only be partial and reduce the lifetime, it need not be by any particularmechanism. It is worthwhile noting that the selectivity and sensitivity ofthis sensor remainsto be matched by any other (non-carbonic anhydrase-based) sensor.
0.23
• 0.22<>
-13
apo-CAn-N67C -ABO (T)
EXC.430nm EM.550nm
-10 -9 -8LOG [M2+] MOLAR
0.22
0.20
Figure 1.11. Cu- (open diatnonds), Zn- (filled diatTIonds), Cd- (open circles), Ni- (triangles), and Co-dependent(filled circles) fluorescence anisotropies of apo-N67C-ABD-T. Reproduced froln (Thompson, Maliwal, Feliccia
et aI., 1998) with pennission.

PROTEIN BASED ANISOTROPY BIOSENSORS 15
It is also worth noting that the sensitivity and dynamic range of this (and otheranisotropy-based approaches) is in part limited by the precision a~d accuracy with whichanisotropy can itselfbe measured. For research-grade fluorometers and some microwell platereaders, accuracy and precision are usually within ± 0.002. However, others have builtinstruments with much better precision and accuracy, and there seems no ab initio reasonwhy the precision and accuracy of other instruments cannot be much better, particularly tformat instruments (WebeL 1956) or those using semiconductor sources and detectors.
Finally, we note that these approaches need not be limited to metal ions as analytes,although this has been the focus ofour own interest. Thus the sulfonamide approach outlinedabove in Figure 1.6 does not require the presence of a sulfonamide and is not necessarilylimited to zinc or another metal, it only requires that the analyte' s binding promote (orreduce) the binding of a fluorescent ligand to the macromolecule (which need not be aprotein). Many examples of this are known or can be constructed (Kolb & Weber, 1975).Similarly, the second approach outlined in Figure 1.9 does not require that the analyte be ametal or (evidently) quench by energy transfer. Energy transfer has the virtues of having apredictable, controllable response which is straightforward to engineer. Rather, the analyte(or a competitor in a competitive assay) need only partially quench the label on themacromolecule by binding to it. As interest grows in real time determination ofa variety ofanalytes, particularly in imaging their concentrations within cells, the usefulness of theseapproaches will become more and more apparent.
1.6. ANISOTROPY-BASED SENSING OF OTHER ANALYTES USING PROTEINSAS TRANSDUCERS
The Lakowicz group has introduced enzymes and other proteins as anisotropy-basedtransducers for analytes other than metal ions, and developed a very clever approach thattransduces the analyte level as a change in the observed fluorescence polarization ofa devicethat occurs without a change in rotational diffusion or lifetime(J. R. Lakowicz et aI., 1999).This approach effectively transduces an intensity change caused by the analyte to afluorescent-labeled protein as a change in polarization by admixture ofthe emission from theprotein with emission from a physically separate reference fluorophore having much higheranisotropy. The reference fluorophore is typified by an oblong fluorophore like Hoechst33342 being entrapped in a polymer film which is stretched to orient the fluorophores, andwhich exhibits a polarization approaching 1.0. As the relative contribution of thefluorescence due to the analyte increases, the apparent net polarization declines. This is aneffective approach, demonstrated using an iodo-anilinonaphthalene sulfonate-labeled variantof a glucose/galactose-binding protein (ANS-Q28C GGBP) isolated from E. coli todetermine glucose: saturation with 6 uM glucose resulted in a 25 % decline in intensity in theANS fluorescence, which induced a 0.15 increase in polarization. The value ofthis approachis that many examples ofanalytes or ligands inducing changes in fluorescent intensity of(forinstance) labeled macromolecules are known, which could be converted to polarization basedindicators by this method. In this sense it is akin to other external reference methods using

16 R. B. THOMPSON
separate fluorophores emitting (or being excited at) different wavelengths. The drawbackin these approaches is that when the reference fluorophore is not the same molecule as thetransducing fluorophore (as it is in classical ratiometric indicators or the quenching-basedanisotropy indicators described above), assorted influences such as bleaching, precipitation,or pH may affect the emission of the one and not the other, defeating the purpose. Most ofthese influences canbe curtailed in macroscopic (cuvette-sized) embodiments, but this wouldappear harder to arrange in microscopic specimens.
This group has used a similar approach but with a different binding protein, lactatedehydrogenase noncovalently labeled with ANS, to measure lactate in the 0 to 240 uM range(normal clinical values are 1.0 to 1.8 mM). In this case saturation with lactate results in a40% decrease in intensity (D'Auria, Gryczynski, Gryczynski, Rossi, & Lakowicz, 2000) .Noteworthy in this paper was the very simple apparatus they used to measure the apparentpolarization ofthe sample essentially using a rotating polarizer to balance (null) the apparentintensity of the sample and a reference chamber containing the same labeled proteinunexposed to lactate. This same nulling approach can even be performed by eye, withsurprising accuracy. This improvement avoids the issue of the reference fluorophorebehaving differentially to physical influences. More recently, the Lakowicz group usedapoglucose dehydrogenase from a thermophilic organism with noncovalently bound ANS ina similar approach to measure glucose concentrations in the clinically relevant range(D'Auria, Cesare et aI., 2000).
1.7. CONCLUSIONS
Based on the few results presented above, the field of anisotropy-based biosensorsincorporating proteins as recognition molecules is obviously in its infancy. Yet the approachwould appear promising, particularly for studies in cell biology where, in an approach akinto that which has proved so successful for calcium, one would wish to know the spatial andtemporal distribution of an analyte within the cell. Powerful approaches have beendeveloped for delivering to or expressing protein biosensors in various compartments ofthecell (Schwarze, Ho, Vocero-Akbani, & Dowdy, 1999; Zelphati et aI., 2001), so this no longerrepresents a barrier (R. Bozym and R. Thompson, unpublished results). A key issue for thisclass of sensors remains, however. While Hellinga has recently shown that binding proteinsfor small molecule analytes can be constructed almost at will(Looger, Dwyer, Smith, &Hellinga, 2003), the ability to design or modify the recognition molecule such that somenearby fluorescent label undergoes a usable change in its emission upon binding somearbitrary analyte remains beyond the state of the art. For spectroscopically active analytessuch as certain metal ions, this is straightforward (see above); for the majority of smallmolecule analytes ofbiomedical interest which lack spectroscopic "handles", it is far fromeasy. The most universal approach has been the use ofcovalent and non-covalent derivativesof "solvent-sensitive" fluorophores such as the ANS family (Godwin & Berg, 1996; J. R.Lakowicz et aI., 1999; Li & Cass, 1991; Marvin & Hellinga, 1998; Thompson & Jones,