Topic 4 Temperature, Atmospheric Circulation and Climate€¦ · · 2017-10-0210/2/2017 1 Topic 4...
31
10/2/2017 1 Topic 4 Temperature, Atmospheric Circulation and Climate 1 Temperature Concepts and Measurement Temp. is a measure of kinetic energy Avg. energy of motion of molecules Heat is the transfer/flow of energy Three standard scales of measurement 2 Thermometer and Instrument Shelter 3
Transcript of Topic 4 Temperature, Atmospheric Circulation and Climate€¦ · · 2017-10-0210/2/2017 1 Topic 4...

10/2/2017
1
Topic 4
Temperature, Atmospheric
Circulation and Climate
Local Winds
Ocean Currents
Weather and Climate
Climate Classification
Climographs
Temperature Controls
Global Temp. Patterns
Atmospheric Circulation
Primary High and Low
Pressure Areas
Global Circulation Model
Chapters 5, 6, & 10
1
Temperature Concepts
and MeasurementTemp. is a measure of kinetic energy
Avg. energy of motion of molecules
Heat is the transfer/flow of energy
Three standard scales of measurement
2
Thermometer and Instrument Shelter
3

10/2/2017
2
Principal Temperature Controls
4
Importance of Temperature
Temperature is a major component of
climate which impacts:
landform processes
vegetation
soil development
economic development
patterns of human activity - culture
5
Latitude
Determines intensity and
duration of insolation.
Most important factor
influencing mean annual and
mean monthly temperature.
6

10/2/2017
3
Altitude/Elevation
Figure 5.5
Concepcion
490 m
La Paz
4103 m
As elevation ↑, density of atm. ↓ and reduces ability to absorb or reradiate heat 7
Cloud CoverLess insolation = lower daytime temp
Increased counter radiation = higher nighttime temps
8
Land-Water Heating Differences
Result of four (not five) major differences
between physical properties of land and water:
1. evaporation
2. transparency
3. specific heat
4. circulation
Note: in the book circulation is divided into movement and ocean currents
and sea surface temperatures
9

10/2/2017
4
L vs. W: Evaporation
• Moderates temps over water
• Much more Q used for LE during day
• Less Q for H
• Condensation releases Q at night
10
L vs. W: Transparency
Land is opaque
SW used to heat surface only
Rapidly reradiates LW
Water is nearly transparent
SW transmitted to depth
Greater opportunity for absorption11
L vs. W: Specific Heat
Specific heat of water 4x greater than land
Water heats slower, and losses it's heat energy slower
Stores a much greater quantity of heat energy
12

10/2/2017
5
L vs. W: Circulation
Vertical mixing redistributes heat
energy and increases storage capacity
Horizontal motion redistributes Q to
higher latitudes13
Land-Water Heating Differences
14
Continental vs. Marine Climates
15

10/2/2017
6
Maritime
and
Continental
Locations
in Canada
16
Global Temperature Patterns
To summarize: temperature patterns can be
explained by primary temperatures controls:
1. Latitude
2. Elevation
3. Cloud Cover
4. Proximity to Water (L vs. W differences)
17
Global Mean Temperatures: January
Figure 5.13Copyright © 2013 Pearson Canada Inc.
18

10/2/2017
7
Bending of Continental Isotherms
January:
equatorward
July:
poleward
Figure 5.13
Copyright © 2013 Pearson Canada Inc.
Copyright © 2013 Pearson Canada Inc.
Figure 5.16
19
Figure 5.16Copyright © 2013 Pearson Canada Inc.
Global Mean Temperatures: July
20
Annual Temperature Range
21

10/2/2017
8
Apparent
Temperature
Wind Chill
Increased cold due to wind speed
More discomfort with high wind and high humidity
Humidex
Increased heat due to higher humidity
More discomfort with high humidity and low wind
22
Wind Chill Temperature Index
23
Humidex
24

10/2/2017
9
Atmospheric Circulation (chapter 6)
Basic element of atmospheric circulation is
wind
Primary Circulation = global
Secondary Circulation = regional
Tertiary Circulation = local
Redistributes heat energy
Causes oceanic circulation25
Wind Essentials
Wind defined by:
- Speed, as measured
with an anemometer
- Direction of origin, as
indicated by wind vane
26
Driving Forces
Force of Gravity
Pressure Gradient Force
Coriolis Force
Friction Force
27
10/2/2017
10
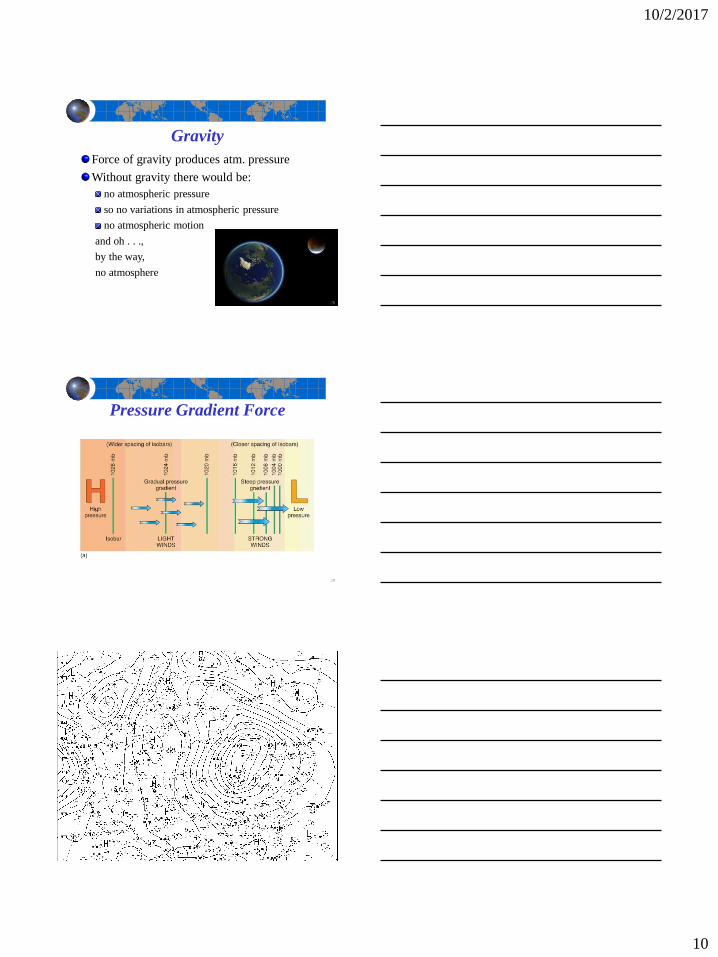
Gravity
Force of gravity produces atm. pressure
Without gravity there would be:
no atmospheric pressure
so no variations in atmospheric pressure
no atmospheric motion
and oh . . .,
by the way,
no atmosphere
28
Pressure Gradient Force
29
30

10/2/2017
11
Primary High- & Low-Pressure Areas
Figure 6.9a Copyright © 2013 Pearson Canada Inc.
31
Figure 6.9b Copyright © 2013 Pearson Canada Inc.
Primary High- & Low-Pressure Areas
32
Descending and Ascending Air
Areas of high pressure: air descends (hence, higher pressure) and
diverges at Earth's surface
Areas of low pressure: air ascends (so lower surface pressure) and is
replaced by converging flow (inflow) 33
10/2/2017
12
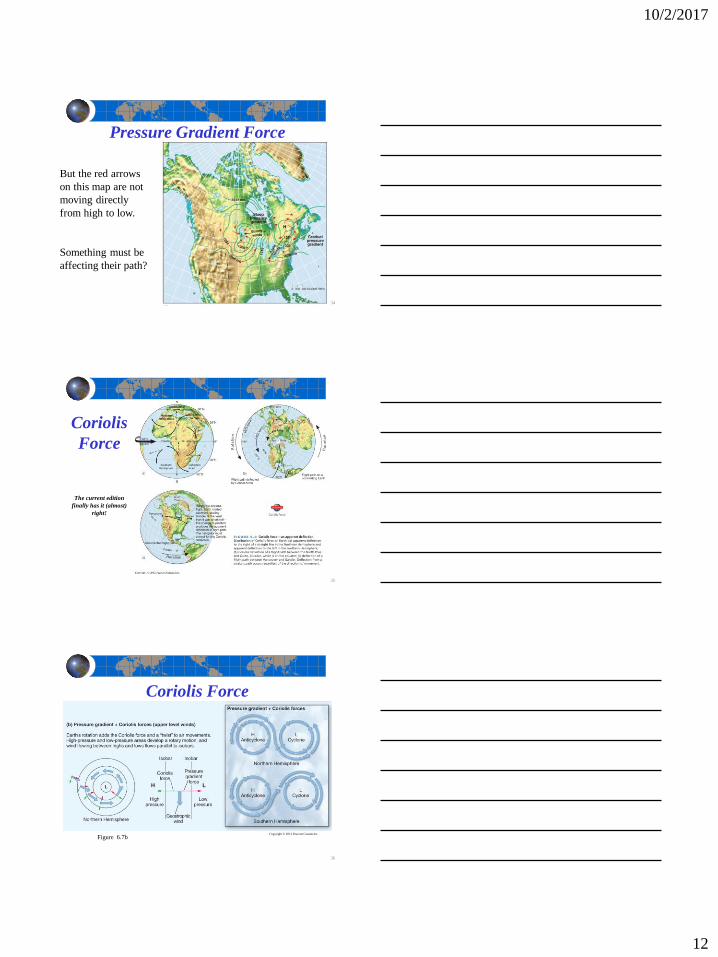
Pressure Gradient Force
But the red arrows
on this map are not
moving directly
from high to low.
Something must be
affecting their path?
34
Coriolis
Force
The current edition
finally has it (almost)
right!
35
Coriolis Force
Figure 6.7b Copyright © 2013 Pearson Canada Inc.
36

10/2/2017
13
Friction Force
Figure 6.7c Copyright © 2013 Pearson Canada Inc.
37
Cyclones and Anticyclones
High Pressure Low Pressure
North
ern
Hemisp
here
Anticyclone
spiral outward
clockwise direction
Cyclone
spiral inward
counterclockwise direction
South
ern
Hemisp
here
Anticyclone
spiral outward
counter-clockwise direction
Cyclone
spiral inward
clockwise direction
38
Up
per
Atm
. C
ircu
lati
on
39

10/2/2017
14
40
Wind Pattern Development
Primary High- & Low-Pressure Areas
Figure 6.9a Copyright © 2013 Pearson Canada Inc.
42

10/2/2017
15
Figure 6.9b Copyright © 2013 Pearson Canada Inc.
Primary High- & Low-Pressure Areas
43
Result of:
differential heating &
moisture characteristics
OR
dynamic forces
Primary High- & Low-Pressure Areas
L
H
H
H
H
L
L
44
45
Generalized Circulation Model
Cross-section of One Hemisphere

10/2/2017
16
Equatorial Low (ITCZ)
Result of differential heating
high sun angle
constant daylength
Warm, moist air, less dense, so rises
Converging, ascending air
Migrates seasonally with thermal equator
Locally calm winds
46
Equatorial Low (ITCZ)
47
Trade WindsSurface flow toward
ITCZ results in
Trades winds
Deflection produces
Northeast trade
winds and southeast
trade winds
Trade winds are
warm and
increasingly moist
lots of latent heat
storage
48

10/2/2017
17
Subtropical High-Pressure
Divergence aloft over
ITCZ results in upper
atm. flow toward
subtropics
Cool air is forced to
descend and warms
adiabatically (due to
increase in pressure)
High pressure results
from descending,
diverging air
mid-latitude deserts
49
50
Generalized Circulation Model
Hadley Cell
Circulation
Atlantic
Sub-Tropical
High
51

10/2/2017
18
Westerlies
Result of surface
flow from subtropical
high toward mid-
latitudes
Deflection produces
prevailing westerly
circulation
52
Polar High and Easterlies
Result of cold dry air
over poles
Descending and
diverging air
Results in a dome of
high pressure
Deflection produces
polar easterlies
53
Subpolar Low
Result of uplift along
polar front
Conflict between
cold dry air and
warm, moist air
Mechanical lifting at
frontal boundary
Results in cool, moist
air54

10/2/2017
19
55
Generalized Circulation Model
Polar Front
Development of Mid-latitude Cyclones
General Atmospheric Circulation Model
Figure 6.11a Copyright © 2013 Pearson Canada Inc.
56
Global Atmospheric Circulation
Model

10/2/2017
20
Upper
Atm
. C
ircu
lati
on
58
Rossby Waves
59
Jet Streams
60

10/2/2017
21
Local Winds
Land-sea breezes
Mountain-valley breezes
Katabatic winds
Chinooks
61
Land
and Sea
Breezes
62
Mountain
Valley
Breezes
63

10/2/2017
22
Monsoonal Winds
64
Chinook Winds
Occur when strong prevailing winds cross a
mountain range
Air is warmed and dried descending the
leeward side
Warm, dry, windy weather with variable
cloudiness
65
Oceanic Currents
66

10/2/2017
23
Thermohaline CirculationThe Deep Currents
67
Weather is:
temperature
precipitation
pressure
humidity
and wind
at a particular place and time
Weather and Climate (chapter 10)
68
Climate: variability of daily and seasonal
weather characteristics averaged over a long
period of time
Weather and Climate (chapter 10)
69

10/2/2017
24
Components of ClimateInsolation
– determined by duration & intensity
Temperature
- Latitude - Altitude - Cloud Cover
- Land-Water Heating Differences:
- Evaporation (LE) - Transparency
- Specific Heat - Circulation
Atm. Circulation
- Primary/Secondary Winds - Ocean Currents
- Semi-Permanent High and Low Pressure Areas
Precipitation
– the W&C course
70
Climate Variability
71
Climate Variability
72

10/2/2017
25
Climate Variability
73
Climate Variability
74
Climate Variability
75

10/2/2017
26
Climate influences the
physical and biotic
environment
Landforms/landscapes
Soil conditions/fertility
Natural vegetation
Wildlife
and in turn is influenced
by the physical and
biotic environment
Weather and Climate (chapter 10)
76
Global Climate Systems
Study of the spatial and temporal patterns of
climate is called climatology
77
Classification of Climatic Regions
Genetic classification
Based on knowledge of causes of climate
Empirical classification
Based on grouping areas with similar climate
data or calculated normals
78

10/2/2017
27
Koppen-Geiger Classification
Criteria include measures of:
mean monthly temperature
mean monthly precipitation
and mean annual precipitation
Does not consider:
winds, temperature extremes, precipitation
intensity, amount of sunshine, cloud cover, or
net radiation
79
General Classification Categories
Six main climatic
regions designated:
A - Tropical
C - Mesothermal
D - Microthermal
E - Polar
H - Highland
B - Dry
80
Classification
Subgroups
Subgroups identified by
second letter indicating
seasonal precipitation
patterns
f - no dry season
m - monsoonal
w - winter dry
s - summer dry
W - arid B climates
K - semiarid B climates
81

10/2/2017
28
Third letter indicates
temperature
characteristics of
subgroups
a hot summers
b warm summers
c cool summers
d very cold winters
h hot B climates
k cold B climates
Classification
Subgroups
82
Exceptions to the above
are:
E climates:
ET polar tundra
EF polar frost
EM polar marine
H climates, which are
not further subdivided
Classification
Subgroups
83
84

10/2/2017
29
Latitude: 49.55N Longitude: 099.57W Altitude: 409m
Temperature (C) J F M A M J J A S O N D
Mean 3.3 C -17 -14 -7 3 11 16 19 18 11 5 -5 -14
Precipitation (mm) J F M A M J J A S O N D
Total 453 mm/yr 18 16 21 35 48 67 72 69 51 22 15 19
Brandon, MB, Canada
Climate Normals 1971-2000
85
86
87
10/2/2017
30
88
89
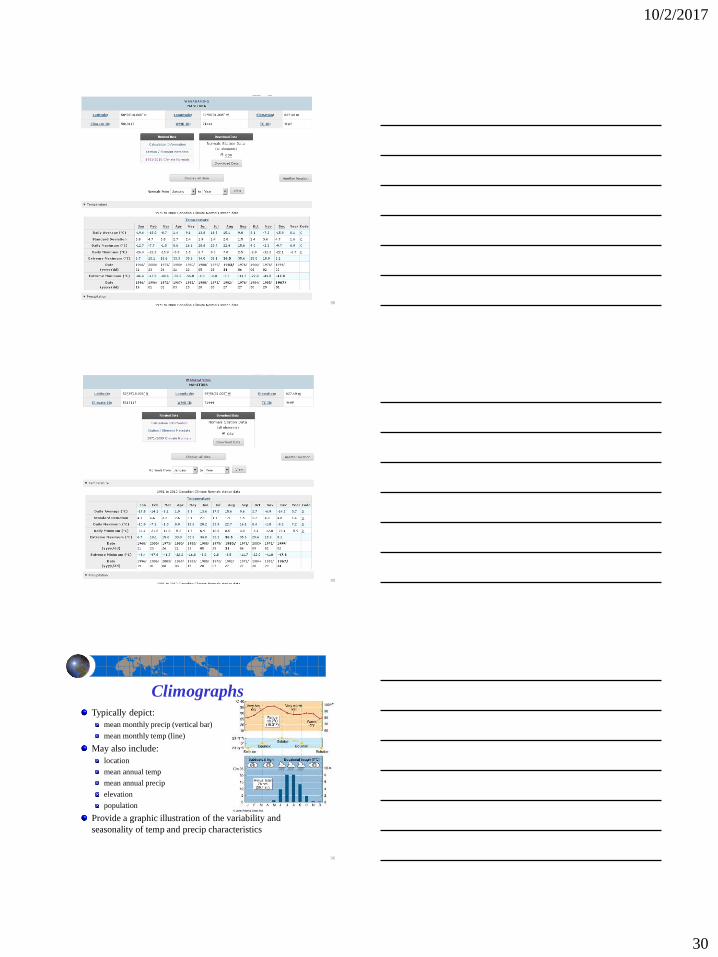
ClimographsTypically depict:
mean monthly precip (vertical bar)
mean monthly temp (line)
May also include:
location
mean annual temp
mean annual precip
elevation
population
Provide a graphic illustration of the variability and
seasonality of temp and precip characteristics
90

10/2/2017
31
91