Top-Consultant.com s Management Consultancy Recruitment ... · Top-Consultant.com’s Management...
28
Top-Consultant.com’s Management Consultancy Recruitment Channel Report 2015
-
Upload
hoangtuong -
Category
Documents
-
view
216 -
download
1
Transcript of Top-Consultant.com s Management Consultancy Recruitment ... · Top-Consultant.com’s Management...
Top-Consultant.com’s Management Consultancy Recruitment Channel Report 2015
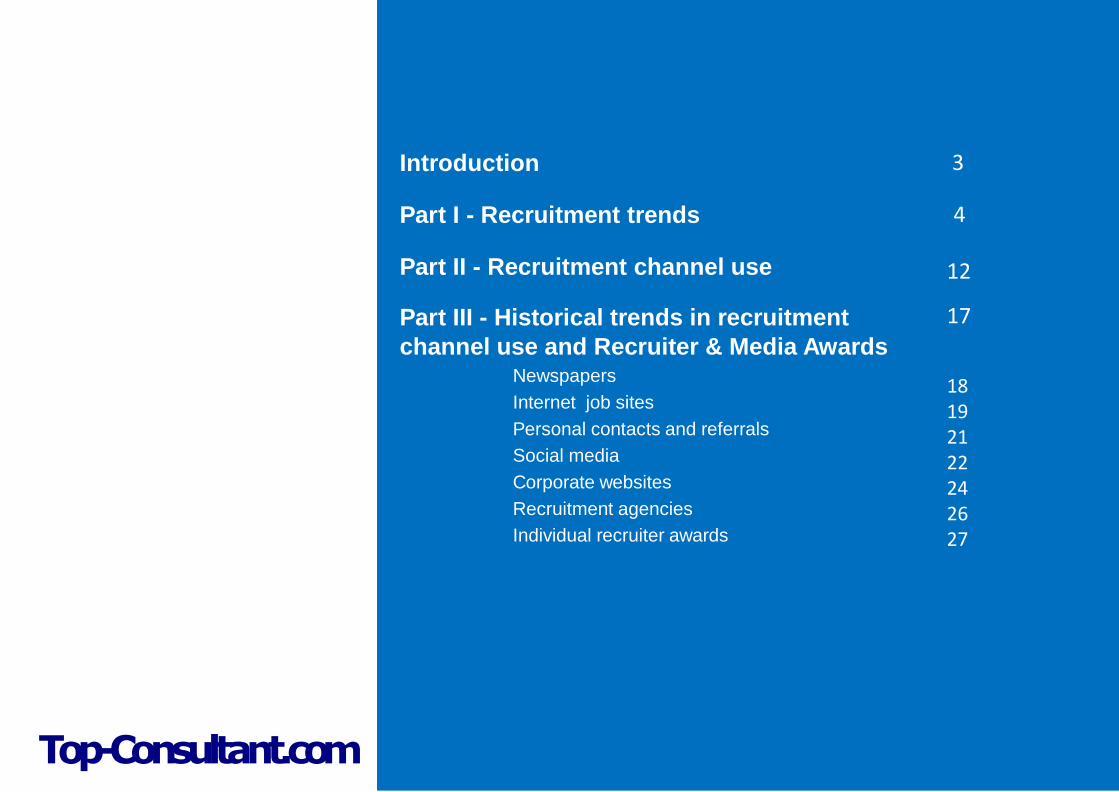
Introduction
Part I - Recruitment trends
Part II - Recruitment channel use
Part III - Historical trends in recruitment
channel use and Recruiter & Media Awards Newspapers
Internet job sites
Personal contacts and referrals
Social media
Corporate websites
Recruitment agencies
Individual recruiter awards
Top-Consultant.com
3
4
17
18 19 21 22 24 26 27
12
INTRODUCTION
Top-Consultant.com Bryan Hickson Managing Director
Top-Consultant.com
This is the 14th year in which we have published
an annual recruitment channel report, detailing the
trends, changes and challenges that the UK
management consultancy recruitment market will
face in the coming year.
Part One of the report is based on responses to a
comprehensive survey of the Top-Consultant.com
consulting recruiter contacts and focuses on
recruitment and retention data and trends within
management consultancy.
With close to 900 responses that we have now
received to these surveys, the recruiter report
has historically proven to be an accurate
predictor for what has gone on to occur
within the management consultancy hiring
market. And it’s been a turbulent 14 years for the
profession with two downturns and two periods of
recovery recorded starkly by the data. The picture
that emerges this year is of an industry that is
looking forward to another year of strong recovery
and growth – an astounding 98% of consulting
employers report that they are looking to hire staff
in 2015 at least as fast as they did last year. And
this following a year in when the MCA report that
consulting may have achieved double digit
growth*.
Parts Two and Three of the report focus on the
channels that candidates use in their job
searches. Also built around a comprehensive
survey, with close to 13,000 responses to our
candidate surveys over the last 14 years, our
readers have predicted and charted their
changing use of the established recruitment
channels as well as the new channels that have
become available to them. The fall in the use of
newspapers has been documented over this
period for example, as well as rise in the use of
internet job sites and social media.
You will see from the report’s historical data that
candidates’ recruitment channel mix is in
constant flux and it is interesting to note data
emerging from other sources that suggest the
same. LinkedIn data, for example, confirms that
the top sources of quality hires has shifted
significantly in the past 4 years:
- 42% jobboard (up 15%)
- 38% social professional networks (up 73%)
- 33% employee referrals (down 14%)
What is certain given these changes is that both
recruiters and candidates alike are keen to
determine which channels are deserving of their
time and investment; we very much hope that
these two surveys, taken together, will help with
those decisions. Our thanks go to the 1000 or so
responses to this year’s surveys, without whose
help this unique data could not have been
produced.
As ever, if the team at Top-Consultant.com can
help in any way as the year unfolds please just
let us know.
Recruitment trends Trend data based on ~900 recruiter
responses
Part One
Top-Consultant.com’s Management Consultancy Recruitment Channel Report 2015
PAGE 5
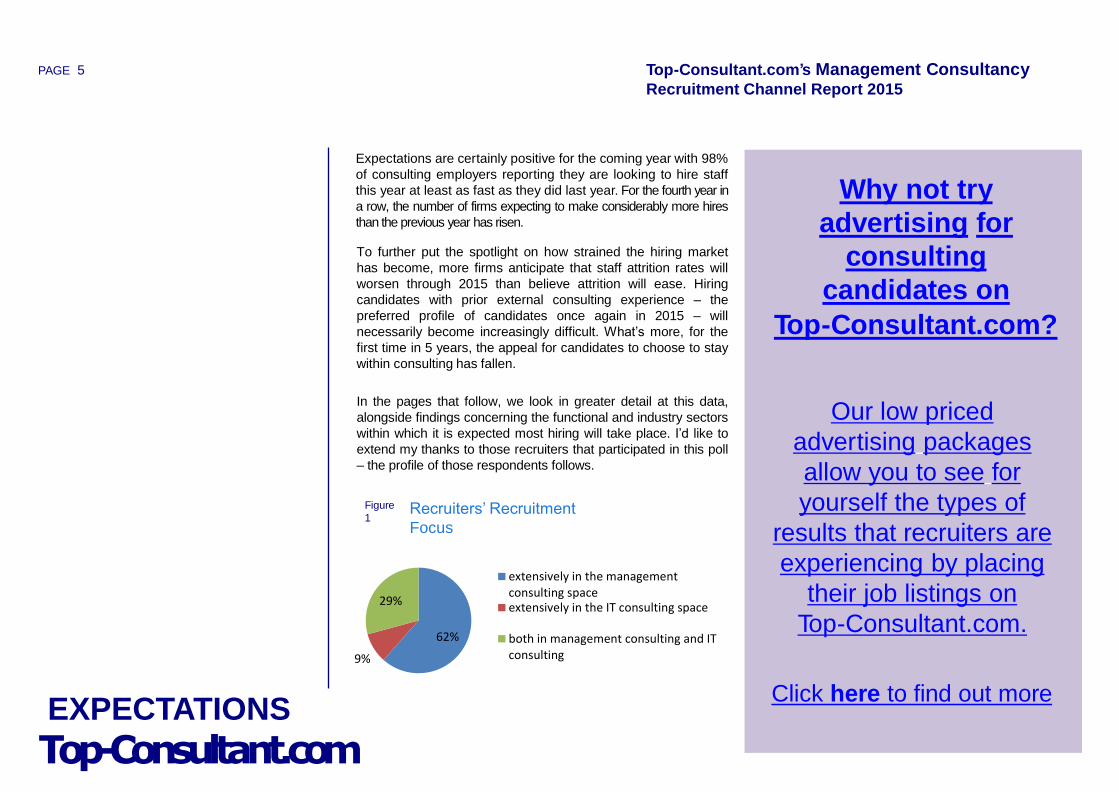
Expectations are certainly positive for the coming year with 98%
of consulting employers reporting they are looking to hire staff
this year at least as fast as they did last year. For the fourth year in
a row, the number of firms expecting to make considerably more hires
than the previous year has risen.
To further put the spotlight on how strained the hiring market
has become, more firms anticipate that staff attrition rates will
worsen through 2015 than believe attrition will ease. Hiring
candidates with prior external consulting experience – the
preferred profile of candidates once again in 2015 – will
necessarily become increasingly difficult. What’s more, for the
first time in 5 years, the appeal for candidates to choose to stay
within consulting has fallen.
In the pages that follow, we look in greater detail at this data,
alongside findings concerning the functional and industry sectors
within which it is expected most hiring will take place. I’d like to
extend my thanks to those recruiters that participated in this poll
– the profile of those respondents follows.
Why not try
advertising for
consulting
candidates on
Top-Consultant.com?
Our low priced
advertising packages
allow you to see for
yourself the types of
results that recruiters are
experiencing by placing
their job listings on
Top-Consultant.com.
Click here to find out more
Top-Consultant.com EXPECTATIONS
62%
9%
29%
extensively in the managementconsulting spaceextensively in the IT consulting space
both in management consulting and ITconsulting
Recruiters’ Recruitment
Focus
Figure
1
Top-Consultant.com’s Management Consultancy Recruitment Channel Report 2015
PAGE 6
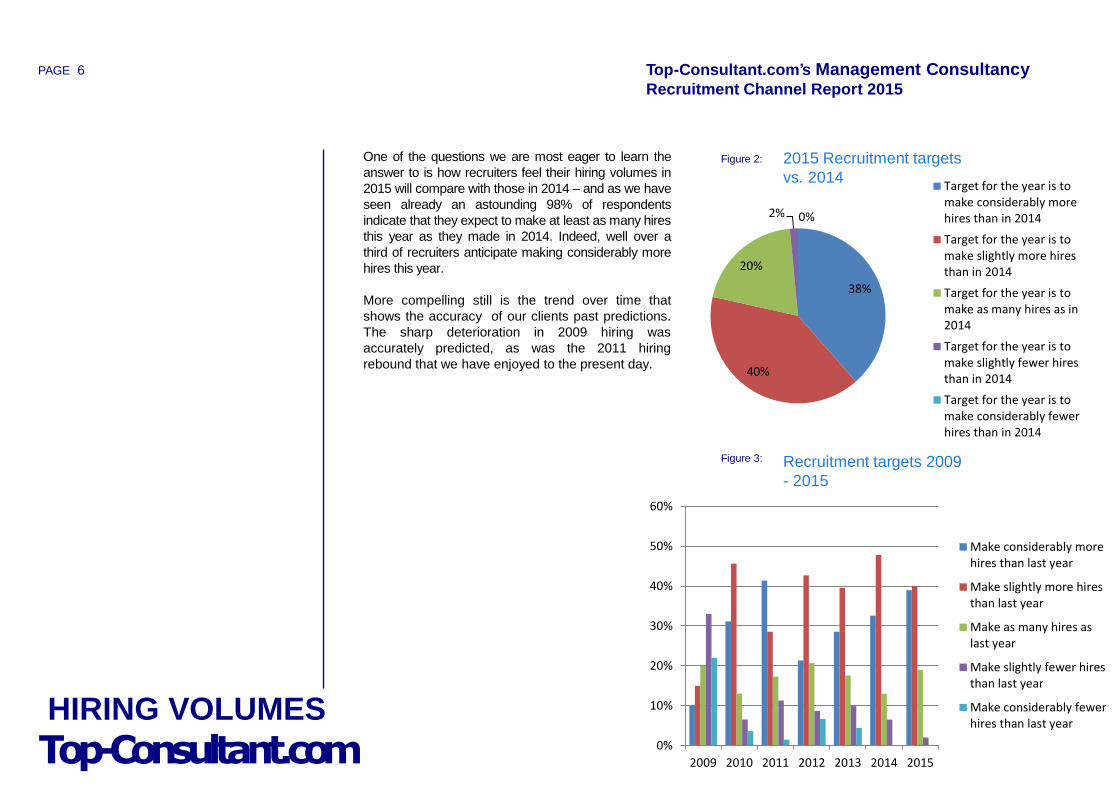
One of the questions we are most eager to learn the
answer to is how recruiters feel their hiring volumes in
2015 will compare with those in 2014 – and as we have
seen already an astounding 98% of respondents
indicate that they expect to make at least as many hires
this year as they made in 2014. Indeed, well over a
third of recruiters anticipate making considerably more
hires this year.
More compelling still is the trend over time that
shows the accuracy of our clients past predictions.
The sharp deterioration in 2009 hiring was
accurately predicted, as was the 2011 hiring
rebound that we have enjoyed to the present day.
Figure 2: 2015 Recruitment targets
vs. 2014
Figure 3: Recruitment targets 2009
- 2015
Top-Consultant.com HIRING VOLUMES
38%
40%
20%
2% 0%
Target for the year is tomake considerably morehires than in 2014
Target for the year is tomake slightly more hiresthan in 2014
Target for the year is tomake as many hires as in2014
Target for the year is tomake slightly fewer hiresthan in 2014
Target for the year is tomake considerably fewerhires than in 2014
0%
10%
20%
30%
40%
50%
60%
2009 2010 2011 2012 2013 2014 2015
Make considerably morehires than last year
Make slightly more hiresthan last year
Make as many hires aslast year
Make slightly fewer hiresthan last year
Make considerably fewerhires than last year
Top-Consultant.com’s Management Consultancy Recruitment Channel Report 2015
PAGE 7
Figure
4: What staff attrition rate has your
consulting business experienced in the
last year?
Figure
5: What do you believe will happen to
staff attrition rates during 2015?
Top-Consultant.com ATTRITION
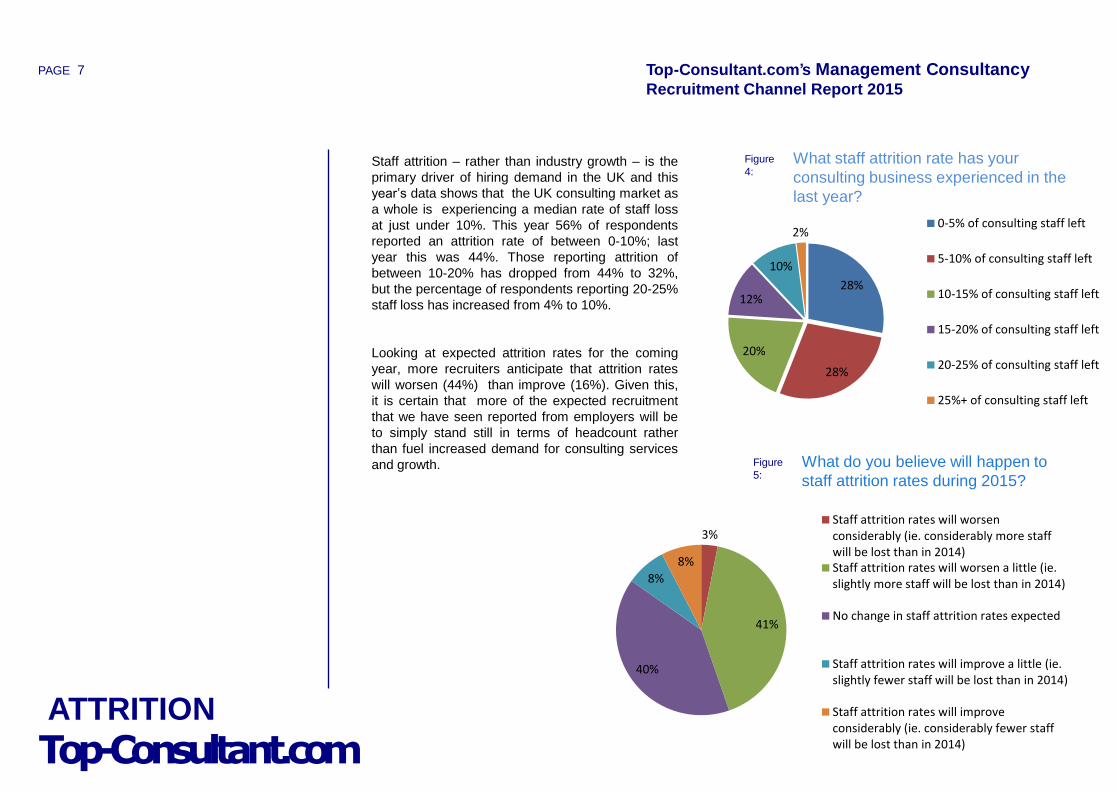
Staff attrition – rather than industry growth – is the
primary driver of hiring demand in the UK and this
year’s data shows that the UK consulting market as
a whole is experiencing a median rate of staff loss
at just under 10%. This year 56% of respondents
reported an attrition rate of between 0-10%; last
year this was 44%. Those reporting attrition of
between 10-20% has dropped from 44% to 32%,
but the percentage of respondents reporting 20-25%
staff loss has increased from 4% to 10%.
Looking at expected attrition rates for the coming
year, more recruiters anticipate that attrition rates
will worsen (44%) than improve (16%). Given this,
it is certain that more of the expected recruitment
that we have seen reported from employers will be
to simply stand still in terms of headcount rather
than fuel increased demand for consulting services
and growth.
28%
28%
20%
12%
10%
2% 0-5% of consulting staff left
5-10% of consulting staff left
10-15% of consulting staff left
15-20% of consulting staff left
20-25% of consulting staff left
25%+ of consulting staff left
3%
41%
40%
8%
8%
Staff attrition rates will worsenconsiderably (ie. considerably more staffwill be lost than in 2014)Staff attrition rates will worsen a little (ie.slightly more staff will be lost than in 2014)
No change in staff attrition rates expected
Staff attrition rates will improve a little (ie.slightly fewer staff will be lost than in 2014)
Staff attrition rates will improveconsiderably (ie. considerably fewer staffwill be lost than in 2014)
Top-Consultant.com’s Management Consultancy Recruitment Channel Report 2015
PAGE 8
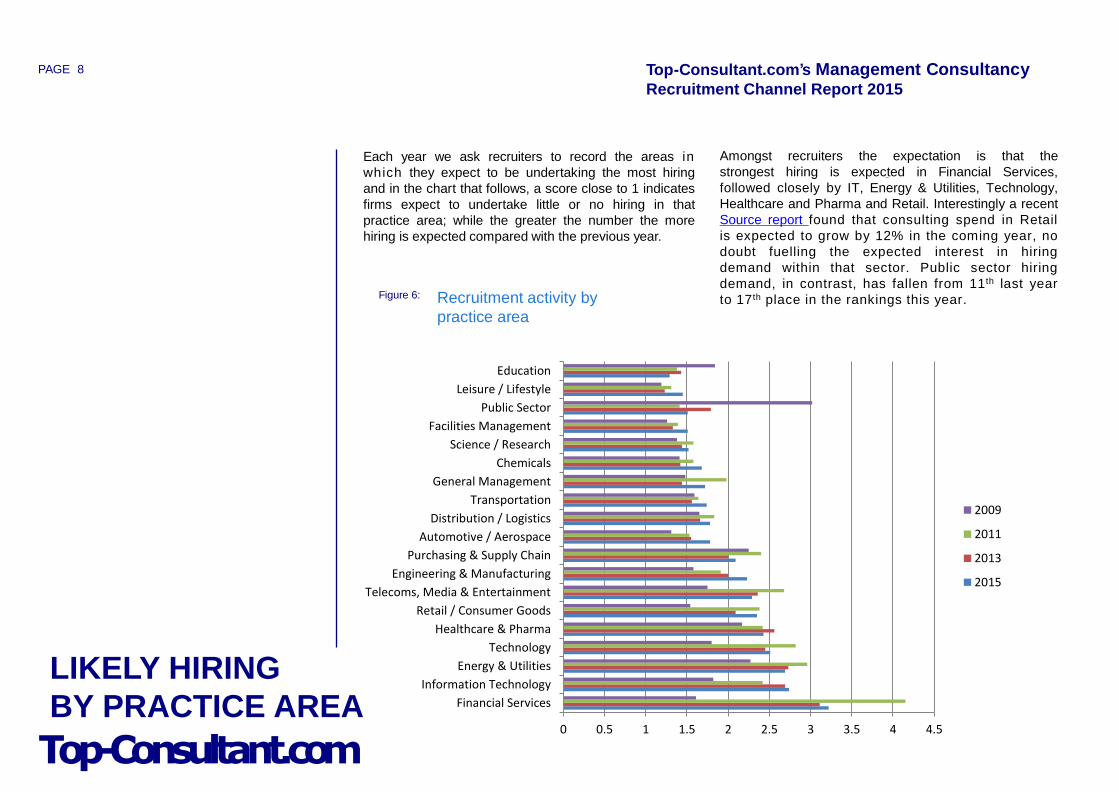
Each year we ask recruiters to record the areas in
which they expect to be undertaking the most hiring
and in the chart that follows, a score close to 1 indicates
firms expect to undertake little or no hiring in that
practice area; while the greater the number the more
hiring is expected compared with the previous year.
Amongst recruiters the expectation is that the
strongest hiring is expected in Financial Services,
followed closely by IT, Energy & Utilities, Technology,
Healthcare and Pharma and Retail. Interestingly a recent
Source report found that consulting spend in Retail
is expected to grow by 12% in the coming year, no
doubt fuelling the expected interest in hiring
demand within that sector. Public sector hiring
demand, in contrast, has fallen from 11 th last year
to 17 th place in the rankings this year. Figure 6: Recruitment activity by
practice area
Top-Consultant.com
LIKELY HIRING
BY PRACTICE AREA 0 0.5 1 1.5 2 2.5 3 3.5 4 4.5
Financial Services
Information Technology
Energy & Utilities
Technology
Healthcare & Pharma
Retail / Consumer Goods
Telecoms, Media & Entertainment
Engineering & Manufacturing
Purchasing & Supply Chain
Automotive / Aerospace
Distribution / Logistics
Transportation
General Management
Chemicals
Science / Research
Facilities Management
Public Sector
Leisure / Lifestyle
Education
2009
2011
2013
2015
Top-Consultant.com’s Management Consultancy Recruitment Channel Report 2015
PAGE 9
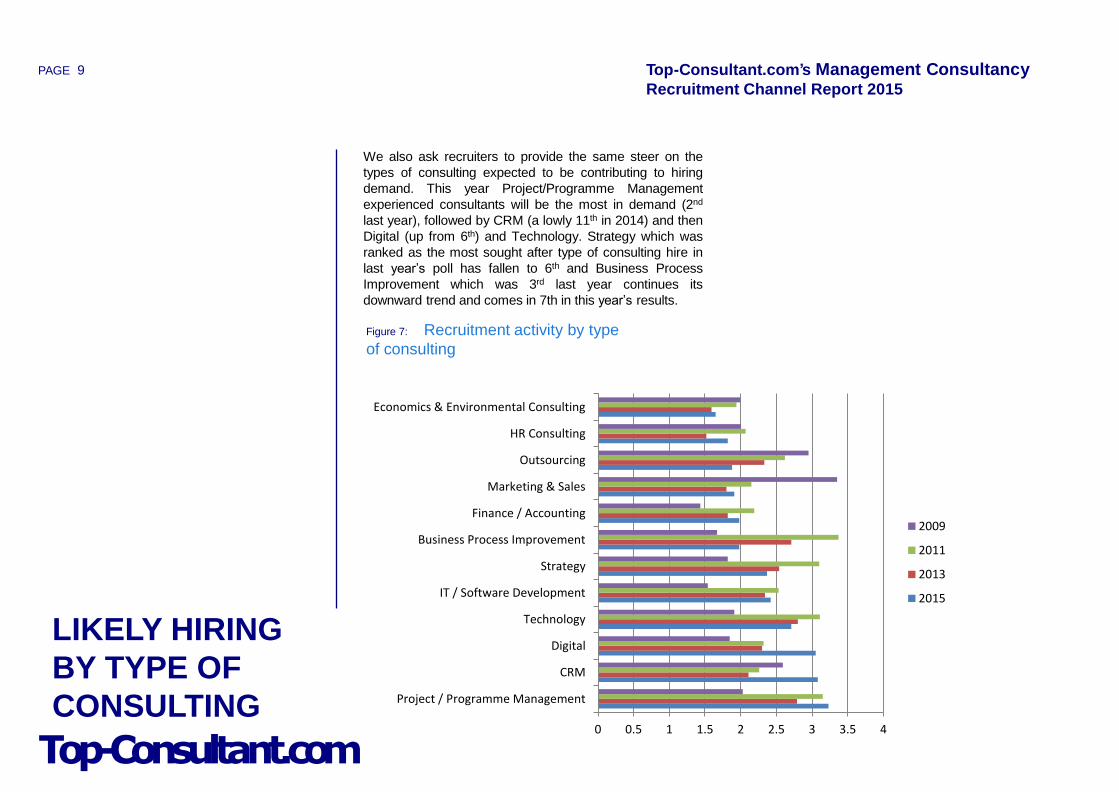
We also ask recruiters to provide the same steer on the
types of consulting expected to be contributing to hiring
demand. This year Project/Programme Management
experienced consultants will be the most in demand (2nd
last year), followed by CRM (a lowly 11th in 2014) and then
Digital (up from 6th) and Technology. Strategy which was
ranked as the most sought after type of consulting hire in
last year’s poll has fallen to 6th and Business Process
Improvement which was 3rd last year continues its
downward trend and comes in 7th in this year’s results.
Figure 7: Recruitment activity by type
of consulting
Top-Consultant.com
LIKELY HIRING
BY TYPE OF
CONSULTING 0 0.5 1 1.5 2 2.5 3 3.5 4
Project / Programme Management
CRM
Digital
Technology
IT / Software Development
Strategy
Business Process Improvement
Finance / Accounting
Marketing & Sales
Outsourcing
HR Consulting
Economics & Environmental Consulting
2009
2011
2013
2015
Top-Consultant.com’s Management Consultancy Recruitment Channel Report 2015
PAGE 10
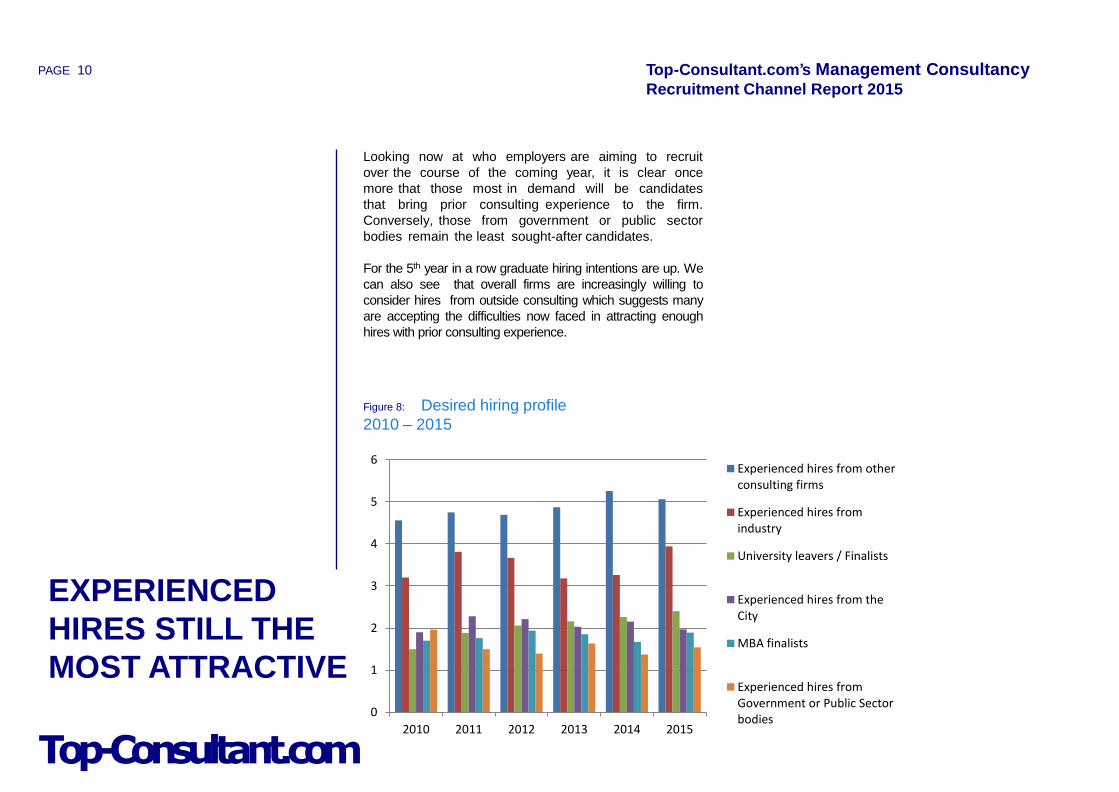
Looking now at who employers are aiming to recruit
over the course of the coming year, it is clear once
more that those most in demand will be candidates
that bring prior consulting experience to the firm.
Conversely, those from government or public sector
bodies remain the least sought-after candidates.
For the 5th year in a row graduate hiring intentions are up. We
can also see that overall firms are increasingly willing to
consider hires from outside consulting which suggests many
are accepting the difficulties now faced in attracting enough
hires with prior consulting experience.
Figure 8: Desired hiring profile
2010 – 2015
Top-Consultant.com
EXPERIENCED
HIRES STILL THE
MOST ATTRACTIVE
0
1
2
3
4
5
6
2010 2011 2012 2013 2014 2015
Experienced hires from otherconsulting firms
Experienced hires fromindustry
University leavers / Finalists
Experienced hires from theCity
MBA finalists
Experienced hires fromGovernment or Public Sectorbodies
Top-Consultant.com’s Management Consultancy Recruitment Channel Report 2015
PAGE 11
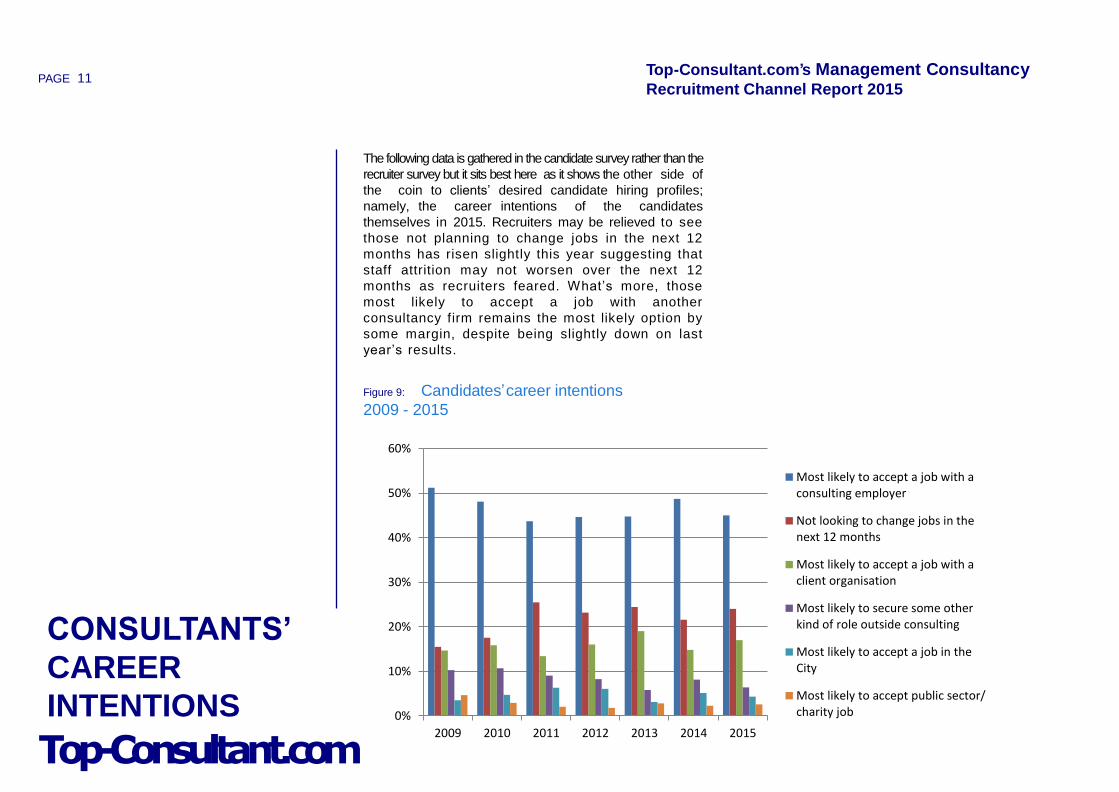
The following data is gathered in the candidate survey rather than the
recruiter survey but it sits best here as it shows the other side of
the coin to clients’ desired candidate hiring profiles;
namely, the career intentions of the candidates
themselves in 2015. Recruiters may be relieved to see
those not planning to change jobs in the next 12
months has risen slightly this year suggesting that
staff attrition may not worsen over the next 12
months as recruiters feared. What’s more, those
most likely to accept a job with another
consultancy firm remains the most likely option by
some margin, despite being slightly down on last
year’s results.
0% 10% 20% 30% 40% 50% 60%
Figure 9: Candidates’career intentions
2009 - 2015
Top-Consultant.com
CONSULTANTS’
CAREER
INTENTIONS 0%
10%
20%
30%
40%
50%
60%
2009 2010 2011 2012 2013 2014 2015
Most likely to accept a job with aconsulting employer
Not looking to change jobs in thenext 12 months
Most likely to accept a job with aclient organisation
Most likely to secure some otherkind of role outside consulting
Most likely to accept a job in theCity
Most likely to accept public sector/charity job
Recruitment channel use Trend data based on ~13,000 candidate responses
Part Two
Top-Consultant.com’s Management Consultancy Recruitment Channel Report 2015
PAGE 13
Trends are based on data collected from almost
13,000 management consultancy candidates over
the last 14 years. Candidates from all the major
consulting firms have participated, together with
consultants currently working at niche consulting firms
and potential industry hires looking to move into
consulting for the first time.
Most respondents this year were Business
Transformation / Change Management consultants
(27%), Strategy consultants (19%), IT/ Technology
consultants (17%), Project / Programme management
Consultants (17%), Business Process Improvement
(12%), HR consultants (5%), Outsourcing (2%).
The sectors that candidates had most experience of
working in this year were Public Sector (26%), Energy /
Utilities (26%), Telecoms, Media & Entertainment (26%),
Retail / Consumer Goods (23%), Financial Services
(Retail Financial Services focus) (23%), Financial
Services (Investment Banking / Capital Markets focus)
(21%), Healthcare & Pharma (19%), Automotive /
Aerospace (15%), Distribution / Logistics (12%),
Transportation (12%)
39% of respondents had spent more than 3 years with
their current firm, 9% between 2 and 3 years, 15%
between 1 and 2 years, 15% between 6 months and 1
year and those that had joined their current firm within the
last 6 months accounted for 22% of the responses.
Survey responses were generated via direct mailshots to
the Top-Consultant.com readership; an invitation sent
to all screened consulting candidates on the Get-
Headhunted CV database; promotions via Twitter,
LinkedIn, Google News and Yahoo News, and by
invitations sent to candidates by recruitment agencies.
Are you a
Management
Consultancy
Recruiter?
Once a month the
Top-Consultant.com team
update recruiter contacts
regarding all the new
initiatives we’re planning,
free reports we’ve published
and any forthcoming
promotional offers they
could benefit from. If you
would like to be added to
our recruiter contact list
please email Bryan
Hickson.
Top-Consultant.com CANDIDATE POOL
Top-Consultant.com’s Management Consultancy Recruitment Channel Report 2015
PAGE 14
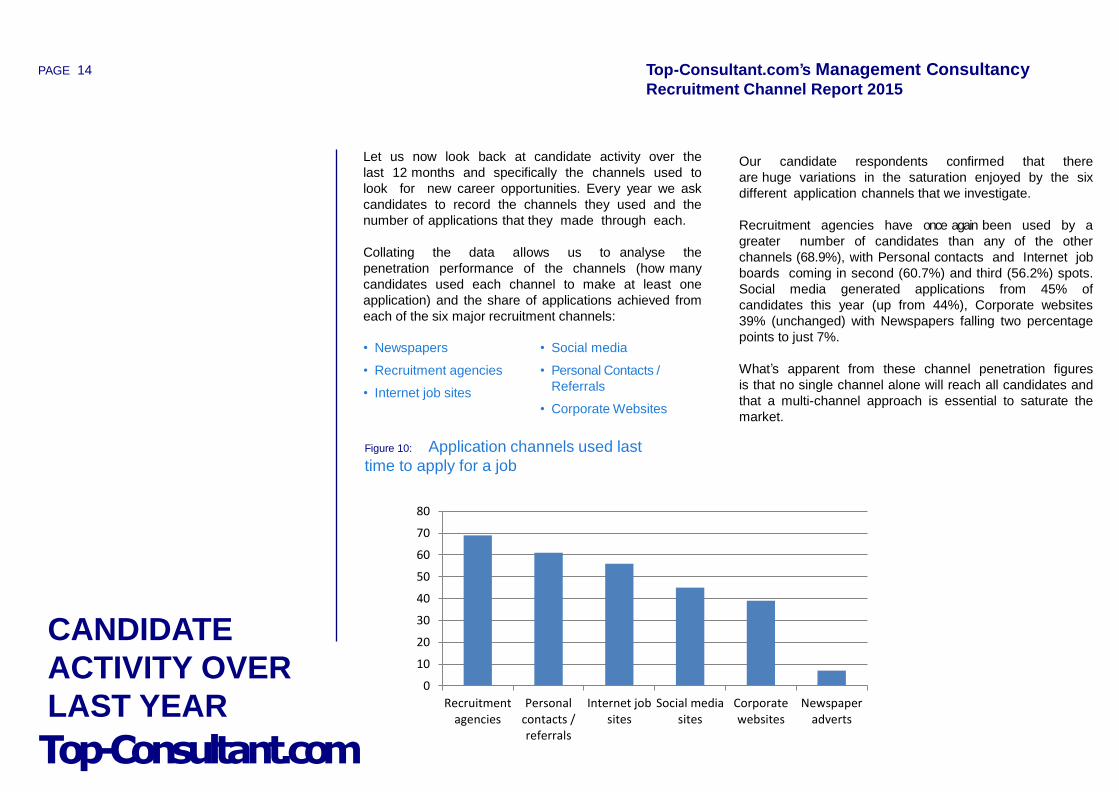
Let us now look back at candidate activity over the
last 12 months and specifically the channels used to
look for new career opportunities. Every year we ask
candidates to record the channels they used and the
number of applications that they made through each.
Collating the data allows us to analyse the
penetration performance of the channels (how many
candidates used each channel to make at least one
application) and the share of applications achieved from
each of the six major recruitment channels:
Figure 10: Application channels used last
time to apply for a job
• Newspapers
• Recruitment agencies
• Internet job sites
• Social media
• Personal Contacts /
Referrals
• Corporate Websites
Top-Consultant.com
CANDIDATE
ACTIVITY OVER
LAST YEAR
Our candidate respondents confirmed that there
are huge variations in the saturation enjoyed by the six
different application channels that we investigate.
Recruitment agencies have once again been used by a
greater number of candidates than any of the other
channels (68.9%), with Personal contacts and Internet job
boards coming in second (60.7%) and third (56.2%) spots.
Social media generated applications from 45% of
candidates this year (up from 44%), Corporate websites
39% (unchanged) with Newspapers falling two percentage
points to just 7%.
What’s apparent from these channel penetration figures
is that no single channel alone will reach all candidates and
that a multi-channel approach is essential to saturate the
market.
0
10
20
30
40
50
60
70
80
Recruitmentagencies
Personalcontacts /referrals
Internet jobsites
Social mediasites
Corporatewebsites
Newspaperadverts
Top-Consultant.com’s Management Consultancy Recruitment Channel Report 2015
PAGE 15
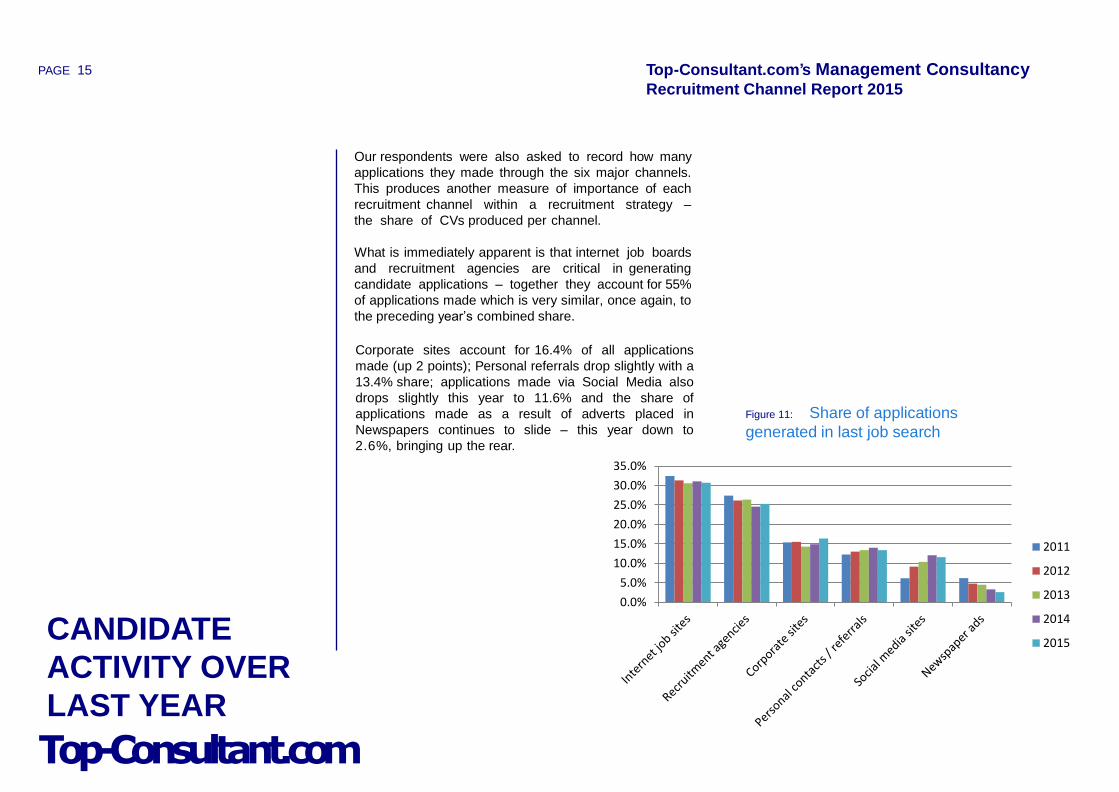
Our respondents were also asked to record how many
applications they made through the six major channels.
This produces another measure of importance of each
recruitment channel within a recruitment strategy –
the share of CVs produced per channel.
What is immediately apparent is that internet job boards
and recruitment agencies are critical in generating
candidate applications – together they account for 55%
of applications made which is very similar, once again, to
the preceding year’s combined share.
Corporate sites account for 16.4% of all applications
made (up 2 points); Personal referrals drop slightly with a
13.4% share; applications made via Social Media also
drops slightly this year to 11.6% and the share of
applications made as a result of adverts placed in
Newspapers continues to slide – this year down to
2.6%, bringing up the rear.
10%
Top-Consultant.com
CANDIDATE
ACTIVITY OVER
LAST YEAR
0.0%
5.0%
10.0%
15.0%
20.0%
25.0%
30.0%
35.0%
2011
2012
2013
2014
2015
Figure 11: Share of applications
generated in last job search
Top-Consultant.com’s Management Consultancy Recruitment Channel Report 2015
PAGE 16
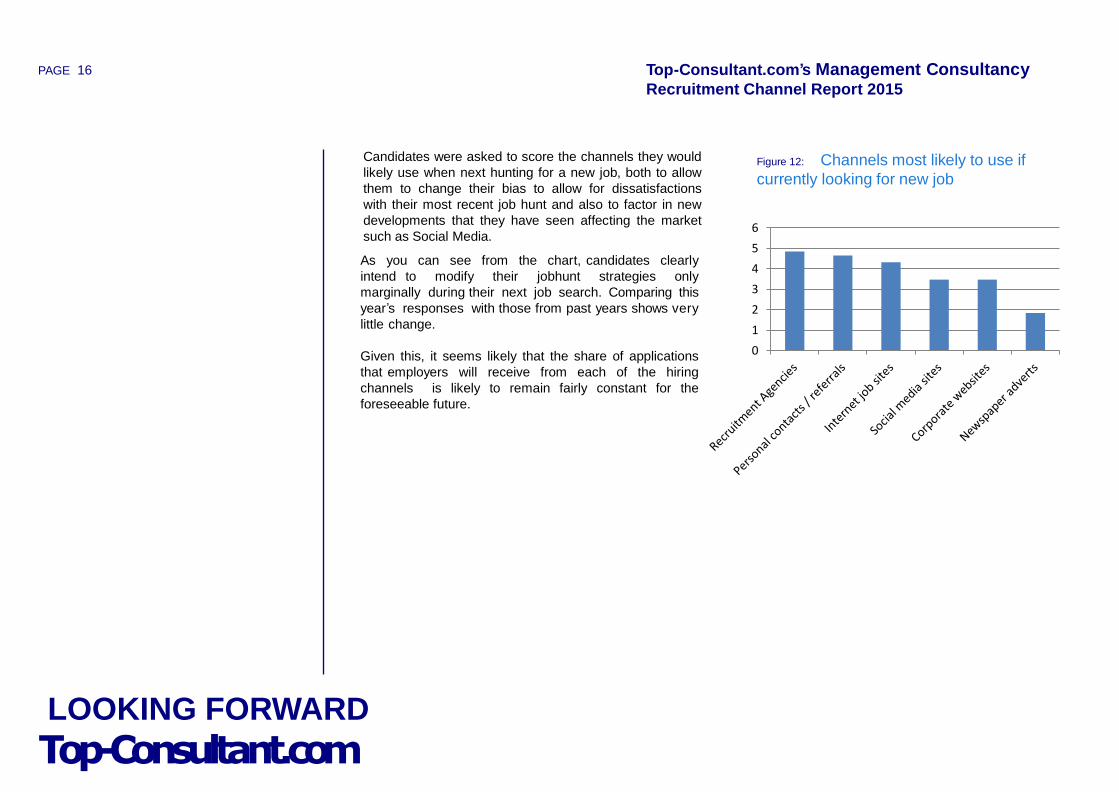
Candidates were asked to score the channels they would
likely use when next hunting for a new job, both to allow
them to change their bias to allow for dissatisfactions
with their most recent job hunt and also to factor in new
developments that they have seen affecting the market
such as Social Media.
As you can see from the chart, candidates clearly
intend to modify their jobhunt strategies only
marginally during their next job search. Comparing this
year’s responses with those from past years shows very
little change.
Given this, it seems likely that the share of applications
that employers will receive from each of the hiring
channels is likely to remain fairly constant for the
foreseeable future.
2
2.5
3
3.
Figure 12: Channels most likely to use if
currently looking for new job
Top-Consultant.com LOOKING FORWARD
0
1
2
3
4
5
6
Historical trends in recruitment channel use and Recruiter & Media awards
Part Three
Top-Consultant.com’s Management Consultancy Recruitment Channel Report 2015
PAGE 18
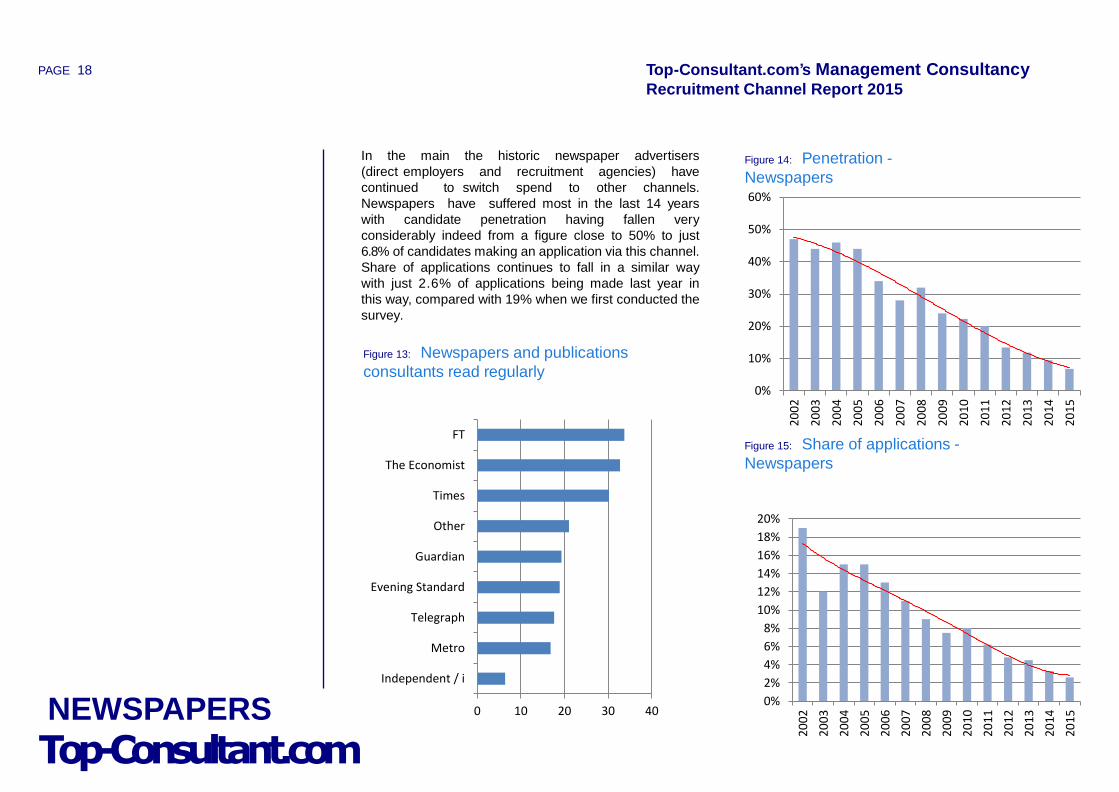
In the main the historic newspaper advertisers
(direct employers and recruitment agencies) have
continued to switch spend to other channels.
Newspapers have suffered most in the last 14 years
with candidate penetration having fallen very
considerably indeed from a figure close to 50% to just
6.8% of candidates making an application via this channel.
Share of applications continues to fall in a similar way
with just 2.6% of applications being made last year in
this way, compared with 19% when we first conducted the
survey.
Figure 15: Share of applications -
Newspapers
10%
20%
30%
Figure 13: Newspapers and publications
consultants read regularly
Figure 14: Penetration -
Newspapers
0% 10% 20% 30%
Top-Consultant.com NEWSPAPERS 0 10 20 30 40
Independent / i
Metro
Telegraph
Evening Standard
Guardian
Other
Times
The Economist
FT
0%
10%
20%
30%
40%
50%
60%
20
02
20
03
20
04
20
05
20
06
20
07
20
08
20
09
20
10
20
11
20
12
20
13
20
14
20
15
0%
2%
4%
6%
8%
10%
12%
14%
16%
18%
20%
20
02
20
03
20
04
20
05
20
06
20
07
20
08
20
09
20
10
20
11
20
12
20
13
20
14
20
15
Top-Consultant.com’s Management Consultancy Recruitment Channel Report 2015
PAGE 19
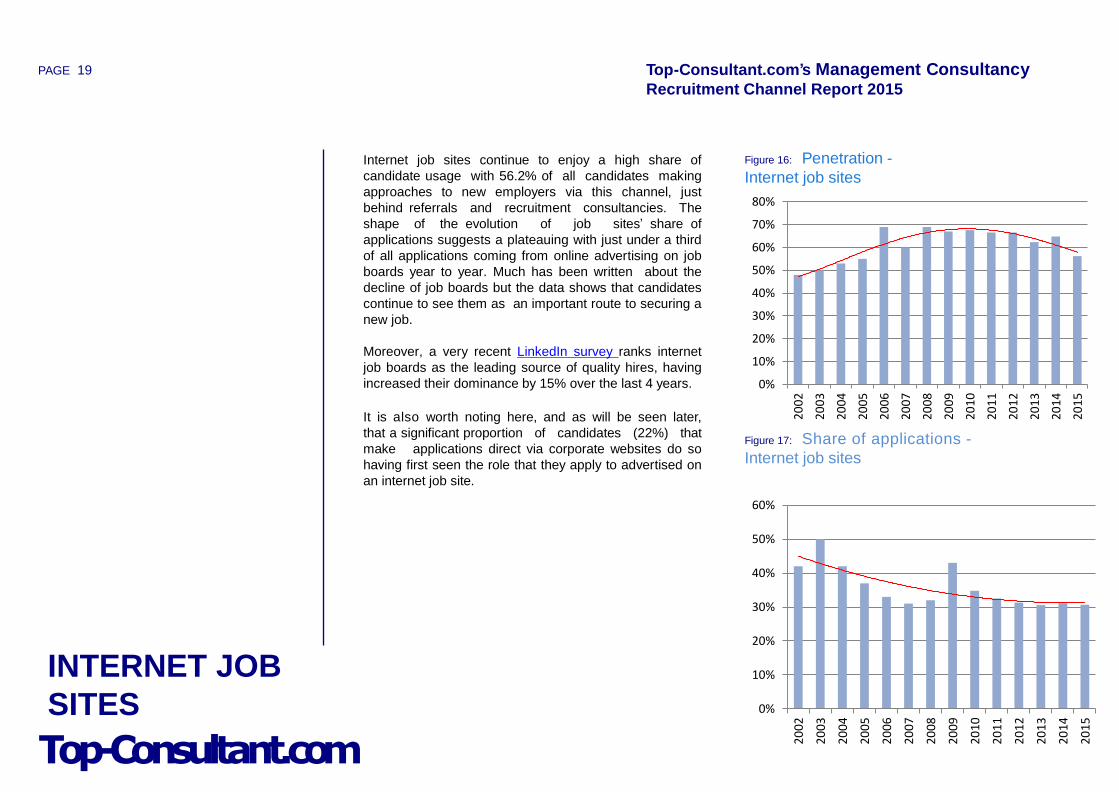
Internet job sites continue to enjoy a high share of
candidate usage with 56.2% of all candidates making
approaches to new employers via this channel, just
behind referrals and recruitment consultancies. The
shape of the evolution of job sites’ share of
applications suggests a plateauing with just under a third
of all applications coming from online advertising on job
boards year to year. Much has been written about the
decline of job boards but the data shows that candidates
continue to see them as an important route to securing a
new job.
Moreover, a very recent LinkedIn survey ranks internet
job boards as the leading source of quality hires, having
increased their dominance by 15% over the last 4 years.
It is also worth noting here, and as will be seen later,
that a significant proportion of candidates (22%) that
make applications direct via corporate websites do so
having first seen the role that they apply to advertised on
an internet job site.
Figure 16: Penetration -
Internet job sites
Top-Consultant.com
Figure 17: Share of applications -
Internet job sites
INTERNET JOB
SITES
0%
10%
20%
30%
40%
50%
60%
70%
80%
20
02
20
03
20
04
20
05
20
06
20
07
20
08
20
09
20
10
20
11
20
12
20
13
20
14
20
15
0%
10%
20%
30%
40%
50%
60%
20
02
20
03
20
04
20
05
20
06
20
07
20
08
20
09
20
10
20
11
20
12
20
13
20
14
20
15
Top-Consultant.com’s Management Consultancy Recruitment Channel Report 2015
PAGE 20
Figure 18: Websites most regularly
reviewed for consulting opportunities
Top-Consultant.com
Figure 19: Websites preferred for
finding a consulting job
INTERNET JOB
SITES
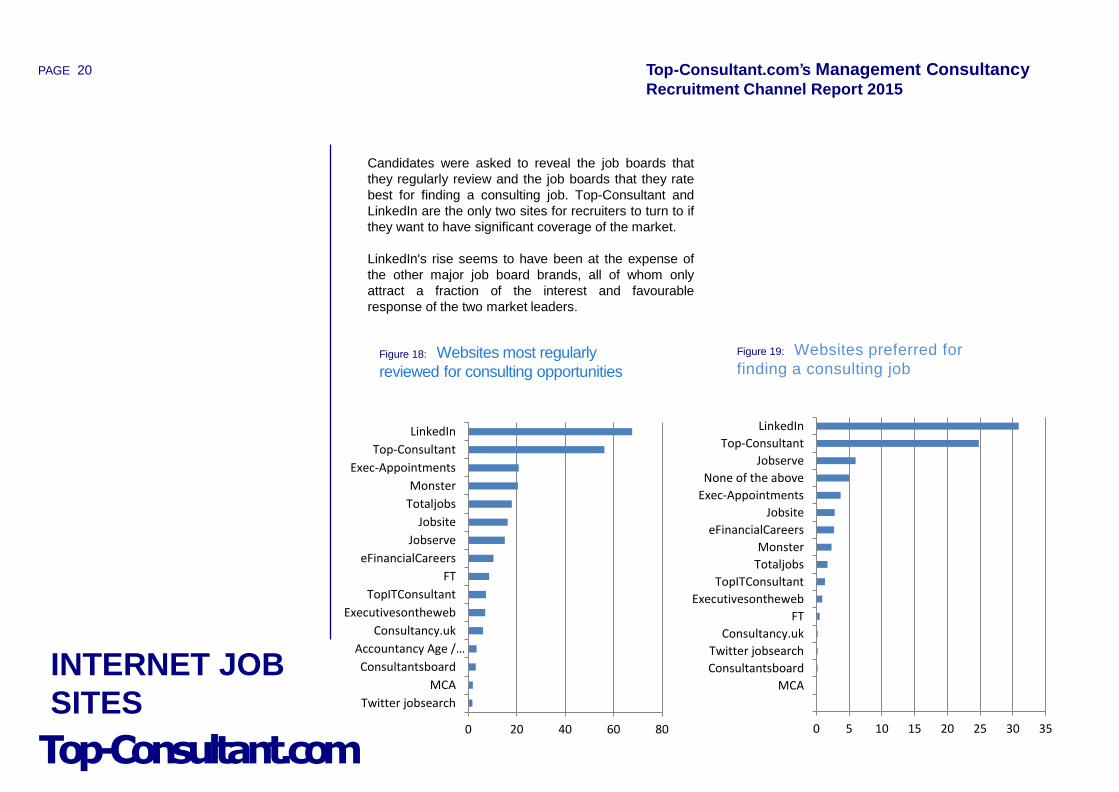
Candidates were asked to reveal the job boards that
they regularly review and the job boards that they rate
best for finding a consulting job. Top-Consultant and
LinkedIn are the only two sites for recruiters to turn to if
they want to have significant coverage of the market.
LinkedIn's rise seems to have been at the expense of
the other major job board brands, all of whom only
attract a fraction of the interest and favourable
response of the two market leaders.
0 20 40 60 80
Twitter jobsearch
MCA
Consultantsboard
Accountancy Age /…
Consultancy.uk
Executivesontheweb
TopITConsultant
FT
eFinancialCareers
Jobserve
Jobsite
Totaljobs
Monster
Exec-Appointments
Top-Consultant
0 5 10 15 20 25 30 35
MCA
Consultantsboard
Twitter jobsearch
Consultancy.uk
FT
Executivesontheweb
TopITConsultant
Totaljobs
Monster
eFinancialCareers
Jobsite
Exec-Appointments
None of the above
Jobserve
Top-Consultant
Top-Consultant.com’s Management Consultancy Recruitment Channel Report 2015
PAGE 21
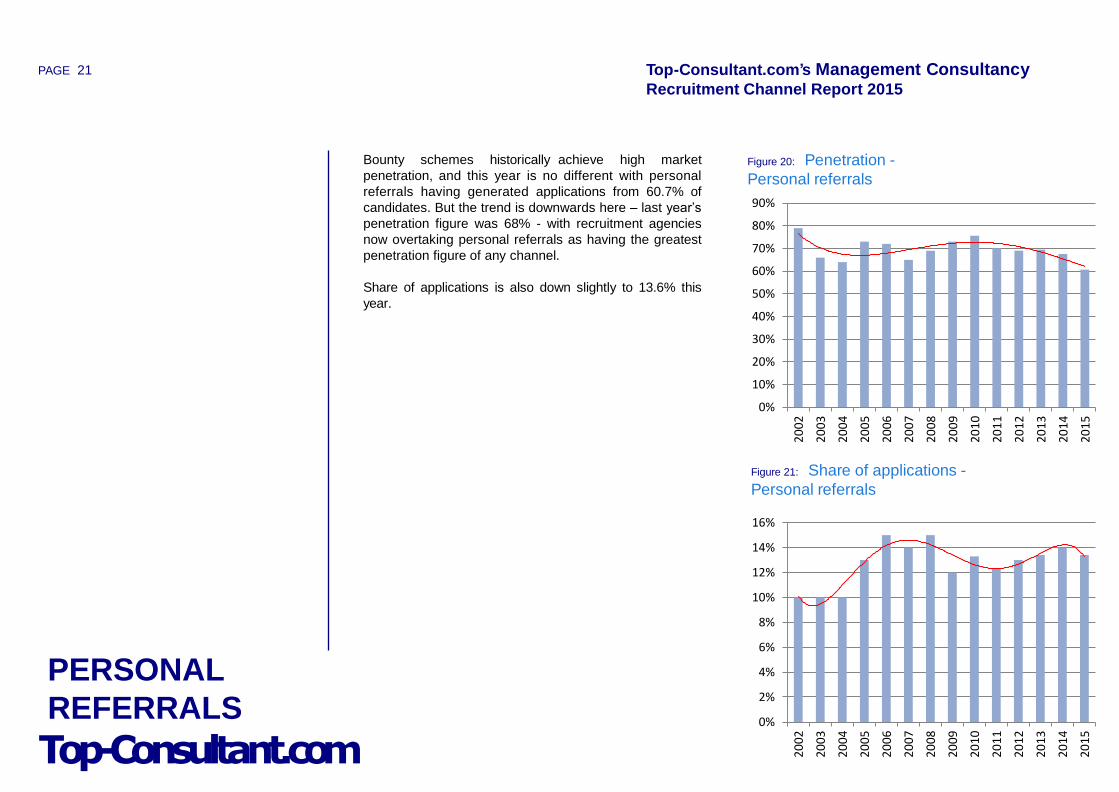
Bounty schemes historically achieve high market
penetration, and this year is no different with personal
referrals having generated applications from 60.7% of
candidates. But the trend is downwards here – last year’s
penetration figure was 68% - with recruitment agencies
now overtaking personal referrals as having the greatest
penetration figure of any channel.
Share of applications is also down slightly to 13.6% this
year.
Figure 20: Penetration -
Personal referrals
Figure 21: Share of applications -
Personal referrals
Top-Consultant.com
PERSONAL
REFERRALS
0%
10%
20%
30%
40%
50%
60%
70%
80%
90%
20
02
20
03
20
04
20
05
20
06
20
07
20
08
20
09
20
10
20
11
20
12
20
13
20
14
20
15
0%
2%
4%
6%
8%
10%
12%
14%
16%
20
02
20
03
20
04
20
05
20
06
20
07
20
08
20
09
20
10
20
11
20
12
20
13
20
14
20
15
Top-Consultant.com’s Management Consultancy Recruitment Channel Report 2015
PAGE 22
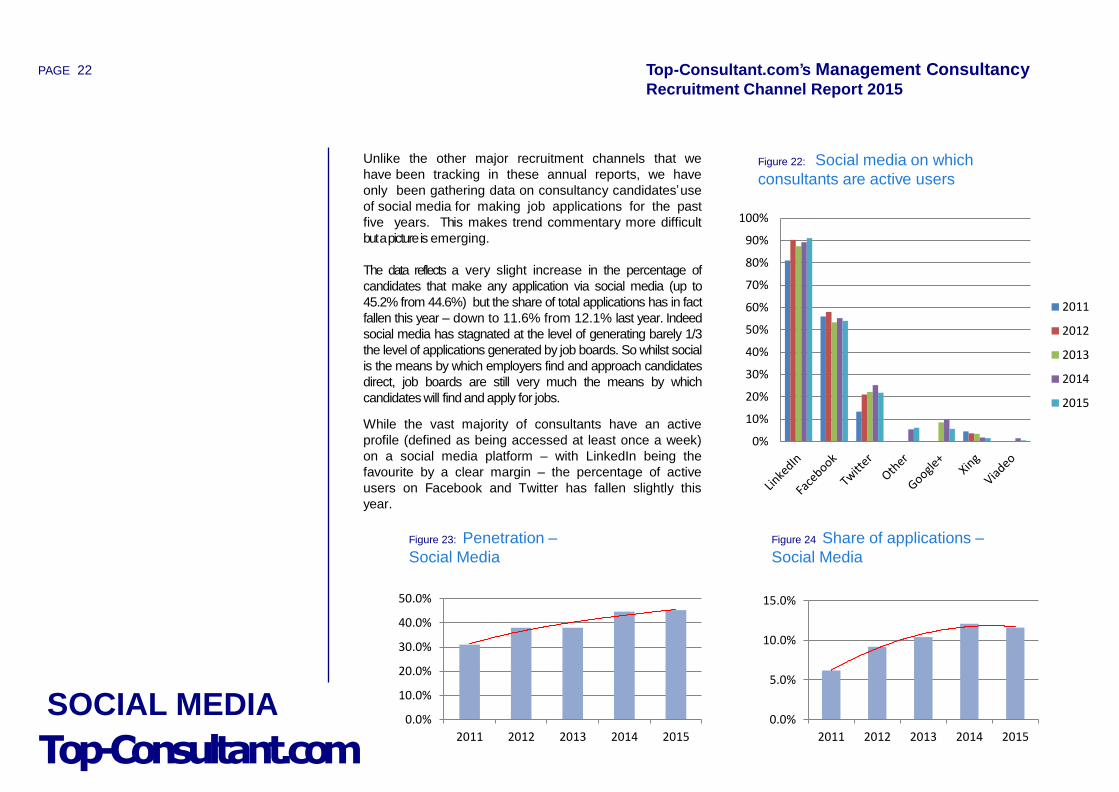
Unlike the other major recruitment channels that we
have been tracking in these annual reports, we have
only been gathering data on consultancy candidates’use
of social media for making job applications for the past
five years. This makes trend commentary more difficult
but a picture is emerging.
The data reflects a very slight increase in the percentage of
candidates that make any application via social media (up to
45.2% from 44.6%) but the share of total applications has in fact
fallen this year – down to 11.6% from 12.1% last year. Indeed
social media has stagnated at the level of generating barely 1/3
the level of applications generated by job boards. So whilst social
is the means by which employers find and approach candidates
direct, job boards are still very much the means by which
candidates will find and apply for jobs.
While the vast majority of consultants have an active
profile (defined as being accessed at least once a week)
on a social media platform – with LinkedIn being the
favourite by a clear margin – the percentage of active
users on Facebook and Twitter has fallen slightly this
year.
Figure 22: Social media on which
consultants are active users
Top-Consultant.com
SOCIAL MEDIA
Figure 23: Penetration –
Social Media
Figure 24 Share of applications –
Social Media
0%
10%
20%
30%
40%
50%
60%
70%
80%
90%
100%
2011
2012
2013
2014
2015
0.0%
10.0%
20.0%
30.0%
40.0%
50.0%
2011 2012 2013 2014 2015
0.0%
5.0%
10.0%
15.0%
2011 2012 2013 2014 2015
Top-Consultant.com’s Management Consultancy Recruitment Channel Report 2015
PAGE 23
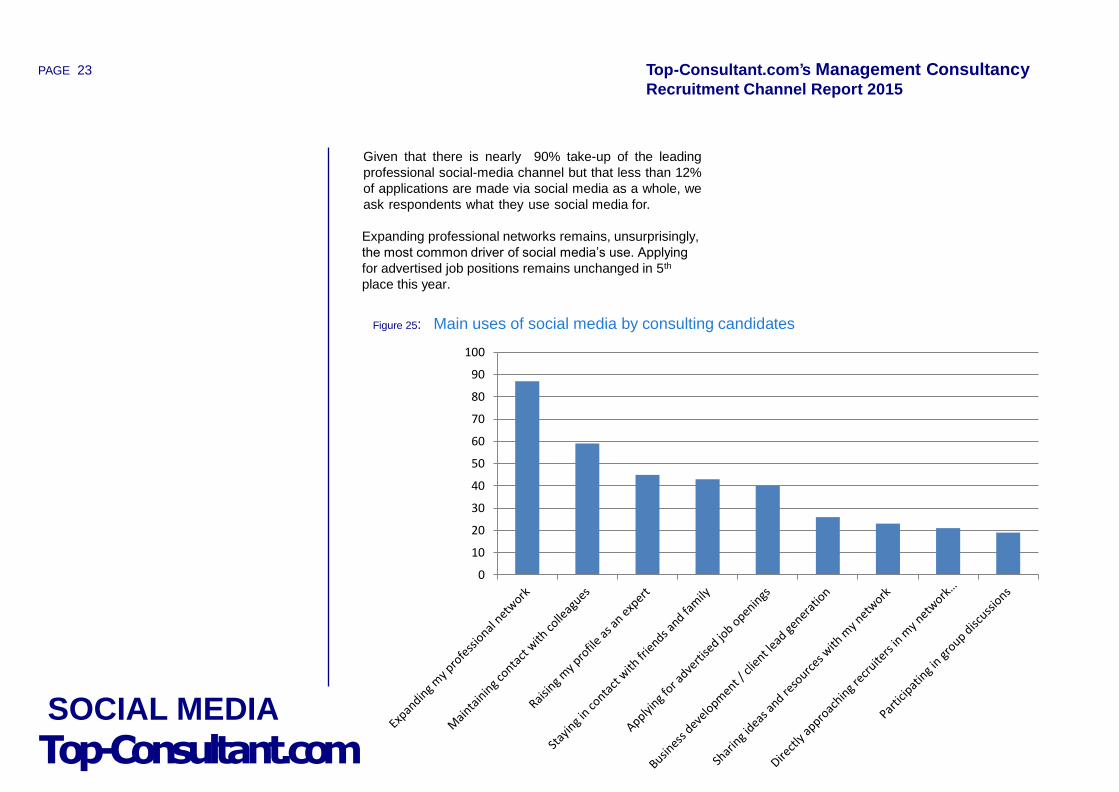
Given that there is nearly 90% take-up of the leading
professional social-media channel but that less than 12%
of applications are made via social media as a whole, we
ask respondents what they use social media for.
Expanding professional networks remains, unsurprisingly,
the most common driver of social media’s use. Applying
for advertised job positions remains unchanged in 5th
place this year.
Top-Consultant.com
Figure 25: Main uses of social media by consulting candidates
SOCIAL MEDIA
0
10
20
30
40
50
60
70
80
90
100
Top-Consultant.com’s Management Consultancy Recruitment Channel Report 2015
PAGE 24
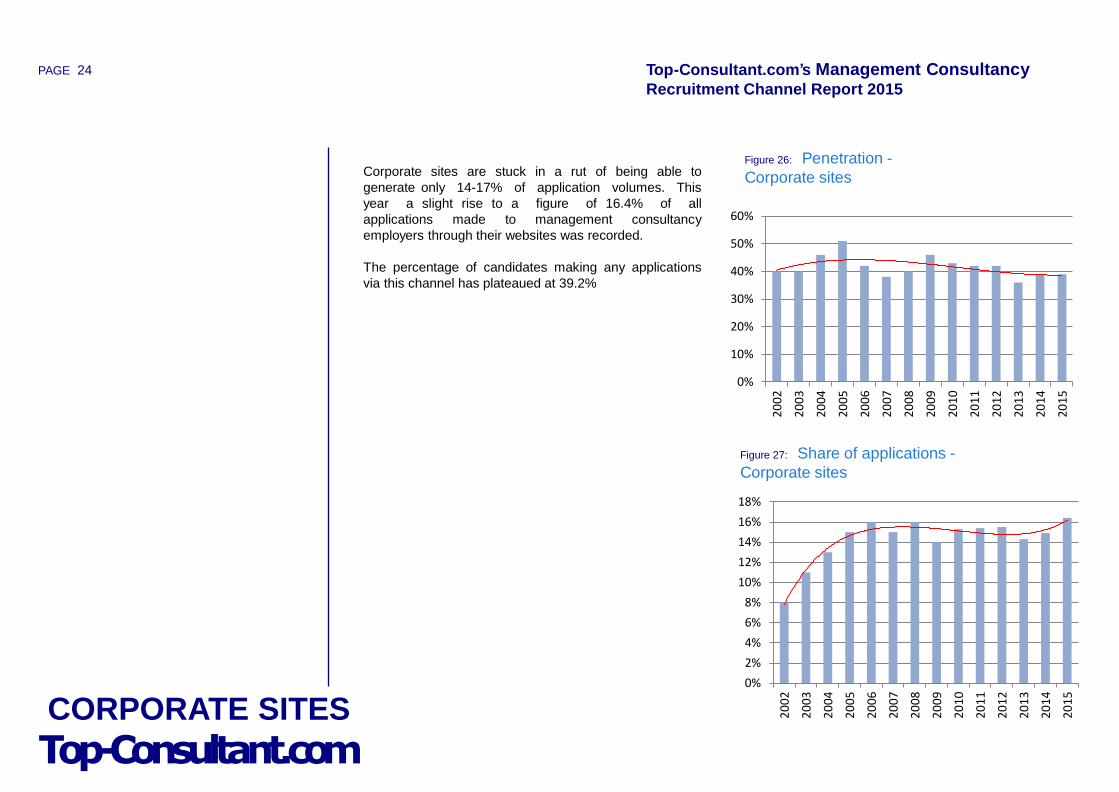
Corporate sites are stuck in a rut of being able to
generate only 14-17% of application volumes. This
year a slight rise to a figure of 16.4% of all
applications made to management consultancy
employers through their websites was recorded.
The percentage of candidates making any applications
via this channel has plateaued at 39.2%
Figure 26: Penetration -
Corporate sites
0%
10%
20%
30%
40%
2002 2003 2004 2005 2006 2007 2008 2009 2010 2011 2012 2013
Figure 27: Share of applications -
Corporate sites
Top-Consultant.com CORPORATE SITES
0%
2%
4%
6%
8%
10%
12%
14%
16%
18%
20
02
20
03
20
04
20
05
20
06
20
07
20
08
20
09
20
10
20
11
20
12
20
13
20
14
20
15
0%
10%
20%
30%
40%
50%
60%
20
02
20
03
20
04
20
05
20
06
20
07
20
08
20
09
20
10
20
11
20
12
20
13
20
14
20
15
Top-Consultant.com’s Management Consultancy Recruitment Channel Report 2015
PAGE 25
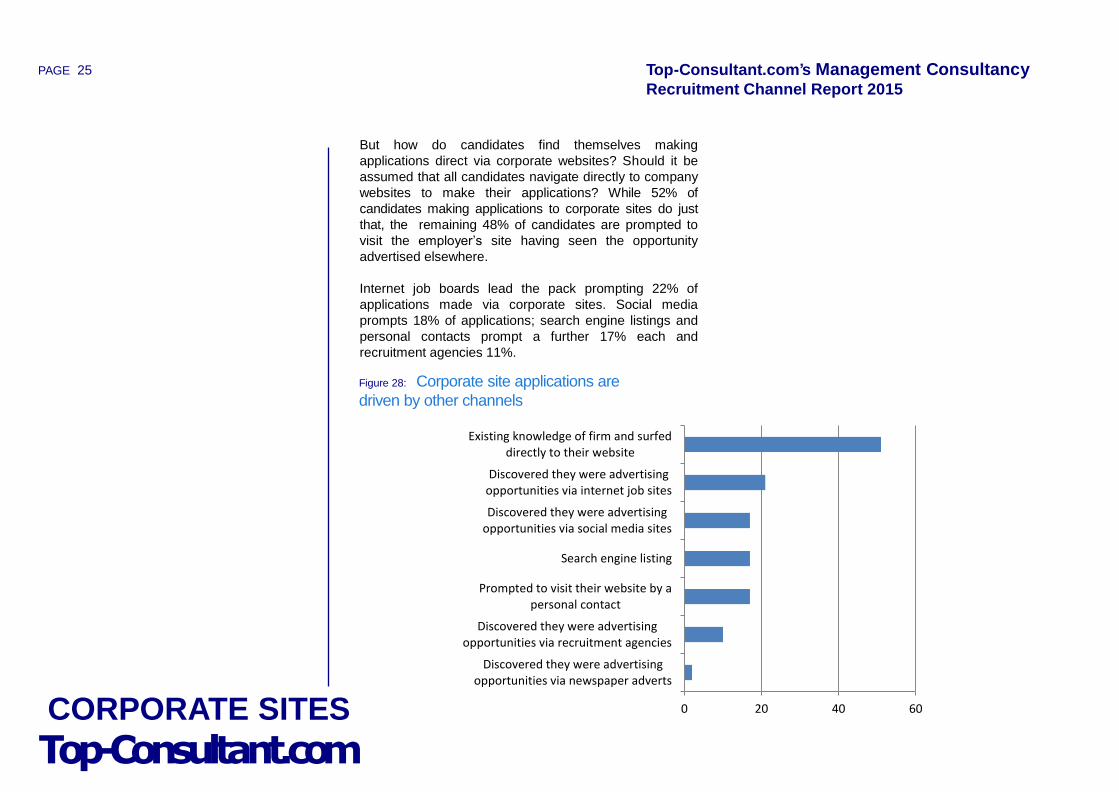
But how do candidates find themselves making
applications direct via corporate websites? Should it be
assumed that all candidates navigate directly to company
websites to make their applications? While 52% of
candidates making applications to corporate sites do just
that, the remaining 48% of candidates are prompted to
visit the employer’s site having seen the opportunity
advertised elsewhere.
Internet job boards lead the pack prompting 22% of
applications made via corporate sites. Social media
prompts 18% of applications; search engine listings and
personal contacts prompt a further 17% each and
recruitment agencies 11%.
0%
10%
20%
30%
40%
2002 2003 2004 2005 2006 2007 2008 2009 2010 2011 2012 2013
Top-Consultant.com CORPORATE SITES 0 20 40 60
Discovered they were advertisingopportunities via newspaper adverts
Discovered they were advertisingopportunities via recruitment agencies
Prompted to visit their website by apersonal contact
Search engine listing
Discovered they were advertisingopportunities via social media sites
Discovered they were advertisingopportunities via internet job sites
Existing knowledge of firm and surfeddirectly to their website
Figure 28: Corporate site applications are
driven by other channels
Top-Consultant.com’s Management Consultancy Recruitment Channel Report 2015
PAGE 26
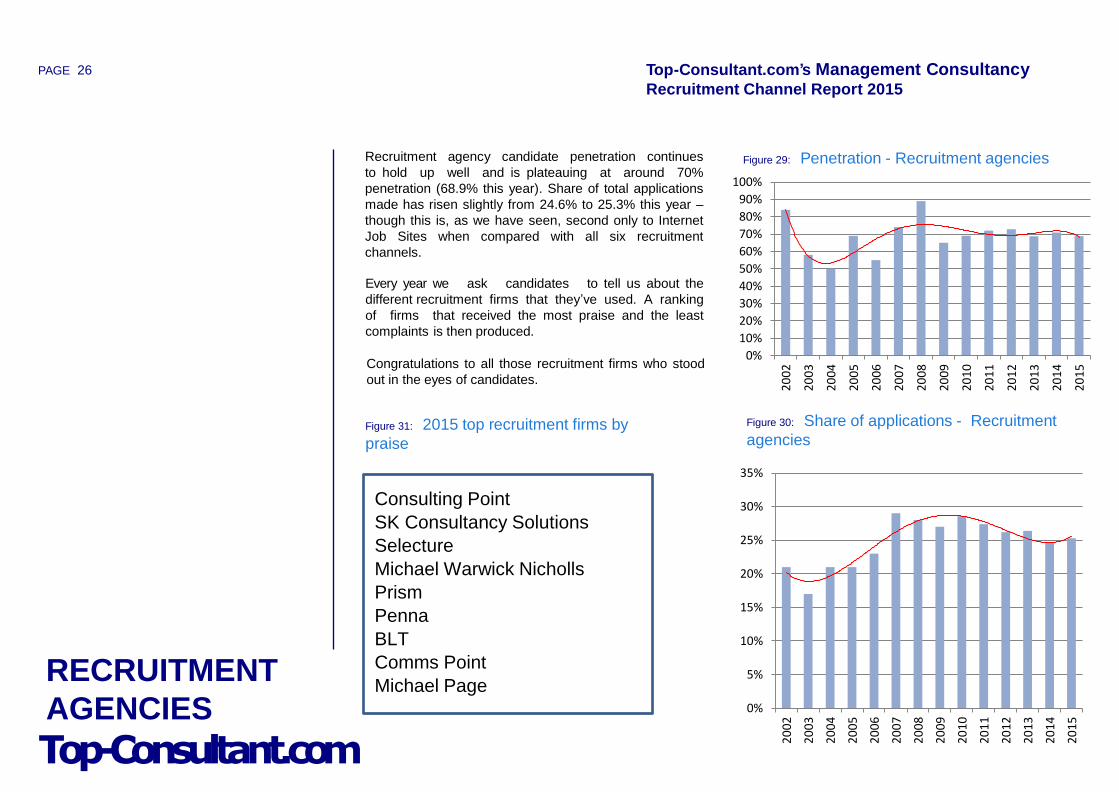
Recruitment agency candidate penetration continues
to hold up well and is plateauing at around 70%
penetration (68.9% this year). Share of total applications
made has risen slightly from 24.6% to 25.3% this year –
though this is, as we have seen, second only to Internet
Job Sites when compared with all six recruitment
channels.
Every year we ask candidates to tell us about the
different recruitment firms that they’ve used. A ranking
of firms that received the most praise and the least
complaints is then produced.
Congratulations to all those recruitment firms who stood
out in the eyes of candidates.
Figure 29: Penetration - Recruitment agencies
Figure 31: 2015 top recruitment firms by
praise
Figure 30: Share of applications - Recruitment
agencies
Top-Consultant.com
RECRUITMENT
AGENCIES
0%
10%
20%
30%
40%
50%
60%
70%
80%
90%
100%
20
02
20
03
20
04
20
05
20
06
20
07
20
08
20
09
20
10
20
11
20
12
20
13
20
14
20
15
0%
5%
10%
15%
20%
25%
30%
35%
20
02
20
03
20
04
20
05
20
06
20
07
20
08
20
09
20
10
20
11
20
12
20
13
20
14
20
15
Consulting Point
SK Consultancy Solutions
Selecture
Michael Warwick Nicholls
Prism
Penna
BLT
Comms Point
Michael Page
Top-Consultant.com’s Management Consultancy Recruitment Channel Report 2015
PAGE 27
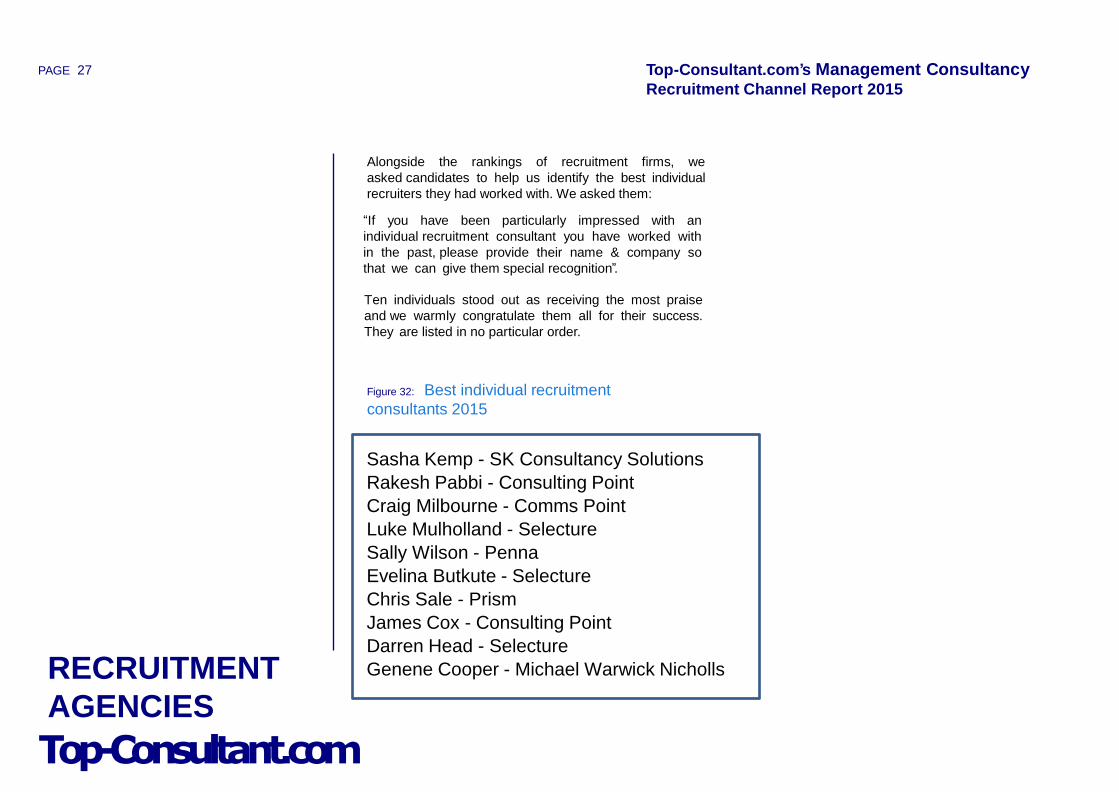
Alongside the rankings of recruitment firms, we
asked candidates to help us identify the best individual
recruiters they had worked with. We asked them:
“If you have been particularly impressed with an
individual recruitment consultant you have worked with
in the past, please provide their name & company so
that we can give them special recognition”.
Ten individuals stood out as receiving the most praise
and we warmly congratulate them all for their success.
They are listed in no particular order.
Figure 32: Best individual recruitment
consultants 2015
Top-Consultant.com
RECRUITMENT
AGENCIES
Sasha Kemp - SK Consultancy Solutions
Rakesh Pabbi - Consulting Point
Craig Milbourne - Comms Point
Luke Mulholland - Selecture
Sally Wilson - Penna
Evelina Butkute - Selecture
Chris Sale - Prism
James Cox - Consulting Point
Darren Head - Selecture
Genene Cooper - Michael Warwick Nicholls
Find out how your firm could attract consulting hires
by:
• advertising on our websites
• advertising in our consultancy-focused publications
• accessing our CV databases
• running bespoke careers events
CALL TO SPEAK WITH ONE OF OUR TEAM For more information on Top-Consultant.com’s services or if you have any
questions about the data in this report please contact Bryan Hickson on 0207
667 6880 or email him on [email protected].
REQUEST A BROCHURE Alternatively, please feel free to request a PDF brochure detailing our services.
You may do so by clicking here.
EMAIL US Feel free to email our Customer Services team with any questions
you may have, using the address [email protected].
©2015 Top-Consultant.com. All rights
reserved.
Follow us on: