Top-Down Analysis Using the solariX-TD · Top-Down Analysis Using the solariX-TD ... sub femtomolar...
6
Bruker Daltonics Abstract The solariX-TD TM FTMS represents a turn-key solution for top-down analysis and sets the standard for the detailed investigation of complex biological systems. Superior sen- sitivity, resolving power, and mass accuracy when com- bined with dissociation techniques such as ECD, ETD, and CID, as well as integration with LC-MS and LC-MS/MS. solariX-TD offers outstanding performance for top-down analysis of biomolecules. In this note, we demonstrate the performance of solariX-TD for the analysis of several proteins where traditional bottom-up protein analysis alone might not be effective. Introduction The solariX-TD is a high-end proteomics research solu- tion that is designed to complement more traditional MS instruments. The solariX-TD can be easily integrated into a workflow that consists of other Bruker platforms such as: amaZon TM (Ion Trap), micrOTOF TM (ESI-qTOF), or the Flex Series axial MALDI-TOF. The focus of the solariX-TD is top-down analysis of biomolecules. The top-down con- cept is applicable to peptides, RNA, and carbohydrates both with and without liquid chromatographic separation. The value comes from the combination of extreme per- formance and versatility. This platform uniquely enables Technical Note # TN-33 Top-Down Analysis Using the solariX-TD a workflow for obtaining gross structural information or characterizing subtle modifications of biomolecules. Structural tools Supplementing the arsenal of conventional top-down proteomics structural fragmentation tools (ECD, Q-CID, in-cell SORI-CID) solariX-TD has now taken a quantum leap with the integration of Electron Transfer Dissociation (ETD). Adapting from Bruker’s proven ETD technology, this addition to the API source facilitates rapid and facile dissociation of a wide range of molecules (Figure 1). This exciting new technique is superb for in depth analysis of proteins and peptides and their often labile, posttranslational modifications (PTMs) (Figure 2). ETD enabled analysis is fully automated, and can be used for LC-MS/MS workflows in combination with quadrupole fragmentation (Q-CID) to provide unprecedented levels of protein structural information. solariX-TD retains the ability to perform electron capture dissociation (ECD) as well. This enables detailed complimentary information to be obtained in rigorous top-down workflows. These methods can incorporate the highest “front-end” resolution for the isolation of multiple, narrow m/z ranges, such as a collection of charge states for a mixture of proteins or protein forms (Figure 3).
Transcript of Top-Down Analysis Using the solariX-TD · Top-Down Analysis Using the solariX-TD ... sub femtomolar...
Bruker Daltonics
Abstract
The solariX-TDTM FTMS represents a turn-key solution for top-down analysis and sets the standard for the detailed investigation of complex biological systems. Superior sen-sitivity, resolving power, and mass accuracy when com-bined with dissociation techniques such as ECD, ETD, and CID, as well as integration with LC-MS and LC-MS/MS. solariX-TD offers outstanding performance for top-down analysis of biomolecules. In this note, we demonstrate the performance of solariX-TD for the analysis of several proteins where traditional bottom-up protein analysis alone might not be effective.
Introduction
The solariX-TD is a high-end proteomics research solu-tion that is designed to complement more traditional MS instruments. The solariX-TD can be easily integrated into a workflow that consists of other Bruker platforms such as: amaZonTM (Ion Trap), micrOTOFTM (ESI-qTOF), or the Flex Series axial MALDI-TOF. The focus of the solariX-TD is top-down analysis of biomolecules. The top-down con-cept is applicable to peptides, RNA, and carbohydrates both with and without liquid chromatographic separation. The value comes from the combination of extreme per-formance and versatility. This platform uniquely enables
Technical Note # TN-33
Top-Down Analysis Using the solariX-TD
a workflow for obtaining gross structural information or characterizing subtle modifications of biomolecules.
Structural tools
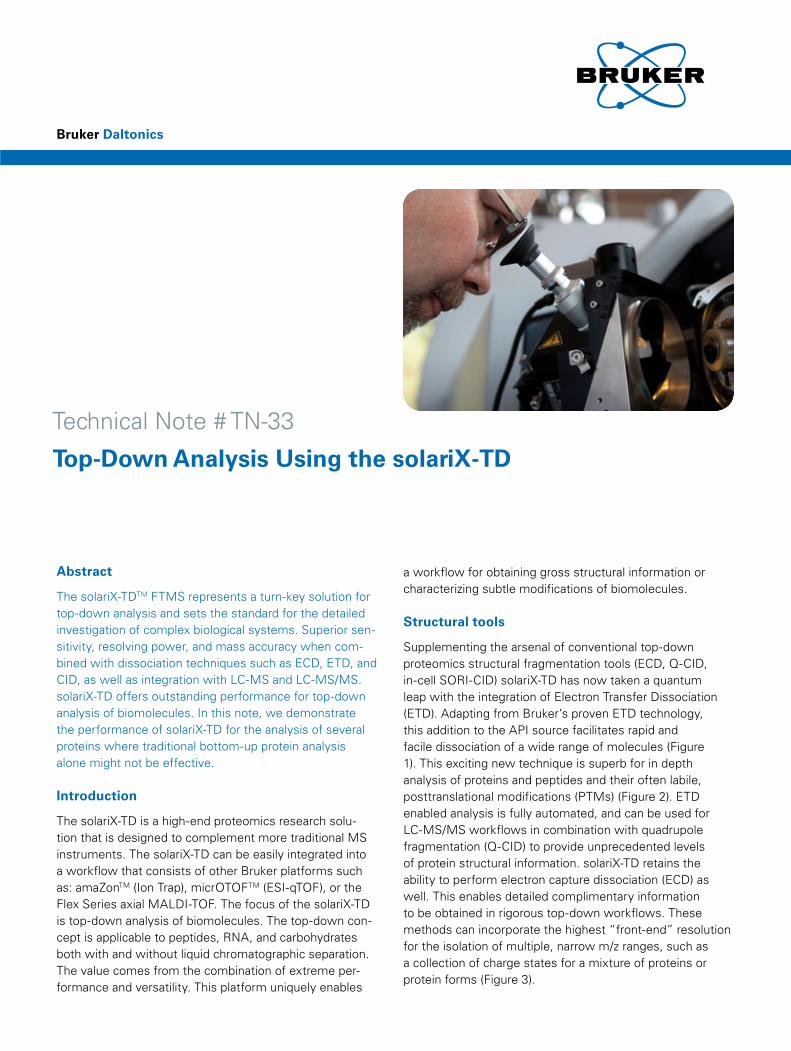
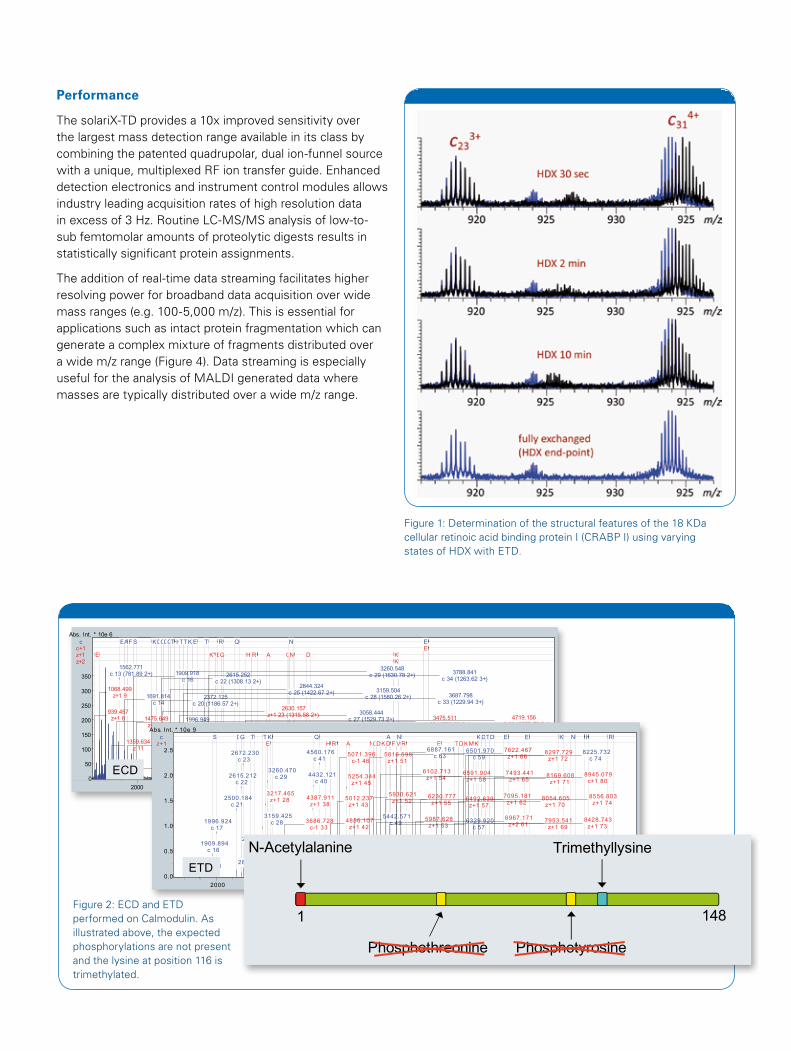
Supplementing the arsenal of conventional top-down proteomics structural fragmentation tools (ECD, Q-CID, in-cell SORI-CID) solariX-TD has now taken a quantum leap with the integration of Electron Transfer Dissociation (ETD). Adapting from Bruker’s proven ETD technology, this addition to the API source facilitates rapid and facile dissociation of a wide range of molecules (Figure 1). This exciting new technique is superb for in depth analysis of proteins and peptides and their often labile, posttranslational modifications (PTMs) (Figure 2). ETD enabled analysis is fully automated, and can be used for LC-MS/MS workflows in combination with quadrupole fragmentation (Q-CID) to provide unprecedented levels of protein structural information. solariX-TD retains the ability to perform electron capture dissociation (ECD) as well. This enables detailed complimentary information to be obtained in rigorous top-down workflows. These methods can incorporate the highest “front-end” resolution for the isolation of multiple, narrow m/z ranges, such as a collection of charge states for a mixture of proteins or protein forms (Figure 3).
Performance The solariX-TD provides a 10x improved sensitivity over the largest mass detection range available in its class by combining the patented quadrupolar, dual ion-funnel source with a unique, multiplexed RF ion transfer guide. Enhanced detection electronics and instrument control modules allows industry leading acquisition rates of high resolution data in excess of 3 Hz. Routine LC-MS/MS analysis of low-to-sub femtomolar amounts of proteolytic digests results in statistically significant protein assignments.
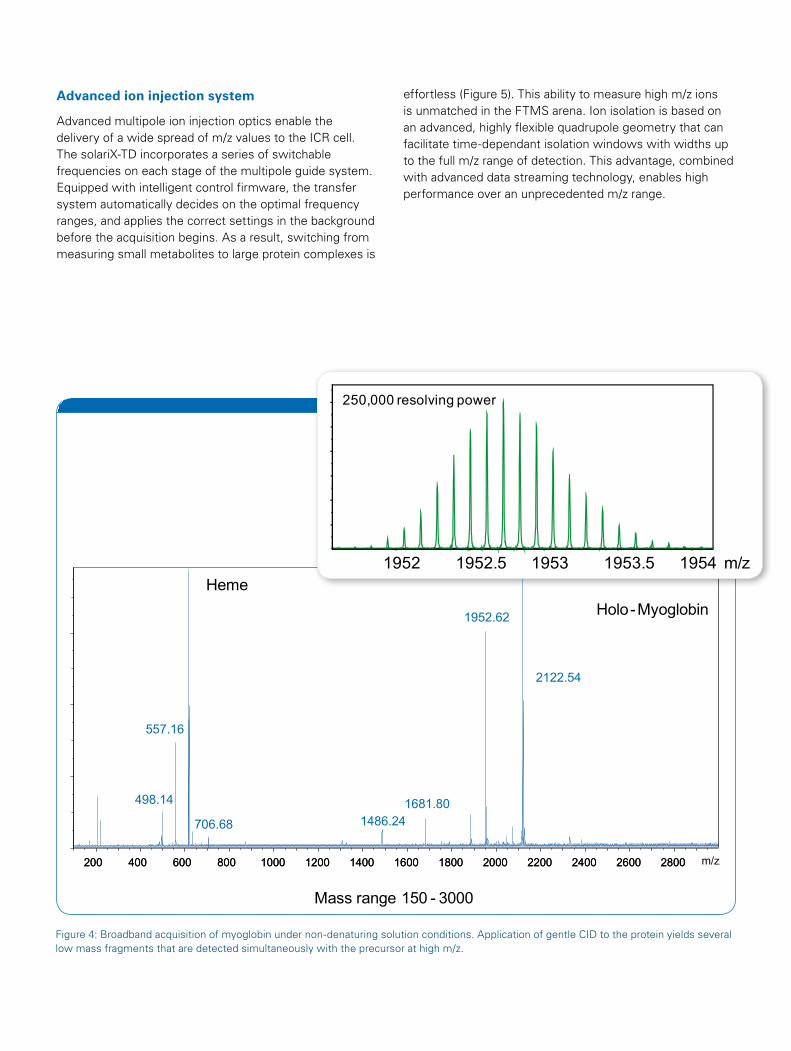
The addition of real-time data streaming facilitates higher resolving power for broadband data acquisition over wide mass ranges (e.g. 100-5,000 m/z). This is essential for applications such as intact protein fragmentation which can generate a complex mixture of fragments distributed over a wide m/z range (Figure 4). Data streaming is especially useful for the analysis of MALDI generated data where masses are typically distributed over a wide m/z range.
Figure 2: ECD and ETD performed on Calmodulin. As illustrated above, the expected phosphorylations are not present and the lysine at position 116 is trimethylated.
m/z2000 4000 6000 8000 10000
0
50
100
150
200
250
300
350
Abs. Int. * 10e 6c EAF S KDGDGT I TTK E T R Q N E
c+1 Ez+1 E K* EG H R A GN D Kz+2 K
939.457z+1 8
1068.499z+1 9
1359.634z 11
1475.649z+2 12
1562.771c 13 (781.89 2+)
1691.814c 14
1701.767z+1 14
1762.853c 15
1909.918c 16
1996.949c 17
2372.125c 20 (1186.57 2+)
2500.228c 21 (1250.62 2+)
2615.252c 22 (1308.13 2+)
2672.274c 23 (1336.64 2+)
2630.157z+1 23 (1315.58 2+)
2787.308c 24 (1394.16 2+)
2844.324c 25 (1422.67 2+)
2945.372c 26 (1473.19 2+)
3003.329z+1 26 (1502.17 2+)
3058.444c 27 (1529.73 2+)
3159.504c 28 (1580.26 2+)
3260.548c 29 (1630.78 2+)
3388.647c 30 (1694.83 2+)
3475.511z+1 30 (1738.26 2+)
3687.798c 33 (1229.94 3+)
3686.790c-1 33 (1843.90 2+)
3804.671z+1 33 (1902.84 2+)
3788.841c 34 (1263.62 3+)
4719.156z+1 41 (1573.72 3+)
ECD
m/z2000 4000 6000 8000 10000
0.0
0.5
1.0
1.5
2.0
2.5
Abs. Int. * 10e 9c S DG T TK Q A N KDTD E E K N I R
z+1 E H R A NGDKD F V R E TDKMK
1562.753c 13
1909.894c 16
1996.924c 17
2500.184c 21
2615.212c 22
2672.230c 23
2844.266c 25
2945.307c 26
3159.425c 28
3217.465z+1 28
3260.470c 29
3346.420z+1 29
3388.592c 30
3686.728c-1 33
4387.911z+1 38
4432.121c 40
4560.176c 41
4718.084z 41
4719.034z+1 41
4856.107z+1 42
5012.237z+1 43
5254.344z+1 45
5071.396c-1 46
5325.373z+1 46
5483.448z+1 48
5442.571c 49
5816.598z+1 51
5930.621z+1 52
5931.625z+2 52
5915.754c 53
5987.628z+1 53
6102.713z+1 54
6230.777z+1 55
6258.887c 56
6345.795z+1 56
6329.920c 57
6492.839z+1 57
6591.904z+1 58
6501.970c 59
6748.061z+1 59
6616.002c 60
6967.171z+2 61
7095.181z+1 62
6887.161c 63
7493.441z+1 65
7622.467z+1 66
7375.339c 67
7839.478z+2 68
7953.541z+1 69
8054.605z+1 70
8169.608z+1 71
8297.729z+1 72
8298.717z+2 72
8070.620c+1 73
8428.743z+1 73
8225.732c 74
8556.803z+1 74
8728.009c 78
8945.079c+1 80
ETD
N-Acetylalanine Trimethyllysine
Phosphothreonine Phosphotyrosine
1 148
Figure 1: Determination of the structural features of the 18 KDa cellular retinoic acid binding protein I (CRABP I) using varying states of HDX with ETD.
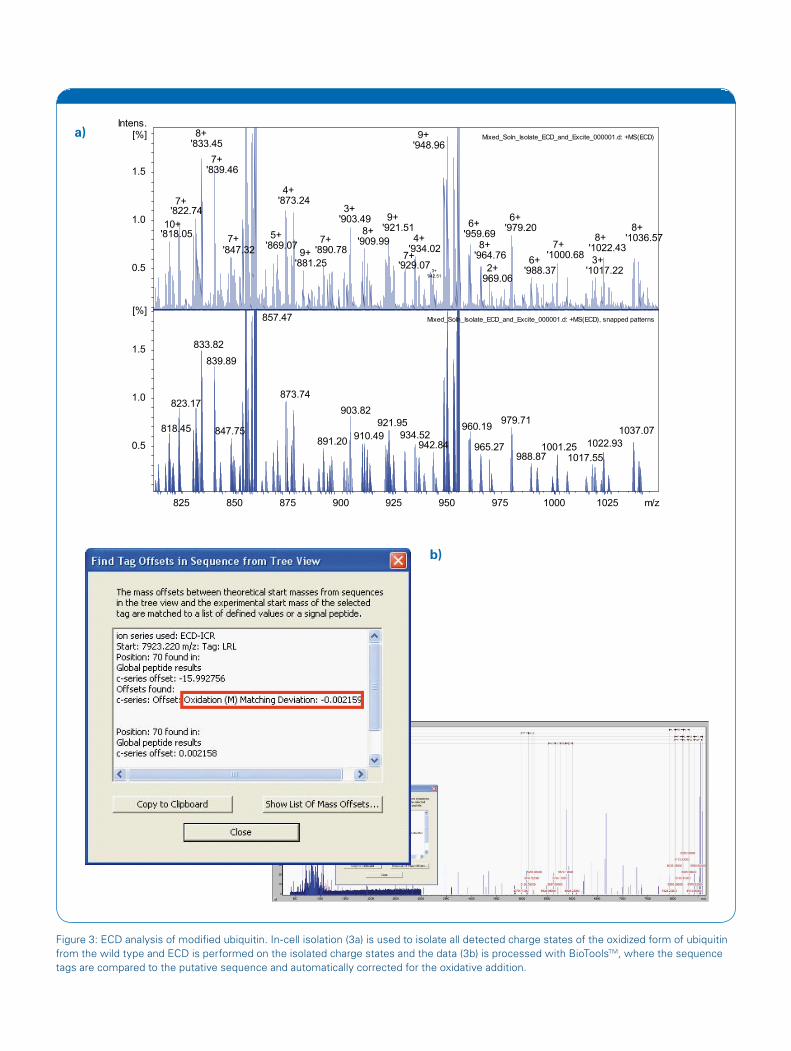
Figure 3: ECD analysis of modified ubiquitin. In-cell isolation (3a) is used to isolate all detected charge states of the oxidized form of ubiquitin from the wild type and ECD is performed on the isolated charge states and the data (3b) is processed with BioToolsTM, where the sequence tags are compared to the putative sequence and automatically corrected for the oxidative addition.
'818.0510+
'822.747+
'833.458+
'839.467+
'847.327+
'869.075+
'873.244+
'881.259+ '890.78
7+
'903.493+
'909.998+ '921.51
9+
'929.077+'934.024+
'942.513+
'948.969+
'959.696+
'964.768+
969.062+
'979.206+
'988.376+ '1000.68
7+
'1017.223+
'1022.438+ '1036.57
8+
Mixed_Soln_Isolate_ECD_and_Excite_000001.d: +MS(ECD)
818.45
823.17
833.82
839.89
847.75
857.47
873.74
891.20
903.82
910.49921.95
934.52942.84
960.19
965.27
979.71
988.871001.25
1017.55
1022.931037.07
Mixed_Soln_Isolate_ECD_and_Excite_000001.d: +MS(ECD), snapped patterns
0.5
1.0
1.5
Intens.[%]
0.5
1.0
1.5
[%]
825 850 875 900 925 950 975 1000 1025 m/z
a)
b)
Advanced ion injection system
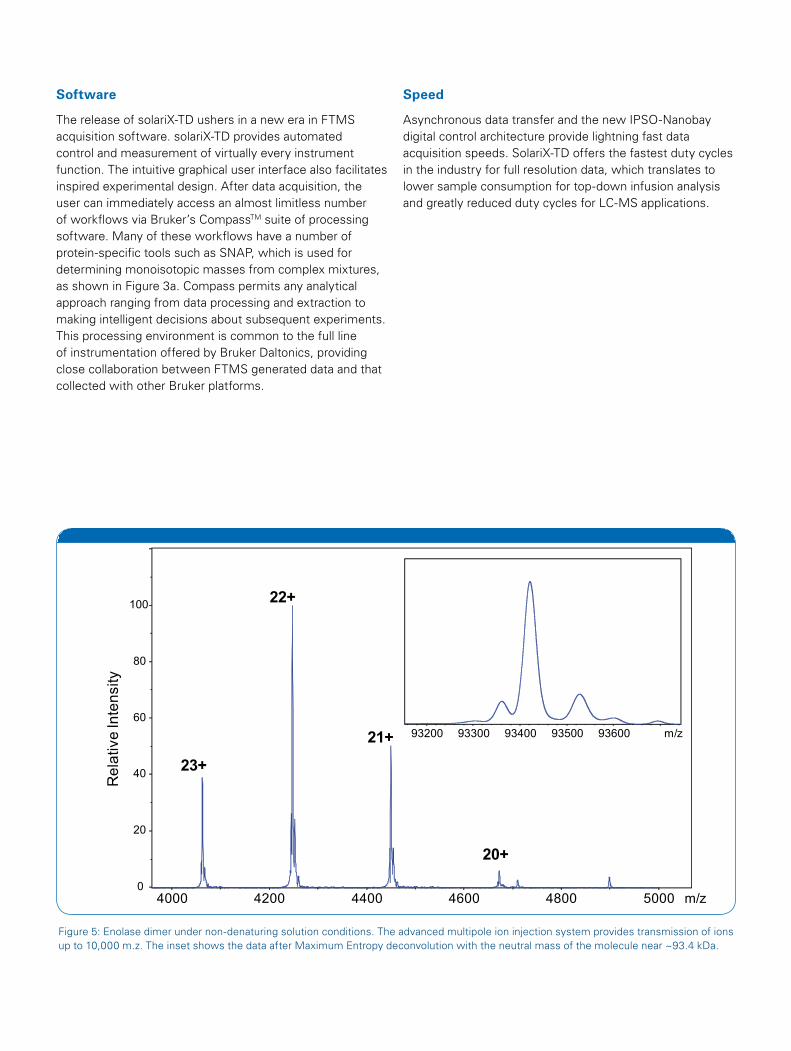
Advanced multipole ion injection optics enable the delivery of a wide spread of m/z values to the ICR cell. The solariX-TD incorporates a series of switchable frequencies on each stage of the multipole guide system. Equipped with intelligent control firmware, the transfer system automatically decides on the optimal frequency ranges, and applies the correct settings in the background before the acquisition begins. As a result, switching from measuring small metabolites to large protein complexes is
effortless (Figure 5). This ability to measure high m/z ions is unmatched in the FTMS arena. Ion isolation is based on an advanced, highly flexible quadrupole geometry that can facilitate time-dependant isolation windows with widths up to the full m/z range of detection. This advantage, combined with advanced data streaming technology, enables high performance over an unprecedented m/z range.
498.14
557.16
706.68 1486.241681.80
1952.62
2122.54
200 400 600 800 1000 1200 1400 1600 1800 2000 2200 2400 2600 2800 m/z200 400 600 800 1000 1200 1400 1600 1800 2000 2200 2400 2600 2800
Mass range 150 - 3000
Heme
Holo-Myoglobin
1952 1952.5 1953 1953.5 1954 m/z
250,000 resolving power
Figure 4: Broadband acquisition of myoglobin under non-denaturing solution conditions. Application of gentle CID to the protein yields several low mass fragments that are detected simultaneously with the precursor at high m/z.
Software
The release of solariX-TD ushers in a new era in FTMS acquisition software. solariX-TD provides automated control and measurement of virtually every instrument function. The intuitive graphical user interface also facilitates inspired experimental design. After data acquisition, the user can immediately access an almost limitless number of workflows via Bruker’s CompassTM suite of processing software. Many of these workflows have a number of protein-specific tools such as SNAP, which is used for determining monoisotopic masses from complex mixtures, as shown in Figure 3a. Compass permits any analytical approach ranging from data processing and extraction to making intelligent decisions about subsequent experiments. This processing environment is common to the full line of instrumentation offered by Bruker Daltonics, providing close collaboration between FTMS generated data and that collected with other Bruker platforms.
Speed
Asynchronous data transfer and the new IPSO-Nanobay digital control architecture provide lightning fast data acquisition speeds. SolariX-TD offers the fastest duty cycles in the industry for full resolution data, which translates to lower sample consumption for top-down infusion analysis and greatly reduced duty cycles for LC-MS applications.
0
20
40
60
80
100
4000 4200 4400 4600 4800 5000 m/z
Re
lativ
e In
ten
sity
93200 93300 93400 93500 93600 m/z
23+
22+
21+
20+
Figure 5: Enolase dimer under non-denaturing solution conditions. The advanced multipole ion injection system provides transmission of ions up to 10,000 m.z. The inset shows the data after Maximum Entropy deconvolution with the neutral mass of the molecule near ~93.4 kDa.
Bruker Daltonik GmbH
Bremen · GermanyPhone +49 (0)421-2205-0 Fax +49 (0)421-2205-103 [email protected]
Bruker Daltonics Inc.
Billerica, MA · USAPhone +1 (978) 663-3660 Fax +1 (978) 667-5993 [email protected]
www.bdal.com
Bru
ker
Dal
toni
cs is
con
tinua
lly im
prov
ing
its p
rodu
cts
and
rese
rves
the
rig
ht
to c
hang
e sp
ecifi
catio
ns w
ithou
t no
tice.
© B
ruke
r D
alto
nics
05
-20
09,
TN
-33
Authors
Michael Easterling, Bruker Daltonics, Billerica MA USA
Keywords
ETD
ECD
resolving power
mass accuracy
sensitivity
posttranslational modifications
proteins
top-down
structural
HDX
Instrumentation & Software
solariX-TD
amaZon
microTOF
Flex series
Compass
BioTools
SNAP
Mascot-TD
For research use only. Not for use in diagnostic procedures.
References
[1] Abzalimov, R.R.; Kaplan, D.A.; Easterling M.L.; Kaltashov, I.A.; JASMS (in press)