TOP 10 CLOUD · TOP 10 CLOUD IaaS Providers Benchmark 2017 NORT H AMERICAN REPORT Price-Performance...
55
TOP 10 CLOUD IaaS Providers Benchmark 2017 NORTH AMERICAN REPORT Price-Performance Analysis of the Top 10 Public IaaS Providers
Transcript of TOP 10 CLOUD · TOP 10 CLOUD IaaS Providers Benchmark 2017 NORT H AMERICAN REPORT Price-Performance...

TOP 10 CLOUD IaaS Providers Benchmark
2017 NORTH AMERICAN REPORT Price-Performance Analysis of the Top 10 Public IaaS Providers

TABLE OF CONTENTS
INTRODUCTION 2
WHY IS THIS INFORMATION NECESSARY? 3 MISCONCEPTIONS ABOUT PERFORMANCE IN CLOUD 3
EXECUTIVE SUMMARY 5
INTRODUCTION 5 PRICE-PERFORMANCE KEY FINDINGS 6 VM PERFORMANCE KEY FINDINGS 7 DISK PERFORMANCE KEY FINDINGS 8
METHODOLOGY 10
THE CRITERIA 10 THE SETUP 11 SIMULTANEOUS TESTING OVER TIME 12 DATA COLLECTION 13 TESTING USED 14 RANKING CALCULATION 15 PRICE-PERFORMANCE VALUE 15 VARIABILITY 17 CONSIDERATIONS 17 DATA CENTER LOCATIONS 19
PRICE-PERFORMANCE VALUE 20
OVERALL CLOUDSPECS RANKING 21 VCPU AND MEMORY VALUE 22 BLOCK STORAGE VALUE 22
PERFORMANCE 23
VCPU AND MEMORY PERFORMANCE 24 BLOCK STORAGE PERFORMANCE 25
PRICING 27
OVERALL PRICING 28 PRICING BY VM CATEGORY 29
PERFORMANCE BY VM SIZE 31
UNDERSTANDING THE CHARTS 31 SMALL VMS 32 MEDIUM VMS 37 LARGE VMS 42 EXTRA LARGE VMS 47 ABOUT CLOUD SPECTATOR 52
APPENDIX: VM & STORAGE CONFIGURATIONS 53

Copyright 2017 Cloud Spectator, LLC. All Rights Reserved. [email protected] +1 (617) 300-0711 2
INTRODUCTION
A public cloud service provider (CSP) offers instantaneous, scalable virtual infrastructure with utility
billing. While the public cloud IaaS industry streamlines IT through these advantages, a lack of
standardization in performance can lead to businesses overspending in order to obtain the necessary
performance requirements for their applications.
Cloud Spectator set out to test 10 of the largest, most well-known public cloud providers with data
centers in North America. This report measures and ranks CSPs using a comprehensive performance
and price-performance methodology designed by Cloud Spectator specifically for the purpose of
measuring cloud environments. The study documented in this report examines the performance of
vCPU, memory, and block storage as well as the value (the CloudSpecsTM Score) as defined by the
relationship between price and performance.
In conjunction with a proper process for cloud vendor selection, this report serves to assist in the
purchasing decision by assessing performance and price-performance in a holistic, industry view. The
report is specifically designed to educate readers on the variation in performance and price-
performance value across public cloud providers. Performance is a critical and often overlooked
component when making a cloud purchase decision, but can have substantial impact on annual
operating costs.

Copyright 2017 Cloud Spectator, LLC. All Rights Reserved. [email protected] +1 (617) 300-0711 3
WHY IS THIS INFORMATION NECESSARY?
A lack of transparency in the public cloud IaaS marketplace for performance often leads to
misinformation or false assumptions. Users and potential users may be led to view cloud computing
as a commodity, differentiated mostly by services. The reality of performance in cloud computing
impacts the user differently from CSP to CSP, involving everything from the physical hardware (e.g.,
Intel or AMD, SSD or spinning disk), to the cost of the virtualized resources. By identifying
environments based on performance rather than resource count, users are able to maximize value in
the cloud.
MISCONCEPTIONS ABOUT PERFORMANCE IN CLOUD
1. VM performance is the same from CSP to CSP.
While CSPs often use the same terms to label resources (i.e., vCPUs, RAM or memory, and block
storage), differences in the underlying hardware, architecture, and performance tuning lead to
entirely different results from the same terms such as vCPUs. For example, on VM performance
alone (the virtual processor and memory), the 10 IaaS providers in this report exhibited differences
of up to 1.9x. With block storage performance, differences exceeded 18x.
2. For performance, you get what you pay for.
When it comes to additional services such as support, security, geographical location, and
managed services on CSPs, this may be true; however, regarding performance, this study found
no correlation between price and performance. The study demonstrated the best-value CSPs in
this report (defined as the ratio of price and performance as ranked by the CloudSpecs ScoreTM)
offer virtualized resources at the lowest prices. Similarly sized VMs within the 10 IaaS providers
Copyright 2017 Cloud Spectator, LLC. All Rights Reserved. [email protected] +1 (617) 300-0711 4
tested displayed a spectrum of prices with up to a 5.8x difference between the least and most
expensive CSPs.
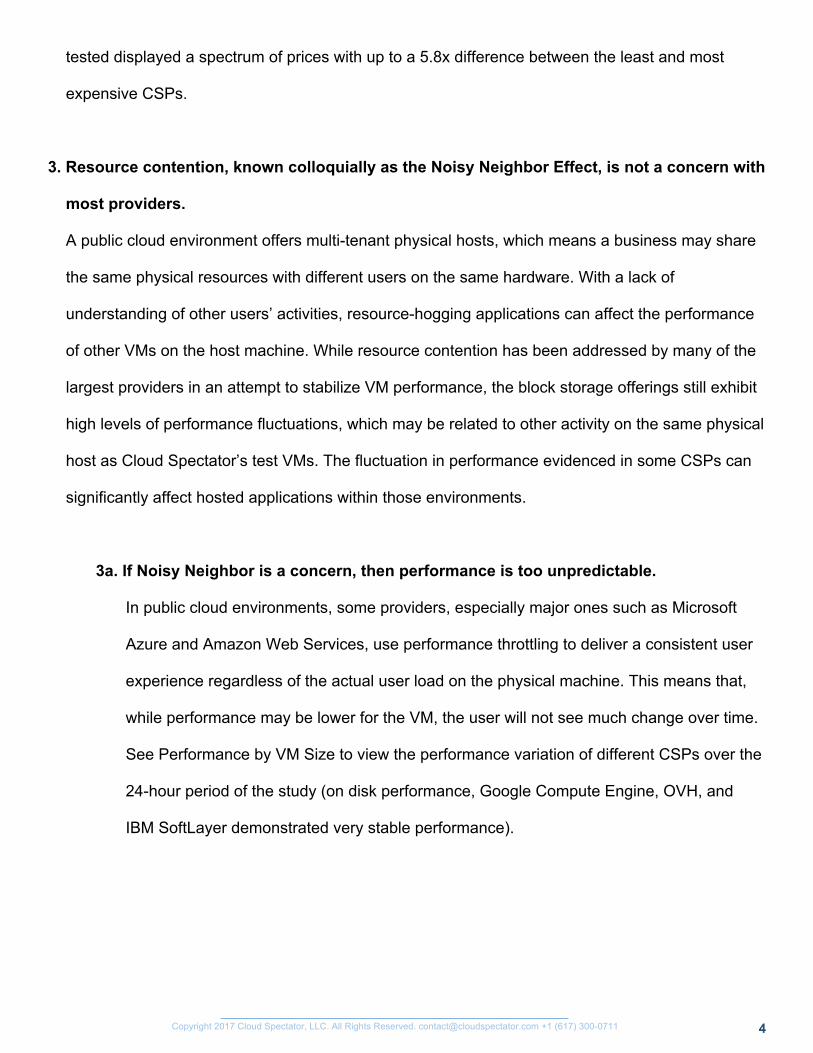
3. Resource contention, known colloquially as the Noisy Neighbor Effect, is not a concern with
most providers.
A public cloud environment offers multi-tenant physical hosts, which means a business may share
the same physical resources with different users on the same hardware. With a lack of
understanding of other users’ activities, resource-hogging applications can affect the performance
of other VMs on the host machine. While resource contention has been addressed by many of the
largest providers in an attempt to stabilize VM performance, the block storage offerings still exhibit
high levels of performance fluctuations, which may be related to other activity on the same physical
host as Cloud Spectator’s test VMs. The fluctuation in performance evidenced in some CSPs can
significantly affect hosted applications within those environments.
3a. If Noisy Neighbor is a concern, then performance is too unpredictable.
In public cloud environments, some providers, especially major ones such as Microsoft
Azure and Amazon Web Services, use performance throttling to deliver a consistent user
experience regardless of the actual user load on the physical machine. This means that,
while performance may be lower for the VM, the user will not see much change over time.
See Performance by VM Size to view the performance variation of different CSPs over the
24-hour period of the study (on disk performance, Google Compute Engine, OVH, and
IBM SoftLayer demonstrated very stable performance).

Copyright 2017 Cloud Spectator, LLC. All Rights Reserved. [email protected] +1 (617) 300-0711 5
EXECUTIVE SUMMARY
INTRODUCTION
This report examines the results of a study measuring and comparing the performance and price-
performance value of 10 CSPs within the North American region. While the CSPs included in the
study did not have to be headquartered in North America, they must have at least one data center
located within the North American continent (see Methodology page 11).
The list of 10 CSPs included major providers like Amazon AWS, Google Compute Engine, Microsoft
Azure, and IBM SoftLayer. Smaller CSPs, some of which specialize in high performance and
aggressive pricing, can achieve higher CloudSpecs ScoresTM.
The performance results are separated into two categories: VM Performance and Block Storage
Performance. VM Performance tests the CPU and memory of the virtual machine. This performance
data is aggregated into one score including both CPU and memory. Block storage is tested using two
different tests detailed in the methodology section (page 11).

Copyright 2017 Cloud Spectator, LLC. All Rights Reserved. [email protected] +1 (617) 300-0711 6
PRICE-PERFORMANCE KEY FINDINGS
• Value, defined as the ratio of price and performance (see Methodology page 16) varies by 7.7x
across the compared IaaS providers.
• 1&1 achieves the highest CloudSpecs ScoreTM in the Top 10 cloud IaaS providers ranking.
This is due to strong VM performance and the most inexpensive packaged pricing found in the
study.
• While certain providers such as Rackspace may have achieved above-average performance
for VM environments, the price-performance value achieved by those types of providers were
lower due to higher costs. This study does not account for additional features such as
managed services, which are included in Rackspace’s pricing.
100
80
49 4842
31 2724
1913
0
10
20
30
40
50
60
70
80
90
100
CL
OU
DS
PE
CS
SC
OR
E
CSP
Chart 2.1: Overall CloudSpecs Ranking

Copyright 2017 Cloud Spectator, LLC. All Rights Reserved. [email protected] +1 (617) 300-0711 7
VM PERFORMANCE KEY FINDINGS
• In certain scenarios, providers exhibited a difference of almost 2x in VM (CPU & memory)
performance, emphasizing the need for performance testing to understand value.
• The differences in performance across the Top 10 providers illustrate a lack of standardization in
public cloud IaaS. Overall, Microsoft Azure’s VMs (Performance Index score of 92 with 2%
variability) demonstrated the highest median performance and lowest performance variability,
while DigitalOcean’s VMs demonstrated the lowest median performance and highest performance
variability (Performance Index score of 60 with 16% variability) in the study.
• Amazon AWS, Microsoft Azure, and Google Compute Engine showed the least performance
variability in the 24-hour testing period.

Copyright 2017 Cloud Spectator, LLC. All Rights Reserved. [email protected] +1 (617) 300-0711 8
BLOCK STORAGE PERFORMANCE KEY FINDINGS
*Amazon’s disk variability is artificially high due to an initial burst period that lasted until the volume ran out of I/O credits.
• Dimension Data’s disk performance variability exceeded 66% in certain scenarios.
• Microsoft Azure showed the lowest performance variability over the testing period. Amazon AWS
demonstrated controlled performance throttling on disk IOPS as well. The level of throttling on
AWS EBS disks is determined by the size of the disk. The high amount of variability on AWS is
due to a burst function that is built in to EBS and is not representative of an unstable environment.
• Rackspace tested highest in median disk IOPS performance with moderate performance
variability at 12%.

Copyright 2017 Cloud Spectator, LLC. All Rights Reserved. [email protected] +1 (617) 300-0711 9
Table 2.1: Performance and Variability of CSPs Over 24 Hours
VM Block Disk
Performance Index Variability Performance Index Variability
1&1 94 6% 49 21% Amazon* 75 1% 17 49% Azure 92 2% 18 2% CenturyLink 83 8% 11 28% DigitalOcean 60 16% 48 9% Dimension Data 89 3% 11 55% Google 67 1% 50 3% OVH 96 4% 33 2% Rackspace 95 5% 90 12% SoftLayer 79 4% 20 4%
*Amazon’s disk variability is artificially high due to an initial burst period that lasted until the volume ran out of I/O credits.
Table 2.1 lists the indexed performance scores and variability percentages by CSP. These numbers
are used in generating Charts 2.2 and 2.3.
The Performance Index is calculated by indexing the individual performance scores achieved by each
VM category (categorized as Small, Medium, Large and Extra Large; see Methodology for more
information) on a scale of 0-100 with 100 as the highest possible score. An average across all VM
categories is calculated to represent the Performance Index for each provider.
Variability is calculated as the average coefficient of variation (CV), which is the standard deviation
expressed as a percentage of the mean performance for the VM categories of each CSP. Higher CV
correlates to more fluctuation in performance (i.e., higher performance variability) over the test period.

Copyright 2017 Cloud Spectator, LLC. All Rights Reserved. [email protected] +1 (617) 300-0711 10
METHODOLOGY
The Cloud Spectator team designed this methodology to measure the performance of various
public cloud infrastructure services. These results will provide a general insight into the public
cloud industry; however, businesses have varying needs when defining performance
requirements, so businesses should apply testing methodologies relevant to their business and
technical use cases to yield more relevant results.
THE CRITERIA
In order to be considered and tested as one of the IaaS providers in this report, a CSP must deliver
the following as part of its IaaS offering:
1. The CSP must have at least one data center located within the North American continent. The
CSP does not need to be headquartered in North America.
2. Self sign-up: a user must be able to sign up for a CSP’s services online, rather than reaching
out to a sales representative. Contact forms that request users to message the CSP for signup
are not considered self sign-up.
3. Self-service: a user must be able to log into a portal that allows the user to provision, manage,
and terminate virtual machines and other cloud-related services.
4. Hourly billing intervals: the CSP must provide billing by the hour or less. Some CSPs offer
billing by the minute.
5. Only providers with persistent block storage offerings are included in this study. Cloud
Spectator measured disk performance by running performance tests on block storage.

Copyright 2017 Cloud Spectator, LLC. All Rights Reserved. [email protected] +1 (617) 300-0711 11
THE SETUP
The team set up anonymous accounts on all cloud service providers. No CSPs provided the team an
account to provision virtual machines. For all VMs, Ubuntu 14.04 images were operating systems of
choice. In cases when Ubuntu 14.04 was not available, 12.04 was used; if no Ubuntu images were
available, Debian was used. Virtual machines were tested according to four separate categories:
Small, Medium, Large and Extra-Large. Each category contained a prerequisite allocation of VM
resources.
Table 4A: VM Sizing
SIZE vCPU COUNT RAM COUNT (GB) DISK SIZE (GB)
Small 2 4 100
Medium 4 8 150
Large 8 16 200
Extra Large 16 32 500
CSPs were segmented into two categories: (1) Packaged Offering CSPs and (2) Customizable
Offering CSPs. Packaged Offering CSPs include providers such as Amazon AWS and Microsoft
Azure, which deliver VMs based on pre-packaged sizes; for example, a customer can purchase an
Instance size of c4.xlarge on AWS. Customizable Offering CSPs allow users to define custom VM
sizes by setting resources such as vCPUs, RAM, and disk space. Only block storage was tested for
disk because of its durability and persistence. This meant that CSPs that only offer local storage were
not included in the report. A single block storage size was paired and tested with each VM size. For
other CSPs such as Amazon AWS, which offers local and persistent block storage, the local storage
was not measured and did not affect the performance or price-performance ranking of the CSP
beyond the potential effect on pricing if local storage is included in packaged VM prices. Please see
the Appendix for a specific list showing what was tested on which providers.

Copyright 2017 Cloud Spectator, LLC. All Rights Reserved. [email protected] +1 (617) 300-0711 12
For Packaged Offering CSPs, the team selected VMs that most closely corresponded to the four
categories of sizes. For Customizable Offering CSPs, the team provisioned servers designed to the
exact requirements of the four categories of sizes when possible.
For each CSP, the team provisioned three copies of VMs for each size; i.e., three Small, three
Medium, three Large, and three Extra-Large VMs were provisioned. All VMs were provisioned and
tested simultaneously for 24 hours. This means that, for each CSP, twelve various-sized VMs were
running from the account on the corresponding provider for 24 hours.
Please note that some CSPs do not offer any VMs with resource allocations that would qualify for the
Extra Large size.
SIMULTANEOUS TESTING OVER TIME
Three resources were examined to compare performance: vCPU, memory, and storage. Performance
tests were run in continuous, iterative sequence according to the following order: vCPU tests and
memory tests followed by block storage tests. Each complete sequence of testing comprised a single
cycle, and cycles repeated without pause for the duration of 24 hours. Different providers completed
varying numbers of cycles within the 24-hour time limit, and the number of cycles completed was
impacted by the performance levels of the resources tested (higher performance allows each test to
be completed faster).
Testing over several iterations impacted the ranking of performance for CSPs. In an uncontrollable
multi-tenant environment, VM performance can be affected by issues that arise with neighboring
VMs. While these issues may be mitigated with resource planning as a responsibility of the CSP,
sometimes performance levels cannot be guaranteed or sustained in the public cloud; therefore,
measuring to examine sustainable performance is just as important on a public cloud as measuring to

Copyright 2017 Cloud Spectator, LLC. All Rights Reserved. [email protected] +1 (617) 300-0711 13
examine achieved performance. This is why the Cloud Spectator team chose to test over a period of
24 hours.
Three VMs of each category size were tested in parallel. Single-VM performance may not necessarily
be reflective of the potential performance a CSP’s VMs can achieve if the provisioned VM is faulty for
any number of reasons. Measuring more than a singular VM of each size mitigates the possibility that
the performance may be an unusual outlier due to a VM provisioning issue, so results are a more
accurate reflection of a VM type’s potential performance.
At other times, the physical host itself may experience issues, affecting all VMs residing on it. By
provisioning all VMs simultaneously, Cloud Spectator may increase the possibility of measuring on
multiple physical hosts with different users and resource contention issues, which would be more
representative of a VM size’s performance. While all of these processes are implemented to increase
the accuracy of the measurements, it should be noted that these practices cannot guarantee 100%
accuracy. Even by provision three of the same VMs of each category, the VMs still have the
possibility of residing on the same physical host depending on the provider’s capacity.
DATA COLLECTION
Throughout the 24-hour period of testing across all qualified and tested providers in this report, a total
of 1,503,285 data points were collected to measure and compare performance variation. Testing was
conducted in January, 2017.
The rankings were produced based on the CloudSpecs ScoreTM, which is a price-performance ratio of
the cost and median performance output of the VM. Each VM size category received a VM
CloudSpecs ScoreTM and a block storage CloudSpecs ScoreTM, which were averaged to calculate a

Copyright 2017 Cloud Spectator, LLC. All Rights Reserved. [email protected] +1 (617) 300-0711 14
CloudSpecs ScoreTM for the VM. The CSPs with the highest average CloudSpecs ScoresTM across all
VMs were then ranked. All 10 tested CSPs were ranked according to price-performance.
TESTING USED
Table 4B: Testing Tools
TEST TOOL TASKS
vCPU Testing Geekbench 3 Integer and Floating Point
Memory Geekbench 3 (using STREAM) Reads and writes
Block Disk Fio Reads and writes
vCPU and Memory
vCPU performance was measured with integer and floating point tasks from the Geekbench 3
benchmark suite. The Geekbench 3 benchmark suite was also used in collecting memory bandwidth
data, which was used to measure the performance of the system memory (RAM).
Storage
Storage performance was measured using fio. Two
storage scenarios were run to capture performance
data: Type 1 and Type 2. In both scenarios, random
and sequential IOPS were recorded as the indicator of
performance over a test period of 60 seconds. Type 1
used a large file size with a small block size, while
Type 2 used a small file size with a large block size.
The total number of files used in testing varied with the
category of VM.
Table 4C: Testing Specifics
CATEGORY TYPE 1 TYPE 2
Block Size 4KB 128KB
File Size 5GB 128MB
Table 4D: Total Files Used in Block Storage Testing
SIZE TYPE 1 TYPE 2
Small 1 2
Medium 2 4
Large 4 8
Extra Large 8 16

Copyright 2017 Cloud Spectator, LLC. All Rights Reserved. [email protected] +1 (617) 300-0711 15
In both testing scenarios, the number of parallel jobs run were set equal to the number of virtual
processors in the VM. Each test scenario was run for 12 hours, for a total of 24 hours.
Table 4E: Type 1 Scenario
SCENARIO BLOCK SIZE FILE SIZE
Type 1 4KB 5GB
Type 2 128KB 128MB
RANKING CALCULATION
The rankings of the 10 CSPs were determined by calculating the median performance of both vCPU-
memory and storage with the monthly cost corresponding to each VM size for two price-performance
scores per VM size (one for vCPU-memory and one for storage). The resulting ratios were
normalized in relation to the highest-value provider for each resource, which receives a score of 100.
Then the two price-performance scores for each VM size were averaged together to get one score
per VM size. The providers were then ordered based on their value across all each VM size, and then
their scores were averaged for all VM sizes to come up with a final score. The providers that
sustained higher ratios across all VM categories ranked highly.
PRICE-PERFORMANCE VALUE (THE CLOUDSPECS SCORE)
Cloud Spectator’s price-performance calculation, the CloudSpecs ScoreTM, provides information on
how much performance the user receives for each unit of cost. The CloudSpecs ScoreTM is an
indexed, comparable score ranging from 0-100 indicative of value based on a combination of cost
and performance. The calculation of the CloudSpecs ScoreTM is:
price-performance_value = [VM performance score] / [VM cost]

Copyright 2017 Cloud Spectator, LLC. All Rights Reserved. [email protected] +1 (617) 300-0711 16
best_VM_value = max{price-performance_values}
CloudSpecs ScoreTM = 100*price-performance_value / best_VM_value
CPU and Memory
Cloud Spectator used the median Geekbench 3 performance scores as the [VM performance score]
to calculate each machine’s CPU and memory CloudSpecs ScoreTM.
Block Storage
For both storage scenarios, median sequential r/w and median random r/w IOPS are used as the [VM
performance score] to calculate each machine’s Type 1 and Type 2 storage CloudSpecs ScoreTM.
Type 1 and Type 2 scores were averaged to calculate a single block storage CloudSpecs ScoreTM.
Overall
Overall storage CloudSpecs ScoreTM was calculated by averaging block storage and vCPU-memory
price-performance scores together so that they have equal weight for each VM size. Then, all
resulting VM size scores were averaged together.
1. For block storage performance, the normalized sequential and random CloudSpecs ScoresTM
were averaged together. 2.
2. Then, the Type 1 and Type 2 CloudSpecs ScoresTM were averaged together to create a single
storage CloudSpecsTM score per VM size.
3. Then, the overall CPU, memory and storage CloudSpecs ScoresTM were calculated by
averaging the CPU and memory CloudSpecs ScoreTM and overall storage CloudSpecs
ScoreTM for each VM size.
4. All VM size scores were then averaged for each provider and normalized to get the final scores
on the scale from 1 to 100.

Copyright 2017 Cloud Spectator, LLC. All Rights Reserved. [email protected] +1 (617) 300-0711 17
VARIABILITY
Variability is calculated by taking the coefficient of variation (CV) of each VM size’s individual
performance data points. The CVs are averaged for all VM sizes per CSP. The coefficient of variation
is the standard deviation expressed as a percentage of the mean.
CONSIDERATIONS
Limitations within the Methodology
The IaaS industry lacks a standard methodology for evaluating CSPs. While the most effective
methodology for measuring value of a CSP varies among use cases, the methodology developed by
Cloud Spectator for this study was designed to capture performance statistics based on synthetic
performance uniquely adopted for cloud infrastructure, which requires steps including extended
testing over a period of time and running multiple VMs in parallel.
Furthermore, the synthetic testing conducted in this study is for measurement of maximum
sustainable performance over a period of 24 hours, and is not representative of any specific
workload. Therefore, the results are used for comparison purposes only, and cannot be applied to
predict application performance. For example, on AWS, the gp2 block volumes demonstrated periods
of burst that were limited due to the continuous bursting over the 24-hour period, but the gp2 would
not be a recommended option for applications that demand the continuously high IOPS performance.
VM Sizes
The performance data in this report only applies to the tested VM and block sizes. Larger VMs may
yield better results with both VM scores and block storage scores. Larger block sizes may also yield
better block storage performance scores. Not all CSPs offered the Extra Large size (see Methodology
page 11) for testing. In those cases, the CloudSpecs Score was calculated by averaging the three
available sizes.
Copyright 2017 Cloud Spectator, LLC. All Rights Reserved. [email protected] +1 (617) 300-0711 18
Pricing Calculations and Discounts
In this report, Cloud Spectator used monthly pricing to calculate the cost of VMs on providers. Some
providers offer sustained-use discounts based on a monthly interval, while others discount for
monthly commitments. Certain providers offer similar discounts on an annual basis or longer; these
longer-term discounts were not factored into the analysis. Where available, monthly discounting was
factored into the pricing calculations; therefore, for longer or shorter time commitments, the rankings
may change.
The Ranking System
The 10 providers included in this report were ranked based on a calculation that considers both
performance and cost of the environments. The performance results of vCPU, memory, and block
storage are all included in the calculation. While some providers may exhibit high performance on
vCPU, memory, and/or block storage, those CSPs may not necessarily rank highly depending on the
cost of their environments as compared to their competitors.
Additional Features and Costs
Only the VM, block storage, and costs of those two components were examined in this study.
Additional features, such as support costs (where applicable), public and private networks, traffic, and
other services that may increase the overall cost of a CSP’s offering, were not examined in the report.
Depending on the types of use cases, the features not examined may impact the overall rankings.
However, if a user can select between different base infrastructure options that have a difference in
performance (e.g. SSD vs. magnetic storage), the options yielding higher performance outputs were
chosen with exception to the pay-to-scale IOPS option, such as Provisioned IOPS. The amount and
cost of the pay-to-scale IOPS option can affect a provider’s ranking.

Copyright 2017 Cloud Spectator, LLC. All Rights Reserved. [email protected] +1 (617) 300-0711 19
DATA CENTER LOCATIONS
All VMs were provisioned in the North American data centers of each CSP. Specific locations, as
described by each CSP, are listed in Table 4E.
Table 4F: Data Center Locations Provider Data Center Location
1&1 US Amazon US East Azure US East 2 CenturyLink Virginia DigitalOcean New York
Dimension Data US East Google US East OVH BHS Rackspace Northern Virginia SoftLayer Washington DC

Copyright 2017 Cloud Spectator, LLC. All Rights Reserved. [email protected] +1 (617) 300-0711 20
PRICE-
PERFORMANCE
VALUE
This section examines the price-performance value (i.e., the
CloudSpecs ScoreTM) of the 10 IaaS providers, which is used in
determining each CSP’s ranking in this report. The CloudSpecs
ScoreTM is calculated as the ratio between the price, defined as the
monthly cost of the VM and block storage, and median
performance of the VM and block storage. For more information on
the calculation of the CloudSpecs ScoreTM, please see the
Methodology.
1&1’s Cloud Server achieves the highest CloudSpecs ScoreTM in
this study (a CloudSpecs Score of 100). CSPs such as Rackspace,
which achieved high performance scores in the previous section,
ranked lower overall due to higher costs of infrastructure.

Copyright 2017 Cloud Spectator, LLC. All Rights Reserved. [email protected] +1 (617) 300-0711 21
OVERALL CLOUDSPECS RANKING
The ranking of the Top 10 CSPs based on CloudSpecs ScoreTM is displayed in Chart 6A.
Value based on price-performance in this study is ranked in relation to the highest-value CSP, 1&1. A
difference in value of 7.7x exists between 1&1, the highest-ranked CSP, and Dimension Data, the
lowest-ranked CSP in the Top 10.
The following sections (vCPU and Memory Value and Block Storage Value) illustrate the individual
Value scores segregated by section, which are the scores used to calculate the overall CloudSpecs
ranking. 1&1 achieves the highest CloudSpecs ranking in both the vCPU and Memory Value category
as well as the Block Storage Value category.
100
80
49 4842
3127
2419
13
0
10
20
30
40
50
60
70
80
90
100
CL
OU
DS
PE
CS
SC
OR
E
CSP
Chart 6A: Overall CloudSpecs Ranking

Copyright 2017 Cloud Spectator, LLC. All Rights Reserved. [email protected] +1 (617) 300-0711 22
VCPU AND MEMORY VALUE
BLOCK STORAGE VALUE
10096
4640 40 39
32 3126
20
0
10
20
30
40
50
60
70
80
90
100
CL
OU
DS
PE
CS
SC
OR
E
CSP
Chart 6B: Average Price-performance Value of CSP's VM Infrastructure
100
61 61 57 54
14 14 12 125
0
10
20
30
40
50
60
70
80
90
100
CL
OU
DS
PE
CS
SC
OR
E
CSP
Chart 6C: Average Price-performance Value of CSP's Block Disk

Copyright 2017 Cloud Spectator, LLC. All Rights Reserved. [email protected] +1 (617) 300-0711 23
PERFORMANCE
This section examines the performance of the 10 IaaS providers
ranked in this report. This section does not use the CloudSpecs
ScoreTM, which is used to rank providers and can be found in the
Price-Performance section of the report.
The period of 24-hour testing across 3 parallel machines for each
category of VMs demonstrated much higher overall stability of
performance in the vCPU and memory components for all
providers, as compared to block storage performance over the
same period. Performance differences are more noticeable as VMs
scale up in size (e.g., the XL size), although a noticeable difference
exists in the small VM category as well.
For detailed information on performance scores by VM size, see
Performance by VM Size on page 32.

Copyright 2017 Cloud Spectator, LLC. All Rights Reserved. [email protected] +1 (617) 300-0711 24
VCPU AND MEMORY PERFORMANCE
Performance differences between CSPs on vCPU and memory increase with the size of the VM:
• The Small VM category exhibits a difference of 1.7x between the highest and lowest-
performing CSP VMs.
• The Extra Large VM category exhibits a difference of 1.9x between the highest and lowest-
performing CSP VMs.
0
5000
10000
15000
20000
25000
30000
35000
S M L X
PE
RF
OR
MA
NC
E S
CO
RE
VM SIZE CATEGORY
Chart 5A: vCPU and Memory Performance (Median Scores Displayed)
1&1
Amazon
Azure
CenturyLink
DigitalOcean
DimensionData
OVH
Rackspace
SoftLayer

Copyright 2017 Cloud Spectator, LLC. All Rights Reserved. [email protected] +1 (617) 300-0711 25
BLOCK STORAGE PERFORMANCE
Because the relationship in performance between providers remained similar with both the random
and sequential operations, only results from the sequential tests are displayed in this section.
Detailed results and random results can be found in the Performance by VM Size on page 32. Each
varying disk size corresponded with a VM category (see Methodology page 11). Two disk scenarios
were measured: Type 1 and Type 2. More information on the two scenarios can be found in the
Methodology (page 11).
• Block storage is not created equally across CSPs in regards to hardware, architecture, or
performance. A difference of more than 18x can exist between highest and lowest-performing
block storage offerings across CSPs.
• While Amazon AWS’s Small, Medium, and Large VMs show performance fluctuation, the
variance is controlled. On AWS, block storage is allocated a limit of burst-performance time;
the limit is dependent on the size of the block storage volume—the larger the volume, the
longer the limit for burst performance. After the burst time limit expires, performance is throttled
also based on the size of the volume. The burst-limit on volumes smaller than 1TB is 3,000
IOPS. The extra-large block volume on AWS shows no performance variance, indicating the
stability of AWS block storage. The burst-model on AWS block storage is specific to the gp2
type. Other models of block storage can yield higher performance without burst, such as the
Provisioned IOPS offering. Provisioned IOPS demonstrates a similar level of high stability in
performance.

Copyright 2017 Cloud Spectator, LLC. All Rights Reserved. [email protected] +1 (617) 300-0711 26
0
2000
4000
6000
8000
10000
12000
14000
16000
18000
S M L X
IOP
S
VM SIZE CATEGORY
Chart 5B: Scenario Type 1 - Sequential Performance (Median Scores Displayed)
1&1
Amazon
Azure
CenturyLink
DigitalOcean
Dimension Data
OVH
Rackspace
SoftLayer
0
500
1000
1500
2000
2500
3000
3500
S M L X
IOP
S
VM SIZE CATEGORY
Chart 5C: Scenario Type 2 - Sequential Performance (Median Scores Displayed)
1and1
Amazon
Azure
CenturyLink
DigitalOcean
Dimension Data
OVH
Rackspace
SoftLayer

Copyright 2017 Cloud Spectator, LLC. All Rights Reserved. [email protected] +1 (617) 300-0711 27
PRICING
This section outlines the cost of the VMs and block storage for each
size examined in the study across all CSPs. Additional services,
unless required (such as Rackspace Managed Services), are not
included in the final cost of the VMs. Only the cost of the VM and
tested block storage were factored into the final cost. Please keep
in mind that some providers may charge for add-on services such
as support, while other providers include it into the cost of the VMs.

Copyright 2017 Cloud Spectator, LLC. All Rights Reserved. [email protected] +1 (617) 300-0711 28
OVERALL PRICING
The final monthly cost of each VM category for each CSP is calculated as the cost of the VM and the
cost of the attached block storage. 1&1 and OVH maintained top ranks as the least-expensive
providers in the price ranking. While DigitalOcean offers lost-cost VMs, its extra-large VM is more
expensive than the alternatives on Google Compute Engine and CenturyLink Cloud.
Table 7A: Monthly Cost of VMs Across CSPs
Small Medium Large Extra Large
1&1 $29.99 $49.99 $129.99 $349.99
Amazon $83.00 $160.27 $310.54 $631.08
Azure $90.19 $163.92 $310.65 $652.02
CenturyLink $64.75 $123.41 $234.62 $481.44
DigitalOcean $50.00 $95.00 $180.00 $530.00
Dimension Data $155.49 $289.08 $534.36 Google $62.24 $115.98 $214.96 $446.92
OVH $34.00 $68.00 $136.00 $272.00
Rackspace $122.27 $219.54 $388.35 $826.70
SoftLayer $128.00 $223.00 $376.00 $766.00
$-
$100.00
$200.00
$300.00
$400.00
$500.00
$600.00
$700.00
$800.00
Small Medium Large Xlarge
MO
NT
HL
Y P
RIC
ING
IN
US
D (
$)
VM SIZING CATEGORY
Chart 7A: Monthly Cost of VMs Across CSPs1&1
Amazon
Azure
CenturyLink
DigitalOcean
Dimension DataGoogle
OVH
Rackspace
SoftLayer

Copyright 2017 Cloud Spectator, LLC. All Rights Reserved. [email protected] +1 (617) 300-0711 29
PRICING BY VM CATEGORY
From small to large-sized VMs, the provider rankings remained the same from the least to most
expensive provider. On the extra-large VMs, sizing allocation is less standardized, with differences in
the amount of memory and local disk (if available) on the VM. The lack of standardization results in
ranking changes on the extra-large VMs: OVH offers the least-expensive VM, and Google Compute
Engine and CenturyLink Cloud offer less-expensive VMs than DigitalOcean. Dimension Data does
not have a VM that fits in the extra-large VM category.
$30 $34
$50 $62 $65
$83 $90
$122 $128
$155
$-$20 $40 $60 $80
$100 $120 $140 $160 $180
1&1 OVH DigitalOcean Google CenturyLink Amazon Azure Rackspace SoftLayer Dimension Data
Mo
nth
ly C
ost
CSP
Chart 7B: Monthly Cost of Small VMs
$50 $68
$95 $116 $123
$160 $164
$220 $223
$289
$-
$50
$100
$150
$200
$250
$300
$350
1&1 OVH DigitalOcean Google CenturyLink Amazon Azure Rackspace SoftLayer Dimension Data
Mo
nth
ly C
ost
CSP
Chart 7C: Monthly Cost of Medium VMs

Copyright 2017 Cloud Spectator, LLC. All Rights Reserved. [email protected] +1 (617) 300-0711 30
$130 $136 $180
$215 $235
$311 $311
$376 $388
$534
$-
$100
$200
$300
$400
$500
$600
1&1 OVH DigitalOcean Google CenturyLink Amazon Azure SoftLayer Rackspace Dimension Data
Mo
nth
ly C
ost
CSP
Chart 7D: Monthly Cost of Large VMs
$272
$350
$447 $481
$530
$631 $652
$766 $827
$-$100 $200 $300 $400 $500 $600 $700 $800 $900
OVH 1and1 Google CenturyLink DigitalOcean Amazon Azure SoftLayer Rackspace
Mo
nth
ly C
ost
CSP
Chart 7E: Monthly Cost of Extra Large VMs

Copyright 2017 Cloud Spectator, LLC. All Rights Reserved. [email protected] +1 (617) 300-0711 31
PERFORMANCE BY VM SIZE
UNDERSTANDING THE CHARTS
VM performance is illustrated using percentile scores retrieved from all data points collected. 5th
percentile and 95th percentile scores are often used instead of minimum and maximum scores in
order to exclude potential outliers. Median scores are used instead of mean to avoid values being
skewed by outliers. The information has been integrated into percentile graphs and value tables
designed to visualize performance variation captured while testing over time. An example of the
performance percentile graph along with a corresponding value table is displayed in Chart 8:
Maximum (MAX): The highest performance score(s) achieved on the VM over the course of the study.
95TH
Percentile (95TH): 95% of all scores on the VM achieved this performance score or lower.
Median (MED): The number separating the higher and lower half of scores. If the median is closer to the 95TH percentile, then more high performance scores were observed than low performance scores (and vice versa).
5TH
Percentile (5TH): 5% of all scores on the VM achieved this performance score or lower.
Minimum (MIN): The lowest performance score(s) achieved on the VM over the course of the study.
0
1000
2000
3000
4000
5000
6000
7000
PE
RF
OR
MA
NC
E S
CO
RE
Chart 8: Sample Chart Guide
Copyright 2017 Cloud Spectator, LLC. All Rights Reserved. [email protected] +1 (617) 300-0711 32
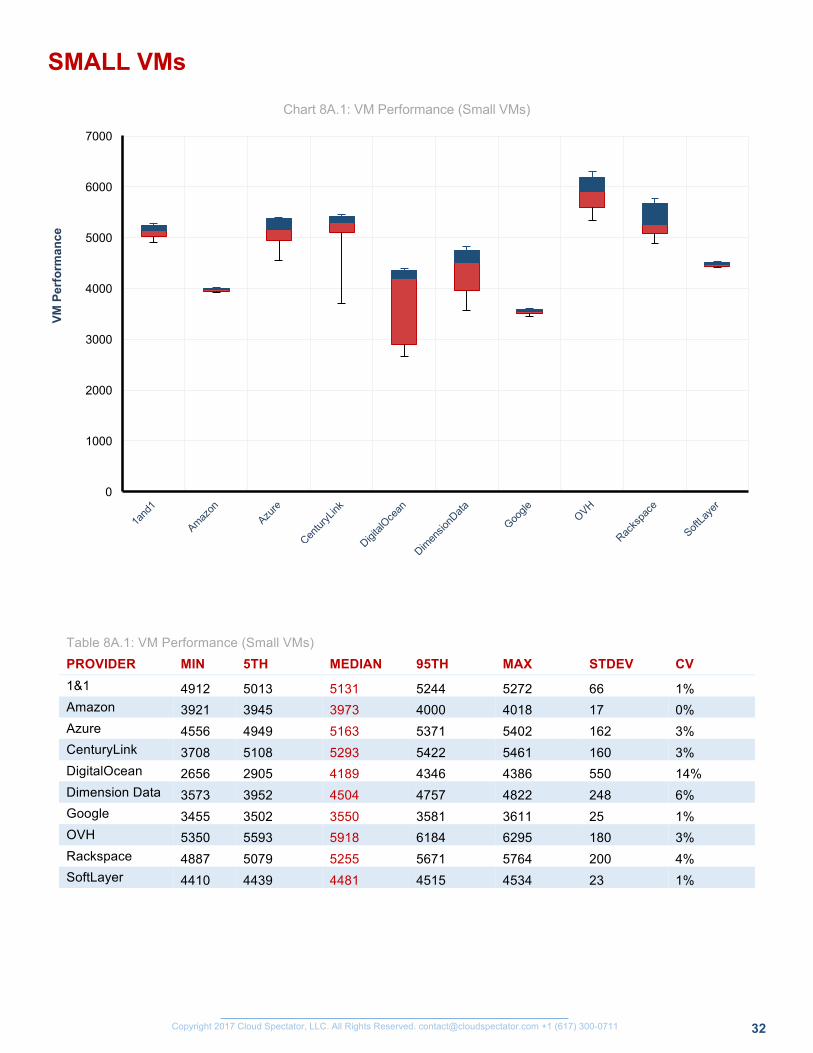
SMALL VMs
Table 8A.1: VM Performance (Small VMs) PROVIDER MIN 5TH MEDIAN 95TH MAX STDEV CV
1&1 4912 5013 5131 5244 5272 66 1% Amazon 3921 3945 3973 4000 4018 17 0% Azure 4556 4949 5163 5371 5402 162 3% CenturyLink 3708 5108 5293 5422 5461 160 3% DigitalOcean 2656 2905 4189 4346 4386 550 14% Dimension Data 3573 3952 4504 4757 4822 248 6% Google 3455 3502 3550 3581 3611 25 1% OVH 5350 5593 5918 6184 6295 180 3% Rackspace 4887 5079 5255 5671 5764 200 4% SoftLayer 4410 4439 4481 4515 4534 23 1%
0
1000
2000
3000
4000
5000
6000
7000
VM
Perf
orm
an
ce
Chart 8A.1: VM Performance (Small VMs)

Copyright 2017 Cloud Spectator, LLC. All Rights Reserved. [email protected] +1 (617) 300-0711 33
Table 8A.2: Sequential Block Disk Performance Type 1 (Small VMs) PROVIDER MIN 5TH MEDIAN 95TH MAX STDEV CV
1&1 818 993 1361 1767 2011 227 16% Amazon 301 301 301 1974 2747 473 114% Azure 389 487 506 507 508 15 3% CenturyLink 162 186 267 424 577 81 29% DigitalOcean 656 764 1184 1331 1423 204 18% Dimension Data 52 80 222 526 586 127 53% Google 1461 1500 1717 1812 1893 97 6% OVH 1493 1791 1849 1882 1906 40 2% Rackspace 2108 2404 2619 2898 2990 172 7% SoftLayer 991 1029 1029 1030 1037 3 0%
0
500
1000
1500
2000
2500
3000
3500
IOP
SChart 8A.2: Sequential Block Disk Performance Type 1 (Small VM)

Copyright 2017 Cloud Spectator, LLC. All Rights Reserved. [email protected] +1 (617) 300-0711 34
Table 8A.3: Random Block Disk Performance Type 1 (Small VMs) PROVIDER MIN 5TH MEDIAN 95TH MAX STDEV CV
1and1 692 902 1278 1776 1873 255 20% Amazon 301 301 301 1728 2499 419 104% Azure 436 490 506 507 510 8 2% CenturyLink 80 164 237 403 496 80 31% DigitalOcean 464 601 974 1121 1180 181 20% Dimension Data 35 79 200 545 622 135 56% Google 1463 1489 1710 1806 1891 97 6% OVH 746 877 1267 1512 1618 181 15% Rackspace 1971 2360 2592 2864 2968 173 7% SoftLayer 999 1029 1029 1030 1030 3 0%
0
500
1000
1500
2000
2500
3000
3500
IOP
SChart 8A.3: Random Block Disk Performance Type 1 (Small VM)

Copyright 2017 Cloud Spectator, LLC. All Rights Reserved. [email protected] +1 (617) 300-0711 35
Table 8A.4: Sequential Block Disk Performance Type 2 (Small VMs) PROVIDER MIN 5TH MEDIAN 95TH MAX STDEV CV
1and1 269 347 538 759 889 125 23% Amazon 304 328 338 908 908 259 52% Azure 205 502 506 508 508 28 6% CenturyLink 114 145 194 261 557 48 24% DigitalOcean 1151 1398 1527 1528 1528 57 4% Dimension Data 81 102 180 506 688 133 56% Google 375 375 375 375 375 0 0% OVH 744 793 800 801 801 5 1% Rackspace 711 1127 1171 1710 1729 234 18% SoftLayer 199 199 199 199 199 0 0%
0
200
400
600
800
1000
1200
1400
1600
1800
2000
IOP
SChart 8A.4: Sequential Block Disk Performance Type 2 (Small VM)

Copyright 2017 Cloud Spectator, LLC. All Rights Reserved. [email protected] +1 (617) 300-0711 36
Table 8A.5: Random Block Disk Performance Type 2 (Small VMs) PROVIDER MIN 5TH MEDIAN 95TH MAX STDEV CV
1and1 214 310 527 707 784 121 23% Amazon 300 300 300 908 908 269 58% Azure 422 502 506 508 508 11 2% CenturyLink 128 138 184 261 431 48 25% DigitalOcean 1011 1209 1521 1527 1528 117 8% DimensionData 62 82 153 419 759 125 66% Google 375 375 375 375 375 0 0% OVH 493 696 776 796 799 40 5% Rackspace 677 1107 1140 1703 1746 245 19% SoftLayer 199 199 199 199 199 0 0%
0
200
400
600
800
1000
1200
1400
1600
1800
2000
IOP
S
Chart 8A.5: Random Block Disk Performance Type 2 (Small VM)

Copyright 2017 Cloud Spectator, LLC. All Rights Reserved. [email protected] +1 (617) 300-0711 37
MEDIUM VMs
Table 8B.1: VM Performance (Medium VMs) PROVIDER MIN 5TH MEDIAN 95TH MAX STDEV CV
1and1 7518 7686 9911 10089 10116 995 11% Amazon 7627 7655 7718 7751 7771 29 0% Azure 8993 9072 9376 9553 9672 156 2% CenturyLink 7038 7625 9657 10189 10358 833 9% DigitalOcean 4918 5122 7299 8000 8257 1119 16% DimensionData 8743 9402 9726 10039 10075 201 2% Google 6261 6716 6854 6947 7033 80 1% OVH 9376 9762 10545 11496 11764 524 5% Rackspace 9352 9483 10158 10386 10732 332 3% SoftLayer 7720 7819 8131 8190 8214 136 2%
0
2000
4000
6000
8000
10000
12000
14000
VM
Perf
orm
an
ce
Chart 8B.1: VM Performance (Medium VMs)

Copyright 2017 Cloud Spectator, LLC. All Rights Reserved. [email protected] +1 (617) 300-0711 38
Table 8B.2: Sequential Block Disk Performance Type 1 (Medium VMs) PROVIDER MIN 5TH MEDIAN 95TH MAX STDEV CV
1and1 725 1672 2900 3833 4288 733 26% Amazon 538 538 539 2768 3198 617 87% Azure 507 507 509 509 509 1 0% CenturyLink 281 319 500 762 841 145 28% DigitalOcean 1766 1995 2369 2596 2659 208 9% DimensionData 62 109 385 950 1276 279 63% Google 3069 3104 3550 3918 3991 263 7% OVH 1983 1989 1998 2001 2062 9 0% Rackspace 2047 3813 4649 5026 5080 453 10% SoftLayer 675 771 1035 1072 1075 97 10%
0
1000
2000
3000
4000
5000
6000
IOP
S
Chart 8B.2: Sequential Block Disk Performance Type 1 (Medium VM)

Copyright 2017 Cloud Spectator, LLC. All Rights Reserved. [email protected] +1 (617) 300-0711 39
Table 8B.3: Random Block Disk Performance Type 1 (Medium VMs) PROVIDER MIN 5TH MEDIAN 95TH MAX STDEV CV
1and1 575 1697 2899 3857 4295 725 26% Amazon 537 537 537 2666 3052 597 85% Azure 507 507 511 515 516 3 1% CenturyLink 265 322 471 823 956 151 30% DigitalOcean 1225 1537 1891 2099 2231 196 11% DimensionData 54 95 293 655 840 177 57% Google 2924 3017 3428 3747 3831 247 7% OVH 1215 1523 1764 1897 1952 136 8% Rackspace 2441 3995 4997 5389 5601 437 9% SoftLayer 746 845 1044 1097 1105 85 8%
0
1000
2000
3000
4000
5000
6000
IOP
S
Chart 8B.3: Random Block Disk Performance Type 1 (Medium VM)

Copyright 2017 Cloud Spectator, LLC. All Rights Reserved. [email protected] +1 (617) 300-0711 40
Table 8B.4: Sequential Block Disk Performance Type 2 (Medium VMs) PROVIDER MIN 5TH MEDIAN 95TH MAX STDEV CV
1and1 420 549 1109 1662 3457 379 34% Amazon 463 465 467 1061 1061 288 42% Azure 399 506 508 508 509 9 2% CenturyLink 172 226 298 439 623 72 23% DigitalOcean 1491 1525 1527 1528 1528 4 0% DimensionData 154 175 372 818 969 217 49% Google 562 563 563 563 563 0 0% OVH 787 797 800 801 801 2 0% Rackspace 1369 1615 2103 2260 2327 262 13% SoftLayer 196 197 199 199 199 1 0%
0
500
1000
1500
2000
2500
3000
3500
4000
IOP
S
Chart 8B.4: Sequential Block Disk Performance Type 2 (Medium VM)

Copyright 2017 Cloud Spectator, LLC. All Rights Reserved. [email protected] +1 (617) 300-0711 41
Table 8B.5: Random Block Disk Performance Type 2 (Medium VMs) PROVIDER MIN 5TH MEDIAN 95TH MAX STDEV CV
1and1 414 533 1130 1572 1821 316 29% Amazon 450 450 451 1056 1056 294 43% Azure 200 506 508 508 509 25 5% CenturyLink 169 196 282 453 643 84 28% DigitalOcean 1416 1520 1527 1528 1528 14 1% DimensionData 129 167 320 713 843 180 48% Google 562 563 563 563 563 0 0% OVH 716 789 798 801 801 9 1% Rackspace 1414 1611 2014 2226 2275 240 12% SoftLayer 197 197 199 199 199 1 0%
0
500
1000
1500
2000
2500
IOP
S
Chart 8B.5: Random Block Disk Performance Type 2 (Medium VM)

Copyright 2017 Cloud Spectator, LLC. All Rights Reserved. [email protected] +1 (617) 300-0711 42
LARGE VMs
Table 8C.1: VM Performance (Large VMs) PROVIDER MIN 5TH MEDIAN 95TH MAX STDEV CV
1and1 14356 17087 18105 18935 19004 624 3% Amazon 13237 13840 14079 14157 14178 121 1% Azure 16891 17243 17625 17819 17895 219 1% CenturyLink 10993 12512 14186 18073 19205 2028 14% DigitalOcean 5994 6486 8724 13609 14618 2091 23% DimensionData 16518 17570 18480 19037 19135 478 3% Google 11600 12438 12692 12822 12990 175 1% OVH 16012 16405 17012 17802 18826 450 3% Rackspace 15167 16021 17895 18208 18286 734 4% SoftLayer 13409 13930 14646 15215 15263 426 3%
0
5000
10000
15000
20000
25000
VM
Perf
orm
an
ce
Chart 8C.1: VM Performance (Large VMs)

Copyright 2017 Cloud Spectator, LLC. All Rights Reserved. [email protected] +1 (617) 300-0711 43
Table 8C.2: Sequential Block Disk Performance Type 1 (Large VMs) PROVIDER MIN 5TH MEDIAN 95TH MAX STDEV CV
1and1 4046 4593 6100 7695 8129 1013 17% Amazon 878 878 879 3109 3110 644 60% Azure 507 508 508 509 509 1 0% CenturyLink 570 628 965 1503 1882 287 28% DigitalOcean 1331 1469 2641 4032 4245 744 29% DimensionData 173 345 1003 2197 2629 559 55% Google 5519 5708 6057 6060 6067 110 2% OVH 1991 1999 2002 2002 2056 9 0% Rackspace 2976 8741 9219 9597 9701 668 7% SoftLayer 1682 1943 2623 2692 2695 269 11%
0
2000
4000
6000
8000
10000
12000
IOP
SChart 8C.2: Sequential Block Disk Performance Type 1 (Large VM)

Copyright 2017 Cloud Spectator, LLC. All Rights Reserved. [email protected] +1 (617) 300-0711 44
Table 8C.3: Random Block Disk Performance Type 1 (Large VMs) PROVIDER MIN 5TH MEDIAN 95TH MAX STDEV CV
1and1 4109 4714 6298 7610 7886 934 15% Amazon 875 877 878 3109 3110 645 60% Azure 508 510 510 512 514 1 0% CenturyLink 604 654 947 1366 2402 286 29% DigitalOcean 1056 1164 1908 3211 3690 632 31% Dimension Data 215 265 662 1098 1394 282 43% Google 5272 5468 6081 6102 6120 207 3% OVH 1641 1806 1965 2010 2120 73 4% Rackspace 3686 8888 9219 9554 9669 582 6% SoftLayer 1346 1593 2666 2748 2754 422 17%
0
2000
4000
6000
8000
10000
12000
IOP
SChart 8C.3: Random Block Disk Performance Type 1 (Large VM)

Copyright 2017 Cloud Spectator, LLC. All Rights Reserved. [email protected] +1 (617) 300-0711 45
Table 8C.4: Sequential Block Disk Performance Type 2 (Large VMs) PROVIDER MIN 5TH MEDIAN 95TH MAX STDEV CV
1and1 1059 1233 1773 2072 2161 247 14% Amazon 610 610 612 1327 1327 351 39% Azure 270 508 509 509 509 19 4% CenturyLink 247 312 405 608 989 109 25% DigitalOcean 1431 1482 1523 1528 1528 19 1% Dimension Data 209 239 516 1470 1845 409 61% Google 751 751 751 751 751 0 0% OVH 784 797 801 801 801 2 0% Rackspace 2106 2211 2782 2971 3050 240 9% SoftLayer 195 196 197 198 199 1 0%
0
500
1000
1500
2000
2500
3000
3500
IOP
SChart 8C.4: Sequential Block Disk Performance Type 2 (Large VM)

Copyright 2017 Cloud Spectator, LLC. All Rights Reserved. [email protected] +1 (617) 300-0711 46
Table 8C.5: Random Block Disk Performance Type 2 (Large VMs)
PROVIDER MIN 5TH MEDIAN 95TH MAX STDEV CV
1and1 1083 1284 1734 2040 2144 236 14% Amazon 606 608 608 1327 1327 354 39% Azure 504 508 509 509 509 1 0% CenturyLink 218 282 391 638 903 124 30% DigitalOcean 1395 1456 1518 1528 1528 25 2% Dimension Data 234 266 425 1208 1654 299 55% Google 751 751 751 751 751 0 0% OVH 779 795 800 801 801 3 0% Rackspace 2120 2288 2771 2937 3012 218 8% SoftLayer 195 196 197 198 199 1 0%
0
500
1000
1500
2000
2500
3000
3500
IOP
SChart 8C.5: Random Block Disk Performance Type 2 (Large VM)

Copyright 2017 Cloud Spectator, LLC. All Rights Reserved. [email protected] +1 (617) 300-0711 47
EXTRA LARGE VMs
Table 8D.1: VM Performance (Extra Large VMs) PROVIDER MIN 5TH MEDIAN 95TH MAX STDEV CV
1and1 21417 24861 31636 32978 33168 3031 10% Amazon 24650 26047 26224 26362 26401 184 1% Azure 28609 29766 31388 32770 33911 967 3% CenturyLink 15510 23407 24197 25309 26933 1173 5% DigitalOcean 11005 13803 16968 18601 19218 1547 9% Google 22584 23231 23790 24158 24333 285 1% OVH 25868 26605 28845 30239 31127 1219 4% Rackspace 21274 25136 31942 34182 34447 2619 8% SoftLayer 18636 21201 26579 28360 28704 2375 9%
0
5000
10000
15000
20000
25000
30000
35000
40000
1and1 Amazon Azure CenturyLink DigitalOcean Google OVH Rackspace SoftLayer
VM
Perf
orm
an
ce
Chart 8D.1: VM Performance (Extra Large VMs)

Copyright 2017 Cloud Spectator, LLC. All Rights Reserved. [email protected] +1 (617) 300-0711 48
Table 8D.2: Sequential Block Disk Performance Type 1 (Extra Large VMs) PROVIDER MIN 5TH MEDIAN 95TH MAX STDEV CV
1and1 4794 5833 7512 10662 12568 1626 21% Amazon 3106 3109 3109 3110 3110 1 0% Azure 2171 2333 2336 2346 2346 21 1% CenturyLink 937 1644 2255 3894 4408 806 32% DigitalOcean 4310 4369 4521 4598 4620 76 2% Google 9847 11898 13817 15727 16040 1141 8% OVH 1990 1997 2001 2002 2011 3 0% Rackspace 9929 10854 15561 16761 16996 2036 14% SoftLayer 2715 3960 5364 5439 5444 762 15%
0
2000
4000
6000
8000
10000
12000
14000
16000
18000
1and1 Amazon Azure CenturyLink DigitalOcean Google OVH Rackspace SoftLayer
IOP
SChart 8D.2: Sequential Block Disk Performance Type 1 (Extra Large VM)

Copyright 2017 Cloud Spectator, LLC. All Rights Reserved. [email protected] +1 (617) 300-0711 49
Table 8D.3: Random Block Disk Performance Type 1 (Extra Large VMs) PROVIDER MIN 5TH MEDIAN 95TH MAX STDEV CV
1and1 3546 3896 6784 10840 11511 2159 31% Amazon 3109 3109 3110 3110 3110 1 0% Azure 2332 2334 2336 2346 2352 5 0% CenturyLink 417 1552 2259 3340 4172 655 28% DigitalOcean 4046 4278 4494 4862 5118 187 4% Google 9526 11420 13071 14809 14968 986 8% OVH 1859 1975 2009 2038 2054 29 1% Rackspace 9110 12194 15594 16741 16968 1688 11% SoftLayer 4084 4608 5375 5490 5592 392 7%
0
2000
4000
6000
8000
10000
12000
14000
16000
18000
1and1 Amazon Azure CenturyLink DigitalOcean Google OVH Rackspace SoftLayer
IOP
SChart 8D.3: Random Block Disk Performance Type 1 (Extra Large VM)
Copyright 2017 Cloud Spectator, LLC. All Rights Reserved. [email protected] +1 (617) 300-0711 50
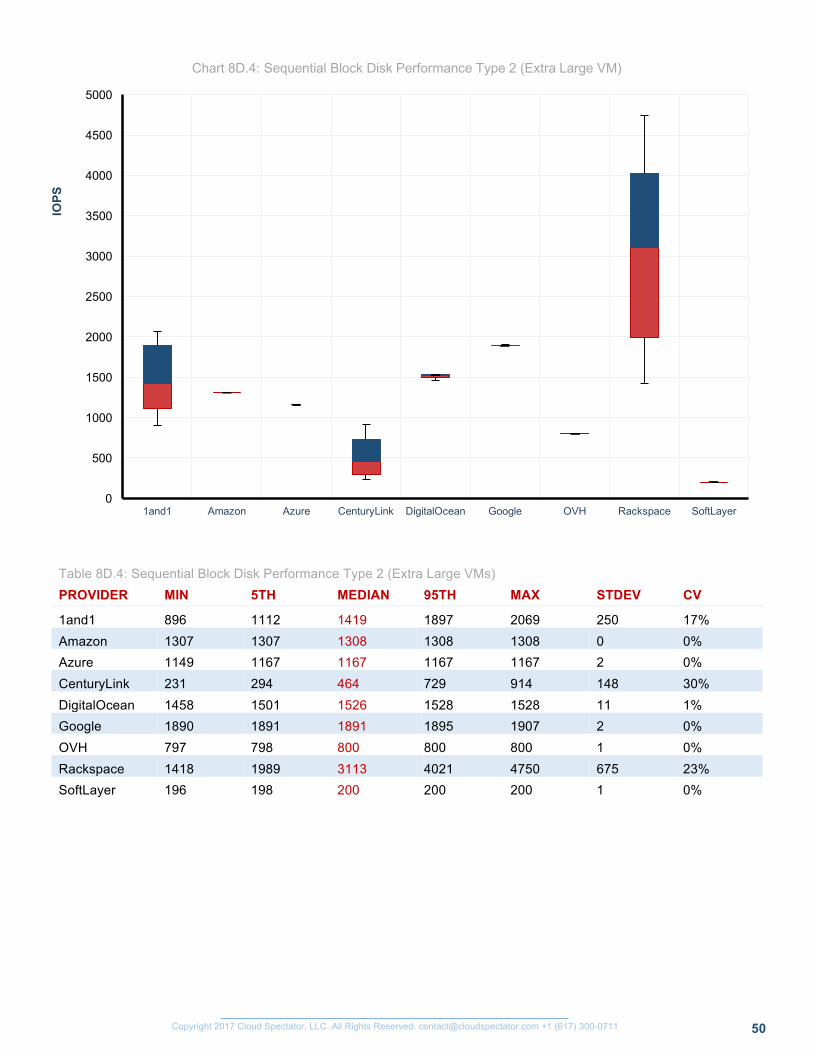
Table 8D.4: Sequential Block Disk Performance Type 2 (Extra Large VMs) PROVIDER MIN 5TH MEDIAN 95TH MAX STDEV CV
1and1 896 1112 1419 1897 2069 250 17% Amazon 1307 1307 1308 1308 1308 0 0% Azure 1149 1167 1167 1167 1167 2 0% CenturyLink 231 294 464 729 914 148 30% DigitalOcean 1458 1501 1526 1528 1528 11 1% Google 1890 1891 1891 1895 1907 2 0% OVH 797 798 800 800 800 1 0% Rackspace 1418 1989 3113 4021 4750 675 23% SoftLayer 196 198 200 200 200 1 0%
0
500
1000
1500
2000
2500
3000
3500
4000
4500
5000
1and1 Amazon Azure CenturyLink DigitalOcean Google OVH Rackspace SoftLayer
IOP
SChart 8D.4: Sequential Block Disk Performance Type 2 (Extra Large VM)

Copyright 2017 Cloud Spectator, LLC. All Rights Reserved. [email protected] +1 (617) 300-0711 51
Table 8D.5: Random Block Disk Performance Type 2 (Extra Large VMs) PROVIDER MIN 5TH MEDIAN 95TH MAX STDEV CV
1and1 874 1078 1310 1756 2096 216 16% Amazon 1307 1307 1308 1308 1308 0 0% Azure 394 1165 1167 1167 1167 81 7% CenturyLink 184 295 439 688 896 136 29% DigitalOcean 1477 1496 1526 1528 1528 11 1% Google 1885 1886 1888 1893 1895 2 0% OVH 787 796 800 800 800 2 0% Rackspace 1524 1803 3114 4101 4722 716 24% SoftLayer 196 198 200 200 200 1 0%
0
500
1000
1500
2000
2500
3000
3500
4000
4500
5000
1and1 Amazon Azure CenturyLink DigitalOcean Google OVH Rackspace SoftLayer
IOP
SChart 8D.5: Random Block Disk Performance Type 2 (Extra Large VM)

Copyright 2017 Cloud Spectator, LLC. All Rights Reserved. [email protected] +1 (617) 300-0711 52
ABOUT CLOUD SPECTATOR
Cloud Spectator is a cloud benchmarking and consulting agency focused on cloud Infrastructure-as-a-Service
(IaaS) performance. The company actively monitors several of the largest IaaS providers in the world,
comparing VM performance (i.e., CPU, RAM, disk, internal network, and workloads) and pricing to achieve
transparency in the cloud market. The company helps cloud providers understand their market position and
helps business make intelligent decisions in selecting cloud providers and lowering total cost of ownership. The
firm was founded in early 2011 and is located in Boston, MA.
For questions about this report, to request a custom report, or if you have general inquiries about our products
and services, please contact Cloud Spectator (www.cloudspectator.com) at +1 (617) 300-0711 or
www.cloudspectator.com

Copyright 2017 Cloud Spectator, LLC. All Rights Reserved. [email protected] +1 (617) 300-0711 53
APPENDIX
Tested VM & Storage Configurations
VM Size Provider Instance StorageType vCPU RAM Storage DataCenter
Small
1and1 CloudServerXL SSDStorage 2 4 120 US
Amazon c4.large SSDEBS 2 3.75 100USEast(N.Virginia)
Azure FS2 PremiumStorageP10(128GB) 2 4 128 USEast2
CenturyLink Customized BlockStorage 2 4 100 Virginia
DigitalOcean 4GB SSDBlockStorage 2 4 100 USEast(NewYork)DimensionData Customized HighPerformanceStorage 2 4 100 USEast
Google Customized SSDPersistentDisk 2 4 100 USEast
OVH HG-7 HighAvailability 2 7 200 BHS
Rackspace Compute1-4 SSDBlockStorage 2 3.75 100 N.Virginia
SoftLayer CustomizedEnduranceBlockStorage10
IOPS/GB 2 4 100 WashingtonDC
Medium
1and1CloudServer
XXL SSDStorage 4 8 160 US
Amazon c4.xlarge SSDEBS 4 7.5 150USEast(N.Virginia)
Azure FS4 PremiumStorageP10(128GB) 4 8 128 USEAST2
CenturyLink Customized BlockStorage 4 8 150 Virginia
DigitalOcean 8GB SSDBlockStorage 4 8 150 USEast(NewYork)DimensionData Customized HighPerformanceStorage 4 8 150 USEast
Google Customized SSDPersistentDisk 4 8 150 USEast
OVH HG-15 HighAvailability 4 15 400 BHS
Rackspace Compute1-8 SSDBlockStorage 4 7.5 150 N.Virginia
SoftLayer CustomizedEnduranceBlockStorage10
IOPS/GB 4 8 150 WashingtonDC
Large
1and1CloudServer
3XL SSDStorage 8 16 240 US
Amazon c4.2xlarge SSDEBS 8 15 200USEast(N.Virginia)
Azure FS8 PremiumStorageP10(128GB) 8 16 128 USEast2
CenturyLink Customized BlockStorage 8 16 200 Virginia
DigitalOcean 16GB SSDBlockStorage 8 16 200 USEast(NewYork)DimensionData Customized HighPerformanceStorage 8 16 200 USEast
Google Customized SSDPersistentDisk 8 16 200 USEast
OVH HG-30 HighAvailability 8 30 800 BHS
Rackspace Compute1-15 SSDBlockStorage 8 15 200 N.Virginia
SoftLayer CustomizedEnduranceBlockStorage10
IOPS/GB 8 16 200 WashingtonDC

Copyright 2017 Cloud Spectator, LLC. All Rights Reserved. [email protected] +1 (617) 300-0711 54
ExtraLarge
1and1CloudServer
5XL SSDStorage 16 48 500 US
Amazon c4.4xlarge SSDEBS 16 30 500USEast(N.Virginia)
Azure FS16 PremiumStorageP20(512GB) 16 32 512 USEast2
CenturyLink Customized BlockStorage 16 32 500 Virginia
DigitalOcean 48GB SSDBlockStorage 16 48 500 USEast(NewYork)DimensionData N/A N/A N/A N/A N/A N/A
Google Customized SSDPersistentDisk 16 32 500 USEast
OVH HG-60 HighAvailability 16 60 1600 BHS
Rackspace Compute1-30 SSDBlockStorage 16 30 500 N.Virginia
SoftLayer CustomizedEnduranceBlockStorage10
IOPS/GB 16 32 500 WashingtonDC