Tootsie Roll Industries, Inc. · PDF fileNet Property, Plant and ... CHKSUM Content: 28568...
31
Industries, Inc. Tootsie Roll Annual Report 2012
-
Upload
truonghuong -
Category
Documents
-
view
218 -
download
2
Transcript of Tootsie Roll Industries, Inc. · PDF fileNet Property, Plant and ... CHKSUM Content: 28568...
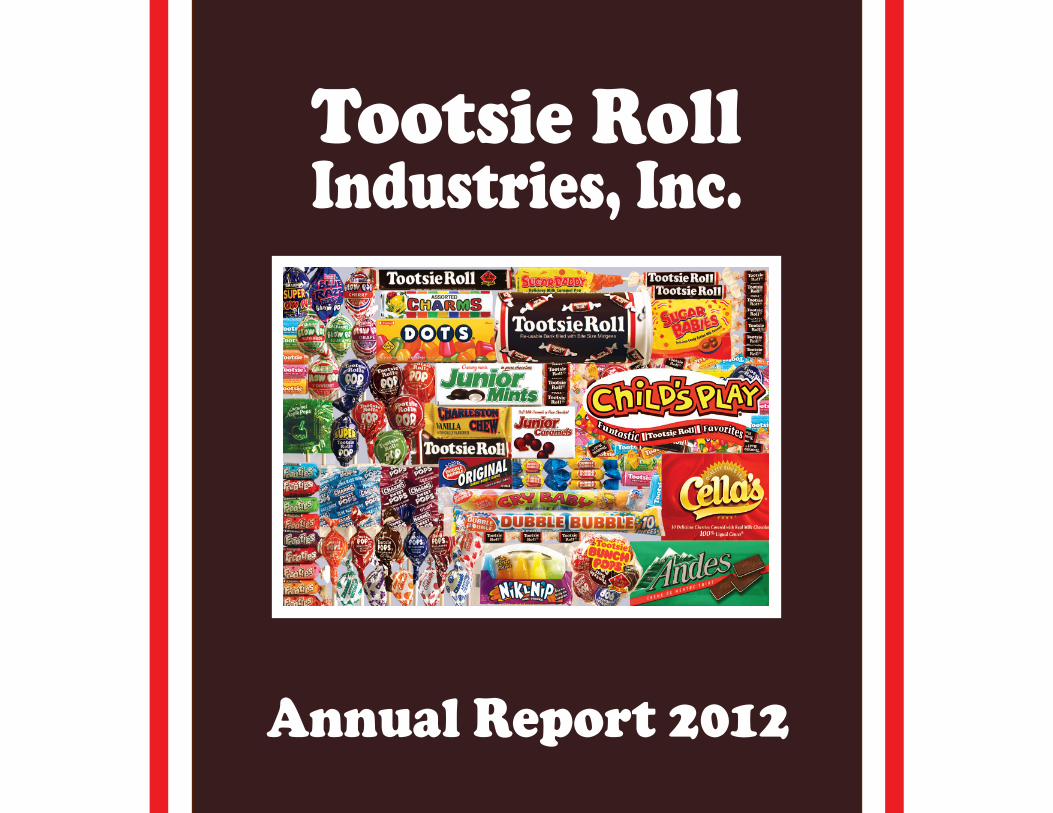
Industries, Inc.Tootsie Roll
Annual Report 2012

Ellen R. Gordon, President and Chief Operating Officer and Melvin J. Gordon, Chairman and ChiefExecutive Officer.
1
We believe that the differences among companies areattributable to the caliber of their people, and therefore we striveto attract and retain superior people for each job.
We believe that an open family atmosphere at work combinedwith professional management fosters cooperation and enableseach individual to maximize his or her contribution to theCompany and realize the corresponding rewards.
We do not jeopardize long-term growth for immediate, short-term results.
We maintain a conservative financial posture in the deploymentand management of our assets.
We run a trim operation and continually strive to eliminate waste,minimize cost and implement performance improvements.
We invest in the latest and most productive equipment to deliverthe best quality product to our customers at the lowest cost.
We seek to outsource functions where appropriate and tovertically integrate operations where it is financiallyadvantageous to do so.
We view our well known brands as prized assets to beaggressively advertised and promoted to each new generationof consumers.
We conduct business with the highest ethical standards andintegrity which are codified in the Company’s “Code of BusinessConduct and Ethics.”
Corporate Principles
Financial Highlights December 31, 2012 2011 (in thousands except per share data)
Net Product Sales . . . . . . . . . . . . . . . $545,985 $528,369
Net Earnings . . . . . . . . . . . . . . . . . . . 52,004 43,938
Working Capital . . . . . . . . . . . . . . . . 136,476 153,846
Net Property, Plant and Equipment . . . . . . . . . . . . . . . . . . 201,290 212,162
Shareholders’ Equity . . . . . . . . . . . . . 649,815 665,935
Average Shares Outstanding* . . . . . 58,742 59,606
Per Share Items*
Net Earnings . . . . . . . . . . . . . . . . . . . $0.89 $0.74
Cash Dividends Paid . . . . . . . . . . . . 0.90 0.32
*Adjusted for stock dividends.
Merrill Corp - Tootsie Roll 10-K 12-05-2012 ED [AUX] | 105123 | 28-Feb-13 03:24 | 12-28786-1.ba | Sequence: 1CHKSUM Content: 28568 Layout: 46811 Graphics: 12884 CLEAN
JOB: 12-28786-1 CYCLE#;BL#: 6; 0 TRIM: 11" x 8.5" AS: CHI COMPOSITECOLORS: Black, ~HTML color, ~HTML color 2, ~note-color 2, ~note-color 3 GRAPHICS: Gordon_new_4c_photo.eps, Tootsie_roll_candy_lrg_logo.eps V1.5

To Our Shareholders
2
2012 Results
We are pleased to report that netproduct sales reached $546 millionin 2012. This was a record for theCompany and an increase of$18 million over 2011 net productsales. Sales increased across all ofour major brands and in keydistribution channels. We also hadanother strong showing in theimportant Halloween selling season.
Net earnings in 2012 were$52 million. This represented anincrease of $8 million over theprevious year. On a per sharebasis, earnings increased to $0.89from $0.74 in the prior year, a $0.15or 20% increase.
Net earnings were favorablyimpacted by higher sales pricerealization which was necessary topartially recover rising commodityand other input costs experiencedin recent years. Although ingredientcosts moderated somewhat duringthe second half of 2012, theyremained comparable to the prioryear and at levels which are high byhistorical standards.
Our Philosophy
We have always maintained a“bottom line” focus and have takenprudent steps to maintain orimprove profitability wheneverpossible. Still, we have done sounder the umbrella of a long-termperspective giving carefulconsideration to what is best for theCompany and our iconic brandsover the long term. As we respondto a developing issue such asincreasing ingredient costs, we takegreat care to ensure that ouractions in the face of current marketconditions will not have an adverse
impact on the Company’s futureprospects.This long-term perspective extendsto every aspect of our operations,whether it is our marketing strategy,human resource development orinvestments in plant operations,equipment and informationtechnology.Over the years, we have continuallyinvested in production technologiesthat are state-of-the-art or better.Consistent with that philosophy ofcontinual reinvestment in theCompany, capital expenditures were$9 million in 2012 and $38 millionover the past three years.We believe that our operations areamong the most efficient in ourindustry. Inasmuch as our brandstend toward being value-oriented,we believe it is essential that ourproduction and distribution systemsoperate with the objective of beingthe low cost producer in each of ourmajor product lines.
Returns to ShareholdersFour regular quarterly cashdividends were paid in 2012.Additionally, in December the Boarddeclared a special dividend of$0.50 per share and acceleratedpayment of the regular quarterlydividend of $0.08 per share whichhas historically been paid duringthe first week in January. Both ofthese actions were in response tothe uncertainty surrounding thefuture federal tax treatment ofdividends at that time after givingconsideration to the Company’scash and investment position. Indeclaring this dividend, the Boardof Directors believed this actionwas in the best interest ofshareholders, and, that the special
dividend was the best utilization ofthe Company’s strong balancesheet for our shareholders.As a result of our conservativefinancial history, we were able topay this special dividend whilemaintaining our strong balancesheet and continuing to invest inour business. This was theseventieth consecutive year theCompany has paid cash dividends.The Company also distributed itsforty-eighth consecutive stockdividend in 2012 and repurchased944,500 shares of its common stockin the open market for an aggregatepurchase price of $24 million.
Cash and InvestmentsThe Company ended 2012 with$200 million in cash andinvestments net of a negligibleamount of interest bearing debt,although $49 million of this isearmarked to hedge the Company’sdeferred compensation liabilities.This is reflective of our conservativeapproach to financing futurebusiness opportunities. We remainpoised to continue investing in ourbusiness, improving manufacturingproductivity and quality, supportingour brands in the competitivemarketplace, paying dividends andrepurchasing common stock. Wealso continue to look forappropriate, complementarybusiness acquisitions.
Sales and MarketingThe confectionery marketplaceoffers many tempting choices forconsumers and we face intensecompetition for both retail shelfspace and for consumers’ dollars.Our key competitive advantage liesin our well-known brands, which
offer high dollar volumes forretailers and attractive values forconsumers. In 2012, successfultargeted promotions and highconsumer awareness of our corebrands lead to continued successin important market niches.Once again, Halloween was ourlargest selling period. Sales weredriven by focused promotionalprograms, particularly in the highvolume grocery, mass merchandise,drug, warehouse club and dollarstore trade channels. Packagedgoods, as well as mixed bagassortments of our most popularitems, were once again successfulin these channels.Complementing our packagedgoods line, we also continue to offermany count good items (sold by thepiece) at a full range of price pointsand numerous entries in theimportant and growing “theaterbox” category, including JuniorMints, the market leader in thiscategory.While our core products consistingof bag goods, count goods andtheater box lines form the nucleusof the Company’s sales, newproducts generate excitement,keep our line fresh and contributeincremental sales growth. Forexample, our popular Blow PopMinis received a makeover for theChristmas, Easter and Valentine’sDay seasons in 2012. Withinnovative new package designsand eye-catching graphics, theseitems make a great on-shelf visualimpression and help to reinforce theimage of Blow Pop Minis as beingcontemporary and fun.We strive to make our venerablebrands available to consumers in awide variety of presentations and
Merrill Corp - Tootsie Roll 10-K 12-05-2012 ED [AUX] | 105123 | 28-Feb-13 03:24 | 12-28786-1.bc | Sequence: 1CHKSUM Content: 5267 Layout: 51160 Graphics: No Graphics CLEAN
JOB: 12-28786-1 CYCLE#;BL#: 6; 0 TRIM: 11" x 8.5" AS: CHI COMPOSITECOLORS: Black, ~note-color 2, ~note-color 3 GRAPHICS: none V1.5
price points, both for every daysnacking and, as in the Blow PopMini example, for seasonaloccasions.
Advertising and Public RelationsWe expanded our digital marketingand social media initiatives during2012. Some of these initiatives weredirected toward candy buyingmothers 25-44 years of age, animportant, tech-savvy Tootsie Rolldemographic group. Ourcampaigns utilized a combinationof target-specific web sites,specialized internet ad networksand social media, as well as,search engine and portal ads in themonths leading up to our keyHalloween selling season. Theprogram this year was capped offwith a video contest solicitingtestimonials to answer the enduringquestion “How many licks does ittake to get to the Tootsie Roll centerof a Tootsie Pop?”
This same theme was againpromoted on popular cabletelevision programs airing ourlong-standing “How Many Licks?”Tootsie Pop commercial. These adsran at various times throughout theyear and with a particular emphasisleading up to Halloween, which isour peak season.
As always, in the wake of thesecampaigns, we received manyconsumer letters advising us justhow many licks it does take to getto the Tootsie Roll center of aTootsie Pop. Also, as expected, theestimates we received variedwidely. With no consensus reached,the long-standing conundrumremains and our advertising stillproclaims: “The world may neverknow!”
In 2012, several of our productswere highlighted in special interestprogramming on network and cabletelevision. Segments on The Chewhighlighted Tootsie Pops and BlowPops, our two market leadingentries in the lollipop category.Food Factory, on the CanadianFood Network, which ran featureson Dubble Bubble and Razzles,was our first such exposure in theCanadian market.
Due to their popularity with viewingaudiences, we have participated ina number of programs such asthese, generating recurringexposure to our brands.
Purchasing
Due to increased supplies, the costof sugar and tropical oils declinedduring 2012. This improvement waslargely offset by increases in thecost of corn-based sweeteners anddomestic edible oils as droughtconditions gripped the MidwestCorn Belt. In addition, the droughtsignificantly increased the cost offeed to dairy farmers resulting indairy prices increasing during thelatter part of the year.
Due to strong world demand, theprice of cocoa powder reachedrecord highs during the year.Packaging costs were essentiallyflat with the prior year, and ouroverall input cost structure wasessentially unchanged from thehigh levels experienced in 2011.
We continue to use formalizedcompetitive bidding programs,hedging and forward purchasecontracts to help shield theCompany from short-term pricefluctuations and to mitigate costincreases whenever possible.
Operations and Supply Chain
The independent factors ofemerging technologies andchanging consumer buyingpatterns result in ongoingopportunities to increase theefficiency of our operations. When aparticular product line or packageconfiguration reaches a certainvolume level, we often find thatinvesting in further automation suchas robotics or reengineering aprocess becomes financiallyjustified.
Technological developments alsoenable us to identify projects inother high priority areas such asproduct quality improvements orworkplace safety enhancements.As a result of the financialresources we have accumulatedover the years, we are able tocapitalize on these opportunitiesand thereby maintain ourcompetitive cost structure andstate-of-the-art facilities.
Information technology is also a keyinvestment priority for the Company.In 2012, we realized enhancedoperational efficiencies andreduced inventory levels as a resultof the company-wide EnterpriseResource Planning (ERP) systeminstalled over the past severalyears. This endeavor also pavedthe way for continuing futureadvancements ranging from aportal to enhance supplierefficiency in our supply chain tofinancial analysis tools and even tothe use of time-saving voice pickingtechnology in our distributioncenters. We believe that theconsiderable resources weexpended to implement the ERPsystem will continue to benefit the
Company in ways both foreseenand unforeseen for years to come.
InternationalThe Company had goodinternational results in 2012. Salesincreased in Canada as weexpanded our offerings in thegrowing dollar store class of trade.Local sales also increased inMexico with another strongChristmas sales performance,which is the most significant candyselling season for the Company inthat market. Exports also grew in2012 with new distribution inseveral promising marketsincluding Europe, the Middle Eastand China. Profits increased in allinternational markets as we wereable to make pricing adjustments tocover increased ingredient andother costs.
In AppreciationWe wish to thank our many loyalemployees, customers, suppliers,sales brokers and domestic andinternational distributors for theircontributions during 2012. We alsothank our fellow shareholders fortheir support over the many yearsas we have met and continue tomeet the challenges of the candymarketplace.
Melvin J. GordonChairman of the Board and Chief Executive Officer
Ellen R. GordonPresident andChief Operating Officer
3
Merrill Corp - Tootsie Roll 10-K 12-05-2012 ED [AUX] | 105123 | 28-Feb-13 03:24 | 12-28786-1.bc | Sequence: 2CHKSUM Content: 2789 Layout: 29721 Graphics: 6250 CLEAN
JOB: 12-28786-1 CYCLE#;BL#: 6; 0 TRIM: 11" x 8.5" AS: CHI COMPOSITECOLORS: Black, ~note-color 2, ~note-color 3 GRAPHICS: ellen_r_gordon_sig.eps, melvin_j_gordon_sig.eps V1.5

4
Management’s Discussion and Analysis of Financial Condition and Results of Operations(in thousands except per share, percentage and ratio figures)
FINANCIAL REVIEW
This financial review discusses theCompany’s financial condition,results of operations, liquidity andcapital resources, significantaccounting policies and estimates,new accounting pronouncements,market risks and other matters. Itshould be read in conjunction withthe Consolidated FinancialStatements and related footnotesthat follow this discussion.
FINANCIAL CONDITION
The Company’s overall financialposition remains very strong as aresult of its 2012 net product sales,net earnings and related cash flowsprovided by operating activities.
During 2012, the Company’s netproduct sales increased from$528,369 in 2011 to $545,985 in2012, an increase of $17,616 or3.3%. Cash flows from operatingactivities totaled $101,919 in 2012compared to $50,390 in 2011. TheCompany used its 2012 cash flowsto pay cash dividends of $52,431,including a one-time specialdividend of $29,138 ($0.50 pershare), purchase and retire $23,803of its outstanding shares, and makecapital expenditures of $8,886.
The Company’s net working capitalwas $136,476 at December 31,2012 compared to $153,272 atDecember 31, 2011 which generally
reflects reductions in inventories. Asof December 31, 2012, theCompany’s aggregate cash, cashequivalents and investments,including all long-term investmentsin marketable securities, was$207,293 compared to $185,668 atDecember 31, 2011, an increase of$21,625. The aforementionedincludes $49,378 and $41,768 intrading securities as of December 31,2012 and 2011, respectively. TheCompany invests in tradingsecurities to provide an economichedge for its deferred compensationliabilities, as further discussedherein and in Note 7 to theConsolidated Financial Statements.
Shareholders’ equity decreased from$665,935 at December 31, 2011 to$649,815 as of December 31, 2012,principally reflecting 2012 netearnings of $52,004, less cashdividends of $52,431, including the$29,138 special one-time dividend,and share repurchases of $23,803during 2012.
The Company has a relativelystraight-forward financial structureand has historically maintained aconservative financial position.Except for an immaterial amount ofoperating leases, the Company hasno special financing arrangementsor “off-balance sheet” specialpurpose entities. Cash flows fromoperations plus maturities of short-term investments are expected to
be adequate to meet the Company’soverall financing needs, includingcapital expenditures, in 2013.Periodically, the Company considerspossible acquisitions, and if theCompany were to pursue andcomplete such an acquisition, thatcould result in bank borrowings orother financing.
Results of Operations
2012 vs. 2011
Net product sales were $545,985 in2012 compared to $528,369 in2011, an increase of $17,616 or3.3%. Net sales in 2012 benefitedfrom effective marketing and sellingprograms, including back-to-schooland pre-Halloween programs, aswell as from higher price realizationneeded to recover some of therising commodity and other inputcosts experienced in recent years.Higher price realization generallyreflects increases in product sales,list prices net of trade promotionsand the effects of any product sizeor weight changes.
Product cost of goods sold were$365,573 in 2012 compared to$365,225 in 2011, an increase of $348or 0.1%. Product cost of goods soldincludes $1,034 and $44 in certaindeferred compensation expenses in2012 and 2011, respectively. Thesedeferred compensation expensesprincipally result from changes in themarket value of investments and
investment income from tradingsecurities relating to compensationdeferred in previous years and are notreflective of current operating results.Adjusting for the aforementioned,product cost of goods solddecreased from $365,181 in 2011to $364,539 in 2012, a decrease of$642 or 0.2%. As a percent of netproduct sales, these adjusted costsdecreased from 69.1% in 2011 to66.8% in 2012, a decrease of 2.3%as a percent of net product sales.The favorable decrease in thesecosts as a percentage of salesprimarily reflects higher pricerealization which was needed torestore a portion of our margins dueto higher commodity and other inputcosts in recent years. Although weexperienced moderating costs forsome ingredients in 2012 comparedto 2011, our unit costs for packagingmaterials, freight and delivery,wages and benefits, and plantoperations continued to increasefurther in 2012 compared to 2011.We have made progress towardrestoring margins to their historicallevels before the increases incommodity costs in recent years,but margins remain below historicallevels prior to these increases incommodity and other input costs.Restoring these margins andcoping with the effects of someongoing high commodity costscontinue to be part of our long-termchallenge.
Merrill Corp - Tootsie Roll 10-K 12-05-2012 ED [AUX] | 105123 | 28-Feb-13 03:24 | 12-28786-1.ca | Sequence: 1CHKSUM Content: 38987 Layout: 28521 Graphics: No Graphics CLEAN
JOB: 12-28786-1 CYCLE#;BL#: 6; 0 TRIM: 11" x 8.5" AS: CHI COMPOSITECOLORS: Black, ~note-color 2, ~note-color 3 GRAPHICS: none V1.5

5
Selling, marketing and administrativeexpenses were $113,842 in 2012compared to $108,276 in 2011, anincrease of $5,566 or 5.1%. Selling,marketing and administrativeexpenses reflect a $3,582 increaseand $15 decrease in certaindeferred compensation expenses in2012 and 2011, respectively. Thesedeferred compensation expensesprincipally result from changes inthe market value of investments andinvestment income from tradingsecurities relating to compensationdeferred in previous years and arenot reflective of current operatingresults. Adjusting for theaforementioned, selling, marketingand administrative expensesincreased from $108,291 in 2011 to$110,260 in 2012, an increase of$1,969 or 1.8%. As a percent of netproduct sales, these adjustedexpenses decreased slightly from20.5% of net product sales in 2011to 20.2% of net product sales in2012. Selling, marketing andadministrative expenses include$45,072 and $45,850 of freight,delivery and warehousing expensesin 2012 and 2011, respectively.These expenses decreased from8.7% of net product sales in 2011 to8.3% of net product sales in 2012,principally reflecting the effects ofhigher price realization.
The Company believes that thecarrying values of its trademarksand goodwill have indefinite lives asthey are expected to generate cashflows indefinitely. In accordancewith current accounting guidance,
goodwill and indefinite-livedintangible assets are assessed atleast annually for impairment as ofDecember 31 or whenever eventsor circumstances indicate that thecarrying values may not berecoverable from future cash flows.No impairments were recorded in2012 or 2011.
The fair values of indefinite livedintangible assets, includingtrademarks, are primarily assessedusing the present value of estimatedfuture cash flows. Managementbelieves that all assumptions usedfor the impairment tests areconsistent with those utilized bymarket participants performingsimilar valuations. The Company’sfair value estimates based on theseassumptions were used to prepareprojected financial informationwhich it believes to be reasonable.Actual future results may differ fromthose projections and the differencescould be material. Holding all otherassumptions constant at the testdate, a 100 basis point increase inthe discount rate or a 100 basispoint decrease in the royalty ratewould reduce the fair value ofcertain trademarks byapproximately 17% and 12%,respectively. Individually, a 100basis point increase in the discountrate would indicate a potentialimpairment of approximately $4,000as of December 31, 2012. However,if the royalty rate were decreasedby 100 basis points no potentialimpairment would be indicated asof December 31, 2012.
Earnings from operations were$69,479 in 2012 compared to$57,966 in 2011, an increase of$11,513. Earnings from operationsinclude $4,616 and $29 in certaindeferred compensation expenses in2012 and 2011, respectively. Asdiscussed above, these deferredcompensation expenses relate tochanges in deferred compensationliabilities resulting from correspondingchanges in the market value oftrading securities and relatedinvestment income that hedge theseliabilities. Adjusting for these deferredcompensation expenses, earningsfrom operations were $74,095 and$57,995 in 2012 and 2011,respectively, an increase of $16,100or 27.8%. This increase in earningsfrom operations principally reflectsthe benefits of increased sales,including higher price realization,as well as some moderation ofingredient costs in 2012 comparedto 2011 and on-going cost controlprograms.
Management believes thecomparisons presented in thepreceding paragraphs after adjustingfor changes in deferred compensationare more reflective of the underlyingoperations of the Company.
Other income, net was $4,685 in2012 compared to $2,946 in 2011,an increase of $1,739. This increaseprincipally reflects higher aggregatenet gains and investment income($4,616 and $29 in 2012 and 2011,respectively) on trading securitieswhich is discussed above. Thesetrading securities were offset by a
like amount of expense in aggregateproduct cost of goods sold andselling, marketing, and administrativeexpenses in the respective years asdiscussed above. Other income,net also includes foreign exchangegains of $442 and $2,098 in 2012and 2011, respectively.
Other income, net includes theresults of the Company’s 50% shareof two Spanish companies whichare accounted for using the equitymethod. These equity methodlosses were $1,019 and $194 for2012 and 2011, respectively; inaddition a pre-tax impairmentcharge of $850 was recorded in2012 write-down the Company’scarrying value to estimated fairvalue. Management estimated fairvalue principally using discountedcash flow and market comparableanalyses. Management believes thebusiness and economic challengesin Spain are likely to continue andmay result in additional equitymethod losses in the future, andthat the Company’s equity investment(carrying value of $2,127 asDecember 31, 2012) could sufferan additional impairment loss at afuture date.
As of December 31, 2012 and2011, the Company’s long-terminvestments include $9,485 and$7,453 ($13,550 original cost),respectively, of Jefferson CountyAlabama Sewer Revenue RefundingWarrants, originally purchased withan insurance-backed AAA rating.This is an auction rate security (ARS)
Merrill Corp - Tootsie Roll 10-K 12-05-2012 ED [AUX] | 105123 | 28-Feb-13 03:24 | 12-28786-1.ca | Sequence: 2CHKSUM Content: 19230 Layout: 61148 Graphics: No Graphics CLEAN
JOB: 12-28786-1 CYCLE#;BL#: 6; 0 TRIM: 11" x 8.5" AS: CHI COMPOSITECOLORS: Black, ~note-color 2, ~note-color 3 GRAPHICS: none V1.5
6
that is classified as an available forsale security. Representatives ofJefferson County and the bondholders were unable to reach asettlement agreement, and therefore,the County filed for bankruptcy in2011. Financial Guaranty InsuranceCompany (FGIC), the bond insurancecarrier, has also filed for bankruptcy.Due to adverse events related toJefferson County and FGIC, as wellas events in the credit markets, theauctions for this ARS failed in 2008through 2012 (and subsequent toDecember 31, 2012). As such, theCompany estimated the fair value ofthis ARS as of December 31, 2012and 2011 utilizing a valuation modelwith Level 3 inputs, as defined byguidance and discussed in Note 10to the Consolidated FinancialStatements.
During the fourth quarter of 2008,the Company determined that themarket decline in fair value of itsJefferson County ARS becameother-than-temporarily impaired, asdefined, and recorded a pre-taximpairment of $5,140. During 2012and 2011, the Company furtherevaluated this investment andconcluded that additional increasesand (declines) in the market valuewere temporary because it was notrelated to further credit impairmentand recorded $2,032 and $678,respectively, as favorable adjustmentsto other comprehensive gain (loss).Although future evaluations of thefair value of this ARS could result inadditional other-than-temporaryclassification of declines in market
value and additional charges toearnings, the $9,485 fair value atDecember 31, 2012 reflects acumulative temporary gain of $1,075in accumulated other comprehensiveincome (loss) as of December 31,2012. The Company continues toreceive all contractual interestpayments on this ARS on a timelybasis and the Company has theintent and ability to hold this ARSuntil recovery of its amortized costbasis. The Company is not currentlyable to predict the outcome of thisbankruptcy, or the amount and timingof net proceeds it may ultimatelyrecover.
The consolidated effective tax ratewas 29.9% and 27.9% in 2012 and2011, respectively. At December 31,2012, the Company’s deferred taxassets include $13,791 of incometax benefits relating to foreignsubsidiary tax loss carry-forwardswhich expire in 2014 through 2031($13,376 of benefits expire between2022 and 2031). The aforementionedreflects the utilization ofapproximately $12,100 of foreigntax loss carry-forwards in 2012. TheCompany has concluded that it ismore-likely-than-not that it wouldrealize the deferred tax assetsrelating to such tax operating losscarry-forwards because it isexpected that sufficient levels oftaxable income will be generatedduring the carry-forward periods.
Net earnings were $52,004 in 2012compared to $43,938 in 2011, andearnings per share were $0.89 and
$0.74 in 2012 and 2011, respectively,an increase of $0.15 or 20.3%.Earnings per share benefited fromthe reduction in average sharesoutstanding resulting from purchasesof the Company’s common stock inthe open market by the Company.Average shares outstandingdecreased from 59,606 in 2011 to58,742 in 2012.
During 2012, the Company receivedits Annual Funding Notice, Notice ofFunded Status, and a RehabilitationPlan (Notices), as defined by thePension Protection Act (PPA), fromthe Bakery and Confectionery Unionand Industry International (BC&T)Pension Fund (Plan), a multi-employerdefined benefit pension plan forcertain Company union employees.The Notices indicate that the Plan’sactuary has certified that the Plan isin critical status, the “Red Zone”, asdefined by the PPA, and that a planof rehabilitation was adopted by theTrustees of the Plan (Trustees) infourth quarter 2012. The Trusteeshave advised that one of the largestcontributors to the Plan filed forbankruptcy and ceased makingcontributions to the Plan in 2011,and that the Plan has achieved lessfavorable investment performancereturns to maintain a favorablefunding status. The Trustees indicatedthat the aforementioned are theprimary reasons for the Plan’sdeterioration to critical status. As ofJanuary 1, 2011 plan valuation date,the BC&T Plan had 116,708participants, of which 32,449 (28%)were active participants, 54,470
(47%) were retired or separatedfrom service and receiving benefits,and 29,789 (25%) were retired orseparated from service and entitledto receive future benefits.
During 2012, a Committee comprisedof an equal number of BC&T Unionand participating employer Trusteesreviewed possible plan changes,including benefit reductions andincreased employer contributions,and concluded that it was notfeasible for the Plan to adoptchanges which would allow it toemerge from critical status withinthe ten year targeted period asdefined in the PPA. The Committeedetermined that rehabilitation withinten years would require 15% annualcompounded surcharges onemployer contributions, and thatsuch action was not feasible andwould likely have an adverse effecton the Plan. Under the RehabilitationPlan adopted, the Plan is projectedto emerge from critical statussometime beyond the 30 yearprojection period. In the event that aplan does not have the financialresources to ultimately pay benefitsat a level specified by law then itmust apply to the Pension BenefitsGuaranty Corporation for governmentfinancial assistance.
The Rehabilitation Plan adoptedrequires that employer contributionsinclude 5% compounded annualsurcharges each year for anunspecified period of time beginningJanuary 2013 (in addition to the 5%interim surcharge initiated in
Merrill Corp - Tootsie Roll 10-K 12-05-2012 ED [AUX] | 105123 | 28-Feb-13 03:24 | 12-28786-1.ca | Sequence: 3CHKSUM Content: 24795 Layout: 53378 Graphics: No Graphics CLEAN
JOB: 12-28786-1 CYCLE#;BL#: 6; 0 TRIM: 11" x 8.5" AS: CHI COMPOSITECOLORS: Black, ~note-color 2, ~note-color 3 GRAPHICS: none V1.5
7
June 2012) as well as certain planbenefit reductions. The Trustees willreview the Plan’s progress each yearand will consider if furtheradjustments, including employersurcharges or plan benefitmodifications, are necessary to meetthe objectives of the RehabilitationPlan. The Trustees have advised thatneither the PPA nor regulatoryguidance currently defines therehabilitation standards for a planthat is not designed to emerge fromcritical status within the 10-yearrehabilitation period. Companycontributions to the Plan were$2,131, $2,046 and $1,923 in eachof the years 2012, 2011 and 2010,respectively. The Company wasadvised by the Plan that if theCompany had withdrawn from thePlan during 2012 its estimatedwithdrawal liability would have been$37,200. Although the Company hasnot made any decisions regardingwithdrawal from the Plan, theCompany is exploring various options,including withdrawal from the Plan.Should the Company actuallywithdraw from the Plan at a futuredate, a withdrawal liability, whichcould be higher than $37,200, wouldbe payable to the Plan. The Companyis currently unable to determine theultimate outcome of the abovediscussed matter and therefore, isunable to determine the effects on itsconsolidated financial statements,but, the ultimate outcome could bematerial to its consolidated results ofoperations in one or more futureperiods.
2011 vs. 2010
Net product sales were $528,369 in2011 compared to $517,149 in 2010,an increase of $11,220 or 2.2%. Thisincrease principally reflects highersales price realization during 2011which was required to recover someof our rising input costs as discussedbelow. Although higher price realizationwas made throughout 2011, mostbecame effective during mid-fourthquarter 2011 after the Company’slarge pre-Halloween selling season,and therefore, a substantial portionof these benefits were not realizeduntil 2012.
Product cost of goods sold were$365,225 in 2011 compared to$349,334 in 2010, an increase of$15,891 or 4.5%. Product cost ofgoods sold includes $44 and $770in certain deferred compensationexpenses in 2011 and 2010,respectively. These deferredcompensation expenses principallyresult from changes in the marketvalue of investments and investmentincome from trading securitiesrelating to compensation deferred inprevious years and are not reflectiveof current operating results. Adjustingfor the aforementioned, product costof goods sold increased from$348,564 in 2010 to $365,181 in 2011,an increase of $16,617 or 4.8%. Asa percent of net product sales, theseadjusted costs increased from 67.4%in 2010 to 69.1% in 2011, an increaseof 1.7% as a percent of net productsales. The Company was adverselyaffected by significantly higher inputcosts, primarily higher ingredientcosts, in 2011 compared to 2010.
Selling, marketing and administrativeexpenses were $108,276 in 2011compared to $106,316 in 2010, anincrease of $1,960 or 1.8%. Selling,marketing and administrativeexpenses reflect a $15 decrease and$2,594 increase in certain deferredcompensation expenses in 2011and 2010, respectively. Thesedeferred compensation expensesprincipally result from changes inthe market value of investments andinvestment income from tradingsecurities relating to compensationdeferred in previous years and arenot reflective of current operatingresults. Adjusting for theaforementioned, selling, marketingand administrative expensesincreased from $103,722 in 2010 to$108,291 in 2011, an increase of$4,569 or 4.4%. As a percent of netproduct sales, these adjustedexpenses increased slightly from20.1% of net product sales in 2010to 20.5% of net product sales in2011. Selling, marketing andadministrative expenses include$45,849 and $43,034 of freight,delivery and warehousing expensesin 2011 and 2010, respectively.These expenses increased from8.3% of net product sales in 2010 to8.7% of net product sales in 2011,principally reflecting higher freightand delivery costs for truckingcarriers, including highersurcharges for diesel fuel.
The fair values of indefinite livedintangible assets, goodwill andtrademarks, are primarily assessedusing the present value of estimatedfuture cash flows. Holding all other
assumptions constant at the testdate, a 100 basis point increase inthe discount rate or a 100 basis pointdecrease in the royalty rate wouldreduce the fair value of certaintrademarks by approximately 16%and 11%, respectively. Individually, a100 basis point increase in thediscount rate would indicate apotential impairment of approximately$2,000 as of December 31, 2011.However, if the royalty rate weredecreased by 100 basis points nopotential impairment would beindicated as of December 31, 2011.
Earnings from operations were$57,966 in 2011 compared to$64,710 in 2010, a decrease of$6,744. Earnings from operationsinclude $29 and $3,364 in certaindeferred compensation expenses in2011 and 2010, respectively. Asdiscussed above, these deferredcompensation expenses relate tochanges in deferred compensationliabilities resulting from correspondingchanges in the market value oftrading securities and relatedinvestment income that hedge theseliabilities. Adjusting for thesedeferred compensation expenses,operating earnings were $57,995and $68,074 in 2011 and 2010,respectively, a decrease of $10,079or 14.8%. This decrease in earningsfrom operations principally reflectssignificantly higher ingredient andother input costs and resulting lowergross profit and operating earningsmargins as discussed above.
Management believes thecomparisons presented in the
Merrill Corp - Tootsie Roll 10-K 12-05-2012 ED [AUX] | 105123 | 28-Feb-13 03:24 | 12-28786-1.ca | Sequence: 4CHKSUM Content: 28371 Layout: 61148 Graphics: No Graphics CLEAN
JOB: 12-28786-1 CYCLE#;BL#: 6; 0 TRIM: 11" x 8.5" AS: CHI COMPOSITECOLORS: Black, ~note-color 2, ~note-color 3 GRAPHICS: none V1.5
8
preceding paragraphs after adjustingfor changes in deferred compensationare more reflective of the underlyingoperations of the Company.
Other income, net was $2,946 in2011 compared to $8,358 in 2010, adecrease of $5,412. This decreaseprincipally reflects a $3,335decrease in net gains and relatedinvestment income on tradingsecurities of $29 and $3,364 in 2011and 2010 which is discussedabove. These trading securitieswere substantially offset by a likeamount of expense in aggregateproduct cost of goods sold andselling, marketing, and administrativeexpenses in the respective yearswhich are also discussed above.Foreign exchange gains were$2,098 and $4,090 in 2011 and 2010,respectively, a decrease of $1,992,which reflects a decrease in netrealized gains on foreign currencyhedging. Other income, net alsoincludes the operating losses of$194 and $342 for 2011 and 2010,respectively, relating to the Company’sequity method investment in two50% owned foreign companies.
The consolidated effective tax ratewas 27.9% and 27.4% in 2011 and2010, respectively. At December 31,2011, the Company deferred taxassets included $16,406 of incometax benefits relating to foreignsubsidiary tax loss carry-forwardswhich expire in future years 2014through 2031. The Companyconcluded that it was more-likely-than-not that it would realize the
deferred tax assets relating to suchtax operating loss carry-forwardsbecause it was expected thatsufficient levels of taxable incomewill be generated during the carry-forward periods.
Net earnings were $43,938 in 2011compared to $53,063 in 2010, andearnings per share were $.76 and$.90 in 2011 and 2010, respectively,a decrease of $.14 or 15.6%.Earnings per share benefited fromthe reduction in average sharesoutstanding resulting from purchasesof the Company’s common stock inthe open market by the Company.Average shares outstandingdecreased from 58,685 in 2010 to57,892 in 2011.
LIQUIDITY AND CAPITALRESOURCES
Cash flows from operating activitieswere $101,919, $50,390 and$82,805 in 2012, 2011 and 2010,respectively. The $51,529 increase incash flows from operating activitiesfrom 2011 to 2012 primarily reflectsthe 2012 increase in net earnings,decreased inventories and prepaidexpenses, and other assets. TheCompany’s investment in enterpriseresource planning and supply chaincomputer systems has resulted inboth improved customer serviceand supply chain efficiencies whilemaintaining lower inventories levels.
During 2008 the Companycontributed $16,050 to a VEBA trustto fund the estimated future costs of
certain employee health, welfareand other benefits. The Companyused the funds, as well as investmentincome in this VEBA trust, to pay theactual cost of such benefits during2011, 2012 and will continue to doso in 2013. At December 31, 2012,the VEBA trust held $2,343 ofaggregate cash, cash equivalentsand investments. This asset value isincluded in prepaid expenses in theCompany’s current assets.
Cash flows from investing activitiesreflect capital expenditures of $8,886,$16,351, and $12,813 in 2012, 2011and 2010, respectively, including$3,025 related to the 2011 purchaseof warehouse space and landplanned for future use. The 2011and 2010 capital additions include$727 and $1,682, respectively,relating to computer systems andrelated implementation.
The Company had no bankborrowing or repayments in 2010,2011, or 2012, and had nooutstanding bank borrowings as ofDecember 31, 2011 or 2012.
Financing activities include Companycommon stock purchases andretirements of $23,803, $18,190, and$22,881 in 2012, 2011 and 2010,respectively. Cash dividends of$52,431, which includes a specialone-time dividend of $29,138,$18,407, and $18,130 were paid in2012, 2011 and 2010, respectively.The increase in cash dividends eachyear reflects the annual 3% stockdividend issued in each of theseyears less the effects of common
stock purchases and retirements inthe respective periods. The fourthquarter 2012 included a special$0.50 per share cash dividend aswell as an accelerated payment ofthe regular quarterly dividend of$0.08 per share which has historicallybeen paid during the first week inJanuary. Both were in response tothe uncertainty surrounding thefuture federal tax treatment ofdividends at that time after givingconsideration to the Company’scash and investment position.
SIGNIFICANT ACCOUNTINGPOLICIES AND ESTIMATES
Preparation of the Company’sfinancial statements involvesjudgments and estimates due touncertainties affecting the applicationof accounting policies, and thelikelihood that different amountswould be reported under differentconditions or using differentassumptions. The Company basesits estimates on historical experienceand other assumptions, as discussedherein, that it believes are reasonable.If actual amounts are ultimatelydifferent from previous estimates, therevisions are included in theCompany’s results of operations forthe period in which the actualamounts become known. TheCompany’s significant accountingpolicies are discussed in Note 1 to theConsolidated Financial Statements.
Following is a summary anddiscussion of the more significantaccounting policies which
Merrill Corp - Tootsie Roll 10-K 12-05-2012 ED [AUX] | 105123 | 28-Feb-13 03:24 | 12-28786-1.ca | Sequence: 5CHKSUM Content: 42595 Layout: 53378 Graphics: No Graphics CLEAN
JOB: 12-28786-1 CYCLE#;BL#: 6; 0 TRIM: 11" x 8.5" AS: CHI COMPOSITECOLORS: Black, ~note-color 2, ~note-color 3 GRAPHICS: none V1.5

9
management believes to have asignificant impact on the Company’soperating results, financial position,cash flows and footnote disclosure.
Revenue recognition
Revenue, net of applicable provisionsfor discounts, returns, allowancesand certain advertising andpromotional costs, is recognizedwhen products are delivered tocustomers based on a customerpurchase order, and collectability isreasonably assured. The accountingfor promotional costs is discussedunder “Customer incentive programs,advertising and marketing” below.
Provisions for bad debts arerecorded as selling, marketing andadministrative expenses. Write-offsof bad debts did not exceed 0.1%of net product sales in each of 2012,2011 and 2010, and accordingly,have not been significant to theCompany’s financial position orresults of operations.
Intangible assets
The Company’s intangible assetsconsist primarily of acquiredtrademarks and goodwill. Inaccordance with accountingguidance, goodwill and otherindefinite-lived assets are notamortized, but are insteadsubjected to annual testing forimpairment unless certain triggeringevents or circumstances are noted.The Company performs its annualimpairment testing as ofDecember 31. The Company may
utilize third-party professionalvaluation firms to assist in thedetermination of valuation of certainintangibles.
The impairment test is performed bycomparing the carrying value of theasset with its estimated fair value,which is calculated using estimates,including discounted projectedfuture cash flows. If the carryingvalue exceeds the fair value, thesecond step of the process isnecessary. The second stepmeasures the difference betweenthe carrying value and implied fairvalue of goodwill. These projectedfuture cash flows are dependent ona number of factors including theexecution of business plans,achievement of projected sales,including but not limited to futureprice increases, projected operatingmargins, and projected capitalexpenditures. Such operatingresults are also dependent uponfuture ingredient and packagingmaterial costs, exchange rates forproducts manufactured or sold inforeign countries, operationalefficiencies, cost savings initiatives,and competitive factors. Althoughthe majority of the Company’strademarks relate to wellestablished brands with a longhistory of consumer acceptance,projected cash flows are inherentlyuncertain. A change in theassumptions underlying theimpairment analysis, including butnot limited to a reduction inprojected cash flows, the use of adifferent discount rate to discountfuture cash flows or a different
royalty rate applied to theCompany’s trademarks, couldcause impairment in the future.
Customer incentive programs,advertising and marketing
Advertising and marketing costs arerecorded in the period to whichsuch costs relate. The Companydoes not defer the recognition of anyamounts on its consolidated balancesheet with respect to such costs.Customer incentives and otherpromotional costs are recorded atthe time of sale based upon incentiveprogram terms and historicalutilization statistics, which aregenerally consistent from year to year.
The liabilities associated with theseprograms are reviewed quarterlyand adjusted if utilization rates differfrom management’s originalestimates. Such adjustments havenot historically been material to theCompany’s operating results.
Split dollar officer life insurance
The Company provides split dollarlife insurance benefits to certainexecutive officers and records anasset principally equal to thecumulative premiums paid. TheCompany will fully recover thesepremiums in future years under theterms of the plan. The Companyretains a collateral assignment ofthe cash surrender values andpolicy death benefits payable toinsure recovery of these premiums.
Valuation of long-lived assets
Long-lived assets, primarily property,plant and equipment are reviewedfor impairment as events orchanges in business circumstancesoccur indicating that the carryingvalue of the asset may not berecoverable. The estimated cashflows produced by assets or assetgroups, are compared to the assetcarrying value to determinewhether impairment exists. Suchestimates involve considerablemanagement judgment and arebased upon assumptions aboutexpected future operatingperformance. As a result, actualcash flows could differ frommanagement’s estimates due tochanges in business conditions,operating performance, andeconomic and competitiveconditions.
Income taxes
Deferred income taxes arerecognized for future tax effects oftemporary differences betweenfinancial and income tax reportingusing tax rates in effect for theyears in which the differences areexpected to reverse. The Companyrecords valuation allowances insituations where the realization ofdeferred tax assets, including thoserelating to net operating tax losses,is not more-likely-than-not; and theCompany adjusts and releasessuch valuation allowances whenrealization becomes more-likely-than-not as defined by accountingguidance. The Company
Merrill Corp - Tootsie Roll 10-K 12-05-2012 ED [AUX] | 105123 | 28-Feb-13 03:24 | 12-28786-1.ca | Sequence: 6CHKSUM Content: 39364 Layout: 61148 Graphics: No Graphics CLEAN
JOB: 12-28786-1 CYCLE#;BL#: 6; 0 TRIM: 11" x 8.5" AS: CHI COMPOSITECOLORS: Black, ~note-color 2, ~note-color 3 GRAPHICS: none V1.5
10
periodically reviews assumptionsand estimates of the Company’sprobable tax obligations and effectson its liability for uncertain taxpositions, using informed judgmentwhich may include the use of third-party consultants, advisors andlegal counsel, and historicalexperience.
Valuation of investments
Investments, primarily municipalbonds, mutual funds and equitymethod investments are reviewedfor impairment at each reportingperiod by comparing the carryingvalue or amortized cost to the fairmarket value. The Company mayutilize third-party professionalvaluation firms as necessary toassist in the determination of thevalue of investments that utilizeLevel 3 inputs as defined in theNotes to Consolidated FinancialStatements. In the event that aninvestment security’s fair value isbelow carrying value or amortizedcost, the Company will record another-than-temporary impairment ora temporary impairment based onaccounting guidance.
Other matters
In the opinion of management,other than contracts for foreigncurrency forwards and rawmaterials, including currency andcommodity hedges and outstandingpurchase orders for packaging,ingredients, supplies, andoperational services, all enteredinto in the ordinary course ofbusiness, the Company does not
have any significant contractualobligations or future commitments.The Company’s outstandingcontractual commitments as ofDecember 31, 2012, all of whichare generally normal and recurringin nature, are summarized in thechart on page 12.
RECENT ACCOUNTINGPRONOUNCEMENTS
In July 2012, the FASB issuedamendments to the indefinite-livedintangible asset impairmentguidance which provides an optionfor companies to use a qualitativeapproach to test indefinite-livedintangible assets for impairment ifcertain conditions are met. Theamendments are effective for annualand interim indefinite-livedintangible asset impairment testsperformed for fiscal years beginningafter September 15, 2012 (earlyadoption is permitted). Theimplementation of the amendedaccounting guidance is not expectedto have a material impact on theCompany’s financial condition,results of operations or cash flows.
MARKET RISKS
The Company is exposed to marketrisks related to commodity prices,interest rates, investments inmarketable securities, equity priceand foreign exchange.
The Company’s ability to forecastthe direction and scope of changesto its major input costs is impactedby significant volatility in crude oil,sugar, corn, soybean and edible oils,
cocoa and dairy products markets.The prices of these commodities areinfluenced by changes in globaldemand, changes in weather andcrop yields, including the effects ofclimate change, changes ingovernments’ farm policies, includingmandates for ethanol and bio-fuels,environmental matters, andfluctuations in the U.S. dollar relativeto dollar-denominated commoditiesin world markets. The Companybelieves that its competitors face thesame or similar challenges.
In order to address the impact ofrising input and other costs, theCompany periodically reviews eachitem in its product portfolio toascertain if price realizationadjustments or other actions shouldbe taken. These reviews include anevaluation of the risk factors relatingto market place acceptance of suchchanges and their potential effect onfuture sales volumes. In addition,the estimated cost of packagingmodifications associated with weightchanges is evaluated. The Companyalso maintains ongoing cost reductionand productivity improvementprograms under which cost savingsinitiatives are encouraged andprogress monitored. The Companyis not able to accurately predict theoutcome of these cost savingsinitiatives and their effects on itsfuture results.
Commodity future and foreigncurrency forward contracts
Commodity price risks relate toingredients, primarily sugar, cocoa,
chocolate, corn syrup, dextrose,soybean and edible oils, milk, wheyand gum base ingredients. TheCompany believes its competitorsface similar risks, and the industryhas historically adjusted prices tocompensate for adverse fluctuations incommodity costs. The Company, aswell as competitors in the confectioneryindustry, has taken actions, includinghigher price realization to mitigaterising input costs for ingredients,energy, freight and delivery. Althoughmanagement seeks to substantiallyrecover cost increases over thelong-term, there is risk that higherprice realization cannot be fullypassed on to customers and, to theextent they are passed on, theycould adversely affect customer andconsumer acceptance and resultingsales volume.
The Company utilizes commodityfutures contracts and commodityoptions contracts as well as annualsupply agreements to hedge andplan for anticipated purchases ofcertain ingredients, including sugar,in order to mitigate commodity costfluctuation. The Company also maypurchase forward foreign exchangecontracts to hedge its costs ofmanufacturing certain products inCanada for sale and distribution in theUnited States, and periodically doesso for purchases of equipment orraw materials from foreign suppliers.Such commodity futures, commodityoptions and currency forwardcontracts are cash flow hedges andare effective as hedges as definedby accounting guidance. Theunrealized gains and losses on such
Merrill Corp - Tootsie Roll 10-K 12-05-2012 ED [AUX] | 105123 | 28-Feb-13 03:24 | 12-28786-1.ca | Sequence: 7CHKSUM Content: 6664 Layout: 53378 Graphics: No Graphics CLEAN
JOB: 12-28786-1 CYCLE#;BL#: 6; 0 TRIM: 11" x 8.5" AS: CHI COMPOSITECOLORS: Black, ~note-color 2, ~note-color 3 GRAPHICS: none V1.5
11
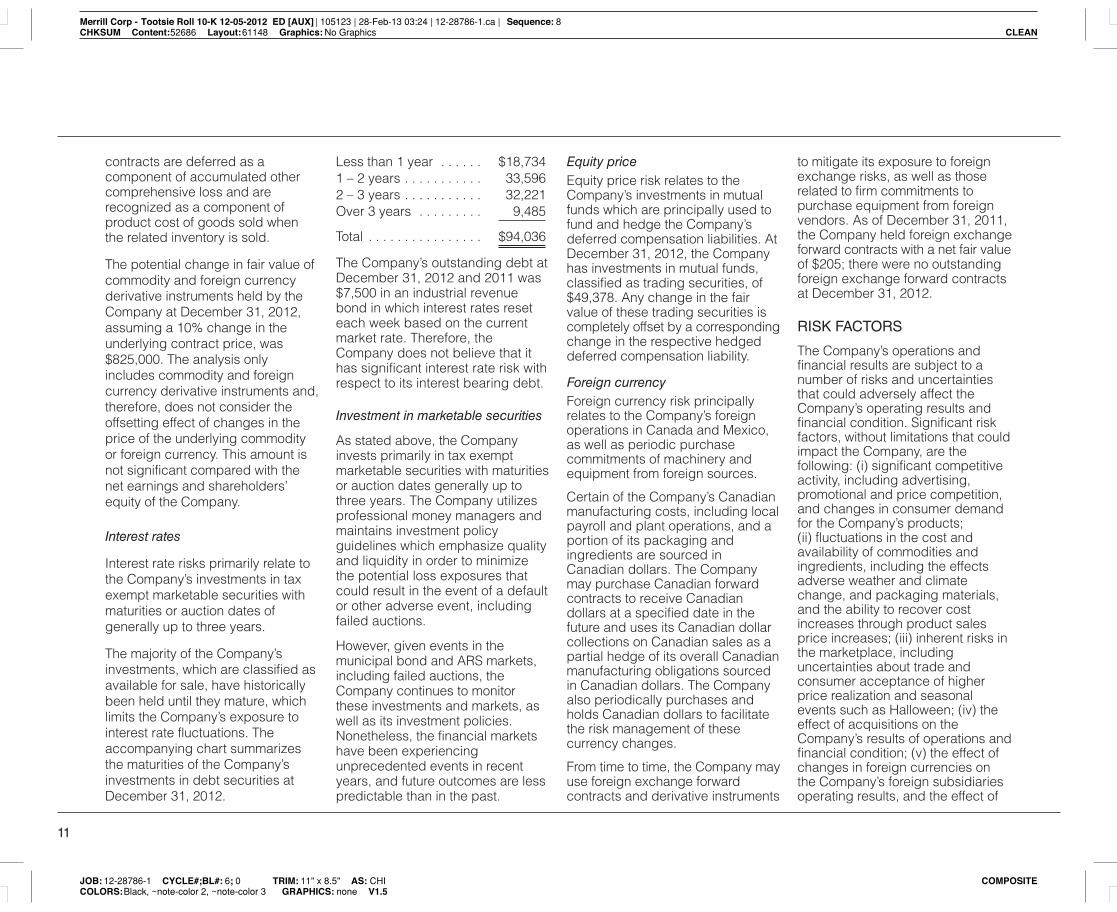
contracts are deferred as acomponent of accumulated othercomprehensive loss and arerecognized as a component ofproduct cost of goods sold whenthe related inventory is sold.
The potential change in fair value ofcommodity and foreign currencyderivative instruments held by theCompany at December 31, 2012,assuming a 10% change in theunderlying contract price, was$825,000. The analysis onlyincludes commodity and foreigncurrency derivative instruments and,therefore, does not consider theoffsetting effect of changes in theprice of the underlying commodityor foreign currency. This amount isnot significant compared with thenet earnings and shareholders’equity of the Company.
Interest rates
Interest rate risks primarily relate tothe Company’s investments in taxexempt marketable securities withmaturities or auction dates ofgenerally up to three years.
The majority of the Company’sinvestments, which are classified asavailable for sale, have historicallybeen held until they mature, whichlimits the Company’s exposure tointerest rate fluctuations. Theaccompanying chart summarizesthe maturities of the Company’sinvestments in debt securities atDecember 31, 2012.
Less than 1 year . . . . . . $18,7341 – 2 years . . . . . . . . . . . 33,5962 – 3 years . . . . . . . . . . . 32,221Over 3 years . . . . . . . . . 9,485
Total . . . . . . . . . . . . . . . . $94,036
The Company’s outstanding debt atDecember 31, 2012 and 2011 was$7,500 in an industrial revenuebond in which interest rates reseteach week based on the currentmarket rate. Therefore, theCompany does not believe that ithas significant interest rate risk withrespect to its interest bearing debt.
Investment in marketable securities
As stated above, the Companyinvests primarily in tax exemptmarketable securities with maturitiesor auction dates generally up tothree years. The Company utilizesprofessional money managers andmaintains investment policyguidelines which emphasize qualityand liquidity in order to minimizethe potential loss exposures thatcould result in the event of a defaultor other adverse event, includingfailed auctions.
However, given events in themunicipal bond and ARS markets,including failed auctions, theCompany continues to monitorthese investments and markets, aswell as its investment policies.Nonetheless, the financial marketshave been experiencingunprecedented events in recentyears, and future outcomes are lesspredictable than in the past.
Equity priceEquity price risk relates to theCompany’s investments in mutualfunds which are principally used tofund and hedge the Company’sdeferred compensation liabilities. AtDecember 31, 2012, the Companyhas investments in mutual funds,classified as trading securities, of$49,378. Any change in the fairvalue of these trading securities iscompletely offset by a correspondingchange in the respective hedgeddeferred compensation liability.
Foreign currencyForeign currency risk principallyrelates to the Company’s foreignoperations in Canada and Mexico,as well as periodic purchasecommitments of machinery andequipment from foreign sources.
Certain of the Company’s Canadianmanufacturing costs, including localpayroll and plant operations, and aportion of its packaging andingredients are sourced inCanadian dollars. The Companymay purchase Canadian forwardcontracts to receive Canadiandollars at a specified date in thefuture and uses its Canadian dollarcollections on Canadian sales as apartial hedge of its overall Canadianmanufacturing obligations sourcedin Canadian dollars. The Companyalso periodically purchases andholds Canadian dollars to facilitatethe risk management of thesecurrency changes.
From time to time, the Company mayuse foreign exchange forwardcontracts and derivative instruments
to mitigate its exposure to foreignexchange risks, as well as thoserelated to firm commitments topurchase equipment from foreignvendors. As of December 31, 2011,the Company held foreign exchangeforward contracts with a net fair valueof $205; there were no outstandingforeign exchange forward contractsat December 31, 2012.
RISK FACTORS
The Company’s operations andfinancial results are subject to anumber of risks and uncertaintiesthat could adversely affect theCompany’s operating results andfinancial condition. Significant riskfactors, without limitations that couldimpact the Company, are thefollowing: (i) significant competitiveactivity, including advertising,promotional and price competition,and changes in consumer demandfor the Company’s products;(ii) fluctuations in the cost andavailability of commodities andingredients, including the effectsadverse weather and climatechange, and packaging materials,and the ability to recover costincreases through product salesprice increases; (iii) inherent risks inthe marketplace, includinguncertainties about trade andconsumer acceptance of higherprice realization and seasonalevents such as Halloween; (iv) theeffect of acquisitions on theCompany’s results of operations andfinancial condition; (v) the effect ofchanges in foreign currencies onthe Company’s foreign subsidiariesoperating results, and the effect of
Merrill Corp - Tootsie Roll 10-K 12-05-2012 ED [AUX] | 105123 | 28-Feb-13 03:24 | 12-28786-1.ca | Sequence: 8CHKSUM Content: 52686 Layout: 61148 Graphics: No Graphics CLEAN
JOB: 12-28786-1 CYCLE#;BL#: 6; 0 TRIM: 11" x 8.5" AS: CHI COMPOSITECOLORS: Black, ~note-color 2, ~note-color 3 GRAPHICS: none V1.5

12
the fluctuation of the Canadiandollar on products manufactured inCanada and marketed and sold inthe United States in U.S. dollars;(vi) the Company’s reliance on thirdparty vendors for various goods andservices, including commoditiesused for ingredients that areprimarily grown or sourced fromforeign locations; (vii) the Company’sability to successfully implementnew production processes and lines,and new computer software systems;(viii) the effect of changes inassumptions, including discountrates, sales growth and profitmargins and the capability to passalong higher ingredient and otherinput costs through price increases,relating to the Company’s impairmenttesting and analysis of its goodwilland trademarks; (ix) changes in theconfectionery marketplace includingactions taken by major retailers andcustomers; (x) customer, consumerand competitor response to marketingprograms and price and productweight adjustments, and newproducts; (xi) dependence onsignificant customers, including thevolume and timing of their purchases,and availability of shelf space;(xii) increases in energy costs,including freight and delivery, thatcannot be passed along tocustomers through increased pricerealization due to competitivereasons; (xiii) any significant laborstoppages, strikes or productioninterruptions; (xiv) changes ingovernmental laws and regulationsincluding taxes and tariffs; (xv) theadverse effects should the Companyeither voluntarily or involuntarily recallits product(s) from the marketplace;
(xvi) the risk that the market value ofCompany’s investments coulddecline including being classified as“other-than-temporary” as defined;(xvii) the Company’s dependenceon its enterprise resource planningcomputer system to manage itssupply chain and customer deliveries,and the risk that the Company’sinformation technology systems fail toperform adequately or the Companyis unable to protect such informationtechnology systems against datacorruption, cyber-based attacks ornetwork security breaches; (xviii) thepotential effects of adverse effects,including rulings by bankruptcycourts, relating to the investment inthe Jefferson County auction ratesecurity and its insurance carrier;(xix) the potential adverse effects onthe Company as to changes toimprove the funding status of theBakery and Confectionary Unionand Industry Pension Plan, amultiemployer plan which coverscertain Company union employees;(xx) the potential adverse effects ofdeteriorating economic andbusiness conditions in Spain andthe effects on the Company’s equityinvestment in two 50% ownedSpanish companies, and (xxi) thepotential effects of current andfuture macroeconomic conditionsand geopolitical events.
Forward-looking statements
This discussion and certain othersections contain forward-lookingstatements that are based largely onthe Company’s current expectationsand are made pursuant to the safeharbor provision of the PrivateSecurities Litigation Reform Act of
1995. Forward-looking statementscan be identified by the use of wordssuch as “anticipated,” “believe,”“expect,” “intend,” “estimate,”“project,” and other words of similarmeaning in connection with adiscussion of future operating orfinancial performance and aresubject to certain factors, risks,trends and uncertainties that couldcause actual results andachievements to differ materiallyfrom those expressed in theforward-looking statements. Suchfactors, risks, trends anduncertainties which in someinstances are beyond theCompany’s control, include theoverall competitive environment inthe Company’s industry, changes inassumptions and judgments
discussed above under the heading“Significant Accounting Policies andEstimates”, and factors identifiedand referred to above under theheading “Risk Factors.”
The risk factors identified andreferred to above are believed to besignificant factors, but notnecessarily all of the significantfactors that could cause actualresults to differ from thoseexpressed in any forward-lookingstatement. Readers are cautionednot to place undue reliance on suchforward-looking statements, whichare made only as of the date of thisreport. The Company undertakes noobligation to update such forward-looking statements.
Open Contractual Commitments as of December 31, 2012
Less than 1 to 3 3 to 5 More thanPayable in Total 1 Year Years Years 5 YearsCommodityhedges . . . . . . . $ 8,495 $ 8,495 $ — $ — $ —
Purchase obligations . . . . 10,317 10,317 — — —
Interest bearingdebt . . . . . . . . . 7,500 — — — 7,500
Operatingleases . . . . . . . . . 3,631 1,061 2,230 339 1
Total . . . . . . . . . . $29,943 $19,873 $2,230 $339 $7,501
Note: Commodity hedges and foreign currency hedges reflect theamounts at which the Company will settle the related contracts. Theabove amounts exclude deferred income tax liabilities of $38,748,liabilities for uncertain tax positions of $7,866, postretirement healthcare and life insurance benefits of $27,381 and deferred compensationand other liabilities of $55,217 because the timing of payments relatingto these items cannot be reasonably determined.
Merrill Corp - Tootsie Roll 10-K 12-05-2012 ED [AUX] | 105123 | 28-Feb-13 03:24 | 12-28786-1.ca | Sequence: 9CHKSUM Content: 56963 Layout: 17806 Graphics: No Graphics CLEAN
JOB: 12-28786-1 CYCLE#;BL#: 6; 0 TRIM: 11" x 8.5" AS: CHI COMPOSITECOLORS: Black, ~note-color 2, ~note-color 3 GRAPHICS: none V1.5

CONSOLIDATED STATEMENTS OF
Earnings, Comprehensive Earnings and Retained EarningsTOOTSIE ROLL INDUSTRIES, INC. AND SUBSIDIARIES (in thousands except per share data)
For the year ended December 31,
2012 2011 2010
Net product sales . . . . . . . . . . . . . . . . . . . . . . . . . . . . . . . . . . . . . . . . . . . . . . . . . . . . . $545,985 $528,369 $517,149Rental and royalty revenue . . . . . . . . . . . . . . . . . . . . . . . . . . . . . . . . . . . . . . . . . . . . . . 3,885 4,136 4,299 Total revenue . . . . . . . . . . . . . . . . . . . . . . . . . . . . . . . . . . . . . . . . . . . . . . . . . . . . . . . . 549,870 532,505 521,448 Product cost of goods sold . . . . . . . . . . . . . . . . . . . . . . . . . . . . . . . . . . . . . . . . . . . . . 365,573 365,225 349,334Rental and royalty cost . . . . . . . . . . . . . . . . . . . . . . . . . . . . . . . . . . . . . . . . . . . . . . . . . 976 1,038 1,088 Total costs . . . . . . . . . . . . . . . . . . . . . . . . . . . . . . . . . . . . . . . . . . . . . . . . . . . . . . . . . . . 366,549 366,263 350,422 Product gross margin . . . . . . . . . . . . . . . . . . . . . . . . . . . . . . . . . . . . . . . . . . . . . . . . . . 180,412 163,144 167,815Rental and royalty gross margin . . . . . . . . . . . . . . . . . . . . . . . . . . . . . . . . . . . . . . . . . . 2,909 3,098 3,211 Total gross margin . . . . . . . . . . . . . . . . . . . . . . . . . . . . . . . . . . . . . . . . . . . . . . . . . . . . 183,321 166,242 171,026Selling, marketing and administrative expenses . . . . . . . . . . . . . . . . . . . . . . . . . . . . . 113,842 108,276 106,316 Earnings from operations . . . . . . . . . . . . . . . . . . . . . . . . . . . . . . . . . . . . . . . . . . . . . . . 69,479 57,966 64,710 Other income, net . . . . . . . . . . . . . . . . . . . . . . . . . . . . . . . . . . . . . . . . . . . . . . . . . . . . . 4,685 2,946 8,358 Earnings before income taxes . . . . . . . . . . . . . . . . . . . . . . . . . . . . . . . . . . . . . . . . . . . 74,164 60,912 73,068 Provision for income taxes . . . . . . . . . . . . . . . . . . . . . . . . . . . . . . . . . . . . . . . . . . . . . . 22,160 16,974 20,005 Net earnings . . . . . . . . . . . . . . . . . . . . . . . . . . . . . . . . . . . . . . . . . . . . . . . . . . . . . . . . . $ 52,004 $ 43,938 $ 53,063
Earnings per share . . . . . . . . . . . . . . . . . . . . . . . . . . . . . . . . . . . . . . . . . . . . . . . . . . . . $ 0.89 $ 0.74 $ 0.88Average Common and Class B Common shares outstanding . . . . . . . . . . . . . . . . . . . 58,742 59,606 60,398
(The accompanying notes are an integral part of these statements.)
13
Merrill Corp - Tootsie Roll 10-K 12-05-2012 ED [AUX] | 105123 | 28-Feb-13 03:24 | 12-28786-1.da | Sequence: 1CHKSUM Content: 41070 Layout: 10894 Graphics: No Graphics CLEAN
JOB: 12-28786-1 CYCLE#;BL#: 6; 0 TRIM: 11" x 8.5" AS: CHI COMPOSITECOLORS: Black, ~note-color 2, ~note-color 3 GRAPHICS: none V1.5

14
CONSOLIDATED STATEMENTS OF
Earnings, Comprehensive Earnings and Retained Earnings, ContinuedTOOTSIE ROLL INDUSTRIES, INC. AND SUBSIDIARIES (in thousands except per share data)
For the year ended December 31,
2012 2011 2010
Other comprehensive income (loss), before taxesForeign currency translation adjustments . . . . . . . . . . . . . . . . . . . . . . . . . . . . . . . . . . $ 1,303 $ (2,496) $ 856 Unrealized gains (losses) for the period on investments . . . . . . . . . . . . . . . . . . . . . . . 1,980 1,030 (1,179)Less: reclassification adjustment for (gains) losses to net earnings . . . . . . . . . . . . . . — — — Unrealized gains (losses) on investments . . . . . . . . . . . . . . . . . . . . . . . . . . . . . . . . . . 1,980 1,030 (1,179) Unrealized gains (losses) for the period on derivatives . . . . . . . . . . . . . . . . . . . . . . . . (339) (397) 7,313Less: reclassification adjustment for (gains) to net earnings . . . . . . . . . . . . . . . . . . . . (243) (7,531) (2,651) Unrealized gains (losses) on derivatives . . . . . . . . . . . . . . . . . . . . . . . . . . . . . . . . . . . (582) (7,928) 4,662 Unrealized gains (losses) for the period on postretirement and pension benefits . . . 1,066 (3,593) (3,135)Less: reclassification adjustment for losses to net earnings . . . . . . . . . . . . . . . . . . . . 1,036 501 128 Unrealized gains (losses) on postretirement and pension benefits . . . . . . . . . . . . . . . 2,102 (3,092) (3,007) Total other comprehensive income (loss), before tax . . . . . . . . . . . . . . . . . . . . . . . . . . 4,803 (12,486) 1,332Income tax related to items of other comprehensive income . . . . . . . . . . . . . . . . . . . (1,297) 3,746 (149) Comprehensive earnings . . . . . . . . . . . . . . . . . . . . . . . . . . . . . . . . . . . . . . . . . . . . . . . $ 55,510 $ 35,198 $ 54,246
Retained earnings at beginning of year . . . . . . . . . . . . . . . . . . . . . . . . . . . . . . . . . . . . $ 114,269 $135,866 $147,687 Net earnings . . . . . . . . . . . . . . . . . . . . . . . . . . . . . . . . . . . . . . . . . . . . . . . . . . . . . 52,004 43,938 53,063 Cash dividends . . . . . . . . . . . . . . . . . . . . . . . . . . . . . . . . . . . . . . . . . . . . . . . . . . . (47,729) (18,360) (18,078) Stock dividends . . . . . . . . . . . . . . . . . . . . . . . . . . . . . . . . . . . . . . . . . . . . . . . . . . . (38,334) (47,175) (46,806) Retained earnings at end of year . . . . . . . . . . . . . . . . . . . . . . . . . . . . . . . . . . . . . . . . . $ 80,210 $114,269 $135,866
Merrill Corp - Tootsie Roll 10-K 12-05-2012 ED [AUX] | 105123 | 28-Feb-13 03:24 | 12-28786-1.da | Sequence: 2CHKSUM Content: 58210 Layout: 49932 Graphics: No Graphics CLEAN
JOB: 12-28786-1 CYCLE#;BL#: 6; 0 TRIM: 11" x 8.5" AS: CHI COMPOSITECOLORS: Black, ~note-color 2, ~note-color 3 GRAPHICS: none V1.5
15
CONSOLIDATED STATEMENTS OF
Financial PositionTOOTSIE ROLL INDUSTRIES, INC. AND SUBSIDIARIES (in thousands)
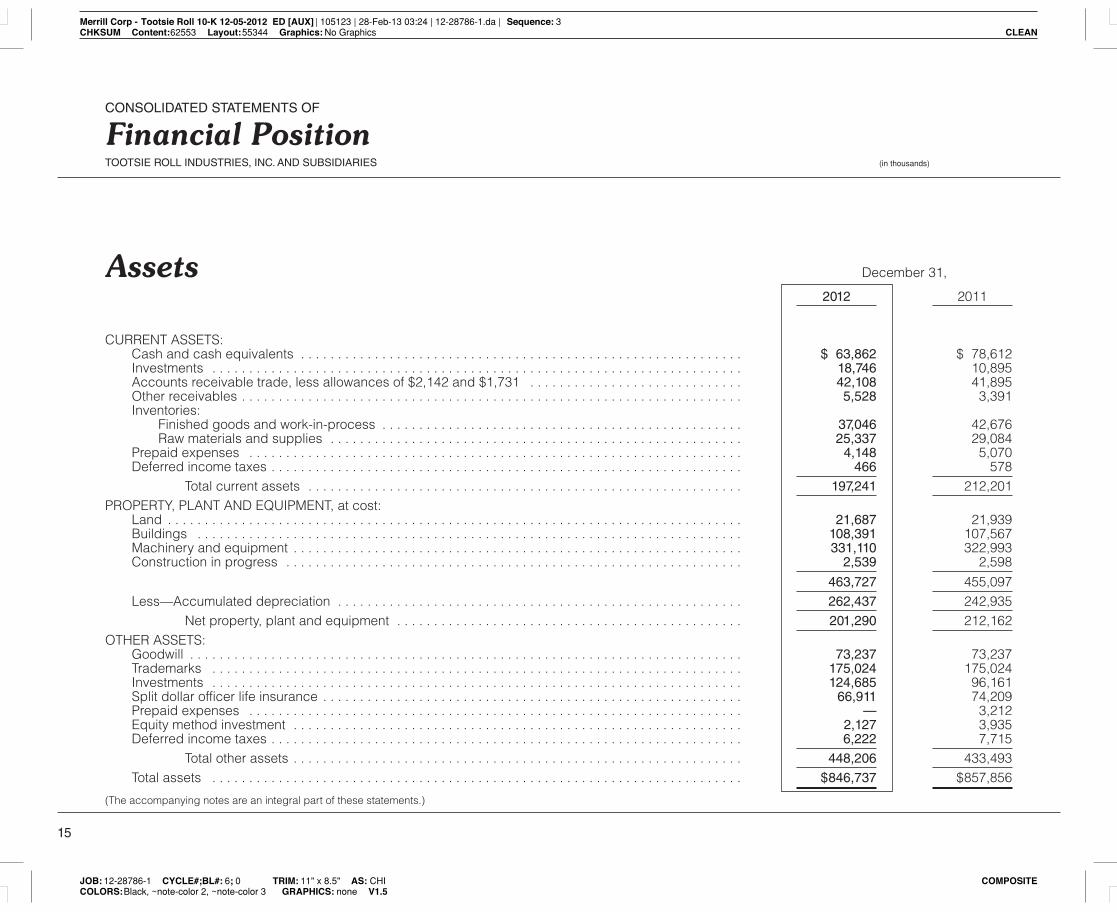
Assets December 31,
2012 2011
CURRENT ASSETS: Cash and cash equivalents . . . . . . . . . . . . . . . . . . . . . . . . . . . . . . . . . . . . . . . . . . . . . . . . . . . . . . . . . . . . $ 63,862 $ 78,612 Investments . . . . . . . . . . . . . . . . . . . . . . . . . . . . . . . . . . . . . . . . . . . . . . . . . . . . . . . . . . . . . . . . . . . . . . . . 18,746 10,895 Accounts receivable trade, less allowances of $2,142 and $1,731 . . . . . . . . . . . . . . . . . . . . . . . . . . . . . 42,108 41,895 Other receivables . . . . . . . . . . . . . . . . . . . . . . . . . . . . . . . . . . . . . . . . . . . . . . . . . . . . . . . . . . . . . . . . . . . . 5,528 3,391 Inventories: Finished goods and work-in-process . . . . . . . . . . . . . . . . . . . . . . . . . . . . . . . . . . . . . . . . . . . . . . . . . 37,046 42,676 Raw materials and supplies . . . . . . . . . . . . . . . . . . . . . . . . . . . . . . . . . . . . . . . . . . . . . . . . . . . . . . . . 25,337 29,084 Prepaid expenses . . . . . . . . . . . . . . . . . . . . . . . . . . . . . . . . . . . . . . . . . . . . . . . . . . . . . . . . . . . . . . . . . . . 4,148 5,070 Deferred income taxes . . . . . . . . . . . . . . . . . . . . . . . . . . . . . . . . . . . . . . . . . . . . . . . . . . . . . . . . . . . . . . . . 466 578
Total current assets . . . . . . . . . . . . . . . . . . . . . . . . . . . . . . . . . . . . . . . . . . . . . . . . . . . . . . . . . . . 197,241 212,201 PROPERTY, PLANT AND EQUIPMENT, at cost: Land . . . . . . . . . . . . . . . . . . . . . . . . . . . . . . . . . . . . . . . . . . . . . . . . . . . . . . . . . . . . . . . . . . . . . . . . . . . . . . 21,687 21,939 Buildings . . . . . . . . . . . . . . . . . . . . . . . . . . . . . . . . . . . . . . . . . . . . . . . . . . . . . . . . . . . . . . . . . . . . . . . . . . 108,391 107,567 Machinery and equipment . . . . . . . . . . . . . . . . . . . . . . . . . . . . . . . . . . . . . . . . . . . . . . . . . . . . . . . . . . . . . 331,110 322,993 Construction in progress . . . . . . . . . . . . . . . . . . . . . . . . . . . . . . . . . . . . . . . . . . . . . . . . . . . . . . . . . . . . . . 2,539 2,598 463,727 455,097 Less—Accumulated depreciation . . . . . . . . . . . . . . . . . . . . . . . . . . . . . . . . . . . . . . . . . . . . . . . . . . . . . . . 262,437 242,935
Net property, plant and equipment . . . . . . . . . . . . . . . . . . . . . . . . . . . . . . . . . . . . . . . . . . . . . . . 201,290 212,162 OTHER ASSETS: Goodwill . . . . . . . . . . . . . . . . . . . . . . . . . . . . . . . . . . . . . . . . . . . . . . . . . . . . . . . . . . . . . . . . . . . . . . . . . . . 73,237 73,237 Trademarks . . . . . . . . . . . . . . . . . . . . . . . . . . . . . . . . . . . . . . . . . . . . . . . . . . . . . . . . . . . . . . . . . . . . . . . . 175,024 175,024 Investments . . . . . . . . . . . . . . . . . . . . . . . . . . . . . . . . . . . . . . . . . . . . . . . . . . . . . . . . . . . . . . . . . . . . . . . . 124,685 96,161 Split dollar officer life insurance . . . . . . . . . . . . . . . . . . . . . . . . . . . . . . . . . . . . . . . . . . . . . . . . . . . . . . . . . 66,911 74,209 Prepaid expenses . . . . . . . . . . . . . . . . . . . . . . . . . . . . . . . . . . . . . . . . . . . . . . . . . . . . . . . . . . . . . . . . . . . — 3,212 Equity method investment . . . . . . . . . . . . . . . . . . . . . . . . . . . . . . . . . . . . . . . . . . . . . . . . . . . . . . . . . . . . . 2,127 3,935 Deferred income taxes . . . . . . . . . . . . . . . . . . . . . . . . . . . . . . . . . . . . . . . . . . . . . . . . . . . . . . . . . . . . . . . . 6,222 7,715
Total other assets . . . . . . . . . . . . . . . . . . . . . . . . . . . . . . . . . . . . . . . . . . . . . . . . . . . . . . . . . . . . . 448,206 433,493 Total assets . . . . . . . . . . . . . . . . . . . . . . . . . . . . . . . . . . . . . . . . . . . . . . . . . . . . . . . . . . . . . . . . . . . . . . . . $846,737 $857,856 (The accompanying notes are an integral part of these statements.)
Merrill Corp - Tootsie Roll 10-K 12-05-2012 ED [AUX] | 105123 | 28-Feb-13 03:24 | 12-28786-1.da | Sequence: 3CHKSUM Content: 62553 Layout: 55344 Graphics: No Graphics CLEAN
JOB: 12-28786-1 CYCLE#;BL#: 6; 0 TRIM: 11" x 8.5" AS: CHI COMPOSITECOLORS: Black, ~note-color 2, ~note-color 3 GRAPHICS: none V1.5
16
(in thousands except per share data)
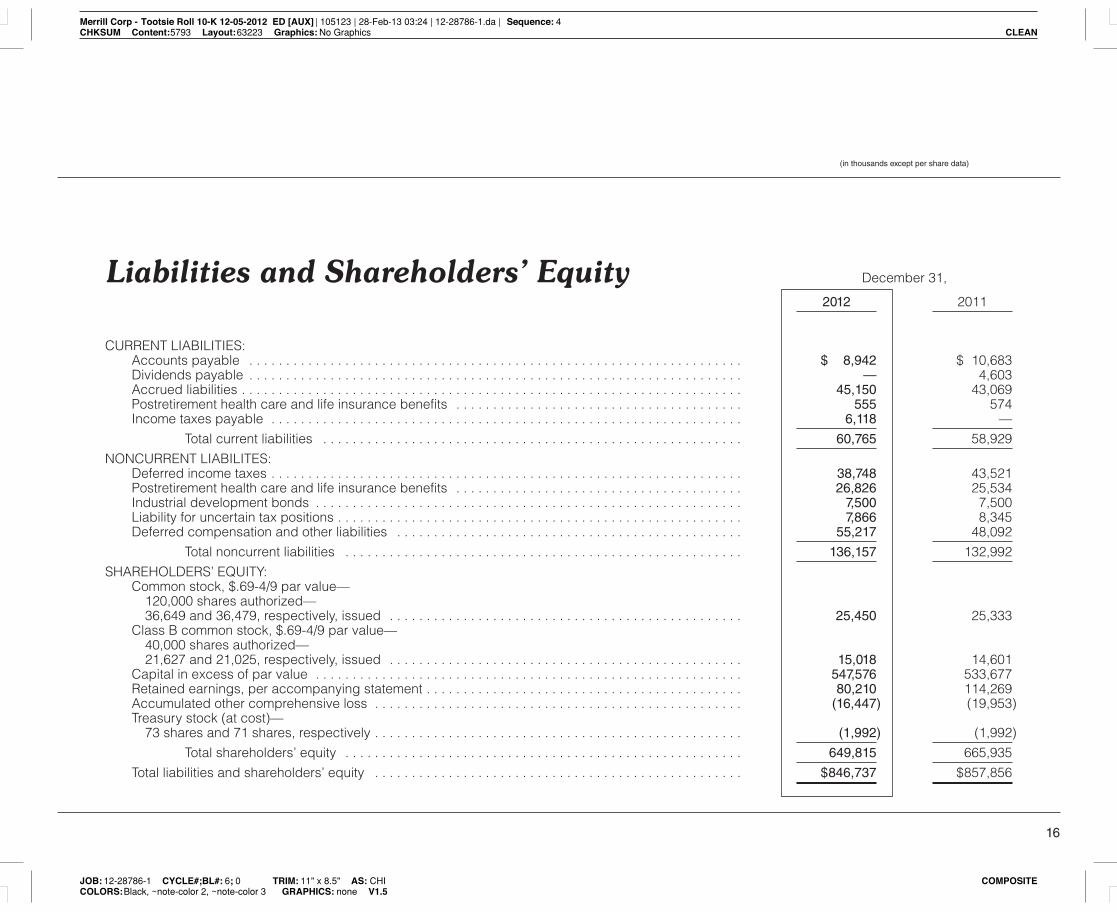
Liabilities and Shareholders’ Equity December 31,
2012 2011
CURRENT LIABILITIES: Accounts payable . . . . . . . . . . . . . . . . . . . . . . . . . . . . . . . . . . . . . . . . . . . . . . . . . . . . . . . . . . . . . . . . . . . $ 8,942 $ 10,683 Dividends payable . . . . . . . . . . . . . . . . . . . . . . . . . . . . . . . . . . . . . . . . . . . . . . . . . . . . . . . . . . . . . . . . . . . — 4,603 Accrued liabilities . . . . . . . . . . . . . . . . . . . . . . . . . . . . . . . . . . . . . . . . . . . . . . . . . . . . . . . . . . . . . . . . . . . . 45,150 43,069 Postretirement health care and life insurance benefits . . . . . . . . . . . . . . . . . . . . . . . . . . . . . . . . . . . . . . . 555 574 Income taxes payable . . . . . . . . . . . . . . . . . . . . . . . . . . . . . . . . . . . . . . . . . . . . . . . . . . . . . . . . . . . . . . . . 6,118 —
Total current liabilities . . . . . . . . . . . . . . . . . . . . . . . . . . . . . . . . . . . . . . . . . . . . . . . . . . . . . . . . . 60,765 58,929 NONCURRENT LIABILITES: Deferred income taxes . . . . . . . . . . . . . . . . . . . . . . . . . . . . . . . . . . . . . . . . . . . . . . . . . . . . . . . . . . . . . . . . 38,748 43,521 Postretirement health care and life insurance benefits . . . . . . . . . . . . . . . . . . . . . . . . . . . . . . . . . . . . . . . 26,826 25,534 Industrial development bonds . . . . . . . . . . . . . . . . . . . . . . . . . . . . . . . . . . . . . . . . . . . . . . . . . . . . . . . . . . 7,500 7,500 Liability for uncertain tax positions . . . . . . . . . . . . . . . . . . . . . . . . . . . . . . . . . . . . . . . . . . . . . . . . . . . . . . . 7,866 8,345 Deferred compensation and other liabilities . . . . . . . . . . . . . . . . . . . . . . . . . . . . . . . . . . . . . . . . . . . . . . . 55,217 48,092
Total noncurrent liabilities . . . . . . . . . . . . . . . . . . . . . . . . . . . . . . . . . . . . . . . . . . . . . . . . . . . . . . 136,157 132,992 SHAREHOLDERS’ EQUITY: Common stock, $.69-4/9 par value— 120,000 shares authorized— 36,649 and 36,479, respectively, issued . . . . . . . . . . . . . . . . . . . . . . . . . . . . . . . . . . . . . . . . . . . . . . . . 25,450 25,333 Class B common stock, $.69-4/9 par value— 40,000 shares authorized— 21,627 and 21,025, respectively, issued . . . . . . . . . . . . . . . . . . . . . . . . . . . . . . . . . . . . . . . . . . . . . . . . 15,018 14,601 Capital in excess of par value . . . . . . . . . . . . . . . . . . . . . . . . . . . . . . . . . . . . . . . . . . . . . . . . . . . . . . . . . . 547,576 533,677 Retained earnings, per accompanying statement . . . . . . . . . . . . . . . . . . . . . . . . . . . . . . . . . . . . . . . . . . . 80,210 114,269 Accumulated other comprehensive loss . . . . . . . . . . . . . . . . . . . . . . . . . . . . . . . . . . . . . . . . . . . . . . . . . . (16,447) (19,953) Treasury stock (at cost)— 73 shares and 71 shares, respectively . . . . . . . . . . . . . . . . . . . . . . . . . . . . . . . . . . . . . . . . . . . . . . . . . . (1,992) (1,992)
Total shareholders’ equity . . . . . . . . . . . . . . . . . . . . . . . . . . . . . . . . . . . . . . . . . . . . . . . . . . . . . . 649,815 665,935 Total liabilities and shareholders’ equity . . . . . . . . . . . . . . . . . . . . . . . . . . . . . . . . . . . . . . . . . . . . . . . . . . $846,737 $857,856
Merrill Corp - Tootsie Roll 10-K 12-05-2012 ED [AUX] | 105123 | 28-Feb-13 03:24 | 12-28786-1.da | Sequence: 4CHKSUM Content: 5793 Layout: 63223 Graphics: No Graphics CLEAN
JOB: 12-28786-1 CYCLE#;BL#: 6; 0 TRIM: 11" x 8.5" AS: CHI COMPOSITECOLORS: Black, ~note-color 2, ~note-color 3 GRAPHICS: none V1.5
17
CONSOLIDATED STATEMENTS OF
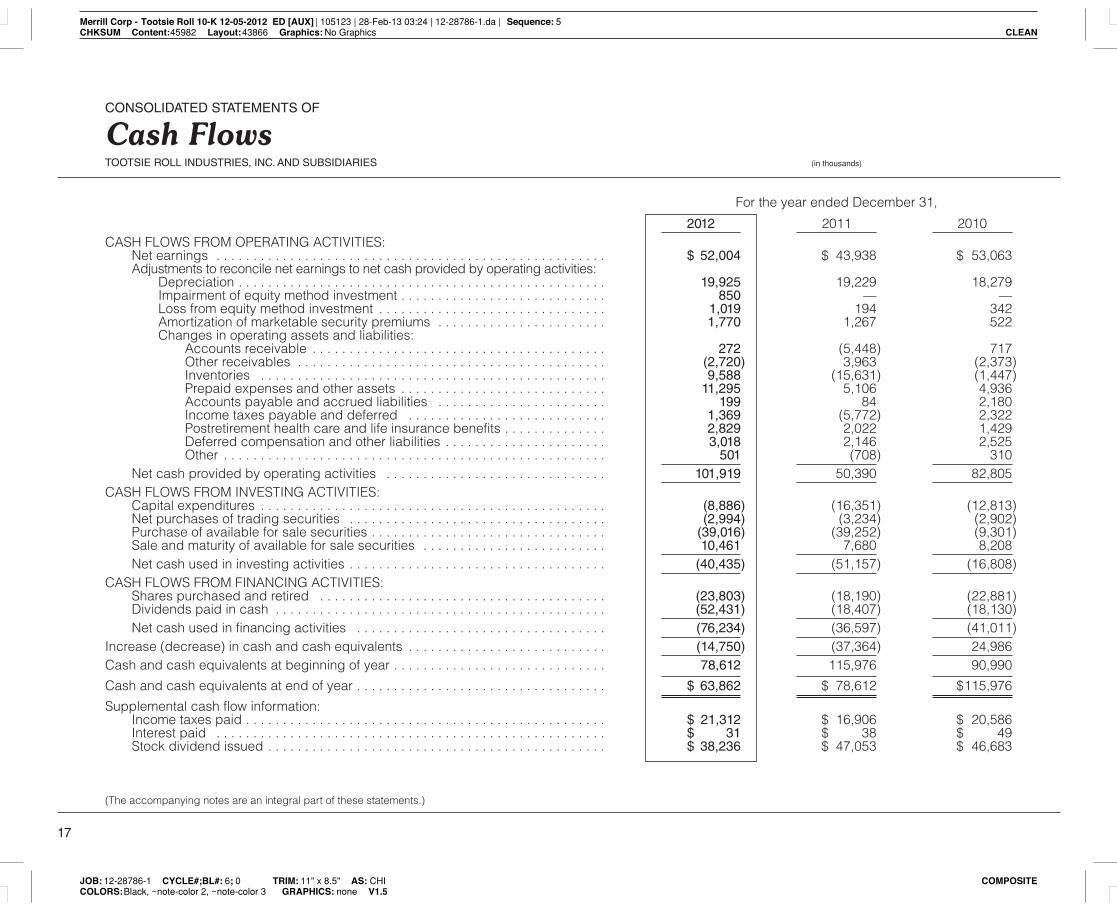
Cash FlowsTOOTSIE ROLL INDUSTRIES, INC. AND SUBSIDIARIES (in thousands)
For the year ended December 31,
2012 2011 2010 CASH FLOWS FROM OPERATING ACTIVITIES: Net earnings . . . . . . . . . . . . . . . . . . . . . . . . . . . . . . . . . . . . . . . . . . . . . . . . . . . . . $ 52,004 $ 43,938 $ 53,063 Adjustments to reconcile net earnings to net cash provided by operating activities: Depreciation . . . . . . . . . . . . . . . . . . . . . . . . . . . . . . . . . . . . . . . . . . . . . . . . . . 19,925 19,229 18,279 Impairment of equity method investment . . . . . . . . . . . . . . . . . . . . . . . . . . . . 850 — — Loss from equity method investment . . . . . . . . . . . . . . . . . . . . . . . . . . . . . . . 1,019 194 342 Amortization of marketable security premiums . . . . . . . . . . . . . . . . . . . . . . . 1,770 1,267 522 Changes in operating assets and liabilities: Accounts receivable . . . . . . . . . . . . . . . . . . . . . . . . . . . . . . . . . . . . . . . . 272 (5,448) 717 Other receivables . . . . . . . . . . . . . . . . . . . . . . . . . . . . . . . . . . . . . . . . . . (2,720) 3,963 (2,373) Inventories . . . . . . . . . . . . . . . . . . . . . . . . . . . . . . . . . . . . . . . . . . . . . . . 9,588 (15,631) (1,447) Prepaid expenses and other assets . . . . . . . . . . . . . . . . . . . . . . . . . . . . 11,295 5,106 4,936 Accounts payable and accrued liabilities . . . . . . . . . . . . . . . . . . . . . . . 199 84 2,180 Income taxes payable and deferred . . . . . . . . . . . . . . . . . . . . . . . . . . . 1,369 (5,772) 2,322 Postretirement health care and life insurance benefits . . . . . . . . . . . . . . 2,829 2,022 1,429 Deferred compensation and other liabilities . . . . . . . . . . . . . . . . . . . . . . 3,018 2,146 2,525 Other . . . . . . . . . . . . . . . . . . . . . . . . . . . . . . . . . . . . . . . . . . . . . . . . . . . . 501 (708) 310 Net cash provided by operating activities . . . . . . . . . . . . . . . . . . . . . . . . . . . . . . 101,919 50,390 82,805 CASH FLOWS FROM INVESTING ACTIVITIES: Capital expenditures . . . . . . . . . . . . . . . . . . . . . . . . . . . . . . . . . . . . . . . . . . . . . . . (8,886) (16,351) (12,813) Net purchases of trading securities . . . . . . . . . . . . . . . . . . . . . . . . . . . . . . . . . . . (2,994) (3,234) (2,902) Purchase of available for sale securities . . . . . . . . . . . . . . . . . . . . . . . . . . . . . . . . (39,016) (39,252) (9,301) Sale and maturity of available for sale securities . . . . . . . . . . . . . . . . . . . . . . . . . 10,461 7,680 8,208 Net cash used in investing activities . . . . . . . . . . . . . . . . . . . . . . . . . . . . . . . . . . . (40,435) (51,157) (16,808) CASH FLOWS FROM FINANCING ACTIVITIES: Shares purchased and retired . . . . . . . . . . . . . . . . . . . . . . . . . . . . . . . . . . . . . . . (23,803) (18,190) (22,881) Dividends paid in cash . . . . . . . . . . . . . . . . . . . . . . . . . . . . . . . . . . . . . . . . . . . . . (52,431) (18,407) (18,130) Net cash used in financing activities . . . . . . . . . . . . . . . . . . . . . . . . . . . . . . . . . . (76,234) (36,597) (41,011) Increase (decrease) in cash and cash equivalents . . . . . . . . . . . . . . . . . . . . . . . . . . . (14,750) (37,364) 24,986 Cash and cash equivalents at beginning of year . . . . . . . . . . . . . . . . . . . . . . . . . . . . . 78,612 115,976 90,990 Cash and cash equivalents at end of year . . . . . . . . . . . . . . . . . . . . . . . . . . . . . . . . . . $ 63,862 $ 78,612 $115,976 Supplemental cash flow information: Income taxes paid . . . . . . . . . . . . . . . . . . . . . . . . . . . . . . . . . . . . . . . . . . . . . . . . . $ 21,312 $ 16,906 $ 20,586 Interest paid . . . . . . . . . . . . . . . . . . . . . . . . . . . . . . . . . . . . . . . . . . . . . . . . . . . . . $ 31 $ 38 $ 49 Stock dividend issued . . . . . . . . . . . . . . . . . . . . . . . . . . . . . . . . . . . . . . . . . . . . . . $ 38,236 $ 47,053 $ 46,683
(The accompanying notes are an integral part of these statements.)
Merrill Corp - Tootsie Roll 10-K 12-05-2012 ED [AUX] | 105123 | 28-Feb-13 03:24 | 12-28786-1.da | Sequence: 5CHKSUM Content: 45982 Layout: 43866 Graphics: No Graphics CLEAN
JOB: 12-28786-1 CYCLE#;BL#: 6; 0 TRIM: 11" x 8.5" AS: CHI COMPOSITECOLORS: Black, ~note-color 2, ~note-color 3 GRAPHICS: none V1.5

18
NOTE 1—SIGNIFICANT ACCOUNTING POLICIES:
Basis of consolidation:The consolidated financial statements include the accounts of Tootsie Roll Industries, Inc.
and its wholly-owned subsidiaries (the Company), which are primarily engaged in themanufacture and sales of candy products. All significant intercompany transactions have beeneliminated. Certain amounts previously reported have been reclassified to conform to the currentyear presentation.
The preparation of financial statements in conformity with generally accepted accountingprinciples in the United States of America requires management to make estimates andassumptions that affect the reported amounts of assets and liabilities and disclosure ofcontingent assets and liabilities at the date of the financial statements and the reported amountsof revenues and expenses during the reporting period. Actual results could differ from thoseestimates.
Revenue recognition:Products are sold to customers based on accepted purchase orders which include quantity,
sales price and other relevant terms of sale. Revenue, net of applicable provisions for discounts,returns, allowances and certain advertising and promotional costs, is recognized when productsare delivered to customers and collectability is reasonably assured. Shipping and handlingcosts of $45,072, $45,850, and $43,034 in 2012, 2011 and 2010, respectively, are included inselling, marketing and administrative expenses. Accounts receivable are unsecured. Revenuesfrom a major customer aggregated approximately 23.5%, 23.3% and 21.4% of net productsales during the years ended December 31, 2012, 2011 and 2010, respectively.
Cash and cash equivalents:The Company considers temporary cash investments with an original maturity of three months
or less to be cash equivalents.
Investments:Investments consist of various marketable securities with maturities of generally up to three
years. The Company classifies debt and equity securities as either available for sale or trading.Available for sale securities are not actively traded by the Company and are carried at fairvalue. The Company follows current fair value measurement guidance and unrealized gainsand losses on these securities are excluded from earnings and are reported as a separatecomponent of shareholders’ equity, net of applicable taxes, until realized or other thantemporarily impaired. Trading securities relate to deferred compensation arrangements andare carried at fair value with gains or losses included in other income, net. The Company investsin trading securities to economically hedge changes in its deferred compensation liabilities.
The Company regularly reviews its investments to determine whether a decline in fair valuebelow the cost basis is other than temporary. If the decline in fair value is judged to be otherthan temporary, the cost basis of the security is written down to fair value and the amount of thewrite-down is included in other income, net. Further information regarding the fair value of theCompany’s investments is included in Note 10 to the Consolidated Financial Statements.
Derivative instruments and hedging activities:Authoritative guidance requires qualitative disclosures about objectives and strategies for
using derivatives, quantitative disclosures about fair value amounts of derivative instrumentsand related gains and losses, and disclosures about credit-risk-related contingent features inderivative agreements.
From time to time, the Company enters into commodity futures, commodity options contractsand foreign currency forward contracts. Commodity futures and options are intended and areeffective as hedges of market price risks associated with the anticipated purchase of certainraw materials (primarily sugar). Foreign currency forward contracts are intended and areeffective as hedges of the Company’s exposure to the variability of cash flows, primarily relatedto the foreign exchange rate changes of products manufactured in Canada and sold in theUnited States, and periodic equipment purchases from foreign suppliers denominated in aforeign currency. The Company does not engage in trading or other speculative use of derivativeinstruments. Further information regarding derivative instruments and hedging activities isincluded in Note 11 to the Consolidated Financial Statements.
Inventories:
Inventories are stated at cost, not to exceed market. The cost of substantially all of theCompany’s inventories ($58,439 and $67,339 at December 31, 2012 and 2011, respectively)has been determined by the last-in, first-out (LIFO) method. The excess of current cost overLIFO cost of inventories approximates $26,130 and $24,043 at December 31, 2012 and 2011,respectively. The cost of certain foreign inventories ($3,944 and $4,421 at December 31, 2012and 2011, respectively) has been determined by the first-in, first-out (FIFO) method. Rebates,discounts and other cash consideration received from vendors related to inventory purchasesis reflected as a reduction in the cost of the related inventory item, and is therefore reflected incost of sales when the related inventory item is sold.
Property, plant and equipment:
Depreciation is computed for financial reporting purposes by use of the straight-line methodbased on useful lives of 20 to 35 years for buildings and 5 to 20 years for machinery andequipment. Depreciation expense was $19,925, $19,229 and $18,279 in 2012, 2011 and 2010,respectively.
Carrying value of long-lived assets:
The Company reviews long-lived assets to determine if there are events or circumstancesindicating that the amount of the asset reflected in the Company’s balance sheet may not berecoverable. When such indicators are present, the Company compares the carrying value ofthe long-lived asset, or asset group, to the future undiscounted cash flows of the underlyingassets to determine if impairment exists. If applicable, an impairment charge would be recordedto write down the carrying value to its fair value. The determination of fair value involves the useof estimates of future cash flows that involve considerable management judgment and arebased upon assumptions about expected future operating performance. The actual cash flowscould differ from management’s estimates due to changes in business conditions, operatingperformance, and economic conditions. No impairment charges of long-lived assets wererecorded by the Company during 2012, 2011 and 2010.
Postretirement health care and life insurance benefits:
The Company provides certain postretirement health care and life insurance benefits. Thecost of these postretirement benefits is accrued during employees’ working careers. TheCompany also provides split dollar life benefits to certain executive officers. The Companyrecords an asset equal to the cumulative insurance premiums paid that will be recovered uponthe death of covered employees or earlier under the terms of the plan. No premiums were paidin 2012, 2011 and 2010. Certain split dollar agreements were terminated during 2012 whichresulted in the full repayment to the Company of all of the cumulative premiums previously paidon these policies. During 2012 the Company received $7,298 of such repayments which wererecorded as a reduction in the carrying value of Split Dollar Officer Life Insurance.
Notes to Consolidated Financial Statements ($ in thousands except per share data)
TOOTSIE ROLL INDUSTRIES, INC. AND SUBSIDIARIES
Merrill Corp - Tootsie Roll 10-K 12-05-2012 ED [AUX] | 105123 | 28-Feb-13 03:25 | 12-28786-1.ea | Sequence: 1CHKSUM Content: 46012 Layout: 36253 Graphics: No Graphics CLEAN
JOB: 12-28786-1 CYCLE#;BL#: 6; 0 TRIM: 11" x 8.5" AS: CHI COMPOSITECOLORS: Black, ~note-color 2, ~note-color 3 GRAPHICS: none V1.5

Goodwill and indefinite-lived intangible assets:In accordance with authoritative guidance, goodwill and intangible assets with indefinite lives
are not amortized, but rather tested for impairment at least annually unless certain interimtriggering events or circumstances require more frequent testing. All trademarks have beenassessed by management to have indefinite lives because they are expected to generate cashflows indefinitely. The Company has completed its annual impairment testing of its goodwilland trademarks at December 31 of each of the years presented. No impairments of intangibleswere recorded in 2012 and 2011.
This determination is made by comparing the carrying value of the asset with its estimatedfair value, which is calculated using estimates including discounted projected future cash flows.If the carrying value of goodwill exceeds the fair value, a second step would measure thecarrying value and implied fair value of goodwill. Management believes that all assumptionsused for the impairment tests are consistent with those utilized by market participants performingsimilar valuations.
Income taxes:Deferred income taxes are recorded and recognized for future tax effects of temporary
differences between financial and income tax reporting. The Company records valuationallowances in situations where the realization of deferred tax assets is not more-likely-than-not.Federal income taxes are provided on the portion of income of foreign subsidiaries that isexpected to be remitted to the U.S. and become taxable, but not on the portion that isconsidered to be permanently invested in the foreign subsidiary.
Foreign currency translation:The U.S. dollar is used as the functional currency where a substantial portion of the subsidiary’s
business is indexed to the U.S. dollar or where its manufactured products are principally soldin the U.S. All other foreign subsidiaries use the local currency as their functional currency.Where the U.S. dollar is used as the functional currency, foreign currency remeasurements arerecorded as a charge or credit to other income, net in the statement of earnings. Where theforeign local currency is used as the functional currency, translation adjustments are recordedas a separate component of accumulated other comprehensive (loss).
Equity method investment:The Company’s 50% interest in two foreign companies is accounted for using the equity
method. The Company records an increase in its investment to the extent of its share of earnings,and reduces its investment to the extent of losses and dividends received. No dividends werepaid in 2012, 2011 and 2010.
As of December 31, 2012, management determined that the carrying value of its equitymethod investment was impaired as a result of accumulated losses from operations and reviewof future expectations. The Company recorded a pre-tax impairment charge of $850 resultingin an adjusted carrying value of $2,127 as of December 31, 2012. The fair value was assessedprimarily using the discounted cash flow method. The key inputs to this method includeprojections of future cash flows, determinations of appropriate discount rates, and otherassumptions of the equity method investee which are considered reasonable and inherent inthe discounted cash flow analysis. No impairment was recorded in 2011 or 2010.
Comprehensive earnings:Comprehensive earnings includes net earnings, foreign currency translation adjustments and
unrealized gains/losses on commodity and/or foreign currency hedging contracts, available forsale securities and certain postretirement benefit obligations.
Earnings per share:A dual presentation of basic and diluted earnings per share is not required due to the lack of
potentially dilutive securities under the Company’s simple capital structure. Therefore, allearnings per share amounts represent basic earnings per share.
The Class B Common Stock has essentially the same rights as Common Stock, except thateach share of Class B Common Stock has ten votes per share (compared to one vote per shareof Common Stock), is not traded on any exchange, is restricted as to transfer and is convertibleon a share-for-share basis, at any time and at no cost to the holders, into shares of CommonStock which are traded on the New York Stock Exchange.
Use of estimates:The preparation of consolidated financial statements in conformity with accounting principles
generally accepted in the U.S. requires management to make estimates and assumptions thataffect the amounts reported. Estimates are used when accounting for sales discounts, allowancesand incentives, product liabilities, assets recorded at fair value, income taxes, depreciation,amortization, employee benefits, contingencies and intangible asset and liability valuations. Forinstance, in determining the annual post-employment benefit costs, the Company estimates thecost of future health care benefits. Actual results may or may not differ from those estimates.
Recent accounting pronouncements:In May 2011, the Financial Accounting Standards Board (FASB) issued new accounting rules
related to fair value measurements. The new accounting rules clarify some existing concepts,eliminate wording differences between Generally Accepted Accounting Principles (GAAP) andInternational Financial Reporting Standards (IFRS), and in some limited cases, change someprinciples to achieve convergence between GAAP and IFRS. The new accounting rules resultin a consistent definition of fair value and common requirements for measurement of anddisclosure about fair value between GAAP and IFRS. The new accounting rules also expandthe disclosures for fair value measurements that are estimated using significant unobservable(Level 3) inputs. The adoption of the new accounting rules on January 1, 2012 did not have amaterial effect on the Company’s financial condition, results of operations or cash flows.
In June 2011, the FASB issued new accounting rules that require an entity to present the totalof comprehensive income, the components of net income, and the components of othercomprehensive income either in a single continuous statement of comprehensive income, or intwo separate but consecutive statements. The new accounting rules eliminate the option topresent components of other comprehensive income as part of the statement of equity. Theadoption of the new accounting rules on January 1, 2012 did not have a material effect on theCompany’s financial condition, results of operations or cash flows.
In September 2011, the FASB issued new accounting rules related to testing goodwill forimpairment. The new accounting rules permit an entity to first assess qualitative factors todetermine if it is more likely than not that the fair value of a reporting unit is less than its carryingvalue. If it is concluded that this is the case, it is necessary to perform the two-step goodwillimpairment test prescribed under current accounting rules. Otherwise, the two-step goodwillimpairment test is not required. The adoption of the new accounting rules on January 1, 2012did not have a material effect on the Company’s financial condition, results of operations orcash flows.
In July 2012, the FASB issued amendments to the indefinite-lived intangible asset impairmentguidance which provides an option for companies to use a qualitative approach to test indefinite-lived intangible assets for impairment if certain conditions are met. The amendments areeffective for annual and interim indefinite-lived intangible asset impairment tests performed forfiscal years beginning after September 15, 2012 (early adoption is permitted). The implementation
19
Merrill Corp - Tootsie Roll 10-K 12-05-2012 ED [AUX] | 105123 | 28-Feb-13 03:25 | 12-28786-1.ea | Sequence: 2CHKSUM Content: 49040 Layout: 64843 Graphics: No Graphics CLEAN
JOB: 12-28786-1 CYCLE#;BL#: 6; 0 TRIM: 11" x 8.5" AS: CHI COMPOSITECOLORS: Black, ~note-color 2, ~note-color 3 GRAPHICS: none V1.5

of the amended accounting guidance is not expected to have a material impact on theCompany’s financial condition, results of operations or cash flows.
In February 2013, the FASB issued authoritative guidance related to reclassifications out ofaccumulated OCI. Under the amendments in this update, an entity is required to report, in oneplace, information about reclassifications out of accumulated OCI and to report changes in itsaccumulated OCI balances. For significant items reclassified out of accumulated OCI to netincome in their entirety in the same reporting period, reporting is required about the effect ofthe reclassifications on the respective line items in the statement where net income is presented.For items that are not reclassified to net income in their entirety in the same reporting period, across reference to other disclosures currently required under GAAP is required in the notes.This guidance is effective prospectively for reporting periods beginning after December 15,2012. The Company will provide the required disclosures beginning in the first quarter of fiscalyear 2013 and does not believe the adoption of this guidance will have a material impact on itsConsolidated Financial Statements.
NOTE 2—ACCRUED LIABILITIES:
Accrued liabilities are comprised of the following: December 31, 2012 2011 Compensation . . . . . . . . . . . . . . . . . . . . . . . . . . . . . . . . . . . . . . . . . . . . . . . . . . $ 8,948 $ 8,817Other employee benefits . . . . . . . . . . . . . . . . . . . . . . . . . . . . . . . . . . . . . . . . . . 7,121 7,299Taxes, other than income . . . . . . . . . . . . . . . . . . . . . . . . . . . . . . . . . . . . . . . . . 2,618 1,954Advertising and promotions . . . . . . . . . . . . . . . . . . . . . . . . . . . . . . . . . . . . . . . 21,431 20,568Other . . . . . . . . . . . . . . . . . . . . . . . . . . . . . . . . . . . . . . . . . . . . . . . . . . . . . . . . . 5,032 4,431 $45,150 $43,069
NOTE 3—INDUSTRIAL DEVELOPMENT BONDS:
Industrial development bonds are due in 2027. The average floating interest rate was 0.3% in2012 and 2011. See Note 10 to the Consolidated Financial Statements for fair value disclosures.
NOTE 4—INCOME TAXES:
The domestic and foreign components of pretax income are as follows: 2012 2011 2010 Domestic . . . . . . . . . . . . . . . . . . . . . . . . . . . . . . . . . . . . . . . . . $64,173 $56,651 $59,308Foreign . . . . . . . . . . . . . . . . . . . . . . . . . . . . . . . . . . . . . . . . . . 9,991 4,261 13,760 $ 74,164 $60,912 $73,068
The provision for income taxes is comprised of the following: 2012 2011 2010 Current: Federal . . . . . . . . . . . . . . . . . . . . . . . . . . . . . . . . . . . . . . . . . $24,312 $15,568 $10,251 Foreign . . . . . . . . . . . . . . . . . . . . . . . . . . . . . . . . . . . . . . . . . 231 559 806 State . . . . . . . . . . . . . . . . . . . . . . . . . . . . . . . . . . . . . . . . . . . 1,914 863 1,455 26,457 16,990 12,512 Deferred: Federal . . . . . . . . . . . . . . . . . . . . . . . . . . . . . . . . . . . . . . . . . (6,857) (1,230) 5,622 Foreign . . . . . . . . . . . . . . . . . . . . . . . . . . . . . . . . . . . . . . . . . 1,710 1,221 2,518 State . . . . . . . . . . . . . . . . . . . . . . . . . . . . . . . . . . . . . . . . . . . 850 (7) (647) (4,297) (16) 7,493 $22,160 $16,974 $20,005
Significant components of the Company’s net deferred tax liability at year end were as follows: December 31, 2012 2011 Deferred tax assets: Accrued customer promotions . . . . . . . . . . . . . . . . . . . . . . . . . . . . . . . . . . . . $ 3,971 $ 1,920 Deferred compensation . . . . . . . . . . . . . . . . . . . . . . . . . . . . . . . . . . . . . . . . . 19,485 15,593 Postretirement benefits . . . . . . . . . . . . . . . . . . . . . . . . . . . . . . . . . . . . . . . . . 8,127 9,139 Other accrued expenses . . . . . . . . . . . . . . . . . . . . . . . . . . . . . . . . . . . . . . . . 7,749 6,102 Foreign subsidiary tax loss carry forward . . . . . . . . . . . . . . . . . . . . . . . . . . . 13,791 16,406 Tax credit carry forward . . . . . . . . . . . . . . . . . . . . . . . . . . . . . . . . . . . . . . . . . 1,066 1,086 Realized capital losses . . . . . . . . . . . . . . . . . . . . . . . . . . . . . . . . . . . . . . . . . 1,366 1,349 Unrealized capital loss . . . . . . . . . . . . . . . . . . . . . . . . . . . . . . . . . . . . . . . . . . 5,848 6,401 61,403 57,996 Valuation allowance . . . . . . . . . . . . . . . . . . . . . . . . . . . . . . . . . . . . . . . . . . . . (2,040) (2,190) Total deferred tax assets . . . . . . . . . . . . . . . . . . . . . . . . . . . . . . . . . . . . . . . . $59,363 $55,806 Deferred tax liabilities: Depreciation . . . . . . . . . . . . . . . . . . . . . . . . . . . . . . . . . . . . . . . . . . . . . . . . . . $33,858 $35,103 Deductible goodwill and trademarks . . . . . . . . . . . . . . . . . . . . . . . . . . . . . . . 42,450 38,635 Accrued export company commissions . . . . . . . . . . . . . . . . . . . . . . . . . . . . 5,117 4,649 Employee benefit plans . . . . . . . . . . . . . . . . . . . . . . . . . . . . . . . . . . . . . . . . . 876 2,248 Inventory reserves . . . . . . . . . . . . . . . . . . . . . . . . . . . . . . . . . . . . . . . . . . . . . 256 1,733 Prepaid insurance . . . . . . . . . . . . . . . . . . . . . . . . . . . . . . . . . . . . . . . . . . . . . 697 289 Accounts receivable . . . . . . . . . . . . . . . . . . . . . . . . . . . . . . . . . . . . . . . . . . . — 733 Deferred gain on sale of real estate . . . . . . . . . . . . . . . . . . . . . . . . . . . . . . . . 8,169 7,644 Total deferred tax liabilities . . . . . . . . . . . . . . . . . . . . . . . . . . . . . . . . . . . . . . . $91,423 $91,034 Net deferred tax liability . . . . . . . . . . . . . . . . . . . . . . . . . . . . . . . . . . . . . . . . . $32,060 $35,228
At December 31, 2012, the Company has provided a valuation allowance relating to $1,366of capital loss carry forwards which begin to expire in 2013.
At December 31, 2012, the Company has recognized $674 of benefits related to foreignsubsidiary tax credit carry forwards. The carry forward credits expire in 2017. A valuationallowance has been established for the carry forward losses to reduce the future income taxbenefits to amounts expected to be realized. The Company has also recognized $392 of benefitsrelated to state tax credit carry forwards.
At December 31, 2012, the tax benefits of foreign subsidiary tax loss carry forwards expiringby year are as follows: $415 in 2015, $374 in 2026, $654 in 2027, $6,724 in 2028, $4,785 in2029 and $839 in 2031.
The effective income tax rate differs from the statutory rate as follows: 2012 2011 2010 U.S. statutory rate . . . . . . . . . . . . . . . . . . . . . . . . . . . . . . . . . . . . . . . . . . 35.0% 35.0% 35.0%State income taxes, net . . . . . . . . . . . . . . . . . . . . . . . . . . . . . . . . . . . . . . 1.1 1.2 1.1Exempt municipal bond interest . . . . . . . . . . . . . . . . . . . . . . . . . . . . . . . (0.5) (0.5) (0.4)Foreign tax rates . . . . . . . . . . . . . . . . . . . . . . . . . . . . . . . . . . . . . . . . . . . (1.6) (0.4) (2.0)Qualified domestic production activities deduction . . . . . . . . . . . . . . . . (3.1) (2.5) (2.6)Tax credits receivable . . . . . . . . . . . . . . . . . . . . . . . . . . . . . . . . . . . . . . . (0.9) (0.4) (0.2)Adjustment of deferred tax balances . . . . . . . . . . . . . . . . . . . . . . . . . . . (0.5) (1.7) —Reserve for uncertain tax benefits . . . . . . . . . . . . . . . . . . . . . . . . . . . . . (0.3) (0.6) (2.3)Other, net . . . . . . . . . . . . . . . . . . . . . . . . . . . . . . . . . . . . . . . . . . . . . . . . . 0.7 (2.2) (1.2) Effective income tax rate . . . . . . . . . . . . . . . . . . . . . . . . . . . . . . . . . . . . . 29.9% 27.9% 27.4%
The Company has not provided for U.S. federal or foreign withholding taxes on $8,868 and$6,410 of foreign subsidiaries’ undistributed earnings as of December 31, 2012 andDecember 31, 2011, respectively, because such earnings are considered to be permanently
20
Merrill Corp - Tootsie Roll 10-K 12-05-2012 ED [AUX] | 105123 | 28-Feb-13 03:25 | 12-28786-1.ea | Sequence: 3CHKSUM Content: 65516 Layout: 10459 Graphics: No Graphics CLEAN
JOB: 12-28786-1 CYCLE#;BL#: 6; 0 TRIM: 11" x 8.5" AS: CHI COMPOSITECOLORS: Black, ~note-color 2, ~note-color 3 GRAPHICS: none V1.5

reinvested. It is not practicable to determine the amount of income taxes that would be payableupon remittance of the undistributed earnings.
The Company recognizes interest and penalties related to unrecognized tax benefits in theprovision for income taxes on the Consolidated Statements of Earnings , ComprehensiveEarnings and Retained Earnings.
At December 31, 2012 and 2011, the Company had unrecognized tax benefits of $6,677 and$6,804, respectively. Included in this balance is $4,306 and $4,199, respectively, ofunrecognized tax benefits that, if recognized, would favorably affect the annual effective incometax rate. As of December 31, 2012 and 2011, $1,189 and $1,541, respectively, of interest andpenalties were included in the liability for uncertain tax positions.
A reconciliation of the beginning and ending balances of the total amounts of unrecognizedtax benefits is as follows:
2012 2011 2010 Unrecognized tax benefits at January 1 . . . . . . . . . . . . . . . . . . . . . . . . . $6,804 $8,138 $14,370Increases in tax positions for the current year . . . . . . . . . . . . . . . . . . . . . 727 320 632Reductions in tax positions for lapse of statute of limitations . . . . . . . . . (854) (668) (1,122)Reductions in tax positions for withdrawal of positions previously taken . . — — (5,256)Reductions in tax positions for effective settlements . . . . . . . . . . . . . . . . — (986) (486) Unrecognized tax benefits at December 31 . . . . . . . . . . . . . . . . . . . . . . $6,677 $6,804 $ 8,138
The Company is subject to taxation in the U.S. and various state and foreign jurisdictions.The Company remains subject to examination by U.S. federal and state and foreign taxauthorities for the years 2009 through 2011. With few exceptions, the Company is no longersubject to examinations by tax authorities for the year 2008 and prior.
The Company is currently subject to a U.S. federal examination for tax years 2009 and 2010.The field work has not yet concluded and the Company is unable to determine the outcome atthis time. The Company’s Canadian subsidiary is currently subject to examination by the CanadaRevenue Agency for tax years 2005 and 2006. The Company is unable to determine theoutcome of the examination at this time. In addition, the Company is currently subject to variousstate tax examinations. Although the Company is unable to determine the ultimate outcome ofthe ongoing examinations, the Company believes that its liability for uncertain tax positionsrelating to these jurisdictions for such years is adequate.
NOTE 5—SHARE CAPITAL AND CAPITAL IN EXCESS OF PAR VALUE:
Capital in Class B Excess Common Stock Common Stock Treasury Stock of Par Shares Amount Shares Amount Shares Amount Value (000’s) (000’s) (000’s) Balance at January 1, 2010 . . . . . . . . . . . . 35,802 $24,862 19,919 $13,833 (67) $(1,992) $482,250Issuance of 3% stock dividend . . . . . . . . . 1,070 743 597 414 (2) — 45,526Conversion of Class B common shares tocommon shares . . . . . . . . . . . . . . . . . . . . 50 35 (50) (35) — — —
Purchase and retirement of commonshares . . . . . . . . . . . . . . . . . . . . . . . . . . . . (865) (600) — — — — (22,281)
Balance at December 31, 2010 . . . . . . . . . 36,057 25,040 20,466 14,212 (69) (1,992) 505,495Issuance of 3% stock dividend . . . . . . . . . 1,077 748 612 426 (2) — 45,880Conversion of Class B common shares tocommon shares . . . . . . . . . . . . . . . . . . . . 53 37 (53) (37) — — —
Purchase and retirement of commonshares . . . . . . . . . . . . . . . . . . . . . . . . . . . . (708) (492) — — — — (17,698)
Capital in Class B Excess Common Stock Common Stock Treasury Stock of Par Shares Amount Shares Amount Shares Amount Value (000’s) (000’s) (000’s) Balance at December 31, 2011 . . . . . . . . . 36,479 $25,333 21,025 $14,601 (71) $(1,992) $533,677Issuance of 3% stock dividend . . . . . . . . . 1,085 753 631 437 (2) — 37,046Conversion of Class B common shares tocommon shares . . . . . . . . . . . . . . . . . . . . 29 20 (29) (20) — — —
Purchase and retirement of commonshares . . . . . . . . . . . . . . . . . . . . . . . . . . . . (944) (656) — — — — (23,147)
Balance at December 31, 2012 . . . . . . . . . 36,649 $25,450 21,627 $15,018 (73) $(1,992) $547,576
Average shares outstanding and all per share amounts included in the financial statements andnotes thereto have been adjusted retroactively to reflect annual three percent stock dividends.
While the Company does not have a formal or publicly announced Company Common Stockpurchase program, the Company’s board of directors periodically authorizes a dollar amountfor such share purchases.
Based upon this policy, shares were purchased and retired as follows: Total Number of SharesYear Purchased (000’s) Average Price Paid Per Share 2012 . . . . . . . . . . . . . . . . . . . . . . . . . . . . . . . . 944 $25.162011 . . . . . . . . . . . . . . . . . . . . . . . . . . . . . . . . 708 $25.642010 . . . . . . . . . . . . . . . . . . . . . . . . . . . . . . . . 865 $26.41
NOTE 6—OTHER INCOME, NET:
Other income, net is comprised of the following: 2012 2011 2010 Interest and dividend income . . . . . . . . . . . . . . . . . . . . . . . . . . . . . $ 1,369 $1,087 $ 879Gains on trading securities relating to deferred compensation plans . . . . . . . . . . . . . . . . . . . . . . . . . . . 4,616 29 3,364Interest expense . . . . . . . . . . . . . . . . . . . . . . . . . . . . . . . . . . . . . . . (137) (121) (142)Impairment of equity investment . . . . . . . . . . . . . . . . . . . . . . . . . . (850) — —Equity method investment loss . . . . . . . . . . . . . . . . . . . . . . . . . . . . (1,019) (194) (342)Foreign exchange gains . . . . . . . . . . . . . . . . . . . . . . . . . . . . . . . . . 442 2,098 4,090Capital losses . . . . . . . . . . . . . . . . . . . . . . . . . . . . . . . . . . . . . . . . . (59) (227) (28)Miscellaneous, net . . . . . . . . . . . . . . . . . . . . . . . . . . . . . . . . . . . . . 323 274 537 $ 4,685 $2,946 $ 8,358
NOTE 7—EMPLOYEE BENEFIT PLANS:
Pension plans:The Company sponsors defined contribution pension plans covering certain non-union
employees with over one year of credited service. The Company’s policy is to fund pensioncosts accrued based on compensation levels. Total pension expense for 2012, 2011 and 2010approximated $4,327, $4,011 and $4,196, respectively. The Company also maintains certainprofit sharing and retirement savings-investment plans. Company contributions in 2012, 2011and 2010 to these plans were $1,107, $1,024 and $1,043, respectively.
The Company also contributes to multi-employer defined benefit pension plan for certain of itsunion employees under a collective bargaining agreement which is currently under negotiation,as follows:
Plan name: Bakery and Confectionery Union and Industry International Pension Fund
21
Merrill Corp - Tootsie Roll 10-K 12-05-2012 ED [AUX] | 105123 | 28-Feb-13 03:25 | 12-28786-1.ea | Sequence: 4CHKSUM Content: 45222 Layout: 19488 Graphics: No Graphics CLEAN
JOB: 12-28786-1 CYCLE#;BL#: 6; 0 TRIM: 11" x 8.5" AS: CHI COMPOSITECOLORS: Black, ~note-color 2, ~note-color 3 GRAPHICS: none V1.5

Employer Identification Number and plan number: 52-6118572, plan number 001Funded Status as of the most recent year available: 83.61% funded as of January 1, 2011The Company’s contributions to such plan: $2,131, $2,046 and $1,923 in 2012, 2011 and
2010, respectivelyPlan status: Not in critical nor endangered as of December 31, 2011
During 2012, the Company received its Annual Funding Notice, Notice of Funded Status, anda Rehabilitation Plan (Notices), as defined by the Pension Protection Act (PPA), from the Bakeryand Confectionery Union and Industry International (BC&T) Pension Fund (Plan), a multi-employer defined benefit pension plan for certain Company union employees. The Noticesindicate that the Plan’s actuary has certified that the Plan is in critical status, the “Red Zone”, asdefined by the PPA, and that a plan of rehabilitation was adopted by the Trustees of the Plan(Trustees) in fourth quarter 2012. The Trustees have advised that one of the largest contributorsto the Plan filed for bankruptcy and ceased making contributions to the Plan in 2011, and thatthe Plan has achieved less favorable investment performance returns to maintain a favorablefunding status. The Trustees indicated that the aforementioned are the primary reasons for thePlan’s deterioration to critical status. As of January 1, 2011 plan valuation date, the BC&T Planhad 116,708 participants, of which 32,449 (28%) were active participants, 54,470 (47%) wereretired or separated from service and receiving benefits, and 29,789 (25%) were retired orseparated from service and entitled to receive future benefits.
During 2012, a Committee comprised of an equal number of BC&T Union and participatingemployer Trustees reviewed possible plan changes, including benefit reductions and increasedemployer contributions, and concluded that it was not feasible for the Plan to adopt changeswhich would allow it to emerge from critical status within the ten year targeted period as definedin the PPA. The Committee determined that rehabilitation within ten years would require 15%annual compounded surcharges on employer contributions, and that such action was notfeasible and would likely have an adverse effect on the Plan. Under the Rehabilitation Planadopted, the Plan is projected to emerge from critical status sometime beyond the 30 yearprojection period. In the event that a plan does not have the financial resources to ultimatelypay benefits at a level specified by law, then it must apply to the Pension Benefits GuarantyCorporation for government financial assistance.
The Rehabilitation Plan adopted requires that employer contributions include 5% compoundedannual surcharges each year for an unspecified period of time beginning January 2013 (inaddition to the 5% interim surcharge initiated in June 2012) as well as certain plan benefitreductions. The Trustees will review the Plan’s progress each year and will consider if furtheradjustments, including employer surcharges or plan benefit modifications, are necessary tomeet the objectives of the Rehabilitation Plan. The Trustees have advised that neither the PPAnor regulatory guidance currently defines the rehabilitation standards for a plan that is notdesigned to emerge from critical status within the 10-year rehabilitation period. Companycontributions to the Plan were $2,131, $2,046 and $1,923 in each of the years 2012, 2011 and2010, respectively. The Company was advised by the Plan that if the Company had withdrawnfrom the Plan during 2012 its estimated withdrawal liability would have been $37,200. Although theCompany has not made any decisions regarding withdrawal from the Plan, the Company is exploringvarious alternatives, including withdrawal from the Plan. Should the Company actually withdraw fromthe Plan at a future date, a withdrawal liability, which could be higher than $37,200, would be payableto the Plan. The Company is currently unable to determine the ultimate outcome of the abovediscussed matter and therefore, is unable to determine the effects on its consolidated financialstatements, but, the ultimate outcome could be material to its consolidated results of operations inone or more future periods.
Deferred compensation:The Company sponsors three deferred compensation plans for selected executives and other
employees: (i) the Excess Benefit Plan, which restores retirement benefits lost due to IRS
limitations on contributions to tax-qualified plans, (ii) the Supplemental Plan, which allows eligibleemployees to defer the receipt of eligible compensation until designated future dates and(iii) the Career Achievement Plan, which provides a deferred annual incentive award to selectedexecutives. Participants in these plans earn a return on amounts due them based on severalinvestment options, which mirror returns on underlying investments (primarily mutual funds).The Company economically hedges its obligations under the plans by investing in the actualunderlying investments. These investments are classified as trading securities and are carriedat fair value. At December 31, 2012 and 2011, these investments totaled $49,378 and $41,768,respectively. All gains and losses and related investment income in these investments, whichare recorded in other income, net, are equally offset by corresponding increases and decreasesin the Company’s deferred compensation liabilities.
Postretirement health care and life insurance benefit plans:The Company provides certain postretirement health care and life insurance benefits for
corporate office and management employees based upon their age, years of service, date ofhire and if they agree to contribute a portion of the cost as determined by the Company. TheCompany has the right to modify or terminate these benefits and does not fund postretirementhealth care and life insurance benefits in advance of payments for benefit claims. The Companyis currently contemplating changes to its postretirement health care and life insurance benefitswith the intention of reducing the Company’s cost of providing such benefits. These changesare likely to include increasing retiree premium contributions, reducing and eliminating certainbenefits, and taking steps to ensure that the Company does not become subject to the excisetax on high value coverage instituted by the Patient Protection and Affordability Act. The Companyis not presently able to determine the effects of such changes on its financial statements.
Amounts recognized in accumulated other comprehensive loss (pre-tax) at December 31,2012 are as follows:Prior service credit . . . . . . . . . . . . . . . . . . . . . . . . . . . . . . . . . . . . . . . . . . . . . $ (501)Net actuarial loss . . . . . . . . . . . . . . . . . . . . . . . . . . . . . . . . . . . . . . . . . . . . . . 6,574 Net amount recognized in accumulated other comprehensive loss . . . . . . . $6,073
The estimated actuarial loss and prior service credit to be amortized from accumulated othercomprehensive earnings (loss) into net periodic benefit cost during 2013 are $796 and $(125),respectively.
The changes in the accumulated postretirement benefit obligation at December 31, 2012 and2011 consist of the following: December 31 2012 2011 Benefit obligation, beginning of year . . . . . . . . . . . . . . . . . . . . . . . . . . . . . . . . $26,108 $20,689Service cost . . . . . . . . . . . . . . . . . . . . . . . . . . . . . . . . . . . . . . . . . . . . . . . . . . . 1,034 831Interest cost . . . . . . . . . . . . . . . . . . . . . . . . . . . . . . . . . . . . . . . . . . . . . . . . . . . 1,113 1,117Actuarial (gain)/loss . . . . . . . . . . . . . . . . . . . . . . . . . . . . . . . . . . . . . . . . . . . . . (520) 3,898Benefits paid . . . . . . . . . . . . . . . . . . . . . . . . . . . . . . . . . . . . . . . . . . . . . . . . . . (354) (427) Benefit obligation, end of year . . . . . . . . . . . . . . . . . . . . . . . . . . . . . . . . . . . . . $ 27,381 $26,108
Net periodic postretirement benefit cost included the following components: 2012 2011 2010 Service cost—benefits attributed to service during the period . . . . . . . $1,034 $ 831 $ 696Interest cost on the accumulated postretirement benefit obligation . . . 1,113 1,117 958Net amortization . . . . . . . . . . . . . . . . . . . . . . . . . . . . . . . . . . . . . . . . . . . 1,036 501 128 Net periodic postretirement benefit cost . . . . . . . . . . . . . . . . . . . . . . . . $3,183 $2,449 $1,782
22
Merrill Corp - Tootsie Roll 10-K 12-05-2012 ED [AUX] | 105123 | 28-Feb-13 03:25 | 12-28786-1.ea | Sequence: 5CHKSUM Content: 16914 Layout: 54947 Graphics: No Graphics CLEAN
JOB: 12-28786-1 CYCLE#;BL#: 6; 0 TRIM: 11" x 8.5" AS: CHI COMPOSITECOLORS: Black, ~note-color 2, ~note-color 3 GRAPHICS: none V1.5

For measurement purposes, the 2013 annual rate of increase in the per capita cost of coveredhealth care benefits was assumed to be 8.2% for pre-age 65 retirees, post 65 retirees and forprescription drugs; these rates were assumed to decrease gradually to 5.0% for 2020 andremain at that level thereafter. The health care cost trend rate assumption has a significanteffect on the amounts reported. The weighted-average discount rate used in determining theaccumulated postretirement benefit obligation was 3.91% and 4.31% at December 31, 2012and 2011, respectively.
Increasing or decreasing the health care trend rates by one percentage point in each yearwould have the following effect: 1% Increase 1% Decrease Postretirement benefit obligation . . . . . . . . . . . . . . . . . . . . . . . . . . . . . . $6,569 $(4,281)Total of service and interest cost components . . . . . . . . . . . . . . . . . . . $ 604 $ (407)
The Company estimates future benefit payments will be $613, $752, $900, $1,014 and $1,136in 2013 through 2017, respectively, and a total of $7,443 in 2018 through 2022. The futurebenefit payments are before the expected annual Medicare Part D subsidies of $58, $64, $72,$82, and $91 in 2013 through 2017, respectively, and a total of $615 in 2018 through 2022.
NOTE 8—COMMITMENTS:
Rental expense aggregated $967, $1,042 and $1,152 in 2012, 2011 and 2010, respectively.Future operating lease commitments are not significant.
NOTE 9—SEGMENT AND GEOGRAPHIC INFORMATION:
The Company operates as a single reportable segment encompassing the manufacture andsale of confectionery products. Its principal manufacturing operations are located in the UnitedStates and Canada, and its principal market is the United States. The Company alsomanufactures and sells confectionery products in Mexico, and exports products to Canadaand other countries worldwide.
The following geographic data includes net product sales summarized on the basis of thecustomer location and long-lived assets based on their physical location: 2012 2011 2010 Net product sales: United States . . . . . . . . . . . . . . . . . . . . . . . . . . . . . . . . . . . $499,660 $487,185 $471,714 Foreign . . . . . . . . . . . . . . . . . . . . . . . . . . . . . . . . . . . . . . . . 46,325 41,184 45,435 $545,985 $528,369 $517,149 Long-lived assets: United States . . . . . . . . . . . . . . . . . . . . . . . . . . . . . . . . . . . $ 161,504 $170,173 $172,087 Foreign . . . . . . . . . . . . . . . . . . . . . . . . . . . . . . . . . . . . . . . . 39,786 41,989 43,405 $ 201,290 $212,162 $215,492
NOTE 10—FAIR VALUE MEASUREMENTS:
Current accounting guidance defines fair value as the price that would be received in thesale of an asset or paid to transfer a liability in an orderly transaction between market participantsat the measurement date. Guidance requires disclosure of the extent to which fair value is usedto measure financial assets and liabilities, the inputs utilized in calculating valuationmeasurements, and the effect of the measurement of significant unobservable inputs onearnings, or changes in net assets, as of the measurement date. Guidance establishes a three-level valuation hierarchy based upon the transparency of inputs utilized in the measurementand valuation of financial assets or liabilities as of the measurement date. Level 1 inputs include
quoted prices for identical instruments and are the most observable. Level 2 inputs includequoted prices for similar assets and observable inputs such as interest rates, foreign currencyexchange rates, commodity rates and yield curves. Level 3 inputs are not observable in themarket and include management’s own judgments about the assumptions market participantswould use in pricing the asset or liability. The use of observable and unobservable inputs isreflected in the hierarchy assessment disclosed in the table below.
As of December 31, 2012 and 2011, the Company held certain financial assets that arerequired to be measured at fair value on a recurring basis. These included derivative hedginginstruments related to the foreign currency forward contracts and purchase of certain rawmaterials, investments in trading securities and available for sale securities, including an auctionrate security (ARS). The Company’s available for sale and trading securities principally consistof municipal bonds and mutual funds that are publicly traded.
The following tables present information about the Company’s financial assets and liabilitiesmeasured at fair value as of December 31, 2012 and 2011, and indicate the fair value hierarchyand the valuation techniques utilized by the Company to determine such fair value: Estimated Fair Value December 31, 2012 Total Input Levels Used
Fair Value Level 1 Level 2 Level 3 Cash and equivalents . . . . . . . . . . . . . . . . . . . . . . $ 63,862 $ 63,862 $ — $ —Auction rate security . . . . . . . . . . . . . . . . . . . . . . . 9,485 — — 9,485Available for sale securities, excluding the
auction rate security . . . . . . . . . . . . . . . . . . . . . 84,568 — 84,568 —Commodity futures contracts, net . . . . . . . . . . . . . (112) (112) — —Trading securities . . . . . . . . . . . . . . . . . . . . . . . . . 49,378 49,378 — — Total assets measured at fair value . . . . . . . . . . . $207,181 $113,128 $84,568 $9,485
Estimated Fair Value December 31, 2011 Total Input Levels Used
Fair Value Level 1 Level 2 Level 3 Cash and equivalents . . . . . . . . . . . . . . . . . . . . . . $ 78,612 $ 78,612 $ — $ —Auction rate security . . . . . . . . . . . . . . . . . . . . . . . 7,453 — — 7,453Available for sale securities, excluding the
auction rate security . . . . . . . . . . . . . . . . . . . . . 57,835 — 57,835 —Foreign currency forward contracts . . . . . . . . . . . 205 — 205 —Commodity futures contracts . . . . . . . . . . . . . . . . 203 203 — —Commodity options contracts . . . . . . . . . . . . . . . . — — — —Trading securities . . . . . . . . . . . . . . . . . . . . . . . . . 41,768 41,768 — — Total assets measured at fair value . . . . . . . . . . . $186,076 $120,583 $58,040 $7,453
Available for sale securities which utilize Level 2 inputs consist primarily of municipal bonds,which are valued based on quoted market prices or alternative pricing sources with reasonablelevels of price transparency.
A summary of the aggregate fair value, gross unrealized gains, gross unrealized losses,realized losses and amortized cost basis of the Company’s investment portfolio by major securitytype is as follows: December 31, 2012
Amortized Fair Unrealized Realized
Available for Sale: Cost Value Gains Losses Losses Auction rate security . . . . . . . . . . . . . . . . $ 8,410 $ 9,485 $1,075 $ — $—Municipal bonds . . . . . . . . . . . . . . . . . . . 84,199 84,551 352 — —Mutual funds . . . . . . . . . . . . . . . . . . . . . . 20 17 — (3) — $92,629 $94,053 $1,427 $ (3) $—
23
Merrill Corp - Tootsie Roll 10-K 12-05-2012 ED [AUX] | 105123 | 28-Feb-13 03:25 | 12-28786-1.ea | Sequence: 6CHKSUM Content: 62460 Layout: 14193 Graphics: No Graphics CLEAN
JOB: 12-28786-1 CYCLE#;BL#: 6; 0 TRIM: 11" x 8.5" AS: CHI COMPOSITECOLORS: Black, ~note-color 2, ~note-color 3 GRAPHICS: none V1.5
December 31, 2011
Amortized Fair Unrealized Realized
Available for Sale: Cost Value Gains Losses Losses Auction rate security . . . . . . . . . . . . . . . . $ 8,410 $ 7,453 $ — $(957) $—Municipal bonds . . . . . . . . . . . . . . . . . . . 57,389 57,791 402 — —Mutual funds . . . . . . . . . . . . . . . . . . . . . . 45 44 — (1) — $65,844 $65,288 $ 402 $(958) $—
As of December 31, 2012, the Company’s long-term investments include $9,485 ($13,550original cost) of Jefferson County Alabama Sewer Revenue Refunding Warrants, originallypurchased with an insurance-backed AAA rating. This is an auction rate security that isclassified as an available-for-sale security. Due to adverse events related to Jefferson Countyand its bond insurance carrier, Financial Guaranty Insurance Company (FGIC), as well asevents in the credit markets, the auctions for this auction rate security have failed since 2008.As such, the Company continues to estimate the fair value of this auction rate security utilizinga valuation model with Level 3 inputs, as defined by guidance. The primary input to thevaluation model was a limited number of market trades during 2012, ranging from 71% to 76%of the original par value. The other factors considered include the credit risk of the collateralunderlying the auction rate security, the credit risk of the bond insurer, interest rates, and theamount and timing of expected future cash flows including assumptions about the marketexpectation of the next successful auction or possible negotiated settlement between theCounty and debt holders. The Company continues to receive all contractual interest paymentson this auction rate security on a timely basis, there has been no default, it is insured by FGICand the Company has the intent and ability to hold this auction rate security until recovery ofits amortized cost basis. Representatives of Jefferson County and the bondholders were innegotiations to reach a settlement agreeable to the bondholders and the insurers, and sincea settlement could not be reached, the County filed for bankruptcy. FGIC is also in bankruptcy.Rulings by the bankruptcy court could have adverse effects to the holders of warrants andother debt, and further reduce the market value of this auction rate security resulting in anadditional other-than-temporary impairments and charges to net earnings. The Company isnot currently able to determine the outcome of this bankruptcy, or the amount and timing ofthe ultimate net proceeds that it may recover. See also the Management’s Discussion andAnalysis of Financial Condition and Results of Operations regarding Jefferson County auctionrate security.
The Company classified this auction rate security as non-current and has included it in long-term investments on the Consolidated Statements of Financial Position at December 31, 2012and 2011 because the Company believes that the current condition of the auction rate securitymarket may take more than twelve months to improve.
The following table presents additional information about the Company’s financial instruments(all ARS) measured at fair value on a recurring basis using Level 3 inputs at December 31,2012 and 2011:
2012 2011 Balance at January 1 . . . . . . . . . . . . . . . . . . . . . . . . . . . . . . . . . . . . . . . . . . . . . . . . . $ 7,453 $6,775Unrealized gain recognized in accumulated other comprehensive loss . . . . . . . . . 2,032 678 Balance at December 31 . . . . . . . . . . . . . . . . . . . . . . . . . . . . . . . . . . . . . . . . . . . . . $9,485 $7,453
The fair value of the Company’s industrial revenue development bonds at December 31, 2012and 2011 were valued using Level 2 inputs which approximates the carrying value of $7,500for both periods. Interest rates on these bonds reset weekly based on current market conditions.
In addition to assets and liabilities that are recorded at fair value on a recurring basis, guidancerequires the Company to record assets and liabilities at fair value on a nonrecurring basisgenerally as a result of impairment charges. Assets measured at fair value on a nonrecurringbasis during 2012 and 2011 are summarized below:
December 31, 2012 Level Used to Determine Fair Value Fair Value Basis Level 1 Level 2 Level 3
Equity method investment . . . . . . . . . . . . . . . . . . . . . . . . $2,127 $— $— $2,127
December 31, 2011 Level Used to Determine Fair Value Fair Value Basis Level 1 Level 2 Level 3
Equity method investment . . . . . . . . . . . . . . . . . . . . . . . . $3,935 $— $— $3,935
As disclosed in Note 1, during the fourth quarter of 2012 the Company recognized animpairment of $850 in an equity method investment. The fair value was determined based onLevel 3 inputs.
NOTE 11—DERIVATIVE INSTRUMENTS AND HEDGING ACTIVITIES:
From time to time, the Company uses derivative instruments, including foreign currencyforward contracts, commodity futures contracts and commodity option contracts, to manageits exposures to foreign exchange and commodity prices. Commodity futures contracts andmost commodity option contracts are intended and effective as hedges of market price risksassociated with the anticipated purchase of certain raw materials (primarily sugar). Foreigncurrency forward contracts are intended and effective as hedges of the Company’s exposureto the variability of cash flows, primarily related to the foreign exchange rate changes of productsmanufactured in Canada and sold in the United States, and periodic equipment purchasesfrom foreign suppliers denominated in a foreign currency. The Company does not engage intrading or other speculative use of derivative instruments.
The Company recognizes all derivative instruments as either assets or liabilities at fair valuein the Consolidated Statements of Financial Position. Derivative assets are recorded in otherreceivables and derivative liabilities are recorded in accrued liabilities. The Company useseither hedge accounting or mark-to-market accounting for its derivative instruments. Derivativesthat qualify for hedge accounting are designated as cash flow hedges by formally documentingthe hedge relationships, including identification of the hedging instruments, the hedged itemsand other critical terms, as well as the Company’s risk management objectives and strategiesfor undertaking the hedge transaction.
Changes in the fair value of the Company’s cash flow hedges are recorded in accumulatedother comprehensive loss, net of tax, and are reclassified to earnings in the periods in whichearnings are affected by the hedged item. Substantially all amounts reported in accumulatedother comprehensive loss for commodity derivatives are expected to be reclassified to cost ofgoods sold. Substantially all amounts reported in accumulated other comprehensive loss forforeign currency derivatives are expected to be reclassified to other income, net.
24
Merrill Corp - Tootsie Roll 10-K 12-05-2012 ED [AUX] | 105123 | 28-Feb-13 03:25 | 12-28786-1.ea | Sequence: 7CHKSUM Content: 31603 Layout: 20214 Graphics: No Graphics CLEAN
JOB: 12-28786-1 CYCLE#;BL#: 6; 0 TRIM: 11" x 8.5" AS: CHI COMPOSITECOLORS: Black, ~note-color 2, ~note-color 3 GRAPHICS: none V1.5
The following table summarizes the Company’s outstanding derivative contracts and theireffects on its Consolidated Statements of Financial Position at December 31, 2012 and 2011:
December 31, 2012
Notional Amounts Assets Liabilities Derivatives designated as hedging instruments: Commodity futures contracts . . . . . . . . . . . . . . . . . . . . . . . . . . . $ 7,868 $127 $(301) Total derivatives designated as hedging instruments: . . . . . . . . 127 (301) Derivatives not designated as hedging instruments: Commodity futures contracts . . . . . . . . . . . . . . . . . . . . . . . . . . . 627 62 — Total derivatives not designated as hedging instruments: . . . . . 62 — Total derivatives . . . . . . . . . . . . . . . . . . . . . . . . . . . . . . . . . . . . . . $189 $(301)
December 31, 2011
Notional Amounts Assets Liabilities Derivatives designated as hedging instruments: Foreign currency forward contracts . . . . . . . . . . . . . . . . . . . . . . $13,044 $205 $ — Commodity futures contracts . . . . . . . . . . . . . . . . . . . . . . . . . . . 4,557 341 (138) Total derivatives . . . . . . . . . . . . . . . . . . . . . . . . . . . . . . . . . . . . . . $546 $(138)
The effects of derivative instruments on the Company’s Consolidated Statement of Earnings,Comprehensive Earnings and Retained Earnings for years ended December 31, 2012 and2011 are as follows:
For Year Ended December 31, 2012 Gain (Loss) Gain (Loss) on Amount Excluded Gain (Loss) Reclassified from from Effectiveness Recognized Accumulated OCI Testing Recognized in OCI into Earnings in Earnings Foreign currency forward contracts . . . . . . . . . . . . . . $ 222 $ 427 $—Commodity futures contracts . . . . . . . . . . . . . . . . . . . (526) (149) —Commodity option contracts . . . . . . . . . . . . . . . . . . . (35) (35) — Total . . . . . . . . . . . . . . . . . . . . . . . . . . . . . . . . . . . . . . $ (339) $ 243 $—
For Year Ended December 31, 2011 Gain (Loss) Gain (Loss) on Amount Excluded Gain (Loss) Reclassified from from Effectiveness Recognized Accumulated OCI Testing Recognized in OCI into Earnings in Earnings Foreign currency forward contracts . . . . . . . . . . . . . . $ 317 $1,054 $—Commodity futures contracts . . . . . . . . . . . . . . . . . . . 4,674 6,782 —Commodity option contracts . . . . . . . . . . . . . . . . . . . (5,388) (305) — Total . . . . . . . . . . . . . . . . . . . . . . . . . . . . . . . . . . . . . . $ (397) $7,531 $—
For the years ended December 31, 2012 and 2011, the Company recognized a gain of $62and $0 in earnings, respectively, related to mark-to-market accounting for certain commodityfutures contracts.
NOTE 12—COMPREHENSIVE EARNINGS (LOSS):
The following table sets forth information with respect to accumulated other comprehensiveearnings (loss):
Unrealized Gain (Loss) on Foreign Accumulated Currency Postretirement Other Translation and Comprehensive Adjustment Investments Derivatives Pension Benefits Earnings (Loss)
Balance at January 1, 2010 . . . . . . . . . $(13,227) $ (255) $ 2,314 $(1,228) $(12,396) Unrealized gains (losses) . . . . . . . . . 856 (1,179) 7,313 (3,135) 3,855 (Gains) losses reclassified to net earnings . . . . . . . . . . . . . . . . . — — (2,651) 128 (2,523) Tax effect . . . . . . . . . . . . . . . . . . . . . 135 435 (1,724) 1,005 (149)
Net of tax amount . . . . . . . . . . . . . . . 991 (744) 2,938 (2,002) 1,183
Balance at December 31, 2010 . . . . . (12,236) (999) 5,252 (3,230) (11,213) Unrealized gains (losses) . . . . . . . . . (2,496) 1,030 (397) (3,593) (5,456) (Gains) losses reclassified to net earnings . . . . . . . . . . . . . . . . . — — (7,531) 501 (7,030) Tax effect . . . . . . . . . . . . . . . . . . . . . 46 (382) 2,933 1,149 3,746
Net of tax amount . . . . . . . . . . . . . . . (2,450) 648 (4,995) (1,943) (8,740)
Balance at December 31, 2011 . . . . . (14,686) (351) 257 (5,173) (19,953) Unrealized gains (losses) . . . . . . . . . 1,303 1,980 (339) 1,066 4,010 (Gains) losses reclassified to net earnings . . . . . . . . . . . . . . . . . — — (243) 1,036 793 Tax effect . . . . . . . . . . . . . . . . . . . . . (23) (721) 214 (767) (1,297)
Net of tax amount . . . . . . . . . . . . . . . 1,280 1,259 (368) 1,335 3,506
Balance at December 31, 2012 . . . . . $(13,406) $ 908 $ (111) $(3,838) $(16,447)
NOTE 13—GOODWILL AND INTANGIBLE ASSETS:
All of the Company’s intangible indefinite-lived assets are trademarks.
The changes in the carrying amount of trademarks for 2012 and 2011 were as follows:
2012 2011
Original cost . . . . . . . . . . . . . . . . . . . . . . . . . . . . . . . . . . . . . . . . . . . . . . . . . . . . . $193,767 $193,767Accumulated impairment losses as of January 1 . . . . . . . . . . . . . . . . . . . . . . . . . (18,743) (18,743)
Balance at January 1 . . . . . . . . . . . . . . . . . . . . . . . . . . . . . . . . . . . . . . . . . . . . . . . $175,024 $175,024
Current year impairment losses . . . . . . . . . . . . . . . . . . . . . . . . . . . . . . . . . . . . . . . — —
Balance at December 31 . . . . . . . . . . . . . . . . . . . . . . . . . . . . . . . . . . . . . . . . . . . . $175,024 $175,024
Accumulated impairment losses as of December 31 . . . . . . . . . . . . . . . . . . . . . . $ (18,743) $ (18,743)
The fair value of indefinite-lived intangible assets was primarily assessed using the presentvalue of estimated future cash flows.
The Company has no accumulated impairment losses of goodwill.
25
Merrill Corp - Tootsie Roll 10-K 12-05-2012 ED [AUX] | 105123 | 28-Feb-13 03:25 | 12-28786-1.ea | Sequence: 8CHKSUM Content: 37368 Layout: 46520 Graphics: No Graphics CLEAN
JOB: 12-28786-1 CYCLE#;BL#: 6; 0 TRIM: 11" x 8.5" AS: CHI COMPOSITECOLORS: Black, ~note-color 2, ~note-color 3 GRAPHICS: none V1.5
26
To the Board of Directors and Shareholders of Tootsie Roll Industries, Inc.:
In our opinion, the accompanying consolidated statements of financial position and the related consolidated statements of earnings, comprehensive earnings and retainedearnings, and of cash flows present fairly, in all material respects, the financial position of Tootsie Roll Industries, Inc. and its subsidiaries at December 31, 2012 andDecember 31, 2011, and the results of their operations and their cash flows for each of the three years in the period ended December 31, 2012 in conformity with accountingprinciples generally accepted in the United States of America. Also in our opinion, the Company maintained, in all material respects, effective internal control over financialreporting as of December 31, 2012, based on criteria established in Internal Control—Integrated Framework issued by the Committee of Sponsoring Organizations of theTreadway Commission (COSO). The Company’s management is responsible for these financial statements, for maintaining effective internal control over financial reportingand for its assessment of the effectiveness of internal control over financial reporting, included in Management’s Report on Internal Control over Financial Reporting onpage 27 of the 2012 Annual Report to Shareholders. Our responsibility is to express opinions on these financial statements and on the Company’s internal control overfinancial reporting based on our integrated audits. We conducted our audits in accordance with the standards of the Public Company Accounting Oversight Board (UnitedStates). Those standards require that we plan and perform the audits to obtain reasonable assurance about whether the financial statements are free of material misstatementand whether effective internal control over financial reporting was maintained in all material respects. Our audits of the financial statements included examining, on a testbasis, evidence supporting the amounts and disclosures in the financial statements, assessing the accounting principles used and significant estimates made bymanagement, and evaluating the overall financial statement presentation. Our audit of internal control over financial reporting included obtaining an understanding ofinternal control over financial reporting, assessing the risk that a material weakness exists, and testing and evaluating the design and operating effectiveness of internalcontrol based on the assessed risk. Our audits also included performing such other procedures as we considered necessary in the circumstances. We believe that ouraudits provide a reasonable basis for our opinions.
A company’s internal control over financial reporting is a process designed to provide reasonable assurance regarding the reliability of financial reporting and the preparationof financial statements for external purposes in accordance with generally accepted accounting principles. A company’s internal control over financial reporting includesthose policies and procedures that (i) pertain to the maintenance of records that, in reasonable detail, accurately and fairly reflect the transactions and dispositions of theassets of the company; (ii) provide reasonable assurance that transactions are recorded as necessary to permit preparation of financial statements in accordance withgenerally accepted accounting principles, and that receipts and expenditures of the company are being made only in accordance with authorizations of management anddirectors of the company; and (iii) provide reasonable assurance regarding prevention or timely detection of unauthorized acquisition, use, or disposition of the company’sassets that could have a material effect on the financial statements.
Because of its inherent limitations, internal control over financial reporting may not prevent or detect misstatements. Also, projections of any evaluation of effectiveness tofuture periods are subject to the risk that controls may become inadequate because of changes in conditions, or that the degree of compliance with the policies orprocedures may deteriorate.
Chicago, ILMarch 1, 2013
Report of Independent Registered Public Accounting Firm
Merrill Corp - Tootsie Roll 10-K 12-05-2012 ED [AUX] | 105123 | 28-Feb-13 03:25 | 12-28786-1.fa | Sequence: 1CHKSUM Content: 28068 Layout: 18527 Graphics: 39708 CLEAN
JOB: 12-28786-1 CYCLE#;BL#: 6; 0 TRIM: 11" x 8.5" AS: CHI COMPOSITECOLORS: Black, ~note-color 2, ~note-color 3 GRAPHICS: price_water_k_sig.eps V1.5
27
The following performance graphcompares the cumulative totalshareholder return on theCompany’s Common Stock for afive-year period (December 31,2007 to December 31, 2012) withthe cumulative total return ofStandard & Poor’s 500 Stock Index(“S&P 500”) and the Dow JonesIndustry Food Index (“Peer Group,”which includes the Company),assuming (i) $100 invested onDecember 31 of the first year of thechart in each of the Company’sCommon Stock, S&P 500 and theDow Jones Industry Food Index and(ii) the reinvestment of dividends.
$140
$120
$100
$80
$60
$40
$20
TR
S&P
DJ
2007 2008 2009 2010 20122011$0
$100.00
$100.00
$100.00
$97.41
$74.98
$63.00
$108.80
$89.30
$79.67
$120.01
$99.64
$91.67
$102.24
$112.28
$93.61
$119.00
$126.61
$108.59
*$100 invested on 12/31/07 in stock or index, including reinvestment of dividends.Fiscal year ending December 31.
Copyright© 2013 S&P, a division of The McGraw-Hill Companies Inc. All rights reserved.Copyright© 2013 Dow Jones & Co. All rights reserved.
COMPARISON OF 5 YEAR CUMULATIVE TOTAL RETURN*Among Tootsie Roll Industries, the S&P 500 Index, and the Dow Jones US Food Producers Index
Management’s Report on Internal Control OverFinancial ReportingThe management of Tootsie Roll Industries, Inc. is responsible for establishing and maintaining adequate internal control over financial reporting, as suchterm is defined in the Securities Exchange Act of 1934 (SEC) Rule 13a-15(f). Our management conducted an evaluation of the effectiveness of theCompany’s internal control over financial reporting as of December 31, 2012 as required by SEC Rule 13a-15(c). In making this assessment, we used thecriteria established in Internal Control—Integrated Framework issued by the Committee of Sponsoring Organizations of the Treadway Commission (theCOSO criteria). Based on our evaluation under the COSO criteria, our management concluded that our internal control over financial reporting was effectiveas of December 31, 2012.The effectiveness of the Company’s internal control over financial reporting as of December 31, 2012 has been audited by PricewaterhouseCoopers LLP,an independent registered public accounting firm, as stated in their report which appears on page 26.Tootsie Roll Industries, Inc.Chicago, IllinoisMarch 1, 2013
Performance Graph
Merrill Corp - Tootsie Roll 10-K 12-05-2012 ED [AUX] | 105123 | 28-Feb-13 03:25 | 12-28786-1.fa | Sequence: 2CHKSUM Content: 30658 Layout: 4906 Graphics: 11049 CLEAN
JOB: 12-28786-1 CYCLE#;BL#: 6; 0 TRIM: 11" x 8.5" AS: CHI COMPOSITECOLORS: Black, ~note-color 2, ~note-color 3 GRAPHICS: 28786-1_comparison_k_line.eps V1.5
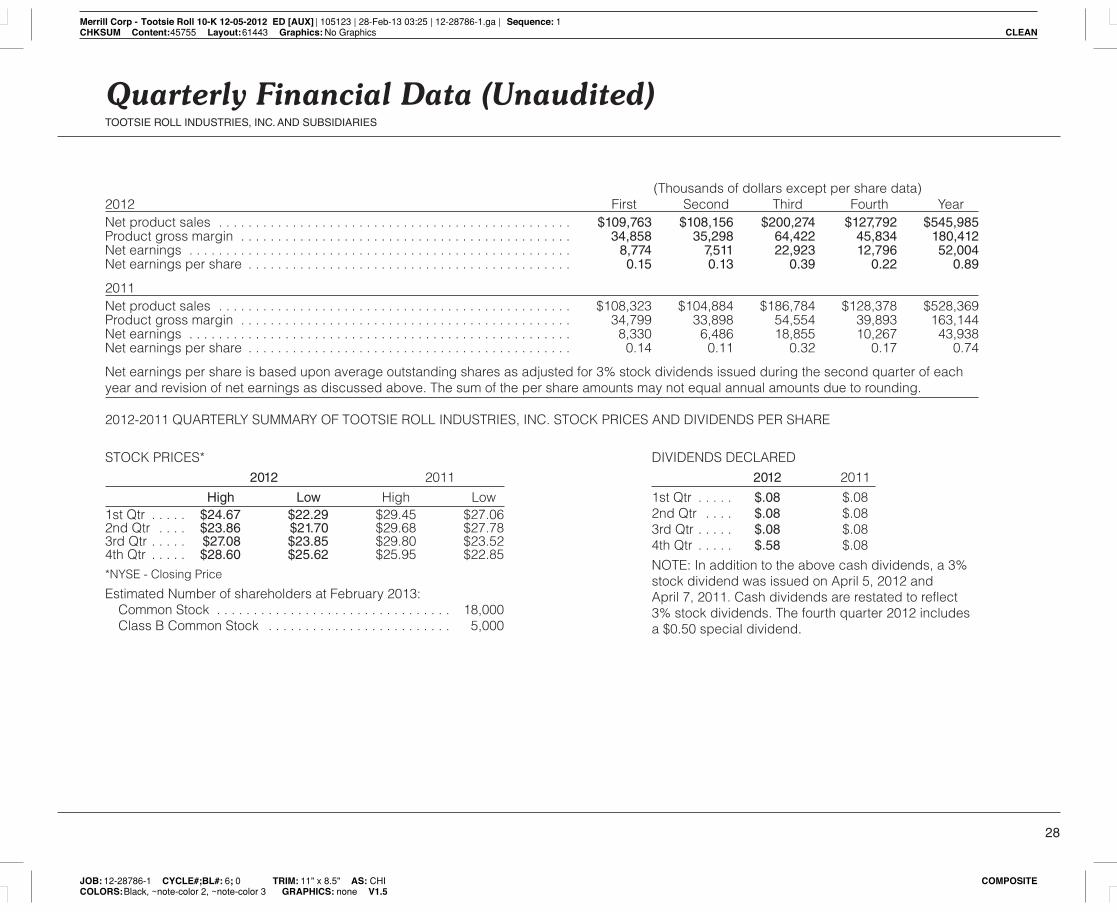
28
(Thousands of dollars except per share data)2012 First Second Third Fourth YearNet product sales . . . . . . . . . . . . . . . . . . . . . . . . . . . . . . . . . . . . . . . . . . . . . . . . $109,763 $108,156 $200,274 $127,792 $545,985Product gross margin . . . . . . . . . . . . . . . . . . . . . . . . . . . . . . . . . . . . . . . . . . . . . 34,858 35,298 64,422 45,834 180,412Net earnings . . . . . . . . . . . . . . . . . . . . . . . . . . . . . . . . . . . . . . . . . . . . . . . . . . . . 8,774 7,511 22,923 12,796 52,004Net earnings per share . . . . . . . . . . . . . . . . . . . . . . . . . . . . . . . . . . . . . . . . . . . . 0.15 0.13 0.39 0.22 0.89
2011Net product sales . . . . . . . . . . . . . . . . . . . . . . . . . . . . . . . . . . . . . . . . . . . . . . . . $108,323 $104,884 $186,784 $128,378 $528,369Product gross margin . . . . . . . . . . . . . . . . . . . . . . . . . . . . . . . . . . . . . . . . . . . . . 34,799 33,898 54,554 39,893 163,144Net earnings . . . . . . . . . . . . . . . . . . . . . . . . . . . . . . . . . . . . . . . . . . . . . . . . . . . . 8,330 6,486 18,855 10,267 43,938Net earnings per share . . . . . . . . . . . . . . . . . . . . . . . . . . . . . . . . . . . . . . . . . . . . 0.14 0.11 0.32 0.17 0.74
Net earnings per share is based upon average outstanding shares as adjusted for 3% stock dividends issued during the second quarter of eachyear and revision of net earnings as discussed above. The sum of the per share amounts may not equal annual amounts due to rounding.
2012-2011 QUARTERLY SUMMARY OF TOOTSIE ROLL INDUSTRIES, INC. STOCK PRICES AND DIVIDENDS PER SHARE
STOCK PRICES* 2012 2011 High Low High Low1st Qtr . . . . . $24.67 $22.29 $29.45 $27.062nd Qtr . . . . $23.86 $21.70 $29.68 $27.783rd Qtr . . . . . $27.08 $23.85 $29.80 $23.524th Qtr . . . . . $28.60 $25.62 $25.95 $22.85*NYSE - Closing Price
Estimated Number of shareholders at February 2013:Common Stock . . . . . . . . . . . . . . . . . . . . . . . . . . . . . . . . 18,000Class B Common Stock . . . . . . . . . . . . . . . . . . . . . . . . . 5,000
DIVIDENDS DECLARED 2012 20111st Qtr . . . . . $.08 $.082nd Qtr . . . . $.08 $.083rd Qtr . . . . . $.08 $.084th Qtr . . . . . $.58 $.08NOTE: In addition to the above cash dividends, a 3%stock dividend was issued on April 5, 2012 andApril 7, 2011. Cash dividends are restated to reflect3% stock dividends. The fourth quarter 2012 includesa $0.50 special dividend.
Quarterly Financial Data (Unaudited)TOOTSIE ROLL INDUSTRIES, INC. AND SUBSIDIARIES
Merrill Corp - Tootsie Roll 10-K 12-05-2012 ED [AUX] | 105123 | 28-Feb-13 03:25 | 12-28786-1.ga | Sequence: 1CHKSUM Content: 45755 Layout: 61443 Graphics: No Graphics CLEAN
JOB: 12-28786-1 CYCLE#;BL#: 6; 0 TRIM: 11" x 8.5" AS: CHI COMPOSITECOLORS: Black, ~note-color 2, ~note-color 3 GRAPHICS: none V1.5
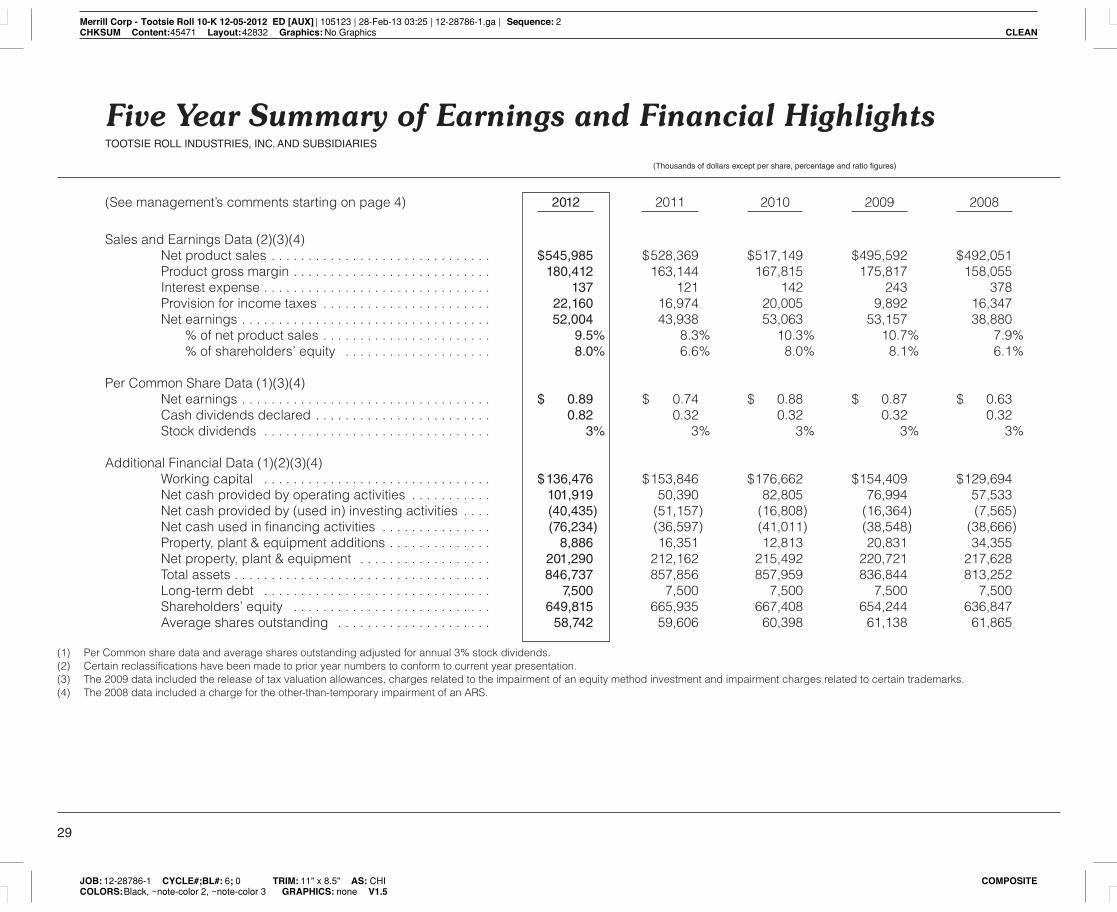
29
Five Year Summary of Earnings and Financial HighlightsTOOTSIE ROLL INDUSTRIES, INC. AND SUBSIDIARIES
(Thousands of dollars except per share, percentage and ratio figures)
(See management’s comments starting on page 4) 2012 2011 2010 2009 2008
Sales and Earnings Data (2)(3)(4)Net product sales . . . . . . . . . . . . . . . . . . . . . . . . . . . . . . $545,985 $528,369 $517,149 $495,592 $492,051Product gross margin . . . . . . . . . . . . . . . . . . . . . . . . . . . 180,412 163,144 167,815 175,817 158,055Interest expense . . . . . . . . . . . . . . . . . . . . . . . . . . . . . . . 137 121 142 243 378Provision for income taxes . . . . . . . . . . . . . . . . . . . . . . . 22,160 16,974 20,005 9,892 16,347Net earnings . . . . . . . . . . . . . . . . . . . . . . . . . . . . . . . . . . 52,004 43,938 53,063 53,157 38,880
% of net product sales . . . . . . . . . . . . . . . . . . . . . . . 9.5% 8.3% 10.3% 10.7% 7.9%% of shareholders’ equity . . . . . . . . . . . . . . . . . . . . 8.0% 6.6% 8.0% 8.1% 6.1%
Per Common Share Data (1)(3)(4)Net earnings . . . . . . . . . . . . . . . . . . . . . . . . . . . . . . . . . . $ 0.89 $ 0.74 $ 0.88 $ 0.87 $ 0.63Cash dividends declared . . . . . . . . . . . . . . . . . . . . . . . . 0.82 0.32 0.32 0.32 0.32Stock dividends . . . . . . . . . . . . . . . . . . . . . . . . . . . . . . . 3% 3% 3% 3% 3%
Additional Financial Data (1)(2)(3)(4)Working capital . . . . . . . . . . . . . . . . . . . . . . . . . . . . . . . $136,476 $153,846 $176,662 $154,409 $129,694Net cash provided by operating activities . . . . . . . . . . . 101,919 50,390 82,805 76,994 57,533Net cash provided by (used in) investing activities . . . . (40,435) (51,157) (16,808) (16,364) (7,565)Net cash used in financing activities . . . . . . . . . . . . . . . (76,234) (36,597) (41,011) (38,548) (38,666)Property, plant & equipment additions . . . . . . . . . . . . . . 8,886 16,351 12,813 20,831 34,355Net property, plant & equipment . . . . . . . . . . . . . . . . . . 201,290 212,162 215,492 220,721 217,628Total assets . . . . . . . . . . . . . . . . . . . . . . . . . . . . . . . . . . . 846,737 857,856 857,959 836,844 813,252Long-term debt . . . . . . . . . . . . . . . . . . . . . . . . . . . . . . . 7,500 7,500 7,500 7,500 7,500Shareholders’ equity . . . . . . . . . . . . . . . . . . . . . . . . . . . 649,815 665,935 667,408 654,244 636,847Average shares outstanding . . . . . . . . . . . . . . . . . . . . . 58,742 59,606 60,398 61,138 61,865
(1) Per Common share data and average shares outstanding adjusted for annual 3% stock dividends.(2) Certain reclassifications have been made to prior year numbers to conform to current year presentation.(3) The 2009 data included the release of tax valuation allowances, charges related to the impairment of an equity method investment and impairment charges related to certain trademarks.(4) The 2008 data included a charge for the other-than-temporary impairment of an ARS.
Merrill Corp - Tootsie Roll 10-K 12-05-2012 ED [AUX] | 105123 | 28-Feb-13 03:25 | 12-28786-1.ga | Sequence: 2CHKSUM Content: 45471 Layout: 42832 Graphics: No Graphics CLEAN
JOB: 12-28786-1 CYCLE#;BL#: 6; 0 TRIM: 11" x 8.5" AS: CHI COMPOSITECOLORS: Black, ~note-color 2, ~note-color 3 GRAPHICS: none V1.5

Corporate ProfileTootsie Roll Industries, Inc. has been engaged in the manufactureand sale of confectionery products for 116 years. Our products areprimarily sold under the familiar brand names: Tootsie Roll, TootsieRoll Pops, Caramel Apple Pops, Child’s Play, Charms, Blow Pop,Blue Razz, Cella’s chocolate covered cherries, Tootsie Dots, TootsieCrows, Junior Mints, Junior Caramels, Charleston Chew, SugarDaddy, Sugar Babies, Andes, Fluffy Stuff cotton candy, DubbleBubble, Razzles, Cry Baby, Nik-L-Nip and EI Bubble.
Board of Directors
(1)Executive Committee (2)Audit Committee (3)Compensation Committee
Officers
Offices, Plants
Other Information
Melvin J. Gordon(1) Chairman of the Board andChief Executive Officer
Ellen R. Gordon(1) President and Chief Operating Officer
Lana Jane Lewis-Brent(2)(3) President, Paul Brent Designer, Inc.,an art publishing, design and licensingcompany
Melvin J. Gordon Chairman of the Board andChief Executive Officer
Ellen R. Gordon President and Chief Operating Officer
G. Howard Ember, Jr. Vice President, Finance & ChiefFinancial Officer
John W. Newlin, Jr. Vice President, Manufacturing
Thomas E. Corr Vice President, Marketing & Sales
John P. Majors Vice President, Physical Distribution
Barry P. Bowen Treasurer & Assistant Secretary
Richard F. Berezewski Controller
Executive Offices 7401 S. Cicero Ave.Chicago, Illinois 60629www.tootsie.com
Plants/Warehouses IllinoisTennesseeMassachusettsPennsylvaniaWisconsinOntario, CanadaMexico City, Mexico
Foreign Sales Offices Mexico City, MexicoOntario, Canada
Stock Exchange New York Stock Exchange, Inc.(Since 1922)
Stock Identification Ticker Symbol: TRCUSIP No. 890516 10-7
Stock Transfer Agent andStock Registrar
American Stock Transferand Trust CompanyOperations Center6201 15th AvenueBrooklyn, NY 112191-800-710-0932www.amstock.com
Independent RegisteredPublic Accounting Firm
PricewaterhouseCoopers LLPOne North WackerChicago, IL 60606
General Counsel Becker Ross, LLP317 Madison AvenueNew York, NY 10017
Annual Meeting May 6, 2013Mutual Building, Room 1200909 East Main StreetRichmond, VA 23219
Barre A. Seibert(2)(3) Retired First Vice President,Washington Mutual Bank
Richard P. Bergeman(2)(3) Retired Senior Vice President, Bestfoods
Printed on recycled paper.30
Merrill Corp - Tootsie Roll 10-K 12-05-2012 ED [AUX] | 105123 | 28-Feb-13 03:25 | 12-28786-1.za | Sequence: 1CHKSUM Content: 39199 Layout: 30953 Graphics: 12681 CLEAN
JOB: 12-28786-1 CYCLE#;BL#: 6; 0 TRIM: 11" x 8.5" AS: CHI COMPOSITECOLORS: Black, ~note-color 2, ~note-color 3 GRAPHICS: recycled_logo.eps, tr_listed_nyse_k_logo.eps V1.5