
2 The Tonal Properties of Pitch-Class Sets: Tonal Implication, Tonal ...

Tonal mapping of Xi’an Mandarin and Standard Chinese
Min Liu,1,a) Yiya Chen,2,b) and Niels O. Schiller2,b)1College of Chinese Language and Culture, Jinan University, 510610, Guangzhou, China2Leiden University Centre for Linguistics, Leiden University, Postbus 9515, 2300 RA, Leiden, The Netherlands
ABSTRACT:One long-neglected fact in linguistic research on Standard Chinese (SC) is that most speakers of SC also speak a
local dialect, which may share phonological features with SC. Tonal information can be a determinant of the
phonological similarities or differences between some Chinese dialects and SC, yet relatively little empirical
research has been conducted on the tonal system of other language varieties in Chinese aside from SC. Among these
dialects, Xi’an Mandarin (XM) is particularly interesting for the seemingly simple, yet intricate mapping between its
lexical tones with those in SC. In this study, the tonal systems of XM and SC were compared empirically. Tones
with similar contours from XM and SC were paired, and both tone production and perception experiments were car-
ried out on bidialectal speakers of XM and SC. The two experiments together showed that there is indeed systematic
mapping of tones between XM and SC. The degree of similarity of the mapped tone pair in tone perception was
largely dependent on the acoustic phonetic similarity between the tones in tone production, with a phonological rule
playing a role in the tone pair of low contour.VC 2020 Acoustical Society of America.https://doi.org/10.1121/10.0000993
(Received 2 May 2019; revised 24 September 2019; accepted 16 October 2019; published online 30 April 2020)
[Editor: Richard A. Wright] Pages: 2803–2816
I. INTRODUCTION
Chinese is a tonal language in which tones are used to
distinguish lexical meanings. However, the term “Chinese”
refers to a large number of Sinitic language varieties. While
numerous studies have been conducted on Standard Chinese
(SC; the official language of China), relatively little attention
has been paid to other dialects or language varieties of
Chinese. Some of the dialects differ from SC in both segmen-
tal and tonal information, whereas others, such as dialects
within the Mandarin family, overlap largely in segmental
information with SC. In these latter dialects, tonal information
can be important as it determines the phonological similarities
or differences between the dialect and SC.
In China, most speakers of SC speak a local dialect (Li
and Lee, 2004; Wiener and Ito, 2015). It is therefore of both
practical and theoretical interest to systematically investi-
gate the tonal similarities or differences between different
dialects and SC. Such investigations can be the prerequisite
to developing dialect-oriented speech synthesis and speech
recognition technology (Czap and Zhao, 2017), guiding lan-
guage pedagogy in teaching SC to dialectal speakers (Lam,
2005; Wong and Xiao, 2010), and addressing issues, such as
whether the phonological information of one’s two or more
dialects are stored separately or integrally (Wu, 2015), or
how cross-dialect phonological similarity/difference affects
lexical access in the minds of bidialectal tonal language
speakers.
Currently, relatively little empirical research has been
conducted on the tonal system of other language varieties
except for SC; even less research has compared the tonal
system of other language varieties with that of SC. As lan-
guage varieties within the Mandarin family rely largely on
tonal information to make distinctions from SC (Li, 2017),
the present study aimed to empirically compare the tonal
systems of two closely related dialects in the Mandarin
family, SC and Xi’an Mandarin (XM).
According to Chappell (2001), there are ten major
dialect groups in Chinese (but see Yuan, 1989; Li and
Thompson, 1981, which argue for seven major dialect
groups). The Mandarin family is the largest Chinese dialect
group. It contains a group of Chinese varieties, which are
typically spoken in northern and southwestern China. The
most influential language within the Mandarin family is SC.
The other dialects within the Mandarin family share a com-
mon logographic writing system with SC and bear high
resemblance with SC as to lexical items and syntactic forms
(Cheng, 1991). Some dialects, such as XM, also exhibit a
large overlap of segmental features with SC. More interest-
ingly, the tones of XM seem to have a one-to-one correspon-
dence with those of SC (Li, 2001; Zhang, 2009). This overall
correspondence between the two tonal systems is quite
unique and makes XM a very compelling case to study.
XM is a Mandarin dialect typically spoken in the urban
areas of Xi’an, the capital of Shaanxi Province. It is the
representative dialect of the Guanzhong dialect spoken in
the Guanzhong area (Li and Stephen, 1987). XM directly
a)Also at: Institute of Applied Linguistics, Jinan University, 510610,
Guangzhou, China. Electronic mail: [email protected])Also at: Leiden Institute for Brain and Cognition, Leiden University,
Postbus 9515, 2300 RA, Leiden, The Netherlands.
J. Acoust. Soc. Am. 147 (4), April 2020 VC 2020 Acoustical Society of America 28030001-4966/2020/147(4)/2803/14/$30.00
ARTICLE.....................................

originated from the official language in ancient China and
has important historical value. As in SC, there are four tonal
categories in XM, and they are referred to as T1, T2, T3,
and T4.1 Here, the terms T1–T4 are adopted to suggest that
words which share the same tonal categories across the two
dialects are etymologically related translation equivalents in
most cases. Across XM and SC, different tones distinguish
lexical meanings for syllables with the same segment. For
example, the segment ma means mother, hemp, horse, andto scold, respectively, when it is combined with the four
lexical tones (tonal category: T1, T2, T3, and T4). On the
5-point scale notation system (Chao, 1930, 1968), the pitch
value of the SC tones has been established as 55 (T1), 35
(T2), 214 (T3), and 51 (T4). However, there have been
discrepancies among researchers regarding the specific pitch
value of each XM tone (see Table I for a summary of the
representative transcriptions of XM tones).
The majority of the existing studies on XM tones,
including the first six studies listed in Table I, have been
based on impressionistic observation. Pitch values of XM
tones in these studies could be susceptible to the subjective
pitch sensitivity of the researchers. It is therefore not sur-
prising that these studies vary in pitch value for each tonal
category. The remaining studies, such as the last three in
Table I, have attempted to study the pitch value of XM tones
with more objective acoustic methods. However, these stud-
ies either sampled from a very limited number of speakers
(e.g., two in Ma, 2005; one in Ren, 2012) or lacked control
of lexical properties of the stimuli used (e.g., Zhang and Shi,
2009). It is not known to what degree these results can rep-
resent the typical tonal patterns of XM. The present study
thus decided to empirically examine the acoustic properties
of XM tones with a larger sample of speakers and stimuli
and better control of lexical properties of the stimuli.
Although the specific pitch value of each tonal category
in XM varies among previous studies, the basic tonal con-
tour shape tends to be largely consistent across studies.
Generally, the four tonal categories of XM possess the tonal
contours of low-falling (T1), mid-rising (T2), high-falling
(T3), and high-level (T4). Interestingly, XM tones display
almost the same tonal contours as SC tones. In SC, tonal
contours of the four tonal categories are described as
high-level (T1, 55), mid-rising (T2, 35), low-falling-rising
(T3, 214), and high-falling (T4, 51). As one can see, both
tonal systems of SC and XM contain tones of high-level,
mid-rising, and high-falling tonal contours, and each of
these tone pairs of similar contours share similar pitch val-
ues across the two tonal systems, although the similar con-
tours do not necessarily represent the same tonal category in
the two tonal systems (see Table II for details). Moreover,
SC has a tone of low-falling-rising tonal contour, whereas
XM has a tone of low-falling tonal contour without the
rising tail. The former, however, would lose its rising tail
when placed before other tones in SC (i.e., {T3[214] + T1/
T2/T4[55/35/51]} ! {T3[21] + T1/T2/T4 [55/35/51]}; see
Dow, 1972; Duanmu, 2007) and become similar to the lat-
ter. Overall, each XM tone seems to have a corresponding
tone in SC with which it shares similar tonal contour and
pitch value, resulting in a very interesting systematic map-
ping pattern between the tonal systems of XM and SC.
In fact, the mapping of tonal contours between the tonal
systems of XM and SC has been proposed in previous stud-
ies. Li (2001) introduced the mapping pattern of XM tones
and SC tones (similar as in Table II) and suggested that XM
learners of SC utilize their knowledge of XM tones to pro-
duce SC tones. Zhang (2009) also claimed the presence of a
comparable tonal contour for each XM tone in SC. She
further statistically compared the F0 contour of each XM
tone with its SC counterpart of a similar tonal contour. The
results showed that although the paired tones were similar in
tonal contour, there were detailed acoustic differences.
Specifically, the XM low-falling tone was different from the
citation form SC low-falling-rising tone in contour shape;
the XM rising tone was significantly lower than the SC ris-
ing tone in F0 height except in the early-middle part; the
XM falling tone had a similar initial F0 height with but
higher final F0 height than the SC falling tone, and the XM
level tone had an overall lower F0 height than the SC level
tone. Zhang (2009) has made an attempt to reveal the acous-
tic similarities and differences between the two tonal sys-
tems empirically. However, it did not include details on the
design of the production experiment; therefore it is not clear
how the tonal patterns were obtained, and the comparison
did not seem to be made on comparable datasets. The pre-
sent study thus decided to compare the F0 acoustic proper-
ties of XM tones and SC tones in a pairwise fashion with a
more balanced and comparable design. Since there have
also been studies which declared that the duration of XM
tones is overall shorter than that of SC tones (Guo et al.,2011), we compared both the F0 and duration for each pair
of tones between SC and XM.
In addition to establishing the acoustic similarities or
differences between the paired tones of XM and SC in pro-
duction, we were also interested to know whether each tone
pair of similar contours from XM and SC is perceived to be
similar or different in tone perception by bidialectal speak-
ers of XM and SC. The tone production and perception
experiments together were expected to confirm the mapping
pattern of the two tonal systems. So far, there have not been
any perception studies comparing XM tones and SC tones.
Conventionally, tone discrimination relies on several
TABLE I. Representative transcription of XM tones in previous studies.
Reference T1 T2 T3 T4
Bai (1954) 21 24 453 45
Luo and Wang (1981) 31 24 42 55
Yuan (1989) 21 24 53 45
Wang (1996) 21 24 53 44
Peking University (1989) 21 24 53 55
Sun (2007) 31 24 53 55
Ma (2005) 21 24 53 44
Zhang and Shi (2009) 31 24 52 55
Ren (2012) 31 24 52 55
2804 J. Acoust. Soc. Am. 147 (4), April 2020 Liu et al.
https://doi.org/10.1121/10.0000993
perceptual cues, among which the most widely adopted and
important perceptual cues have proved to be F0 height and
F0 contour, according to previous cross-language studies
(Gandour, 1983, 1984; Gandour and Harshman, 1978;
Francis et al., 2008). The relative importance of these two
cues, however, varies among listeners of different language
backgrounds. SC listeners tended to attach more importance
to F0 contour than F0 height, whereas Cantonese and
English listeners gave more weight to F0 height than F0
contour (Gandour, 1983, 1984). Apart from the F0-related
features, other acoustic properties, such as duration, ampli-
tude contour, and voice quality, have also been shown to
serve as secondary cues for tone discrimination, especially
when the primary F0 information was not available (Liu and
Samuel, 2004; Whalen and Xu, 1992; Yang, 2015).
Furthermore, phonological rules might play a role in tone
discrimination. For example, SC native listeners found it
more difficult to discriminate between the rising tone and
the low-falling-rising tone than other tone pairs in SC
(Huang, 2012), which was partly attributed to the tone san-
dhi rule that makes the two tones conditioned allophonic
tonal variants. Specifically, the low-falling-rising tone
would be realized as a rising tone when it precedes another
low-falling-rising tone (Duanmu, 2007). The native phono-
logical rule can sometimes even affect tone discrimination
in a non-native language. For example, Cantonese listeners
with or without SC experience had difficulty distinguishing
between the SC high-level tone (55) and high-falling tone
(51; Hao, 2012; So and Best, 2010). This is because in
Cantonese the high-level tone (55) has a free allophonic
tonal variant, high-falling tone (53; Bauer and Benedict,
1997; Hashimoto, 1972; Yip, 2002; Yu, 2007), which shows
phonetic similarity to the SC high-falling tone. In this study,
based on the acoustic results in the tone production experi-
ment, we ran a tone perception experiment to see whether
each tone pair would be perceived as similar or different by
the bidialectal speakers and how the acoustic differences in
each tone pair affect tone perception.
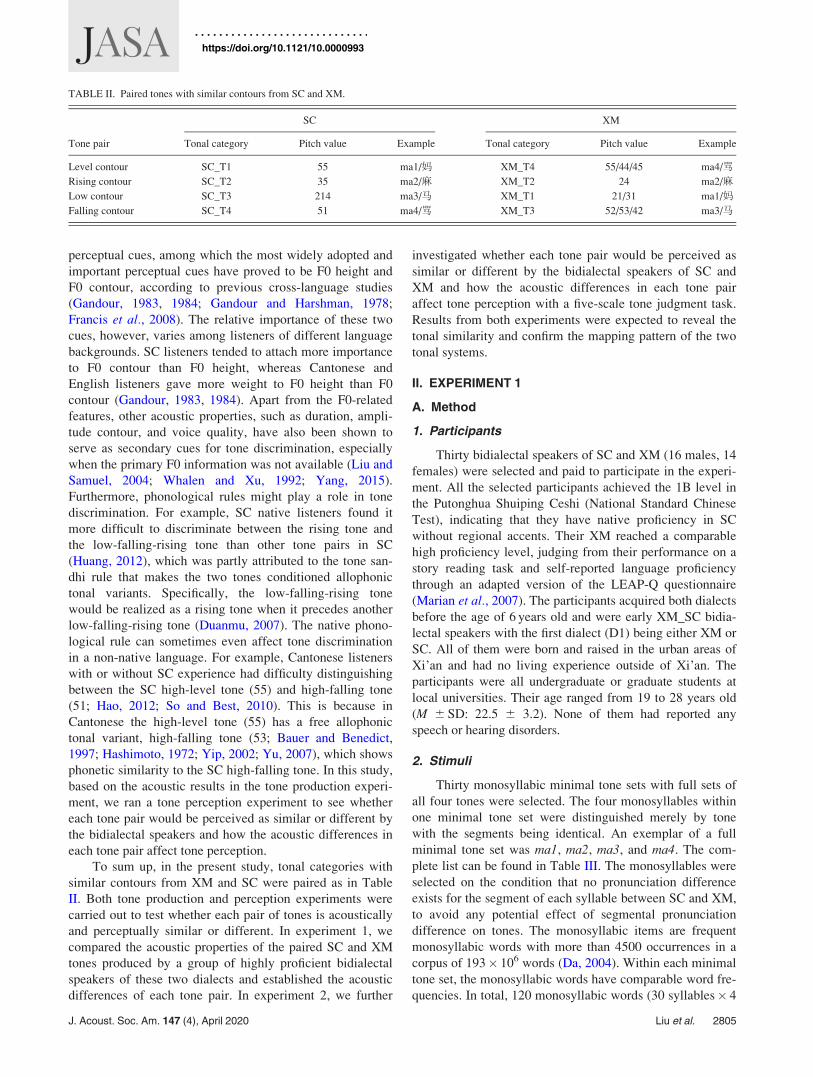
To sum up, in the present study, tonal categories with
similar contours from XM and SC were paired as in Table
II. Both tone production and perception experiments were
carried out to test whether each pair of tones is acoustically
and perceptually similar or different. In experiment 1, we
compared the acoustic properties of the paired SC and XM
tones produced by a group of highly proficient bidialectal
speakers of these two dialects and established the acoustic
differences of each tone pair. In experiment 2, we further
investigated whether each tone pair would be perceived as
similar or different by the bidialectal speakers of SC and
XM and how the acoustic differences in each tone pair
affect tone perception with a five-scale tone judgment task.
Results from both experiments were expected to reveal the
tonal similarity and confirm the mapping pattern of the two
tonal systems.
II. EXPERIMENT 1
A. Method
1. Participants
Thirty bidialectal speakers of SC and XM (16 males, 14
females) were selected and paid to participate in the experi-
ment. All the selected participants achieved the 1B level in
the Putonghua Shuiping Ceshi (National Standard Chinese
Test), indicating that they have native proficiency in SC
without regional accents. Their XM reached a comparable
high proficiency level, judging from their performance on a
story reading task and self-reported language proficiency
through an adapted version of the LEAP-Q questionnaire
(Marian et al., 2007). The participants acquired both dialects
before the age of 6 years old and were early XM_SC bidia-
lectal speakers with the first dialect (D1) being either XM or
SC. All of them were born and raised in the urban areas of
Xi’an and had no living experience outside of Xi’an. The
participants were all undergraduate or graduate students at
local universities. Their age ranged from 19 to 28 years old
(M 6 SD: 22.5 6 3.2). None of them had reported any
speech or hearing disorders.
2. Stimuli
Thirty monosyllabic minimal tone sets with full sets of
all four tones were selected. The four monosyllables within
one minimal tone set were distinguished merely by tone
with the segments being identical. An exemplar of a full
minimal tone set was ma1, ma2, ma3, and ma4. The com-
plete list can be found in Table III. The monosyllables were
selected on the condition that no pronunciation difference
exists for the segment of each syllable between SC and XM,
to avoid any potential effect of segmental pronunciation
difference on tones. The monosyllabic items are frequent
monosyllabic words with more than 4500 occurrences in a
corpus of 193� 106 words (Da, 2004). Within each minimal
tone set, the monosyllabic words have comparable word fre-
quencies. In total, 120 monosyllabic words (30 syllables� 4
TABLE II. Paired tones with similar contours from SC and XM.
Tone pair
SC XM
Tonal category Pitch value Example Tonal category Pitch value Example
Level contour SC_T1 55 ma1/妈 XM_T4 55/44/45 ma4/骂
Rising contour SC_T2 35 ma2/麻 XM_T2 24 ma2/麻
Low contour SC_T3 214 ma3/马 XM_T1 21/31 ma1/妈
Falling contour SC_T4 51 ma4/骂 XM_T3 52/53/42 ma3/马
J. Acoust. Soc. Am. 147 (4), April 2020 Liu et al. 2805
https://doi.org/10.1121/10.0000993

tones) were selected. Some disyllabic words were added as
fillers.
3. Recording
The recordings took place in a soundproof booth of the
behavioral laboratory at Shaanxi Normal University in Xi’an.
Stimuli were randomly presented to the speakers with E-
prime 2.0 (Psychology Software Tools, Sharpsburg, PA).
Each speaker produced all the items in both SC and XM with
no repetition in two separate sessions. The order of the ses-
sions was counterbalanced. Half of the speakers did the SC
session first and then the XM session, and the other half
started with the XM session. Each session included one prac-
tice block and three experimental blocks. Between each block,
there was a 3-min break. The practice block contained eight
trials, which were not used in the experimental blocks, to
familiarize the participants with the specific language mode.
An experimental trial started with a 300ms fixation cross, fol-
lowed by a 200ms pause. After that, a stimulus in the form of
simplified Chinese character was presented on the screen.
Speakers were requested to produce the stimulus in that partic-
ular language of the session in a self-paced fashion. They
pressed a button to proceed to the next stimulus when finished
producing the current stimulus. The interstimulus interval was
500ms. Instructions were given to the speakers visually on the
screen in simplified Chinese characters and orally by the
experimenter in that particular language before each session.
All the stimuli were recorded at 16-bit resolution with a sam-
pling rate of 44.1 kHz on a laptop via an external digitizer
(UA-1G, Cakewalk, Boston, MA). Altogether, 240 monosyl-
labic items (30 syllables� 4 tones� 2 languages) were eli-
cited from each of the 30 speakers.
4. Data analysis
The F0 and duration of the speech items were analyzed.
All the stimuli were manually annotated in Praat (Boersma
and Weenink, 2015). A custom-made script was then used
to extract ten equally distanced F0 values from the rhyme
part of each time-normalized syllable. Gross errors in F0
extractions were manually corrected afterward. To eliminate
between-speaker acoustic differences, the raw F0 values
were transformed to Z-score2 for each speaker (Rose, 1987),
pooling the SC and XM productions.
Statistical analyses of F0 were carried out using the
growth curve analysis (Mirman, 2014) with the package
lmerTest (Kuznetsova et al., 2017) in R version 3.1.2
TABLE III. The full monosyllabic words used in the two experiments.
Syllable
number
Tone
T1 T2 T3 T4
1 逼 (bi1, to force) 鼻 (bi2, nose) 比 (bi3, to compare) 闭 (bi4, to close)
2 搭 (da1, to travel by) 达 (da2, to reach) 打 (da3, to hit) 大 (da4, big)
3 低 (di1, low) 敌 (di2, enemy) 底 (di3, bottom) 弟 (di4, younger brother)
4 督 (du1, to supervise) 毒 (du2, poison) 赌 (du3, to gamble) 度 (du4, degree)
5 涛 (tao1, great waves) 桃 (tao2, peach) 讨 (tao3, to ask for) 套 (tao4, case)
6 梯 (ti1, ladder) 题 (ti2, question) 体 (ti3, body) 替 (ti4, to substitute for)
7 通 (tong1, to go through) 铜 (tong2, copper) 桶 (tong3, bucket) 痛 (tong4, pain)
8 方 (fang1, square) 房 (fang2, house) 访 (fang3, to visit) 放 (fang4, to put)
9 风 (feng1, wind) 冯 (feng2, a surname) 讽 (feng3, irony) 凤 (feng4, phoenix)
10 呼 (hu1, to call) 湖 (hu2, lake) 虎 (hu3, tiger) 户 (hu4, household)
11 灰 (hui1, grey) 回 (hui2, to go back) 毁 (hui3, to destroy) 会 (hui4, be able to)
12 吸 (xi1, to absorb) 席 (xi2, mat) 洗 (xi3, to wash) 戏 (xi4, drama)
13 歇 (xie1, to rest) 邪 (xie2, evil) 写 (xie3, to write) 谢 (xie4, to thank)
14 星 (xing1, star) 形 (xing2, shape) 醒 (xing3, to wake up) 姓 (xing4, surname)
15 虚 (xu1, virtual) 徐 (xu2, slowly) 许 (xu3, a surname) 续 (xu4, to continue)
16 抽 (chou1, to pump) 仇 (chou2, hatred) 丑 (chou3, ugly) 臭 (chou4, smelly)
17 鸡 (ji1, chicken) 急 (ji2, urgent) 挤 (ji3, crowded) 记 (ji4, to remember)
18 街 (jie1, street) 杰 (jie2, hero) 姐 (jie3, elder sister) 戒 (jie4, to quit)
19 居 (ju1, to reside) 局 (ju2, bureau) 举 (ju3, to lift) 句 (ju4, sentence)
20 期 (qi1, period) 旗 (qi2, flag) 起 (qi3, to rise) 气 (qi4, gas)
21 轻 (qing1, light) 晴 (qing2, sunny) 请 (qing3, to invite) 庆 (qing4, to celebrate)
22 妈 (ma1, mom) 麻 (ma2, hemp) 马 (ma3, horse) 骂 (ma4, to scold)
23 汪 (wang1, a surname) 王 (wang2, king) 网 (wang3, network) 旺 (wang4, prosperous)
24 屋 (wu1, house) 吴 (wu2, a surname) 五 (wu3, five) 误 (wu4, mistake)
25 优 (you1, excellent) 油 (you2, oil) 有 (you3, to have) 右 (you4, right)
26 威 (wei1, prestige) 围 (wei2, to surround) 伟 (wei3, great) 胃 (wei4, stomach)
27 敲 (qiao1, to knock) 桥 (qiao2, bridge) 巧 (qiao3, skillful) 俏 (qiao4, pretty)
28 荒 (huang1, uncultivated) 黄 (huang2, yellow) 谎 (huang3, lies) 晃 (huang4, to sway)
29 秃 (tu1, bald) 图 (tu2, picture) 土 (tu3, dust) 兔 (tu4, rabbit)
30 汤 (tang1, soup) 唐 (tang2, Tang dynasty) 躺 (tang3, to recline) 烫 (tang4, scalding)
2806 J. Acoust. Soc. Am. 147 (4), April 2020 Liu et al.
https://doi.org/10.1121/10.0000993
(R Core Team, 2015). The overall F0 curves were modeled
with up to second-order orthogonal polynomials, given that
the most complex F0 contour in this study has a U-shaped
curve. Three time terms of the models would be of interest:
the intercept, the linear slope, and the steepness of the
quadratic curvature, which indicate the overall F0 mean,
the direction of F0 change such as rising or falling, and the
steepness of F0 rising or falling, respectively. If tonal con-
tours under investigation are different, we expect statistical
difference in at least one of the three time terms. As we are
interested in whether each pair of tones listed in Table II is
acoustically similar or different, we built separate models
for the F0 of each pair of tones. All the models included the
random intercept of subjects on all time terms. The fixed
effects of language (XM, SC) on all time terms, as well as
the random intercept of items, and the random slope of
subjects-by-language and items-by-language on all time
terms were added in a stepwise fashion, and their effects on
model fits were evaluated via model comparisons based on
log-likelihood ratios.
Statistical analyses of duration were performed using
linear mixed-effects regression models with the package
lmerTest (Kuznetsova et al., 2017) in R version 3.1.2 (R
Core Team, 2015). As for F0, we built separate models for
the duration of each pair of tones. All the models first
included random intercepts of subjects and items. The fixed
effect of language and random slopes of subjects-by-
language and items-by-language were added in a stepwise
fashion, and their effects on model fits were evaluated via
model comparisons based on log-likelihood ratios.
B. Results
1. F0
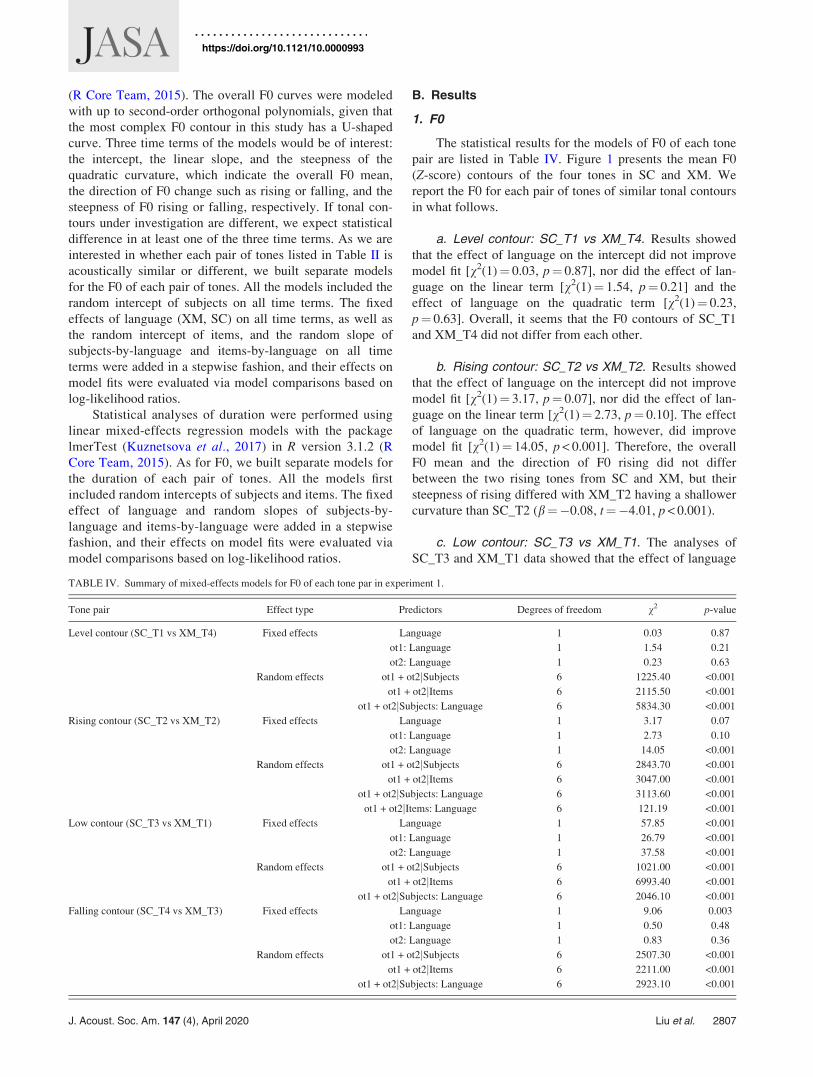
The statistical results for the models of F0 of each tone
pair are listed in Table IV. Figure 1 presents the mean F0
(Z-score) contours of the four tones in SC and XM. We
report the F0 for each pair of tones of similar tonal contours
in what follows.
a. Level contour: SC_T1 vs XM_T4. Results showed
that the effect of language on the intercept did not improve
model fit [v2(1)¼ 0.03, p¼ 0.87], nor did the effect of lan-
guage on the linear term [v2(1)¼ 1.54, p¼ 0.21] and the
effect of language on the quadratic term [v2(1)¼ 0.23,
p¼ 0.63]. Overall, it seems that the F0 contours of SC_T1
and XM_T4 did not differ from each other.
b. Rising contour: SC_T2 vs XM_T2. Results showed
that the effect of language on the intercept did not improve
model fit [v2(1)¼ 3.17, p¼ 0.07], nor did the effect of lan-
guage on the linear term [v2(1)¼ 2.73, p¼ 0.10]. The effect
of language on the quadratic term, however, did improve
model fit [v2(1)¼ 14.05, p < 0.001]. Therefore, the overall
F0 mean and the direction of F0 rising did not differ
between the two rising tones from SC and XM, but their
steepness of rising differed with XM_T2 having a shallower
curvature than SC_T2 (b¼�0.08, t¼�4.01, p < 0.001).
c. Low contour: SC_T3 vs XM_T1. The analyses of
SC_T3 and XM_T1 data showed that the effect of language
TABLE IV. Summary of mixed-effects models for F0 of each tone par in experiment 1.
Tone pair Effect type Predictors Degrees of freedom v2 p-value
Level contour (SC_T1 vs XM_T4) Fixed effects Language 1 0.03 0.87
ot1: Language 1 1.54 0.21
ot2: Language 1 0.23 0.63
Random effects ot1 + ot2jSubjects 6 1225.40 <0.001
ot1 + ot2jItems 6 2115.50 <0.001
ot1 + ot2jSubjects: Language 6 5834.30 <0.001
Rising contour (SC_T2 vs XM_T2) Fixed effects Language 1 3.17 0.07
ot1: Language 1 2.73 0.10
ot2: Language 1 14.05 <0.001
Random effects ot1 + ot2jSubjects 6 2843.70 <0.001
ot1 + ot2jItems 6 3047.00 <0.001
ot1 + ot2jSubjects: Language 6 3113.60 <0.001
ot1 + ot2jItems: Language 6 121.19 <0.001
Low contour (SC_T3 vs XM_T1) Fixed effects Language 1 57.85 <0.001
ot1: Language 1 26.79 <0.001
ot2: Language 1 37.58 <0.001
Random effects ot1 + ot2jSubjects 6 1021.00 <0.001
ot1 + ot2jItems 6 6993.40 <0.001
ot1 + ot2jSubjects: Language 6 2046.10 <0.001
Falling contour (SC_T4 vs XM_T3) Fixed effects Language 1 9.06 0.003
ot1: Language 1 0.50 0.48
ot2: Language 1 0.83 0.36
Random effects ot1 + ot2jSubjects 6 2507.30 <0.001
ot1 + ot2jItems 6 2211.00 <0.001
ot1 + ot2jSubjects: Language 6 2923.10 <0.001
J. Acoust. Soc. Am. 147 (4), April 2020 Liu et al. 2807
https://doi.org/10.1121/10.0000993

on the intercept significantly improved model fit [v2(1)¼ 57.85, p< 0.001], as well as the effect of language on the
linear term [v2(1)¼ 26.79, p < 0.001] and the effect of lan-
guage on the quadratic term [v2(1)¼ 37.58, p < 0.001].Apparently, SC_T3 was different from XM_T1 in all three
time terms. The overall F0 mean of XM_T1 was signifi-
cantly higher than SC_T3 (b¼ 0.46, t¼ 9.13, p < 0.001).The direction of the F0 change was also different between
the two tones (b¼�0.96, t¼�14.06, p < 0.001), with
SC_T3 having a falling-rising contour and XA_T1 having a
low-falling contour without the rising tail. Moreover, the F0
curvature of XA_T1 was shallower than that of SC_T3
(b¼�1.08, t¼�14.23, p < 0.001).
d. Falling contour: SC_T4 vs XM_T3. The analyses of
SC_T4 and XM_T3 showed that there was a significant effect
of language on the intercept [v2(1)¼ 9.06, p¼ 0.003].
However, no language effect on the linear term [v2(1)¼ 0.50,
p¼ 0.48] or the quadratic term [v2(1)¼ 0.83, p¼ 0.36] was
found. Evidently, the overall F0 mean of XM_T3 was lower
than that of SC_T4 (b¼�0.19, t¼�3.08, p¼ 0.002). The
direction of F0 falling and the steepness of F0 falling were not
significantly different between the two falling tones.
2. Duration
The statistical results for the models of duration of each
tone pair are listed in Table V. Figure 2 presents the mean
durations of the four tones in SC and XM. The following
reports the duration results for each pair of tones of similar
tonal contours.
a. Level contour: SC_T1 vs XM_T4. There was a sig-
nificant main effect of language [v2(1)¼ 10.91, p < 0.001].SC_T1 was significantly longer (45.09ms) than XM_T4.
b. Rising contour: SC_T2 vs XM_T2. The effect of
language significantly improved model fit [v2(1)¼ 425.36,
p < 0.001]. SC_T2 was 47.60ms longer than XM_T2.
c. Low contour: SC_T3 vs XM_T1. Not surprisingly, a
significant main effect of language was also found for the
durations of this tone pair [v2(1)¼ 71.33, p < 0.001]. SC_T3was considerably longer than XM_T1 with the duration dif-
ference reaching up to 166.29ms.
d. Falling contour: SC_T4 vs XM_T3. An investiga-
tion of the durations of the tone pair of the falling contour
revealed no effect of language [v2(1)¼ 0.64, p¼ 0.42], indi-
cating that there was no duration difference between SC_T4
and XM_T3.
From the above comparisons of F0 and duration for
each pair of tones of similar tonal contours, the acoustic pat-
terns of each tone pair can be summarized as follows (see
also Table VI). First, the tone pair of level contour did not
show any difference in F0. However, the duration of the
tone of level contour in SC was significantly longer than
that of its counterpart in XM. Second, the overall F0 mean
and the direction of F0 change did not differ between the
two tones of rising contour in SC and XM, despite a shallow
curvature of the rising F0 contour in XM_T2 relative to
SC_T2. In addition, the duration of XM_T2 was consider-
ably shorter than that of SC_T2. Third, the two tones of low
contour in SC and XM were significantly different from each
other regarding the overall F0 mean, the direction of F0
change, and the steepness of F0 change. In fact, their contour
FIG. 1. Mean F0 (Z-score) contours of the four tones in SC and XM. The
F0 values of each tone were averaged over 30 speakers and 30 monosyllabic
items with the tone of each item represented by 10 equally distanced F0 val-
ues taken from the rhyme part of the time-normalized item. The grey areas
indicate the 95% confidence interval of the corresponding mean.
TABLE V. Summary of mixed-effects models for the duration of each tone pair in experiment 1.
Tone pair Effect type Predictors Degrees of freedom v2 p-value
Level contour (SC_T1 vs XM_T4) Fixed effects Language 1 10.91 <0.001
Random effects 1jItems 1 1332.20 <0.001
1 + LanguagejSubjects 2 155.75 <0.001
Rising contour (SC_T2 vs XM_T2) Fixed effects Language 1 425.36 <0.001
Random effects 1 + LanguagejSubjects 2 182.79 <0.001
1 + LanguagejItems 2 14.69 <0.001
Low contour (SC_T3 vs XM_T1) Fixed effects Language 1 71.33 <0.001
Random effects 1jItems 1 2173.60 <0.001
1 + LanguagejSubjects 2 308.28 <0.001
Falling contour (SC_T4 vs XM_T3) Fixed effects Language 1 0.64 0.42
Random effects 1jItems 1 1318.50 <0.001
1 + LanguagejSubjects 2 165.27 <0.001
2808 J. Acoust. Soc. Am. 147 (4), April 2020 Liu et al.
https://doi.org/10.1121/10.0000993

shape differed with the SC tone having a low-falling-rising
contour and the XM tone having a low-falling contour with-
out the rising tail. The former also tended to be remarkably
longer than the latter. Fourth, having almost parallel F0
contours, the two tones of high-falling contour in SC and
XM revealed differences in the overall F0 mean with an
overall higher F0 contour of SC_T4 compared to XM_T3.
Nevertheless, their durations did not differ.
III. EXPERIMENT 2
Having established the acoustic differences of each tone
pair, the question arises as to whether the acoustic differences
in each tone pair can be perceived. In fact, the two tonal sys-
tems provide an interesting test case for us to look into the
relationship of the production and perception of tones by the
bidialectal tonal language speakers. As shown in experiment 1,
the F0 difference of each tone pair ranged from no F0 differ-
ence (level tone pair) through F0 curvature difference (rising
tone pair) to F0 height difference (falling tone pair) and F0
contour difference (low tone pair). With this setup of the two
tonal systems, we could investigate how different F0 dimen-
sions affect tone perception of the bidialectal tone language
speakers. In this session, a five-scale tone judgment task was
adopted to examine whether the acoustic differences in each
tone pair can be perceived. We then compared the tone percep-
tion results of different tone pairs to reveal how different F0
dimensions affect tone perception.
A. Method
1. Participants
Another set of 30 XM_SC bidialectal speakers (11
males, 19 females) with high proficiency in both dialects
were selected and paid to participate in the experiment.
They all achieved the 1B level in the Putonghua Shuiping
Ceshi (National Standard Chinese Test). All the selected
participants acquired both dialects before the age of 6 years
old and were early XM_SC bidialectal speakers with a D1
of either XM or SC. They were born and raised in the urban
areas of Xi’an and had no living experience outside of
Xi’an. All were undergraduate or graduate students at local
universities between 18 and 29 years old (M 6 SD: 21.2
6 2.6). None of them had reported any speech or hearing
disorders. Informed consent was obtained from all the par-
ticipants before the experiment.
2. Stimuli
The four pairs of tones in experiment 1 were used for
tone judgment. Since the two tones in each tone pair were
similar in tonal contour overall, two pairs of tones of distinct
tonal contours were added as fillers to avoid potential
response strategies. Each tone pair was tested with all 30
root monosyllables in experiment 1, resulting in 30 trials.
The two speech items in a trial always share the same seg-
ment so that participants could focus on the tone judgment.
For example, a SC_T1 monosyllable (“妈”, ma1, mother)
was paired with its corresponding XM_T4 monosyllable
(“骂”, ma4, to scold).
Four speakers were recruited to record the stimuli for
the perception experiment. They were all university students
aged 20–28. Two native speakers (one male, one female) of
SC, who were born and raised in Beijing and had no knowl-
edge of any other dialects, recorded the SC monosyllabic
sounds. Likewise, two native speakers (one male, one
female) of XM, who were born and raised in the urban area
of Xi’an and had no living experience outside of Xi’an,
recorded the XM monosyllabic sounds. Note that as it is
impossible to find monolingual XM speakers nowadays, the
two native speakers of XM also speak SC fluently. The
recordings took place in Beijing for the Beijing speakers
and in Xi’an for the Xi’an speakers. All of the speech items
were recorded at 16-bit resolution with a sampling rate of
44.1 KHz.
To ensure that the two XM speakers’ tone patterns were
representative enough of XM, we compared the acoustic
properties of their tone patterns with those of the XM tone
patterns in experiment 1 (see Figs. 3 and 4). Statistical anal-
yses of F0 were carried out using the growth curve analysis.
And statistical analyses of duration were performed using
linear mixed-effects regression models. We found no statis-
tical differences in F0 and duration. It was therefore con-
firmed that the two XM speakers’ production of XM tone
patterns were representative patterns of XM and suitable for
the perception study. We also compared the acoustic
FIG. 2. Mean durations with the 95% confidence interval of the four tones
in SC and XM.
TABLE VI. Summary of the acoustic differences for each tone pair of SC
and XM.a
Tone pair
F0Duration
Intercept Slope Quadratic estimate
Level (SC_T1 vs XM_T4) n.s. n.s. n.s. ***
Rising (SC_T2 vs XM_T2) n.s. n.s. *** ***
Low (SC_T3 vs XM_T1) *** *** *** ***
Falling (SC_T4 vs XM_T3) ** n.s. n.s. n.s.
aNote: **p< 0.01; ***p< 0.001; n.s.: not significant.
J. Acoust. Soc. Am. 147 (4), April 2020 Liu et al. 2809
https://doi.org/10.1121/10.0000993

properties of the two SC speakers’ tone patterns with those
of the SC tone patterns in experiment 1 (see Figs. 5 and 6)
and did not find statistical differences in F0 and duration
either.
After normalizing the amplitude of all the speech items
in Praat (Boersma and Weenink, 2015), we paired the
Beijing female speaker’s speech items with the Xi’an female
speaker’s corresponding speech items according to tone
pairs. The same was done for the two male speakers’ speech
items. Instead of recording all the speech items by a
XM_SC bidialectal speaker, we recorded the SC speech
items by native speakers of SC and the XM speech items by
native speakers of XM. This ensured more typical realiza-
tions of SC and XM tones. The inclusion of two groups of
speakers could avoid potential speaker bias.
3. Procedure
Participants were tested individually in a soundproof
booth of the behavioral laboratory at Shaanxi Normal
University in Xi’an. All the trials (30 syllables� 6 tone
pairs� 2 speaker groups) were randomly presented to the
participants using the E-Prime 2.0 software (Psychology
Software Tools, Sharpsburg, PA) through headphones at a
comfortable listening level.
The experiment included a practice block and four
experimental blocks. The practice block contained six trials,
which were not used in the experimental blocks. Each exper-
imental block contained 90 trials. Between every second
block, there was a 3-min break. An experimental trial started
with a 100ms warning beep, followed by a 300ms pause.
The first speech item was then presented. After a 600ms
pause, the second speech item was presented. The language
order of the two speech items in a trial was counterbalanced
for each speaker group of the trials. Half of the trials pre-
sented the SC item before its corresponding XM item, while
the other half presented the SC item after its corresponding
XM item. Participants were requested to judge the similarity
of the two tones of the two speech items in a trial on a five-
point scale, with “1” indicating “completely different” and
“5” indicating “completely the same.” Response accuracy
rather than speed was stressed. However, if participants did
not make any response from the onset of the second stimulus
to 2.5 s after the offset of the second stimulus, the program
moved on to the next trial automatically with an intertrial inter-
val of 500ms. Instructions were given both visually on the
screen and orally by the experimenter in SC before the experi-
ment. To eliminate any influence of top-down knowledge on
tone judgment, we did not mention the source languages of the
auditory stimuli to the participants in the instructions.
4. Data analysis
To decide whether each pair of tones was perceived as
similar or different, we analyzed the frequency distribution
of the responses with the chi-square goodness-of-fit test.
The observed frequency distribution of the responses was
first compared with the expected frequency distribution
(null hypothesis: equal proportions) for each tone pair. If
the null hypothesis of equal proportions was rejected, the
individual response category’s contribution to the overall
chi-square statistic was determined by calculating the square
of the difference between the observed and expected frequen-
cies for a category, divided by the expected frequency for that
category. Generally speaking, categories with a larger differ-
ence between the observed and expected frequencies make a
FIG. 3. Mean F0 (Z-score) contours of the four tones in XM by the 30 SC and XM bidialectal speakers in experiment 1 (left), the male Xi’an speaker (mid-
dle), and the female Xi’an speaker (right) in experiment 2. The grey areas indicate the 95% confidence interval of the corresponding mean.
FIG. 4. Mean durations with the 95% confidence interval of the four tones
in XM by the 30 SC and XM bidialectal speakers in experiment 1 (black
boxes), the male Xi’an speaker (light grey boxes), and the female Xi’an
speaker (dark grey boxes) in experiment 2.
2810 J. Acoust. Soc. Am. 147 (4), April 2020 Liu et al.
https://doi.org/10.1121/10.0000993

larger contribution to the overall chi-square statistic. After rec-
ognizing the response category that contributed the most to
the overall chi-square statistic, we further conducted several
pair-wise goodness-of-fit tests to compare this category’s fre-
quency with that of the other categories. If all the comparisons
are statistically significant (p-value adjusted), the category
would be considered as the best indicator of the similarity/dif-
ference between the two tones under investigation.
The second analysis concerned how the varying acous-
tic differences of different tone pairs affect tone perception
of XM_SC bidialectal speakers. All of the four pairs of
tones were merged into one dataset, and the tone perception
results of different tone pairs were compared. Statistical
analyses were carried out with the package ordinal
(Christensen, 2015) in R version 3.1.2 (R Core Team, 2015).
Cumulative link mixed models (CLMMs) were constructed
for the dependent variable response (1, 2, 3, 4, 5) with tone
pair (level, rising, low, falling), language order (XM before
SC; SC before XM), speaker group (female, male), listener
gender (female, male) and their interactions as fixed factors,
and subjects and items as random factors. The fixed factors
were added in a stepwise fashion, and their effects on model
fits were evaluated via model comparisons based on log-
likelihood ratios. Post hoc pairwise comparisons between
different tone pairs were conducted using the lsmeans pack-
age (Lenth, 2016) with single-step p-value adjustment.
B. Results
1. Level contour: SC_T1 vs XM_T4
The chi-square goodness-of-fit test showed that the
responses were clearly not equally distributed [v2(4)¼ 5634.42, p< 0.001]. As can be seen from Table VII, the
response category 5 contributed the most to the overall chi-
square statistic. Pairwise comparisons showed that the fre-
quency of the response category 5 was significantly higher
than that of the other categories (all p’s < 0.001), indicatingthat SC_T1 and XM_T4 were mostly judged as 5, i.e.,
completely the same.
2. Rising contour: SC_T2 vs XM_T2
The chi-square goodness-of-fit test showed that the
responses were clearly not equally distributed [v2(4)¼ 5677.38, p < 0.001]. Again, the response category 5 con-
tributed the most to the overall chi-square statistic (see
Table VII). Further pairwise comparisons showed that the
frequency of the response category 5 was significantly
higher than that of the other categories (all p’s < 0.001), indi-cating that SC_T2 and XM_T2 were mostly judged as 5, i.
e., completely the same.
3. Low contour: SC_T3 vs XM_T1
The chi-square goodness-of-fit test showed that the
responses were not equally distributed [v2(4)¼ 1043.36,
p < 0.001]. As shown in Table VII, the response category 5
contributed the most to the overall chi-square statistic.
However, the response category 1 also made a relatively
large contribution to the overall chi-square statistic.
Pairwise comparisons showed that the frequencies of the
response categories 1 and 5 were significantly higher than
those of the rest categories (all p’s < 0.001). Moreover, the
frequency of the response category 5 was higher than that of
the response category 1 [v2(1)¼ 12.07, p¼ 0.0005].
FIG. 5. Mean F0 (Z-score) contours of the four tones in SC by the 30 SC and XM bidialectal speakers in experiment 1 (left), the male Beijing speaker (mid-
dle), and the female Beijing speaker (right) in experiment 2. The grey areas indicate the 95% confidence interval of the corresponding mean.
FIG. 6. Mean durations with the 95% confidence interval of the four tones
in SC by the 30 SC and XM bidialectal speakers in experiment 1 (black
boxes), the male Beijing speaker (light grey boxes), and the female Beijing
speaker (dark grey boxes) in experiment 2.
J. Acoust. Soc. Am. 147 (4), April 2020 Liu et al. 2811
https://doi.org/10.1121/10.0000993
Overall, participants were more likely to perceive SC_T3
and XM_T1 as the same tone, although they also gave
slightly fewer but a comparable number of “different”
responses.
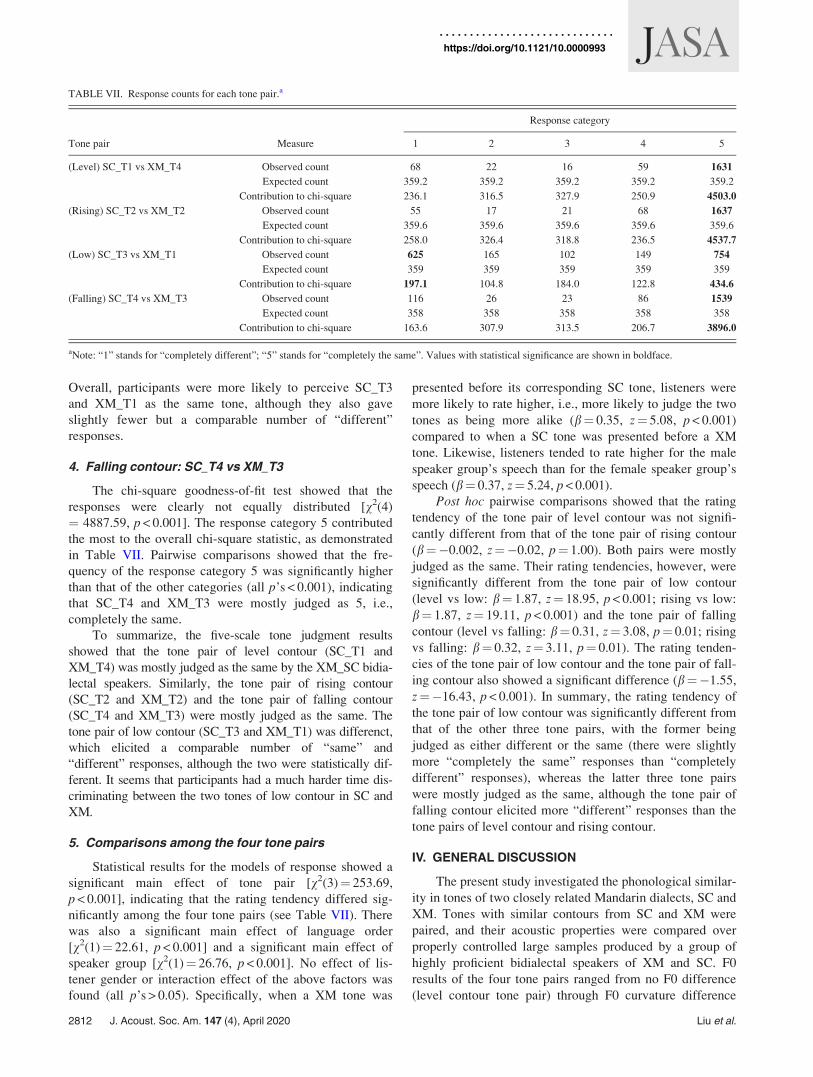
4. Falling contour: SC_T4 vs XM_T3
The chi-square goodness-of-fit test showed that the
responses were clearly not equally distributed [v2(4)¼ 4887.59, p < 0.001]. The response category 5 contributed
the most to the overall chi-square statistic, as demonstrated
in Table VII. Pairwise comparisons showed that the fre-
quency of the response category 5 was significantly higher
than that of the other categories (all p’s < 0.001), indicatingthat SC_T4 and XM_T3 were mostly judged as 5, i.e.,
completely the same.
To summarize, the five-scale tone judgment results
showed that the tone pair of level contour (SC_T1 and
XM_T4) was mostly judged as the same by the XM_SC bidia-
lectal speakers. Similarly, the tone pair of rising contour
(SC_T2 and XM_T2) and the tone pair of falling contour
(SC_T4 and XM_T3) were mostly judged as the same. The
tone pair of low contour (SC_T3 and XM_T1) was differenct,
which elicited a comparable number of “same” and
“different” responses, although the two were statistically dif-
ferent. It seems that participants had a much harder time dis-
criminating between the two tones of low contour in SC and
XM.
5. Comparisons among the four tone pairs
Statistical results for the models of response showed a
significant main effect of tone pair [v2(3)¼ 253.69,
p < 0.001], indicating that the rating tendency differed sig-
nificantly among the four tone pairs (see Table VII). There
was also a significant main effect of language order
[v2(1)¼ 22.61, p < 0.001] and a significant main effect of
speaker group [v2(1)¼ 26.76, p < 0.001]. No effect of lis-
tener gender or interaction effect of the above factors was
found (all p’s > 0.05). Specifically, when a XM tone was
presented before its corresponding SC tone, listeners were
more likely to rate higher, i.e., more likely to judge the two
tones as being more alike (b¼ 0.35, z¼ 5.08, p< 0.001)compared to when a SC tone was presented before a XM
tone. Likewise, listeners tended to rate higher for the male
speaker group’s speech than for the female speaker group’s
speech (b¼ 0.37, z¼ 5.24, p< 0.001).Post hoc pairwise comparisons showed that the rating
tendency of the tone pair of level contour was not signifi-
cantly different from that of the tone pair of rising contour
(b¼�0.002, z¼�0.02, p¼ 1.00). Both pairs were mostly
judged as the same. Their rating tendencies, however, were
significantly different from the tone pair of low contour
(level vs low: b¼ 1.87, z¼ 18.95, p< 0.001; rising vs low:
b¼ 1.87, z¼ 19.11, p < 0.001) and the tone pair of falling
contour (level vs falling: b¼ 0.31, z¼ 3.08, p¼ 0.01; rising
vs falling: b¼ 0.32, z¼ 3.11, p¼ 0.01). The rating tenden-
cies of the tone pair of low contour and the tone pair of fall-
ing contour also showed a significant difference (b¼�1.55,
z¼�16.43, p < 0.001). In summary, the rating tendency of
the tone pair of low contour was significantly different from
that of the other three tone pairs, with the former being
judged as either different or the same (there were slightly
more “completely the same” responses than “completely
different” responses), whereas the latter three tone pairs
were mostly judged as the same, although the tone pair of
falling contour elicited more “different” responses than the
tone pairs of level contour and rising contour.
IV. GENERAL DISCUSSION
The present study investigated the phonological similar-
ity in tones of two closely related Mandarin dialects, SC and
XM. Tones with similar contours from SC and XM were
paired, and their acoustic properties were compared over
properly controlled large samples produced by a group of
highly proficient bidialectal speakers of XM and SC. F0
results of the four tone pairs ranged from no F0 difference
(level contour tone pair) through F0 curvature difference
TABLE VII. Response counts for each tone pair.a
Tone pair Measure
Response category
1 2 3 4 5
(Level) SC_T1 vs XM_T4 Observed count 68 22 16 59 1631
Expected count 359.2 359.2 359.2 359.2 359.2
Contribution to chi-square 236.1 316.5 327.9 250.9 4503.0
(Rising) SC_T2 vs XM_T2 Observed count 55 17 21 68 1637
Expected count 359.6 359.6 359.6 359.6 359.6
Contribution to chi-square 258.0 326.4 318.8 236.5 4537.7
(Low) SC_T3 vs XM_T1 Observed count 625 165 102 149 754
Expected count 359 359 359 359 359
Contribution to chi-square 197.1 104.8 184.0 122.8 434.6
(Falling) SC_T4 vs XM_T3 Observed count 116 26 23 86 1539
Expected count 358 358 358 358 358
Contribution to chi-square 163.6 307.9 313.5 206.7 3896.0
aNote: “1” stands for “completely different”; “5” stands for “completely the same”. Values with statistical significance are shown in boldface.
2812 J. Acoust. Soc. Am. 147 (4), April 2020 Liu et al.
https://doi.org/10.1121/10.0000993

(rising contour tone pair) to F0 height difference (falling
contour tone pair) and F0 contour difference (low contour
tone pair). Except for the falling contour tone pair, all the
other tone pairs exhibited a difference in tone duration, and
the largest duration difference was found in the low contour
tone pair. These tone pairs of varying acoustic differences were
then presented to the bidialectal speakers of XM and SC for
tone perception with a five-scale tone judgment task. Results
showed that the rating tendency of the tone pair of low contour
was significantly different from that of the other three tone
pairs, with the former being judged as either different or the
same (there were slightly more “completely the same”
responses than “completely different” responses), whereas the
latter three tone pairs were mostly judged as the same, although
the tone pair of falling contour elicited more “different”
responses than the tone pairs of level contour and rising
contour.
With a balanced comparable design, the present produc-
tion and perception experiments empirically confirmed the
systematic tonal mapping pattern between XM and SC pro-
posed in Li (2001) and Zhang (2009). While there were
detailed acoustic differences in tone production, tones with
similar contours between the two dialects were basically
perceived to be the same, resulting in mapped tone pairs of
level contour (SC_T1 vs XM_T4), rising contour (SC_T2 vs
XM_T2), and falling contour (SC_T4 vs XM_T3). Despite
having distinct surface tonal contours, the tone pair of low
contour (SC_T3 vs XM_T1) also showed mapping, although
to a lesser degree compared to the other three tone pairs.
The mapping patterns of XM tones and SC tones were
initially put forward based on the similarity of the tonal con-
tour and pitch value of XM tones and SC tones represented
on the five-point scale notation system (Chao, 1930, 1968).
Different from the established pitch value of SC tones, there
have been variances as to the specific pitch value of XM
tones in previous studies (e.g., Bai, 1954; Luo and Wang,
1981; Ma, 2005; Peking University, 1989; Ren, 2012; Sun,
2007; Wang, 1996; Yuan, 1989; Zhang and Shi, 2009).
However, the basic tonal contour shape of each tone was
largely consistent across studies, and it has been noted that
each XM tone has a mapped tone in SC with which it shares
similar tonal contour and pitch value (Li, 2001; Zhang,
2009). Zhang (2009) tested the mapping pattern of the two
tonal systems in tone production, but the tonal comparisons
were not made on comparable datasets. The present study
thus made more of an effort to empirically test the mapping
pattern of the two tonal systems in tone production with a
more balanced comparable design. Tonal comparisons were
made on paired tones of similar tonal contours from the two
dialects produced by highly proficient bidialectal speakers
of SC and XM. Our acoustic results showed that except for
the tone pair of level contour, all the other tone pairs showed
difference in F0. Specifically, the XM rising tone had a shal-
lower rising F0 curvature than the SC rising tone, with an
overall comparable F0 mean. The XM falling tone had an
overall lower F0 height than the SC falling tone. The XM
low tone, not surprisingly, had a different F0 contour from
the SC low-falling-rising tone. Our results of the specific F0
difference for each tone pair, except for the tone pair of low
contour, was different from that found in Zhang (2009),
showing that the manipulation of a comparable design in
this study actually resulted in different tonal realizations. It
is therefore important to test on comparable datasets in such
cross-dialect investigations. Nevertheless, both studies
showed an overall compact tonal space of XM tones than
SC tones. Apart from the F0 difference, we also found a
duration difference for each tone pair except for the tone
pair of falling contour. All XM tones, other than the falling
tone, tended to be shorter than their respective SC counter-
parts. On the whole, there were acoustic differences for each
pair of tones with similar contours from SC and XM.
The acoustically different tone pairs, however, were
mostly perceived to be the same or, at least, very similar by
the bidialectal speakers of SC and XM. In a five-scale tone
judgment task, the tone pairs of level contour, rising con-
tour, and falling contour were mostly perceived to be
completely the same, and the tone pair of low contour was
also slightly more likely to be perceived as the same rather
than different. Overall, these tone pairs of similar tonal con-
tours from the two dialects were basically treated as the
same during tone perception, despite the presence of acous-
tic differences. The results of our tone perception experi-
ment confirmed the mapping pattern of XM tones and SC
tones proposed in Li (2001) and Zhang (2009), providing
new empirical evidence for the mapping of the two tonal
systems from a perceptual point of view. Moreover, the
mapping pattern seems to be more pronounced in tone per-
ception than in tone production, given that each mapped
tone pair was almost perceptually indistinguishable while
having acoustically detectable differences.
The fact that the tone pairs of similar tonal contours
from XM and SC were basically perceived to be the same
by the bidialectal speakers does not mean that the partici-
pants did not pick up the acoustic differences at all. The
mapped tone pairs did vary in the degree to which they were
perceived as the same tones. The tone pairs of level contour
and rising contour were mostly judged as the same by the
bidialectal speakers of XM and SC, followed by the tone
pair of falling contour. The tone pair of low contour elicited
more “different” responses relative to the other three tone
pairs. As only acoustic information was available to the par-
ticipants during tone judgment, it is reasonable to assume
that the different perceptual results for all the tone pairs
resulted from their acoustic differences in some way. Our
acoustic analyses demonstrated that the four tone pairs
showed variance in different F0 dimensions, ranging from
no F0 difference (level contour tone pair) through F0 curva-
ture difference (rising contour tone pair) to F0 height differ-
ence (falling contour tone pair) and F0 contour difference
(low contour tone pair). This varying acoustic difference in
different F0 dimensions seems to have affected the tone per-
ception results of each tone pair to varying degrees.
Compared to the level contour tone pair with no F0 differ-
ence, the rising contour tone pair with F0 curvature
J. Acoust. Soc. Am. 147 (4), April 2020 Liu et al. 2813
https://doi.org/10.1121/10.0000993

difference was not perceived as any different, seemingly
indicating that the bidialectal speakers of SC and XM were
not sensitive to the F0 curvature difference between the two
rising tones. This is not surprising, as F0 curvature has not
been identified as a strong perceptual cue for tone discrimi-
nation. In contrast, the tone pair of falling contour with F0
height difference was perceived to be less similar than the
tone pair of level contour with no F0 difference, suggesting
that F0 height difference contributed to the discrimination
of the two falling tones. This is consistent with the previous
cross-language finding that F0 height is an important per-
ceptual cue for tone discrimination (Gandour, 1983, 1984;
Gandour and Harshman, 1978; Francis et al., 2008). Finally,the tone pair of low contour with F0 contour difference was
perceived to be much more different than the tone pair of
level contour with no F0 difference, as well as than the tone
pair of falling contour with F0 height difference. Obviously,
F0 contour difference significantly affected the discrimina-
tion between the two low tones. Also, the bidialectal speak-
ers tended to be more sensitive to the dimension of F0
contour than F0 height in tone discrimination, as has been
found by Gandour (1983, 1984) for SC speakers.
Note that although the duration property of each tone
pair was maintained in the speech stimuli, participants did
not seem to make full use of it in tone perception, if they
used it at all. A duration difference was found in all the tone
pairs except the falling tone pair. If the participants did use
the duration cue for tone perception, with a duration differ-
ence of nearly 50ms, the tone pair of level contour, as well
as the tone pair of rising contour, should have been judged
as different tones rather than similar tones. If this is not con-
vincing, a duration difference of about 166ms in the tone
pair of low contour should be certainly salient enough to
rule out the possibility that the two tones were judged as
similar. However, the pair of low contour tones ended up
eliciting even slightly more “same” responses than
“different” responses. Clearly, duration was not adopted as a
valid perceptual cue for tone discrimination by the bidialec-
tal speakers of SC and XM. They relied primarily on F0
information to make tone judgments.
Acoustic information, especially F0 information, is not
the only perceptual cue that listeners employ during tone dis-
crimination. Phonological rules can sometimes play a role in
the process, too (Hao, 2012; Huang, 2012; So and Best, 2010).
In this study, the tone pair of low contour (SC_T3 vs XM_T1)
had distinct F0 contours. SC_T3 has a low-falling-rising con-
tour and XM_T1 has a low-falling contour. If participants
made tone perceptions purely based on acoustic information,
the two low tones would have been judged as different.
Instead, the two tones were perceived as either different or
similar with even slightly more “same” responses than
“different” responses. This could presumably be attributed to
a phonological rule of SC_T3. SC_T3 has a low-falling-rising
contour when it is in citation form or at the final position of an
utterance. When placed before other tones or in a context,
SC_T3 loses its rising tail and becomes a low-falling contour
(Dow, 1972; Duanmu, 2007), which shows phonetic similarity
to the XM low-falling tone. Participants seem to have applied
this phonological rule of SC_T3 and used the context form
SC_T3 to mediate between the citation form SC_T3 and
XM_T1, and therefore perceived the citation form SC_T3 and
XM_T1 as similar tones. Recall that we did not mention the
source languages of the speech stimuli to the participants. It is
therefore not clear where and how the context form SC_T3
came into play. There might be two scenarios. One is that
XM_T1 here were considered as a representation of the con-
text form SC_T3. Participants then made a comparison
between the citation form SC_T3 with the context form
SC_T3, which were judged as similar (citation form SC_T3
vs [XM_T1 ! context form SC_T3]). The other scenario is
that when presented with the citation form SC_T3 and
XM_T1, participants activated the corresponding context
form SC_T3, and they compared the context form SC_T3
with XM_T1, the latter being considered either as a represen-
tation of XM_T1 or context form SC_T3, resulting in a similar
response ([citation form SC_T3 ! context form SC_T3] vs
XM_T1). In either scenario, the tone pairs of low contour
should be judged as similar tones as a result of the phonologi-
cal rule. In our result, the two low tones from SC and XM eli-
cited a comparable number of “same” and “different”
responses, suggesting that both the acoustic information and
the phonological rule played roles in the tone discrimination
process, and the two effects seem to counterbalance each
other.
One might wonder whether the comparable number of
“same” and “different” responses for the tone pair of low con-
tour could be attributed to extreme individual variances, i.e., if
some participants gave overwhelmingly more “different”
responses than “same” responses or vice versa and shifted the
overall perceptual pattern. In our data, almost all the partici-
pants gave both the “same” and “different” responses, indicat-
ing that they indeed used both acoustic cues and the
phonological rule to make tone discrimination. There is no
denying that the response distribution exhibited some differ-
ences among the participants. Some participants gave rela-
tively more “different” responses than “same” responses,
whereas others gave relatively more “same” responses than
“different” responses. However, neither one was dominant.
With the sample size like the one in this study, we believe that
the individual differences were cancelled out, and our results
reflected the interaction of the phonetic information and pho-
nological knowledge during the tone discrimination process.
V. CONCLUSION
To conclude, the present study investigated the phono-
logical similarity in tones of two closely related Mandarin
dialects, SC and XM. Through production and perception
experiments, it was established that there is systematic map-
ping of tones between XM and SC. The degree of similarity
of the mapped tone pair in tone perception was largely
dependent on the acoustic phonetic similarity between the
tones in tone production, with a phonological rule playing a
role in certain circumstance.
2814 J. Acoust. Soc. Am. 147 (4), April 2020 Liu et al.
https://doi.org/10.1121/10.0000993

ACKNOWLEDGMENTS
This research was supported by the Guangdong
Planning Office of Philosophy and Social Science under
Grant No. GD19YYY06 to M.L. and by the European
Research Council (ERC) under the ERC Starting Grant
(Grant No. 206198) to Y.C. We thank Dr. Xuhai Chen for
providing access to the laboratory.
1Tones in modern Chinese were developed from those in Middle Chinese.
There are four tonal categories in Middle Chinese, referred to as Ping,Shang, Qu, Ru in Chinese terms. Evidence suggests that three of the
Middle Chinese tones, i.e., the Ping (level), Shang (rising), and Qu(departing) tones have developed into the four modern tonal categories
(Yinping, Yangping, Shangsheng, Qusheng) in a rather uniform way
across dialects in the Mandarin family (Yuan, 1989). The Ru (entering)
tone, characterized by syllables ending in stops, disappeared in most mod-
ern Mandarin dialects. These syllables with an entering tone have been
distributed into the four modern Chinese tonal categories in different
ways in different dialects. The four modern Chinese tonal categories
Yinping, Yangping, Shangsheng, Qusheng are often labeled as T1, T2, T3,
T4 nowadays. Note that a modern tonal category (e.g., T1) can have dif-
ferent tonal contours and pitch values in different Mandarin dialects.2We used Z-scores instead of T-values to normalize tone values because T-values can be easily distorted by extreme values like the maximum F0 or
the minimum F0.
Bai, D. (1954). A Report on Guanzhong Dialect (Chinese Academy of
Sciences Press, Beijing), Chap. 5, pp. 227–230 (in Chinese).
Bauer, R. S., and Benedict, P. K. (1997). Modern Cantonese Phonology(Mouton De Gruyter, Berlin), Chap. 2, pp. 162–164.
Boersma, P., and Weenink, D. (2015). “Praat: Doing phonetics by computer
(version 5.4.21) [computer program],” http://www.praat.org (Last viewed
March 15, 2020).
Chao, Y. R. (1930). “A system of tone letters,” LeMaıtre Phonetique 45, 24–27.Chao, Y. R. (1968). A Grammar of Spoken Chinese (University of
California Press, Berkeley), Chap. 1, pp. 25–30.
Chappell, H. (2001). Sinitic Grammar: Synchronic and DiachronicPerspectives (Oxford University Press, Oxford, UK), Chap. 1, pp. 3–28.
Cheng, C.-C. (1991). “Quantifying affinity among Chinese dialects,”
J. Chin. Linguist. 3, 76–110, available at http://www.jstor.org/stable/
23827036.
Christensen, R. H. B. (2015). “Ordinal—Regression models for ordinal data
(R package version 2015.6.28) [computer program],” http://www.cran.r-
project.org/package=ordinal/ (Last viewed March 25, 2020).
Czap, L., and Zhao, L. (2017). “Phonetic aspects of Chinese Shaanxi Xi’andialect,” in Proceedigs of the 8th IEEE International Conference onCognitive Infocommunications (CogInfoCom 2017), Debrecen, Hungary,pp. 000051–000056.
Da, J. (2004). “A corpus-based study of character and bigram frequencies in
Chinese e-texts and its implications for Chinese language instruction,” in
Proceedings of the 4th International Conference on New Technologies inTeaching and Learning Chinese, edited by P. Zhang, T. Xie, and J. Xu
(The Tsinghua University Press, Beijing), pp. 501–511.
Dow, F. D. M. (1972). “A discussion on tone sandhi problems in Chinese,”
J. Int. Phon. Assoc. 2, 13–19.Duanmu, S. (2007). The Phonology of Standard Chinese (Oxford
University Press, Oxford), Chap. 10–11, pp. 225–274.
Francis, A. L., Ciocca, V., Ma, L., and Fenn, K. (2008). “Perceptual learn-ing of Cantonese lexical tones by tone and non-tone language speakers,”
J. Phonetics 36, 268–294.Gandour, J. T. (1983). “Tone perception in Far Eastern languages,”
J. Phonetics 11, 149–175.Gandour, J. T. (1984). “Tone dissimilarity judgments by Chinese listeners,”
J. Chin. Linguist. 12, 235–261, available at http://www.jstor.org/stable/
23767002.
Gandour, J. T., and Harshman, R. A. (1978). “Crosslanguage differences intone perception: A multidimensional scaling investigation,” Lang. Speech
21, 1–33.
Guo, W., Yang, H., Liang, Q., and Pei, D. (2011). “Prosody conversion from
Mandarin to Xi’an dialect,” Comput. Eng. Appl. 47, 122–127 (in Chinese).Hao, Y.-C. (2012). “Second language acquisition of Mandarin Chinese tones
by tonal and non-tonal language speakers,” J. Phonetics 40, 269–279.Hashimoto, A. O.-K. Y. (1972). Phonology of Cantonese (Cambridge
University Press, Cambridge, UK), Chap. 2, pp. 91–93.
Huang, T. (2012). “Cross-linguistic and inter-dialectal differences in tone
perception by native speakers of three Chinese dialects and American
English,” J. Chin. Linguist. 40, 155–179, available at http://www.jstor.
org/stable/23754202.
Kuznetsova, A., Brockhoff, P. B., and Christensen, R. H. B. (2017).“LmerTest package: Tests in linear mixed effects models,” J. Stat. Softw.
82, 1–26.Lam, A. (2005). “Language learning in China: The experience of four
learners,” Reflections Engl. Lang. Teach. 4, 1–14.Lenth, R. V. (2016). “Least-squares means: The R package lsmeans,”
J. Stat. Softw. 69, 1–33.Li, C. N., and Thompson, S. A. (1981). Mandarin Chinese: A FunctionalReference Grammar (University of California Press, Berkeley), Chap. 1,
pp. 1–2.
Li, D. C. S., and Lee, S. (2004). “Bilingualism in East Asia,” in TheHandbook of Bilingualism, edited by T. K. Bhatia and W. C. Ritchie
(Blackwell, Malden, MA), pp. 742–779.
Li, P. (2001). “The correspondence pattern between Xi’an dialect and
Putonghua in pronunciation,” J. Xi’an Educ. Coll. 16, 57–61(in Chinese).Li, R., and Stephen, W. (1987). Language Atlas of China (Longman, Hong
Kong), p. B4.
Li, X. (2017). A Training Course on Mandarin Pronunciation, 2nd ed.
(Communication University of China Press, Beijing), p. 2 (in
Chinese).
Luo, C., and Wang, J. (1981). An Introduction to General Linguistics (TheCommercial Press, Beijing), Chap. 5, p. 142 (in Chinese).
Liu, S., and Samuel, A. G. (2004). “Perception of Mandarin lexical tones
when f0 information is neutralized,” Lang. Speech 47, 109–138.Ma, M. (2005). “Acoustic study of the tones of Xi’an dialect,” J. Yanan
Uni. (Social Science) 27, 110–112 (in Chinese).Marian, V., Blumenfeld, H. K., and Kaushanskaya, M. (2007). “The lan-
guage experience and proficiency questionnaire (LEAP-Q): Assessing
language profiles in bilinguals and multilinguals,” J. Speech Lang. Hear.
Res. 50, 940–967.Mirman, D. (2014). Growth Curve Analysis and Visualization Using R(CRC Press, Boca Raton, FL), pp. 1–188.
Peking University (1989). A Dictionary of Pronunciations of Charactersin Chinese Dialects (Wenzi Gaige Chubanshe, Beijing), p. 10 (in
Chinese).
R Core Team (2015). “R: A language and environment for statistical com-
puting [computer program],” https://www.r-project.org/ (Last viewed
February 10, 2020).
Ren, J. (2012). “Investigations of Guangzhou, Jixi and Xi’an tones based on
EGG,” M.A thesis, Nanjing Normal University, Nanjing, China (in
Chinese).
Rose, P. (1987). “Considerations in the normalisation of the fundamental
frequency of linguistic tone,” Speech Commun. 6, 343–352.So, C. K., and Best, C. T. (2010). “Cross-language perception of non-native
tonal contrasts: Effects of native phonological and phonetic influences,”
Lang. Speech 53, 273–293.Sun L. (2007). A Study on Xi’an Dialect (Xi’an Publishing House, Xi’an),
Chap. 1, p. 8 (in Chinese).
Wang, J. (1996). A Dictionary of Xi’an Dialect (Phoenix Publishing AND
Media Network, Nanjing), p. 6 (in Chinese).
Whalen, D. H., and Xu, Y. (1992). “Information for Mandarin tones in the
amplitude contour and in brief segments,” Phonetica 49, 25–47.Wiener, S., and Ito, K. (2015). “Do syllable-specific tonal probabilities
guide lexical access? Evidence from Mandarin, Shanghai and Cantonese
speakers,” Lang. Cogn. Neurosci. 30, 1048–1060.Wong, K. F., and Xiao, Y. (2010). “Diversity and difference: Identity issues
of Chinese heritage language learners from dialect backgrounds,”
Heritage Lang. J. 7, 152–187.Wu, J. (2015). “Tonal bilingualism: The case of two closely related Chinese
dialects,” Ph.D. dissertation, Leiden University, Leiden, The Netherlands.
Yang, R. (2015). “The role of phonation cues in Mandarin tonal
perception,” J. Chin. Linguist. 43, 543–572.
J. Acoust. Soc. Am. 147 (4), April 2020 Liu et al. 2815
https://doi.org/10.1121/10.0000993

Yip, M. (2002). Tone (Cambridge University Press, Cambridge, UK), Chap.
7, pp. 171–211.
Yu, A. C. L. (2007). “Understanding near mergers: The case of morphologi-
cal tone in Cantonese,” Phonology 24, 187–214.Yuan, J. (1989). An Introduction to Chinese Dialects, 2nd ed. (Wenzi Gaige
Chubanshe, Beijing), Chap. 3–4, pp. 16–55 (in Chinese).
Zhang, J. (2009). “The comparative analysis of the monosyllabic
tone between Xi’an and Beijing,” J. Shaanxi Inst. Educ. 25, 71–75 (in
Chinese).
Zhang, J., and Shi, F. (2009). “The statistical analysis on monosyllabic
tone of Xi’an dialect,” J. Xianyang Normal Univ. 24, 38–42 (in
Chinese).
2816 J. Acoust. Soc. Am. 147 (4), April 2020 Liu et al.
https://doi.org/10.1121/10.0000993