High-AR WLP (TSV,4 © Tokyo Electron Limited Fin FET, GAA ...

PR57-156
ANNUALREPORT 2019
TOKYO ELECTRON
For the Year Ended March 31, 2019
Contents
Vision
A truly global company generating
high added value and profits
in the semiconductor and
flat panel display industries through
innovative technologies and
groundbreaking proactive solutions
that integrate diverse technologies.
We strive to contribute to the develop-
ment of a dream-inspiring society
through our leading-edge technologies
and reliable service and support.
Corporate Philosophy
The Corporate Philosophy defines the pur-
pose of Tokyo Electron’s existence and its
mission in society. It represents Tokyo
Electron’s basic way of thinking and forms
the foundation for its corporate activities.
The Vision describes Tokyo Electron’s
medium- to long-term business aspirations
and the direction of Tokyo Electron’s near
future. Jointly with the Medium-term
Management Plan, the Vision defines Tokyo
Electron’s focus in the industry.
DisclaimerMatters discussed in this annual report, including forecasts of future business performance of Tokyo Electron, management strategies, beliefs and other statements are based on Tokyo Electron’s assumptions in light of information that is currently available. These forward-looking statements involve known or unknown risks, uncertainties and other factors that could cause actual results to differ materially from those referred to in the forward-looking statements. Factors that have a direct or indirect impact on Tokyo Electron’s future performance include, but are not limited to:
• Economic circumstances in Japan and overseas, consumption trends, and large fluctuations in foreign exchange rates
• Changes in semiconductor/FPD markets • Changes in the demand for products and services manufactured or offered by Tokyo Electron’s customers, such as
semiconductor manufacturers, FPD manufacturers and electronics makers • Tokyo Electron’s capabilities to continue to develop and provide products and services that respond to rapid tech-
nology innovation and changing customer needs in a timely manner
For details, please refer to Business-Related and Other Risks on page 15.
Move Back to Previous Page
Move Forward to Next Page
Return to Last Page Opened
Go to Contents Page
Search PDF Content
Zoom
Guide to Buttons
Contents
2 To Our Stakeholders
3 Business Overview and Financial Highlights
4 Interview with the CEO
7 Review of Operations and Business Outlook
8 Corporate Governance
Message from the Chairman of the Board
12 Directors, Audit & Supervisory Board Members and Executive Officers
13 Financial Section
29 Consolidated Subsidiaries
29 Investor Information
To Our Stakeholders Business Overview and Financial Highlights Interview with the CEO Review of Operations
and Business Outlook Corporate Governance Financial SectionInvestor Information
PAGE 1TOKYO ELECTRON ANNUAL REPORT 2019
To Our Stakeholders
Technology is Creating the Societies of the Future
Tetsuo TsuneishiRepresentative Director Chairman of the Board
Toshiki KawaiRepresentative Director President & CEO
To begin, we would like to express our gratitude for the ongoing support and confidence of
our shareholders, investors and all of Tokyo Electron’s stakeholders.
In 2018, the wafer fab equipment market grew to its largest ever, spurred by continued
expansion in demand for mobile devices and data centers. In the flat panel display (FPD)
production equipment market, capital investment remained strong for large-size TV
production. Tokyo Electron increased its market share in these expanding markets and
improved productivity. As a result, fiscal 2019 net sales, operating income and net income
attributable to owners of the parent all reached record highs. Furthermore, ROE hit 30.1%,
surpassing our medium-term management plan target of 30%.
The semiconductor and FPD production equipment markets are expected to continue
expanding over the long term, reflecting broadening applications and growing technological
needs related to the adoption of such new technologies as next-generation 5G
telecommunications standards and artificial intelligence. By providing innovative
technologies and solutions that integrate diverse technologies, we aim to sustainably
improve Tokyo Electron’s corporate value and thereby contribute to the development of a
dream-inspiring society.
We look forward to your continued confidence and support.
To Our Stakeholders
To Our Stakeholders
PAGE 2TOKYO ELECTRON ANNUAL REPORT 2019

Business Overview and Financial Highlights
1,600
(Billions of yen)
800
400
0
1,200
320
(Billions of yen)
80
0
7
160 14
240 21
160
(Billions of yen)
40
0
80
120
800
(Yen)
200
0
400
600
280
(Billions of yen)
0
70 8
140 16
210 24
1,600
(Yen)
0
1,200
400
800
11
22
33
171615 18 19
613.1 663.9799.7
1,130.7
310.5
24.3248.2
30.1
171615 18 19
88.1116.8
155.614.4
17.619.5
24.9
281.1
28
(%)
0
64.2 60.4
118.0
139.7
143
237
352
624
171615 18 19 171615 18 19 171615 18 19 171615 18 19
71.9 77.9
115.211.8 13.0
19.1
204.3
29.032
(%)
0
401.08 461.10
702.26
1,245.48
149.5 1,513.58 758
Net Sales and Gross Profit Margin Operating Income and Operating Margin
Net Income A�ributable to Owners of Parent and ROE
Free Cash Flow Net Income per Share Cash Dividends per Share
Net Sales Gross Profit Margin Operating Income Net Income A�ributable to Owners of ParentOperating Margin
ROE
39.6 40.2 40.342.0 41.2
44
0
(%)
1,278.2
1,600
(Billions of yen)
800
400
0
1,200
320
(Billions of yen)
80
0
7
160 14
240 21
160
(Billions of yen)
40
0
80
120
800
(Yen)
200
0
400
600
280
(Billions of yen)
0
70 8
140 16
210 24
1,600
(Yen)
0
1,200
400
800
11
22
33
171615 18 19
613.1 663.9799.7
1,130.7
310.5
24.3248.2
30.1
171615 18 19
88.1116.8
155.614.4
17.619.5
24.9
281.1
28
(%)
0
64.2 60.4
118.0
139.7
143
237
352
624
171615 18 19 171615 18 19 171615 18 19 171615 18 19
71.9 77.9
115.211.8 13.0
19.1
204.3
29.032
(%)
0
401.08 461.10
702.26
1,245.48
149.5 1,513.58 758
Net Sales and Gross Profit Margin Operating Income and Operating Margin
Net Income A�ributable to Owners of Parent and ROE
Free Cash Flow Net Income per Share Cash Dividends per Share
Net Sales Gross Profit Margin Operating Income Net Income A�ributable to Owners of ParentOperating Margin
ROE
39.6 40.2 40.342.0 41.2
44
0
(%)
1,278.2
The amounts in this report in billions, millions and thousands of yen; thousands of U.S. dollars; and thousands of shares as of and for the years ended March 31, 2016 and prior are rounded to the nearest unit.
Such amounts as of and for the years ended March 31, 2017 and onward, including year-on-year differences, are truncated at the nearest unit. Accordingly, totals for the years ended March 31, 2017 and onward
do not necessarily agree with the sum of the corresponding individual amounts.
Free Cash Flow = Cash flows from operating activities + Cash flows
from investing activities (excluding changes in short-term
investments with original maturities of less than one year)
Flat panel displays (FPDs) are an essential part of everyday life, employed in such products as TVs, smartphones and tab-lets. Going forward, applications for FPDs are expected to expand even further with the adoption of flexible displays. Tokyo Electron supplies coater/developers and etch/ash sys-tems for manufacturing FPDs along with solid technical sup-port and service. We also offer inkjet printing systems for manufacturing OLED panels to take advantage of the expand-ing OLED display market.
FPD Production Equipment
Semiconductor Production Equipment
Semiconductor devices are broadly used in mobile devices, such as smartphones and tablets, as well as the data centers that are indispensable for the processing of big data. With the arrival of the IoT, semiconductor applications will expand in all fields, from consumer electronics and automobiles to medicine and healthcare. Tokyo Electron provides a wide range of semiconductor production equipment used to man-ufacture such semiconductors along with reliable technical support and service. The main categories of our product line-up are coater/developers, etch systems, deposition systems and cleaning systems used in wafer processing as well as wafer probers used in the wafer testing process. In addition, we also offer such products as wafer bonders/debonders used in advanced packaging processes.
P Coater/Developer
P Etch System
P Deposition System
P Cleaning System
P Wafer Prober
P FPD Coater/Developer
P FPD Etch/Ash System
P Inkjet Printing System for Manufacturing OLED Panels
Sales by Region Sales by Region
Southeast Asia 5.2%
China 17.7%
South Korea 26.2%
Taiwan 14.0%
Europe 8.0%
Japan 17.6%
North America 11.3%
Overseas 97.7%
Japan 2.3%
Single Wafer Deposition System Triase+™
Single Wafer Cleaning System CELLESTA™ -i
Wafer Prober Precio™ XL
Coater/DeveloperCLEAN TRACK™ LITHIUS Pro™ Z
Plasma Etch SystemTactras™
ALD SystemNT333™
FPD Coater/DeveloperExceliner™
FPD Plasma Etch/Ash SystemBetelex™
Inkjet Printing System for Manufacturing OLED PanelsElius™
Business Overview and Financial Highlights
Business Overview and Financial Highlights
PAGE 3TOKYO ELECTRON ANNUAL REPORT 2019

Interview with the CEO
The Dawn of the Big Data Era
Targeting World-Class Profitability
Toshiki KawaiRepresentative Director President & CEO
Tokyo Electron achieved record-high profit1 in fiscal 2019; how is the medium-term management plan progressing?
Tokyo Electron has been working to expand sales
and profit in the key fields of etch, deposition and
cleaning. We are focusing on these fields over the
medium term in expectation of ongoing techno-
logical innovation and market expansion, and
because they offer opportunities to leverage our
accumulated technologies and business expertise.
Over the last five years, the wafer fab equip-
ment (WFE)2 market has rapidly expanded from
around US$30 billion to almost US$60 billion. In
that time, Tokyo Electron has reorganized its
business units to combine best known methods
for various products while advancing highly effi-
cient product development through coordination
between development and account sales divi-
sions. These and other efforts have steadily
grown our market share and significantly
improved the profitability of our products. In
addition, thanks to increases in our installed base
and support capabilities, the field solutions busi-
ness (encompassing sales of parts and used
equipment, modifications and maintenance ser-
vices) has grown substantially. As a result, sales
and profit growth has outpaced market growth,
and we have reached the ROE target established
in the medium-term management plan. We are
very pleased with these achievements, which
reaffirm that our business strategies are progress-
ing as planned. Going forward, we will continue
to improve product competitiveness, responsive-
ness to customers and productivity to realize
further business expansion.
1 Gross profit, operating income and net income attributable to owners of the parent reached record highs.
2 Wafer fab equipment (WFE): The semiconductor production process is divided into front-end production, in which circuits are formed on wafers and inspected, and back-end production, in which wafers are cut into chips, assembled and inspected again. WFE refers to the production equip-ment used in front-end production and in wafer-level packaging production.
Question01
Interview with the CEO
Interview with the CEO
PAGE 4TOKYO ELECTRON ANNUAL REPORT 2019

Interview with the CEO
Question03
Over the past two years in particular, we have
seen brisk investment in expanding DRAM and
NAND production capacity, reflecting increased
memory in mobile devices and a shift in demand
from HDDs to SSDs for personal computers and
data centers. There has been a great deal of
greenfield investment in NAND, due to the shift
from 2D to 3D device structures. Semiconductor
demand remains robust, but supply of CPUs,
which are necessary for use with memory devic-
es, has fallen behind, so memory device manufac-
turers are temporarily adjusting their capital
investment. Furthermore, another factor behind
the contraction is likely that some investment in
data centers is on hold as companies wait for the
release of new CPUs and peripheral devices suit-
able for 5G applications.
Due to the shrinkage of the WFE market, Tokyo
Electron forecasts a year-on-year decrease in net
sales in fiscal 2020. The importance of semicon-
ductors going forward, however, is not going
anywhere. Taking the current market adjustment
as an opportunity, in fiscal 2020, we are steadily
investing in strategic technological development
and human resources, with a focus on future
growth. Maintaining industry-leading technologi-
cal innovativeness is, I believe, crucial.
Question02After several years of expansion,
the WFE market is expected to contract in 2019. What changes are occurring in Tokyo Electron’s business environment?
Financial Model (within 5 years)
Net sales ¥1,500 billion ¥1,700 billion ¥2,000 billionOperating margin 26.5% 28% >30%
ROE >30%
In addition to the adjustment in investment by
semiconductor manufacturers, we continue to
monitor risks to the macro economy, such as the
U.S.-China trade friction and Brexit negotiations.
However, as when we announced our previous
financial model last year, we still expect contin-
ued growth in the semiconductor and flat panel
display (FPD) markets over the medium and long
terms. With such developments as the IoT and 5G,
all kinds of things will be connected to networks,
and data traffic will grow exponentially. At the
same time, the establishment of systems to pro-
cess and analyze vast amounts of data, including
data centers and AI, will accelerate the transition
to the big data era. The expansion of applications
and technological innovation in semiconductor
and FPDs will power this transition.
We amended our financial model to reflect this
medium- to long-term outlook. We retained the
projections of the model announced last year for
net sales and operating income and supplement-
ed these with a new scenario of ¥2 trillion in net
sales. We also removed the upper limit on ROE,
making our target simply “over 30%.” We aim to
realize growth in line with this model within five
years. Previously, we linked our sales targets to
projected WFE market size, but the new model
intentionally drops this linkage. This decision
reflects a shift in focus from the WFE market size
estimates of external research institutions to the
SAM3 in which we are focusing our efforts on
business expansion and improved profitability.
Going forward, we will strive to achieve an oper-
ating margin of over 30% and ROE of over 30%.
3 SAM: Served available market
Could you explain how you arrived at the new financial model announced in May 2019?
For details on the medium-term management plan, please visit our website.www.tel.com/ir/policy/mplan/
Interview with the CEO
Interview with the CEO
PAGE 5TOKYO ELECTRON ANNUAL REPORT 2019

Interview with the CEO
Question05Question04How does Tokyo Electron aim to grow in
the medium- to long-term in order to achieve the new financial model’s targets?
The big data era is upon us, requiring even higher-
performance semiconductors and FPDs. In turn,
the technological requirements facing production
equipment manufacturers are constantly growing
more sophisticated. Boasting diverse technolo-
gies and a wide-ranging product lineup, Tokyo
Electron is among the few manufacturers that
can meet these rising expectations. We are focus-
ing on fields where we expect ongoing techno-
logical innovation and market growth, and in
which we can leverage our strengths, working to
increase our market share and profitability.
As you know, Tokyo Electron is a manufacturer.
We believe that constantly striving to provide the
best products and best services on the market is
the key to sustained growth. In line with this
belief, we will invest ¥400 billion in research and
development over the coming three years. We
will also enhance development and production
capabilities in etch and deposition, where we
expect outsized growth. Tokyo Electron possess-
es technologies related to such key processes as
lithography, etching, deposition and cleaning. To
leverage these strengths and provide solutions
that co-optimize multiple processes, we will
conduct joint development with customers from
the early stages of each new technology node. In
addition, by identifying and addressing techno-
logical needs and product requirements before
mass production, we will further improve the effi-
ciency of technology marketing and development.
We will reflect the technological expertise gained
through these initiatives in next-generation
equipment to create a virtuous cycle, enhancing
customer satisfaction and advancing develop-
ment, always a step ahead of the competition.
Furthermore, we are targeting stable growth in
the field solutions business by leveraging the
insights provided by our installed base, which is
the largest in the industry. Increasingly sophisti-
cated process technologies are more reliant on
proper maintenance to ensure that equipment
consistently operates at optimal performance. By
realizing high-value-added services, such as pre-
dictive maintenance using equipment operational
data, we will provide support that maximizes
uptime and improves yields for our customers.
Through these measures, we aim to achieve the
targets of the new financial model and increase
corporate value over the long term.
Our shareholder return policy is to maintain a
payout ratio of 50% of net income attributable to
owners of the parent and flexibly consider share
repurchases. Based on this policy, annual cash
dividends for fiscal 2019 came to ¥758 per share,
a record high. The share repurchase announced in
May 2019 is also in line with this policy. The deci-
sion to implement the buyback stems from our
belief that our growth potential was not ade-
quately reflected in our stock price, as well as our
confidence that Tokyo Electron will realize profit
growth going forward.
As for uses of cash on hand, investment in
future growth is our foremost priority. Tokyo
Electron’s growth depends on continuously cre-
ating innovative technologies that solve the
constantly evolving challenges our customers
face. In addition to our internal research and
development, we will collaborate with consortia.
We are often asked about M&A, and we do not
rule out the possibility. M&A could be an option
provided we can realistically expect solid return
on investment, medium- to long-term business
expansion, clear benefit to our stakeholders and
increased shareholder value. When approaching
such opportunities, however, we will also consid-
er the potential for business collaboration. We will
continue to manage our balance sheet appropri-
ately with due consideration placed on our ability
to generate cash, maintain necessary cash on
hand and preserve capital for growth invest-
ments going forward.
What led to the decision to implement a share repurchase of up to ¥150 billion,
and what is your approach to using cash on hand going forward?
Interview with the CEO
Interview with the CEO
PAGE 6TOKYO ELECTRON ANNUAL REPORT 2019

Review of Operations and Business Outlook
2018 Business EnvironmentInvestment in semiconductors for mobile devices and data centers was robust, backed by grow-ing data traffic due in part to the spread of streaming and downloadable video services. Under these conditions, capital investment, especially in DRAM, saw significant growth. As a result, the 2018 global market for wafer fab equipment (WFE)1 grew 16% year on year to a record high of about US$59 billion.
1 Wafer fab equipment (WFE): The semiconductor production process is divided into front-end production, in which circuits are formed
on wafers and inspected, and back-end production, in which wafers are cut into chips, assembled and inspected again. WFE refers to
the production equipment used in front-end production and in wafer-level packaging production.
Fiscal 2019 Business Overview Segment net sales grew 10.6% year on year to ¥1,166.7 billion.
• By application, sales of equipment for DRAM grew substantially year on year.
• By product, etch systems saw especially large growth in both market share and sales, due in significant part to increased market share of products for key 3D NAND processes.
• Sales in the field solutions business (encompassing sales of parts and used equipment, modi-fications and maintenance services) rose 14.8% year on year to ¥288.2 billion, reflecting growth in parts sales.
The segment profit margin decreased from 29.8% in the previous fiscal year to 28.0%, due to aggressive investment aimed at medium- and long-term growth.
Business OutlookSemiconductor demand is expected to expand over the medium to long term, due to dramati-cally increasing data traffic resulting from the adoption of such technologies as IoT and AI. Within the SPE market, Tokyo Electron particularly expects ongoing innovation and market expansion in etch, deposition and cleaning systems, and has designated these as its three key fields. By differ-entiating our technologies and services in these fields, we aim to grow sales and profit. As the miniaturization of DRAM and logic chips continues and the number of layers in 3D NAND increases, the use of new materials and increasingly complex device structures are creat-ing greater technological challenges. To turn these business opportunities into growth, in the area of etch, we will strengthen our competitive advantage based on process performance and productivity in HARC,2 interconnects and patterning processes. In deposition, we boast technolo-gies for batch, semi-batch and single wafer processes, and we will leverage this strength to offer optimal deposition methods while advancing the development of technologies for new materi-als. In cleaning, we will provide technologies to reduce fine pattern collapse and remove foreign particles and residue that reduce yields. In these ways, Tokyo Electron seeks to expand its SAM3 share in its three key fields. In the longer term, the importance of co-optimizing multiple processes will grow, creating greater needs for services that help increase uptime and yields. Tokyo Electron will leverage the insights provided by its diverse product lineup to conduct joint development with customers from the early stages of each new technology node. By doing so, we aim to be at the forefront in offering integration technologies that realize co-optimization. In addition, by providing servic-es with higher added value, such as remote equipment maintenance and equipment diagnosis using AI, we aim to achieve further business growth.
2 HARC (High aspect ratio contact) process: A process for forming deep holes or trenches that requires advanced processing technology
3 SAM: Served available market
2018 Business EnvironmentCapital investment in small- and medium-sized panels edged down year on year, reflecting stagnant demand for OLED panels for smartphones and other mobile devices. However, capital investment in generation 10.5 LCD panels for large-sized TVs over 65 inches increased signifi-cantly year on year. As a result, the equipment market for TFT array processes,1 in which Tokyo Electron operates, remained strong at about US$9.8 billion.
1 TFT (Thin-film transistor) array process: The process of manufacturing the substrates with the electric circuit functions that drive displays
Fiscal 2019 Business Overview Segment net sales rose 48.2% year on year to ¥111.2 billion.
The segment profit margin reached 21.8%, a record high, due to product differentiation in each generation.
• Tokyo Electron expanded its highly profitable PICP™2 etch systems from small- and medium-sized panels to generation 8.5 panels.
• Tokyo Electron used its track record in generation 10 panels to secure a large share of the equipment market for generation 10.5 panels.
2 PICP™: A plasma source that produces extremely uniform high-density plasma on panel substrates
Business OutlookIn the FPD market, technological innovation is expected in both products for mobile devices and for TVs. In response to increasingly advanced technological requirements, Tokyo Electron aims to achieve differentiation using its superior process technologies to expand its market share and raise the operating margin to 30%. In small- and medium-sized panels for mobile devices, in addition to such technologies as LTPS3 and IGZO4 that enable even greater resolution, self-lighting OLED panels and foldable devices made with flexible displays are expected to gain broader utilization going forward. These changes will drive an increase in the number of masks and dry etch processes as well as a need for more precise patterning. Tokyo Electron will further enhance the performance of its dry etch systems and coater/developers to leverage these expanding business opportunities and achieve business growth. Looking at large-sized panels, a shift from LCD to OLED is expected across a wide range of applications, including televisions, high-end monitors, and displays installed in vehicles and pub-lic places. Tokyo Electron will maintain its competitive advantage in generation 10.5 panels while expanding its PICP™ etch systems, which provide superior processing uniformity, from small- and medium-sized panels to generation 8.5 and 10.5 panels. Furthermore, Tokyo Electron has begun sales of inkjet printing systems, which until now it has sold only for large-sized panels, for generation 4.5 panels in anticipation of expansion in OLED panel applications. Tokyo Electron’s inkjet printing systems can be used to manufacture high-resolution panels for 8K TVs and moni-tors. Leveraging the overwhelmingly high productivity of the inkjet method, Tokyo Electron will take advantage of the coming mass production of OLED displays.
3 LTPS: Low temperature poly-silicon
4 IGZO: An oxide semiconductor containing indium, gallium and zinc
Segment profit corresponds to income before income
taxes on the consolidated statements of income.
Segment profit corresponds to income before income
taxes on the consolidated statements of income.
Semiconductor Production Equipment (SPE) FPD Production Equipment
1,200
600
400
200
0
5
10
15
800
1,000
20
25
17 18 19
30
0
(Billions of yen) (%)
24.41,055.2
749.8
29.81,166.7
28.0
Segment Net Sales
Segment Profit Margin
91.3%
120
40
20
0
5
10
60 15
80 20
100 25
17 18 19
30
0
(Billions of yen) (%)
49.3
75.0
9.4
17.7
111.2
21.8
Segment Net Sales
Segment Profit Margin
8.7%
Segment Net Sales and Profit Margin
Segment Net Sales and Profit Margin
Share of Net Sales Share of Net Sales
Review of Operations and Business Outlook
Review of Operations and Business Outlook
PAGE 7TOKYO ELECTRON ANNUAL REPORT 2019

Message from the Chairman of the Board
Tetsuo TsuneishiRepresentative Director Chairman of the Board
Steadily Enhancing Board Effectiveness Four years have passed since the introduction of Japan’s Corporate Governance Code, and governance reforms are beginning to extend beyond form and into substance. Tokyo Electron has strengthened its corporate governance, as this is the foundation supporting our efforts to attain world-class profitability and increase corporate value over the short, medium and long terms. Using the Audit & Supervisory Board System, Tokyo Electron achieves an effective balance of aggressive management and careful oversight. We seek to continually enhance corporate governance, adapting to the changing business environment and requirements of society. In fiscal 2019, the year ended March 31, 2019, to further improve the effectiveness of our corporate governance and enhance our corporate value, we continued the practice inaugurated in fiscal 2018 of holding an off-site meeting as an opportunity for our directors and Audit & Supervisory Board members to discuss important matters other than Board of Directors meeting agenda items. At this two-day meeting, we exchanged views on Tokyo Electron’s vision of becoming a truly global company, renewing our shared understanding of the Company’s long-term direction in an effort to make corporate governance more effective. In addition, the directors and Audit & Supervisory Board members actively debated measures necessary to achieve the goals of the medium-term management plan as well as initiatives related to ESG issues and the Sustainable Development Goals that will improve corporate value. We engaged in fruitful discussion on how the Board of Directors and Audit & Supervisory Board, which oversee the execution of such measures, can function best, including the optimal composition of internal and outside members. The meeting thus enabled us to set a course to address a range of important issues. We welcomed a new outside director in June 2019, the first woman to serve on the Board. As a result, six of 16 current directors and Audit & Supervisory Board members are independent outside members. The new outside director, Ms. Makiko Eda, brings global insight fostered by experience living overseas as well as many years of experience working in marketing for a major American semiconductor manufacturer. As Chief Representative Officer at World Economic Forum Japan, she possesses broad-ranging knowledge of sustainable global economic growth and related challenges. I am sure that she will put her knowledge of the semiconductor industry, corporate management and economics to great use at Tokyo Electron. Our other outside directors, Mr. Charles Ditmars Lake , who is an executive at an American life insurance company, and Mr. Michio Sasaki, who served for many years as president of Keyence, a corporation well known for being highly profitable, also provide us with tremendous advice and suggestions based on their deep insight. The diverse values and perspectives of all of our directors and Audit & Supervisory Board members contribute to highly productive discussion, further enhancing the effectiveness of the Board of Directors. As we enter a new era of IoT, AI and big data, the semiconductor and FPD markets continue to expand. As chairman, I am working to ensure the Board of Directors can take decisive action and sustainably enhance corporate value in a dynamic business environment.
Corporate Governance
Message from the Chairman of the Board
PAGE 8TOKYO ELECTRON ANNUAL REPORT 2019

Corporate Governance
Basic Stance
In an environment where over 80% of our sales come from overseas, Tokyo Electron regards maintaining governance as essential to becoming a truly global company that achieves sustainable growth. To that end, Tokyo Electron strives to build frameworks to maximize the use of its worldwide resources. In addition to strengthening its management platform and technology base, the Company maintains a governance structure that will enable it to attain world-class profitability. Tokyo Electron uses the Audit & Supervisory Board System, which consists of a Board of Directors and an Audit & Supervisory Board. Effective governance is achieved based on the supervision of management by the Audit & Supervisory Board.
Board of Directors
Roles and Responsibilities of the Board of DirectorsThe Board of Directors works to achieve sustainable growth and increase corporate value over the medium to long term based on its fiduciary responsibility to shareholders. The roles and responsibilities of the Board of Directors are as follows: (1) Establishing management strategy and vision (2) Making major operational decisions based on strategic
direction (3) Engaging in constructive, open-minded debate
The Board of Directors seeks the active participation of those present in discussions in order to obtain a wide range of opinions, and supervises management and operational execution based on active debate. The Board of Directors respects minority or opposing viewpoints, including opinions voiced by outside directors; revises the conditions for implementation or the content of proposals as necessary; and engages in extensive debate with the goal of reaching decisions based on consensus. However, emphasis is placed on making necessary decisions quickly to avoid missing opportunities.
Board Size and Independent Outside DirectorsTokyo Electron considers it essential to maintain a Board of Directors with the appropriate size to ensure high quality, active debate; a robust balance of knowledge, experience and skills among both executive directors and independent directors; and diversity, including gender and nationality. The current Board of Directors consists of 11 directors, including one woman and one foreign national, and Tokyo Electron believes this to be the appropriate size, at present, to achieve a good balance in terms of knowledge, experi-ence and skills. Tokyo Electron regards the active expression of opinions, not only by independent directors, but also by Audit & Supervisory Board members, as the cornerstone that sup-ports the sound decision making of the Board of Directors. Currently, six out of the 16 participants in the Board of
Directors meetings, including the Audit & Supervisory Board members, are outside members, consisting of three inde-pendent directors and three outside Audit & Supervisory Board members. Tokyo Electron believes that the current Board of Directors meetings achieve an appropriate sense of productive tension and constructive debate essential for making operational decisions due to the combined presence of executive directors, who are highly knowledgeable about Tokyo Electron’s businesses, and outside members, who provide objectivity.
Nominations for Director and CEOTokyo Electron has established a Nomination Committee to ensure fairness and efficacy in management. The Nomination Committee proposes director candidates to the Board of Directors prior to their election at the General Meeting of Shareholders and also nominates CEO candi-dates for appointment by the Board of Directors. The Nomination Committee is composed of four directors and Audit & Supervisory Board members, including at least one outside director or outside Audit & Supervisory Board member; the CEO is not a member of the committee. The authority to propose the election or dismissal of the CEO or directors is entrusted to the Nomination Committee. In addition, to develop the next generation of manage-ment and executive human resources, the Nomination Committee carefully surveys and analyzes the status of the successor pool, then reports to the Board of Directors, which provides appropriate supervision to ensure that ade-quate time and resources are being devoted to implement-ing the successor development plan.
Director and CEO CompensationTokyo Electron’s compensation policy prioritizes the follow-ing considerations. (1) Globally competitive compensation levels and sys-
tems that can secure excellent management human resources
(2) Strong correspondence with short-term performance and medium- and long-term increases in corporate value aimed at sustainable growth
(3) Assuring transparency and fairness in the process of determining compensation as well as the appropriate-ness of compensation
In line with this policy, Tokyo Electron has adopted a director and executive officer compensation system that is closely linked to performance and shareholder value. The
compensation of directors currently comprises a fixed basic wage, annual performance-linked compensation and medi-um-term performance-linked compensation. Outside direc-tors receive only a fixed basic wage and an annual performance-linked cash bonus. To ensure management transparency and fairness as well as the appropriateness of compensation, Tokyo Electron maintains a Compensation Committee, which comprises three or more directors (excluding the representative direc-tors) or Audit & Supervisory Board members and includes at least one outside director. The Compensation Committee utilizes advice from external experts and conducts an analy-sis of compensation at high-tech companies in and outside Japan. Based on this analysis, the committee proposes a pol-icy and system for the compensation of the Board of Directors and executive officers that will be globally compet-itive and optimally suited to the Company as well as individ-ual compensation amounts for the representative directors. In principle, annual performance-linked compensation consists of monetary compensation and stock option share-based compensation; the ratio of these two compo-nents is roughly 1:1 for directors. Stock options are awarded with the exercise price set at one yen per share, and a three-year vesting period from the date of allotment before the options may be exercised. In order to incentivize the CEO and other directors to improve corporate performance, Tokyo Electron has desig-nated the net income attributable to owners of the parent and return on equity (ROE) for the current period, which are indicators related to profit, as the main benchmarks for cal-culating their annual performance-linked compensation. The medium-term performance-linked compensation utilizes performance shares (share-based compensation) with the aim of using shareholdings to align the perspec-tives of directors with those of shareholders and incentivize directors to increase corporate value. The number of Tokyo Electron shares issued to directors is calculated based on each director’s position and duties and varies from 0% to 150% according to the attainment of performance targets over the relevant three-year term. In the determination of medium-term performance-linked compensation, the operating margin is used as an indicator of profitability and ROE as an indicator of capital efficiency to assess the attainment of performance targets and appropriately link such compensation with medium-term enhancement of corporate value.
Does Tokyo Electron have these major components of corporate governance? (As of July 1, 2019)
Compensation Committee Yes Composed of directors, including outside directors and excluding representative directors, or Audit & Supervisory Board members
Nomination Committee Yes Composed of directors or Audit & Supervisory Board members, excluding the CEO and including at least one outside director or Audit & Supervisory Board member
Outside directors Yes Three of the 11 directors are outside directors
Outside Audit & Supervisory Board members YesThree of the five Audit & Supervisory Board members are outside Audit & Supervisory Board members
Executive officer system Yes
Disclosure of individual remuneration of representative directors Yes Disclosed since 1999
Annual performance-linked compensation system Yes
Medium-term performance-linked compensation scheme Yes Adopted in 2018
Stock options system YesDoes not apply to outside directors and Audit & Supervisory Board members
Retirement allowance system for executives No
Anti-takeover measures No
Corporate Governance
Corporate Governance
PAGE 9TOKYO ELECTRON ANNUAL REPORT 2019

Corporate Governance
Audit
Cooperate
Audit
Business Execution
Audit
Appointment or Dismissal Appointment or Dismissal Appointment or Dismissal
Audit
Cooperate Cooperate
Commiees • Ethics Commiee • Information Security Commiee • Export Trade Control Commiee
Department in Charge • Risk Management (General A�airs Dept.) • Compliance (Compliance Dept.)
Shareholders’ Meeting
Independent Auditors
Internal Control Executive O�cersRisk Management Executive O�cersCompliance Executive O�cers
Business Execution Organization(All Division/All TEL Group Companies)
Audit & Supervisory BoardNomination Commiee Compensation Commiee
Board of Directors
Internal Audit Dept.(Global Audit Center)
CSS & Executive O�cers
Representative Directors
Corporate Governance Framework, Internal Control System and Risk Management System (As of July 1, 2019)
Moreover, the composition of Audit & Supervisory Board members provides a good balance of knowledge required for operational audits and accounting audits, including financial and accounting knowledge, legal knowledge, and audit experience at other companies. Tokyo Electron thus believes its Audit & Supervisory Board members are able to perform their auditing functions effectively.
Risk Management
Approach to Risk ManagementReflecting changes in society and the business environment, the risks facing businesses are growing increasingly complex and diverse. Tokyo Electron considers understanding and appropriately addressing the risks that it may face in its businesses, as well as their impacts, to be a crucial factor to sustainable corporate growth.
Risk Management SystemIn order to promote more effective risk management, Tokyo Electron carries out enterprise risk management through a body established within the General Affairs Department at its headquarters. This body supervises risk management, analyzing a wide range of risks arising in business activities (such as compliance risk, human resource and labor risk, and business continuity risks) to identify key risks. It then moni-tors the management of these risks by the respective departments responsible and supports their risk manage-ment activities. The status of these activities is regularly reported to the Board of Directors and the Audit & Supervisory Board.
Auditing by the Internal Audit DepartmentThe Global Audit Center serves as the internal audit depart-ment for the entire Group and implements audits based on the audit plan. Based on the results of these audits, the Center then gives instructions for making improvements as needed, follows up on progress toward these improve-ments and provides support. The Group’s internal control over financial reporting in fiscal 2019 was evaluated as effective by the independent auditors.
Risk Management InitiativesEach year, we set priority management targets and strive to steadily reduce risk. In fiscal 2019, we reinforced measures in the following areas.
ComplianceWe appointed people responsible for compliance at key overseas bases and established a system whereby they report the progress of compliance-related activities to the Group headquarters each month. In addition, compliance risk audits are conducted through systematic visits to over-seas subsidiaries.
Business Continuity Plans (BCPs)Tokyo Electron is improving its plans based on lessons from past disasters and is surveying the earthquake risks at its overseas locations. We are also working, on an ongoing basis, to establish alternate production structures within our net-work and to develop multiple sources of important parts.
Mental Health, Long Work Hours, and HarassmentTokyo Electron carries out mental health-related measures based on employee stress checks and multiple seminars aimed at helping managers look after their employees. In addition, we have introduced a mechanism to monitor excessive work hours that lead to health risks. Tokyo Electron also holds harassment prevention seminars led by lawyers. The Ethics Committee Chairman and Human Resource Department provide messaging about changing mindsets and behaviors.
Management of Confidential InformationThe Human Resources Department and the Intellectual Property Department cooperate to strengthen measures to prevent leaks of confidential information, particularly tar-geting employees who leave the Company to ensure the proper return and destruction of confidential information. We also take thoroughgoing steps to ensure that mid-career hires do not divulge confidential information about their previous employers. We use a combination of indus-try-leading security systems, provide security training for employees, and work to protect our information from the sabotage of our servers or computers as well as data theft, data manipulation and other forms of cyber attack. The information security environment, including cyber attack methods, is changing constantly. To stay ahead of these changes, Tokyo Electron is constantly gathering information and formulating and implementing necessary countermea-sures on a global basis.
Evaluation of the Effectiveness of the Board of DirectorsTo evaluate the Board of Directors, including the Nomination Committee and Compensation Committee, Tokyo Electron conducts a question-based survey of all directors and Audit & Supervisory Board members as well as interviews with some of these individuals. In fiscal 2019, Tokyo Electron hired a third-party institu-tion to provide advice on the drafting of the survey, hold the interviews, and compile and analyze the results. Using the compiled data and analysis, the outside directors and outside Audit & Supervisory Board members held discus-sions of the Board of Director’s effectiveness. These findings were then shared with and discussed by the entire Board of Directors, which evaluated its effectiveness and disclosed a summary of the results. At meetings of the Board of Directors, directors and Audit & Supervisory Board members actively engage in discussion based on their diverse viewpoints and experiences. Important items are examined in terms of risk, openly debated and considered carefully. To complement Board of Directors meetings, Tokyo Electron held an off-site meeting focused on operational strategy, vision and governance. Tokyo Electron thus believes that its Board of Directors is appropriately carrying out its role as defined in the Corporate Governance Guidelines, namely (1) Establishing management strategy and vision and (2) Making major operational decisions based on strategic direction.
Accordingly, Tokyo Electron believes that the Board of Directors, including the Nomination Committee and Compensation Committee, is functioning effectively. Going forward, the Board of Directors will strive to increase its diversity, including gender and nationality, and create more opportunities to discuss Tokyo Electron’s medium- and long-term vision and growth strategy. The Board will also examine ways to reinforce Group governance systems, including those overseas, and the proper division of roles and authority between the Board of Directors and executive bod-ies. Furthermore, the Board regards the effective operation of the successor development plan and provision of value to society in areas related to ESG issues and the United Nations’ Sustainable Development Goals (SDGs) as important man-agement priorities that it will continue to discuss.
Audit & Supervisory Board
The Audit & Supervisory Board currently consists of five members and includes three outside Audit & Supervisory Board members. Two members are full-time. The full-time Audit & Supervisory Board members collect information through onsite surveys, and the board maintains appropri-ate coordination with the Internal Audit Department and the independent auditors as part of a structure that enables Audit & Supervisory Board members to obtain all informa-tion necessary for audits.
Corporate Governance
Corporate Governance
PAGE 10TOKYO ELECTRON ANNUAL REPORT 2019

Corporate Governance
Compliance
Approach to ComplianceStakeholder trust is essential to business activities. In order to maintain this trust, it is essential to continuously ensure compli-ance and enhance corporate ethics. The Fundamental Policies concerning Internal Controls within the Tokyo Electron Group and the Code of Ethics of the Tokyo Electron Group (Code of Ethics) stipulate that all Group executives and employees must comply with laws and regulations and act with high ethical standards and a strong awareness of compliance.
Compliance Systems and InitiativesCompliance SystemTokyo Electron has built a structure to implement its com-pliance program globally. Under the head of the Legal, Compliance Division, compliance representatives have been newly appointed at major overseas bases to create a system for direct reporting through the chain of command to the Legal, Compliance Division. The Company has restructured its compliance system. Specifically, compliance-related issues are immediately reported by the head of the Legal, Compliance Division to the CEO, Board of Directors, and the Audit & Supervisory Board so that they can be addressed quickly and effectively.
Corporate EthicsTokyo Electron has established the Code of Ethics as a stan-dard of conduct by which employees and executives should abide. To ensure awareness of this code, we distribute it in the form of booklets in Japanese and four other languages to all employees. Tokyo Electron revises its Code of Ethics as needed, in response to changes to external and internal conditions. In addition, an Ethics Committee has been established to support and supervise the activities of Group companies in Japan and overseas aimed at more effectively promoting and raising awareness of compliance and corpo-rate ethics. Furthermore, directors and senior executives sign an oath to uphold the Code of Ethics and comply with corruption-related laws every year.
Compliance RegulationsBased on its Code of Ethics, each Group company in Japan and abroad has established its own compliance regulations to ensure that every individual taking part in the business activities of the Group clearly understands the pertinent laws, regulations and internal company rules, and consis-tently applies these in all of their activities.
Compliance EducationTokyo Electron conducts online education and face-to-face training on topics including corporate ethics and the basics of compliance, export compliance, insider trading preven-tion, the Act for Subcontracting, and the prevention of harassment. Depending on the topic, this education is implemented for specific levels or across the board. We also implement ongoing testing to check the degree of under-standing among employees. From fiscal 2020, we will deploy a more comprehensive, systematic education pro-gram, advancing multilingual support in an effort to foster compliance awareness and reinforce behavior-oriented awareness-building activities among all Group employees.
Internal Reporting SystemAs a means for employees to provide information outside the chain of command about behavior that may be in violation of laws or corporate ethics, we have established a hotline (organized around the tenets of confidentiality, anonymity, and prohibition of retribution) to receive inter-nal reports. In addition, we established an external contact point for employees and another contact point specifically for suppliers and third parties. Each overseas location has its own internal reporting hotline, and we are building a unified internal reporting system for all overseas bases.
As a result of these initiatives, in fiscal 2019 there were no reports or cases of noncompliance with laws, regulations, or the Code of Ethics that could have had a material impact on the Tokyo Electron Group’s business or local communities.
Promoting Dialog with Investors
Basic StanceTokyo Electron endeavors to provide opportunities for con-structive dialog with growing numbers of investors around the world to contribute to the Company’s sustainable growth and increase corporate value over the medium and long term. Furthermore, to the extent that this is reason-able and possible, the Company places emphasis on having the Chairman of the Board and CEO communicate with investors through direct dialog.
IR ActivitiesStriving to maintain dialog with investors, Tokyo Electron maintains a dedicated Investor Relations Department under the direct control of the CEO. The Chairman of the Board and CEO serve as spokespersons for the Company at such events as earnings release conferences and medium-term management plan briefings for securities analysts and insti-tutional investors, IR conferences in and outside Japan, and individual meetings. The spokespersons for the IR Department hold individual meetings with investors and periodically relay the opinions
of investors at these events to the Chairman of the Board and CEO so that feedback can be of use in management.
Shareholders’ MeetingTokyo Electron schedules its shareholders’ meeting to avoid days on which many such meetings are concentrated as part of its measures to vitalize these meetings and to pro-mote smooth and efficient voting. The Company also mails a Notice of Annual General Meeting of Shareholders to shareholders more than three weeks in advance of the meeting and discloses notices on its website before they are mailed, striving to provide shareholders with informa-tion as early as possible. Shareholders are free to cast their votes via the internet, and Tokyo Electron participates in the web based voting platform for institutional investors operated by ICJ, Inc. To supplement the above shareholder meeting-related initiatives, Tokyo Electron’s website carries the resolutions, voting results and presentation materials of shareholders’ meetings.
For more details on our corporate governance, please refer to the Tokyo Electron Corporate Governance Guidelines. www.tel.com/about/cg
For details on Tokyo Electron’s ESG-related initiatives, please refer to our Sustainability Report 2019.
Third-Party Recognition
Tokyo Electron has been selected for inclusion in world-leading environmental, social and governance (ESG)
investment indices.
In fiscal 2019, following from the previous fiscal year, Tokyo Electron was again selected as a constituent stock under
indices including DJSI1 Asia Pacific 2018, FTSE4Good,2 FTSE Blossom Japan Index, MSCI World ESG Leaders Index,3 and
MSCI Japan ESG Select Leaders Index.4
1 DJSI (Dow Jones Sustainability Index): ESG investment indices developed by U.S.-based S&P Dow Jones Indices LLC and Switzerland-based RobecoSAM AG. The Asia Pacific index covers companies
in that region.
2 FTSE4Good: An index related to environmental performance and corporate social responsibility developed by the UK-based FTSE Group
3 MSCI World ESG Leaders Index: Companies that have high ESG performance are selected from the MSCI Global Sustainability Index, an ESG investment index developed by Morgan Stanley Capital
International (MSCI)
4 MSCI Japan ESG Select Leaders Index: The MSCI Japan ESG Select Leaders Index is an index constructed from companies that have high ESG performance selected from its parent index (MSCI Japan IMI
Top 500 Index: Top 500 securities based on free float-adjusted market capitalization). The index targets 50% of the free float-adjusted market capitalization within each GICS sector of the parent index.
Corporate Governance
Corporate Governance
PAGE 11TOKYO ELECTRON ANNUAL REPORT 2019

Directors, Audit & Supervisory Board Members and Executive Officers (As of July 1, 2019)
Charles Ditmars Lake II*Corporate Director Chairman and Representative Director, Aflac Life Insurance Japan Ltd. President, Aflac International Incorporated
Directors
Audit & Supervisory Board Members
Executive Officers
Tetsuo TsuneishiChairman of the Board
Toshiki KawaiPresident & CEO, GM, Corporate Innovation Division
Sadao SasakiEVP & GM, Development & Production 1st Division, Development & Production 4th Division, EHS, Quality, Procurement, Production Technology President, Tokyo Electron Technology Solutions Ltd.
Yoshikazu NunokawaEVP & GM, Finance Division, Export & Logistics Control Division, IT Division, Internal Control
Tatsuya NagakuboSVP & GM, Human Resources, General Affairs, CSR Division, Legal, Compliance Division, Chairman of Ethics Committee
Kiyoshi SunoharaSVP & GM, Field Solutions Business Division, Business Innovation Project
Seisu IkedaSVP & GM, Account Sales Division
Yoshinobu MitanoSVP & GM, SPE Business Division
Barry MayerSVP & GM, Global Strategy
David BroughSVP & GM, Global Strategy President, Tokyo Electron Europe Ltd.
Tetsuro HoriSVP & GM, Business Innovation Project
Kenji WashinoSVP & GM, Backend Process Business Division
Tsuguhiko MatsuuraSVP & GM, FPD Business Division
Hideyuki TsutsumiSVP & GM, Vice Division GM, Corporate Innovation Division
Takeshi OkuboSVP & GM, Global Sales Division
Masaki YoshizawaVP & GM, Strategy
Tadashi ShimizuVP & GM, Business Innovation Project
Hiroshi KawamotoVP & GM, Finance Division
Takeo SasakiVP & GM, Export & Logistics Control Division
Yutaka NanasawaVP & GM, IT Division, Business Innovation Project President, TEL Solar Services AG
Keiichi AkiyamaVP & GM, CTSPS BU
Isamu WakuiVP & GM, ES BU
Hiroshi IshidaVP & GM, TFF BU
Toshihiko NishigakiVP & GM, Deputy GM, Corporate Innovation Division (Digital Transformation) President, TEL FSI, Inc.
Masayuki KojimaVP & GM, Development & Production 2nd Division President, Tokyo Electron Miyagi Ltd.
Shinichi HayashiVP & GM, Development & Production 3rd Division, Deputy GM, Corporate Innovation Division President, Tokyo Electron Kyushu Ltd.
Shingo TadaVP & GM, Deputy GM, Account Sales Division
Masahiro MoritaVP & GM, Account Sales, Global Sales
* Outside Audit & Supervisory Board Member
Kazushi Tahara Audit & Supervisory Board Member
Kyosuke Wagai*Audit & Supervisory Board Member Certified Public Accountant, Wagai CPA Office
Takatoshi Yamamoto*Audit & Supervisory Board Member
Ryuji Sakai*Audit & Supervisory Board Member Attorney at law, Nagashima Ohno & Tsunematsu
* Outside Director
Yoshikazu NunokawaCorporate Director
Makiko Eda*Corporate Director Chief Representative Officer, World Economic Forum Japan
Sadao SasakiCorporate Director
Tatsuya NagakuboCorporate Director
Michio Sasaki*Corporate Director Outside Director, ZUIKO CO., LTD. Outside Director, SHIFT, Inc.
Tetsuo TsuneishiRepresentative Director Chairman of the Board
Yoshinobu MitanoCorporate Director
Seisu IkedaCorporate Director
Yoshiteru HaradaAudit & Supervisory Board Member
Toshiki KawaiRepresentative Director President & CEO
Kiyoshi SunoharaCorporate Director
EVP: Executive Vice PresidentSVP: Senior Vice PresidentVP: Vice PresidentGM: General Manager
Corporate Governance
Directors, Audit & Supervisory Board Members and Executive O�cers
PAGE 12TOKYO ELECTRON ANNUAL REPORT 2019

Financial Review
Sales and Income
Operating EnvironmentThe overall world economy in fiscal 2019 held firm, with the United States economy remaining solid, despite signs of stagnation in the economies of China, Asia and Europe. In the electronics industry, investment in mobile devices and data centers remained brisk. Demand for semiconductors, especially memory, increased. As a result, the wafer fab equipment market grew a further 16% year on year from the previous year’s record-breaking US$50 billion, reaching approximately US$59 billion. At the same time, the display industry saw full-scale investment in large generation 10.5 panels, despite adjustments in investment in small- and medium-sized OLED panels due to slower growth in shipments of mobile devices. Accordingly, the market for flat panel display (FPD) production equipment maintained the brisk level from the previous year, staying at around US$20 billion.
SalesNet sales in fiscal 2019 rose 13.0% year on year to ¥1,278.2 billion. This reflected the favorable market environment for semiconductors and FPD as well as the increase in the Company’s share of each market. By segment, net sales in the semiconductor production equipment (SPE) segment grew 10.6% year on year to ¥1,166.7 billion. Net sales in the FPD production equip-ment segment grew 48.2% year on year to ¥111.2 billion. For details on performance by segment, please refer to Review of Operations and Business Outlook on page 7. Furthermore, net sales in the field solutions business (encompassing sales of parts and used equipment, modifications and maintenance services) rose 14.8% year on year to ¥288.2 billion, accounting for 22.6% of consolidated net sales.
Gross Profit, SG&A Expenses and Operating IncomeGross profit in fiscal 2019 was up 10.8% year on year to ¥526.1 billion, reflecting the growth in net sales. The gross profit margin fell 0.8 percentage points to 41.2%, due to an increase in the production cost ratio follow-ing an expansion of the production and service systems. SG&A expenses rose 11.2% year on year to ¥215.6 bil-lion, but the ratio of SG&A expenses to consolidated net sales dropped 0.2 percentage points from the pre-vious fiscal year to 16.9% in the fiscal year under review. The Group actively advanced R&D with the aim of out-performing the SPE market, where growth is expected. Consequently, operating income increased 10.5% year on year to ¥310.5 billion, and the operating margin decreased 0.6 percentage points to 24.3%. This was due to increases in the R&D expense ratio and the pro-duction cost ratio.
R&D ExpensesR&D expenses were up 17.4% year on year to ¥113.9 bil-lion. The increase was focused consistently with the previous year: the reinforcement of R&D in the fields of etch, deposition and cleaning systems, in which the Company is working to expand its market share under the medium-term management plan. Tokyo Electron also focused on R&D aimed at enhancing the competi-tiveness of future products. This included not only enhancing the performance of individual products, but developing innovative technologies to optimize entire processes, as well as making products more intelligent. Tokyo Electron regards advanced technological prowess as the source of its growth. Accordingly, the Company actively invests in growth to produce next-generation products, mainly focusing on fields in which market growth is forecast. In the fiscal year under review, Tokyo Electron increased its market share in key fields related to cutting-edge DRAM and 3D NAND
flash memory production, making progress toward the goals of the medium-term management plan. In FPD production equipment, Tokyo Electron devel-oped a new version of the PICP™ plasma etch system for generation 10.5 panels, which are expected to see rapid market growth. This system excels in uniformity and was originally released for small- and medium-sized panels. In addition, the Company released a high- resolution inkjet printing system for small- and medium-sized panels amid growing demand for higher definition OLED displays.
Other Income (Expenses) and Net Income Attributable to Owners of ParentDuring fiscal 2019, net other expenses came to ¥0.1 bil-lion (digits below ¥0.1 billion are truncated), reflecting ¥1.0 billion in extraordinary loss due mainly to a loss on sales and disposal of property, plant and equipment, as well as net unrealized losses on investment securities, offsetting ¥0.8 billion in extraordinary income due to a gain on sales of investment securities and property, plant and equipment. Income before income taxes came to ¥321.5 billion, up 16.8% year on year. As a result, net income attributable to owners of the parent totaled ¥248.2 billion in fiscal 2019, up 21.5% from fiscal 2018. Net income per share (basic) rose 21.5% year on year to ¥1,513.58.
Comprehensive IncomeIn fiscal 2019, Tokyo Electron recognized comprehensive income of ¥242.6 billion, up from ¥206.1 billion in fiscal 2018. This was mainly due to the ¥248.2 billion in net income, ¥4.1 billion in unrealized loss on investment
securities related to strategically held shares, ¥0.2 billion in net deferred loss on hedging instruments, and ¥1.1 bil-lion in loss on foreign currency translation adjustments.
Dividend Policy and DividendsIt is the policy of Tokyo Electron to pay dividends on the basis of business performance. The Company aims for a payout ratio of 50% of net income attributable to owners of the parent. Furthermore, with an eye to ensuring stable dividends, a lower limit of ¥150 per share has been set on annual dividends.1 Reflecting the Company’s strong sales and profit growth, Tokyo Electron paid annual dividends for fiscal 2019 of ¥758 per share (for a payout ratio of 50.1%), its highest ever. Going forward, the Company will seek to build world-class profitability and reciprocate the support of share-holders by delivering profit growth.
1 This lower limit may be revised in the event that the Company does not gen-erate net income for two consecutive fiscal years.
Financial Position and Cash Flows
Assets, Liabilities and Net AssetsM AssetsCurrent assets increased ¥36.2 billion from the end of the previous fiscal year to ¥982.8 billion, reflecting a ¥25.2 billion decrease in cash and cash equivalents and ¥44.0 billion increase in short-term investments. The turnover period for trade notes and accounts receivable in fiscal 2019 was 42 days, compared with 52 days in fis-cal 2018, and the inventory turnover period in fiscal 2019 was 101 days, compared with 111 days in fiscal 2018.
Millions of yen
Sales and Income 2015 2016 2017 2018 2019
Net sales ¥613,125 ¥663,949 ¥799,719 ¥1,130,728 ¥1,278,240
Gross profit 242,774 267,210 322,291 475,032 526,183
Gross profit margin 39.6% 40.2% 40.3% 42.0% 41.2%
Selling, general and administrative expenses 154,661 150,421 166,594 193,860 215,612
Operating income 88,113 116,789 155,697 281,172 310,571
Operating margin 14.4% 17.6% 19.5% 24.9% 24.3%
Income before income taxes 86,828 106,467 149,116 275,242 321,508
Net income attributable to owners of parent 71,888 77,892 115,208 204,371 248,228
0
160
320 28
14
240 21
80 7
0
(Billions of yen)
� Operating Income� Operating Margin
(%)
Operating Income andOperating Margin
0
70
280 32
8
140 16
210 24
0
(Billions of yen)
� Net Income A�ributable to Owners of Parent� ROE
(%)
Net Income A ributable to Owners of Parent and ROE
0
1,200
1,600 44
33
400 11
800 22
0
(Billions of yen)
� Net Sales� Gross Profit Margin
(%)
15 16 17 18 19 15 16 17 18 19 15 16 17 18 19
Net Sales and Gross Profit Margin
ROE = Net income a�ributable to owners of parent / Average total equity x 100
613.1663.9
799.7
1,278.2 24.3
39.6 40.2 40.3 41.242.0
281.1
24.9
204.3
29.0
88.1
116.8
155.614.4
17.6
19.5
71.9 77.9
115.211.813.0
19.1
1,130.7
310.5
248.2
30.1
Financial SectionInvestor Information
Financial Review
PAGE 13TOKYO ELECTRON ANNUAL REPORT 2019

Financial Review
0
30
60
90
120(Billions of yen)
R&D Expenses
0
200
400
600
800(Yen)
Cash Dividends per Share
0 0
60
120
180
240 40
30
20
10
(Billions of yen)
� Selling, General and Administrative Expenses� Ratio to Net Sales
(%)
15 16 17 18 19 15 16 17 18 19 15 16 17 18 19
Selling, General and Administrative Expenses and Ratio to Net Sales
25.222.6
20.8
154.7 150.4166.5
71.376.3
83.8
215.6113.9 758
97.1624
16.9
193.8
17.1
143
237
352
Net property, plant and equipment increased ¥24.1 billion year on year to ¥150.0 billion. This was largely due to finishing construction of a new development building at the Miyagi Plant to bolster the development of next-generation technologies, beginning construc-tion of new production buildings at the Yamanashi and Tohoku plants, and acquiring new evaluation tools. Investments and other assets decreased ¥5.5 billion year on year to ¥124.6 billion. This reflected a ¥6.8 billion year-on-year decrease in intangible assets to ¥9.0 billion, due primarily to depreciation and amortization, as well as the removal of TEL NEXX, Inc. from the scope of consoli-dation. As a result, total assets as of March 31, 2019 stood at ¥1,257.6 billion, up ¥54.8 billion year on year.
M Liabilities and Net AssetsCurrent liabilities decreased ¥63.5 billion from the end of fiscal 2018 to ¥304.8 billion at the end of fiscal 2019. This was mainly due to a ¥33.1 billion decrease in trade notes and accounts payable and a ¥22.9 billion decrease in customer advances.
Non-current liabilities increased ¥1.7 billion year on year to ¥64.6 billion. Net assets came to ¥888.1 billion at the end of fiscal 2019, up ¥116.6 billion from the end of fiscal 2018. This was mainly due to a ¥123.4 billion increase in retained earnings, reflecting the recording of ¥248.2 billion in net income attributable to owners of the parent and ¥124.7 billion paid in cash dividends (¥56.9 billion for the fiscal 2018 year-end dividend and ¥67.8 billion for the fiscal 2019 interim dividend). As a result, the equity ratio rose 6.2 percentage points year on year to 70.0% at the end of March 2019. ROE climbed to 30.1% from 29.0% in fiscal 2018. In addition, Tokyo Electron adopted Partial Amendments to Accounting Standard for Tax Effect Accounting (ASBJ Statement No. 28, February 16, 2018) from April 1, 2018. Prior year comparisons retroactively apply these standards to the abovementioned figures for assets, liabilities and net assets as of March 31, 2018.
0
10
40
50
20
30
(Billions of yen)
� Capital Expenditures� Depreciation and Amortization
Capital Expenditures andDepreciation and Amortization
0
300
400
100
200
(Billions of yen)
Cash on Hand = Cash and cash equivalents +Short-term investments with original maturities of less than one year
Cash on Hand
0
80
120
160
40
(Days)
15 16 17 18 19 15 16 17 18 19 15 16 17 18 19
Receivable Turnover andInventory Turnover
� Receivable Turnover� Inventory Turnover
105 107 108
66 64 61 13.2
20.9
13.3
19.320.6
111
52
101
42
17.8
317.7
236.7
315.3
373.845.6
20.6
49.7
24.3
392.6
Capital Expenditures1 and Depreciation and Amortization2
Capital expenditures totaled ¥49.7 billion in fiscal 2019, a 9.1% year-on-year increase. Major expenditures included the acquisition of evaluation tools in order to strengthen key areas in the SPE business as well as the completion of construction of a new development building at the Miyagi Plant and start of construction of new production buildings at the Tohoku and Yamanashi plants to meet rising demand for etch and deposition equipment. Depreciation and amortization increased 18.0% to ¥24.3 billion.
1 Capital expenditures represent only the gross increase in property, plant and equipment.
2 Depreciation and amortization does not include amortization of goodwill or losses on impairment.
Cash FlowsThe balance of cash and cash equivalents at the end of March 2019 stood at ¥232.6 billion, a decrease of ¥25.2 billion from the end of fiscal 2018. Cash on hand, which consists of cash and cash equivalents as well as short-term investments with original maturities of less than
one year not included in cash and cash equivalents, increased ¥18.7 billion year on year to ¥392.6 billion at the end of March 2019. Cash flows during the fiscal year under review were as follows. Net cash provided by operating activities came to ¥189.5 billion, up ¥2.9 billion from fiscal 2018. Major contributors were ¥321.5 billion in income before income taxes, ¥24.3 billion in depreciation and amorti-zation, and a ¥10.5 billion decrease in trade notes and accounts receivable. Major outflows included ¥102.9 billion in income taxes paid, a ¥31.7 billion decrease in trade notes and accounts payable, a ¥22.0 billion decrease in customer advances, and a ¥14.7 billion increase in inventories. Net cash used in investing activities was ¥84.0 bil-lion, compared with ¥11.8 billion used in the previous fiscal year. This was mainly due to ¥46.5 billion used as payment for purchases of property, plant and equip-ment and a net outflow of ¥44.0 billion due to an increase in short-term investments. Net cash used in financing activities came to ¥129.7 bil-lion, compared with ¥82.5 billion in fiscal 2018. This was mainly attributable to ¥124.7 billion in dividends paid.Millions of yen
Financial Position 2015 2016 2017 2018 2019
Total current assets ¥670,883 ¥617,416 ¥775,938 ¥ 946,597 ¥ 982,897
Net property, plant and equipment 106,896 96,317 100,441 125,952 150,069
Total investments and other assets 98,375 79,635 81,067 130,246 124,661
Total assets 876,154 793,368 957,447 1,202,796 1,257,627
Total current liabilities 172,812 166,061 247,770 368,452 304,882
Total liabilities 234,991 229,129 311,447 431,287 369,510
Total net assets 641,163 564,239 645,999 771,509 888,117
Millions of yen
Cash Flows 2015 2016 2017 2018 2019
Cash flows from operating activities ¥ 71,806 ¥ 69,398 ¥136,948 ¥186,582 ¥189,572
Cash flows from investing activities 155,738 (150,014) (28,893) (11,833) (84,033)
Cash flows from financing activities (18,214) (138,601) (39,380) (82,549) (129,761)
Cash and cash equivalents at end of year 317,632 95,638 164,366 257,877 232,634
Note: From fiscal 2019, the Company applied the Accounting Standards Board of Japan’s “Partial Amendments to Accounting Standard for Tax Effect Accounting” (ASBJ Statement No. 28, revised on February 16, 2018). Total current assets, total investments and other assets, total assets and total liabilities for fiscal 2018 have been restated in accordance with the revised accounting standard.
Financial SectionInvestor Information
Financial Review
PAGE 14TOKYO ELECTRON ANNUAL REPORT 2019
Financial Review
Business-Related and Other Risks
The following risks may have a material impact on Tokyo Electron’s business performance, stock price, or financial position.
(1) Impact from Changes in the Semiconductor Market
Tokyo Electron has achieved a high profit margin by concentrating resources in high-tech fields, including semiconductor production equipment, where techno-logical innovation is rapid but Tokyo Electron can effectively use its strengths. Although technological change is responsible for the semiconductor market’s rapid growth, Tokyo Electron has actively undertaken structural reforms to be able to generate profits under any circumstances, including when the market con-tracts temporarily due to imbalance of supply and demand. However, order cancellations, excess capacity and personnel and increased inventories resulting from an unexpectedly large market contraction, losses from bad debts resulting from the worsening of a custom-er’s financial position, and supply shortages resulting from the worsening of a supplier’s management situa-tion, could adversely affect Tokyo Electron’s business performance considerably.
(2) Impact from Concentration of Transactions on Particular Customers
Tokyo Electron has been successful at increasing trans-actions with the leading semiconductor manufacturers worldwide, including those in Japan, through the provi-sion of products featuring outstanding, cutting-edge technology and of services offering a high level of cus-tomer satisfaction. However, Tokyo Electron’s sales may from time to time be temporarily concentrated on par-ticular customers due to the timing of large capital investments of major semiconductor manufacturers. The resulting escalation in sales competition could adversely affect Tokyo Electron’s business performance.
(3) Impact from Research and DevelopmentThrough ongoing and proactive R&D investment and activities in cutting-edge technologies—miniaturiza-tion, vacuum, plasma, thermal processing, coating/developing, cleaning, wafer-transfer and clean technol-ogies—Tokyo Electron has created advanced technol-ogies. At the same time, by quickly bringing to market new products incorporating these technologies, Tokyo Electron has successfully captured a high market share in each of the product fields it has entered and gener-ated a high profit margin. However, delays in the launch of new products and other factors could adversely affect Tokyo Electron’s business performance.
(4) Safety-Related ImpactTokyo Electron’s basic philosophy is to always bear in mind safety and health in the execution of business activities, including development, manufacturing, sales, services and management. In accordance with this phi-losophy, Tokyo Electron works actively and continu-ously to improve the safety of its products and to eliminate any harmful impact on health. However, harm to customers, order cancellations or other cir-cumstances resulting from safety or other problems related to Tokyo Electron’s products could adversely affect Tokyo Electron’s business performance.
(5) Impact from Quality IssuesTokyo Electron actively develops outstanding, cutting-edge technologies for incorporation in new products that are brought quickly to market. At the same time, Tokyo Electron works to establish a quality assurance system, efforts that include obtaining ISO 9001 certifi-cation, as well as to establish a world-class service sys-tem. These actions have resulted in a large number of customers adopting Tokyo Electron’s products. However, because Tokyo Electron’s products are based on cutting-edge technologies, and due to other factors, many of the technologies developed are in unfamiliar fields. The occurrence of unforeseen defects or other issues could adversely affect Tokyo Electron’s business performance.
(6) Impact of Intellectual Property RightsIn order to distinguish its products and make them more competitive, Tokyo Electron has promoted its R&D strategy for the early development of cutting-edge technologies together with its business and intel-lectual property strategies. This approach has enabled Tokyo Electron to obtain sole possession of many pro-prietary technologies that have been instrumental to the Company’s ability to capture a high market share and generate high profit margins in each of its product fields. Tokyo Electron’s products incorporate and opti-mize many of these proprietary cutting-edge technol-ogies. There may be cases in which, by avoiding the use of third-party technologies and intellectual property rights, Tokyo Electron’s business performance could be adversely affected.
(7) Impact of Fluctuating Foreign Exchange RatesSuccess in the development of overseas operations has increased the share of sales generated overseas. As a rule, Tokyo Electron conducts export transactions on a yen basis to avert exposure to foreign currency risks. However, some exports are denominated in foreign currencies. In these cases, Tokyo Electron hedges for-eign currency risk by using a forward foreign exchange contract when an order is received or by other means. However, foreign exchange rate risks can arise from fluctuations in prices due to sudden foreign exchange movements, which could have an indirect adverse effect on Tokyo Electron’s business performance.
(8) Influence of Corporate AcquisitionsAs part of its business strategy, Tokyo Electron con-ducts corporate acquisitions in order to expand into new business areas, secure new technologies and busi-ness platforms, and strengthen the competitiveness of existing businesses. The Company conducts due dili-gence and carefully deliberates each specific acquisi-tion. However, in the event that the results following an acquisition do not meet expectations, Tokyo Electron’s business performance could be adversely affected.
(9) Impact from Major Lawsuits or Legal ActionsTokyo Electron is not currently involved in any lawsuits or other legal actions that are likely to significantly influence its business results. However, in the event that the Company’s business or other activities become the subject of a major lawsuit or other legal action, depending on the outcome of such action, Tokyo Electron’s business results could be adversely affected.
(10) Impact of Laws and RegulationsTokyo Electron operates globally and is therefore sub-ject to and strives to ensure compliance with the laws and regulations of the countries and regions where it does business, including import and export regulations, environmental regulations and transfer pricing rules. However, should the Company be unable to respond adequately to unforeseen tightening or other changes to such laws or regulations, such changes could adversely affect Tokyo Electron’s business performance.
(11) Other RisksTokyo Electron is actively engaged in reforming its cor-porate structure so that it can generate profits even when markets contract. These reforms have entailed creating new high-growth and high-return businesses and pursuing higher earnings from existing businesses. At the same time, Tokyo Electron has promoted activi-ties to preserve the environment and worked to restructure its compliance, risk management and infor-mation security management systems. However, as long as it conducts business activities, as with peer companies or companies in different industries, Tokyo Electron is subject to the effect of many other factors. These include the world and regional economic envi-ronments, natural disasters, war, terrorism, infectious diseases and other unavoidable occurrences, financial or stock markets, government or other regulations, supply chains, market conditions for products and real estate, the ability to recruit personnel in Japan and overseas, competition over standardization, and loss of key personnel. Any of these factors could adversely affect Tokyo Electron’s business performance.
Financial SectionInvestor Information
Financial Review
PAGE 15TOKYO ELECTRON ANNUAL REPORT 2019

Consolidated Eleven-Year SummaryTokyo Electron Limited and SubsidiariesAs of and for the years ended March 31
Thousands of U.S. dollars Millions of yen
2019 2019 2018 2017 2016 2015 2014 2013 2012 2011 2010 2009
Net sales 1 $11,516,718 ¥1,278,240 ¥1,130,728 ¥799,719 ¥663,949 ¥613,125 ¥612,170 ¥ 497,300 ¥ 633,091 ¥ 668,722 ¥ 418,637 ¥ 508,082 Semiconductor production equipment 10,512,487 1,166,781 1,055,234 749,893 613,033 576,242 478,842 392,027 477,873 511,332 262,392 325,383 FPD production equipment 1,002,449 111,261 75,068 49,387 44,687 32,710 28,317 20,077 69,889 66,721 71,361 88,107 PV production equipment — — — — — 3,618 3,806 83 — — — — Electronic components and computer networks — — — — — — 100,726 84,665 84,868 90,216 84,473 94,207 Other 1,780 197 425 438 6,229 555 479 448 461 453 411 385Operating income (loss) 2,798,191 310,571 281,172 155,697 116,789 88,113 32,205 12,549 60,443 97,870 (2,181) 14,711Income (loss) before income taxes 2,896,735 321,508 275,242 149,116 106,467 86,828 (11,756) 17,767 60,602 99,579 (7,768) 9,637Net income (loss) attributable to owners of parent 2,236,489 248,228 204,371 115,208 77,892 71,888 (19,409) 6,076 36,726 71,924 (9,033) 7,543Comprehensive income (loss) 2 2,186,648 242,696 206,152 119,998 60,984 80,295 (10,889) 15,826 36,954 69,598 (4,751) —
Domestic sales 1,881,220 208,796 148,760 101,122 121,808 95,046 161,631 118,504 171,364 182,165 162,609 208,871Overseas sales 9,635,497 1,069,443 981,967 698,597 542,141 518,079 450,539 378,796 461,727 486,557 256,028 299,211
Depreciation and amortization 3 219,151 24,323 20,619 17,872 19,257 20,878 24,888 26,631 24,198 17,707 20,002 23,068Capital expenditures 4 448,277 49,754 45,603 20,697 13,341 13,184 12,799 21,774 39,541 39,140 14,919 18,108R&D expenses 1,026,946 113,980 97,103 83,800 76,287 71,350 78,664 73,249 81,506 70,568 54,074 60,988
Total assets 7 11,330,999 1,257,627 1,202,796 957,447 793,368 876,154 828,592 775,528 783,611 809,205 696,352 668,998Total net assets 8,001,777 888,117 771,509 645,999 564,239 641,163 590,614 605,127 598,603 584,802 523,370 529,265
Number of employees 12,742 11,946 11,241 10,629 10,844 12,304 12,201 10,684 10,343 10,068 10,391U.S. dollars Yen
Net income (loss) per share of common stock:
Basic $ 13.64 ¥ 1,513.58 ¥ 1,245.48 ¥ 702.26 ¥ 461.10 ¥ 401.08 ¥ (108.31) ¥ 33.91 ¥ 205.04 ¥ 401.73 ¥ (50.47) ¥ 42.15 Diluted 5 13.58 1,507.22 1,241.22 700.35 460.00 400.15 — 33.85 204.72 401.10 — 42.07Net assets per share of common stock 48.40 5,371.78 4,674.49 3,919.50 3,428.37 3,567.23 3,225.92 3,309.58 3,275.14 3,198.66 2,859.37 2,896.55Cash dividends per share of common stock 6.83 758.00 624.00 352.00 237.00 143.00 50.00 51.00 80.00 114.00 12.00 24.00Number of shares outstanding (thousands) 165,210 165,210 165,210 165,211 180,611 180,611 180,611 180,611 180,611 180,611 180,611Number of shareholders 50,843 35,186 21,937 24,664 20,829 30,563 41,287 42,414 44,896 39,285 42,509
%
ROE 30.1 29.0 19.1 13.0 11.8 (3.3) 1.0 6.3 13.3 (1.8) 1.4Operating margin 24.3 24.9 19.5 17.6 14.4 5.3 2.5 9.5 14.6 (0.5) 2.9Equity ratio 7 70.0 63.8 67.2 70.9 73.0 69.8 76.5 74.9 70.8 73.5 77.5Total asset turnover (times) 7 1.04 1.05 0.91 0.80 0.72 0.76 0.64 0.79 0.89 0.61 0.70
U.S. dollars Thousands of yen
Net sales per employee $ 903,839 ¥ 100,317 ¥ 94,653 ¥ 71,143 ¥ 62,466 ¥ 56,540 ¥ 49,754 ¥ 40,759 ¥ 59,256 ¥ 64,655 ¥ 41,581 ¥ 48,896
1 From fiscal 2015, Electronic components and computer networks was excluded because Tokyo Electron Device Limited, a former consolidated subsidiary, became an equity method affiliate. Photovoltaic panel (PV) production equipment was included in FPD production equipment until fiscal 2012 but from fiscal 2016, it has been included in Other.2 From fiscal 2011, the Company applied “Accounting Standards for Presentation of Comprehensive Income” (Statement No. 25) released by the Accounting Standards Board of Japan (ASBJ). Accordingly, comprehensive income (loss) has been disclosed from fiscal 2010.3 Depreciation and amortization does not include amortization and loss on impairment of goodwill.4 Capital expenditures only represent the gross increase in property, plant and equipment.5 From fiscal 2011, the Company calculated net income per share of common stock (diluted) in accordance with “Accounting Standard for Earning Per Share” (Statement No. 2) and “Guidance on Accounting Standard for Earnings Per Share” (Guidance No. 4) released by the ASBJ. Dilution is not assumed for the years ended March 31, 2014 and 2010.6 The amounts in this summary in millions and thousands of yen; thousands of U.S. dollars; and thousands of shares as of and for the years ended March 31, 2016 and prior are rounded to the nearest unit. Such amounts as of and for the years ended March 31, 2017 and onward are truncated at the nearest unit. Accordingly, totals for the years ended
March 31, 2017 and onward do not necessarily agree with the sum of the corresponding individual amounts.7 From fiscal 2019, the Company applied “Partial Amendments to Accounting Standard for Tax Effect Accounting” (Statement No. 28, revised on February 16, 2018) released by the ASBJ. Accordingly, total assets, equity ratio and total asset turnover for fiscal 2018 have been restated.
Financial SectionInvestor Information
Consolidated Eleven-Year Summary
PAGE 16TOKYO ELECTRON ANNUAL REPORT 2019

Consolidated Balance SheetsTokyo Electron Limited and Subsidiaries As of March 31, 2019 and 2018
Millions of yenThousands of
U.S. dollars
LIABILITIES AND NET ASSETS 2019 2018 2019
Current liabilities:
Trade notes and accounts payable ¥ 75,448 ¥ 108,607 $ 679,780
Income taxes payable 57,671 66,046 519,605
Customer advances 77,247 100,208 695,990
Accrued employees’ bonuses 33,139 34,467 298,584
Accrued warranty expenses 14,097 11,284 127,012
Other current liabilities 47,277 47,837 425,961
Total current liabilities 304,882 368,452 2,746,935
Non-current liabilities:
Net defined benefit liabilities 60,975 59,684 549,382
Other liabilities 3,652 3,150 32,904
Total non-current liabilities 64,628 62,834 582,287
Total liabilities 369,510 431,287 3,329,222
Net assets:
Shareholders’ equity
Common stock Authorized: 300,000,000 shares
Issued: 165,210,911 and 165,210,911 shares as of March 31, 2019 and 2018, respectively
54,961 54,961 495,190
Capital surplus 78,011 78,011 702,865
Retained earnings 748,827 625,390 6,746,800
Treasury stock, at cost 1,252,517 and 1,097,342 shares
as of March 31, 2019 and 2018, respectively
(11,821) (7,518) (106,513)
Accumulated other comprehensive income
Net unrealized gains on investment securities 13,024 17,134 117,346
Net deferred gains (losses) on hedging instruments (34) 278 (314)
Foreign currency translation adjustments 4,366 5,507 39,339
Accumulated remeasurements of defined benefit plans (6,585) (6,618) (59,330)
Share subscription rights 7,368 4,363 66,391
Total net assets 888,117 771,509 8,001,777
Total liabilities and net assets ¥1,257,627 ¥1,202,796 $11,330,999
Millions of yenThousands of
U.S. dollars
ASSETS 2019 2018 2019
Current assets:
Cash and cash equivalents ¥ 232,634 ¥ 257,877 $ 2,095,997
Short-term investments 160,000 116,000 1,441,571
Trade notes and accounts receivable 146,971 159,570 1,324,185
Allowance for doubtful accounts (84) (59) (765)
Inventories 354,219 344,071 3,191,455
Other current assets 89,156 69,137 803,281
Total current assets 982,897 946,597 8,855,726
Property, plant and equipment:
Land 26,849 28,030 241,907
Buildings 169,682 159,474 1,528,805
Machinery and equipment 153,830 138,932 1,385,980
Construction in progress 19,643 11,060 176,988
Total property, plant and equipment 370,005 337,498 3,333,682
Less: Accumulated depreciation 219,936 211,546 1,981,587
Net property, plant and equipment 150,069 125,952 1,352,094
Investments and other assets:
Investment securities 27,853 33,128 250,950
Deferred tax assets 63,925 62,442 575,959
Net defined benefit assets 3,065 — 27,618
Intangible assets 9,054 15,882 81,578
Other assets 22,189 20,215 199,921
Allowance for doubtful accounts (1,426) (1,422) (12,850)
Total investments and other assets 124,661 130,246 1,123,178
Total assets ¥1,257,627 ¥1,202,796 $11,330,999
See accompanying Notes to Consolidated Financial Statements.
Financial SectionInvestor Information
Consolidated Balance Sheets
PAGE 17TOKYO ELECTRON ANNUAL REPORT 2019

Millions of yenThousands of
U.S. dollars
2019 2018 2019
Net sales ¥1,278,240 ¥1,130,728 $11,516,718
Cost of sales 752,057 655,695 6,775,900
Gross profit 526,183 475,032 4,740,817
Selling, general and administrative expenses 215,612 193,860 1,942,626
Operating income 310,571 281,172 2,798,191
Other income (expenses):
Interest and dividend income 2,573 859 23,188
Share of profit of associates accounted for using the equity method 817 571 7,361
Insurance dividend income 378 334 3,410
Foreign exchange gain (loss), net 3,623 (2,897) 32,647
Gain on sales of property, plant and equipment 101 77 916
Gain on sales of investment securities 768 — 6,927
Maintenance and operation costs of closed facilities (57) (71) (513)
Loss on sales and disposal of property, plant and equipment (967) (487) (8,719)
Loss on impairment of property, plant and equipment, goodwill and other assets — (925) —
Loss on revision of retirement benefit plan — (3,154) —
Other, net 3,698 (236) 33,324
Income before income taxes 321,508 275,242 2,896,735
Income taxes:
Current 72,478 83,434 653,022
Deferred 801 (12,591) 7,223
Net income 248,228 204,399 2,236,489
Net income attributable to non-controlling interests — 28 —
Net income attributable to owners of parent ¥ 248,228 ¥ 204,371 $ 2,236,489
Yen U.S. dollars
Per share of common stock:
Net income — basic ¥1,513.58 ¥1,245.48 $13.64
Net income — diluted 1,507.22 1,241.22 13.58
Net assets 5,371.78 4,674.49 48.40
Cash dividends 758.00 624.00 6.83
See accompanying Notes to Consolidated Financial Statements.
Consolidated Statements of IncomeTokyo Electron Limited and Subsidiaries Years ended March 31, 2019 and 2018
Millions of yenThousands of
U.S. dollars
2019 2018 2019
Net income ¥248,228 ¥204,399 $2,236,489
Other comprehensive income (loss):
Net unrealized gains (losses) on investment securities (4,102) 6,337 (36,962)
Net deferred gains (losses) on hedging instruments (272) 198 (2,450)
Foreign currency translation adjustments (1,170) (242) (10,548)
Remeasurements of defined benefit plans (106) (4,494) (957)
Share of other comprehensive income of associates accounted for using the equity method 119 (46) 1,077
Total other comprehensive income (loss) (5,531) 1,752 (49,841)
Comprehensive income 242,696 206,152 2,186,648
Total comprehensive income attributable to:
Owners of parent 242,696 206,122 2,186,648
Non-controlling interests — 29 —
See accompanying Notes to Consolidated Financial Statements.
Consolidated Statements of Comprehensive IncomeTokyo Electron Limited and Subsidiaries Years ended March 31, 2019 and 2018
Financial SectionInvestor Information
Consolidated Statements of Income Consolidated Statements of Comprehensive Income
PAGE 18TOKYO ELECTRON ANNUAL REPORT 2019
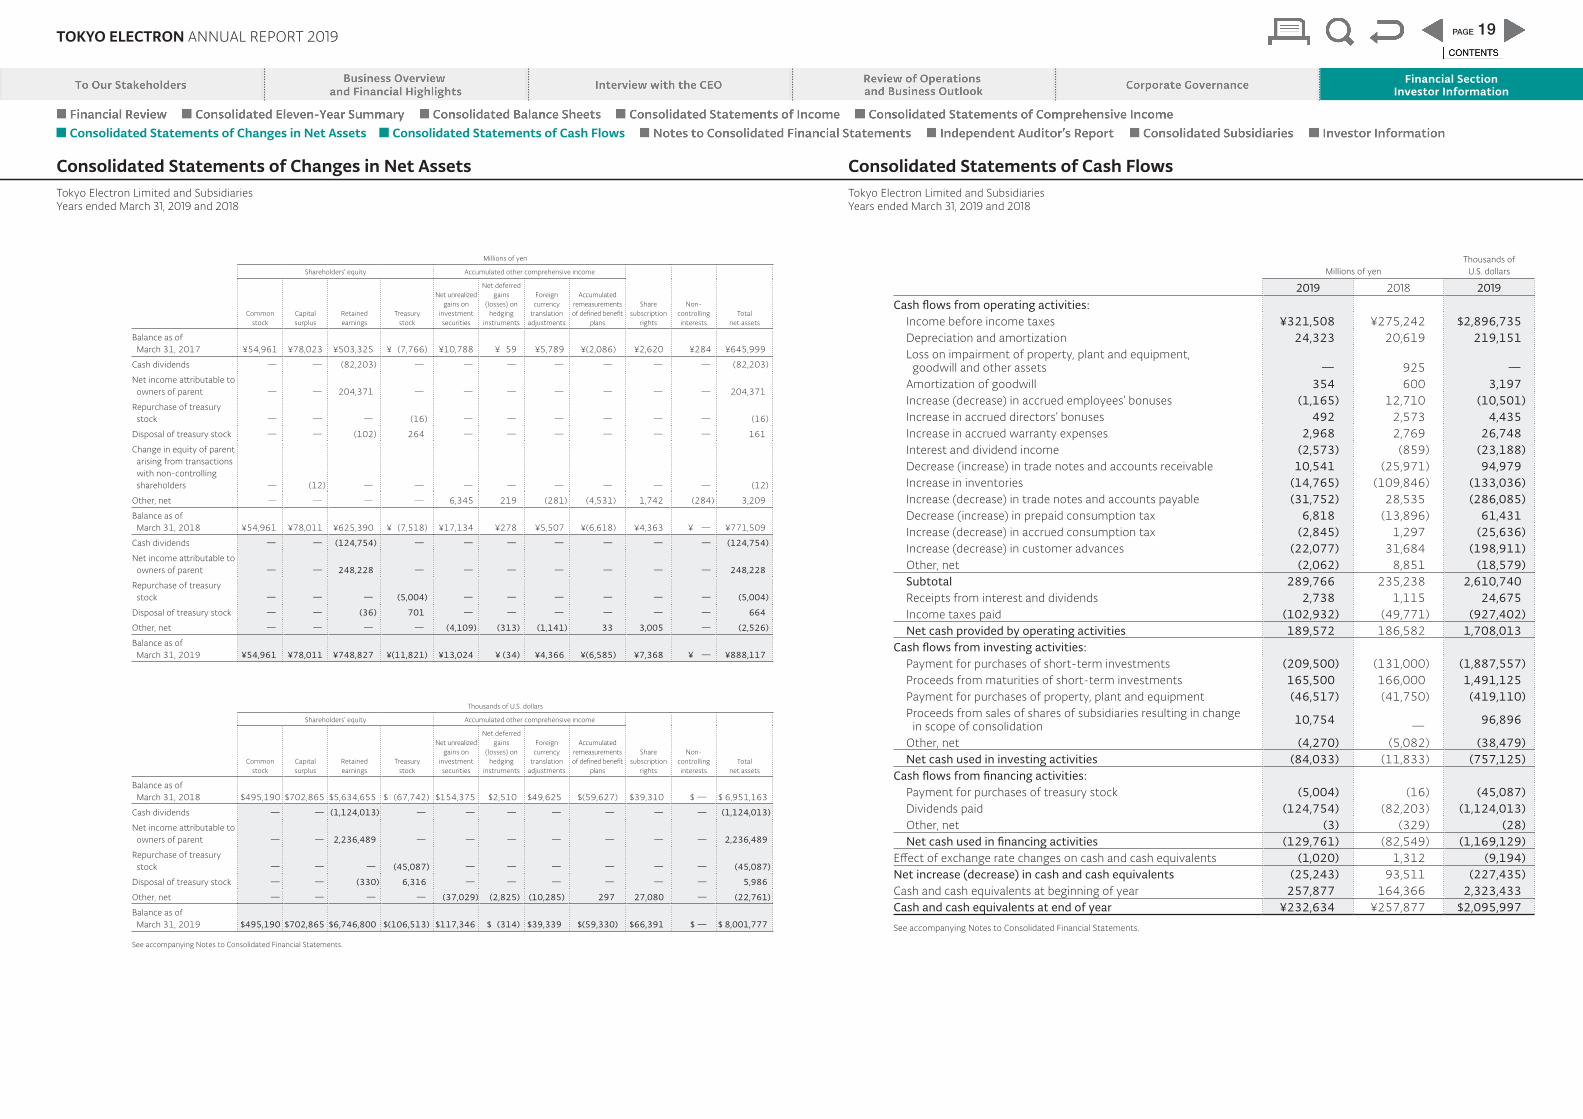
Millions of yen
Shareholders’ equity Accumulated other comprehensive income
Common stock
Capital surplus
Retained earnings
Treasury stock
Net unrealized gains on
investment securities
Net deferred gains
(losses) on hedging
instruments
Foreign currency
translation adjustments
Accumulated remeasurements of defined benefit
plans
Share subscription
rights
Non-controlling interests
Total net assets
Balance as of March 31, 2017 ¥54,961 ¥78,023 ¥503,325 ¥ (7,766) ¥10,788 ¥ 59 ¥5,789 ¥(2,086) ¥2,620 ¥284 ¥645,999
Cash dividends — — (82,203) — — — — — — — (82,203)
Net income attributable to owners of parent — — 204,371 — — — — — — — 204,371
Repurchase of treasury stock — — — (16) — — — — — — (16)
Disposal of treasury stock — — (102) 264 — — — — — — 161
Change in equity of parent arising from transactions
with non-controlling shareholders — (12) — — — — — — — — (12)
Other, net — — — — 6,345 219 (281) (4,531) 1,742 (284) 3,209
Balance as of March 31, 2018 ¥54,961 ¥78,011 ¥625,390 ¥ (7,518) ¥17,134 ¥278 ¥5,507 ¥(6,618) ¥4,363 ¥ — ¥771,509
Cash dividends — — (124,754) — — — — — — — (124,754)
Net income attributable to owners of parent — — 248,228 — — — — — — — 248,228
Repurchase of treasury stock — — — (5,004) — — — — — — (5,004)
Disposal of treasury stock — — (36) 701 — — — — — — 664
Other, net — — — — (4,109) (313) (1,141) 33 3,005 — (2,526)
Balance as of March 31, 2019 ¥54,961 ¥78,011 ¥748,827 ¥(11,821) ¥13,024 ¥ (34) ¥4,366 ¥(6,585) ¥7,368 ¥ — ¥888,117
Thousands of U.S. dollars
Shareholders’ equity Accumulated other comprehensive income
Common stock
Capital surplus
Retained earnings
Treasury stock
Net unrealized gains on
investment securities
Net deferred gains
(losses) on hedging
instruments
Foreign currency
translation adjustments
Accumulated remeasurements of defined benefit
plans
Share subscription
rights
Non-controlling interests
Total net assets
Balance as of March 31, 2018 $495,190 $702,865 $5,634,655 $ (67,742) $154,375 $2,510 $49,625 $(59,627) $39,310 $ — $ 6,951,163
Cash dividends — — (1,124,013) — — — — — — — (1,124,013)
Net income attributable to owners of parent — — 2,236,489 — — — — — — — 2,236,489
Repurchase of treasury stock — — — (45,087) — — — — — — (45,087)
Disposal of treasury stock — — (330) 6,316 — — — — — — 5,986
Other, net — — — — (37,029) (2,825) (10,285) 297 27,080 — (22,761)
Balance as of March 31, 2019 $495,190 $702,865 $6,746,800 $(106,513) $117,346 $ (314) $39,339 $(59,330) $66,391 $ — $ 8,001,777
See accompanying Notes to Consolidated Financial Statements.
Consolidated Statements of Changes in Net AssetsTokyo Electron Limited and Subsidiaries Years ended March 31, 2019 and 2018
Millions of yenThousands of
U.S. dollars
2019 2018 2019Cash flows from operating activities: Income before income taxes ¥321,508 ¥275,242 $2,896,735 Depreciation and amortization 24,323 20,619 219,151 Loss on impairment of property, plant and equipment,
goodwill and other assets — 925 — Amortization of goodwill 354 600 3,197 Increase (decrease) in accrued employees’ bonuses (1,165) 12,710 (10,501) Increase in accrued directors’ bonuses 492 2,573 4,435 Increase in accrued warranty expenses 2,968 2,769 26,748 Interest and dividend income (2,573) (859) (23,188) Decrease (increase) in trade notes and accounts receivable 10,541 (25,971) 94,979 Increase in inventories (14,765) (109,846) (133,036) Increase (decrease) in trade notes and accounts payable (31,752) 28,535 (286,085) Decrease (increase) in prepaid consumption tax 6,818 (13,896) 61,431 Increase (decrease) in accrued consumption tax (2,845) 1,297 (25,636) Increase (decrease) in customer advances (22,077) 31,684 (198,911) Other, net (2,062) 8,851 (18,579) Subtotal 289,766 235,238 2,610,740 Receipts from interest and dividends 2,738 1,115 24,675 Income taxes paid (102,932) (49,771) (927,402) Net cash provided by operating activities 189,572 186,582 1,708,013 Cash flows from investing activities: Payment for purchases of short-term investments (209,500) (131,000) (1,887,557) Proceeds from maturities of short-term investments 165,500 166,000 1,491,125 Payment for purchases of property, plant and equipment (46,517) (41,750) (419,110) Proceeds from sales of shares of subsidiaries resulting in change
in scope of consolidation 10,754 — 96,896
Other, net (4,270) (5,082) (38,479) Net cash used in investing activities (84,033) (11,833) (757,125)Cash flows from financing activities: Payment for purchases of treasury stock (5,004) (16) (45,087) Dividends paid (124,754) (82,203) (1,124,013) Other, net (3) (329) (28) Net cash used in financing activities (129,761) (82,549) (1,169,129)Effect of exchange rate changes on cash and cash equivalents (1,020) 1,312 (9,194)Net increase (decrease) in cash and cash equivalents (25,243) 93,511 (227,435)Cash and cash equivalents at beginning of year 257,877 164,366 2,323,433 Cash and cash equivalents at end of year ¥232,634 ¥257,877 $2,095,997
See accompanying Notes to Consolidated Financial Statements.
Consolidated Statements of Cash FlowsTokyo Electron Limited and Subsidiaries Years ended March 31, 2019 and 2018
Financial SectionInvestor Information
Consolidated Statements of Changes in Net Assets Consolidated Statements of Cash Flows
PAGE 19TOKYO ELECTRON ANNUAL REPORT 2019

Notes to Consolidated Financial StatementsTokyo Electron Limited and SubsidiariesYears ended March 31, 2019 and 2018
1. Basis of Presentation of Consolidated Financial Statements
The accompanying consolidated financial statements of
Tokyo Electron Limited (hereinafter “the Company”) and its
subsidiaries (hereinafter collectively referred to as “Tokyo
Electron”) have been prepared in accordance with the provi-
sions set forth in the Financial Instruments and Exchange Act
of Japan and its related accounting regulations, and in con-
formity with accounting principles generally accepted in
Japan, which are different in certain respects as to application
and disclosure requirements of International Financial
Reporting Standards.
The Company uses financial statements prepared by for-
eign subsidiaries in accordance with International Financial
Reporting Standards or U.S. generally accepted accounting
principles for the preparation of the consolidated financial
statements, together with adjustment for certain items which
are required to be adjusted in the consolidation process.
The accompanying consolidated financial statements have
been restructured and translated into English from the statutory
Japanese language consolidated financial statements. Some
supplementary information included in the statutory Japanese
language consolidated financial statements is not presented in
the accompanying consolidated financial statements.
The amounts in the consolidated financial statements and
associated notes shown in millions and thousands of yen;
thousands of U.S. dollars; and thousands of shares as of and
for the years ended March 31, 2019 and 2018 are truncated at
the nearest unit. Accordingly, totals do not necessarily agree
with the sum of the corresponding individual amounts.
U.S. dollar amounts included herein are solely for the con-
venience of readers and are presented at the rate of ¥110.99
to $1.00, the approximate rate as of March 31, 2019. The
translation should not be construed as a representation that
the Japanese yen amounts shown could be converted into
U.S. dollars at that or any other rate.
2. Summary of Significant Accounting Policies
(a) Principles of consolidation The consolidated financial statements include the
accounts of the Company and its 33 subsidiaries as of March
31, 2019 and 2018. All significant inter-company accounts,
transactions and unrealized profits or losses have been elimi-
nated through consolidation procedures.
There are 9 affiliates accounted for using the equity meth-
od as of March 31, 2019 and 2018.
The fiscal year-end of all entities is March 31, except for 3
consolidated foreign subsidiaries. Financial statements provi-
sionally closed for the period ending March 31 are used for
those subsidiaries.
(b) Foreign currency translation All assets and liabilities denominated in foreign currencies
are translated into Japanese yen at the year-end rates, except
for those hedged by forward exchange contracts, which are
translated at the contracted rates. Resulting exchange gains
and losses are included in earnings for the year.
Revenue and expense items are translated at the rates that
approximate those prevailing at the time of the transactions.
The balance sheet accounts of foreign subsidiaries are
translated into Japanese yen at the rates of exchange in
effect at the balance sheet date, except for shareholders’
equity accounts, which are translated at the historical rates.
Revenue and expense accounts of foreign subsidiaries are
translated at average rates of exchange in effect during the
year. Resulting translation adjustments are presented in net
assets as a component of accumulated other comprehensive
income in the consolidated balance sheets.
(c) Cash and cash equivalents Cash and cash equivalents consist of cash, short term
deposits and low-risk financial instruments with original
maturities of three months or less.
(d) Short-term investments Short-term investments consist of short term deposits
and low-risk financial instruments with original maturities of
more than three months.
(e) Investment securities Tokyo Electron examines the intent of holding each securi-
ty and classifies those securities as trading securities, held-to
maturity debt securities or other securities. Tokyo Electron
has no trading securities as of March 31, 2019 and 2018. Held-
to-maturity debt securities are stated mainly at amortized
cost. Other securities with market prices are valued at fair
value at the balance sheet date. The differences between the
book value and fair value of other securities, net of applicable
income taxes, are presented in net assets as a component of
accumulated other comprehensive income. Other securities
without market prices are valued at cost using the weighted-
average method.
The cost of sold securities is calculated using the weighted
average method.
(f) Inventories Inventories are stated at the lower of cost, determined by
principally the specific identification method, or net realizable
value, which is defined as selling price less estimated addition-
al manufacturing costs and estimated direct selling expenses.
(g) Property, plant and equipment Property, plant and equipment are stated at cost.
Depreciation of buildings, machinery and equipment of the
Company and its domestic subsidiaries is computed using
the declining-balance method, except for buildings acquired
since April 1, 1998 and facilities attached to buildings and
structures acquired since April 1, 2016 which are depreciated
using the straight-line method, based on the estimated use-
ful lives of assets. Foreign subsidiaries mainly apply the
straight-line method over the estimated useful lives of
assets.
Estimated useful lives of property, plant and equipment
are as follows:
Buildings 2 to 60 years
Machinery and equipment 2 to 17 years
(h) Intangible assets (excluding goodwill) Intangible assets are amortized by the straight-line meth-
od over their estimated useful lives.
(i) Goodwill Goodwill is evaluated on an individual basis and amortized by
the straight-line method over a period not exceeding 20 years.
(j) Impairment of fixed assets Tokyo Electron evaluates the carrying value of fixed assets
held for use in the business and idle assets.
If the carrying value of a fixed asset is impaired, a loss is
recognized based on the amount by which the carrying value
exceeds its recoverable amount, being the higher of the net
selling price or the value in use of the assets. Net selling price
is determined using the fair value less disposal costs and
value in use is based on the total amount of discounted cash
flows estimated to be generated from the continuing use of
the individual assets or the asset group and the disposal of
the assets.
(k) Allowance for doubtful accounts The allowance for doubtful accounts is provided at an
amount determined based on the historical experience of
bad debts with respect to ordinary receivables, and an esti-
mate of uncollectible amounts determined by reference to
specific doubtful receivables from customers which are
experiencing financial difficulties.
(l) Employee benefits The Company and its domestic subsidiaries provide
defined benefit plans for their employees. Expected benefits
are attributed to accounting periods by the benefit formula
basis. Prior service costs are charged to earnings on
a straight-line basis, beginning from the fiscal year in which
they are incurred, over a fixed number of years (4 years)
within the average remaining years of service of employees
when the changes occur. Actuarial differences are charged to
earnings on a straight-line basis, beginning from the follow-
ing fiscal year after they are incurred, over a fixed number of
years (4 years) within the average remaining years of service
of employees when the differences occur.
The provision for accrued pension and severance costs for
directors and audit & supervisory board members of the
Company and its domestic subsidiaries is calculated in accor-
dance with internal regulations.
The Company and certain domestic subsidiaries decided to
discontinue the payment of severance pay for directors and
audit & supervisory board members after April 1, 2005, and at
the general shareholders’ meeting in June 2005, it was
resolved that the severance pay for directors and audit &
supervisory board members until March 31, 2005 would be
paid at the termination of their service and the decision
regarding the payment amount for each director and audit &
supervisory board member was delegated to the board of
directors and audit & supervisory board members. The accru-
als for severance costs for directors and audit & supervisory
board members are included in Net defined benefit liabilities
in the consolidated balance sheets.
(m) Accrued warranty expenses Tokyo Electron’s products are generally subject to warranty,
and Tokyo Electron accrues estimated warranty costs when
product revenue is recognized. Estimated after-sale repair
expenses over warranty periods are accrued based on the his-
torical ratio of actual repair expenses to corresponding sales.
(n) Derivatives and hedge accounting The Company and certain subsidiaries make use of deriva-
tives in order to manage certain risks arising from adverse
fluctuations in foreign currency exchange rates. The amount
of derivatives is limited to the extent of foreign currency
assets, liabilities and actual orders, and Tokyo Electron does
not trade in derivatives for speculative purposes.
Financial SectionInvestor Information
Notes to Consolidated Financial Statements
PAGE 20TOKYO ELECTRON ANNUAL REPORT 2019

Notes to Consolidated Financial Statements
Derivatives are carried at fair value in the consolidated bal-
ance sheet with changes in unrealized gain or loss charged or
credited to earnings, except for those which meet the criteria
for hedge accounting. Unrealized gains or losses on hedging
instruments, net of taxes, are reported in net assets as
a component of accumulated other comprehensive income
(loss). Receivables and payables hedged by qualified forward
foreign exchange contracts are translated at the correspond-
ing foreign exchange contract rates.
(o) Income taxes Tokyo Electron records deferred tax assets and liabilities on
temporary differences between the carrying amounts of
assets and liabilities for financial reporting purposes and the
amounts used for income tax purposes and net operating
loss carryforwards. Deferred tax assets and liabilities are
measured using the enacted tax rates and laws which are
expected to be in effect when net operating loss carryfor-
wards and temporary differences are expected to be realized.
(p) Revenue recognition Revenue from Semiconductor and FPD (Flat Panel Display)
production equipment is principally recognized at the time of
the customer confirmation of set-up and testing of products.
Revenue from equipment not requiring substantial installa-
tion is recognized at the time of shipment. Service revenue
maintenance is recognized ratably over the term of the
maintenance contract.
(q) Research and development expenses Research and development expenses are charged to earn-
ings as incurred and amounted to ¥113,980 million
($1,026,946 thousand) and ¥97,103 million for the years
ended March 31, 2019 and 2018, respectively.
(r) Reclassifications Certain reclassifications have been made to the prior year’s
consolidated financial statements to conform with the pre-
sentation used for the year ended March 31, 2019.
Tokyo Electron adopted “Partial Amendments to Accounting
Standard for Tax Effect Accounting” (ASBJ Statement No. 28,
February 16, 2018) from the beginning of the fiscal year ended
March 31, 2019, and deferred tax assets are classified as
“Investments and other assets” and deferred tax liabilities are
classified as “Non-current liabilities”, respectively.
As a result, out of “Deferred tax assets” of ¥50,505 million
presented under “Current assets” as of March 31, 2018,
¥44,596 million was reclassified to “Deferred tax assets”
under “Investments and other assets”, and ¥5,908 million
(2) The Company’s shares held by the trust
Tokyo Electron recorded the Company’s shares held by the
trust in “Treasury stock, at cost” under “Net assets” at the
book value in the trust (excluding ancillary expenses). The
book value and the number of such treasury shares as of
March 31, 2019 were ¥4,274 million ($38,508 thousand) and
215,663 shares, respectively.
4. Accounting Standards Issued but Not yet Adopted
“Accounting Standard for Revenue Recognition” (ASBJ
Statement No. 29, March 30, 2018 (hereinafter, “Statement
No.29”))
“Implementation Guidance on Accounting Standard for
Revenue Recognition” (ASBJ Guidance No. 30, March 30, 2018
(hereinafter, “Guidance No.30”))
(1) Overview
The International Accounting Standards Board (IASB) and
the U.S. Financial Accounting Standards Board (FASB) collab-
orated on a project to develop a single, comprehensive reve-
nue recognition model and jointly issued new revenue
recognition standards “Revenue from Contracts with
Customers” (IFRS 15 published by IASB, Topic 606 published
by FASB) in May 2014. IFRS 15 is effective for annual reporting
periods beginning on or after 1 January 2018 and Topic 606 is
effective for annual reporting periods beginning after
December 15, 2017.
Considering the above circumstances, the Accounting
Standard Board of Japan (ASBJ) also developed a new
revenue recognition standard and issued Statement No.29
together with Guidance No.30.
ASBJ’s basic policy in developing the new revenue recogni-
tion standards is to first incorporate the core principle of IFRS
15 in the light of improving the international comparability of
financial statements and then add additional alternative
treatments to the extent that international comparability
would not be significantly impaired where any business prac-
tices operated in Japan need to be considered.
(2) Effective date
Effective from the beginning of the fiscal year ending
March 31, 2022.
(3) Effects of the application of the standards
The Company and its consolidated domestic subsidiaries are
currently in the process of determining the effects of these
new standards on the consolidated financial statements.
was offset by deferred tax liabilities, which are included in
“Other liabilities” under “Non-current liabilities”. Accordingly,
total assets as of March 31, 2018 decreased by ¥5,908 million.
3. Additional Information
Stock delivering schemes linked to medium-term
performance
Tokyo Electron introduced stock delivering schemes
( hereinafter “the Schemes”) as a common global incentive
plan linked to medium-term performance from the fiscal
year ended March 31, 2019. The purpose of the Schemes is to
encourage directors and employees to contribute to the
Group’s medium-term performance and enterprise value.
Tokyo Electron adopted the “Practical Solution on
Transactions of Delivering the Company’s Own Stock to
Employees, etc. through Trusts” (PITF No. 30, March 26, 2015)
for the accounting treatment of the Schemes.
1. Executive compensation BIP (Board Incentive Plan) Trust
(1) Overview of the transactions
The Executive compensation BIP Trust which the Company
established acquires the Company’s shares, and delivers and
provides shares of the Company and monetary compensa-
tion corresponding to the cash conversion value of the
Company’s shares to the directors of the Company and its
subsidiaries (excluding outside directors) based on their posi-
tion and attainment of performance targets in accordance
with the share delivery rules.
(2) The Company’s shares held by the trust
Tokyo Electron recorded the Company’s shares held by the
trust in “Treasury stock, at cost” under “Net assets” at the
book value in the trust (excluding ancillary expenses). The
book value and the number of such treasury shares as of
March 31, 2019 were ¥674 million ($6,074 thousand) and
34,038 shares, respectively.
2. Share-delivering ESOP (Employee Stock Ownership Plan)
Trust
(1) Overview of the transactions
The Share-delivering ESOP Trust which the Company
established acquires the Company’s shares, and delivers and
provides shares of the Company and monetary compensa-
tion corresponding to the cash conversion value of the
Company’s shares to the general managers, senior employees
and mid-class employees of the Company and its subsidiaries
based on their position and attainment of performance
targets in accordance with the share delivery rules.
5. Securities
Other securities as of March 31, 2019 and 2018 are as follows:
Millions of yen
2019: Cost Carrying value
Non-current
Securities with carrying value exceeding acquisition cost
Equity securities ¥8,063 ¥26,834
Securities with carrying value not exceeding acquisition cost
Equity securities 1,011 1,002
Other 15 15
Total ¥9,090 ¥27,853
Millions of yen
2018: Cost Carrying value
Non-current
Securities with carrying value exceeding acquisition cost
Equity securities ¥7,620 ¥32,293
Securities with carrying value not exceeding acquisition cost
Equity securities 819 819
Other 15 15
Total ¥8,455 ¥33,128
Thousands of U.S. dollars
2019: Cost Carrying value
Non-current
Securities with carrying value exceeding acquisition cost
Equity securities $72,647 $241,777
Securities with carrying value not exceeding acquisition cost
Equity securities 9,116 9,031
Other 141 141
Total $81,904 $250,950
Held-to-maturity securities classified as current assets are
¥215,000 million ($1,937,111 thousand) and ¥286,500 million
as of March 31, 2019 and 2018, respectively.
Reconciliation of held-to-maturity securities as of March
31, 2019 and 2018 to the amounts of short-term investments
in the consolidated balance sheets are as follows:
Millions of yen
Thousands of U.S. dollars
2019 2018 2019
Held-to-maturity (current) ¥215,000 ¥286,500 $1,937,111
Deposits and low-risk financial instruments with original
maturities of three months or less (55,000) (170,500) (495,540)
Deposits with original maturities of more than three months — — —
Short-term investments ¥160,000 ¥116,000 $1,441,571
Financial SectionInvestor Information
Notes to Consolidated Financial Statements
PAGE 21TOKYO ELECTRON ANNUAL REPORT 2019

Notes to Consolidated Financial Statements
Net loss on devaluation of investment securities was ¥55
million ($496 thousand) and ¥536 million for the years ended
March 31, 2019 and 2018, respectively.
For the year ended March 31, 2019, the Company sold
available-for-sale securities and recognized the following
gain and loss on sale:
Millions of yen
Amount of sale Gain on sale Loss on sale
Equity securities ¥1,087 ¥768 ¥—
Total ¥1,087 ¥768 ¥—
Thousands of U.S. dollars
Amount of sale Gain on sale Loss on sale
Equity securities $9,795 $6,927 $—
Total $9,795 $6,927 $—
For the year ended March 31, 2018, the amounts of gain and
loss on sale of available-for-sale securities was immaterial.
6. Inventories
Inventories as of March 31, 2019 and 2018 are as follows:
Millions of yen
Thousands of U.S. dollars
2019 2018 2019
Finished products ¥234,102 ¥220,497 $2,109,221
Work in process, raw materials and supplies 120,117 123,573 1,082,233
Total ¥354,219 ¥344,071 $3,191,455
The amounts of change in inventory provision included in
cost of sales in the consolidated statements of income for
the years ended March 31, 2019 and 2018 were an increase of
¥4,031 million ($36,325 thousand) and an increase of ¥173
million, respectively.
7. Pledged Assets
Tokyo Electron did not hold any assets pledged as collater-
al as of March 31, 2019 and 2018.
8. Short-term Borrowings
There are no short-term borrowings classified as current
liabilities as of March 31, 2019 and 2018.
As of March 31, 2019 and 2018, Tokyo Electron had unused
lines of credit amounting to ¥126,947 million ($1,143,770
thousand) and ¥126,953 million, respectively.
9. Employee Benefits
The Company and its domestic subsidiaries provide a cash
balance plan and a non-contributory retirement and severance
(3) Reconciliation from defined benefit obligations and plan
assets to net defined benefit liabilities (assets)
Millions of yen
Thousands of U.S. dollars
2019 2018 2019
Funded defined benefit obligations ¥58,453 ¥54,677 $526,653
Plan assets (60,925) (53,683) (548,930)
Funded status (2,472) 993 (22,277)
Unfunded defined benefit obligations 60,008 58,315 540,662
Net defined benefit liabilities at March 31, 2019 and 2018 ¥57,535 ¥59,309 $518,385
Net defined benefit liabilities 60,600 59,309 546,004
Net defined benefit assets (3,065) — (27,618)
Net defined benefit liabilities at March 31, 2019 and 2018 ¥57,535 ¥59,309 $518,385
Note: The provision for accrued pension and severance costs for directors and audit & supervisory board members of ¥374 million ($3,378 thousand) and ¥374 million as of March 31, 2019 and 2018 is not included.
(4) Defined benefit costs
Millions of yen
Thousands of U.S. dollars
2019 2018 2019
Service cost ¥5,853 ¥6,052 $52,738
Interest cost 701 963 6,320
Expected return on plan assets (1,152) (1,400) (10,380)
Net actuarial gain (loss) amortization 2,537 (1,237) 22,858
Prior service cost amortization 338 — 3,050
Other 287 388 2,592
Total defined benefit costs for the years ended
March 31, 2019 and 2018 ¥8,566 ¥4,765 $77,179
Loss on transfer to defined contribution plan (Note) — 3,154 —
Note: Loss on revision of retirement benefit plan was recognized in other income (expenses) for the year ended March 31, 2018.
(5) Remeasurements of defined benefit plans
Millions of yen
Thousands of U.S. dollars
2019 2018 2019
Prior service cost ¥338 ¥(1,354) $3,050
Actuarial gain (loss) (396) (5,093) (3,575)
Total ¥ (58) ¥(6,448) $ (525)
Note: Prior service cost and actuarial loss for the year ended March 31, 2018 include the reclassification adjustments of ¥336 million and ¥240 million, respectively, associated with the conversion of a part of defined benefit plans to a defined contribution plan.
benefit plan as defined benefit plans, and provide a defined
contribution plan as defined contribution plans for their
employees. Further, certain consolidated overseas subsidiar-
ies provide defined benefit plans and defined contribution
plans for their employees.
Effective April 1, 2018, Tokyo Electron and its domestic sub-
sidiaries converted a part of their defined benefit plans to
a defined contribution plan. The loss on revision of retirement
benefit plan of ¥3,154 million resulting from this change was
recognized and presented in other income (expenses) for the
year ended March 31, 2018 in accordance with the “Accounting
Procedures for Conversion between Different Retirement
Benefit Schemes” (Corporate Accounting Standards
Implementation Guidelines No. 1) and the “Practical Treatment of
Accounting Procedures for Conversion between Different
Retirement Benefit Schemes” (Practical Issues Task Force No. 2).
Defined benefit plans
(1) Movement of defined benefit obligations
Millions of yen
Thousands of U.S. dollars
2019 2018 2019
Balance at April 1, 2018 and 2017 ¥112,992 ¥118,660 $1,018,040
Service cost 5,853 6,052 52,738
Interest cost 701 963 6,320
Actuarial gain 2,986 4,632 26,905
Benefits paid (3,936) (3,029) (35,467)
Prior service cost — 1,690 —
Decrease by conversion of a part of defined benefit plans
to a defined contribution plan — (15,946) —
Foreign currency exchange rate changes (135) (30) (1,220)
Balance at March 31, 2019 and 2018 ¥118,461 ¥112,992 $1,067,316
(2) Movement of plan assets
Millions of yen
Thousands of U.S. dollars
2019 2018 2019
Balance at April 1, 2018 and 2017 ¥53,683 ¥67,653 $483,676
Expected return on plan assets 1,152 1,400 10,380
Actuarial gain (loss) (6) 526 (61)
Employer contributions 7,403 3,577 66,701
Benefits paid (1,164) (915) (10,493)
Decrease by conversion of a part of defined benefit plans
to a defined contribution plan — (18,523) —
Foreign currency exchange rate changes (124) (24) (1,125)
Other (16) (12) (147)
Balance at March 31, 2019 and 2018 ¥60,925 ¥53,683 $548,930
(6) Accumulated remeasurements of defined benefit plans
Millions of yen
Thousands of U.S. dollars
2019 2018 2019
Prior service cost that is yet to be recognized (before tax) ¥(1,015) ¥(1,354) $ (9,151)
Net actuarial loss that is yet to be recognized (before tax) (8,204) (7,806) (73,922)
Total ¥(9,220) ¥(9,161) $(83,073)
(7) Plan assets
1. Plan assets comprise:
2019 2018
Bonds 31% 38%
Life insurance company general account 30 25
Equity securities 14 20
Alternative investments (Note) 13 9
Cash and cash equivalents 1 1
Other 11 7
Total 100% 100%
Note: Alternative investments mainly consist of hedge funds, real estate and insurance-linked securities
2. Long-term expected rate of return
Current and target asset allocations, and historical and
expected returns on the various categories of plan assets
have been considered in determining the long-term
expected rate of return.
(8) Actuarial assumptions
The principal actuarial assumptions as of and for the years
ended March 31, 2019 and 2018 are as follows:
2019 2018
Discount rate 0.36% 0.46%
Long-term expected rate of return 2.00% 2.00%
The expected rates of salary increase for the years ended
March 31, 2019 and 2018 are also considered as one of the
actuarial assumptions, and are set based on the salary
increase index by age group as of January 1, 2019 and January
1, 2018, respectively.
Defined contribution plans
The contributions of the Company and its subsidiaries to
the defined contribution plans are ¥2,498 million ($22,514
thousand) and ¥1,124 million for the years ended March 31,
2019 and 2018, respectively.
Financial SectionInvestor Information
Notes to Consolidated Financial Statements
PAGE 22TOKYO ELECTRON ANNUAL REPORT 2019

Notes to Consolidated Financial Statements
Significant components of the difference between the
statutory and effective tax rates for the years ended March
31, 2019 and 2018 are as follows:
2019 2018
Statutory tax rate in Japan 30.62% 30.86%
Adjustments:
Tax credits (6.52) (6.23)
Difference in statutory tax rates of subsidiaries (1.11) (1.33)
Effect of enacted changes in tax rates on net deferred tax assets — 1.55
Others, net (0.20) 0.89
Effective tax rate 22.79% 25.74%
Year ended March 31, 2019
The Company received notification from the National Tax
Agency, Japan (NTA) dated January 24, 2019, that agreement
had been reached through the Mutual Agreement Procedure
(MAP) between the NTA and Korean income tax authorities
concerning the transfer pricing adjustments assessed during
prior historical periods relating to the transactions between
the Company and its Korean subsidiary. As a result, ¥862 mil-
lion ($7,770 thousand) of tax benefit is included in current
income tax expense as the difference between the actual tax
refunds and the estimated amount recorded in prior fiscal
year.
Year ended March 31, 2018
The U.S. federal income tax rate applied to the consolidated
subsidiaries in the U.S. was reduced from 35% to 21% associ-
ated with the U.S. tax reform legislation signed into law on
December 22, 2017.
Net deferred tax assets were reduced by ¥3,029 million and
income taxes were increased by ¥3,211 million as of and for the
year ended March 31, 2018 resulting from this tax rate reduction.
10. Income Taxes
Significant components of the deferred tax assets and
liabilities as of March 31, 2019 and 2018 are as follows:
Millions of yen
Thousands of U.S. dollars
2019 2018 2019
Deferred tax assets
Elimination of unrealized profit in inventories ¥25,145 ¥27,718 $226,558
Net defined benefit liabilities 18,751 18,129 168,950
Net operating loss carryforwards 11,132 10,969 100,299
Accrued employees’ bonuses 7,766 8,185 69,974
Devaluation of inventories 7,038 4,148 63,412
Accrued warranty expenses 3,846 2,675 34,653
Depreciation 2,710 1,903 24,417
Other 12,664 14,819 114,103
Total gross deferred tax assets 89,054 88,550 802,368
Less valuation allowance (8,535) (8,043) (76,903)
Total deferred tax assets 80,519 80,506 725,464
Deferred tax liabilities
Undistributed earnings of subsidiaries (7,559) (6,143) (68,112)
Net unrealized gains on investment securities (5,747) (7,554) (51,785)
Other (3,474) (4,384) (31,304)
Total deferred tax liabilities (16,781) (18,082) (151,201)
Net deferred tax assets ¥63,737 ¥62,424 $574,263
The ultimate realization of deferred tax assets is dependent
upon the generation of future taxable income during the
period in which temporary differences become deductible
and net operating loss carryforwards are available to be
utilized. For assessment of the realizability of deferred tax
assets, management considers the scheduled reversal of
deferred tax liabilities, future estimated taxable income, tax
planning strategies and level of net operating loss carryfor-
wards, if any, in accordance with accounting principles
generally accepted in Japan.
Based on the level of historical taxable income and future
estimated taxable income over the periods which the tem-
porary differences are deductible and net operating loss-
carryforwards are available to be utilized, management believes
Tokyo Electron will realize the benefits of deferred tax assets, net
of valuation allowance, as of March 31, 2019 and 2018.
The Company and its wholly-owned domestic subsidiaries
apply a consolidated tax filing system for corporate tax purposes.
11. Other Income (Expenses)
Loss on impairment of property, plant and equipment,
goodwill and other assets
For the year ended March 31, 2018, the following loss on
impairment was recognized:
Goodwill of TEL NEXX, Inc.
Loss on impairment
LocationPurpose of use
Asset Type
Millions of yen
Billerica, Massachusetts, U.S.A. Business assets Goodwill ¥925
Tokyo Electron performed an impairment test and recog-
nized loss on impairment of goodwill of TEL NEXX, Inc.,
a subsidiary manufacturing semiconductor production
equipment, due to TEL NEXX, Inc.’s reconsideration of its
business plan. Tokyo Electron recognized the difference
between the book value and the recoverable amount of
goodwill as loss on impairment. The recoverable amount was
measured as value in use, and was calculated by discounting
future cash flows at a discount rate of 14.0%.
Loss on revision of retirement benefit plan
Effective April 1, 2018, Tokyo Electron and its domestic
subsidiaries converted a part of their defined benefit plans to
a defined contribution plan. The loss on revision of retirement
benefit plan of ¥3,154 million resulting from this change was
recognized and presented in other income (expenses) for the
year ended March 31, 2018 in accordance with the
“Accounting Procedures for Conversion between Different
Retirement Benefit Schemes” (Corporate Accounting
Standards Implementation Guidelines No. 1) and the
“Practical Treatment of Accounting Procedures for
Conversion between Different Retirement Benefit Schemes”
(Practical Issues Task Force No. 2).
12. Net Assets
Net assets comprises four subsections, which are share-
holders’ equity, accumulated other comprehensive income,
share subscription rights and non-controlling interests.
Under Japanese laws and regulations, the entire amount
paid for new shares is required to be designated as common
stock. However, a company may, by a resolution of the board
of directors, designate an amount not exceeding one half of
the price of the new shares as additional paid-in capital
which is included in capital surplus.
In cases where dividend distribution of surplus is made, the
lesser of an amount equal to 10% of the dividend or the
excess, if any, of 25% of common stock over the total of
additional paid-in capital and legal reserve must be set aside
as additional paid-in capital or legal reserve. Legal reserve is
included in retained earnings in the accompanying consoli-
dated balance sheets.
Both appropriations of legal reserve and additional paid-in
capital used to eliminate or reduce a deficit generally require
a resolution of the shareholders’ meeting.
Additional paid-in capital and legal reserve may not be dis-
tributed as dividends. All additional paid-in capital and legal
reserve may be transferred to other capital surplus and
retained earnings, respectively, which are potentially available
for dividends.
The Company is subject to restriction of dividends based
on the Japanese Corporate Act, which restricts the amount of
dividends to retained earnings on a consolidated basis.
The Company’s articles allow for the distribution of earn-
ings to shareholders on dates other than the mid-term and
year-end, by a resolution of the board of directors in accor-
dance with Japanese laws and regulations.
At the board of directors’ meeting held on May 10, 2019, the
distribution of cash dividends amounting to ¥56,651 million
($510,422 thousand) was resolved. Such appropriations have
not been accrued in the consolidated financial statements as
of March 31, 2019 since they are recognized in the period in
which they are resolved at the board of directors’ meeting.
The dividends of ¥56,651 million include ¥86 million
($776 thousand) related to treasury stock held by the BIP/
ESOP Trusts.
Financial SectionInvestor Information
Notes to Consolidated Financial Statements
PAGE 23TOKYO ELECTRON ANNUAL REPORT 2019

Notes to Consolidated Financial Statements
13. Other Comprehensive Income
Other comprehensive income for the years ended March 31, 2019 and 2018 is as follows:
Millions of yen
Thousands of U.S. dollars
2019 2018 2019
Net unrealized gains (losses) on investment securities
Net unrealized gains (losses) arising during the year ¥(5,910) ¥9,134 $(53,255)
Reclassification adjustments — — —
Sub-total, before tax (5,910) 9,134 (53,255)
Tax expense 1,808 (2,796) 16,293
Sub-total, net of tax (4,102) 6,337 (36,962)
Net deferred gains (losses) on hedging instruments
Net deferred gains (losses) arising during the year (392) 286 (3,532)
Reclassification adjustments — — —
Sub-total, before tax (392) 286 (3,532)
Tax expense 120 (87) 1,081
Sub-total, net of tax (272) 198 (2,450)
Foreign currency translation adjustments
Adjustments during the year (1,170) (297) (10,548)
Reclassification adjustments — 54 —
Sub-total, before tax (1,170) (242) (10,548)
Tax expense — — —
Sub-total, net of tax (1,170) (242) (10,548)
Remeasurements of defined benefit plans
Adjustments during the year (2,933) (5,787) (26,434)
Reclassification adjustments 2,875 (660) 25,908
Sub-total, before tax (58) (6,448) (525)
Tax expense (48) 1,953 (432)
Sub-total, net of tax (106) (4,494) (957)
Share of other comprehensive income of associates accounted for using the equity method
Adjustments during the year 119 (46) 1,077
Total other comprehensive income ¥(5,531) ¥1,752 $(49,841)
14. Share Subscription Rights
Stock option plan The Company’s shareholders have approved annual stock
option plans for directors and selected employees since the
year ended March 31, 1999. The options under the plans vest
immediately or over three-year period with restriction on
exercise up to three years after the date of grant, and have
an exercise period of seventeen years from the date on
which the options become exercisable.
Options to purchase 219,900 shares of the Company were
authorized and granted at an exercise price of ¥1 ($0.01) for
the year ended March 31, 2019.
A summary of stock options outstanding and exercisable as of March 31, 2019 and 2018 is as follows:
2019 2018
Number of shares
Weighted-average exercise priceNumber of
shares
Weighted-average exercise price
Yen U.S. dollars Yen
Outstanding at the beginning of year 563,600 ¥1 $0.01 457,500 ¥1
Granted 219,900 1 0.01 144,700 1
Exercised 94,800 1 0.01 38,600 1
Expired (forfeited) — — — — —
Outstanding at the end of year 688,700 1 0.01 563,600 1
Exercisable at the end of year 129,700 1 0.01 88,800 1
Amounts expensed related to stock options The amounts expensed related to stock options for the
years ended March 31, 2019 and 2018, are as follows:
Millions of yen
Thousands of U.S. dollars
2019 2018 2019
Selling, general and administrative expenses ¥3,618 ¥1,903 $32,601
Valuation method of fair value per unit of stock options Fair value as of the grant date for stock options granted for
the year ended March 31, 2019 was ¥16,455 ($148.26) per unit,
which was evaluated as follows:
(1) Valuation method used: Black-Scholes model
(2) Major underlying assumptions and estimates:
14th Stock Acquisition Rights
Volatility (Note 1) 35.31%
Expected residual period (Note 2) 5.55 years
Expected dividends (Note 3) ¥488 ($4.40) per share
Risk-free interest rate (Note 4) (0.09)%
Notes: 1. Calculated based on the stock price performance for the period corresponding to the expected residual period (from November 2012 to June 2018).
2. Calculated based on past actual results and forecast of the exercise of stock options.
3. Based on the dividends paid for the years ended March 31, 2018 and 2017.
4. Based on Japanese government bond yield corresponding to the expected residual period.
(3) Method of estimating the number of vested stock options
It is not necessary to estimate the number of vested stock
options as the rights to exercise stock options are vested
immediately when granted.
15. Leases
Future minimum lease payments on non-cancelable oper-
ating leases are as follows:
Millions of yen
Thousands of U.S. dollars
2019 2018 2019
Due within one year ¥ 3,694 ¥ 3,772 $ 33,284
Due over one year 8,577 7,039 77,284
Total ¥12,272 ¥10,811 $110,568
16. Fair Value of Financial Instruments
Policy for financial instruments Tokyo Electron limits its fund management to short-term
bank deposits and low-risk financial instruments.
Trade receivables, which consist of notes and accounts
receivable, are exposed to credit risk in the event of non-
performance by the counterparties. Execution and manage-
ment of credit risk, maturity and receivable balance are
conducted pursuant to the internal management rules for
credit control. Credit risk of major customers is assessed on a
regular basis.
Short-term investments consist of short term deposits and
low-risk financial instruments and Tokyo Electron trade with
highly-rated financial institutions to mitigate credit risks.
Investment securities consist of mainly equity interests in
listed companies exposed to equity market risks. Conditions,
including market prices, for these investment securities are
monitored on a regular basis.
Trade payables, which consist of notes and accounts
payable, mainly mature within one year. Trade payables are
exposed to liquidity risks which are managed through
activities such as implementing cash management plans.
See note 17 for detailed discussion on derivative financial
instruments.
Financial SectionInvestor Information
Notes to Consolidated Financial Statements
PAGE 24TOKYO ELECTRON ANNUAL REPORT 2019

Notes to Consolidated Financial Statements
Fair value of financial instruments Carrying amount and estimated fair value of financial
instruments as of March 31, 2019 and 2018 are set out below.
Fair value of financial instruments which is practically difficult
to estimate are excluded.
Millions of yen
2019:Carrying amount
Estimated fair value1
Assets
Cash and cash equivalents ¥232,634 ¥232,634
Short-term investments 160,000 159,921
Trade notes and accounts receivable, net of allowance for
doubtful accounts (¥84 million) 146,886 146,886
Investment securities 26,866 26,866
Liabilities
Trade notes and accounts payable 75,448 75,448
Derivatives (see note 17)
Hedge accounting not applied 74 74
Hedge accounting applied (56) (56)
Millions of yen
2018:Carrying amount
Estimated fair value1
Assets
Cash and cash equivalents ¥257,877 ¥257,877
Short-term investments 116,000 115,966
Trade notes and accounts receivable, net of allowance for
doubtful accounts (¥59 million) 159,510 159,510
Investment securities 32,230 32,230
Liabilities
Trade notes and accounts payable 108,607 108,607
Derivatives (see note 17)
Hedge accounting not applied (7) (7)
Hedge accounting applied 335 335
Thousands of U.S. dollars
2019:Carrying amount
Estimated fair value1
Assets
Cash and cash equivalents $2,095,997 $2,095,997
Short-term investments 1,441,571 1,440,864
Trade notes and accounts receivable, net of allowance for
doubtful accounts ($765 thousand) 1,323,420 1,323,420
Investment securities 242,060 242,060
Liabilities
Trade notes and accounts payable 679,780 679,780
Derivatives (see note 17)
Hedge accounting not applied 670 670
Hedge accounting applied (513) (513)
Notes: 1. Fair value calculation of financial instruments Cash and cash equivalents, short-term investments, trade notes and accounts receivable and trade notes and accounts payable.
The carrying amounts approximate fair value because of the short maturity of these instruments.
Investment securities The fair values of marketable securities are based on quoted
market prices. See note 5 for further information by classification of investment
securities. Derivatives See note 17 for detailed discussion on derivative financial
instruments.
2. The following financial instruments are not included in the above as they do not have quoted market prices and therefore it is considered extremely difficult to measure their fair value.
Millions of yen
Thousands of U.S. dollars
2019 2018 2019
Reported amount in balance sheet
Unlisted stocks ¥971 ¥882 $8,749
Other 15 15 141
Total ¥986 ¥897 $8,890
3. Maturities of financial assets and securities are as follows:
Millions of yen
2019: Within 1 yearAfter 1 through
5 years
Cash and cash equivalents ¥232,634 ¥—
Short-term investments 160,000 —
Trade notes and accounts receivable 146,971 —
Millions of yen
2018: Within 1 yearAfter 1 through
5 years
Cash and cash equivalents ¥257,877 ¥—
Short-term investments 116,000 —
Trade notes and accounts receivable 159,570 —
Thousands of U.S. dollars
2019: Within 1 yearAfter 1 through
5 years
Cash and cash equivalents $2,095,997 $—
Short-term investments 1,441,571 —
Trade notes and accounts receivable 1,324,185 —
17. Derivative Financial Instruments
Tokyo Electron is subject to risk from adverse fluctuations
in foreign currency exchange rates in its operating and
financing activities. The Company and certain subsidiaries
enter into forward foreign exchange contracts in order to
hedge such risks, but do not enter into such transactions for
speculative purposes. The Company implements a ratio anal-
ysis of the total cumulative cash flow fluctuations to assess
effectiveness of hedging for all derivative transactions,
except for transactions where the critical terms of the hedg-
ing instrument and hedged item match and the Company
could conclude that changes in fair value or cash flows are
expected to completely offset. Execution and management
of all derivative transactions are conducted pursuant to the
internal management rule.
The estimated fair values of the derivative financial instru-
ments as of March 31, 2019 and 2018 are as follows:
1. Derivative financial instruments not designated as hedging
instruments
Millions of yen
2019:Contractamount Fair value
Gains (losses)
Sell U.S. dollars ¥ 1,201 ¥14 ¥14
Buy U.S. dollars 11,967 53 53
Buy Chinese yuan 2,720 9 9
Buy Taiwan dollars 1,213 (3) (3)
Buy GBP 593 0 0
Buy EURO 360 0 0
Buy Singapore dollars 326 (0) (0)
Total ¥18,383 ¥74 ¥74
Millions of yen
2018:Contractamount Fair value
Gains (losses)
Sell U.S. dollars ¥ 703 ¥18 ¥18
Buy U.S. dollars 3,639 (19) (19)
Buy Chinese yuan 1,515 (0) (0)
Buy Taiwan dollars 912 0 0
Buy GBP 820 (2) (2)
Buy EURO 785 (1) (1)
Buy Singapore dollars 706 (2) (2)
Total ¥9,084 ¥ (7) ¥ (7)
Thousands of U.S. dollars
2019:Contract amount Fair value
Gains (losses)
Sell U.S. dollars $ 10,823 $127 $127
Buy U.S. dollars 107,828 484 484
Buy Chinese yuan 24,508 85 85
Buy Taiwan dollars 10,932 (27) (27)
Buy GBP 5,344 1 1
Buy EURO 3,250 0 0
Buy Singapore dollars 2,944 (0) (0)
Total $165,632 $670 $670
Note: The fair values are based on the quoted forward foreign exchange rates.
2. Derivative financial instruments designated as hedging instruments
The contract amounts of forward foreign exchange contracts, entered into to hedge future transactions and receivables and
payables denominated in foreign currencies that have been translated by the corresponding contracted rates, are as follows:
Millions of yen Thousands of U.S. dollars
2019: Contract amountContract amount due after 1 year Fair value Contract amount
Contract amount due after 1 year Fair value
Future transactions denominated in a foreign currency
Sell U.S. dollars ¥5,951 ¥— ¥(56) $53,624 $— $(513)
Monetary assets and liabilities in foreign currency (Note)
Sell U.S. dollars 898 — — 8,097 — —
Buy U.S. dollars 61 — — 550 — —
Total ¥6,911 ¥— ¥(56) $62,272 $— $(513)
Millions of yen
2018: Contract amountContract amount due after 1 year Fair value
Future transactions denominated in a foreign currency
Sell U.S. dollars ¥11,853 ¥71 ¥335
Buy U.S. dollars 156 — (0)
Monetary assets and liabilities in foreign currency (Note)
Sell U.S. dollars 555 — —
Total ¥12,566 ¥71 ¥335
Note: The fair value of these derivative financial instruments, which is based on the quoted foreign exchange rates, is included in the carrying value of hedged assets and liabilities.
Financial SectionInvestor Information
Notes to Consolidated Financial Statements
PAGE 25TOKYO ELECTRON ANNUAL REPORT 2019

Notes to Consolidated Financial Statements
Millions of yen
Reportable Segment
Other Total Adjustments Consolidated2018:
Semiconductor production equipment
FPD production equipment
Net sales
Sales to external customers ¥1,055,234 ¥75,068 ¥ 425 ¥1,130,728 ¥ — ¥1,130,728
Intersegment sales or transfers — — 19,469 19,469 (19,469) —
Total 1,055,234 75,068 19,894 1,150,197 (19,469) 1,130,728
Segment profit (loss) 314,602 13,299 (57) 327,844 (52,601) 275,242
Segment assets 494,964 43,963 3,014 541,943 660,853 1,202,796
Depreciation and amortization 11,402 701 81 12,185 8,434 20,619
Amortization of goodwill 600 — — 600 — 600
Loss on impairment 925 — — 925 — 925
Capital expenditures, including intangible assets 16,392 935 247 17,575 33,722 51,297
Thousands of U.S. dollars
Reportable Segment
Other Total Adjustments Consolidated2019:
Semiconductor production equipment
FPD production equipment
Net sales
Sales to external customers $10,512,487 $1,002,449 $ 1,780 $11,516,718 $ — $11,516,718
Intersegment sales or transfers — — 170,420 170,420 (170,420) —
Total 10,512,487 1,002,449 172,200 11,687,138 (170,420) 11,516,718
Segment profit 2,943,661 218,408 9,327 3,171,397 (274,661) 2,896,735
Segment assets 4,567,342 321,852 22,293 4,911,488 6,419,510 11,330,999
Depreciation and amortization 126,166 7,867 1,136 135,169 83,981 219,151
Amortization of goodwill 3,197 — — 3,197 — 3,197
Capital expenditures, including intangible assets 203,925 13,586 1,788 219,300 262,029 481,330
Notes: 1. “Other” includes all other operating segments which are not included in the reportable segments, including group-wide logistic services, facility maintenance and insurance.
2. (1 ) “Adjustments” for segment profit (loss) totaling ¥(30,484) million ($(274,661) thousand) and ¥(52,601) million for the years ended March 31, 2019 and 2018, respectively, mainly consists of research and development costs of ¥(15,999) million ($(144,148) thousand) and ¥(22,263) million for the years ended March 31, 2019 and 2018, respectively, pertaining to the Company’s fundamental research and element research, the loss on revision of retirement benefit plan of ¥(3,154) million for the year ended March 31, 2018 and other general and administrative costs that do not belong to the reportable seg-ments.
(2) “Adjustments” for segment assets totaling ¥712,501 million ($6,419,510 thousand) and ¥660,853 million as of March 31, 2019 and 2018, respectively, mainly consist of cash and cash equivalents, short-term investments and buildings not allocated to any of the reportable segments.
(3) “Adjustments” for capital expenditures totaling ¥29,082 million ($262,029 thousand) and ¥33,722 million for the years ended March 31, 2019 and 2018, respectively, mainly consist of capital expenditures for buildings not allocated to any of the reportable segments.
Other information(1) Domestic and overseas net sales by destination for the years ended March 31, 2019 and 2018 are as follows:
Millions of yen
2019: Japan North America Europe South Korea Taiwan China Other Total
Net sales ¥208,796 ¥131,954 ¥93,113 ¥311,081 ¥164,912 ¥307,879 ¥60,502 ¥1,278,240
Notes: 1. Sales are classified in countries or regions based on location of customers. 2. Net sales of North America include sales in the U.S.A. of ¥131,914 million.
Millions of yen
2018: Japan North America Europe South Korea Taiwan China Other Total
Net sales ¥148,760 ¥119,257 ¥96,948 ¥378,496 ¥174,636 ¥164,344 ¥48,283 ¥1,130,728
Notes: 1. Sales are classified in countries or regions based on location of customers. 2. Net sales of North America include sales in the U.S.A. of ¥119,047 million.
Thousands of U.S. dollars
2019: Japan North America Europe South Korea Taiwan China Other Total
Net sales $1,881,220 $1,188,887 $838,939 $2,802,784 $1,485,830 $2,773,941 $545,113 $11,516,718
Note: Net sales of North America include sales in the U.S.A. of $1,188,526 thousand.
18. Segment Information
General information about reportable segments A reportable segment is a component or an aggregated component of Tokyo Electron. For each of the components, discrete
financial information is available and the operating result is regularly reviewed by management to make decisions about resourc-
es to be allocated to the segment and assess its performance.
The operation of Tokyo Electron consists of segments by products and services based on business units (BUs), and Tokyo
Electron identifies as a reportable segment, “semiconductor production equipment (SPE)” and “flat panel display (FPD) produc-
tion equipment”.
Products of the SPE segment consist of coater/developers, etch systems, deposition systems, cleaning systems used in wafer
processing, wafer probers used in the wafer testing process and other semiconductor production equipment. The SPE segment
principally develops, manufactures, sells such products and provide services on them.
Products of the FPD production equipment segment consist of coater/developers and etch/ash systems used in the manufac-
ture of flat panel displays. The FPD production equipment segment principally develops, manufactures, sells such products and
provide services on them.
Basis of measurement of reportable segment net sales, segment profit (loss), segment assets and other items The accounting policies applied in each reportable segment are generally consistent with those applied for the preparation of
the consolidated financial statements. Intersegment sales or transfers are determined by negotiation between the Tokyo
Electron group companies considering current market prices. Assets in common use have not been allocated to each reportable
segment, while costs associated with those assets have been allocated to reportable segments on a systematic basis.
Information about reportable segment net sales, segment profit (loss), segment assets and other items Reportable segment information as of and for the years ended March 31, 2019 and 2018 is as follows:
Millions of yen
Reportable Segment
Other Total Adjustments Consolidated2019:
Semiconductor production equipment
FPD production equipment
Net sales
Sales to external customers ¥1,166,781 ¥111,261 ¥ 197 ¥1,278,240 ¥ — ¥1,278,240
Intersegment sales or transfers — — 18,914 18,914 (18,914) —
Total 1,166,781 111,261 19,112 1,297,155 (18,914) 1,278,240
Segment profit 326,716 24,241 1,035 351,993 (30,484) 321,508
Segment assets 506,929 35,722 2,474 545,126 712,501 1,257,627
Depreciation and amortization 14,003 873 126 15,002 9,321 24,323
Amortization of goodwill 354 — — 354 — 354
Capital expenditures, including intangible assets 22,633 1,507 198 24,340 29,082 53,422
Financial SectionInvestor Information
Notes to Consolidated Financial Statements
PAGE 26TOKYO ELECTRON ANNUAL REPORT 2019

Notes to Consolidated Financial Statements
(2) Net property, plant and equipment by location as of March 31, 2019 and 2018 are as follows:
Millions of yen
2019: Japan Other Total
Property, plant and equipment ¥120,177 ¥29,891 ¥150,069
Millions of yen
2018: Japan Other Total
Property, plant and equipment ¥97,610 ¥28,342 ¥125,952
Thousands of U.S. dollars
2019: Japan Other Total
Property, plant and equipment $1,082,779 $269,315 $1,352,094
(3) Major customer information
Net sales to external customers that represent 10 percent or more of net sales are as follows:
Millions of yen
Thousands of U.S. dollars
Name of customer Related reportable segment 2019 2019
Intel Corporation Semiconductor production equipment ¥199,594 $1,798,306
Samsung Electronics Co., Ltd. Semiconductor production equipment and FPD production equipment 175,315 1,579,563
SK hynix Inc. Semiconductor production equipment 174,468 1,571,930
Micron Technology, Inc. Semiconductor production equipment 131,821 1,187,687
Note: The amounts include sales to the customer and its subsidiaries.
Millions of yen
Name of customer Related reportable segment 2018
Samsung Electronics Co., Ltd. Semiconductor production equipment and FPD production equipment ¥261,544
Intel Corporation Semiconductor production equipment 181,053
SK hynix Inc. Semiconductor production equipment 132,146
Note: The amounts include sales to the customer and its subsidiaries.
Information about reportable segment goodwill Reportable segment information about amortization of goodwill for the years ended March 31, 2019 and 2018, and unamortized
balances as of March 31, 2019 and 2018 are as follows:
Millions of yen
2019:
Semiconductor production equipment
FPD production equipment Total
Amortization of goodwill ¥ 354 ¥— ¥ 354
Goodwill 1,124 — 1,124
Millions of yen
2018:
Semiconductor production equipment
FPD production equipment Total
Amortization of goodwill ¥ 600 ¥— ¥ 600
Goodwill 1,699 — 1,699
Thousands of U.S. dollars
2019:
Semiconductor production equipment
FPD production equipment Total
Amortization of goodwill $ 3,197 $— $ 3,197
Goodwill 10,135 — 10,135
19. Per-Share Information
Net income per share and net assets per share are computed based on the weighted-average number of shares of common
stock outstanding during each year. Net income-diluted per share is computed based on the weighted-average number of
shares of common stock outstanding during each year after incorporating the dilutive potential effect of shares of common
stock to be issued upon the exercise of stock options.
Dividends per share has been presented on an accruals basis and include, in each fiscal year ended March 31, dividends
approved or to be approved after March 31 but applicable to the year then ended.
The basis for the calculation of net income per share for the fiscal years ended March 31, 2019 and 2018 is as follows:
Millions of yen
Thousands of U.S. dollars
2019 2018 2019
Net income per share of common stock — Basic
Net income attributable to owners of parent ¥248,228 ¥204,371 $2,236,489
Less components not pertaining to holders of common stock — — —
Net income pertaining to holders of common stock ¥248,228 ¥204,371 $2,236,489
Weighted-average number of shares of common stock outstanding (thousands) 164,000 164,090
Net income per share of common stock — Diluted
Adjustment of net income attributable to owners of parent — — —
Increase in number of common stock (Thousands of share) 692 562
Increase in number of share subscription rights (Thousands of share) 692 562
Notes: The shares of the Company held by “Executive compensation BIP Trust” and “Share-delivering ESOP Trust”, which are recorded in “Treasury stock, at cost” under shareholders’ equity, are included in the treasury stock which is deducted in calculating the per-share information. The number of treasury shares deducted in the calculation of net assets per share was 249 thousand shares as of March 31, 2019, and the average number of treasury shares deducted in the calculation of net income per share and fully diluted net income per share was 167 thousand shares in the fiscal year ended March 31, 2019.
20. Subsequent Events
Share repurchase At the Board of Directors meeting held on May 27, 2019, the Company resolved to acquire its own shares under the provisions
of its Articles of Incorporation pursuant to paragraph 1, Article 459 of the Companies Act, as follows:
1. Reason for acquisition of own shares
The Company intends to acquire its own shares in accordance with its capital policy while taking into account its current cash
position, its base for medium- to long-term revenue growth and growth investment capital.
2. Details of acquisition
(1) Type of shares to be acquired: Shares of common stock
(2) Total number of shares to be acquired: Up to 14 million shares (Equivalent to 8.5% of outstanding shares excluding treasury stock)
(3) Total cost of acquisition: Up to ¥150 billion
(4) Period of acquisition: From May 28, 2019 to December 31, 2019
(5) Method of acquisition: Acquisition through market transactions on the Tokyo Stock Exchange
Financial SectionInvestor Information
Notes to Consolidated Financial Statements
PAGE 27TOKYO ELECTRON ANNUAL REPORT 2019

Independent Auditor’s Report
Financial SectionInvestor Information
Independent Auditor’s Report
PAGE 28TOKYO ELECTRON ANNUAL REPORT 2019

Consolidated Subsidiaries (As of March 31, 2019) Investor Information (As of March 31, 2019)
JAPAN • Tokyo Electron Technology Solutions Limited
• Tokyo Electron Kyushu Limited
• Tokyo Electron Miyagi Limited
• Tokyo Electron FE Limited
• Tokyo Electron BP Limited
• Tokyo Electron Agency Limited
U.S. • Tokyo Electron U.S. Holdings, Inc.
• Tokyo Electron America, Inc.
• TEL Technology Center, America, LLC
• TEL Venture Capital, Inc.
• TEL Epion Inc.
• TEL FSI, Inc.
EUROPE • Tokyo Electron Europe Limited
• Tokyo Electron Israel Limited
• TEL Magnetic Solutions Limited
ASIA • Tokyo Electron Korea Limited
• Tokyo Electron Taiwan Limited
• Tokyo Electron (Shanghai) Limited
• Tokyo Electron (Kunshan) Limited
• Tokyo Electron Singapore Pte. Limited
33 consolidated subsidiaries in total, including the above 20 companies
Stock Price and Trading Volume
25,000
10,000
15,000
20,000
5,000
0
(Thousands of shares)(Yen)
Trading volume
Stock price100,000
50,000
0
CY2016CY2015 CY2017 CY2018 CY2019CY2014
Number ofshares held(thousands)
Votingshare ratio
(%)
The Master Trust Bank of Japan Limited (trust account) 30,791 18.75Japan Trustee Services Bank Limited (trust account) 17,573 10.70JP Morgan Chase Bank 380055 9,627 5.86Tokyo Broadcasting System Holdings, Inc. 7,077 4.31Trust & Custody Services Bank, Limited (securities investment trust account) 3,672 2.23
JP Morgan Chase Bank 385151 3,108 1.89Japan Trustee Services Bank Limited (trust account 4) 2,801 1.70Japan Trustee Services Bank Limited (trust account 5) 2,616 1.59State Street Bank West Client Treaty 505234 2,538 1.54Japan Trustee Services Bank Limited (trust account 7) 2,442 1.48Notes: 1. Shares of less than one thousand have been rounded down in the “Number of shares held.” 2. Voting share ratios are calculated excluding treasury stock (1,002,816 shares). Figures are truncated after
the second decimal place. Treasury stock excludes the 249,701 Company shares owned by the executive compensation Board Incentive Plan (BIP) trust account and the share-delivering Employee Stock Ownership Plan (ESOP).
Distribution of Ownership among Shareholders:Treasury stock0.61%
Foreign institutions and others32.69%
Japanese financial institutions and securities companies51.61%
Japanese individuals and others9.59%
Other Japanese corporations5.50%
Corporate Name and Head Office:Tokyo Electron LimitedAkasaka Biz Tower3-1 Akasaka 5-chome, Minato-ku,Tokyo 107-6325, Japan
Established:November 11, 1963
Annual General Meeting of Shareholders:June
Common Stock:Stock trading unit 100 sharesAuthorized 300,000,000 sharesIssued 165,210,911 sharesNumber of shareholders 50,843
Common Stock Listed on:Tokyo Stock Exchange 1st Section (Stock code: 8035)
Independent Auditor:KPMG AZSA LLC
Administrator of Shareholders’ Register:Sumitomo Mitsui Trust Bank, Limited4-1 Marunouchi 1-chome, Chiyoda-ku, Tokyo, Japan
Direct mail and inquiries to:Sumitomo Mitsui Trust Bank, Limited8-4 Izumi 2-chome, Suginami-ku, Tokyo, 168-0063, JapanTel (toll free): 0120-782-031 (available only in Japan)
For Further Information, Contact:Investor RelationsTokyo Electron LimitedAkasaka Biz Tower3-1 Akasaka 5-chome, Minato-ku,Tokyo 107-6325, JapanTel: +81-3-5561-7000
Website:www.tel.com
Major Shareholders:
Years ended March 31 2015 2016 2017 2018 2019
High (yen) 9,451 8,450 12,285 23,875 21,935
Low (yen) 5,751 5,519 6,603 11,455 11,595
Total shareholder return (%) 134.8 122.0 203.7 337.9 286.4
(TOPIX, dividends reinvested) (130.7) (116.5) (133.7) (154.9) (147.1)
Financial SectionInvestor Information
Consolidated Subsidiaries Investor Information
PAGE 29TOKYO ELECTRON ANNUAL REPORT 2019