TODD C. FAHEY State Director AARP NEW HAMPSHIRE · A LIVABLE COMMUNITY…. • Features housing...
31
TODD C. FAHEY State Director AARP NEW HAMPSHIRE
Transcript of TODD C. FAHEY State Director AARP NEW HAMPSHIRE · A LIVABLE COMMUNITY…. • Features housing...

TODD C. FAHEYState DirectorAARP NEW HAMPSHIRE

THINK A MOMENT …
https://vimeo.com/aarpbroadcast/review/206247677/cc9d7fd195

3
“A community that is safe and secure, has affordable and appropriate housing and transportation options, and has
supportive community features and services. Once in place, those resources enhance personal independence; allow
residents to age in place; and foster residents’ engagement in the community’s civic, economic, and social life”
Age-Friendly and Livable Communities

The Built Environment
The Social Environment
Our Vision and the “8 Domains of Livability”Network of Age-Friendly Communities The

The 8 Domains of Livability
The availability and quality of these community features
impact the well-being of older adults
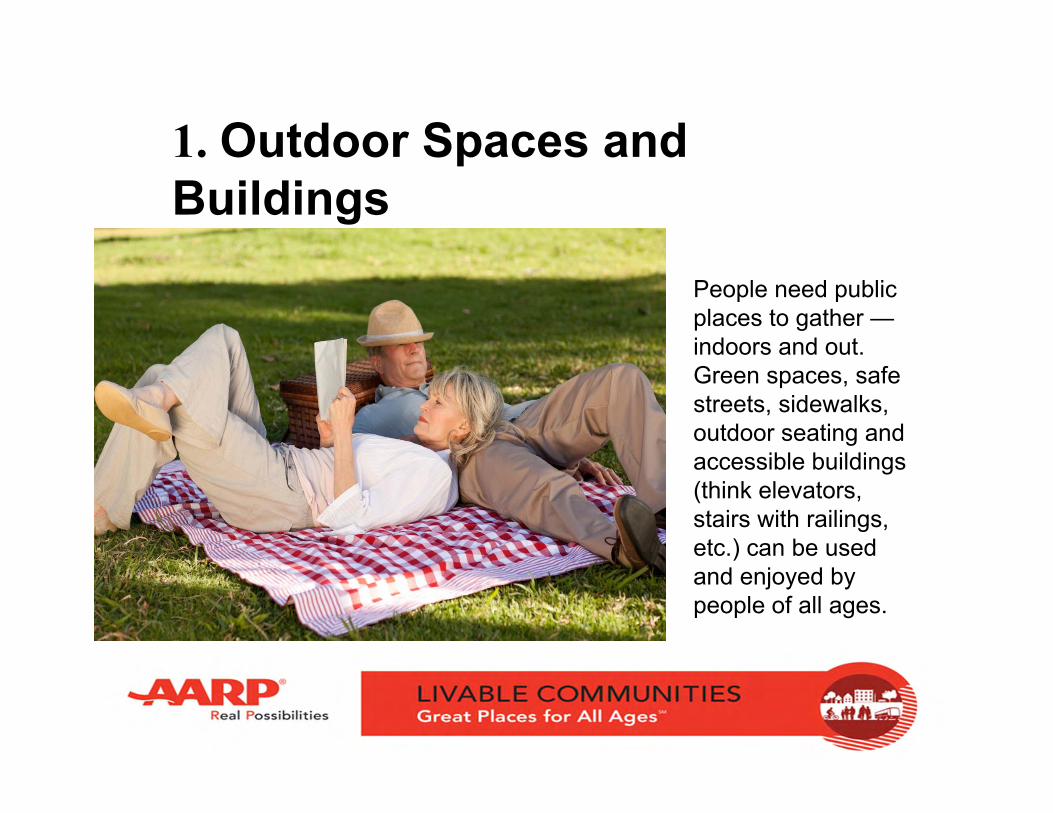
People need public places to gather —indoors and out. Green spaces, safe streets, sidewalks, outdoor seating and accessible buildings (think elevators, stairs with railings, etc.) can be used and enjoyed by people of all ages.
1. Outdoor Spaces and Buildings

Transform Public Spaces

Driving shouldn't be the only way to get around. Public transit options can be as expansive and as infrastructure dependent as a train system or as targeted as a taxi service that provides non-drivers with rides to and from a doctor's office.
2. Transportation
https://vimeo.com/aarpbroadcast/review/206595921/d52d294d41
Ask Experts, best practice video
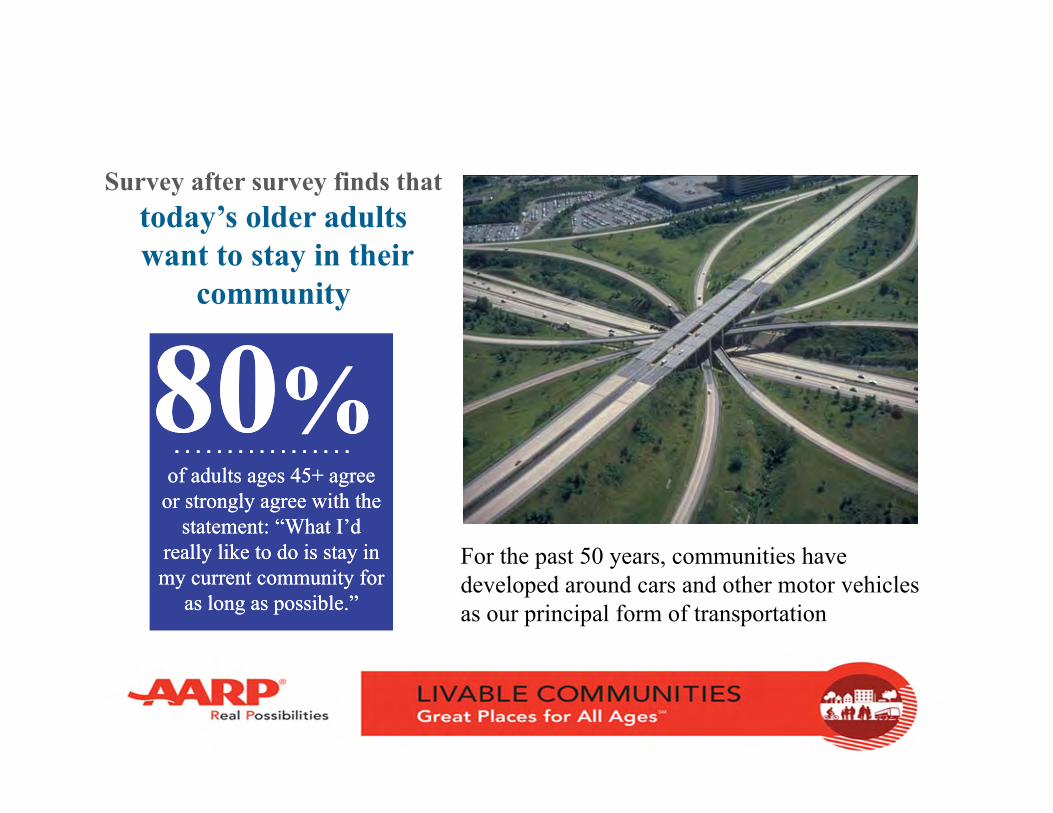
Survey after survey finds that today’s older adultswant to stay in their
community
For the past 50 years, communities have developed around cars and other motor vehicles as our principal form of transportation
80%80%of adults ages 45+ agree
or strongly agree with the statement: “What I’d
really like to do is stay in my current community for
as long as possible.”
of adults ages 45+ agree or strongly agree with the
statement: “What I’d really like to do is stay in my current community for
as long as possible.”

Risky Roadways 1. Hawaii2. Vermont3. New Hampshire4. Massachusetts5. New York6. Maine7. Rhode Island8. Idaho9. California10. Washington D.C.
Highest risk of pedestrian death for people age 65 and older vs. younger, per the 2016 Dangerous by Design report.
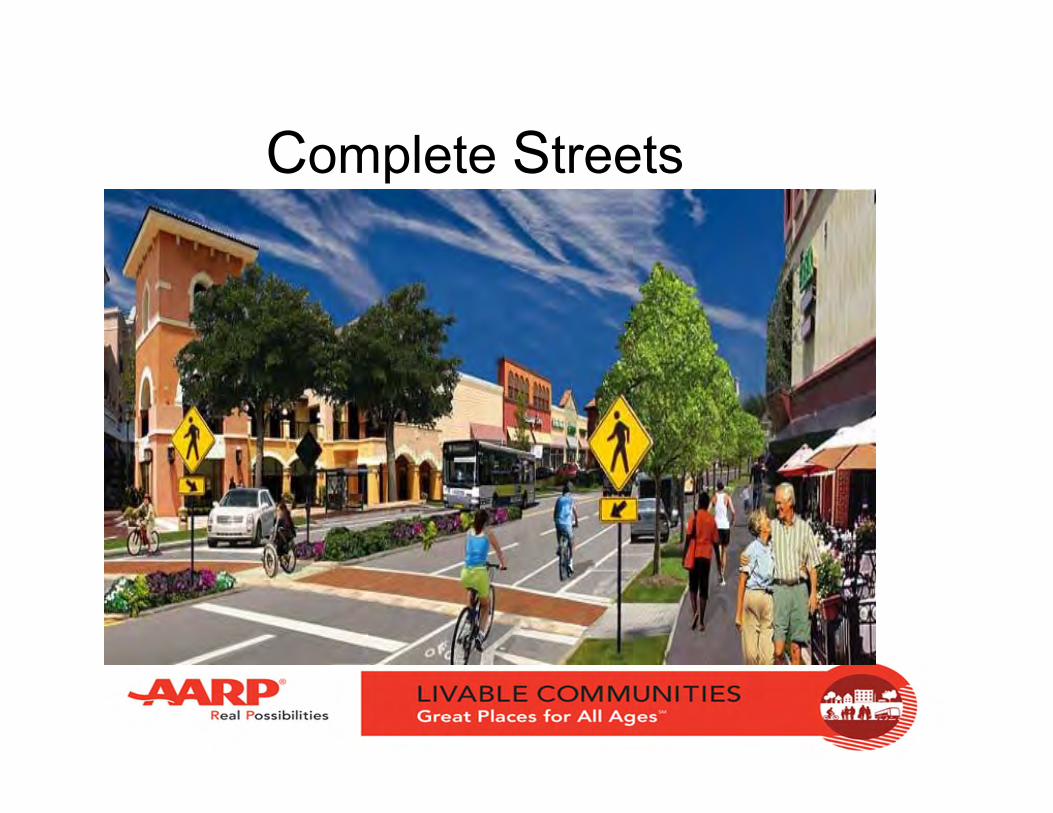
Complete Streets

IncompleteStreets

Improved access for all modes

AARP surveys consistently find that older adults want to stay in their homes and communities for as long as possible. Doing so ispossible if a house is designed or modified for aging in place and if a community includes housing options for varying life stages (and varying bank accounts).
3. Housing
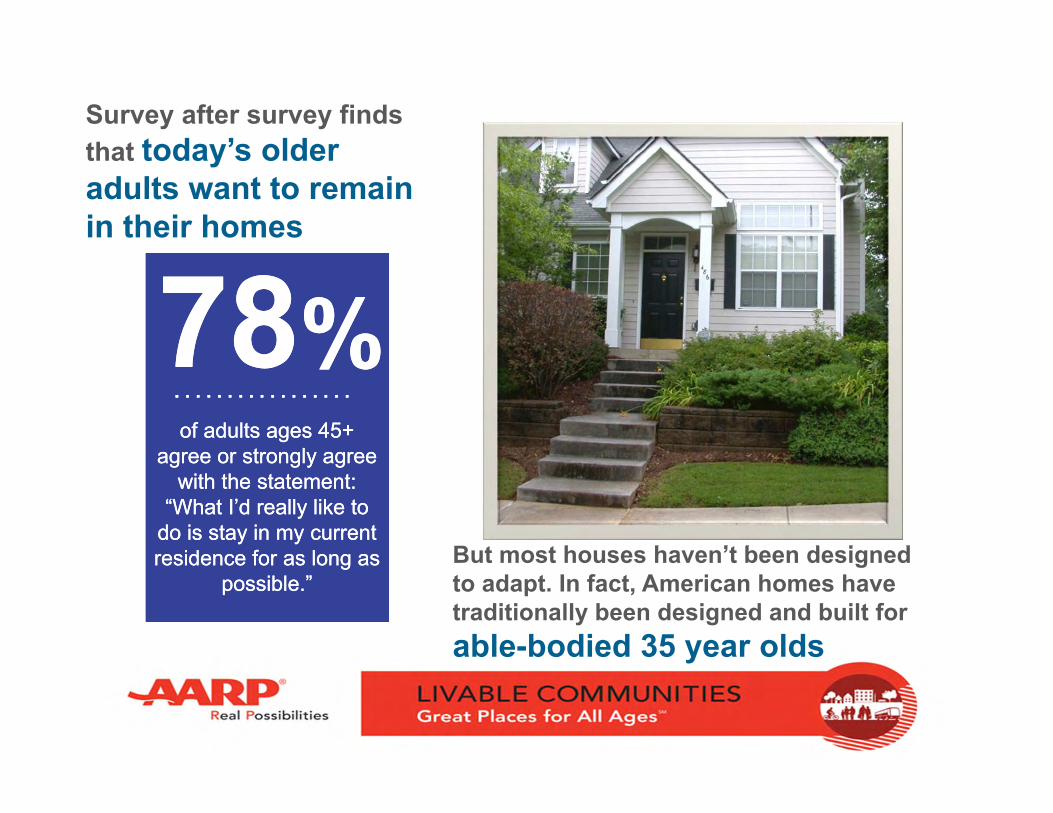
Survey after survey finds that today’s older adults want to remain in their homes
But most houses haven’t been designed to adapt. In fact, American homes have traditionally been designed and built forable-bodied 35 year olds
78%78%of adults ages 45+
agree or strongly agree with the statement:
“What I’d really like to do is stay in my current residence for as long as
possible.”
of adults ages 45+ agree or strongly agree
with the statement: “What I’d really like to
do is stay in my current residence for as long as
possible.”
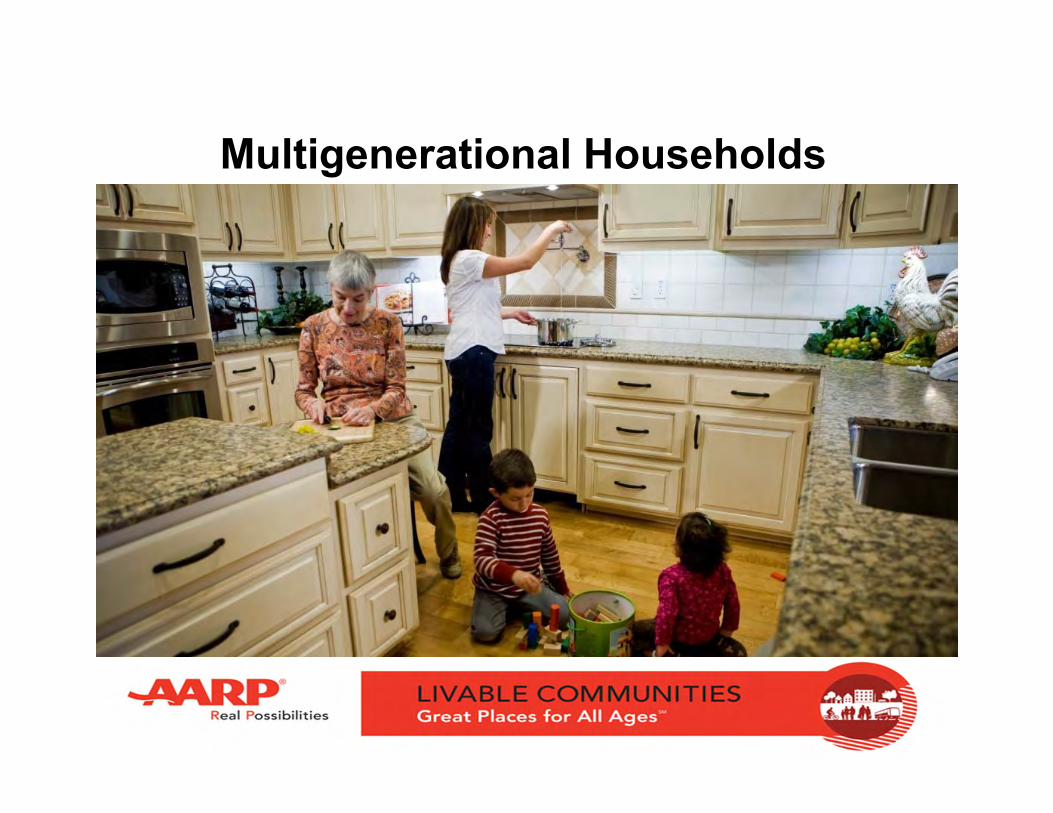
Multigenerational Households
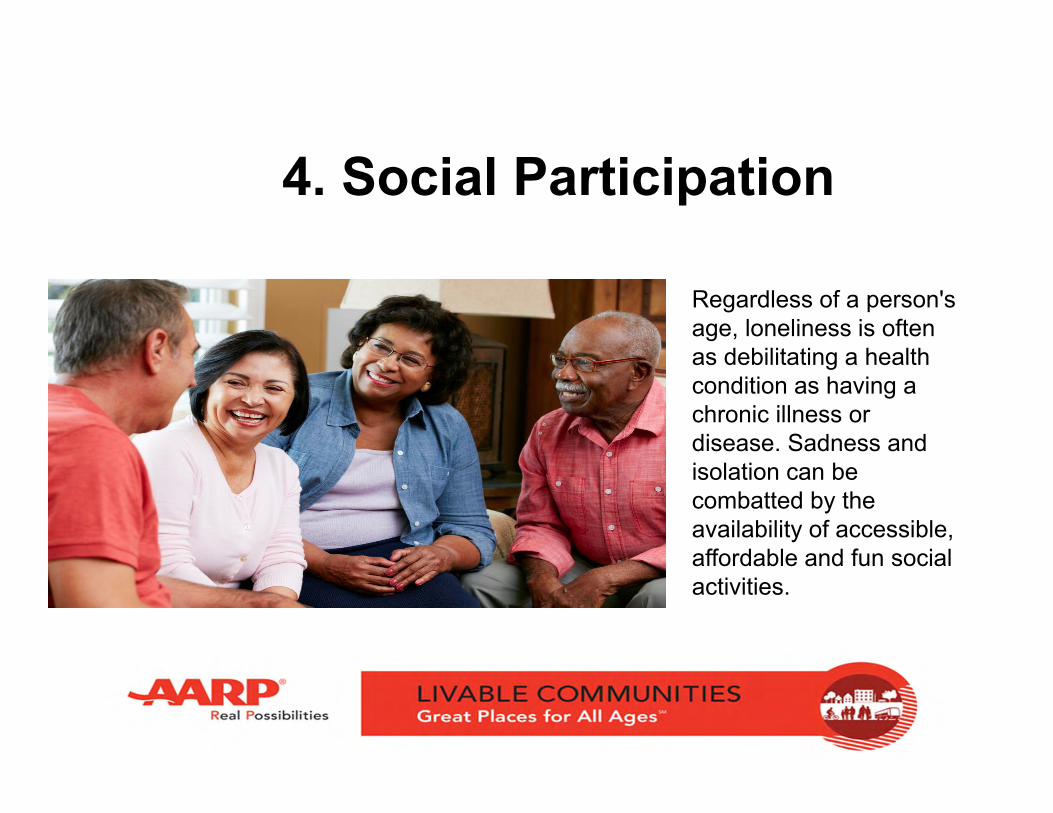
Regardless of a person's age, loneliness is often as debilitating a health condition as having a chronic illness or disease. Sadness and isolation can be combatted by the availability of accessible, affordable and fun social activities.
4. Social Participation

Everyone wants to feel valued. Intergenerational activities are a great way for young and old to learn from one another, honor what each has to offer and, at the same time, feel good about themselves.
5. Respect and Social Inclusion

Why does work need to be an all or nothing experience? An age-friendly community provides ways older people can (if they choose) continue to work for pay, volunteer their skills and be actively engaged in community life.
6. Civic Participation and Employment

Information today is delivered in ways few could have imagined a decade ago — and many still don't know how to use. Age-friendly communities recognize that not everyone has a smartphone or Internet access and that information needs to be disseminated through a variety of means.
7. Communication and Information
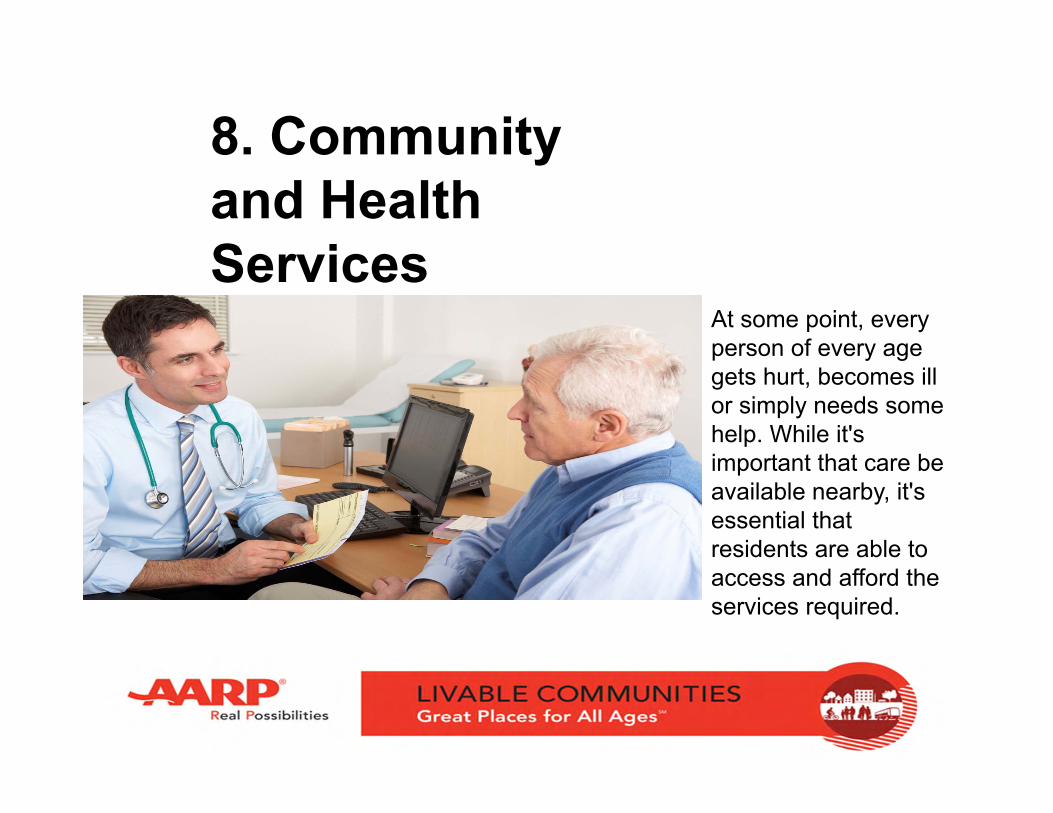
At some point, every person of every age gets hurt, becomes ill or simply needs some help. While it's important that care be available nearby, it's essential that residents are able to access and afford the services required.
8. Community and Health Services
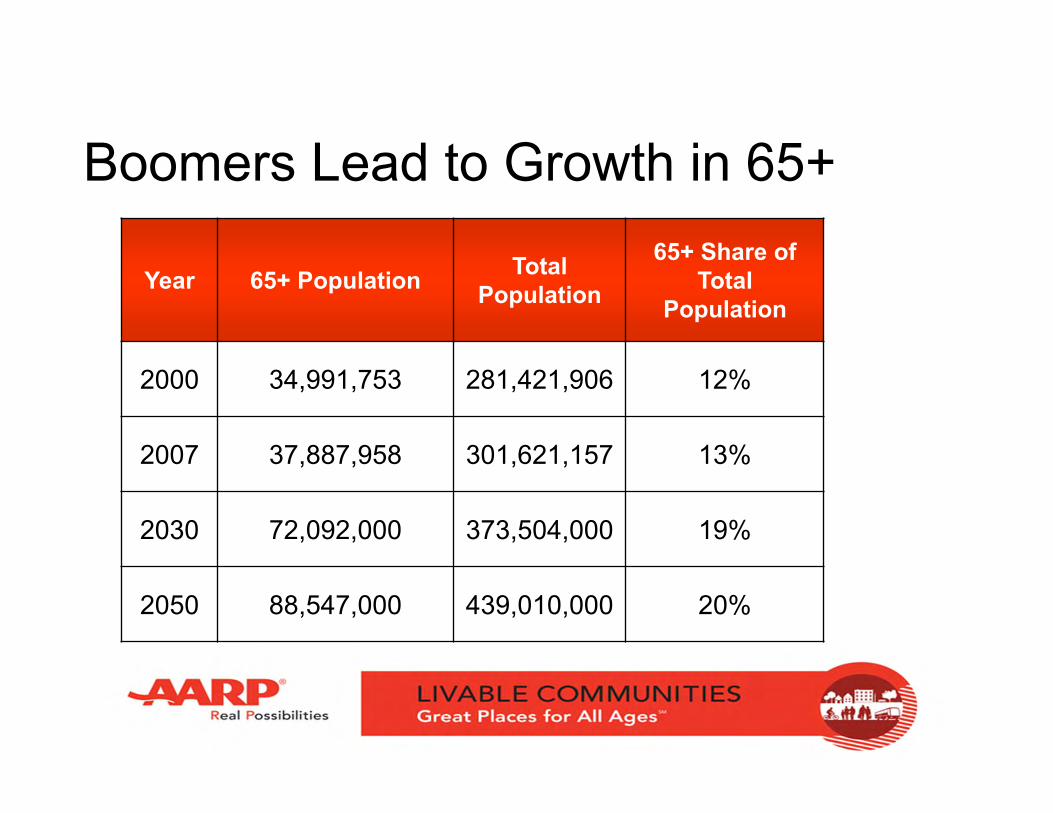
Boomers Lead to Growth in 65+
Year 65+ Population Total Population
65+ Share of Total
Population
2000 34,991,753 281,421,906 12%
2007 37,887,958 301,621,157 13%
2030 72,092,000 373,504,000 19%
2050 88,547,000 439,010,000 20%

Boomers and Millennials: Changing Preferences

LONGEVITY ECONOMYA LIVABLE COMMUNITY….• Features housing choices that are suitable for people of all ages and life
states.
• Reduces automobile dependence and supports a socially vibrant public realm.
• Integrates land uses so people can live closer to our within walking distance of jobs, community activities and services they need.
• Has transportation options that enable residents to get around even if they don’t drive.

LONGEVITY ECONOMYKEY FINDINGS:
• COMPACTNESS helps make a community walkable, decreases automobile dependence, and supports a socially vibrant public realm.
• INTEGRATION OF LAND USES helps older adults live closer to or within walking distance of work, community activities, and the services they need.
• HOUSING DIVERSITY helps ensure that appropriate housing is available for each stage of the life span.
• TRANSPORTATION OPTIONS helps older adults remain independent, mobile, and engaged in their surrounding community.

5 Things to Do and NOT to Do
DON’T… DO…
1. Assume changes HAVE to be costly
2. Just build a senior center
3. Plan JUST for one age group
4. View older people as a drain
5. Ignore pedestrians and design JUST for cars
1. Reach out to your residents
2. Bring in other funders and partners
3. Recognize the value of 50+ residents
4. Borrow ideas from others
5. Understand that small changes can make a big difference

28
We’re entering a time of profound and permanent change to the demographic composition of the United States
By 2030 the U.S. will have twice as many people over the age of 65 as we have today
Every day, 10,000boomers turn 65
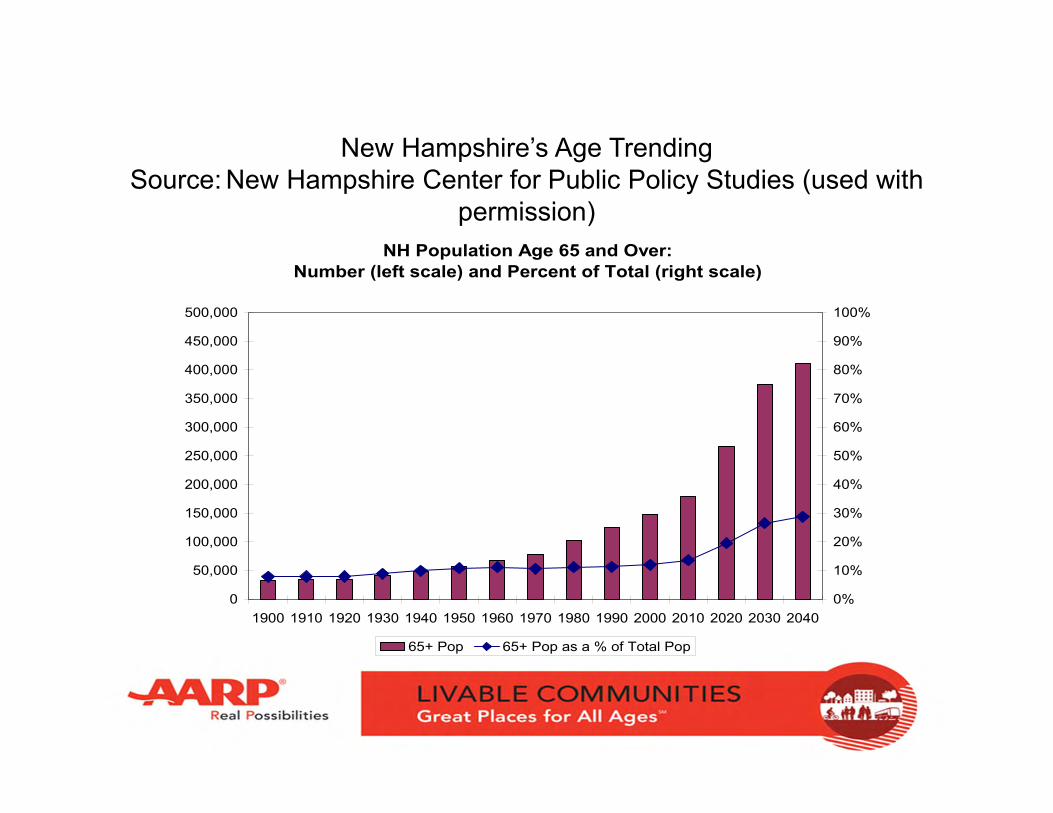
New Hampshire’s Age TrendingSource: New Hampshire Center for Public Policy Studies (used with
permission)NH Population Age 65 and Over:
Number (left scale) and Percent of Total (right scale)
0
50,000
100,000
150,000
200,000
250,000
300,000
350,000
400,000
450,000
500,000
1900 1910 1920 1930 1940 1950 1960 1970 1980 1990 2000 2010 2020 2030 20400%
10%
20%
30%
40%
50%
60%
70%
80%
90%
100%
65+ Pop 65+ Pop as a % of Total Pop
https://vimeo.com/aarpbroadcast/review/206428243/4634481027
Thank you