Today’s Topic-- Production and Output. Into Outputs Firms Turn Inputs (Factors of Production)
26
Today’s Topic-- Production and Output
-
Upload
colleen-french -
Category
Documents
-
view
231 -
download
4
Transcript of Today’s Topic-- Production and Output. Into Outputs Firms Turn Inputs (Factors of Production)

Today’s Topic--
Production and Output

Into OutputsInto Outputs
Firms Turn Inputs Firms Turn Inputs (Factors of Production)(Factors of Production)

WHAT ARE COSTS?
• The Firm’s Objective– The economic goal of the firm is to maximize
profits.

Total Revenue, Total Cost, and Profit
• Total Revenue– The amount a firm receives for the sale of its
output.
• Total Cost– The market value of the inputs a firm uses in
production.
Profit = Total revenue - Total cost

Costs as Opportunity Costs• A firm’s cost of production includes all the opportunity costs of making its output of goods and services.
• Explicit and Implicit Costs– A firm’s cost of production include explicit
costs and implicit costs.
• Explicit costs are input costs that require a direct outlay of money by the firm.
• Implicit costs are input costs that do not require an outlay of money by the firm.

Economic Profit versus Accounting Profit
• Economists measure a firm’s economic profit as total revenue minus total cost, including both explicit and implicit costs.
• Accountants measure the accounting profit as the firm’s total revenue minus only the firm’s explicit costs.

Economic Profit versus Accounting Profit
• When total revenue exceeds both explicit and implicit costs, the firm earns economic profit.– Economic profit is smaller than accounting
profit.

Figure 1 Economic versus Accountants
Copyright © 2004 South-Western
Revenue
Totalopportunitycosts
How an EconomistViews a Firm
How an AccountantViews a Firm
Revenue
Economicprofit
Implicitcosts
Explicitcosts
Explicitcosts
Accountingprofit

Short Run--Period long enough to Period long enough to
change some, but not all, inputschange some, but not all, inputs
Long Run-- Period long enough to change all inputs
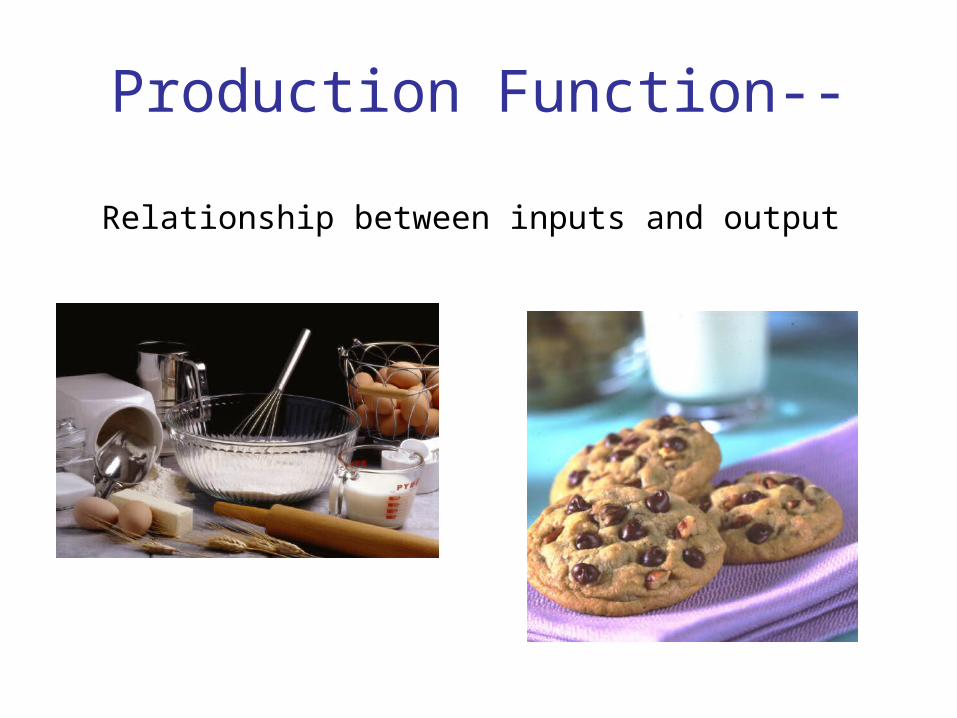
Production Function--
Relationship between inputs and output

Production Function
Indicates the output that a firm produces for every specified combination of inputs
Describes what is technically feasible when firm operates efficiently

Marginal Product--
The additional output that can be produced by one more unit of a particular input, while holding all
other inputs constant
in Q
in variable inputMP =

AP = Q variable input
Average Product
The amount of output produced by the typical unit of a particular input, while
holding all other inputs constant

Law of Diminishing Marginal Returns--
As you combine more and more of the variable input with the same amount of fixed input,
eventually the additional output produced will decrease.
Short Run

Diminishing Marginal Product
– Example: As more and more workers are hired at a firm, each additional worker contributes less and less to production because the firm has a limited amount of equipment.
– The slope of the production function measures the marginal product of an input, such as a worker.
– When the marginal product declines, the production function becomes flatter.

Figure 2 Hungry Helen’s Production Function
Copyright © 2004 South-Western
Quantity ofOutput
(cookiesper hour)
150
140
130
120
110
100
90
80
70
60
50
40
30
20
10
Number of Workers Hired0 1 2 3 4 5
Production function

output
Variable input
TP
Diminishing Marginal Returns
MP
Diminishing Marginal Returns

Cost ClassificationsCost Classifications
FIXED COSTS– Costs that stay
the same no matter how
much output is produced
FC
Costs that increase with the level of
output
VC

Total Cost = TC
TC = FC + VC
FC = TC - VC
VC = TC - FC
Think TOTAL

Average Total Cost = ATC
ATC = TC AVC = VC AVC = VC
Q Q Q
ATC = AFC + AVC
AFC = ATC – AVC
AVC = ATC – AFC
Think AVERAGE

Marginal Cost = MC
MC = Change in TC = Δ TC
Change in Q Δ Q
The rate at which costs ↑
When Q ↑
Think on the MARGIN

From the Production Function to the Total-Cost Curve• The firm uses inputs to produce output
-the production function
• The total-cost curve graphically shows the relationship between the amount of output produced by the firm and the cost associated with this production.
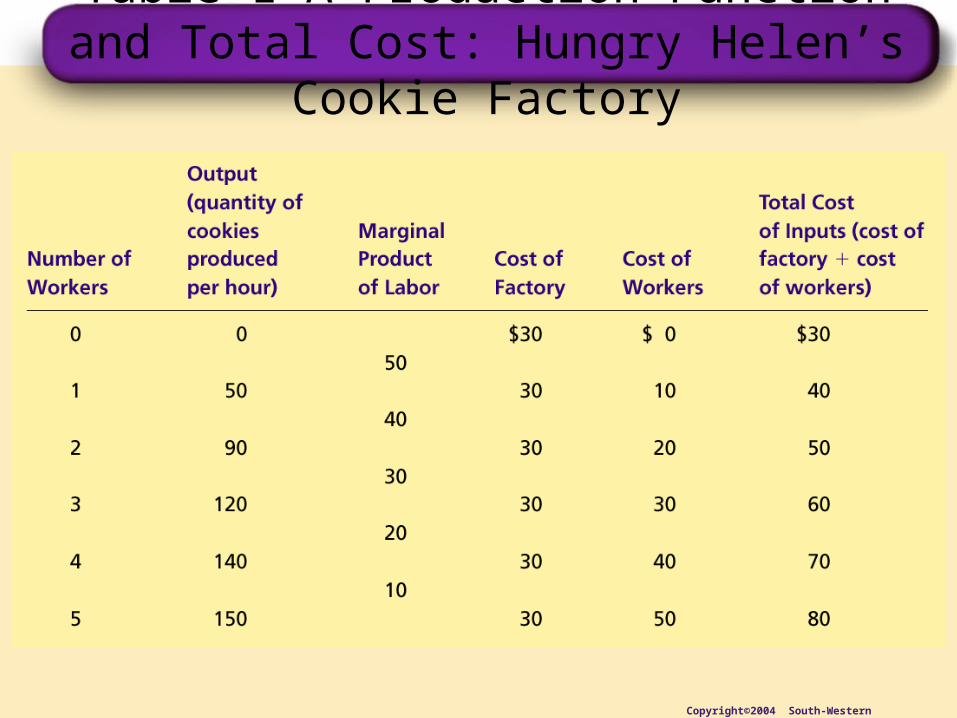
Table 1 A Production Function and Total Cost: Hungry Helen’s Cookie Factory
Copyright©2004 South-Western

Figure 2 Hungry Helen’s Production Function
Copyright © 2004 South-Western
Quantity ofOutput
(cookiesper hour)
150
140
130
120
110
100
90
80
70
60
50
40
30
20
10
Number of Workers Hired0 1 2 3 4 5
Production function

Figure 3 Hungry Helen’s Total-Cost Curve
Copyright © 2004 South-Western
TotalCost
$80
70
60
50
40
30
20
10
Quantityof Output
(cookies per hour)
0 10 20 30 15013011090705040 1401201008060
Total-costcurve

Cost Curves and Their Shapes
• Rising marginal cost as the amount of output produced increases reflects the property of diminishing marginal product.