TOCANTINZINHO GOLD PROJECT PRELIMINARY ECONOMIC ASSESSMENT FOUR … · 2013-03-28 · tocantinzinho...
173
TOCANTINZINHO GOLD PROJECT PRELIMINARY ECONOMIC ASSESSMENT FOUR MILLION TONS/YEAR SCENARIO TAPAJÓS GOLD DISTRICT, PARÁ STATE, BRAZIL Prepared by NCL Brasil Ltda. March 2010
Transcript of TOCANTINZINHO GOLD PROJECT PRELIMINARY ECONOMIC ASSESSMENT FOUR … · 2013-03-28 · tocantinzinho...
TOCANTINZINHO GOLD PROJECT
PRELIMINARY ECONOMIC ASSESSMENT
FOUR MILLION TONS/YEAR SCENARIO
TAPAJÓS GOLD DISTRICT, PARÁ STATE, BRAZIL
Prepared by NCL Brasil Ltda.
March 2010
2
TABLE OF CONTENTS 1 SUMMARY ............................................................................................................. 8
1.1 MINERAL RESOURCES AND RESERVES .................................................. 9 1.2 KEY ASPECTS OF THE TOCANTINZINHO PROJECT ............................ 10
1.3 CONCLUSIONS AND RECOMMENDATIONS ......................................... 11 2 INTRODUCTION ................................................................................................ 12
2.1 INTRODUCTION .......................................................................................... 12
2.2 TERMS OF REFERENCE ..................................................................................... 13
3 RELIANCE ON OTHER EXPERTS ................................................................. 14
4 PROPERTY DESCRIPTION AND LOCATION ............................................. 15
4.1 LOCATION .................................................................................................... 15 4.2 PROJECT OWNERSHIP ............................................................................... 17
4.2.1 Details of properties holding the deposit ................................................ 17
4.3 ENVIROMENTAL LIABILITIES ................................................................. 19 4.4 STATUS OF REQUIRED PERMITS ............................................................ 19
5 ACCESSIBILITY, CLIMATE, LOCAL RESOURCES, INFRASTRUC TURE AND PHYSIOGRAPHY. ............................................................................................. 21
5.1 ACCESSIBILITY AND INFRASTRUCTURE ............................................. 21 5.2 PHYSIOGRAPHY, CLIMATE AND VEGETATION .................................. 21
5.3 LOCAL RESOURCES ................................................................................... 23
6 HISTORY .............................................................................................................. 25 7 GEOLOGICAL SETTING .................................................................................. 27
7.1 REGIONAL GEOLOGY ................................................................................ 27
7.2 LOCAL GEOLOGY ....................................................................................... 29
8 DEPOSIT TYPES ................................................................................................. 33 9 MINERALIZATION ........................................................................................... 35 10 EXPLORATION .................................................................................................. 38
10.1 TOCANTINZINHO AREA .................................................................................... 38
10.2 OTHER AREAS ................................................................................................. 40
11 DRILLING ............................................................................................................ 43 11.1 CORE DRILLING PROGRAMS ................................................................... 43
12 SAMPLING METHOD AND APPROACH ...................................................... 46
12.1 DRILL CORE SAMPLING ............................................................................ 46
13 SAMPLE PREPARATION, ANALYSES AND SECURITY .......................... 48 13.1 DRILL CORE AND ROCK ASSAY METHODS.......................................... 48
13.1.1 METHOD OF SAMPLE PREPARATION FOR ASSAYING .............. 49 13.2 METHOD OF GOLD ANALYSIS BY FIRE ASSAY/AA FINISH .............. 49
14 DATA VERIFICATION ...................................................................................... 51
14.1 CHECK ANALYSIS ...................................................................................... 51
14.1.1 Brazauro Protocol of QAQC .................................................................. 51
14.1.2 Eldorado Protocol of QAQC .................................................................. 51
14.2 QAQC ANALYSIS ........................................................................................ 51
14.2.1 Failure rate .............................................................................................. 52 14.2.2 Blank Samples ........................................................................................ 52
14.2.3 Standard Samples ................................................................................... 53
14.2.4 Duplicates ............................................................................................... 56 14.3 CONCLUSIONS ............................................................................................ 56
15 ADJACENT PROPERTIES ................................................................................ 57
3
16 MINERAL PROCESSING AND METALLURGICAL TESTING ...... .......... 58 16.1 SUMMARY OF THE AVAILABLE INFORMATION................................. 58
16.2 TESTS AT HAZEN RESEARCH .................................................................. 58 16.2.1 Conclusions of Flotation tests by Hazen ................................................ 59
16.2.2 Hazen Study Conclusions ....................................................................... 61
16.3 FLOTATION TESTS AND CYANIDATION OF CONCENTRATES AT
HAZEN RESEARCH ................................................................................................. 61 16.3.1 Test Conclusions .................................................................................... 62
16.4 ADDITIONAL FLOTATION TESTS BY RALPH MEYERTONS .............. 62 16.4.1 Test Conclusions .................................................................................... 64
16.5 GRAVITATIONAL CONCENTRATION TESTS AND CYANIDATION
AT LAKEFIELD ........................................................................................................ 64 16.6 COMMINUTION TESTS BY SGS LAKEFIELD RESEARCH LIMITED .. 66
16.7 CONCLUSIONS FOR SULPHIDE ORE ....................................................... 67 16.8 GOLD BEARING SOIL, SAPROLITE, TRANSITION ZONE, AND
TAILING SAMPLES ................................................................................................. 68
16.9 WORK STARTED BUT ON HOLD CURRENTLY ..................................... 71
17 MINERAL RESOURCE AND MINERAL RESERVE ESTIMATE ..... ......... 72 17.1 SOFTWARE USED ....................................................................................... 72
17.2 DATABASE ................................................................................................... 72 17.3 SPECIFIC GRAVITY .................................................................................... 77
17.4 SELECTION OF REPRESENTATIVE SAMPLES ...................................... 77
17.5 OUTLIER ANALYSIS .................................................................................. 78
17.6 COMPOSITING ............................................................................................. 79
17.7 3D MODELS .................................................................................................. 82
17.8 BLOCK MODEL PARAMETERS ................................................................ 82 17.9 POPULATION ANALYSIS .......................................................................... 83
17.10 VARIOGRAPHY ........................................................................................... 83
17.11 KRIGING STRATEGY .................................................................................. 85
17.12 BLOCK MODEL CONSTRUCTION ............................................................ 85 17.13 MINERAL RESOURCE CRITERIA ............................................................. 86
17.13.1 Classification method ............................................................................. 86
17.13.2 Resource Reporting Criteria ................................................................... 86
17.14 MODEL VALIDATION ................................................................................ 87
17.15 RESULTS ....................................................................................................... 89 17.16 CONCLUSIONS AND RECOMMENDATIONS ......................................... 92
18 OTHER RELEVANT DATA AND INFORMATION ............... ....................... 93 18.1 PROJECT CONCEPT .................................................................................... 93
18.1.1 Manpower ............................................................................................... 93
18.1.2 Mine Site Plan ........................................................................................ 94
18.2 POWER SUPPLY .......................................................................................... 96
18.2.1 Alternatives for the Delivery of Power. ................................................. 96
18.2.2 Power Supplv. ......................................................................................... 99
18.2.3 Conclusions. ......................................................................................... 101
18.3 METALLURGY ........................................................................................... 103
18.3.1 Introduction .......................................................................................... 103
18.3.2 Process Description .............................................................................. 105
18.3.3 Plant Capital Expenditure (CAPEX) for Construction ......................... 108
18.3.1 Operating Cost estimation (OPEX) ...................................................... 109
18.4 GEOTECHNICAL ....................................................................................... 110
4
18.4.1 Stability assessment .............................................................................. 110
18.4.2 CONCLUSIONS .................................................................................. 110
18.5 MINING ....................................................................................................... 112 18.5.1 Pit Optimization and Mine Design ....................................................... 112
18.5.2 Pit Contained Resources ....................................................................... 120
18.5.3 Mine Production Schedule.................................................................... 121
18.5.4 Mine Equipment ................................................................................... 133
18.5.5 Mine Personnel ..................................................................................... 134
18.5.6 Mine Capital Cost ................................................................................. 138
18.5.7 Mine Operating Cost ............................................................................ 142
18.6 ENVIRONMENTAL AND SOCIAL ASPECTS ......................................... 149
18.6.1 Enviromental Conditions ...................................................................... 149
18.6.2 Social Parameters ................................................................................. 149
18.6.3 Brazilian Permitting Process ................................................................ 150
18.6.4 International Financing ......................................................................... 150
18.6.5 Social and Environmental Contribution ............................................... 151
18.7 INFRASTRUCTURE ................................................................................... 152
18.7.1 Climatic Regime ................................................................................... 152
18.7.2 Access ................................................................................................... 152 18.7.3 Access construction details ................................................................... 154
18.7.4 Earthmoving ......................................................................................... 154
18.7.5 Dams: Tailing/Water Containment ....................................................... 154
18.7.6 Explosives Deposit ............................................................................... 154
18.7.7 Airstrip .................................................................................................. 155 18.7.8 Basic Sanitation .................................................................................... 155
18.7.9 Other Works ......................................................................................... 155
18.7.10 Contractors and Machinery .................................................................. 156
18.7.11 Logistics ............................................................................................... 156 18.8 PROJECT ECONOMICS ............................................................................. 158
18.8.1 Assumptions used ................................................................................. 158
18.8.2 Taxation Issues ..................................................................................... 159
18.8.3 Summary Capex ................................................................................... 161
18.8.4 Project Sensitivities .............................................................................. 162
19 INTERPRETATION AND CONCLUSIONS .................................................. 166
19.1 KEY STATISTICS ....................................................................................... 166
19.2 COMMENTS ............................................................................................... 168 20 RECOMMENDATIONS ................................................................................... 169
21 REFERENCES ................................................................................................... 170 22 DATE AND SIGNATURE PAGE .................................................................... 171
5
List of Tables Table 1-1 Mineral Resource Statement ............................................................................ 9 Table 1-2 Mineral Resources contained in the economic pitshell and above cutoff ...... 10
Table 5-1 Monthly average precipitation – Itaituba Station .......................................... 23
Table 11-1 Drilling summary, by company and total per type ....................................... 44
Table 16-1 Test results for Gravimetric separation ....................................................... 60 Table 16-2 Cyanidation Results ..................................................................................... 61 Table 16-3 Relationship between grade-recovery and grind grade ............................... 63
Table 16-4 Summary of flotation tests ............................................................................ 63 Table 16-5 Gravitational/Cyanidation Results .............................................................. 66 Table 16-6 Gravity Tailing Cyanidation Results - 2 ...................................................... 66
Table 16-7 Grindability Test Summary – Nov-07 .......................................................... 67
Table 16-8 Grindability Test Summary – Sept-09 .......................................................... 67
Table 16-9 Leaching Test Summary ............................................................................... 70 Table 17-1: Comparison of drilling totals: additional information since the 2007 PEA73
Table 17-2: SG values adopted for the different rock types ........................................... 77
Table 17-3 Basic statistics of samples from orezone. ..................................................... 77 Table 17-4: Basic statistics and comparison between original and capped samples. ... 78
Table 17-5: Basic statistics for samples and composites inside the orezone. ................ 79
Table 17-6: Zone Codes used in the Block model .......................................................... 82
Table 17-7: Block model parameters ............................................................................. 83 Table 17-8: Variogram parameters ................................................................................ 84 Table 17-9: Kriging strategy for Tocantinzinho gold deposit ........................................ 85
Table 17-10: Parameters used for Whittle ..................................................................... 86 Table 17-11 Mineral Resources Statement ..................................................................... 89 Table 17-12 Mineral resources according to various cut-offs. ...................................... 90
Table 18-1 Manpower requirement for the Project. ...................................................... 93
Table 18-2 Design Criteria for the process plant ....................................................... 103 Table 18-3: Summary of the Operating Cost - OPEX ................................................. 109
Table 18-4: Lerch-Grossman Optimization Parameters .............................................. 113
Table 18-5: Lerch-Grossman Optimization Results ..................................................... 114
Table 18-6: Pit Design Parameters .............................................................................. 118 Table 18-7: Resources Contained in Final Pit ............................................................. 121 Table 18-8: Resources Contained in Mining Phases ................................................... 121
Table 18-9: Mine Production Schedule ........................................................................ 130 Table 18-10: Plant Feed Schedule ............................................................................... 130 Table 18-11: Total hauling distante ............................................................................. 132 Table 18-12: Peak Fleet Requirements ........................................................................ 133 Table 18-13: Mine Major Equipment Fleet Requirement ............................................ 134
Table 18-14: Support Equipment Requirement ............................................................ 134
Table 18-15: Salaried Staff Labour Requirements ....................................................... 136
Table 18-16: Mine Hourly Labour Requirements ........................................................ 137
Table 18-17: Summary of Mine Capital Costs (US$’000) ........................................... 139
Table 18-18: Mine Capital Costs (US$’000) ............................................................... 140 Table 18-19: Mine Major Equipment Salvage Values (US$’000) ............................... 141
Table 18-20: Summary of Total and Unit Mining Costs .............................................. 142
Table 18-21: Summary of Operating Hours ................................................................. 143 Table 18-22: Summary of Hourly Costs ....................................................................... 143 Table 18-23: Summary of Mine Operating Costs - Total Dollars (US$’000) .............. 145
6
Table 18-24: Summary of Mine Operating Costs –Per Total Tonne (US$/tonne) ....... 146
Table 18-25: Source foreseen for the building material needed. ................................. 156
Table 18-26 Infrastructure capital items ..................................................................... 157 Table 18-27 Base case cash flow in nominal terms ..................................................... 160
Table 18-28 CAPEX required for construction ............................................................ 161 Table 18-29: Sensitivities for gold price ...................................................................... 162 Table 19-1 Key Operational Parameters ..................................................................... 166 Table 19-2: Unit costs .................................................................................................. 166 Table 19-3: Key financial parameters .......................................................................... 167 List of Figures Figure 4-1 Tocantinzinho Project Location Map. .......................................................... 16
Figure 4-2 Claims Map. ................................................................................................. 17 Figure 5-1 Aerial view of Tocantinzinho Project ........................................................... 22 Figure 5-2 Hydrographic Configuration ........................................................................ 24 Figure 7-1 Regional Geology Map. ................................................................................ 28 Figure 7-2 Local Geology Map. ..................................................................................... 31 Figure 10-1 Soil Geochemistry....................................................................................... 39 Figure 11-1 Drilling distribution, according to company .............................................. 45
Figure 14-1 Failures detected by the Eldorado’s QAQC program. .............................. 52
Figure 14-2 Blank samples results. ................................................................................ 52 Figure 14-3 G907-2 standard results. ............................................................................ 53 Figure 14-4 G901-13 standard results. .......................................................................... 54 Figure 14-5 G907-6 standard results. ............................................................................ 54 Figure 14-6 G907-08 standard results. .......................................................................... 55 Figure 14-7 Si42 standard results. ................................................................................. 55 Figure 14-8 HARD graphic of duplicate samples .......................................................... 56
Figure 16-1 Flotation Tests Summary ............................................................................ 71 Figure 17-1: Cross section 315: geology features and Au distribution. ........................ 74
Figure 17-2: Cross section 490: geological features and Au distribution ..................... 75
Figure 17-3: Cross section 630: geological features and Au distribution ..................... 76
Figure 17-4: Probability plot for identification of outliers ............................................ 78
Figure 17-5: Grade (Au) histograms and cumulative curves for samples and composites. .............................................................................................................. 80
Figure 17-6: Histograms – Oxide and Fresh rock mineralization samples ................... 81
Figure 17-7 Search Ellipse. ............................................................................................ 83 Figure 17-8:Variogram from the fresh rock zone analyzed for 2 m composites. ........... 84
Figure 17-9 Floating window along West-East. ............................................................ 87
Figure 17-10 Floating window along South-North. ....................................................... 88
Figure 17-11 Floating window along levels (height) ..................................................... 88
Figure 17-12 Grade vs. tonnage curves ......................................................................... 91 Figure 18-1 Mine Site plan of the Tocantinzinho Project .............................................. 95
Figure 18-2 Distribution of the power grid in the vicinity of the project ....................... 97
Figure 18-3 Proposed processo flowsheet .................................................................. 104 Figure 18-4: Variable Mining Cost with Depth ........................................................... 113 Figure 18-5: Ore Tonnes and Grades versus Pit Number ........................................... 115
Figure 18-6: Tonnes and Grades versus Pit Number .................................................. 115
Figure 18-7: NPV and Recovered Gold versus Pit Number ........................................ 116
Figure 18-8: Average and Incremental Costs versus Recovered Gold ........................ 116
7
Figure 18-9: Pit Shells Cross Sections ......................................................................... 117 Figure 18-10: Pit shells plant view .............................................................................. 117 Figure 18-11: Final Pit Design .................................................................................... 119 Figure 18-12: Mining Phases on Bench 100 ................................................................ 120 Figure 18-13: Total mine schedule by mining phases .................................................. 131
Figure 18-14: Waste mine schedule by mining phases ................................................ 131
Figure 18-15: Ore mine schedule by mining phases .................................................... 132
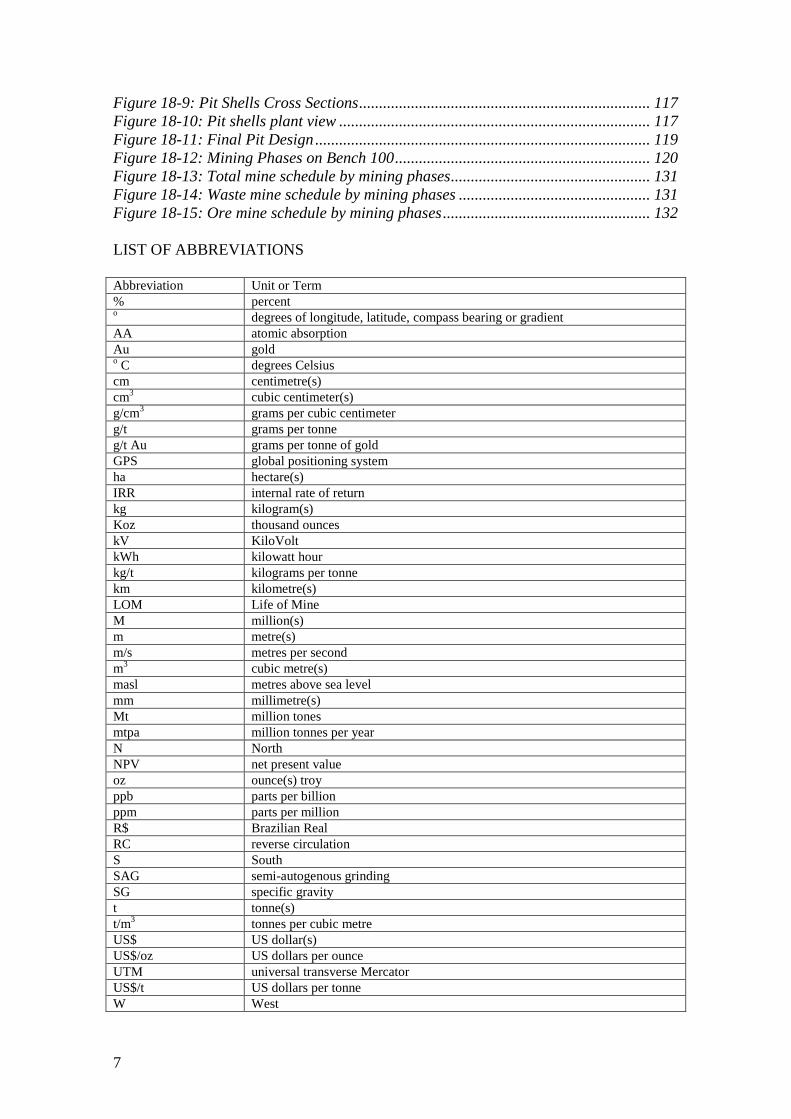
LIST OF ABBREVIATIONS Abbreviation Unit or Term % percent o degrees of longitude, latitude, compass bearing or gradient AA atomic absorption Au gold o C degrees Celsius cm centimetre(s) cm3 cubic centimeter(s) g/cm3 grams per cubic centimeter g/t grams per tonne g/t Au grams per tonne of gold GPS global positioning system ha hectare(s) IRR internal rate of return kg kilogram(s) Koz thousand ounces kV KiloVolt kWh kilowatt hour kg/t kilograms per tonne km kilometre(s) LOM Life of Mine M million(s) m metre(s) m/s metres per second m3 cubic metre(s) masl metres above sea level mm millimetre(s) Mt million tones mtpa million tonnes per year N North NPV net present value oz ounce(s) troy ppb parts per billion ppm parts per million R$ Brazilian Real RC reverse circulation S South SAG semi-autogenous grinding SG specific gravity t tonne(s) t/m3 tonnes per cubic metre US$ US dollar(s) US$/oz US dollars per ounce UTM universal transverse Mercator US$/t US dollars per tonne W West
8
1 SUMMARY
Tocantinzinho is located in the State of Pará in Northern Brazil, in the Tapajós gold province, approximately, 200 km south-southwest of the city of Itaituba. It is a gold deposit which has been in production by artisanal miners (called here by the local name of garimpeiros) since the eighties, but whose true potential was unveiled by Brazauro Resources Corporation (Brazauro). Under the tailing of the hydraulic mining undertaken by the garimpeiros, a bulk tonnage deposit was discovered, measuring at least 700 m x 200 m in area.
At the request of Jim Komadina, President and COO of Brazauro, NCL has been engaged to:
• Produce an updated mineral resources model; • To estimate the resources contained within the economic envelope, using open
cut optimizer software; • To produce an economic assessment at the level of a scoping study (+/- 25%
accuracy), considering the processing costs, infrastructure, power, environment and all costs related to the construction and operation of a gold mine in the Amazon region;
• To prepare a Technical Report that is in compliance with the requirements of the National Instrument 43-101.
The main differences between this report and the previous one, prepared by NCL and published in September 2007, are the following:
• The production rate adopted is 4 million ore tons per annum, while in the previous study the rate was 3 mtpa. This increase was made possible after the confirmation that enough power would be available.
• The Capital estimates were increased to accommodate this increased rate, and also for a more conservative estimate of expenditure for the tailing dam. The exchange rate used is 1.8 R$/US$, to reflect the depreciation of the dollar.
• In the last report no measured resource was estimated, as the topographic data was judged not to be reliable. Additionally, the number of samples used in the new estimate is significantly higher (about 44% more samples).
• Oxide resources were considered as ore in the mining plan, given that new metallurgical testwork demonstrated gold recovery in the order of 66%.
Mineral resources were estimated and classified according to the Australian JORC Code and are reported here in terms equivalent to those of the Canadian Institute of Mining, Metallurgy and Petroleum (CIM) as required by Canadian National Instrument 43-101 (NI 43-101). Considering that JORC requires that mineral reserves should be defined only after a Pre-Feasibility report, no mineral reserves are defined in this scoping study. Since the objective is to estimate the economic potential of the deposit in order to support further investments, all the mineral resources, including the inferred, were used for the preparation of the production plan.
The Qualified Person who prepared this report, the mineral resource estimate and the economic appraisal was Rodrigo Mello, Senior Geologist and Project Manager with
9
NCL Brasil. Mr. Mello has 24 years of experience in the mining industry. He has experience in this style of mineralization, having worked with gold deposits in Proterozoic hydrothermally altered zones in Minas Gerais (Nova Lima Group, several deposits), Goiás (Crixás mine), Amapá (Amapari mine), all in Brazil, and Mali (Yatela and Sadiola mines).
Other professionals from NCL, involved in this work were: Bruno Gadelha, technician, Reinaldo Martins, geologist; Carlos Guzman, Fernanda Bastos and Francisco Carrasco, mining engineers. External consultants engaged were Antonio Gadelha, civil engineer, and Walter de Moura, metallurgy engineer.
1.1 MINERAL RESOURCES AND RESERVES
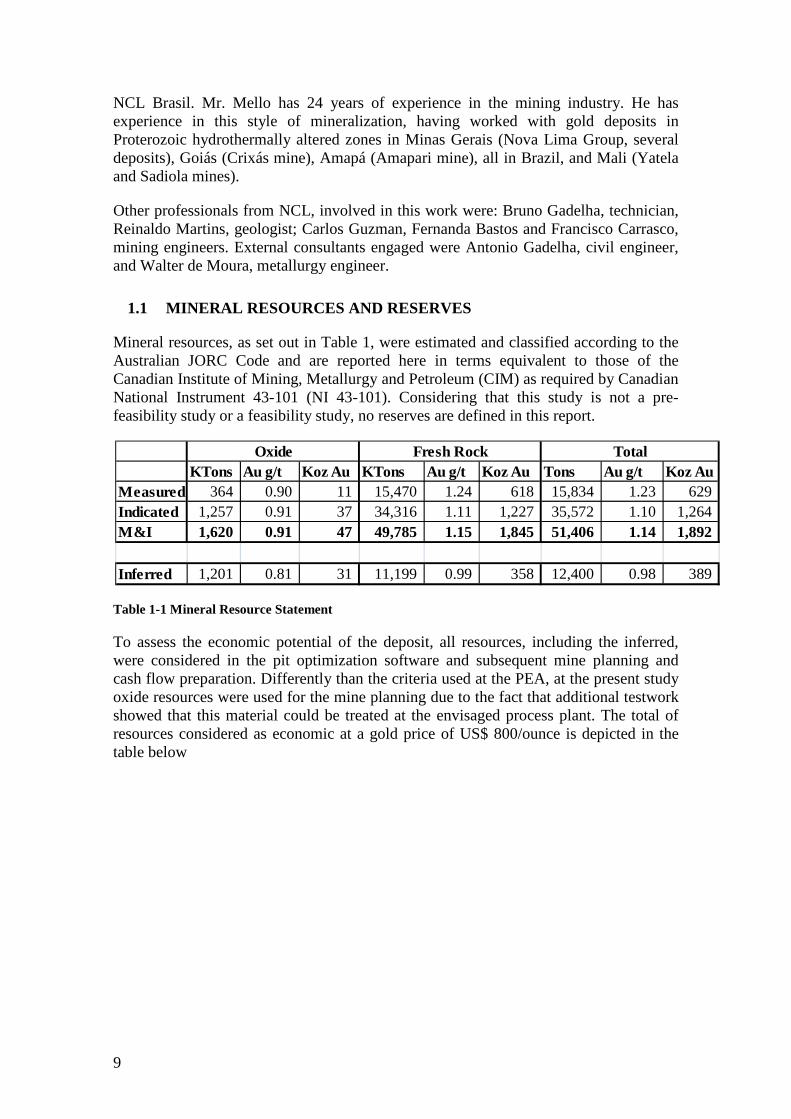
Mineral resources, as set out in Table 1, were estimated and classified according to the Australian JORC Code and are reported here in terms equivalent to those of the Canadian Institute of Mining, Metallurgy and Petroleum (CIM) as required by Canadian National Instrument 43-101 (NI 43-101). Considering that this study is not a pre-feasibility study or a feasibility study, no reserves are defined in this report.
Table 1-1 Mineral Resource Statement
To assess the economic potential of the deposit, all resources, including the inferred, were considered in the pit optimization software and subsequent mine planning and cash flow preparation. Differently than the criteria used at the PEA, at the present study oxide resources were used for the mine planning due to the fact that additional testwork showed that this material could be treated at the envisaged process plant. The total of resources considered as economic at a gold price of US$ 800/ounce is depicted in the table below
KTons Au g/t Koz Au KTons Au g/t Koz Au Tons Au g/t Koz AuMeasured 364 0.90 11 15,470 1.24 618 15,834 1.23 629 Indicated 1,257 0.91 37 34,316 1.11 1,227 35,572 1.10 1,264 M&I 1,620 0.91 47 49,785 1.15 1,845 51,406 1.14 1,892
Inferred 1,201 0.81 31 11,199 0.99 358 12,400 0.98 389
Oxide Fresh Rock Total
10
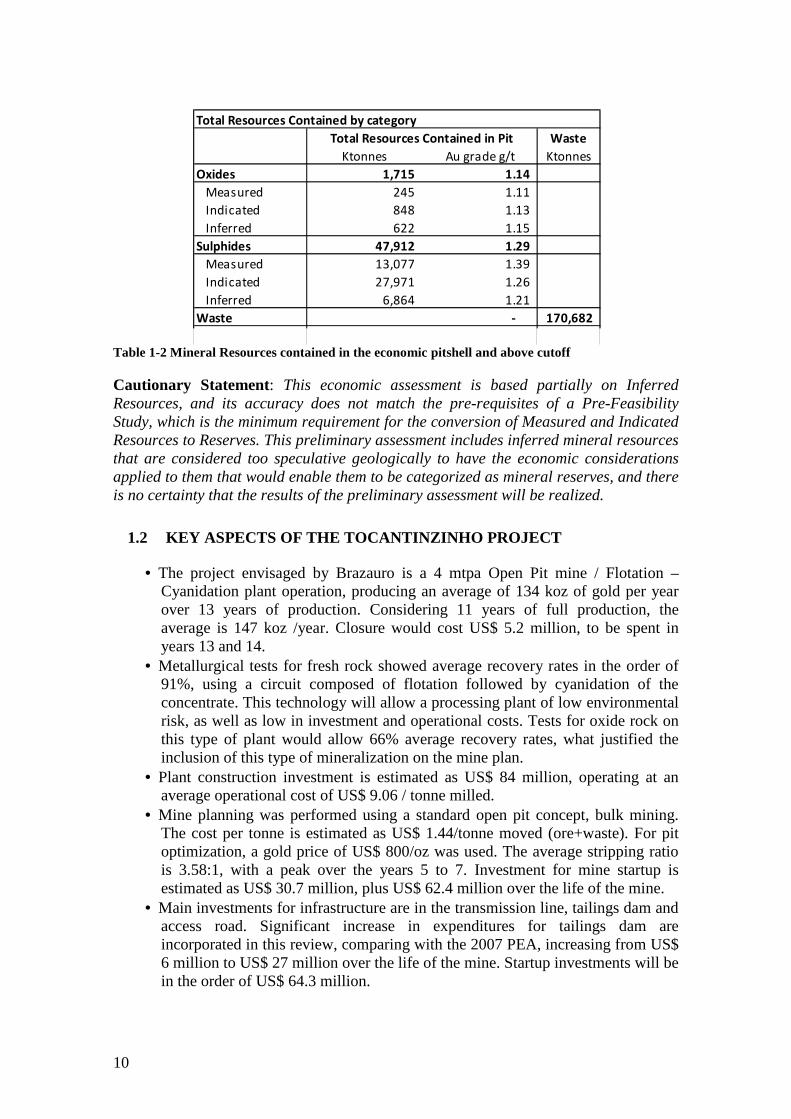
Table 1-2 Mineral Resources contained in the economic pitshell and above cutoff
Cautionary Statement: This economic assessment is based partially on Inferred Resources, and its accuracy does not match the pre-requisites of a Pre-Feasibility Study, which is the minimum requirement for the conversion of Measured and Indicated Resources to Reserves. This preliminary assessment includes inferred mineral resources that are considered too speculative geologically to have the economic considerations applied to them that would enable them to be categorized as mineral reserves, and there is no certainty that the results of the preliminary assessment will be realized.
1.2 KEY ASPECTS OF THE TOCANTINZINHO PROJECT
• The project envisaged by Brazauro is a 4 mtpa Open Pit mine / Flotation – Cyanidation plant operation, producing an average of 134 koz of gold per year over 13 years of production. Considering 11 years of full production, the average is 147 koz /year. Closure would cost US$ 5.2 million, to be spent in years 13 and 14.
• Metallurgical tests for fresh rock showed average recovery rates in the order of 91%, using a circuit composed of flotation followed by cyanidation of the concentrate. This technology will allow a processing plant of low environmental risk, as well as low in investment and operational costs. Tests for oxide rock on this type of plant would allow 66% average recovery rates, what justified the inclusion of this type of mineralization on the mine plan.
• Plant construction investment is estimated as US$ 84 million, operating at an average operational cost of US$ 9.06 / tonne milled.
• Mine planning was performed using a standard open pit concept, bulk mining. The cost per tonne is estimated as US$ 1.44/tonne moved (ore+waste). For pit optimization, a gold price of US$ 800/oz was used. The average stripping ratio is 3.58:1, with a peak over the years 5 to 7. Investment for mine startup is estimated as US$ 30.7 million, plus US$ 62.4 million over the life of the mine.
• Main investments for infrastructure are in the transmission line, tailings dam and access road. Significant increase in expenditures for tailings dam are incorporated in this review, comparing with the 2007 PEA, increasing from US$ 6 million to US$ 27 million over the life of the mine. Startup investments will be in the order of US$ 64.3 million.
Total Resources Contained by category
Waste
Ktonnes Au grade g/t Ktonnes
Oxides 1,715 1.14
Measured 245 1.11
Indicated 848 1.13
Inferred 622 1.15
Sulphides 47,912 1.29
Measured 13,077 1.39
Indicated 27,971 1.26
Inferred 6,864 1.21
Waste - 170,682
Total 49,627 1.28 170,682
Total Resources Contained in Pit
11
• Total Startup Capital is estimated as US$ 239 million, including 10% contingency.
• Manpower is estimated as 477 employees, working in a fly-in-fly-out regime. Operational costs related to G&A are estimated as US$ 2/tonne milled.
• For financial modeling, a base case of US$ 900/oz was used. At this price, the project has a NPV of US$ 128.9 million, using a discount rate of 5%. The post tax 100% equity IRR is 11.9%. If considering the current spot price of US$ 1100/ounce, the NPV at 5% is US$ 327.7 million, and the post tax 100% equity IRR 20.6%.
• Cash operating cost is estimated as US$ 490 per gold ounce produced.
1.3 CONCLUSIONS AND RECOMMENDATIONS
From the results of this work, a feasible gold deposit has been outlined, subject to the uncertainties inherent to the level of the study, a scoping assessment, and to the inclusion of inferred resources in the mine plan and cash flow projection. The infill drilling developed by Eldorado generally confirmed the geometry and grades of the deposit, enhancing the confidence on the resource estimate. Only 15% of the mine plan is based on inferred resources.
There is solid indication that the project deserves investments to undertake additional studies. Further engineering work would increase the accuracy of the cost estimates, and environmental study program should start immediately, considering that this aspect is a key one in order to bring a project to production in a timely manner. Considering that, NCL recommends that a pre-feasibility study should be undertaken to confirm the results presented in this scoping study; to supply the elements for a environmental study and also to ensure enough financing for the expenses of a full feasibility study and subsequent project development.
12
2 INTRODUCTION
2.1 INTRODUCTION
Brazauro Resources Corporation (Brazauro), through its subsidiary Brazauro Recursos Minerais Ltda, retained the services of NCL Brasil Ltda (NCL) to prepare a NI43-101 compliant PEA study and a Technical Report covering its Tocantinzinho (TZ) Gold Project, located in the state of Pará, Brazil, in the region of the Tapajós river valley. It is intended for disclosure at the Toronto Stock Exchange, where Brazauro is listed. The mineral code followed in this report is the CIM code, using the 2005 Edition, and this report follows the recommendations of the National Instrument 43-101.
The mineral resources evaluation update announced by Brazauro in December 8th, 2009, provided the basis for pit designs, estimated open pit mineable resources and mine production schedule. All technical information regarding the resource evaluation is presented in this report.
Rodrigo Mello, Consulting Geologist and Project Manager from Brazil’s NCL office, served as Qualified Person responsible for this report, as defined in CIM Code and the NI 43-101. In his 24 years of industry experience Rodrigo accumulated relevant experience in the exploration and evaluation of gold deposits similar to Tocantinzinho.
In preparing this report, NCL relied on field observations, reports, studies, maps, databases and miscellaneous technical papers listed in the References section of this report.
Antonio Gadelha, civil engineer, was responsible for preparation of the capital cost estimations for infrastructure, namely road access, tailings dam and site edifications.
Walter de Moura, senior metallurgy engineer, partner of Testwork Desenvolvimento de Processos Ltda, reviewed the metallurgical information and designed the process flowsheet, estimating the capital and operational costs for gold extraction.
Eduardo Maldonado, partner of Maldonado and Associates, conducted the studies related to power supply, and is responsible for the estimate of power cost. The capital cost for the transmission line is based on a quote provided by the power company Rede, obtained by Eduardo.
The geotechnical characterization, used to estimate slope angles and pit geometry, was prepared by Graeme Major and Rennie Kaunda, from Golder Associates.
The mineral resource evaluation is based on drillhole data supplied by Brazauro, which relayed partially on information collected by Eldorado, under the terms of an exploration agreement.
NCL is grateful to the valuable contributions received from the Brazauro’s officers Jim Komadina and Elton Pereira, respectively COO and VP Exploration.
13
2.2 Terms of Reference
The PEA study was completed by NCL, with the support of a team of consultants and specialists invited by either NCL or Brazauro. NCL was responsible for the preparation of the overall study as well as resource estimation, open pit mine design, mine capital cost, mine operating cost, and economic models. Other members of the team are listed on the item above.
Rodrigo Mello, Consulting Geologist and Project Manager from NCL, completed a site visit from August, 6th to 7th, 2007. In this visit, he became familiarized with the geology and site conditions. The core yard was visited and aspects of Quality Control were discussed.
NCL is not an associate or affiliate of Brazauro, nor of any associated company, or any joint-venture company. NCL’s fees for this Technical Report are not dependent in whole or in part on any prior or future engagement or understanding resulting from the conclusions of this report. These fees are in accordance with standard industry fees for work of this nature, and NCL’s previously provided estimates are based solely on the approximate time needed to assess the various data and reach appropriate conclusions. This report is based on information known to NCL as of January 20th , 2010.

14
3 RELIANCE ON OTHER EXPERTS
NCL relied on exploration and technological data supplied by Brazauro Resources Corp. to produce this report. NCL has reviewed and evaluated the data pertaining to the mineralization found at the Tocantinzinho deposit that was provided to it by Brazauro and their consultants, and has drawn its own conclusions.
The geological, mineralization and exploration techniques (items 5 to 13) used in this report were updated and reviewed from information contained in the previous technical reports, as listed in the references. The items 16 and 18.3, containing the metallurgical results and cost estimates, were prepared by Walter de Moura, a metallurgy consultant who worked 28 years in development and operation of gold and silver process plants. The item 18.5, infrastructure, was prepared by the infrastructure consultant, Antonio Gadelha, a civil engineer with over 30 years of experience on the Amazon region, working with roads and water management. The power supply (section 18.6) was studied by Eduardo Maldonado, a renowned specialist of energy sourcing. Graeme Major and Rennie Kaunda, from Golder, analyzed the geotechnical information and prepared an appraisal of the local conditions which were used for establishing the pit geometry.
The status of the mining claim under which Brazauro holds title to the mineral rights for this property has been investigated by NCL only by consulting the systems of DNPM (the public agency for mineral control), which reports the property as regular and belonging to Brazauro Recursos Minerais and Mineração Cachambix, Both are subsidiary companies, 100% owned by Brazauro, as NCL was informed by Brazauro. No further investigation was done and NCL does not guarantee that any liability or litigation could prevent Brazauro to explore the property.
A reasonable amount of confirmatory testing and verification has been accomplished. Although NCL believes that all the information provided in this report is accurate, it is possible that some problems were not detected, and may have been used in this evaluation. NCL does however represent that the information was evaluated and put together in good faith.
15
4 PROPERTY DESCRIPTION AND LOCATION
The Tocantinzinho exploration property consists of 44,525 hectares (445 km2) of land located in the State of Pará, of northern Brazil. Brazauro Resources Corporation holds other mineral concessions in the State of Pará, to the south and west of Tocantinzinho, named Piranhas, Água Branca, Bom Jardim, that were not visited by NCL staff.
The Tocantinzinho exploration property consists of a contiguous block of one area under exploration license, one area under mining concession application and other four areas under application to exploration licenses, all registered with the Departamento Nacional de Produção Mineral (“DNPM”) by Brazauro’s wholly-owned.
The Tocantinzinho exploration project is in the locality of Bacia do Rio Tocantins, in the Municipality of Itaituba, district of Itaituba, in the Tapajós gold region. This region has been mined by “garimpeiros” since the late 1950s. It is estimated that about one million cubic meters of gold bearing laterite and saprolite (Orequest, July 10, 2003) have been mined out from the immediate Project area. Altoro Gold Corp., a wholly owned subsidiary of Solitario Resources Corp. since 2000, explored the Tocantinzinho property from 1997 to 1999 with exploration work consisting of the establishment of a grid, geological mapping, channel sampling in the “garimpeiro” pits, auger soil sampling, power auger drilling, and a ground magnetometer survey. In addition, some regional mapping and sampling were completed.
Brazauro Resources Corporation acquired the Tocantinzinho property in July 2003 and has actively explored the property since that time. Its first drill hole made the discovery of an extensive stockwork-hosted gold mineralization below the placer workings. Subsequent drilling by Brazauro has outlined the mineralized body which is the subject of this report.
The drilled gold-mineralization at Tocantinzinho is located on either side of a north-south-trending boundary line between an exploration license and land which is at the mining application stage both held by Brazauro, in an area that still contains a handful of “garimpos”, basically two to three-man gold placer operations. Exploration programs, including six drilling campaigns in the Project area, have indicated a gold-mineralized zone that remains open at depth. The mineralized area contains disseminated gold in association with traces of lead and copper minerals within a stockwork zone hosted by granitic rocks of Lower Proterozoic age.
4.1 LOCATION
The Tocantinzinho Project is situated at an average elevation of 145 meters above sea level approximately 200 kilometers South/Southwest of the city of Itaituba, and approximately 1,150 kilometers in a S60ºW bearing from Belem, the capital city of Pará State located along the north seacoast of Brazil at the mouth of the Amazon River.
The Project’s location can be found on the central northern part of the 1:250,000 Vila Riozinho Brazilian Topographic Map Sheet (SB.21-Z-A, MIR-194). Approximate coordinates of the center of the Tocantinzinho Project area are as follows:
16
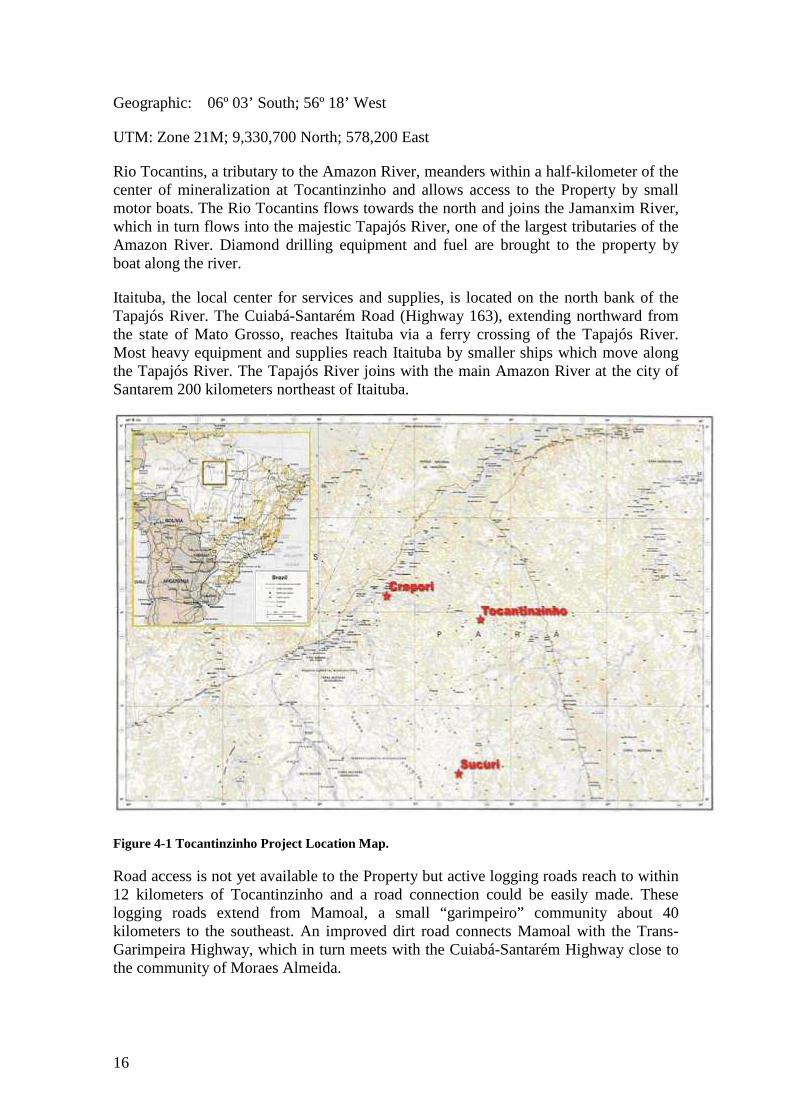
Geographic: 06º 03’ South; 56º 18’ West
UTM: Zone 21M; 9,330,700 North; 578,200 East
Rio Tocantins, a tributary to the Amazon River, meanders within a half-kilometer of the center of mineralization at Tocantinzinho and allows access to the Property by small motor boats. The Rio Tocantins flows towards the north and joins the Jamanxim River, which in turn flows into the majestic Tapajós River, one of the largest tributaries of the Amazon River. Diamond drilling equipment and fuel are brought to the property by boat along the river.
Itaituba, the local center for services and supplies, is located on the north bank of the Tapajós River. The Cuiabá-Santarém Road (Highway 163), extending northward from the state of Mato Grosso, reaches Itaituba via a ferry crossing of the Tapajós River. Most heavy equipment and supplies reach Itaituba by smaller ships which move along the Tapajós River. The Tapajós River joins with the main Amazon River at the city of Santarem 200 kilometers northeast of Itaituba.
Figure 4-1 Tocantinzinho Project Location Map.
Road access is not yet available to the Property but active logging roads reach to within 12 kilometers of Tocantinzinho and a road connection could be easily made. These logging roads extend from Mamoal, a small “garimpeiro” community about 40 kilometers to the southeast. An improved dirt road connects Mamoal with the Trans-Garimpeira Highway, which in turn meets with the Cuiabá-Santarém Highway close to the community of Moraes Almeida.
17
Two airstrips serve Tocantinzinho. One, called Pista Velha, is 350 meters long and is situated between the main mineralized zone and the Rio Tocantins. This airstrip is at a convenient location to the camp and is most frequently used to supply the camp with personnel and supplies. At the end of the airstrip there are a number of houses and two saloons. A second airstrip, called Pista Nações Unidas, is 800 meters long and is situated 2.0 kilometers due south of the camp. Heavier materials are hauled to and from the airstrips by means of Honda ATV’s with attached trailer and/or by one Toyota Hilux Pick Up truck.
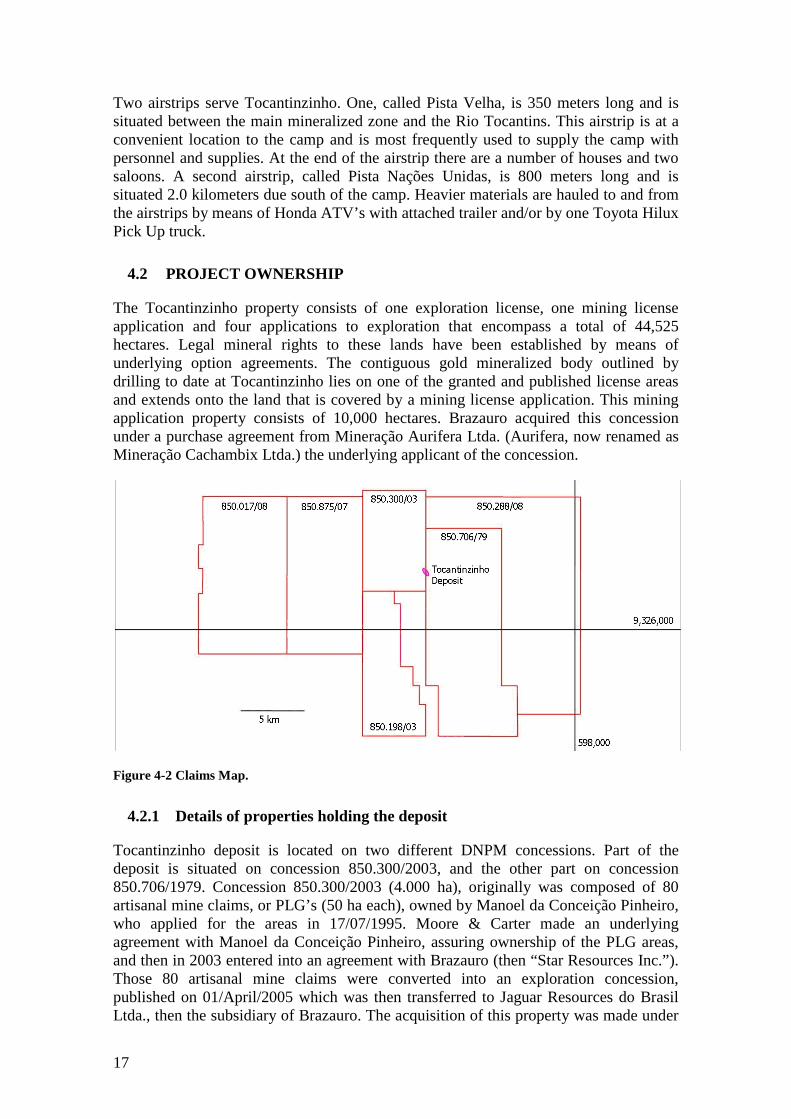
4.2 PROJECT OWNERSHIP
The Tocantinzinho property consists of one exploration license, one mining license application and four applications to exploration that encompass a total of 44,525 hectares. Legal mineral rights to these lands have been established by means of underlying option agreements. The contiguous gold mineralized body outlined by drilling to date at Tocantinzinho lies on one of the granted and published license areas and extends onto the land that is covered by a mining license application. This mining application property consists of 10,000 hectares. Brazauro acquired this concession under a purchase agreement from Mineração Aurifera Ltda. (Aurifera, now renamed as Mineração Cachambix Ltda.) the underlying applicant of the concession.
Figure 4-2 Claims Map.
4.2.1 Details of properties holding the deposit
Tocantinzinho deposit is located on two different DNPM concessions. Part of the deposit is situated on concession 850.300/2003, and the other part on concession 850.706/1979. Concession 850.300/2003 (4.000 ha), originally was composed of 80 artisanal mine claims, or PLG’s (50 ha each), owned by Manoel da Conceição Pinheiro, who applied for the areas in 17/07/1995. Moore & Carter made an underlying agreement with Manoel da Conceição Pinheiro, assuring ownership of the PLG areas, and then in 2003 entered into an agreement with Brazauro (then “Star Resources Inc.”). Those 80 artisanal mine claims were converted into an exploration concession, published on 01/April/2005 which was then transferred to Jaguar Resources do Brasil Ltda., then the subsidiary of Brazauro. The acquisition of this property was made under

18
the payment of US$ 1.2 million. The production from this property includes to Carter & Moore, a production NSR royalty of 2.5% for a gold price less than US$ 500/oz and 3.5% for a gold price equal or greater than US$ 500/oz.
In January 2010, Brazauro signed an Amending Agreement with those holders of the net smelter return royalty on Brazauro’s Tocantinzinho Project which amends and clarifies the original agreement signed in 2003. Under the Amending Agreement the parties have agreed that Brazauro can buy down the royalty from 3.5% to 1.5% in two increments of 1% each. The first payment of $2,000,000 will be triggered by certain events including the exercise, if at all, by Eldorado Gold Corporation under its Option/Joint Venture agreement with the company to acquire 60% of the Tocantinzinho project or failing such exercise by completion of project financing, the making of a production decision or other specified events. The second payment of $3,500,000 will be triggered by the making of a construction decision to proceed with the development of the Tocantinzinho Project. The amended royalty will cover all the ground referred to in the original agreement signed with the royalty holders in 2003 which encompasses the entire Tocantinzinho mineralized deposit.
Concession 850.706/79, owned by Mineração Cachambix Ltda., is a valid mining application license, dated of 1979. In 2007 Jaguar Resources do Brasil Ltda. acquired 100% of Mineração Cachambix Ltda. for US$ 3 million, which were totally paid in February 2009. No royalty obligations are included in this agreement.
In July 2008, Brazauro (BZO) and Eldorado Gold Corporation (“Eldorado”, or ELD) have entered into an agreement under which Eldorado is entitled to earn an option to acquire an initial 60% interest in the Company’s Tocantinzinho Gold Project in Brazil (the “Project”) by paying $40 million, a second option to acquire a further 10% interest exercisable after a construction decision has been made on the Project by paying an additional $30 million, subject to an increase to up to $40 million based on the proven and probable reserves outlined in the feasibility study, and a third option to acquire within two years of the construction decision a further 5% interest (for a total of 75%) by paying a further $20 million. (All figures in Canadian dollars.)
To earn the first option, Eldorado invested $8.36 million by way of a private placement of 8.8 million units of Brazauro at $0.95 per unit and incur expenditures of $9.5 million on the Project over a two-year period, or pay Brazauro an equal amount in cash. A joint venture (ELD: 60% / BZO: 40%) will be formed upon exercise of the first option with each party contributing its pro rata share of expenditures.
If the feasibility study upon which a construction decision on the Project is made outlines between 2 and 2.5 million proven and probable ounces of gold, the second option exercise price will be increased from $30 million to $35 million. If it outlines more than 2.5 million proven and probable ounces of gold, the second option exercise price will be $40 million.
Each unit issued to Eldorado will comprise one share and one share purchase warrant with two warrants entitling Eldorado to purchase one additional share at the price of $1.00 for a period of 18 months. Payments for the Project, including share and warrant purchases, could total $123.58 million. Eldorado is since September 2008, the operator of the Project and joint venture.
19
4.3 ENVIROMENTAL LIABILITIES
The Tocantinzinho land disturbance consists primarily of “garimpeiro” workings, including shallow water-filled pits and small surface openings from which lateritic and saprolitic materials were extracted by hydraulic mining methods and processed by gravity concentration. All of Brazauro’s exploration programs have been restricted to areas already affected by placer mining disturbances at Tocantinzinho, with insignificant effects caused by Brazauro’s drilling and exploration activities. A limited amount of “garimpeiro” operations still survive at the property, but the miners are careful not to interfere with Brazauro’s exploration activities. Traditional “garimpeiro” operations include amalgamation for gold recovery using mercury and some unpredictable environmental liability may possibly exist from previous placer mining operations. The placer tailings contain significant gold values and will probably be mined and milled at the beginning of any hard-rock gold mining operation at the property.
4.4 STATUS OF REQUIRED PERMITS
NCL did not review the status of the permitting and claim status; these statements are based on information provided by Brazauro.
Basic geological and geochemical exploration, including geological work, geochemical sampling, and small-scale line-cutting needs no permitting on public lands within the vast “Garimpeiro” Reserve of Brazil. Drilling activities on lands already disturbed by “garimpeiro” mining need no environmental permitting. Past drilling by Brazauro within the extensively placer-mined lands required no drilling permits. Future activity within the area of mineral resources discussed in this report is all within this extensively placer-mined zone and will not require permitting.
In 2005, Brazauro contracted Keystone Ltda. from Belem, Pará to produce a baseline environmental study at Tocantinzinho (RCA, or Environmental Control Report). This report has been submitted to the Pará State´s environmental agency SECTAM (Secretaria Executiva de Ciência, Tecnologia e Meio Ambiente). SECTAM issued, on October, 2005, an operation license for the exploration workings of Brazauro which are annually renovated.
By presidential decree, on February 13, 2006, much of Pará State’s Tapajós region, an area centered on the old Tapajós “Garimpeiro” Reserve, was reclassified. In effect, this region was put under Federal jurisdiction. Not considering lands which had already been classified or withdrawn in the region, the areas lands were classified into six major categories. The majority of the “garimpeiro” reserve land was classified as APA (Área de Proteção Ambiental), which is the least restrictive environmental classification and allows for mining and exploration activities. Brazauro’s entire Tocantinzinho mineral land package lies within this land status and outside of any restricting effects resulting from proposed buffer zones around the most restrictive land blocks. The second least restrictive land classification is the FLONA (Floresta Nacional), which also can permit mining activities but will receive more environmental scrutiny than the APA lands from the proper administrative agency.
Large areas of pristine jungle have been classified as PARNA (Parque Nacional) or national parks, where mining activities and drilling are not permitted. A buffer zone

20
which can reach up to ten kilometer radius depending on location may be defined around the perimeter of national parks. However it will not affect the Tocantinzinho gold deposit as it is located far beyond a ten kilometers buffer zone of the nearest park, the Jamanxim National Park. Three other land classifications are the indigenous lands, REBIO and RESEX, which are biological study or use areas where mining is also prohibited. None exist within the old “garimpeiro” Reserve.
All permits for exploration and mining on Federal lands in the Tapajós region will be issued by IBAMA (Instituto Brasileiro do Meio Ambiente), the Federal Environmental Agency. This agency is the administrative arm of the environmental ministry, the Ministerio do Meio Ambiente do Brasil. At the present time, permits for building roads and clearing trees for exploration and drilling within lands under Federal jurisdiction, lands that have had no previous “garimpeiro” disturbance, must be obtained from IBAMA. There is an IBAMA office in Itaituba.
21
5 ACCESSIBILITY, CLIMATE, LOCAL RESOURCES, INFRASTRUCTURE AND PHYSIOGRAPHY.
5.1 ACCESSIBILITY AND INFRASTRUCTURE
The Tocantinzinho property is located south of the Amazon River. To reach the property from Belem one travels 1,000 km west to Itaituba, a town at the crossing of the Tapajós River by the Trans-Amazonian Highway and the major supply post for the Tapajós region. The Tapajós River is a major tributary joining the Amazon River at Santarem. One regional airline service Itaituba from Belem and Manaus to the West. To fly from Belem via Santarem to Itaituba is a 3½ hour trip. Flying from Manaus is a 1½ hour trip. Itaituba has several charter companies flying single engine aircraft into the Tapajós region.
Tocantinzinho lies within the Rio Tocantins valley, about 200 km south southwest of Itaituba. Access is by single engine aircraft from Itaituba or aluminum boat along the Rio Jamanxim and Rio Tocantins, from a loading point at Aruri Grande village at Highway BR-163. Itaituba is located at the intersection of the Trans-Amazonian Highway with the Tapajos River and there is a ferry crossing of the Tapajós. The Tocantins River, as well as numerous other small streams, transects the Tocantinzinho Project area. The general area drains to the north.
There are no roads within about 12 kilometers of the property. The region is serviced by a gravel road. Highway BR-163, a road that was included in the federal Growing National Plan (PAC) is planned to be paved in the near future. It passes just east of Itaituba bearing the Mato Grosso State, passing 70 km to the east of the property. The Trans-Garimpeira Highway is located 50 kilometers south of the property and connects with BR-163 at the town of Moraes Almeida. Numerous drilling accesses branch off the main roads and get closer to the property every year. Most of the rivers in the region are navigable during the wet season and provide better access than the roads. A road from the community of Creporizão which is located on a river that is navigable by larger barges during rainy season, to the community of Cuiú Cuiú, is located 30 km to the northwest of Tocantinzinho.
From Itaituba, small airplanes are used to access two airstrips at the property. This flight to the property from Itaituba takes about one hour and is weather-dependent. The typical tropical afternoon rain can be a problem for flight departures and the pilot prefers to depart the property before 4 PM to be able to land comfortably at Itaituba before sunset.
5.2 PHYSIOGRAPHY, CLIMATE AND VEGETATION
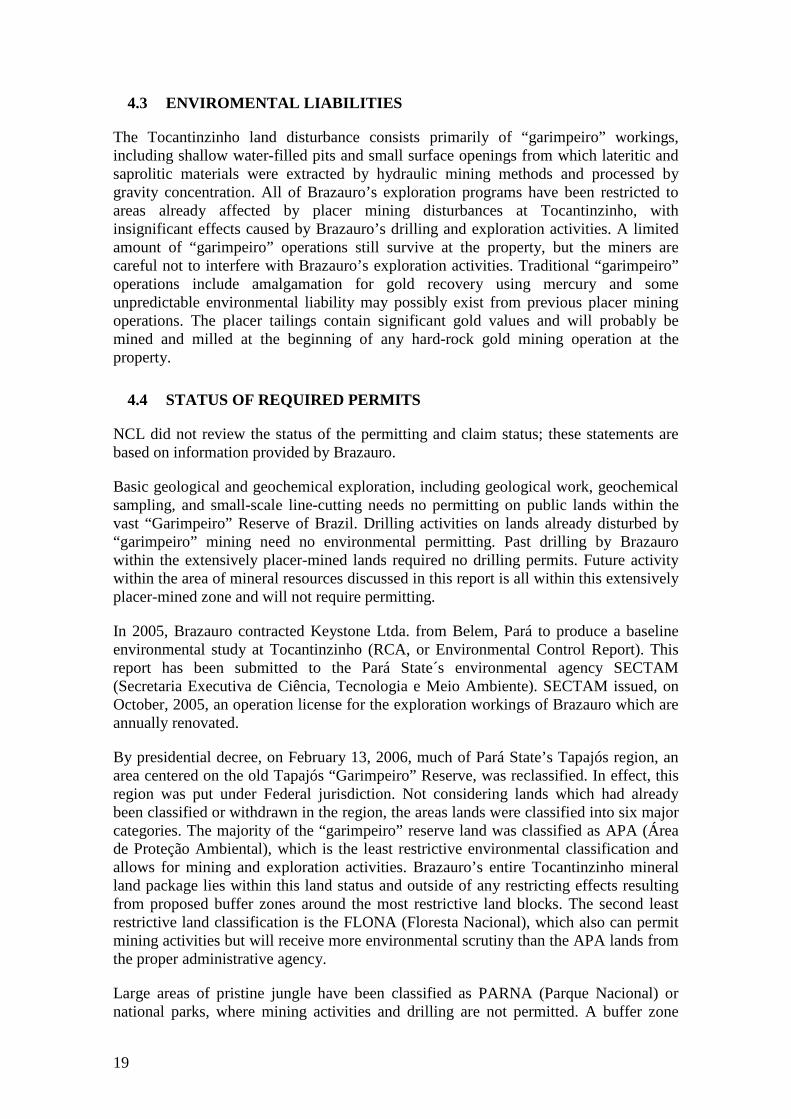
Local physiography consists of somewhat rugged topography forming hills and valleys. Serra Leste is the highest point of land on the Tocantinzinho property and is about 50 meters above the surrounding drainages. Vegetation is typical of that found in a tropical jungle environment of the Amazon basin. The only areas not covered by jungle are those worked by the “garimpeiros” and the drainages filled by either tailings or swamps. The photography shown on Figure 5-1 demonstrates the physiography of the Project area.
22
Figure 5-1 Aerial view of Tocantinzinho Project
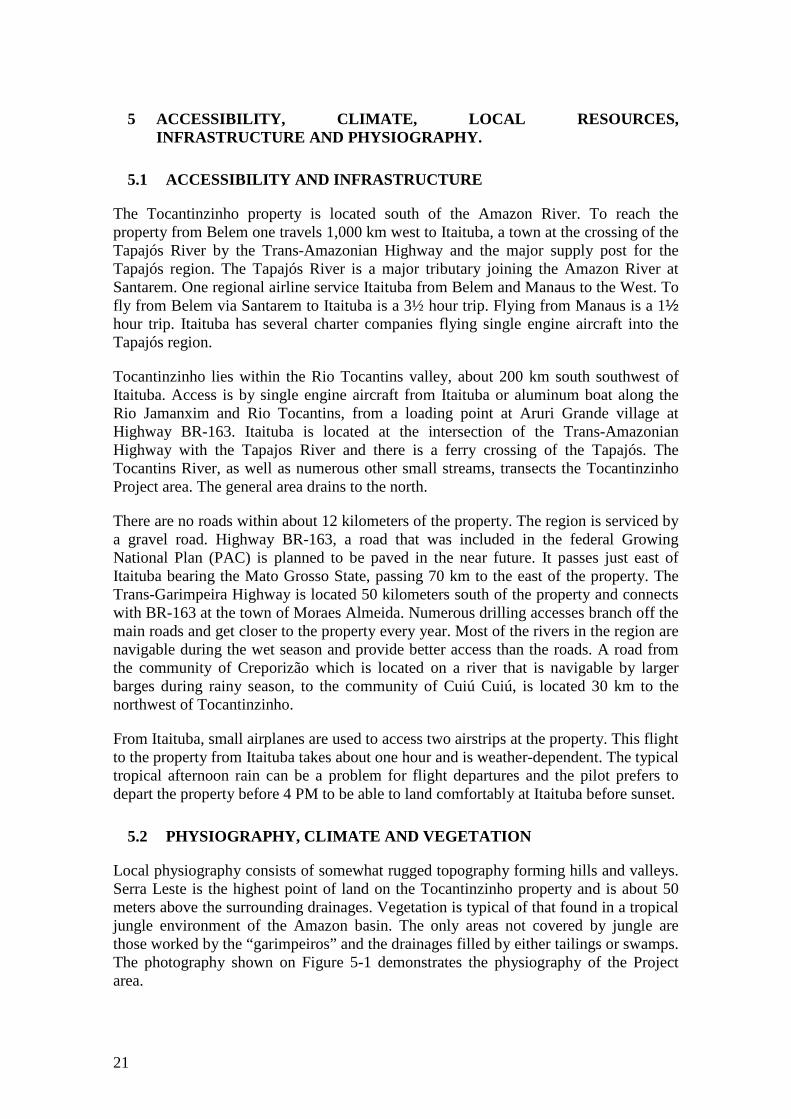
The local climate has two well defined seasons, the rainy season from January to June, and the dry season from July to December. This climate is characteristic of much of the state of Pará. The average daytime temperature in the project area is 26.1º C. The temperatures don’t vary significantly with maximum of 33°C and a minimum of 22 °C. Relative humidity averages 88% with an annual range from 83% to 91%. Rainfall in the project area is about 1950 mm per year, as indicated by measurements at the Itaituba station (table below). The project area is in the Tocantinzinho basin, which empties into Jamanxim basin. That basin empties into Tapajós which empties in the Amazon river. The rivers near the area present rapids, sandy beds and are shallow, making navigation difficult mainly during the dry season.
23
Month Average Monthly Precipitation (mm) January 206.4 February 292.2 March 276.1 April 231.8 May 188.8 June 109.6 July 67.3 August 92.4 September 74.8 October 82.6 November 128.1 December 199.7 Total year 1949.8
Table 5-1 Monthly average precipitation – Itaituba Station
http://www.climate-charts.com/Locations/b/BZ82445.php
5.3 LOCAL RESOURCES
There are no permanent inhabitants within the boundaries of Brazauro’s properties. However there are currently, about six to eight teams of local garimpeiros operating in some areas of Brazauro properties. The nearest town to Tocantinzinho with social services is Itaituba that has a population of about 127 848 inhabitants (IBGE, 2009). Banking, postal service, health services and communications, as well as education centers, and regular air service to other major cities, such as Belem, Manaus and Cuiabá, etc. are available at Itaituba. Labor required for Project development and operations will be brought into the Project from Itaituba and other Pará State cities.
Brazauro has verified that 101 km of roads would have to be repaired or built. 65 km of those are on existing roads, that need to be enlarged and prepared, and 36 km will have to be built.
24
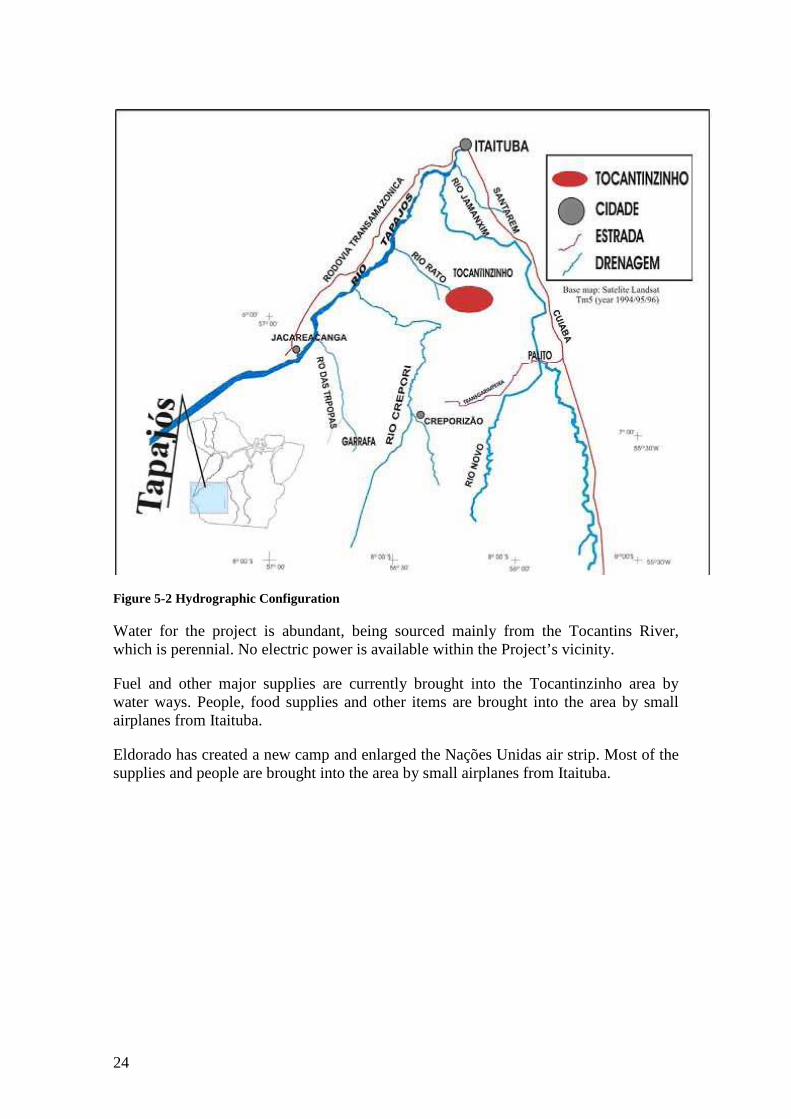
Figure 5-2 Hydrographic Configuration
Water for the project is abundant, being sourced mainly from the Tocantins River, which is perennial. No electric power is available within the Project’s vicinity.
Fuel and other major supplies are currently brought into the Tocantinzinho area by water ways. People, food supplies and other items are brought into the area by small airplanes from Itaituba.
Eldorado has created a new camp and enlarged the Nações Unidas air strip. Most of the supplies and people are brought into the area by small airplanes from Itaituba.
25
6 HISTORY
Gold is reported to have been first discovered in the Amazon region in 1747 where today is the Maranhão state. In Tapajós region, gold was discovered in 1958 at the mouth of Das Tropas River. Notwithstanding, the Tapajós area has only been a significant gold producer since the 1980s. The famous gold rush of the Tapajós region began about 1977 when “garimpeiros” poured into the region that was nothing other than wilderness. Production from the region apparently peaked in the late-1980s with as many as 500,000 “garimpeiros” extracting somewhere between 200,000 and one million ounces per year, during a period that represents the largest gold rush in the history of Brazil. Up until 1993, production was officially estimated at 16 million ounces (500 tonnes), but real production is unknown and may have been more than double that amount. In addition to gold, the district has produced tin, fluorite, diamond, topaz and other precious gemstones from the alluvial production.
The district is still active with approximately 40,000 to 60,000 miners and is estimated to produce approximately 200,000 to 300,000 ounces annually. Typically in the area, consistent with other gold districts of the Brazilian Shield where alluvial gravels are mined or re-worked, the miners turn to primary mineralized veins and stockworks in laterite and saprolite in an attempt to work the primary sources of the rich alluvials.
It appears that gold mining at Tocantinzinho was initiated by “garimpeiros” and production began in 1970 with the best years being in the mid-eighties; unfortunately, there are no published records to support the timing or amount of production.
Following evaluation of the placer potential of the immediate area of Tocantinzinho by the Brazilian Geological Survey during the midst of the Tapajós gold rush, Mineração Aurifera Limitada obtained an exploration license over the Tocantinzinho mineralization in 1979. After several extensions of its exploration license (Alvará de Pesquisa) Aurifera filed its required Final Exploration Report with the Departamento Nacional da Produção Mineral (DNPM), which ended its exploration period in December 1986. The company then filed for a mining concession, a request which was not analysed yet by the DNPM. Aurifera lost interest in its property and the entire property files were shelved and archived by the DNPM in 1992. In 1995, Mr. Manuel da Conceição Pinhero received placer rights from the DNPM for the western part of the Tocantinzinho area. His block of placer claims were subsequently turned into a hard-rock exploration concession by Jaguar Resources do Brasil Ltda. in 2003.
In 1997, Renison Goldfields (of Australia) and Altoro formed a Joint Venture to explore Brazil for major gold deposits. Altoro acted as both the manager and operator. The Tocantinzinho property was brought to the JV’s attention by air charter pilot Vicente Luz, and acquired after a property visit by Dennis Moore who collected continuous channel samples of saprolite from two different “garimpeiro” pits 250-m apart. These samples returned results of 36 m at 2.68 ppm Au from the main pit and 21 m at 2.01 ppm Au from the northern pit. An option to purchase the Tocantinzinho property was signed October 15, 1997. On June 12, 1998 Altoro was advised by Renison Goldfields that they intended to withdraw from the Joint Venture due to a corporate decision to concentrate their activities on mineral sands and restrict gold exploration to near mine tenements in Australia. As a consequence, all properties, projects, and data acquired by the Joint Venture were passed to Altoro on July 12, 1998. Solitario Resources
26
Corporation acquired Altoro in October 2000, but terminated the Tocantinzinho Project a year later due to the low gold price environment.
Altoro’s exploration program at Tocantinzinho consisted of soil geochemistry, ground magnetic survey, channel sampling, geological mapping of the pits, and power auger drilling.
A camp was constructed on site and water was supplied from a nearby well. During Altoro’s exploration work in 1998 and 1999, approximately 200 people were living at Tocantinzinho supported by “garimpeiro” activity. Of the 200 people, 60 to 70 were actively working “garimpeiros”. Relationship between the “garimpeiros” and Altoro were reported to have been good. In several instances the “garimpeiros” modified their activities to facilitate mapping and sampling of the pits by Altoro technical staff.
The mining of laterite and saprolite is performed by hydraulic methods with gold recovery by sluice boxes. The method used consists of one pump to bring water to a working face and a second pump to recover the loosened material and run it over a sluice box. A carpet cover is used to better recover the gold at the sluice boxes. At the time of Altoro’s work, up to 18 sets of pumps were operating at any one time, but at the time of 2003, only four or five pumps and sluices were seen. Most of the material is washed as it is mined with no grinding or crushing involved.
The availability of water is a critical factor for the “garimpeiro” activity. The main “garimpeiro” workings in saprolite (Serra Leste) were in the headwaters of minor drainages so sufficient water to mine saprolite is not always available. In times of low water availability, the “garimpeiros” move their operations to lower areas and wash tailings and alluvials. The “garimpeiros” have located their sluices such that the tailings have formed dams across the main drainages and numerous large ponds are present retaining sufficient water for current operations, however, this water supply may not last into the dry season. Although water has been a concern for the artisanal miners during the dry season with their style of gold extraction, the property and the area surrounding the property contain abundant sources of water for all usual exploration and development purposes.
In 2003, Brazauro’s Brazilian subsidiary, then Jaguar Resources do Brasil Ltda., acquired the properties covering the Tocantinzinho mineralization. Following geochemical soil sampling, Brazauro initiated a drilling program which lasted until 2008, for a total of 25,635 meters, on 97 holes. After Eldorado took over the project, in September 2008, further 62 holes were drilled, for 19,431 meters.
This report is an update of the report produced by NCL Brasil, dated December 2007, which studied the economic feasibility of the deposit at a production rate of 3 million tons/year.

27
7 GEOLOGICAL SETTING
The Tapajós gold region is situated in the south-central part of the vast Amazon Craton. The Craton is generally divided into two physiographic components: the Guyana Shield north of the Amazon River and the Brazilian Shield south of the river. However, geochronological and structural provinces have a northwestern trend and these provinces are continuous across the two shields. The Brazilian Shield has as its nucleous the Archean greenstone-granitoid terrane of the Carajás-Imataca Province in the east. The structural provinces become younger towards the west and are dominantly granitic rocks of Paleoproterozoic age in the region of Tocantinzinho.
7.1 REGIONAL GEOLOGY
In the Tapajós District, the oldest rocks are the gneisses, schists, and metagranites of the Cuiu-Cuiu complex (2,011-2,033 Ma), which is the local basement for all units present in the region. The Cuiu-Cuiu Complex is intruded by the granites and granodiorites of the Parauari Suite (1,957-1,997 Ma); tonalites, diorites and granodiorites of the Tropas Suite (1,898-1,907 Ma) and granites and granodiorites of the Creporizão Suite (1,853-1,893 Ma). The rocks of the Parauari, Tropas and Creporizão granitoids have calc-alkali afilliation and are considered as the roots of a magmatic arc. Another set of coeval intrusive and extrusive rocks cut all units above. The extrusives are rhyolites, dacites and andesites of the Bom Jardim and Salustiano Formations (1,853-1,900 Ma) and the volcaniclastics of the Aruri Formation (1,853-1,893 Ma). Intruding all above are the granites of the Maloquinha Suite (1,870-1,882 Ma), which are alkaline and considered as anorogenic. Subordinate mafic intrusive and extrusive rocks of the Ingarana Suite do occur (1,878-1,900 Ma), mainly in the central-north portion of the district. By looking at the geologic map of the Tapajós sheet (CPRM, 2004), one can observe that the central-NW portion of the district is domained by the Parauari granites, the SE portion is domained by the Creporizão granites and the eastern portion is domained by the Salustiano and Aruri volcanics. The Maloquinha granite is widespread, intruding all units above it.
Gold mineralization is found in almost all rock types present in the Tapajós district. The known deposits and main occurrences are found in the Cuiu-Cuiu Complex (Cuiu-Cuiu), Parauari Suite (Tocantinzinho and Palito), Tropas Suite (Ouro Roxo), Creporizão Suite (São Jorge and Sucuri), Salustiano and Bom Jardim Formations (V3-Botica, Bom Jardim and Doze de Outubro) and even in the Maloquinha Suite (Mamoal).
In the immediate area of Tocantinzinho the most widespread igneous rocks are the granites and quartz-monzonites of the Parauari Suite. Rocks of the suite, dated at 1,883 Ga, are believed to be the predominant hosts to mineralization at Tocantinzinho. Following the emplacement of this suite of batholithic proportions, igneous activity changed to predominantly andesitic to basaltic character, perhaps by the onset of extensional tectonics. Extensive felsic volcanism followed, the Uatumã Volcanics, with the eruption of rhyolitic to dacitic flows and tuffs and their sister volcaniclastic sediments. The Uatumã Volcanics have been subdivided into the Iriri Group, the Aruri Formation and the Salustiano Formation. Dating of these rocks and associated mineral deposits, some showing remarkable near-surface erosion levels, has shown the age of these rocks to be about 1,874 Ga.
28
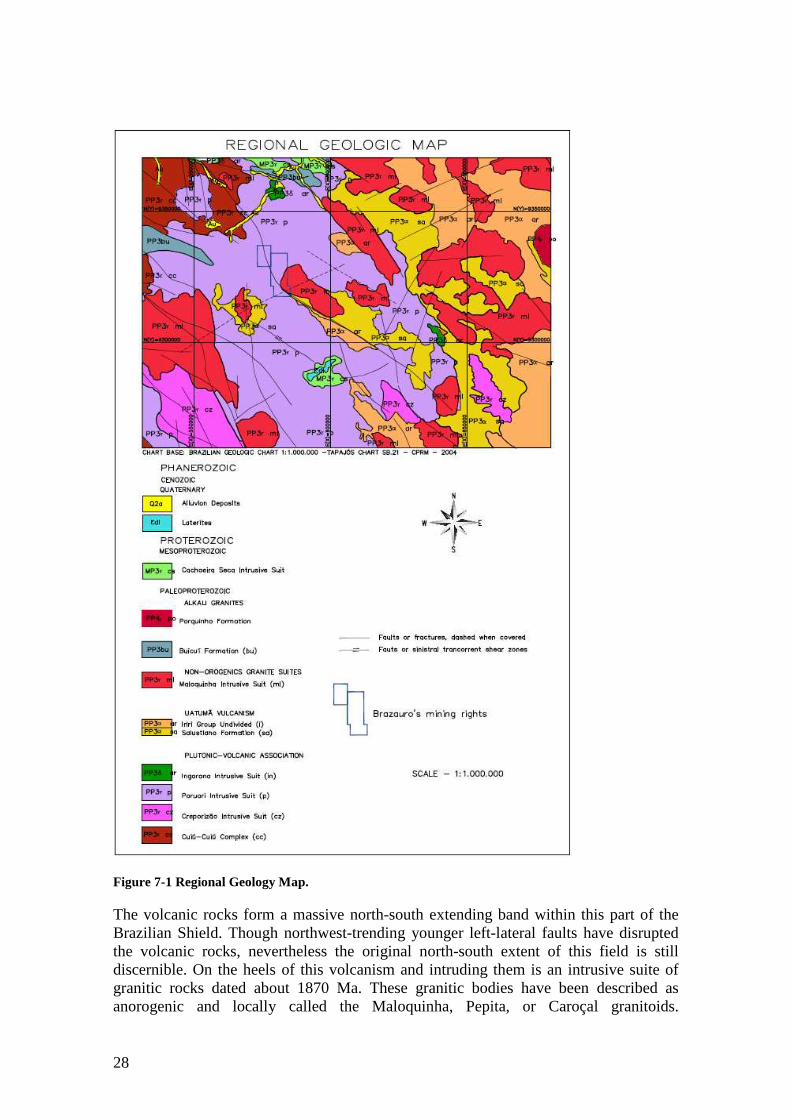
Figure 7-1 Regional Geology Map.
The volcanic rocks form a massive north-south extending band within this part of the Brazilian Shield. Though northwest-trending younger left-lateral faults have disrupted the volcanic rocks, nevertheless the original north-south extent of this field is still discernible. On the heels of this volcanism and intruding them is an intrusive suite of granitic rocks dated about 1870 Ma. These granitic bodies have been described as anorogenic and locally called the Maloquinha, Pepita, or Caroçal granitoids.
29
Mineralization found in these predominantly granite or adamellite bodies tends to consist of deep-seated glassy to milky quartz, representing the root zones of vein systems, suggesting the granitic rocks to be the source of mineralization. The Maloquinha Granite is believed to represent the deeper intrusive phase of the Uatumã intrusive-volcanic event.
Younger clastic sedimentary rocks cover the Maloquinha/Uatumã suite of rocks, generally as erosion-resistant caprocks or within west-northwest-trending graben-like structural features of the greater area. Younger volcanic, sedimentary, and igneous suites are prevalent far to the west of Tocantinzinho, all of which show U-Pb age dates between 1,780 and 1,757 Ma.
7.2 LOCAL GEOLOGY
Whereas the igneous intrusions shown on a small scale geological map of the Tapajós district (Faraco et al., 1996) appear to be scattered at random, it has been proposed that most of the intrusions associated with significant gold “garimpos” – including the Tocantinzinho Project – line up along the Tocantinzinho Megashear, a northwest-trending lineament, readily visible on remote sensing imagery and also known as the Chico Torres Megashear zone or the Cuiú-Cuiú /Tocantinzinho trend (Brandt Meio Ambiente, October 2005).
The Tocantinzinho area is underlain by an intrusive igneous complex of broad extent. No older country rocks have been recorded in the vicinity. The absence of penetrative foliation or cleavage in the intrusive rocks, coupled with information from other intrusive complexes of the district, indicates that the Tocantinzinho intrusive complex has not suffered significant tectonic disturbance since emplacement.
Gold mineralization at Tocantinzinho appears to be rather closely confined to a distinctive coarse-grained pink granitic rock, which also is the oldest of the intrusive rock types identified on the property. Schuler (1998, p.13), invoking earlier work by David Pascoe of Goldfields, infers that this granite has areal dimensions of 5.0 km by 10 km.
The coarse-grained granite-hosting mineralization has a composition lying “within the syenogranite and monzogranite fields of Streckeisen” (Geller, 2004, p.5.). Color ranges from pink to red, and is due to microcline, the dominant mineral. The feldspars are generally fresh, except for minor sericitization of the plagioclase. The microcline locally displays internal reflections from cleavages and twin planes. The primary mafic mineral or minerals (most likely biotite) has/have been completely transformed to black chlorite.
Quartz grains in this rock commonly are large, with a distinctive amoeba-shaped appearance. This feature is called “blebby” quartz. Geller (op. cit.) describes the thin section appearance of a typical occurrence (Sample #8) as follows: “Quartz very coarse, anhedral, extremely undulated, especially in coarse sutured aggregates of healed polygons (=quartz blebs.)”. Observations of core show that in some places the blebs projecting into or growing across quartz-chlorite veinlets, indicating that the original or parent quartz grain experienced overgrowth after formation of the veinlet. However, in the majority of cases the reverse is true, quartz-chlorite veins cut across the blebby
30
quartz. The preferred explanation of the blebby character is that it represents a contact metasomatic or hydrothermal effect induced by younger granitic phases which intruded the host granite.
The granite displays no sign of penetrative foliation except for rare instances where strings of blebby quartz grains demonstrate a weak parallelism. Much of the granite body shows intense crushing and brecciation. Effects of the crushing range from tiny cracks throughout the quartz and feldspar grains to a network of fractures defining an in situ breccia to more advanced brecciation with some rotation of fragments, eventually culminating in breccia with development of matrix (e.g., six of the samples submitted to Bruce Geller – Geller, 2004, p.1.) The crushing and brecciation, though widespread, are not ubiquitous; in DDH 16, for example, core lengths of tens of meters display no visible brecciation. In the absence of extensive outcrops, it is impossible to determine whether the distribution of brecciation in the granite is subject to some systematic pattern.
The origin of the crushing/brecciation is thought possibly to be related to an igneous process (explosive, pneumatolitic or hydraulic) rather than to tectonism. Whatever the origin of the brecciation, the crushed rock was eventually healed, and became compact again, able to support brittle fracturing. The healing has been sufficiently thorough that the breccia interstices are sealed and are not a preferred site for later mineralization.
Closely associated with the granite and presumably co-magmatic with it, are dike-like bodies of aplite and pegmatite up to 4 meters in width. It is not yet clear whether they have a preferred orientation. The aplite and pegmatite appear to grade into each other. Each shows similar development of graphic intergrowth. Quartz grains in aplite and pegmatite have been subjected to the same enlargement or overgrowth phenomenon which produced the blebby character of quartz in the Tocantinzinho Granite.
Surface mapping and several recent drill holes collared near the topographic ridge above the trend of mineralization have better defined the main mass of andesite. This unit forms a tooth-shaped body capping mineralization, narrowing with depth into feeder dikes. The rock is strongly altered, with intense carbonate, chlorite, and sericite development, and is riddled with carbonate veins and veinlets. These veinlets also contain quartz, though generally much less quartz than the veinlets hosted by the granitic rocks below. Gold values within the andesite are generally below the detection limit. However, there are scattered ore-grade gold values within this rock type. A close examination of +1 ppm Au value intercepts in the andesite clearly demonstrated that these elevated gold values are not mineralized veinlets that come the mineralized granite. In one case, gold was observed in a quartz veinlet that contained some galena, besides the usual pyrite. The tiny gold flakes within quartz have the same size and distribution characteristics as the gold has in the granite-hosted quartz veins. In examining a number of inclusions of veined granitic rocks within the andesite, veining generally can be followed from the andesite into the inclusions. Veins were not observed to be cut-off, but veins do change from dominantly carbonate within the andesite to dominantly quartz within the granitic inclusions.
The andesite forms an upward flaring cap over the main mineralized zone and may have been much more extensive at one time. It is now an erosion remnant along the main ridge, high ground that the placer miners left in place. At the surface the andesite mass varies from widths of 45 meters to over 80 meters and has a vertical dimension that may
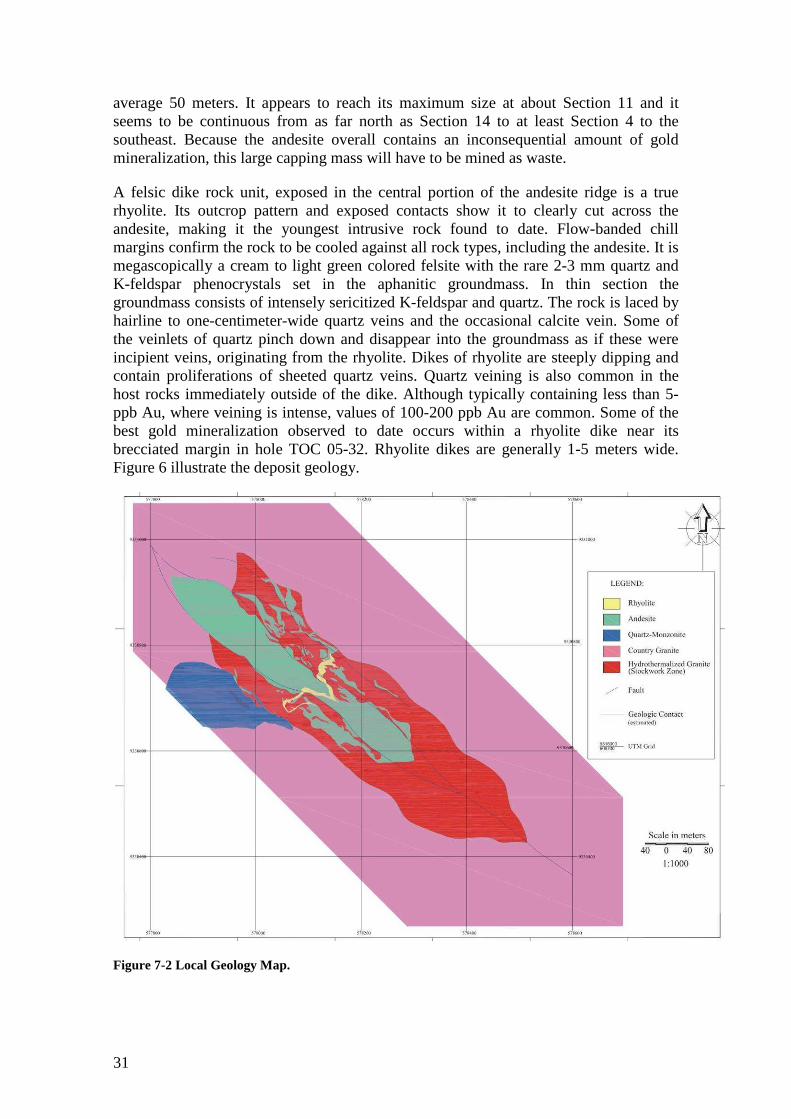
31
average 50 meters. It appears to reach its maximum size at about Section 11 and it seems to be continuous from as far north as Section 14 to at least Section 4 to the southeast. Because the andesite overall contains an inconsequential amount of gold mineralization, this large capping mass will have to be mined as waste.
A felsic dike rock unit, exposed in the central portion of the andesite ridge is a true rhyolite. Its outcrop pattern and exposed contacts show it to clearly cut across the andesite, making it the youngest intrusive rock found to date. Flow-banded chill margins confirm the rock to be cooled against all rock types, including the andesite. It is megascopically a cream to light green colored felsite with the rare 2-3 mm quartz and K-feldspar phenocrystals set in the aphanitic groundmass. In thin section the groundmass consists of intensely sericitized K-feldspar and quartz. The rock is laced by hairline to one-centimeter-wide quartz veins and the occasional calcite vein. Some of the veinlets of quartz pinch down and disappear into the groundmass as if these were incipient veins, originating from the rhyolite. Dikes of rhyolite are steeply dipping and contain proliferations of sheeted quartz veins. Quartz veining is also common in the host rocks immediately outside of the dike. Although typically containing less than 5-ppb Au, where veining is intense, values of 100-200 ppb Au are common. Some of the best gold mineralization observed to date occurs within a rhyolite dike near its brecciated margin in hole TOC 05-32. Rhyolite dikes are generally 1-5 meters wide. Figure 6 illustrate the deposit geology.
Figure 7-2 Local Geology Map.
32
The intense sericitization, the presence of incipient veining, disseminated cubes of pyrite set in the granular groundmass, and the striking coincidence of quartz veining in and around this rock unit strongly point to it being a source of siliceous hydrothermal solutions. Where native gold has been observed in veins in the rhyolite, it has the same characteristics as gold-bearing veins in the granitic host rocks: the gold is disseminated in quartz veins as very fine small particles of high fineness.
Only dikes of the square quartz rhyolite are known to date; its source area remains to be investigated. There is the strong possibility that Tocantinzinho’s gold-bearing sheeted stockwork formed above the source rock of these dikes. Vein stockworks, even sheeted stockworks, tend to be a carapace above vapor-producing bulged porphyry bodies. The dikes are distinctly a source of quartz veins; the parent intrusive may be the ultimate source of gold-bearing veins. This source intrusive apex remains a potentially lucrative target.
Both the rhyolite and the andesitic rock have aphanitic groundmasses, showing that they crystallized quickly, implying that the host granitic rocks were relatively cool. The various odd petrographic textures within the granitic host rocks, such as early brecciation, biotite introduction, barren quartz-chlorite veining, quartz overgrowths, and rehealing of granular quartz phenocrystal masses may be an early phenomenon and have nothing to do with gold mineralization. The host granitic mass is a complex of various intrusive units, each one of which may have been responsible for fracturing, brecciating, and veining of previously emplaced masses. The relevant veining and alteration are those that have associated sulfides. Though there may be several phases of sulfide and gold-bearing veining, the granitic rocks appear to have had nothing to do with the emplacement of mineralization. Other potentially ore-related porphyries have been discovered during Phase II drilling. A porphyry was intersected in the lower part of TOC 05-24 that has an unusual bimodal size distribution of phenocrysts. Sericitized microcline and plagioclase form two populations of phenocrysts in a microscopic groundmass of quartz, K-feldspar, and plagioclase. Phenocrysts form about 40 percent of the rock. Books of completely chloritized biotite are also a common constituent of this porphyry and disseminated cubes of pyrite are common. Very few quartz phenocrysts occur in this rock that may be best labeled a quartz latite.
Porphyries tend to be intruded in dilation zones within shear couples or in pressure shadows at the intersection of major shear zones. The structural features of this shear system set the stage for the orientation of the sheeted stockworks. But in the mesozonal setting of the stockworks, there is almost always a clear relationship between veining and source porphyry.
The quartz-chlorite veins are early in the paragenetic sequence and may be related to the introduction of one of the post-coarse-grained granite intrusive phases of the older batholitic sequence of intrusions. Yet the presence of quartz-chlorite veins is a good indicator of low-grade gold values. Chlorite, especially chlorite veining without much quartz, is well developed near the intensely chloritized andesite dikes, as if that type of chlorite veining is related to the andesitic intrusives.
33
8 DEPOSIT TYPES
The Amazon Craton extends from Venezuela and Guyana to the Tapajós region and hosts a great variety of mineral deposit types, including some of the larger gold deposits of South America, such as:
• Omai in Guyana (Open pit production since 1993, 3.7 million ounces Au: the Fennell pit produced 49 million tonnes at 1.50 g/t Au - Cambior, August 2006);
• Las Brisas in Venezuela (582 million tonnes at 0.66 g/t Au, 0.126% Cu); • Las Cristinas in Venezuela (244 million tonnes at 1.33 g/t Au); • Serra Pelada in Brazil (3.7 million tonnes at 15.3 g/t Au in addition to
approximately 1.3-1.9 million ounces of gold historically produced by garimpeiros);
• Gross Rosebel in Guyana (42 million tonnes at 1.6 g/t Au); • Salobo in Brazil (789 million tonnes at 0.52 g/t Au and 0.96% Cu).
Exploration in the Amazon Craton over the last twenty years has drastically changed the importance of certain deposit types. The discovery of the giant iron oxide copper gold (IOCG) type deposits in the Carajás district of eastern Pará State make this type of mineralization the most lucrative for the exploration community.
Primary gold occurrences in the Amazon Craton of Venezuela, Guyana, and Brazil, have been historically contained in four main categories: veins in greenstones or metasediments, placers near a granite-greenstone contact, local placers over greenstone bodies, and veins in granitic or gneissic rocks.
Historically, gold production in the Tapajós Region has been restricted to alluvial material and secondary enriched laterite and saprolite material immediately below the surface. Near-surface gold enrichment can be attributed to the tropical climate, low topographic relief, and an absence of a thick post-Proterozoic cover, which create ideal conditions for the remobilization of lode gold in the weathering zone. The laterite and saprolite are commonly exploited by the “garimpeiros”. Due to secondary enrichment and oxidation, these deposits may be concentrated over uneconomic bedrock mineralization, forming superficial gold occurrences. The gold generally consists of small grains and nuggets occurring in deeply weathered areas within laterite soil and saprolite in vertical thickness from 10 meters up to 50 meters. A large percentage of the gold is residual in origin and likely represents particles weathered from auriferous quartz veins. Some of the gold may be of chemical origin with, gold precipitated from solutions that derived the metal both from weathering of the gold-quartz veins and from the host rocks. Gold mineralization appears to be primarily controlled by major northwest-trending structures, but host rock control appears to be an important factor.
“Garimpeiro” activities in the Tapajós region have uncovered numerous zones of primary mineralization. It is important to note that the areas with a high density of primary mineralization are generally coincident with areas of high density of auriferous alluvium deposits and intense “garimpeiro” developments.
The main types of primary gold mineralization described within the Tapajós region are the following:
34
• Stockworks and disseminated; • Quartz vein deposits; • Quartz-sulfide lodes; • Shear hosted
The sources of the myriad of placers in the Tapajós region are generally low to moderate sulphide-containing gold-quartz veins. Gold mineralization contained within the Brazilian Shield is commonly localized by faults and shear zones. Quartz veins generally range in thickness from a fraction of a centimeter to upwards of ten meters. The quartz veins are typically milky white to grey in color and not banded. Native gold and minor to trace amounts of pyrite with lesser amounts of chalcopyrite, bornite, galena, and sphalerite are the most typical accessory minerals in the quartz veins. Carbonate alteration in the quartz veins extends as much as 30 meters into the wallrocks in some districts. In addition to carbonate alteration, the wallrocks can be intensely silicified, sericitized, and propylitized (with epidote and chlorite) as much as several tens of meters away from the veins.
35
9 MINERALIZATION
The Tocantinzinho mineral deposit is a bulk-tonnage gold-bearing sheeted quartz vein stockwork hosted in granitic rocks of the Parauari Intrusive Suite. A consistent large mass of stockwork gold mineralization has been outlined by core drilling with dimensions of about 700 meters in a northwesterly direction and a width dimension of about 120-200 meters in a northeasterly direction.
Gold is associated with hairline to 4-cm wide stockwork quartz veinlets with several predominant veinlet trends. The two strongest veinlet trends strike at about N20-30E and N70-80E respectively. Other veinlet trends also exist, but because of the predominance of the two trends, the veining is best described as a sheeted stockwork.
Two types of veins and veinlets are predominant in the stockwork zone. An earlier quartz-chlorite vein system forms sheeted stockworks and has associated pyrite. Associated to these quartz-chlorite veins, economic gold mineralization is ubiquitous. The second and younger vein type (called base metal veins) is gray quartz with pyrite, generally with chlorite and carbonate, variable small quantities of chalcopyrite, galena, sphalerite and native gold. Where the base metal minerals (mainly galena) are visible and abundant in these veins, native gold is generally visible to the naked eye as 1-mm or smaller individual specks and flakes. Microscopic studies have shown that gold is also disseminated as discrete 1-5 micron particles in pyrite. The two styles of veining are coincidental but the base metal veins tend to follow quartz-chlorite veining.
The presence of abundant grayish quartz veinlets, especially when galena or chalcopyrite are also visible in the drill core, signals that gold values are high. Disseminated pyrite in the core with abundant quartz-chlorite veinlets indicates lower grade gold values but still resource-grade mineralization. Stockwork-type veining is consistent and drill holes have intersected this style of mineralization in excess of 300 meters in length. Though open at depth, the stockwork stops rather quite abruptly on the northeast and southwest flanks of the stockwork zone. The overall sulfide content of the gold-bearing stockwork zone varies from 1-3 volume percent and may average between 1 and 2 percent. This amount of sulfide, for all practical purposes pyrite, coincides with the average gold grade of the stockwork of 1.5-2.0 g/t Au.
The deposit has been followed by drilling from the surface to a vertical depth of more than 300 meters and has not been bottomed. Gold mineralization is preferentially hosted in the coarse-grained granite. The granite has aplite and pegmatite phases that were less amenable to veining and gold mineralization.
Outside the veins, pyrite generally replaces chlorite and tends to be anhedral in habit, usually 1-mm or smaller in the size of the crystals. Chlorite also occurs as distinct wisps and as fracture coatings within the granite host, generally associated to the pyrite. Chlorite veining and chlorite wisps within the host granite are exceptionally common and well-developed near chlorite-rich altered andesite dikes, suggesting that at least some of the components of the chlorite are derived from the andesite.
Two zones of mineralization in drill hole TOC 06-35 were analyzed for total sulfur, copper, and lead. The first set of analyses of 37 individual samples, representing 71.19 m of core, with an average grade of 1.25 g/t Au has a weighted average of 0.26 percent
36
total sulfur. The second segment of drill core, representing 75.85 m of mineralized core, with an average grade of 1.88 g/t Au, composed of 40 individual samples, has a weighted average of 0.31 percent total sulfur. If all of the sulfur is ascribed to pyrite, and sulfur theoretically makes up 53.4 percent of pyrite by weight, then the average pyrite content of these two mineralized intervals is about 0.42 percent by weight. Copper and lead contents of the individual samples are consistently below the wet chemical lower analytical limit of 0.01 percent for each element.
A distinguishing characteristic feature of the host granite is that its quartz phenocrysts have a blebby botryoidal-like habit: a white to faint-blue granular texture that suggests recrystallization and overgrowth. In several areas of the mineralization blebby quartz phenocrysts have been observed to have grown across quartz-chlorite veinlets; however, that is the exception to the rule as quartz-chlorite veinlets generally cut across the blebby quartz phenocrysts. Coincident with the blebby quartz, the K-feldspars (microcline) have a distinct salmon-pink color due to microscopic inclusions of hematite. The combination of this bright pink color of the feldspar with the blebby white quartz, constituting the most productive host rocks, has been given the alteration type field name of “Salami-Type” granite.
A second most important veining style is the “gray quartz” veining. This type of veining is younger than the quartz-chlorite veining, generally of the same structural attitude as the earlier quartz-chlorite veins but generally thicker, locally ballooning up to 4 cm in thickness. The gray quartz veins are distinguished by their finely to coarsely disseminated pyrite, thus their gray color, whose shape tends to be irregular and not individual cubes, generally forming irregular aggregates within the veins. Differing from the earlier quartz-chlorite veins, the gray quartz veins characteristically contain various amounts of chalcopyrite, galena, traces of sphalerite, and native gold. Veins show no banding. There are no significant concentrations of deleterious elements such as arsenic. Gold tends to be visible to the naked eye when there is an abundance of galena and chalcopyrite. The veins also can contain calcite in their centers. Gray quartz veins are less planar than the quartz-chlorite veins and are anastomizing and branching. A careful examination of drill core intervals which contain more than 5 g/t Au usually reveals the presence of visible gold in gray quartz veins or veinlets. There is the distinct possibility that gold values in core below grades of 5 g/t Au can also be attributed to more subtle and thinner veinlets of gray quartz which are intergrown with the earlier quartz-chlorite veinlets. Observations support this but it has not yet been conclusively demonstrated. The frequency and thickness of gray quartz veining is in direct proportion to the gold grade of the various intervals. The abundance of early quartz-chlorite sheeted stockwork veining might be an indicator of a structurally active environment, an environment favorable to the introduction of later gold-bearing gray quartz veins and veinlets. Nevertheless, early quartz-chlorite veining is an indicator for gold mineralization above the 0.2 g/t cutoff grade.
The quartz-sheeted veins, the blebby quartz phenocrysts and silica flooding, which do occur mainly in the gray type ore, indicate that silicification is an important alteration phase to the mineralization. Because chlorite, silica and the small amounts of pyrite are the most distinguishing characteristics of alteration, the general alteration scheme is best described as propylitic.
The sheeted stockwork veinlets show some preferred orientation. Though many vein orientations have been measured, two directions are predominant: one averaging about
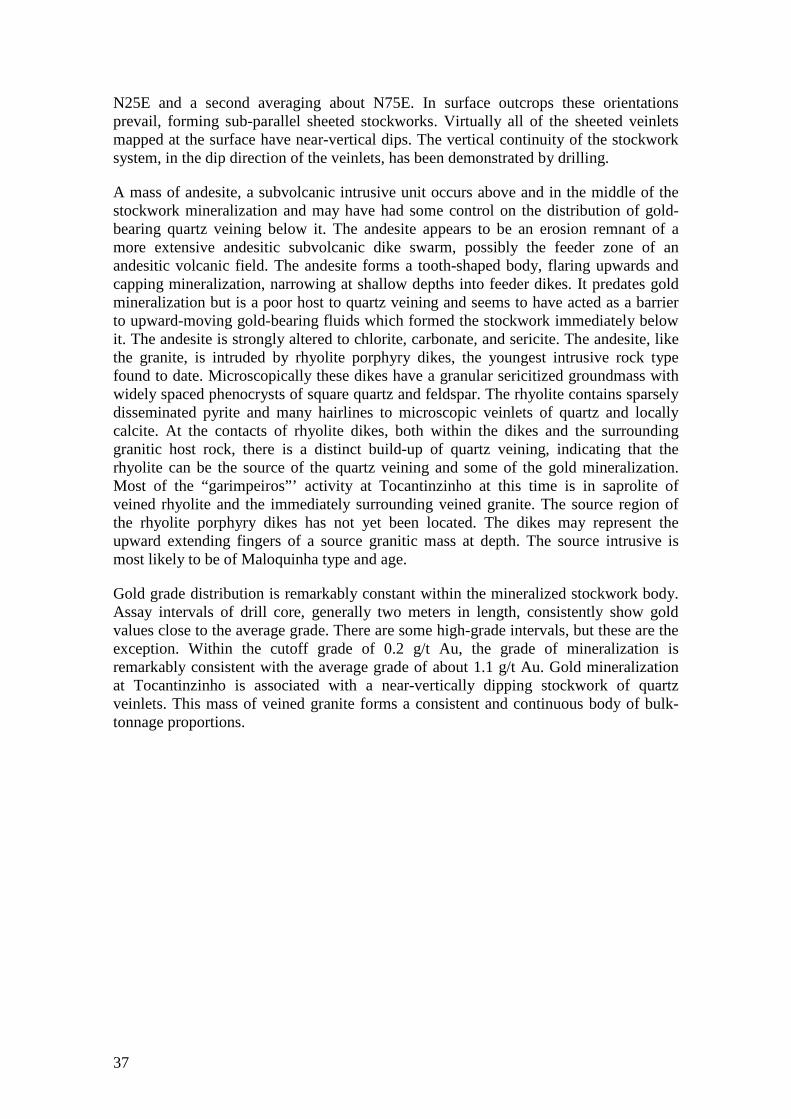
37
N25E and a second averaging about N75E. In surface outcrops these orientations prevail, forming sub-parallel sheeted stockworks. Virtually all of the sheeted veinlets mapped at the surface have near-vertical dips. The vertical continuity of the stockwork system, in the dip direction of the veinlets, has been demonstrated by drilling.
A mass of andesite, a subvolcanic intrusive unit occurs above and in the middle of the stockwork mineralization and may have had some control on the distribution of gold-bearing quartz veining below it. The andesite appears to be an erosion remnant of a more extensive andesitic subvolcanic dike swarm, possibly the feeder zone of an andesitic volcanic field. The andesite forms a tooth-shaped body, flaring upwards and capping mineralization, narrowing at shallow depths into feeder dikes. It predates gold mineralization but is a poor host to quartz veining and seems to have acted as a barrier to upward-moving gold-bearing fluids which formed the stockwork immediately below it. The andesite is strongly altered to chlorite, carbonate, and sericite. The andesite, like the granite, is intruded by rhyolite porphyry dikes, the youngest intrusive rock type found to date. Microscopically these dikes have a granular sericitized groundmass with widely spaced phenocrysts of square quartz and feldspar. The rhyolite contains sparsely disseminated pyrite and many hairlines to microscopic veinlets of quartz and locally calcite. At the contacts of rhyolite dikes, both within the dikes and the surrounding granitic host rock, there is a distinct build-up of quartz veining, indicating that the rhyolite can be the source of the quartz veining and some of the gold mineralization. Most of the “garimpeiros”’ activity at Tocantinzinho at this time is in saprolite of veined rhyolite and the immediately surrounding veined granite. The source region of the rhyolite porphyry dikes has not yet been located. The dikes may represent the upward extending fingers of a source granitic mass at depth. The source intrusive is most likely to be of Maloquinha type and age.
Gold grade distribution is remarkably constant within the mineralized stockwork body. Assay intervals of drill core, generally two meters in length, consistently show gold values close to the average grade. There are some high-grade intervals, but these are the exception. Within the cutoff grade of 0.2 g/t Au, the grade of mineralization is remarkably consistent with the average grade of about 1.1 g/t Au. Gold mineralization at Tocantinzinho is associated with a near-vertically dipping stockwork of quartz veinlets. This mass of veined granite forms a consistent and continuous body of bulk-tonnage proportions.
38
10 EXPLORATION
10.1 Tocantinzinho Area
Exploration work completed to date at the Tocantinzinho Project include the establishment of a grid, geological mapping, channel sampling in the “garimpeiro” pits, geochemical studies, auger soil sampling, power auger drilling, geophysical investigations by ground and airborne magnetic surveying, detailed topographic survey and core drilling programs that have completed 159 holes for a total drilled depth of 45,065 meters. In addition, petrographic and metallurgical studies have been conducted on drill core by contracted consulting firms.
The area around Tocantinzinho is jungle-covered with a lateritic profile of 2 to 10m overlying another 10 to 20m of saprolite. Weathered outcrops occasionally occur in drainages and it is generally possible to identify the original rock type from these outcrops. Some relatively fresh outcrops occur in the larger drainages. Detailed geological mapping was completed along the barren central ridge and in the main, placer pits. Some of the workings have changed in shape and exposures since the mapping due to continued “garimpeiros” mining.
A ferruginous zone lies near the base of the soil/laterite profile and commonly contains nodules and layers of ferricrete usually overlying the Fe-rich andesites.
Soil sampling was conducted around the main “garimpeiro” workings and along lines and grids extending up to two km from the “garimpeiro” pits. Within the main grid placed on the obviously mineralized zone, lines were located at 100 meter spacing and samples were taken at 40 meter intervals along the lines. Over 700 samples were collected between 1997 and 1999. Samples were collected using a hand auger and at the start of the program a survey was conducted to determine the optimum depth for sample collection. Samples were collected from several locations at half-meter increments and Schuler reports that grades were slightly enriched in the top half meter but relatively consistent below this level. As a result of this survey, all samples were collected between 0.5 and 1.0 meters depth.
The soil sampling program outlined a highly anomalous area roughly 1,000 meters long by up to 500 meters wide. This area has now been almost completely excavated by the “garimpeiros”. There were some other anomalous values found in the near vicinity of the main anomaly, which at the time warranted further investigation, provided in situ mineralization was found under the pit. The soil samples were not assayed, but panned with the grade calculated from counted gold grains.
Schuler states that this pinta counting technique has been used by many companies in Brazil because labor is inexpensive and turnaround time for results is short. It is particularly effective at Tocantinzinho where costs are high for transporting samples from the project. The soil sampling project employed two panners who had many years of experience in this technique with RTZ. The area underlying the principal anomaly has been almost completely removed by the “garimpeiros” since that time.
39
Figure 10-1 Soil Geochemistry
Four-hundred-seventy-six channel samples of saprolite (weathered bedrock) were collected from the various “garimpeiro” pits. These were mostly 4-m horizontal samples from walls and floors of the “garimpeiro” pits with a few vertical channels collected from the walls of the pits. There was not a systematic approach to the sample location, with samples taken from available “garimpeiro” working faces. Bondar Clegg assayed all channel samples; maps are available showing the location of all of the samples. Some of the pits, particularly the north part of the main pit, were sampled several times at different levels as the “garimpeiros” excavations went deeper. All of the sampled areas are now covered by either sandy tailings or water. These channel samples were not used in the resource estimation.
A ground magnetometer survey was conducted along the established grid lines spaced 50 meters apart. The lines completed were from grid 9000 N to 9450 N with the survey extending between 4700 E and 5300 E. Readings were taken at 5 meter intervals. Altoro collected 6.0 km of magnetic data with one magnetometer, using a loop configuration whereby the operator returned to the base station for control. Along the 50m line separation, the station separation was 5m. A total of 10 east-west oriented lines of 600m each were surveyed. The data were processed by Rhiannon Morris, a consulting geophysicist with Howe Chile Limitada. Data were corrected and leveled.
An airborne geophysical survey carried out in 2005, have identified several target areas. In a grand sense, Tocantinzinho is located at the junction of a very prominent
40
northwest-trending magnetic low (probably a large shear zone) where it crosses an east-northeast-trending magnetic low, probably representing another shear zone. In detail, the northwest-trending zone has an intermediate low that seems to correlate with mineralization. This magnetic trough, probably representing an iron oxide-destructive hydrothermally altered area, appears to be offset by an NW-SE magnetic high. The magnetic trough of interest is offset to the east by the magnetic high feature and appears to continue towards the southeast. This is a distinct exploration target. To the northwest of the drilled area, the magnetic low trough meets the prominent ENE-trending magnetic low. This is an unknown area, representing destruction of iron oxides, and is also a legitimate drill target. Both of these magnetically anomalous areas should be tested during the next stage of drilling.
10.2 Other Areas
Brazauro has four more exploration areas in the region, Bom Jardim and Andorinhas, northwest of Tocantinzinho and Piranhas and Água Branca to the southwest and south.
The Bom Jardim area locates approximately 30km NE of the Crepori river mouth at the Tapajós river. The Bom Jardim is a spectacular circular feature resembling a large volcanic caldera. The geology of the area is composed by intermediate-acid volcanic rocks of the Uatumã tectono-magmatic event (1,900-1,882 Ma). The volcanic rocks are dacites and latites of the Bom Jardim Formation and dacites and rhyolites of the Salustiano Formation. Brazauro has been issued four exploration licenses by the DNPM, for a total of 37,653 hectares.
In this area, Brazauro aims to explore for gold deposits related to epithermal systems like those existent in the Fanerozoic mountain belts. This idea is supported by the discovery made by Rio Tinto Exploration Brasil in 1998, of the oldest Au-epithermal system (V3-Botica) preserved in the world. Like Bom Jardim, the mineralized volcanic rocks at V3-Botica are also of the Uatumã event, in that case, in the Salustiano Formation.
An airborne survey (magnetic and radiometric) totalling 4,353 linear kilometers, with flight lines spaced 200 meters, was completed in May, 2008 to support the company to highlight targets for the exploration program.
The combined interpretation of the airborne survey and remote sensing images led to the definition of ten targets which were followed up from October 2008 to July 2009. The exploration program was carried out along two fronts. One front had teams walking all the creeks draining the caldera in search of rock float and out-cropping rocks which could eventually indicate hydrothermalism and mineralization. At the same time these crews collected pan concentrate samples for gold analysis and fine sediments for ICP multi-element analysis. Along the other front, crews carried out grid soil sampling over the pre-defined targets, for gold and base metals analysis.
A total of 134 kilometers of lines were cut for soil sampling and mapping. A total of 1,625 soil samples, 152 pan concentrate samples and 83 sediment samples were collected. During the mapping of the creeks and grids, 462 rock samples were collected and out of this, 111 were assayed.

41
The results of this first phase of exploration led to a definition of one target made up of coincident copper, zinc and vanadium anomalies. Sediment samples from creeks draining the same area also had anomalous copper, zinc and vanadium values. Brazauro is now evaluating the results of the first phase of exploration at Bom Jardim, to decide the next steps on this project
The company also holds three exploration licenses for a total of 28,720 hectares in the Andorinhas property. This property is located close to the mouth of the Crepori river and lies in another important gold belt in the Tapajós, the north-south trending Ouro Roxo-Canta Galo mega shear zone. As the exploration licenses were recently issued, the company did not commence exploration over this area.
In July 2008, September 2009 and December 2009 Brazauro entered into three Option Agreements to acquire 100% of the Piranhas property situated approximately 20 kilometers southwest of the Company’s Tocantinzinho project. These agreements include four exploration applications and one exploration license for a total of 34,533 hectares. Piranhas is a well-known and historic garimpo that has been active for the last 40 years. The unofficial artisanal gold production from near surface has been reported as more than 836,000 ounces of gold, all produced by primitive methods. Geologically, the Piranhas property is one of the most interesting in the Tapajós, where a sequence of geotectonic events can be responsible for diverse styles of gold mineralization. The local basement is the gold-fertile Parauri granite, the same unit which hosts the Tocantinzinho gold deposit. Overlying the Parauari granite, there is a cover of volcanic rocks of the Salustiano formation and intruding all that sequence, there is a stock of the Maloquinha granite. Gold mineralization may be found in all these rock types.
The near surface mineralization has been mined out and Brazauro will focus on the source of this surface mineralization in the vicinity as well as at depth. The company has already started a soil sampling program and geological mapping in the 7,230 hectares area for which the exploration license has been issued.
Under an option agreement signed in December 2009 Brazauro has the option to acquire the Água Branca Project from Talon Metals Corp. and has paid Talon US$60,000 with an additional US$60,000 due upon renewal of the exploration licenses by the Brazilian National Department of Mineral Production (DNPM) which is expected on or before February 26, 2010. Two subsequent option payments of US$130,000 and US$1,870,000 are due on December 31, 2010 and September 30, 2011, respectively. Brazauro has also committed to perform a minimum of US$500,000 per year for each of the first two years following renewal of the exploration licenses by DNPM. The development expenditure obligations are cumulative and aggregate against the overall US$1 million obligation. Talon retains a 2% net smelter royalty which Brazauro can purchase for US$2,000,000.
Água Branca property lies approximately 35 km south of Tocantinzinho. The access can be made year round through a dirt road starting at the Transgarimpeiro road. At Água Branca, the scale of the surface workings done by the “ garimpeiros” and the amount of shafts sunk in the target called Camarão is quite impressive. This target was investigated by Talon with the execution of 13 diamond holes. Mineralization at Camarão is related to narrow veins where gold usually is high grade. The host rocks are
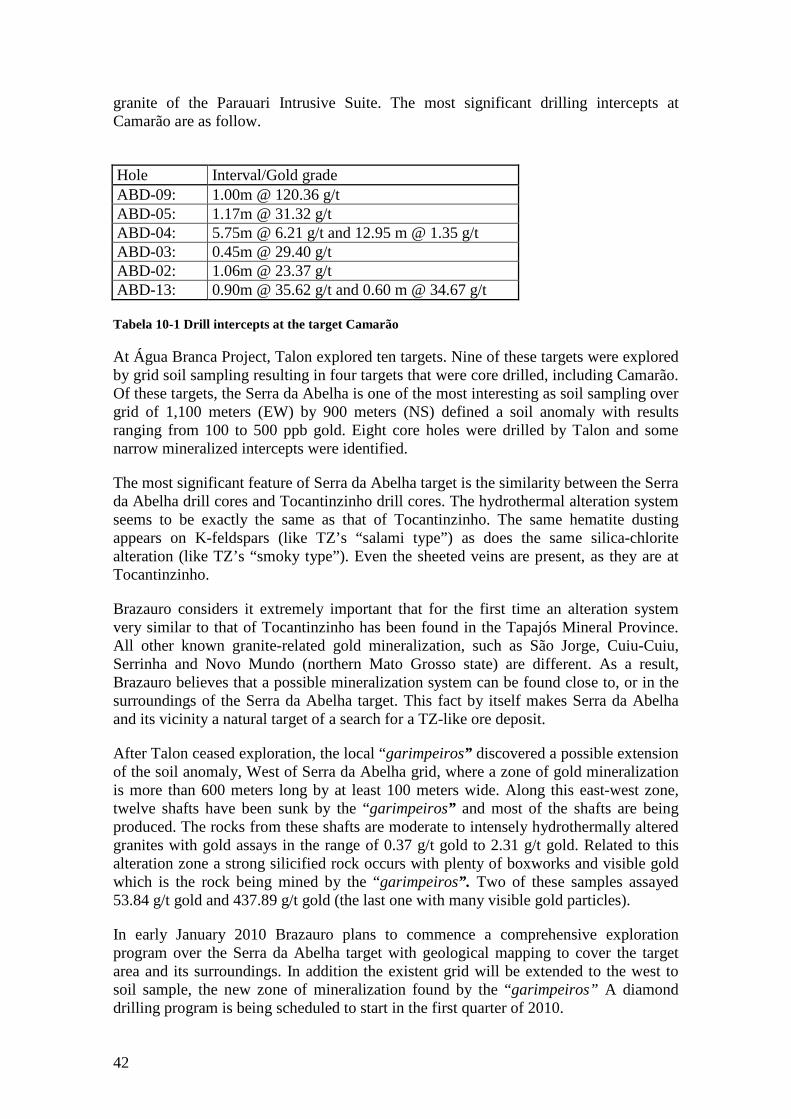
42
granite of the Parauari Intrusive Suite. The most significant drilling intercepts at Camarão are as follow.
Hole Interval/Gold grade ABD-09: 1.00m @ 120.36 g/t ABD-05: 1.17m @ 31.32 g/t ABD-04: 5.75m @ 6.21 g/t and 12.95 m @ 1.35 g/t ABD-03: 0.45m @ 29.40 g/t ABD-02: 1.06m @ 23.37 g/t ABD-13: 0.90m @ 35.62 g/t and 0.60 m @ 34.67 g/t
Tabela 10-1 Drill intercepts at the target Camarão
At Água Branca Project, Talon explored ten targets. Nine of these targets were explored by grid soil sampling resulting in four targets that were core drilled, including Camarão. Of these targets, the Serra da Abelha is one of the most interesting as soil sampling over grid of 1,100 meters (EW) by 900 meters (NS) defined a soil anomaly with results ranging from 100 to 500 ppb gold. Eight core holes were drilled by Talon and some narrow mineralized intercepts were identified.
The most significant feature of Serra da Abelha target is the similarity between the Serra da Abelha drill cores and Tocantinzinho drill cores. The hydrothermal alteration system seems to be exactly the same as that of Tocantinzinho. The same hematite dusting appears on K-feldspars (like TZ’s “salami type”) as does the same silica-chlorite alteration (like TZ’s “smoky type”). Even the sheeted veins are present, as they are at Tocantinzinho.
Brazauro considers it extremely important that for the first time an alteration system very similar to that of Tocantinzinho has been found in the Tapajós Mineral Province. All other known granite-related gold mineralization, such as São Jorge, Cuiu-Cuiu, Serrinha and Novo Mundo (northern Mato Grosso state) are different. As a result, Brazauro believes that a possible mineralization system can be found close to, or in the surroundings of the Serra da Abelha target. This fact by itself makes Serra da Abelha and its vicinity a natural target of a search for a TZ-like ore deposit.
After Talon ceased exploration, the local “garimpeiros” discovered a possible extension of the soil anomaly, West of Serra da Abelha grid, where a zone of gold mineralization is more than 600 meters long by at least 100 meters wide. Along this east-west zone, twelve shafts have been sunk by the “garimpeiros” and most of the shafts are being produced. The rocks from these shafts are moderate to intensely hydrothermally altered granites with gold assays in the range of 0.37 g/t gold to 2.31 g/t gold. Related to this alteration zone a strong silicified rock occurs with plenty of boxworks and visible gold which is the rock being mined by the “garimpeiros”. Two of these samples assayed 53.84 g/t gold and 437.89 g/t gold (the last one with many visible gold particles).
In early January 2010 Brazauro plans to commence a comprehensive exploration program over the Serra da Abelha target with geological mapping to cover the target area and its surroundings. In addition the existent grid will be extended to the west to soil sample, the new zone of mineralization found by the “garimpeiros” A diamond drilling program is being scheduled to start in the first quarter of 2010.
43
11 DRILLING
To the end of October 2009, Brazauro and Eldorado have completed a total of six core drilling campaigns that include 159 holes at Tocantinzinho for a total of 45,065 meters. Of the 159 holes, 139 have explored the main zone of mineralization. Fourteen holes were intended as prospecting holes to test some of the surrounding areas to the main known zone of the deposit and six holes were twin holes drilled by Eldorado to generate samples for metallurgical tests.
11.1 CORE DRILLING PROGRAMS
All drilling by Brazauro and Eldorado has been core diamond drilling and was conducted by Kluane International Drilling, Inc. whose base is in Vancouver, B.C., Canada. Nowadays, Kluane has subsidiaries in Belém and Belo Horizonte in Brazil. This drilling provides light weight portable Hydrocore Gopher all-hydraulic drill rig capable of drilling +350 meters of BTW core during Brazauro’s drilling phases and +500 meters during Eldorado’s drilling phase.
In the first five drilling phases, executed by Brazauro, drill holes were drilled NTW size, with a drill core diameter of 5.71 centimeters, from the surface through the laterite and across the saprolitic bedrock. When hard unweathered bedrock was reached, generally at depths between 25 and 40 meters, the gauge of drill rods was reduced to BTW size. The bulk of the Brazauro’s drill core is BTW size with a drill core diameter of 4.20 centimeters.
In Eldorado’s drilling phase more powerful drill rigs were available making possible to drill deeper and with wider diameters. As a consequence, all Eldorado’s holes were drilled with NTW (5.71 cm) from the surface to depths ranging between 200 and 280 meters, where the gauge of drill rods was reduced to BTW (4.20 cm) diameter. In twelve holes drilled by Eldorado the larger HQ diameter was used from the surface to a depth between 90 and 100 meters, where they were reduced to NTW. Deepest hole drilled by Eldorado reached 516.63 meters and deepest drilled by Brazauro reached 434.34 meters.
All drill holes were angle holes drilled at 47 to 83 degree angles from the horizontal, generally at right angles to the long-axis trend of mineralization, drilled either towards the northeast or towards the southwest. Three of the holes were drilled parallel with the trend of the mineralization, with the purpose of crosscutting the two major sheeted vein trends at the optimal intermediate angle.
The core was split on site by means of a diamond bladed rock saw. One-half of the drill core was sent for assay while the second half has been kept on site for geological studies. Of the 159 core holes completed to date fourteen had been programmed for prospecting exploration in surrounding adjacent areas to the main Tocantinzinho mineralization. The rest of the holes have all been within the 800-m-long continuous geochemical anomaly along the main Tocantinzinho trend. A summary of all drilling is shown on Table 11-1.

44
COMPANY TYPE Number of Holes
Metres drilled
Number of samples
Samples (metres sampled)
BRAZAURO AUG 106 934.4 912 851.4 BRAZAURO DDH 97 25635.05 13543 24662.34 ELDORADO AUG 104 298.3 298 298.3 ELDORADO DDH 62 19430.84 9442 16711.37 TOTAL 369 46298.6 24195 42523.41
TYPE Number of Holes
Metres drilled
Number of samples
Samples (metres sampled)
AUG 210 1232.7 1210 1149.7 DDH 159 45065.89 22985 41373.71
Table 11-1 Drilling summary, by company and total per type
In 2004, the company completed its first exploratory core drilling program of 20 holes for a total of 4,692.9 meters. The first hole, TOC 04-01 intersected significant gold mineralization and was the discovery hole. During the second drilling campaign, conducted in 2005, holes TOC 05-21 through TOC 05-34 were completed for a total of 3,758.9 meters. The third drilling campaign was conducted in mid-2006 when core holes TOC 06-35 through TOC 06-46 were completed. These 12 holes amounted to a total of 3,022.4 meters. The fourth campaign concluded in mid 2007, when core holes TOC 06-47 through TOC 07-71 were completed amounting to a total of 5.763,2 meters. The fifth drilling campaign executed by Brazauro was held in 2008 from holes TOC-08-72 to TOC-08-96 for a total of 8,497.6 meters. In September 2008 Eldorado became the operator of the project, when it started its drilling program which ended in September 2009. Eldorado drilled from hole TOC-08-97 to hole TOC-09-152, for a total of 19,330 meters. Six drill holes executed under Eldorado’s management were twin holes with holes previously drilled by Brazauro. The purpose of these six holes was to provide larger samples for metallurgical testing. The drilling distribution, according to the company, is depicted in the Figure 11-1.
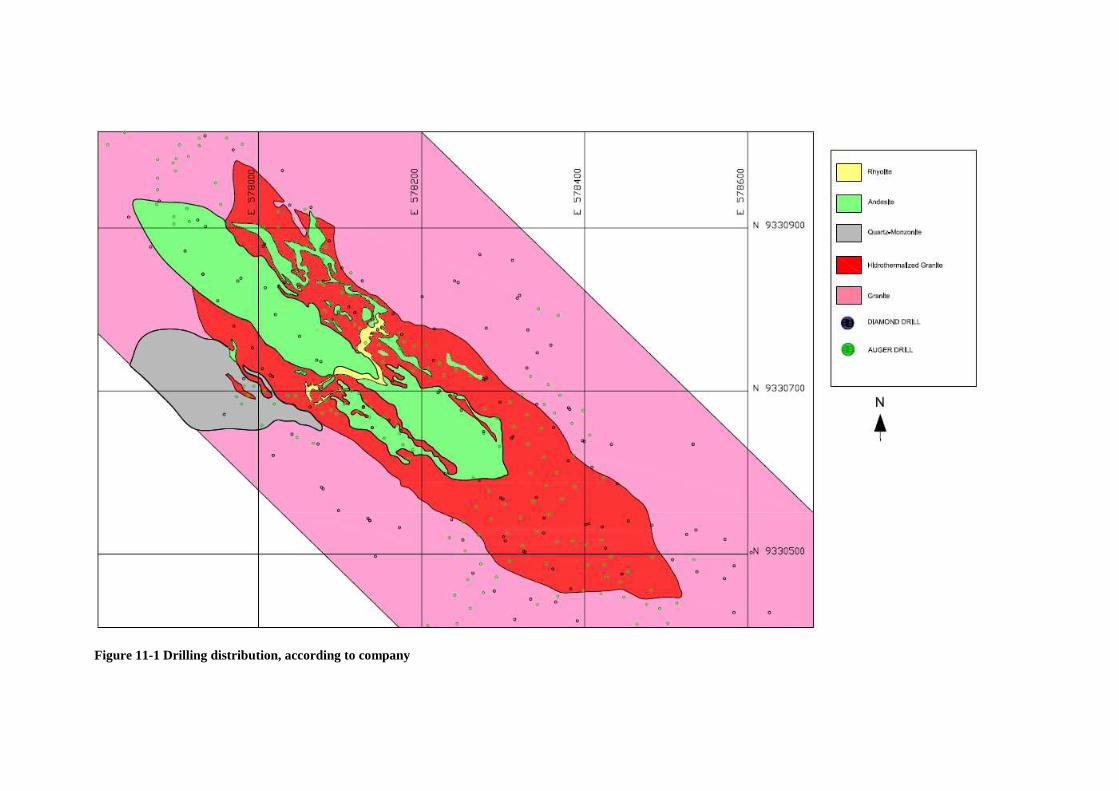
Figure 11-1 Drilling distribution, according to company
12 SAMPLING METHOD AND APPROACH
Only the relevant sampling for the resource evaluation is here commented, basically diamond and auger drilling. Details for the other sampling methods used by Brazauro and previous operators for the identification of anomalies that finally led to the discovery of the deposit should be consulted on the previous Technical Reports, as listed in the references.
12.1 DRILL CORE SAMPLING
Brazauro and Eldorado protocols for sampling and logging drill core are well defined and established. Drill core is retrieved each shift from the drill site and brought to camp. The geologist logs the full core and produces a “Summary Log.” While he is logging the full core he measures and marks the intervals to be sampled, marking sequential sample divisions and numbers in the core. An attempt is made to make 2-meters-long sample intervals, diverging from these intervals for geological reasons, as for example rock type contacts. Core recovery and engineering geological parameters are also noted from the full core. A line is drawn on the core, generally consistent with the geologist refitting all cores together, as a guide for the core cutter. The core is then cut in half along the indicated line by means of a diamond-bladed rock saw. After cutting the core in half, the core cutting laborer places both halves of the core back into the core-box and places the core-box on a logging table. When an entire hole’s core or a long section of the core has been cut, two trained geotechnicians place half of the core into new sample bags and clearly mark the interval, on the ribs of the core box, with the interval footages and sample number. The bagged sample is clearly marked and tagged and enclosed for shipping to the laboratory. Groups of bagged samples are placed in larger sacks. These large sacks are marked, showing the sample numbers enclosed on the face of the large sacks.
Until hole TOC-09-123 samples were shipped to the SGS/Geosol laboratory at Itaituba and starting at hole TOC-09-124 the raw samples were air shipped to the Belo Horizonte’s ALS-Chemex laboratory. The half core remaining in the core boxes is then logged in detail by the project’s geologists. Core loggers make careful note of the rock types, veining, alteration, and mineralogy, estimating all the parameters shown on the individual drill log sheets. The percentage of sulfide is carefully estimated. Where native gold is observed in the detailed logging, those sample intervals are noted and sent to the laboratory for screened metallic assays. The free gold is extremely fine, generally visible only with the aid of a hand lens. Where free gold is observed its presence is marked on the core by dotted magic marker points surrounding the gold. A mark is also put on the core box rib for easy relocation. When analytical results are received they are typed into the core log sheets, at which points the logs are complete. Summary and detailed logs as well as the sample intervals are typed into a computer each evening to keep the database current. Completed drill logs contain sample intervals, sample numbers and assay results, lithology, written notes, and an estimate of sulfides, veinlets by type, alteration by specific minerals, and structural data.
Based on earlier geochemical analytical results, which showed that there were insignificant concentrations of other metals, samples are analyzed for gold only. Specific drill core intervals have also been analyzed for total sulfur, copper and lead: all

47
sample intervals of core hole TOC 06-35 were analyzed for these elements. Tocantinzinho drill core does not contain significant amounts of any deleterious element. No arsenopyrite has been observed in any drill core and generally the arsenic content of mineralized core is below the detection level for that element.
48
13 SAMPLE PREPARATION, ANALYSES AND SECURITY
Only the relevant sampling for the resource evaluation is here commented, basically diamond and auger drilling. The work of Brazauro and previous operators of the project on soil, auger and channel sampling is described in the previous Technical Reports, as listed in the references.
All of Brazauro’s drill core samples and Eldorado’s until hole TOC-09-123, were prepared and analyzed by SGS Geosol Laboratory and all drill core samples from hole TOC-09-124 were prepared and analyzed by ALS-Chemex Laboratory. Bagged core samples were shipped from Tocantinzinho to Itaituba by either bush plane or by a combination of boat and truck transportation. Previous to the existence of the SGS Geosol preparation facility in Itaituba, all core samples were shipped by truck from Itaituba to the SGS Geosol sample preparation facility in Parauapebas in the Carajas District of Para State. Prepared sample pulps were sent from Parauapebas to the SGS Geosol analytical laboratory in Belo Horizonte. Beginning in April of 2006, SGS Geosol opened a sample preparation facility in Itaituba. Since that time, all Tocantinzinho core samples until hole TOC-09-123 have been prepared at the Itaituba facility. Sample pulps are then sent to the Belo Horizonte laboratory for chemical analysis. Starting at hole hole TOC-09-124 the raw samples were air shipped to the Belo Horizonte’s ALS-Chemex laboratory.
Sample preparation check programs at Tocantinzinho were established to ensure the integrity of the samples. These systems included the preparation of duplicate samples as well as the insertion of blank and standard samples.
13.1 DRILL CORE AND ROCK ASSAY METHODS
Brazauro utilized the analytical services of SGS Geosol for all its drill core samples during each of its five phases of diamond drilling. Eldorado followed the same sampling procedures as that of Brazauro, however, utilizing the ALS-Chemex services starting at hole TOC-09-124.
While the geologist completes preliminary logging of the full core, the core is marked for sample intervals. Sample intervals are generally two-meters long with exceptions made to accommodate geological contacts, alteration boundaries, and zones of strong mineralization. Sample intervals which contain visible gold are specifically marked for special sample preparation methods described below. The core is then sent to the core-cutting facility on site and cut in half by means of a diamond saw and placed back into the core box. A specially trained sampling crew then removes one half of the core from the various pre-marked core intervals, placing each interval into a numbered and labeled plastic bag. The sample numbers are also appropriately marked on the ribs of the wooden core boxes for each sample interval. Bagged samples are placed into larger bags, about ten samples per bag. Sample numbers in each bag are clearly marked on the outside of the large bags for easy identification and sorting at the analytical laboratory.
49
13.1.1 METHOD OF SAMPLE PREPARATION FOR ASSAYING
At the SGS Geosol sample preparation facility, samples are placed into trays and dried at 110° C. When dry, the entire sample, usually about 2-3 kilograms, is crushed to minus 2 mm size and a 1 kilogram sample split is taken from the crushed product by means of a Jones splitter. This split sample is then ground to a -150 mesh pulp, and a 125 grams-size homogenized fraction removed: 50 grams of which are used for the analysis and 75 grams of which are stored in a marked envelope for future reference. Prior to sample preparation, samples which have been marked specifically because visible gold had been observed during the rough logging of the full core are handled slightly differently from the normal samples. The entire sample is crushed and ground to -150 mesh. The sample is then passed through a 150 mesh screen. The undersize, the bulk of the sample, is weighed and treated exactly as a normal sample, with 125 grams extracted, 50 grams of which go for fire assay and 75 grams are stored for future use. The oversize is then collected, weighed, pulverized, and treated as a separate sample. Both analyses are reported separately but the laboratory calculates a weighted average of the two results in its final report. This reported single value is ascribed to the sample interval. At ALS-Chemex laboratory, samples are dried at 105°C; crushed with at least 70% of passing mass in 2mm sieve (grain fraction). Samples are split to obtain 250 to300g of material and pulverized with at last 85% of material passing in a sieve of 75 microns = 200 mesh. A split of 30g is assayed by Fire Assay and AAS. In case of samples with visible gold a duplicate is collected and the procedure is repeated.
13.2 METHOD OF GOLD ANALYSIS BY FIRE ASSAY/AA FINISH
(a) 50 grams of the pulverized sample is weighed into a crucible which contains a combination of fluxes such as lead oxide, sodium carbonate, borax, silica flour, baking flour or potassium nitrate. After the sample and fluxes have been mixed thoroughly, a silver inquart and a thin layer of borax is added on top.
(b) The sample is placed into a fire assay furnace at 2000º F for one hour. At this stage, lead oxide is reduced to elemental lead and slowly sinks down to the bottom of the fusion pot or crucible collecting the gold and silver along its way to the bottom of the melt.
(c) After one hour of fusion, the crucible is removed from the furnace and its contents poured into a conical cast iron mold. Elemental lead, which contains the precious metals, sinks to the bottom of the mold and any unwanted materials, the glassy slag, floats to the top. When cooled, the cone is removed from the mold and by hammering the glass is eliminated and a "lead button" formed.
(d) The lead button is then put onto a preheated cupel made of bone ash and reintroduced into a furnace for a second stage of separation at 1650º F. The lead button becomes liquefied and reacts with and is absorbed by the cupel. The gold and silver which have higher melting points remain on top of the cupel.
(e) After 45 minutes of cupellation, the spent cupel is then taken out of the furnace and cooled. The doré bead which contains the precious metals is then transferred into a test tube and dissolved in hot Aqua Regia solution heated by a hot water bath.

50
(f) The amount of gold in solution is determined with an Atomic Absorption spectrometer (AA). The gold value, in parts-per-billion, or grams-per-tonne, is calculated by comparison with a set of known gold standards.
51
14 DATA VERIFICATION
NCL has not collected any independent samples for data corroboration. NCL has found no inconsistencies in the database that would indicate that the data are significantly in error or not representative of the Project’s mineral occurrences.
NCL site visit included a review of the geologic setting to confirm alterations and mineral evidences in the Project’s area. Rock outcroppings, garimpeiro workings and some of the drilled areas were visited. Drill cores were examined at the project site.
14.1 CHECK ANALYSIS
Besides the routine internal standards and duplicate analyses performed during SGS Geosol’s and ALS/Chemex analytical work for all of the drill core and auger samples, Brazauro and Eldorado routinely inserted its own standards. The procedures were the following:
14.1.1 Brazauro Protocol of QAQC
At the time the core samples were bagged, the sampling crew inserted its own control sample every 10th sample, whereby either a blank, a medium gold grade sample (1,805-ppb), or a high grade gold standard sample (8,367-ppb) was inserted in the sequence of samples. The standards were inserted in the field at regular intervals. In each batch of 50 samples, the standards were inserted at each nine samples; a low standard at the 10th and 20th sample, one blank at the 30th and one high standard at the 40th sample. The standard samples have been prepared and provided by Rock Labs from New Zealand.
14.1.2 Eldorado Protocol of QAQC
The QAQC protocol used by Eldorado was considered by NCL as being very well designed and implemented.
Seven types of Standard samples are used, covering a range of grades, from 0.86 g/t to 13.6 g/t Au, supplied by Geostats Pty. At every 10th sample one standard is used. Blanks are used at the rate of one blank at each 40 samples. Field duplicates (one quarter of a core) are inserted at each 15th sample or less. Coarse duplicates are submitted to the laboratory after return of the rejects of quartering. Very strict levels of variation are permitted. The rate of resubmission of samples due to failure of attending the acceptance rules varied from 100%, in the startup of the Eldorado’s involvement with the project, to 0%, on the final holes.
14.2 QAQC ANALYSIS
Only the Eldorado QAQC data is here interpreted. Previous information from Brazauro for quality control has been analyzed in the 2007 NCL Technical report and considered adequate to support the usage of the drilling information in the resource evaluation.

52
14.2.1 Failure rate
In general, the results for failure rate show a decreasing variance during the period comprised between September 2008 and September 2009, as shown in Figure 14-1. This demonstrates that the quality measures put in place initially were followed up by the laboratory and the overall quality increased through the end of the campaign.
Figure 14-1 Failures detected by the Eldorado’s QAQC program.
14.2.2 Blank Samples
No contamination events were detected within the period evaluated (sep/08-sep/09), except for one sample that seems to be swapped during the sampling process. The results are shown in Figure 14-2.
Figure 14-2 Blank samples results.
QC Sample Failure Rate Tocantinzinho Project
September 2008 to September 2009
0
10
20
30
40
50
60
70
80
90
100
1 2 3 4 5 6 7 8 9
10
11
12
13
14
15
16
17
Months
Fail
ure
Rat
e %
G901-13
G907-2
G907-6
G907-8
G903-7
G903-9
Si42
Total Fai lures
Field Blanks - Tocantinzinho Project
From September 2008 to September 2009
0.00
0.01
0.02
0.03
0.04
0.05
0.06
0.07
0.08
0.09
0.10
0.11
0 51
01
52
02
53
03
54
04
55
05
56
06
57
07
58
08
59
09
51
00
10
51
10
11
51
20
12
51
30
13
51
40
14
51
50
15
51
60
16
51
70
17
51
80
18
51
90
19
52
00
20
52
10
21
52
20
22
52
30
23
52
40
24
52
50
25
52
60
26
52
70
27
52
80
28
52
90
29
53
00
30
53
10
Instance - Lab Received Date
Au
pp
m
Blank Samples
Warning Level
Under Investigation
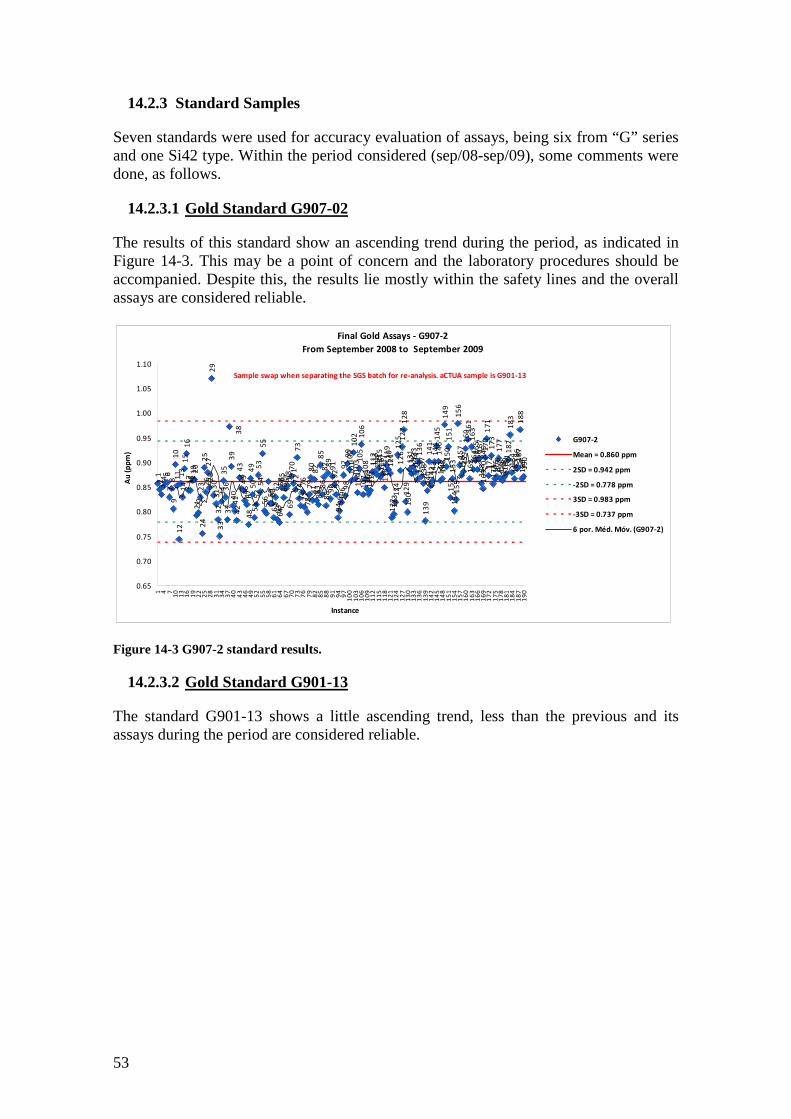
53
14.2.3 Standard Samples
Seven standards were used for accuracy evaluation of assays, being six from “G” series and one Si42 type. Within the period considered (sep/08-sep/09), some comments were done, as follows.
14.2.3.1 Gold Standard G907-02
The results of this standard show an ascending trend during the period, as indicated in Figure 14-3. This may be a point of concern and the laboratory procedures should be accompanied. Despite this, the results lie mostly within the safety lines and the overall assays are considered reliable.
Figure 14-3 G907-2 standard results.
14.2.3.2 Gold Standard G901-13
The standard G901-13 shows a little ascending trend, less than the previous and its assays during the period are considered reliable.
Final Gold Assays - G907-2
From September 2008 to September 2009
12
34
5 67
89
10
11
12
13
14
15
16
17
18
19
20
21 22
23
24
25
26
27
28
29
30
31
32
33
34
35
36
37
39
40
41
42
43
44
45
46
47
48
49
50
51
52
53
54
55
56
57
59
60
61
62
63
64
65
66
67 68
69
70
71
72
73
74
75
76
77
78
79
80
81
82
83
84
85
86
87
88
89
90
91
92
93
94 9
59
69
79
89
91
00
10
11
02
10
31
04
10
51
06
10
71
08
10
91
10
11
11
12
11
31
14 11
51
16
11
71
18
11
91
20
12
11
22
12
3 12
41
25
12
61
27
12
81
29
13
01
31
13
2 13
31
34
13
51
36
13
71
38
13
91
40
14
11
42 14
31
44
14
51
46
14
71
48
14
91
50
15
11
52
15
31
54 1
55
15
61
57
15
81
59
16
0 16
11
62
16
31
64 1
65
16
6 16
71
68
17
01
71
17
21
73
17
41
75
17
61
77
17
81
79
18
01
81
18
21
83
18
41
85 1
86
18
71
88
18
91
90
38
58 16
9;
0.8
45
0.65
0.70
0.75
0.80
0.85
0.90
0.95
1.00
1.05
1.10
1 4 71
01
31
61
92
22
52
83
13
43
74
04
34
64
95
25
55
86
16
46
77
07
37
67
98
28
58
89
19
49
71
00
10
31
06
10
91
12
11
51
18
12
11
24
12
71
30
13
31
36
13
91
42
14
51
48
15
11
54
15
71
60
16
31
66
16
91
72
17
51
78
18
11
84
18
71
90
Instance
Au
(p
pm
)
G907-2
Mean = 0.860 ppm
2SD = 0.942 ppm
-2SD = 0.778 ppm
3SD = 0.983 ppm
-3SD = 0.737 ppm
6 por. Méd. Móv. (G907-2)
Sample swap when separating the SGS batch for re-analysis. aCTUA sample is G901-13
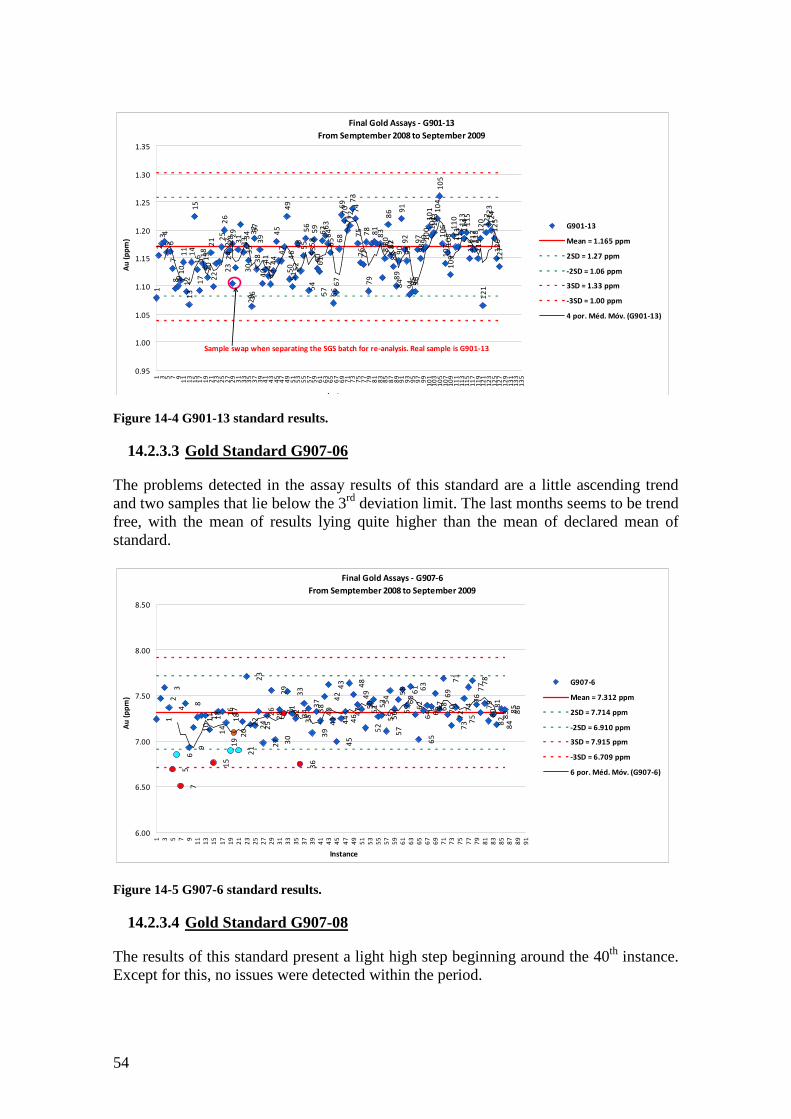
54
Figure 14-4 G901-13 standard results.
14.2.3.3 Gold Standard G907-06
The problems detected in the assay results of this standard are a little ascending trend and two samples that lie below the 3rd deviation limit. The last months seems to be trend free, with the mean of results lying quite higher than the mean of declared mean of standard.
Figure 14-5 G907-6 standard results.
14.2.3.4 Gold Standard G907-08
The results of this standard present a light high step beginning around the 40th instance. Except for this, no issues were detected within the period.
Final Gold Assays - G901-13
From Semptember 2008 to September 2009
12
3 45 6
78 9
10
11
12
13
14
15
16
17
18
19
20
21
22
25
26
27 28 2
93
13
3 34
35
36
37
38
39
40
41
42
43
44
45
47
49
50
51
52
55
56
58
59
60
61
62 6
36
46
56
66
76
86
97
07
1 72
73
74
75
76
77
78
79
81
83
85
86
87
88
89
90
91
92
93
94 95
96
97
98
99 10
01
01
10
21
03
10
41
05
10
61
07 1
08
10
91
10
11
11
12
11
31
14 11
51
16 1
17
11
81
19
12
01
21
12
2 12
31
24
12
51
26
12
7
23
24
29
30
32
46
48
53
54
57
80
82
84
0.95
1.00
1.05
1.10
1.15
1.20
1.25
1.30
1.351 3 5 7 9
11
13
15
17
19
21
23
25
27
29
31
33
35
37
39
41
43
45
47
49
51
53
55
57
59
61
63
65
67
69
71
73
75
77
79
81
83
85
87
89
91
93
95
97
99
10
11
03
10
51
07
10
91
11
11
31
15
11
71
19
12
11
23
12
51
27
12
91
31
13
31
35
Instance
Au
(p
pm
)
G901-13
Mean = 1.165 ppm
2SD = 1.27 ppm
-2SD = 1.06 ppm
3SD = 1.33 ppm
-3SD = 1.00 ppm
4 por. Méd. Móv. (G901-13)
Sample swap when separating the SGS batch for re-analysis. Real sample is G901-13
Final Gold Assays - G907-6
From Semptember 2008 to September 2009
12
34
56
78
91
01
1 12
13
14
15
16
17
21
22
23
24
25
26
27
28
29
30
31
32
33
34
35
36
37
38
39
40
41
42
43
44
45
46 4
74
84
95
05
15
25
3 54
55 56
57
58
59
60
61
62
63
64
65
66 6
76
86
97
07
17
27
37
47
57
67
7 78
79
80
81
82 8
38
48
58
6
18
19
20
6.00
6.50
7.00
7.50
8.00
8.50
1 3 5 7 9
11
13
15
17
19
21
23
25
27
29
31
33
35
37
39
41
43
45
47
49
51
53
55
57
59
61
63
65
67
69
71
73
75
77
79
81
83
85
87
89
91
Instance
Au
(p
pm
)
G907-6
Mean = 7.312 ppm
2SD = 7.714 ppm
-2SD = 6.910 ppm
3SD = 7.915 ppm
-3SD = 6.709 ppm
6 por. Méd. Móv. (G907-6)
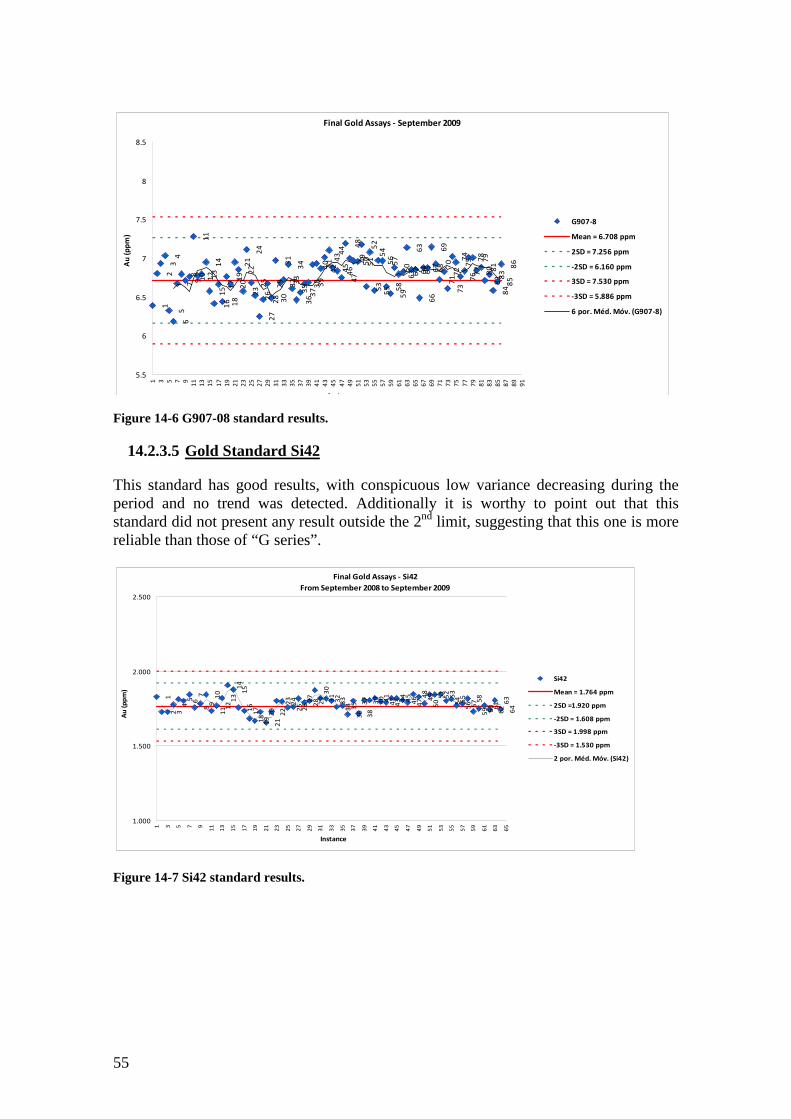
55
Figure 14-6 G907-08 standard results.
14.2.3.5 Gold Standard Si42
This standard has good results, with conspicuous low variance decreasing during the period and no trend was detected. Additionally it is worthy to point out that this standard did not present any result outside the 2nd limit, suggesting that this one is more reliable than those of “G series”.
Figure 14-7 Si42 standard results.
Final Gold Assays - September 2009
12
34
56
78
9 10
11
12 13
14
15
16
17
18
19
20
21
22
23
24
25
26
27
28
29
30
31
32 33
34
35
36 3
73
8 39
40 41
42
43 4
44
54
64
74
84
95
05
15
25
35
45
55
65
75
85
96
06
1 62
63
64
65
66
67
68
69
70
71
72
73
74
75
76 7
77
87
98
0 81
82 8
38
48
58
6
5.5
6
6.5
7
7.5
8
8.51 3 5 7 9
11
13
15
17
19
21
23
25
27
29
31
33
35
37
39
41
43
45
47
49
51
53
55
57
59
61
63
65
67
69
71
73
75
77
79
81
83
85
87
89
91
Instance
Au
(p
pm
)
G907-8
Mean = 6.708 ppm
2SD = 7.256 ppm
-2SD = 6.160 ppm
3SD = 7.530 ppm
-3SD = 5.886 ppm
6 por. Méd. Móv. (G907-8)
Final Gold Assays - Si42
From September 2008 to September 2009
12 3
45 6
78
91
01
1 12
13
14
15
16
17
18
19
20
21
22
23
24
25
26
27
28 29
30
31
32
33
34 35
36
37
38
39
40 41
42
43 4
44
54
64
74
84
95
05
15
25
35
4 55
56 57 5
85
9 60 61
62
63
64
1.000
1.500
2.000
2.500
1 3 5 7 9
11
13
15
17
19
21
23
25
27
29
31
33
35
37
39
41
43
45
47
49
51
53
55
57
59
61
63
65
Instance
Au
(p
pm
)
Si42
Mean = 1.764 ppm
2SD =1.920 ppm
-2SD = 1.608 ppm
3SD = 1.998 ppm
-3SD = 1.530 ppm
2 por. Méd. Móv. (Si42)
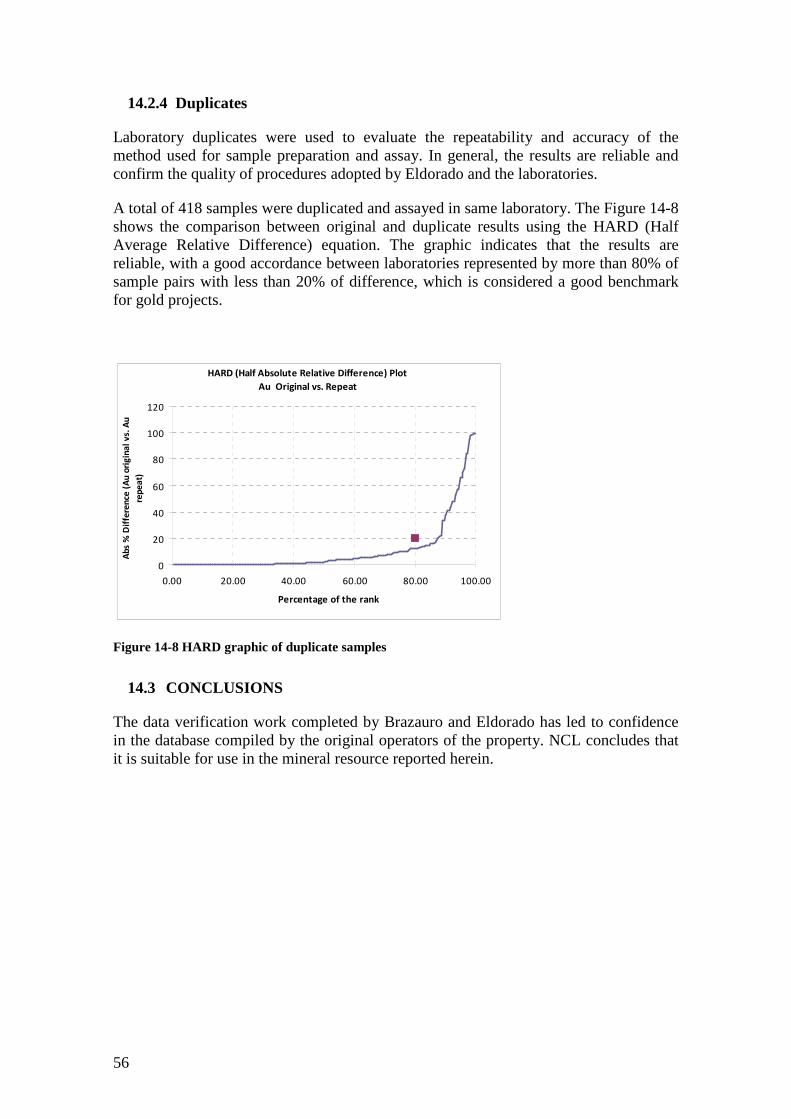
56
14.2.4 Duplicates
Laboratory duplicates were used to evaluate the repeatability and accuracy of the method used for sample preparation and assay. In general, the results are reliable and confirm the quality of procedures adopted by Eldorado and the laboratories.
A total of 418 samples were duplicated and assayed in same laboratory. The Figure 14-8 shows the comparison between original and duplicate results using the HARD (Half Average Relative Difference) equation. The graphic indicates that the results are reliable, with a good accordance between laboratories represented by more than 80% of sample pairs with less than 20% of difference, which is considered a good benchmark for gold projects.
Figure 14-8 HARD graphic of duplicate samples
14.3 CONCLUSIONS
The data verification work completed by Brazauro and Eldorado has led to confidence in the database compiled by the original operators of the property. NCL concludes that it is suitable for use in the mineral resource reported herein.
HARD (Half Absolute Relative Difference) Plot
Au Original vs. Repeat
0
20
40
60
80
100
120
0.00 20.00 40.00 60.00 80.00 100.00
Percentage of the rank
Ab
s %
Dif
fere
nce
(A
u o
rig
ina
l v
s. A
u
rep
ea
t)

57
15 ADJACENT PROPERTIES
No data from any adjacent property were used in determining the mineral resources or to assess the economic aspects for the Tocantinzinho deposit.
58
16 MINERAL PROCESSING AND METALLURGICAL TESTING
This section was produced by the consultant Walter de Moura, a senior metallurgist with 28 years experience in the design and operation of gold and silver ore processing plants. He reviewed the available metallurgical tests and produced a recommendation for the route to be followed for the gold recovery. He also produced the Capital (CAPEX) and Operational Costs (OPEX) estimates for the process plant with 4 mtpa capacity.
16.1 SUMMARY OF THE AVAILABLE INFORMATION
The following information was derived from detailed studies undertaken by third party experts. All test work was carried out using ore obtained from drill core.
• Flotation test, gravimetric concentration and cyanidation at Hazen Research • Flotation tests and cyanidation of the concentrates at Hazen Research • Additional flotation tests by Ralph Meyertons • Tests of gravimetric concentrate and cyanidation at Lakefield • Comminution tests by SGS Lakefield Research Limited • Oxide Soil and Tailing tests by Wardell Armstrong
The key aspects and results of these tests are presented in the following items:
16.2 TESTS AT HAZEN RESEARCH
In the study, “Characterization and Process Development of Tocantinzinho Gold Ore, Hazen Project 10470”, the distribution of gold particle size was analyzed and the following processes were investigated: gravitational concentration, flotation and cyanidation of the mineral using samples with 1.0 to 1.7 g/t of gold grade.
The study results are summarized as follows:
• At a size of 80 % minus 190 microns it is possible to recover around 35% of the gold contained as coarse gold through gravity with a concentrate grade of 9,7 g/t.
• At a size of 105 microns (or 150 mesh) the flotation recovery is around 93% of the gold with a concentrate grade of 64 g/t.
• The extraction of gold from concentrates by cyanidation ranges between 75-89% with cyanide consumption of 2.4 k/t.
• These preliminary results show that the process of flotation, integrated at mill stage, is more feasible than a gravitational circuit with centrifugal Knelson concentrators. Considering that the mine is too remote to transport concentrates, this study also recommends using cyanide on the concentrates to produce bullion.
• The test work flotation circuit contains a rougher stage and a cleaning stage, with no addition of lime to modify the pH and using standard reagents.
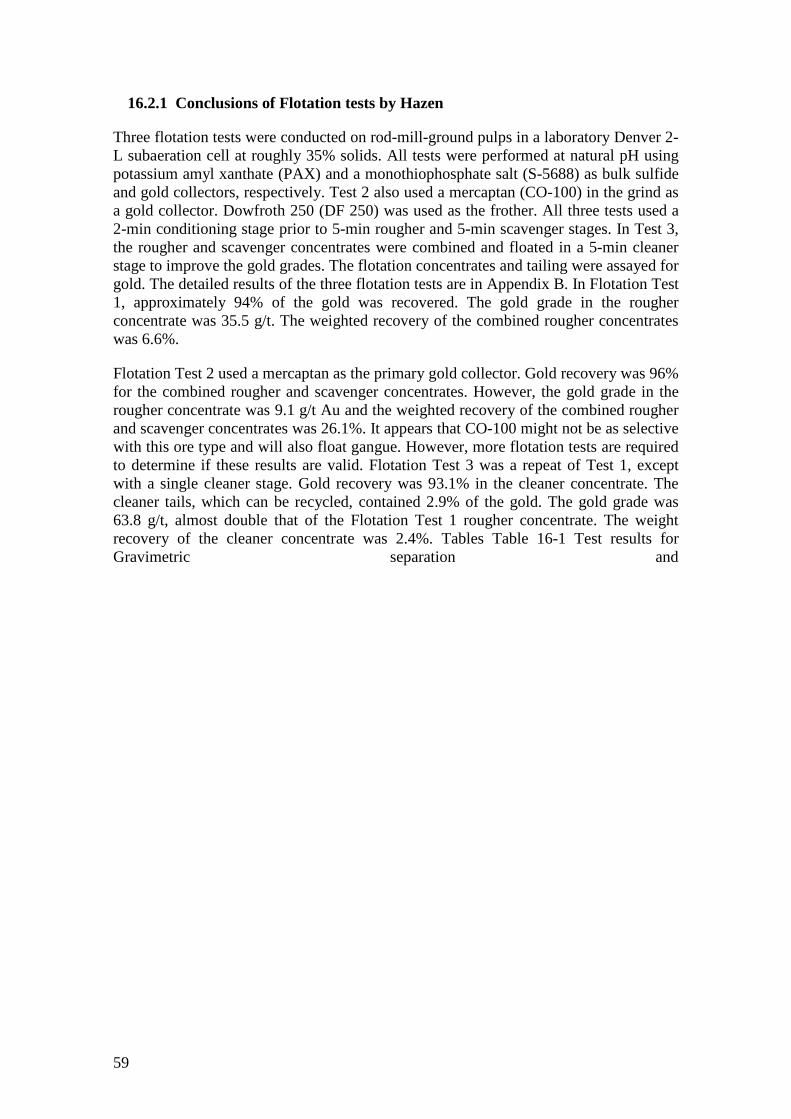
59
16.2.1 Conclusions of Flotation tests by Hazen
Three flotation tests were conducted on rod-mill-ground pulps in a laboratory Denver 2-L subaeration cell at roughly 35% solids. All tests were performed at natural pH using potassium amyl xanthate (PAX) and a monothiophosphate salt (S-5688) as bulk sulfide and gold collectors, respectively. Test 2 also used a mercaptan (CO-100) in the grind as a gold collector. Dowfroth 250 (DF 250) was used as the frother. All three tests used a 2-min conditioning stage prior to 5-min rougher and 5-min scavenger stages. In Test 3, the rougher and scavenger concentrates were combined and floated in a 5-min cleaner stage to improve the gold grades. The flotation concentrates and tailing were assayed for gold. The detailed results of the three flotation tests are in Appendix B. In Flotation Test 1, approximately 94% of the gold was recovered. The gold grade in the rougher concentrate was 35.5 g/t. The weighted recovery of the combined rougher concentrates was 6.6%.
Flotation Test 2 used a mercaptan as the primary gold collector. Gold recovery was 96% for the combined rougher and scavenger concentrates. However, the gold grade in the rougher concentrate was 9.1 g/t Au and the weighted recovery of the combined rougher and scavenger concentrates was 26.1%. It appears that CO-100 might not be as selective with this ore type and will also float gangue. However, more flotation tests are required to determine if these results are valid. Flotation Test 3 was a repeat of Test 1, except with a single cleaner stage. Gold recovery was 93.1% in the cleaner concentrate. The cleaner tails, which can be recycled, contained 2.9% of the gold. The gold grade was 63.8 g/t, almost double that of the Flotation Test 1 rougher concentrate. The weight recovery of the cleaner concentrate was 2.4%. Tables Table 16-1 Test results for Gravimetric separation and

60
Table 16-2 show the summary of the flotation and leaching results.
Table 16-1 Test results for Gravimetric separation
61
Table 16-2 Cyanidation Results
16.2.2 Hazen Study Conclusions
Based on the gold characterization and beneficiation experiments conducted at Hazen, grinding followed by flotation appears to be the process that yields the highest gold recovery. Due to the remote location of the mine, cyanide leaching of a high-grade flotation concentrate may be a good option, but this was not investigated by Hazen at that time.
Related to grinding requirements, a grind curve for an 8 by 9 inch laboratory soft-steel rod mill was established by grinding three 1-kg charges at 62% solids for 5, 10, and 20 min and screening at 35, 65, 150, and 400 mesh. The target grind of 150 mesh was based on prior work by SGS Lakefield (Lakefield, Ontario, Canada), which indicated that gold will be liberated at this size.
16.3 FLOTATION TESTS AND CYANIDATION OF CONCENTRATES AT HAZEN RESEARCH
The study “Bulk Flotation of Tocantinzinho Gold Ore and Cyanidation of Final Concentrates, Hazen Project 10583” is the continuation to the previous test work and it was targeted to generate a concentrate that could be treated by cyanidation.
The results are the following:
• In flotation, a gold recovery between 85-90% was reached, which is lower than the obtained recovery in the previous study (93%). According to this analysis the low recovery is due to the protocol of tests applied that consisted of loads of 10 kg of ore that were processed in a 12x15”mill with a grinding time of 60 minutes. This was needed to generate a larger amount of concentrate for further testing. Grinding curves were not made. This protocol is different from the normal process of preparing loads of 1-2 kg with grinding time of 20 minutes. Grinding too long in a mill batch with no classification produces a high proportion of ultra fines or mud that makes flotation difficult.
62
• In cyanidation, an extraction of 98% of gold was obtained using 5 k of cyanide per tonne of concentrate. Lime consumption is 1.1 k/t and the time of residence is 48 hrs. All these parameters show that it is a low operational cost process.
Considering the gold recovery by flotation obtained in the previous study (93%) and the extraction of gold in cyanidation, the global feasible recovery is in the order of 91%. On the other hand, the amount of cyanide is low expressed in terms of processed mineral, therefore with a lower potential of environmental risk if compared to the process of direct cyanidation of ore.
16.3.1 Test Conclusions
The majority of the final bulk concentrate was used for a 48 hr cyanidation bottle-roll test to evaluate its leachability. Detailed cyanidation results are in Appendix B. Gold extraction was 98%, which indicates no problems with leaching this concentrate. However, cyanide consumption was high at 5.10 kg/t because of the sulfides present in the concentrate. As only 1% of the original weight is being subjected to cyanidation, this relatively high cyanide consumption is insignificant. However further investigation should be made to decrease the cyanide consumption.
For the 10kg batches, a 60 min grind produced a particle size distribution closest to the target of a nominal 150 mesh. The addition of CO-100 gold collector in the grind followed by flotation with PAX and a monothiophosphate salt can produce gold recoveries greater than 90%. A three-stage cleaner step can maintain a recovery of 85–90% with a grade of about 140 g/t.
16.4 ADDITIONAL FLOTATION TESTS BY RALPH MEYERTONS
Corresponding to the report: “Investigation of Flotation Operating Conditions and Grind Size Upon Gold Recovery” described testing to optimize the recovery and grade of concentrates.
The results obtained are:
• The optimal grind size of flotation is 75% minus 200# or 75 microns (which is equal to a size of grinding P80 of 95 microns). This grinding is superior than the one used on previous tests which is 150# or 105 microns
• With a higher intensity of grinding the gold recovery was increased, reaching a 93.7% as global versus 93% of previous tests.
• The grade of the final concentrate also increased by the use of two or three stages of cleaning which resulted in a concentrate grade of 83 g/t of gold.
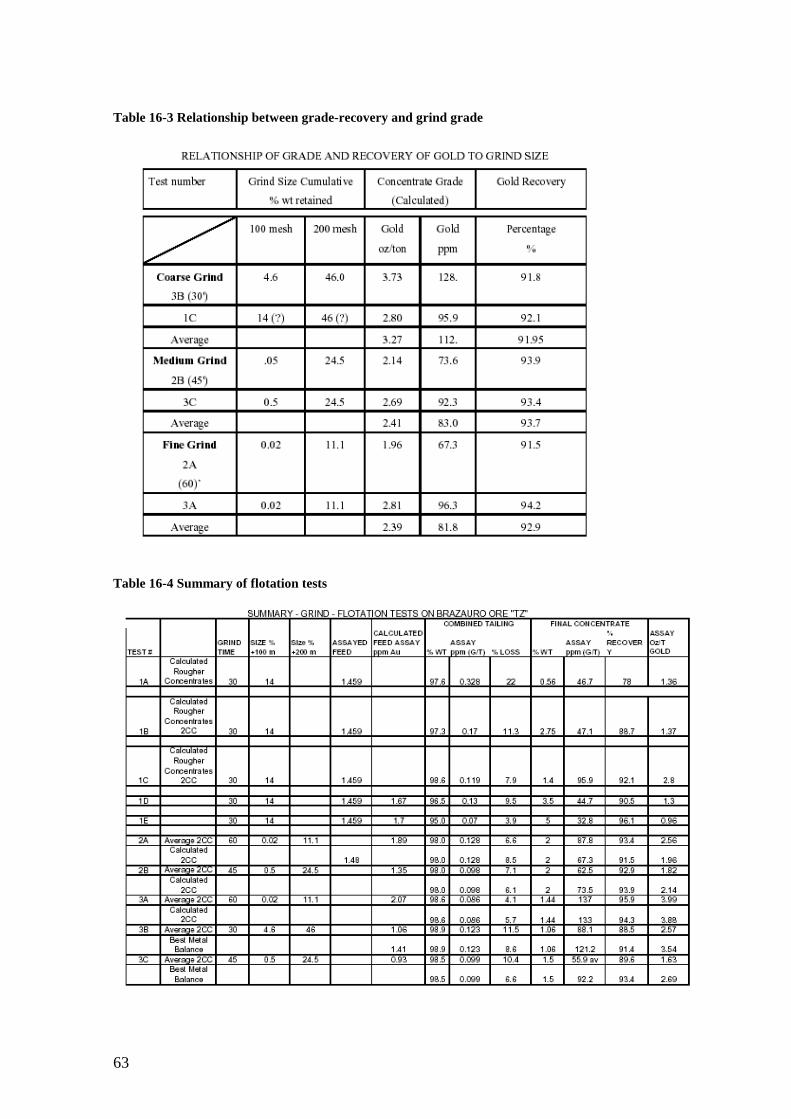
63
Table 16-3 Relationship between grade-recovery and grind grade
Table 16-4 Summary of flotation tests
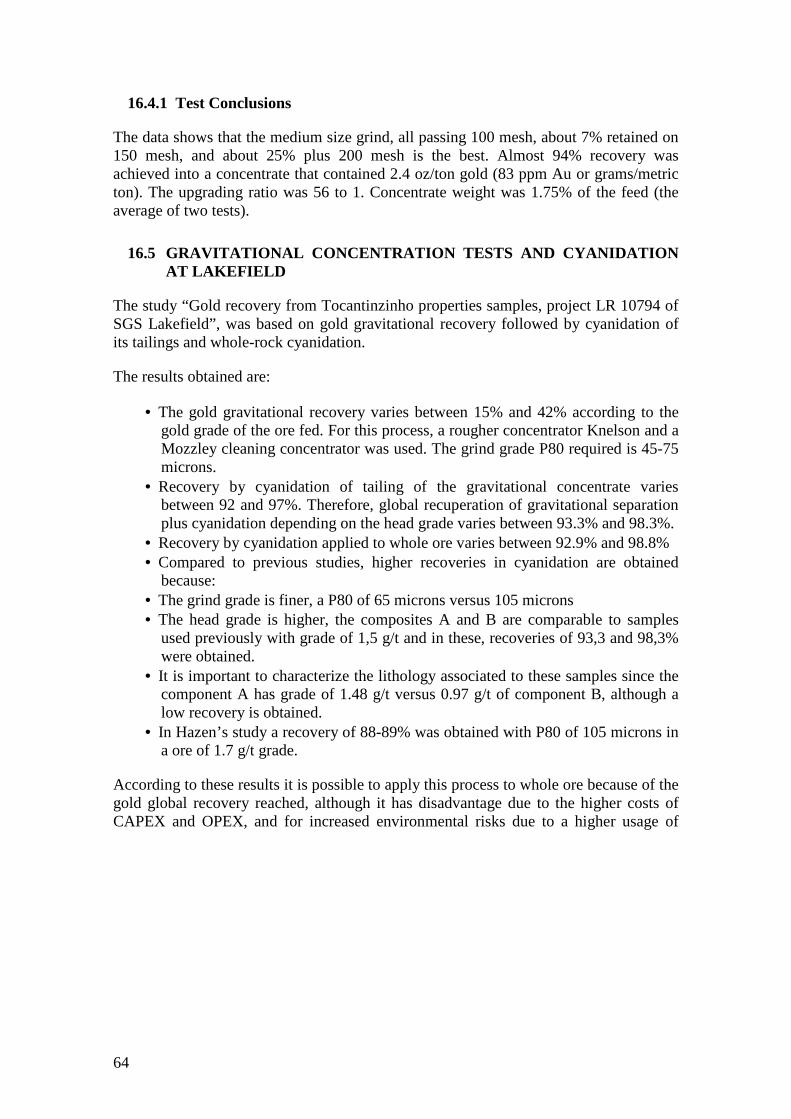
64
16.4.1 Test Conclusions
The data shows that the medium size grind, all passing 100 mesh, about 7% retained on 150 mesh, and about 25% plus 200 mesh is the best. Almost 94% recovery was achieved into a concentrate that contained 2.4 oz/ton gold (83 ppm Au or grams/metric ton). The upgrading ratio was 56 to 1. Concentrate weight was 1.75% of the feed (the average of two tests).
16.5 GRAVITATIONAL CONCENTRATION TESTS AND CYANIDATION AT LAKEFIELD
The study “Gold recovery from Tocantinzinho properties samples, project LR 10794 of SGS Lakefield”, was based on gold gravitational recovery followed by cyanidation of its tailings and whole-rock cyanidation.
The results obtained are:
• The gold gravitational recovery varies between 15% and 42% according to the gold grade of the ore fed. For this process, a rougher concentrator Knelson and a Mozzley cleaning concentrator was used. The grind grade P80 required is 45-75 microns.
• Recovery by cyanidation of tailing of the gravitational concentrate varies between 92 and 97%. Therefore, global recuperation of gravitational separation plus cyanidation depending on the head grade varies between 93.3% and 98.3%.
• Recovery by cyanidation applied to whole ore varies between 92.9% and 98.8% • Compared to previous studies, higher recoveries in cyanidation are obtained
because: • The grind grade is finer, a P80 of 65 microns versus 105 microns • The head grade is higher, the composites A and B are comparable to samples
used previously with grade of 1,5 g/t and in these, recoveries of 93,3 and 98,3% were obtained.
• It is important to characterize the lithology associated to these samples since the component A has grade of 1.48 g/t versus 0.97 g/t of component B, although a low recovery is obtained.
• In Hazen’s study a recovery of 88-89% was obtained with P80 of 105 microns in a ore of 1.7 g/t grade.
According to these results it is possible to apply this process to whole ore because of the gold global recovery reached, although it has disadvantage due to the higher costs of CAPEX and OPEX, and for increased environmental risks due to a higher usage of

65
Table 16-5 and Table 16-6 summarize the results obtained:
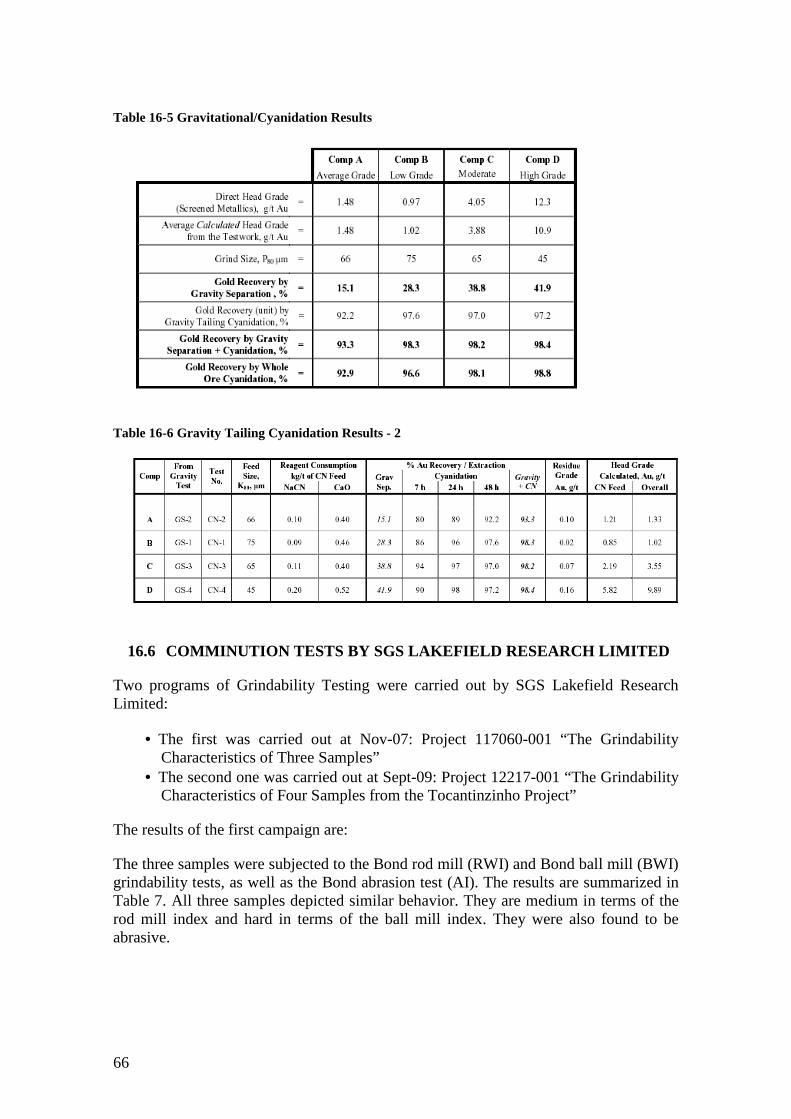
66
Table 16-5 Gravitational/Cyanidation Results
Table 16-6 Gravity Tailing Cyanidation Results - 2
16.6 COMMINUTION TESTS BY SGS LAKEFIELD RESEARCH LIMITED
Two programs of Grindability Testing were carried out by SGS Lakefield Research Limited:
• The first was carried out at Nov-07: Project 117060-001 “The Grindability Characteristics of Three Samples”
• The second one was carried out at Sept-09: Project 12217-001 “The Grindability Characteristics of Four Samples from the Tocantinzinho Project”
The results of the first campaign are:
The three samples were subjected to the Bond rod mill (RWI) and Bond ball mill (BWI) grindability tests, as well as the Bond abrasion test (AI). The results are summarized in Table 7. All three samples depicted similar behavior. They are medium in terms of the rod mill index and hard in terms of the ball mill index. They were also found to be abrasive.
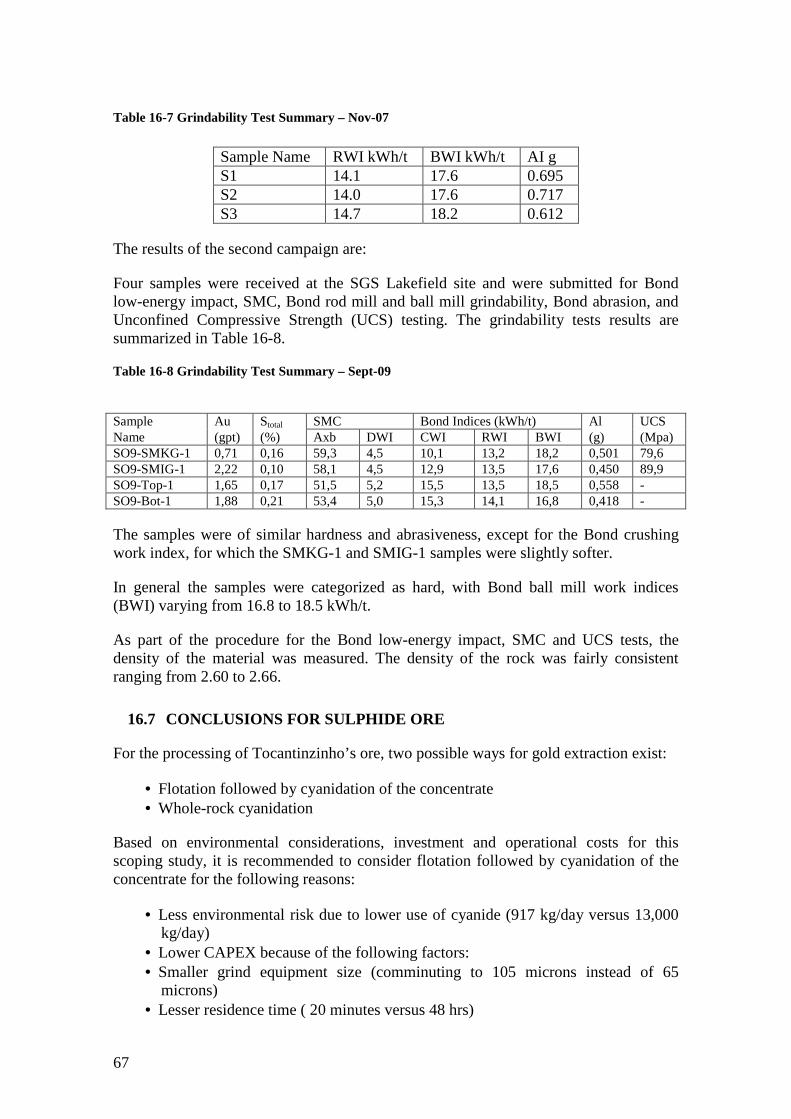
67
Table 16-7 Grindability Test Summary – Nov-07
Sample Name RWI kWh/t BWI kWh/t AI g S1 14.1 17.6 0.695 S2 14.0 17.6 0.717 S3 14.7 18.2 0.612
The results of the second campaign are:
Four samples were received at the SGS Lakefield site and were submitted for Bond low-energy impact, SMC, Bond rod mill and ball mill grindability, Bond abrasion, and Unconfined Compressive Strength (UCS) testing. The grindability tests results are summarized in Table 16-8.
Table 16-8 Grindability Test Summary – Sept-09
Sample Au Stotal SMC Bond Indices (kWh/t) Al UCS Name (gpt) (%) Axb DWI CWI RWI BWI (g) (Mpa) SO9-SMKG-1 0,71 0,16 59,3 4,5 10,1 13,2 18,2 0,501 79,6 SO9-SMIG-1 2,22 0,10 58,1 4,5 12,9 13,5 17,6 0,450 89,9 SO9-Top-1 1,65 0,17 51,5 5,2 15,5 13,5 18,5 0,558 - SO9-Bot-1 1,88 0,21 53,4 5,0 15,3 14,1 16,8 0,418 -
The samples were of similar hardness and abrasiveness, except for the Bond crushing work index, for which the SMKG-1 and SMIG-1 samples were slightly softer.
In general the samples were categorized as hard, with Bond ball mill work indices (BWI) varying from 16.8 to 18.5 kWh/t.
As part of the procedure for the Bond low-energy impact, SMC and UCS tests, the density of the material was measured. The density of the rock was fairly consistent ranging from 2.60 to 2.66.
16.7 CONCLUSIONS FOR SULPHIDE ORE
For the processing of Tocantinzinho’s ore, two possible ways for gold extraction exist:
• Flotation followed by cyanidation of the concentrate • Whole-rock cyanidation
Based on environmental considerations, investment and operational costs for this scoping study, it is recommended to consider flotation followed by cyanidation of the concentrate for the following reasons:
• Less environmental risk due to lower use of cyanide (917 kg/day versus 13,000 kg/day)
• Lower CAPEX because of the following factors: • Smaller grind equipment size (comminuting to 105 microns instead of 65
microns) • Lesser residence time ( 20 minutes versus 48 hrs)
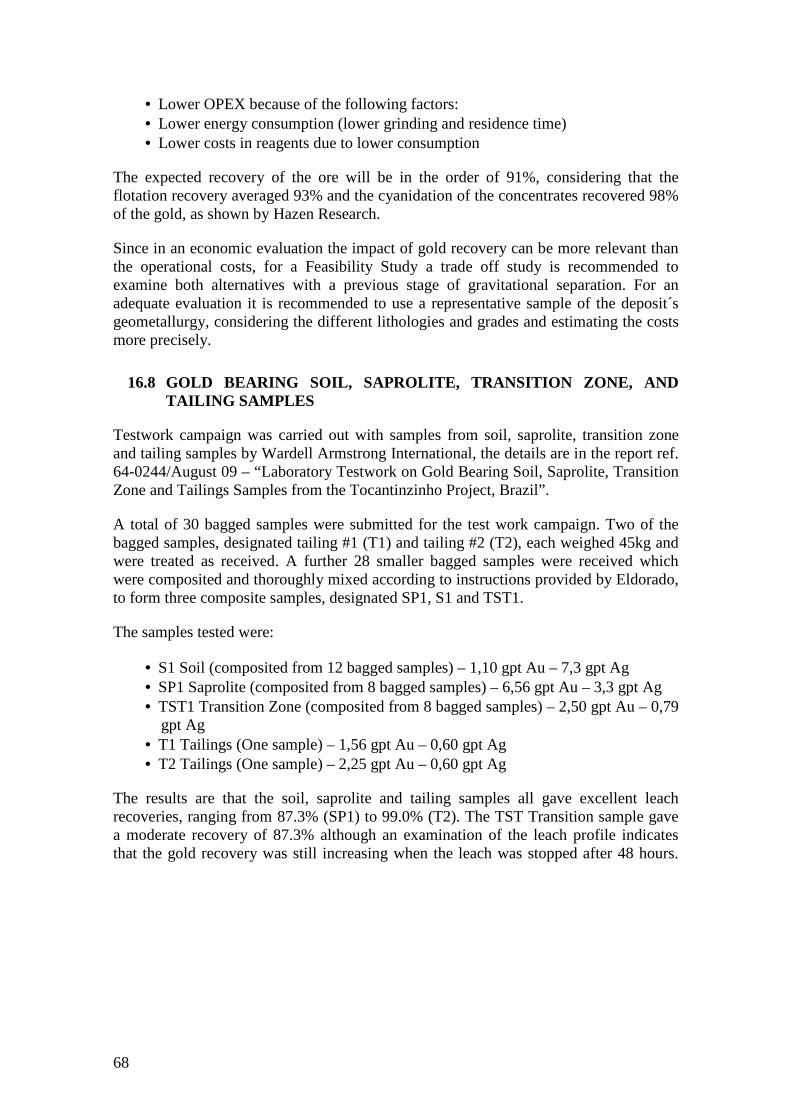
68
• Lower OPEX because of the following factors: • Lower energy consumption (lower grinding and residence time) • Lower costs in reagents due to lower consumption
The expected recovery of the ore will be in the order of 91%, considering that the flotation recovery averaged 93% and the cyanidation of the concentrates recovered 98% of the gold, as shown by Hazen Research.
Since in an economic evaluation the impact of gold recovery can be more relevant than the operational costs, for a Feasibility Study a trade off study is recommended to examine both alternatives with a previous stage of gravitational separation. For an adequate evaluation it is recommended to use a representative sample of the deposit´s geometallurgy, considering the different lithologies and grades and estimating the costs more precisely.
16.8 GOLD BEARING SOIL, SAPROLITE, TRANSITION ZONE, AND TAILING SAMPLES
Testwork campaign was carried out with samples from soil, saprolite, transition zone and tailing samples by Wardell Armstrong International, the details are in the report ref. 64-0244/August 09 – “Laboratory Testwork on Gold Bearing Soil, Saprolite, Transition Zone and Tailings Samples from the Tocantinzinho Project, Brazil”.
A total of 30 bagged samples were submitted for the test work campaign. Two of the bagged samples, designated tailing #1 (T1) and tailing #2 (T2), each weighed 45kg and were treated as received. A further 28 smaller bagged samples were received which were composited and thoroughly mixed according to instructions provided by Eldorado, to form three composite samples, designated SP1, S1 and TST1.
The samples tested were:
• S1 Soil (composited from 12 bagged samples) – 1,10 gpt Au – 7,3 gpt Ag • SP1 Saprolite (composited from 8 bagged samples) – 6,56 gpt Au – 3,3 gpt Ag • TST1 Transition Zone (composited from 8 bagged samples) – 2,50 gpt Au – 0,79
gpt Ag • T1 Tailings (One sample) – 1,56 gpt Au – 0,60 gpt Ag • T2 Tailings (One sample) – 2,25 gpt Au – 0,60 gpt Ag
The results are that the soil, saprolite and tailing samples all gave excellent leach recoveries, ranging from 87.3% (SP1) to 99.0% (T2). The TST Transition sample gave a moderate recovery of 87.3% although an examination of the leach profile indicates that the gold recovery was still increasing when the leach was stopped after 48 hours.

69
Table 16-9 shows the results.
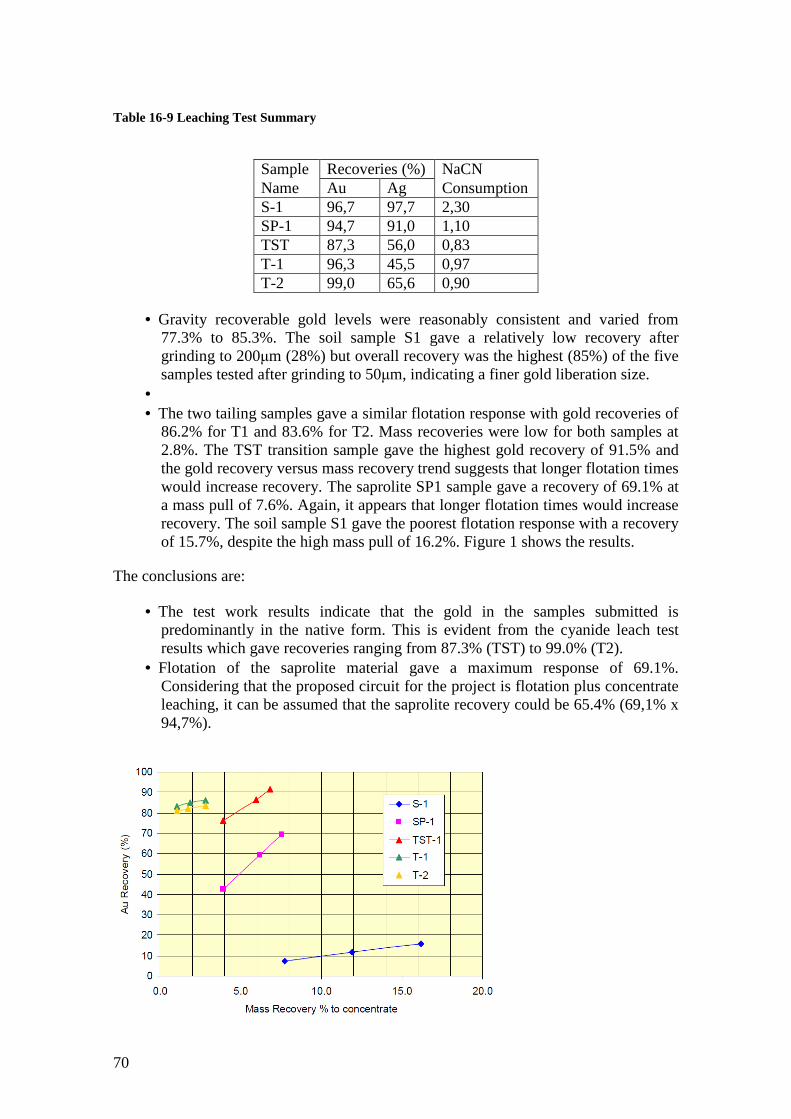
70
Table 16-9 Leaching Test Summary
Sample Recoveries (%) NaCN Name Au Ag Consumption S-1 96,7 97,7 2,30 SP-1 94,7 91,0 1,10 TST 87,3 56,0 0,83 T-1 96,3 45,5 0,97 T-2 99,0 65,6 0,90
• Gravity recoverable gold levels were reasonably consistent and varied from 77.3% to 85.3%. The soil sample S1 gave a relatively low recovery after grinding to 200µm (28%) but overall recovery was the highest (85%) of the five samples tested after grinding to 50µm, indicating a finer gold liberation size.
• • The two tailing samples gave a similar flotation response with gold recoveries of
86.2% for T1 and 83.6% for T2. Mass recoveries were low for both samples at 2.8%. The TST transition sample gave the highest gold recovery of 91.5% and the gold recovery versus mass recovery trend suggests that longer flotation times would increase recovery. The saprolite SP1 sample gave a recovery of 69.1% at a mass pull of 7.6%. Again, it appears that longer flotation times would increase recovery. The soil sample S1 gave the poorest flotation response with a recovery of 15.7%, despite the high mass pull of 16.2%. Figure 1 shows the results.
The conclusions are:
• The test work results indicate that the gold in the samples submitted is predominantly in the native form. This is evident from the cyanide leach test results which gave recoveries ranging from 87.3% (TST) to 99.0% (T2).
• Flotation of the saprolite material gave a maximum response of 69.1%. Considering that the proposed circuit for the project is flotation plus concentrate leaching, it can be assumed that the saprolite recovery could be 65.4% (69,1% x 94,7%).

71
Figure 16-1 Flotation Tests Summary
16.9 WORK STARTED BUT ON HOLD CURRENTLY
About 3,900 kg sulfide ore samples were collected and delivered to Wardell Armstrong International in July 2009. Seven composites will be made for a number of metallurgical testing, including detailed feed assays, flotation (batch, locked-cycle, continuous), concentrate regrinding, cyanide leach of concentrate, multi-stage gravity concentration, slurry thickening, slurry viscosity, cyanide detoxification, specific gravity, ABA (acid-base accounting), SPLP (synthetic precipitation leaching procedure), TCLP (toxicity characteristic leaching procedure). Five months are required to complete all of the planned test work.
72
17 MINERAL RESOURCE AND MINERAL RESERVE ESTIMATE
This report refers to the updated estimates of mineral resources of the Tocantinzinho gold deposit, finished in November 2009. It also includes data used in the unpublished resources update report, finished in March 2009. Besides the additional drilling, an important improvement comparing to the 2007 PEA is the topographic survey of the deposit, allowing the definition of measured resources.
The Qualified Person who prepared this report and the mineral resource estimate was Rodrigo Mello, Senior Geologist and Project Manager within NCL Brasil. Mr. Mello has 24 years of experience in the mining industry. He has experience in this style of mineralization, having worked with gold deposits in Proterozoic hydrothermally altered zones in Minas Gerais (Nova Lima Group, several deposits), Goiás (Crixás mine), Amapá (Amapari mine), all in Brazil, and Mali (Yatela and Sadiola mines).
NCL used for the present work a strategy consisting of 3D modeling and geostatistics. Two mineralized material types were considered in this evaluation: oxide and fresh rock.
Mineral resources were estimated and classified according to the Australian JORC Code and are reported here in terms equivalent to those of the Canadian Institute of Mining, Metallurgy and Petroleum (CIM) as required by Canadian National Instrument 43-101 (NI 43-101).
No mineral reserves were calculated for this project, since the economic viability has not been demonstrated by a pre-feasibility of a higher level study.
17.1 SOFTWARE USED
The modeling and geostatistics analysis of the deposit was carried out using two different software packages: Gemcom (modeling, kriging and block model construction, modeling and exploratory data analysis, model validation) and GSLIB (variography and exploratory data analysis).
For the selection of portions from block model that has reasonable prospects of being economical, the pit optimizer software Whittle was used.
17.2 DATABASE
Data was supplied by Brazauro in Excel format, consisted of drilling in formation with assays, survey, geology and topography. The database was composed of diamond drillholes and auger holes. The drillholes database was validated using the standard tools from GEMCOM and Excel. No problems were detected in the database.
Quality control information for the diamond drilling campaign was available and no problem of contamination or insufficient accuracy or precision was detected in the analysis of this information.
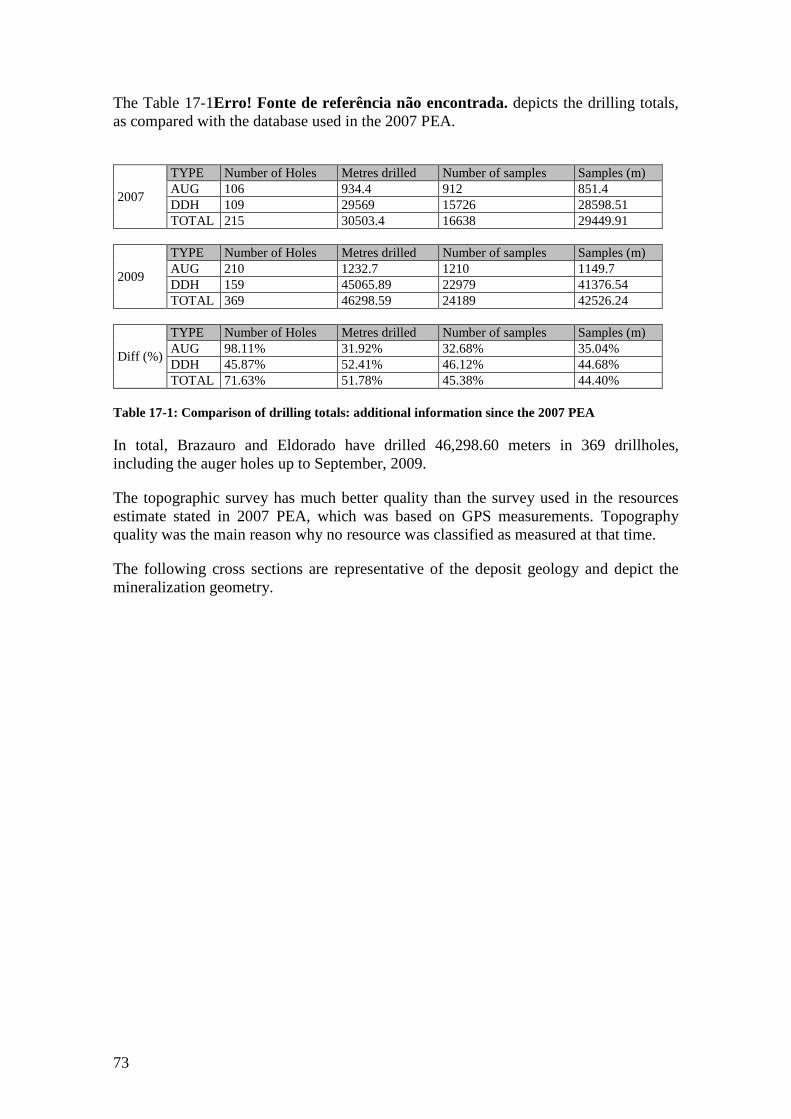
73
The Table 17-1Erro! Fonte de referência não encontrada. depicts the drilling totals, as compared with the database used in the 2007 PEA.
2007
TYPE Number of Holes Metres drilled Number of samples Samples (m) AUG 106 934.4 912 851.4 DDH 109 29569 15726 28598.51 TOTAL 215 30503.4 16638 29449.91
2009
TYPE Number of Holes Metres drilled Number of samples Samples (m) AUG 210 1232.7 1210 1149.7 DDH 159 45065.89 22979 41376.54 TOTAL 369 46298.59 24189 42526.24
Diff (%)
TYPE Number of Holes Metres drilled Number of samples Samples (m) AUG 98.11% 31.92% 32.68% 35.04% DDH 45.87% 52.41% 46.12% 44.68% TOTAL 71.63% 51.78% 45.38% 44.40%
Table 17-1: Comparison of drilling totals: additional information since the 2007 PEA
In total, Brazauro and Eldorado have drilled 46,298.60 meters in 369 drillholes, including the auger holes up to September, 2009.
The topographic survey has much better quality than the survey used in the resources estimate stated in 2007 PEA, which was based on GPS measurements. Topography quality was the main reason why no resource was classified as measured at that time.
The following cross sections are representative of the deposit geology and depict the mineralization geometry.
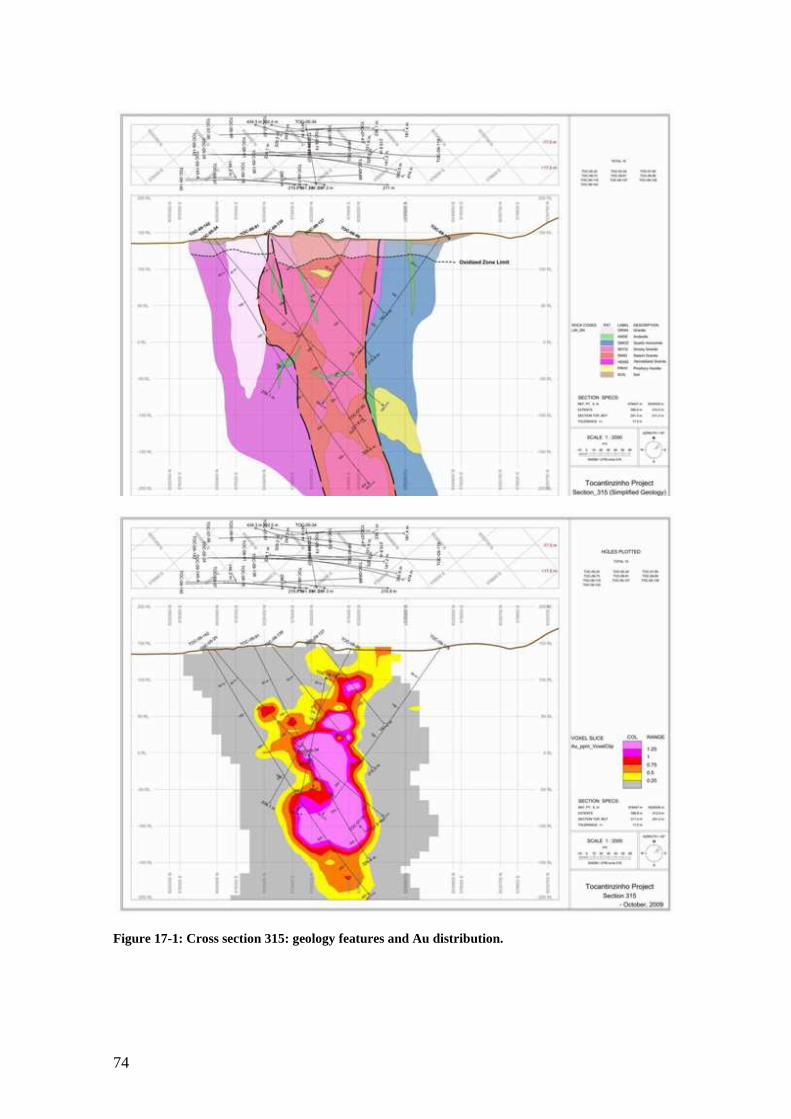
74
Figure 17-1: Cross section 315: geology features and Au distribution.
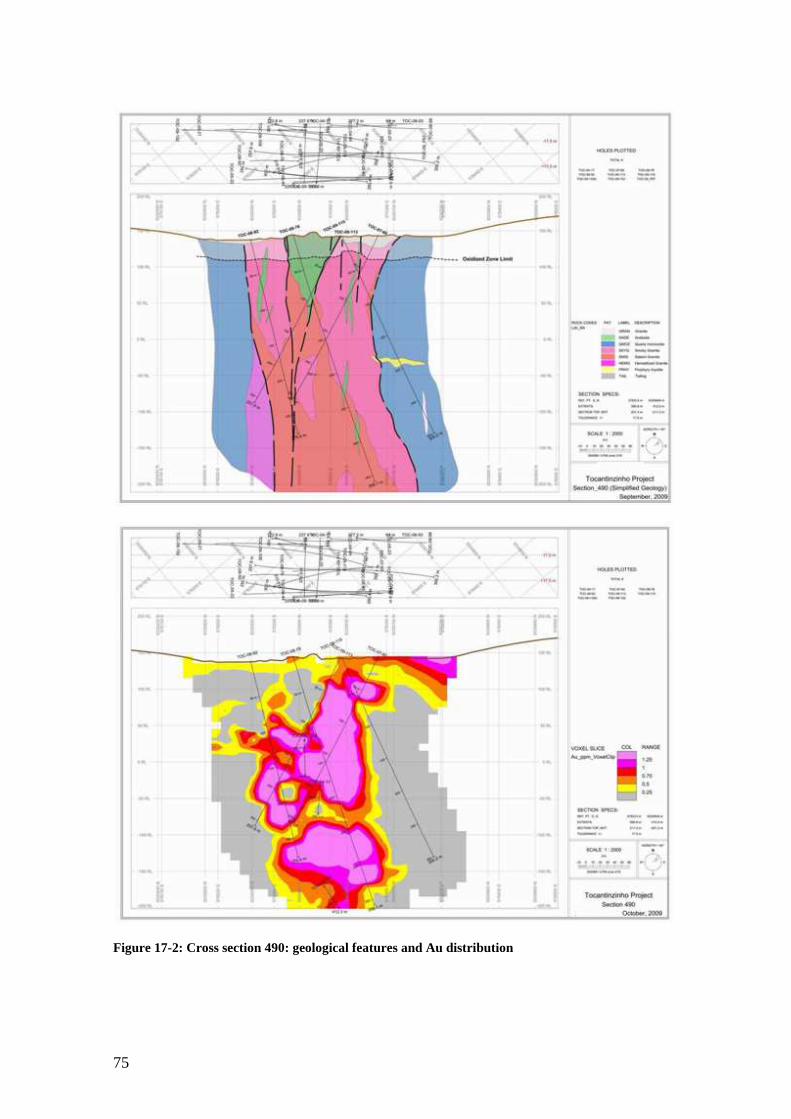
75
Figure 17-2: Cross section 490: geological features and Au distribution
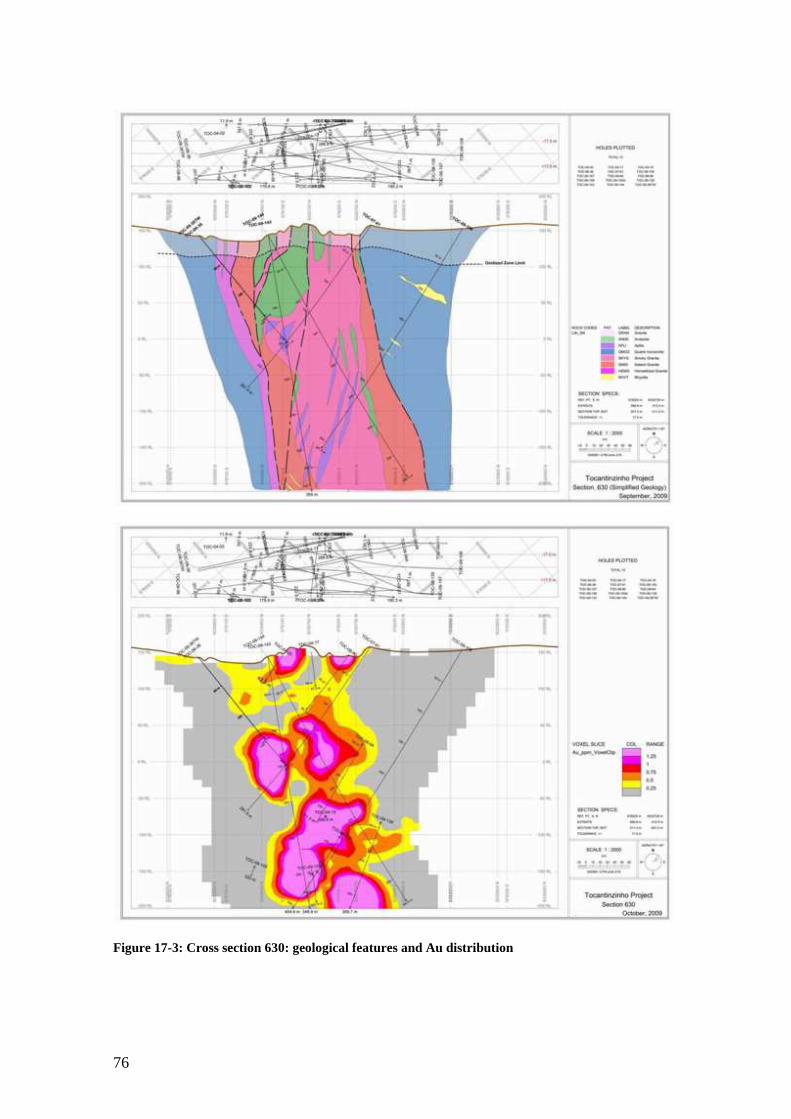
76
Figure 17-3: Cross section 630: geological features and Au distribution
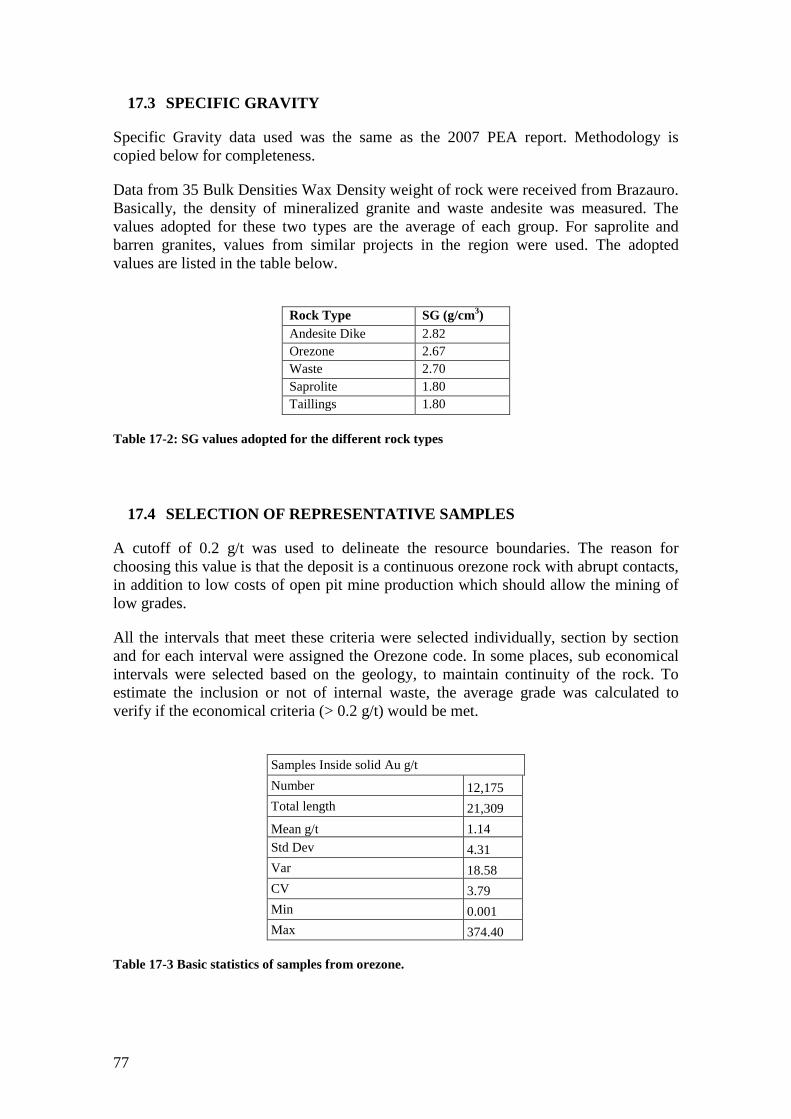
77
17.3 SPECIFIC GRAVITY
Specific Gravity data used was the same as the 2007 PEA report. Methodology is copied below for completeness.
Data from 35 Bulk Densities Wax Density weight of rock were received from Brazauro. Basically, the density of mineralized granite and waste andesite was measured. The values adopted for these two types are the average of each group. For saprolite and barren granites, values from similar projects in the region were used. The adopted values are listed in the table below.
Rock Type SG (g/cm3) Andesite Dike 2.82 Orezone 2.67 Waste 2.70 Saprolite 1.80 Taillings 1.80
Table 17-2: SG values adopted for the different rock types
17.4 SELECTION OF REPRESENTATIVE SAMPLES
A cutoff of 0.2 g/t was used to delineate the resource boundaries. The reason for choosing this value is that the deposit is a continuous orezone rock with abrupt contacts, in addition to low costs of open pit mine production which should allow the mining of low grades.
All the intervals that meet these criteria were selected individually, section by section and for each interval were assigned the Orezone code. In some places, sub economical intervals were selected based on the geology, to maintain continuity of the rock. To estimate the inclusion or not of internal waste, the average grade was calculated to verify if the economical criteria (> 0.2 g/t) would be met.
Samples Inside solid Au g/t
Number 12,175 Total length 21,309
Mean g/t 1.14 Std Dev 4.31 Var 18.58 CV 3.79 Min 0.001 Max 374.40
Table 17-3 Basic statistics of samples from orezone.
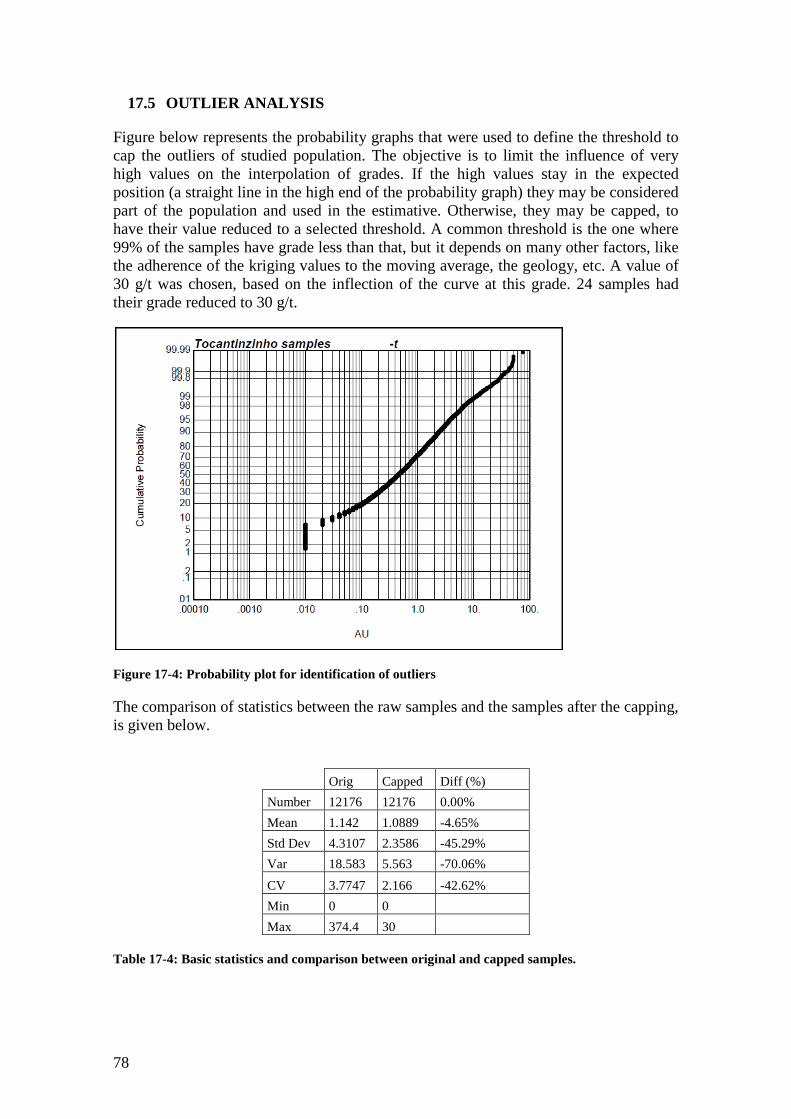
78
17.5 OUTLIER ANALYSIS
Figure below represents the probability graphs that were used to define the threshold to cap the outliers of studied population. The objective is to limit the influence of very high values on the interpolation of grades. If the high values stay in the expected position (a straight line in the high end of the probability graph) they may be considered part of the population and used in the estimative. Otherwise, they may be capped, to have their value reduced to a selected threshold. A common threshold is the one where 99% of the samples have grade less than that, but it depends on many other factors, like the adherence of the kriging values to the moving average, the geology, etc. A value of 30 g/t was chosen, based on the inflection of the curve at this grade. 24 samples had their grade reduced to 30 g/t.
Figure 17-4: Probability plot for identification of outliers
The comparison of statistics between the raw samples and the samples after the capping, is given below.
Orig Capped Diff (%)
Number 12176 12176 0.00%
Mean 1.142 1.0889 -4.65%
Std Dev 4.3107 2.3586 -45.29%
Var 18.583 5.563 -70.06%
CV 3.7747 2.166 -42.62%
Min 0 0
Max 374.4 30
Table 17-4: Basic statistics and comparison between original and capped samples.
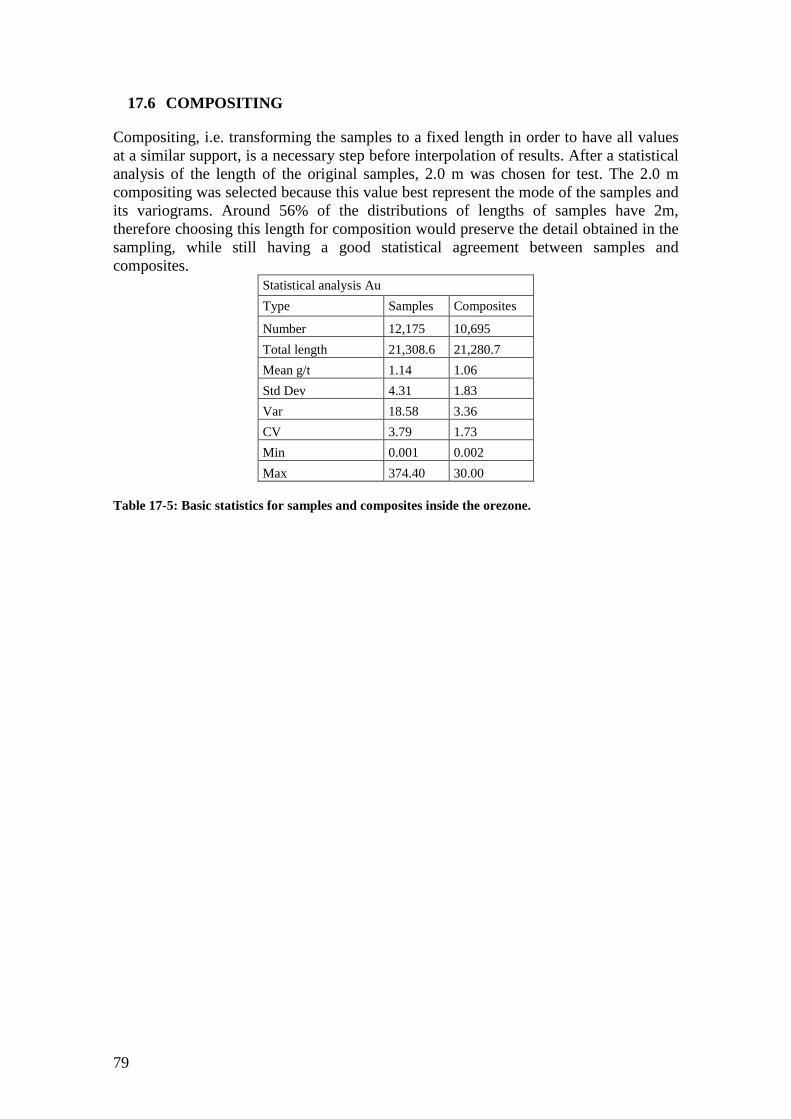
79
17.6 COMPOSITING
Compositing, i.e. transforming the samples to a fixed length in order to have all values at a similar support, is a necessary step before interpolation of results. After a statistical analysis of the length of the original samples, 2.0 m was chosen for test. The 2.0 m compositing was selected because this value best represent the mode of the samples and its variograms. Around 56% of the distributions of lengths of samples have 2m, therefore choosing this length for composition would preserve the detail obtained in the sampling, while still having a good statistical agreement between samples and composites.
Statistical analysis Au
Type Samples Composites
Number 12,175 10,695
Total length 21,308.6 21,280.7
Mean g/t 1.14 1.06
Std Dev 4.31 1.83
Var 18.58 3.36
CV 3.79 1.73
Min 0.001 0.002
Max 374.40 30.00
Table 17-5: Basic statistics for samples and composites inside the orezone.
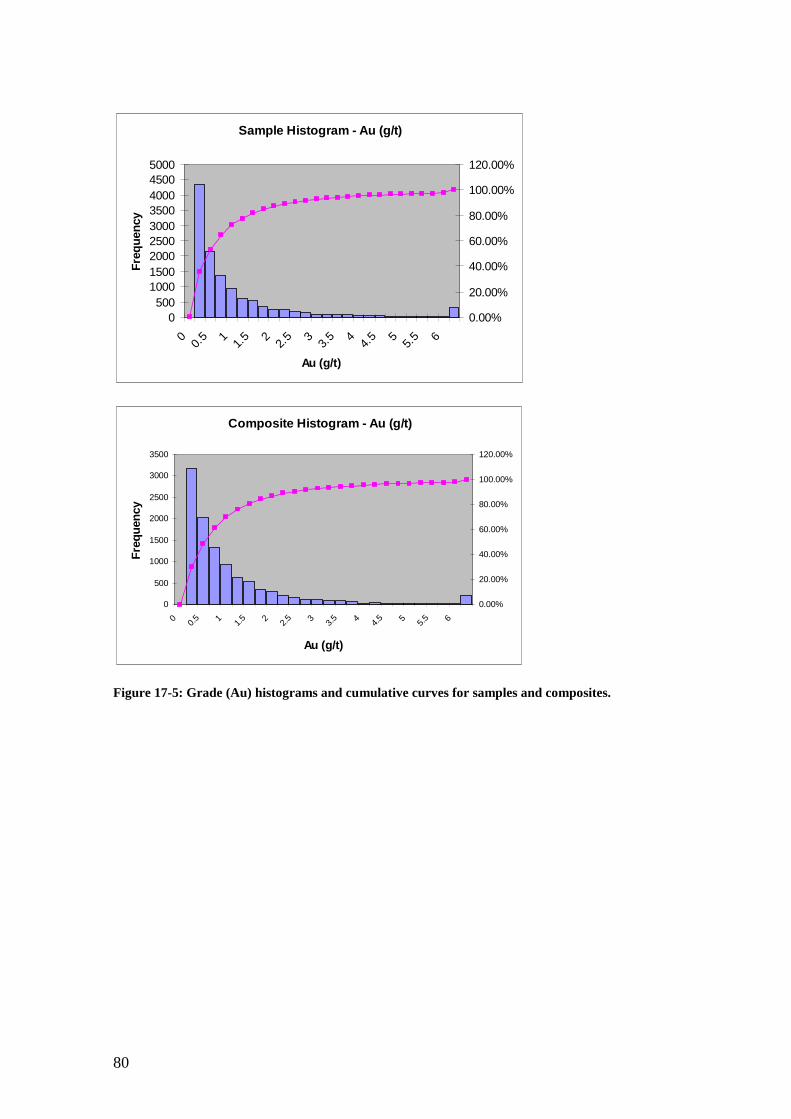
80
Figure 17-5: Grade (Au) histograms and cumulative curves for samples and composites.
Sample Histogram - Au (g/t)
0500
100015002000250030003500400045005000
00.
5 11.
5 22.
5 33.
5 44.
5 55.
5 6
Au (g/t)
Freq
uenc
y
0.00%
20.00%
40.00%
60.00%
80.00%
100.00%
120.00%
Composite Histogram - Au (g/t)
0
500
1000
1500
2000
2500
3000
3500
0 0.5 1 1.5 2 2.5 3 3.5 4 4.5 5 5.5 6
Au (g/t)
Fre
qu
ency
0.00%
20.00%
40.00%
60.00%
80.00%
100.00%
120.00%
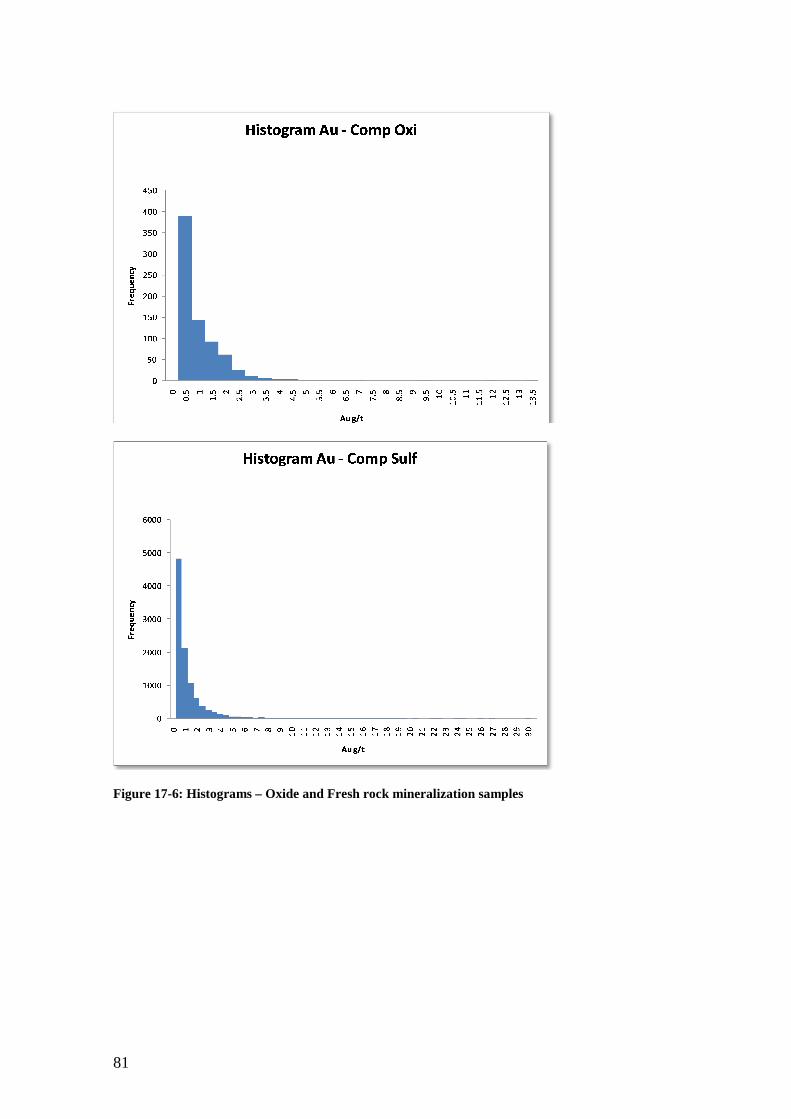
81
Figure 17-6: Histograms – Oxide and Fresh rock mineralization samples
Oxide and Fresh rock mineralization samples

82
17.7 3D MODELS
NCL interpreted the results of the infill campaign, adjusting the interpretation used in the last resource evaluation. These sections were digitized in GEMCOM to develop a geologic and resource model for the Tocantinzinho gold project. The geological outlines were drawn in 30 vertical cross sections at 25m intervals oriented approximately at N38°E, perpendicular to the main strike of the deposit. The saprolite limit and the tailings surface were defined using the drillholes information.
Four different solids and surfaces were used in the construction of the block model:
• Orebodies: the zones representing the material with reasonable prospects of being economically mined
• Intrusives: andesites that cut the mineralization, considered as waste. These solids have precedence over the orebodies
• Surface separating the oxide (weathered) and fresh rock zones • Topographic surface based on survey data.
The orebodies modeling criteria were as follows:
• All contact lines were snapped to the drillholes; • The contacts were usually interpreted as vertical. Down dip extension was
limited to a maximum of 50 m; • Linking between two sections was limited to a maximum of 50 meters.
Extension along the strike was limited to 25 m; • The geological map was used to define the orebody near to surface.
The same rules are used for the intrusive rocks interpretation.
17.8 BLOCK MODEL PARAMETERS
For the construction of the block model, the codes listed in table below were used.
ROCK TYPES MEANING 100 INTRUSIVES FRESH 110 INTRUSIVE OXIDE 200 ORE FRESH 210 ORE OXIDE 300 WASTE FRESH 310 WASTE OXIDE
Table 17-6: Zone Codes used in the Block model
The block size used was 10 x 10 x 5 m, the same used for the previous estimation, as shown in Table 17-7.
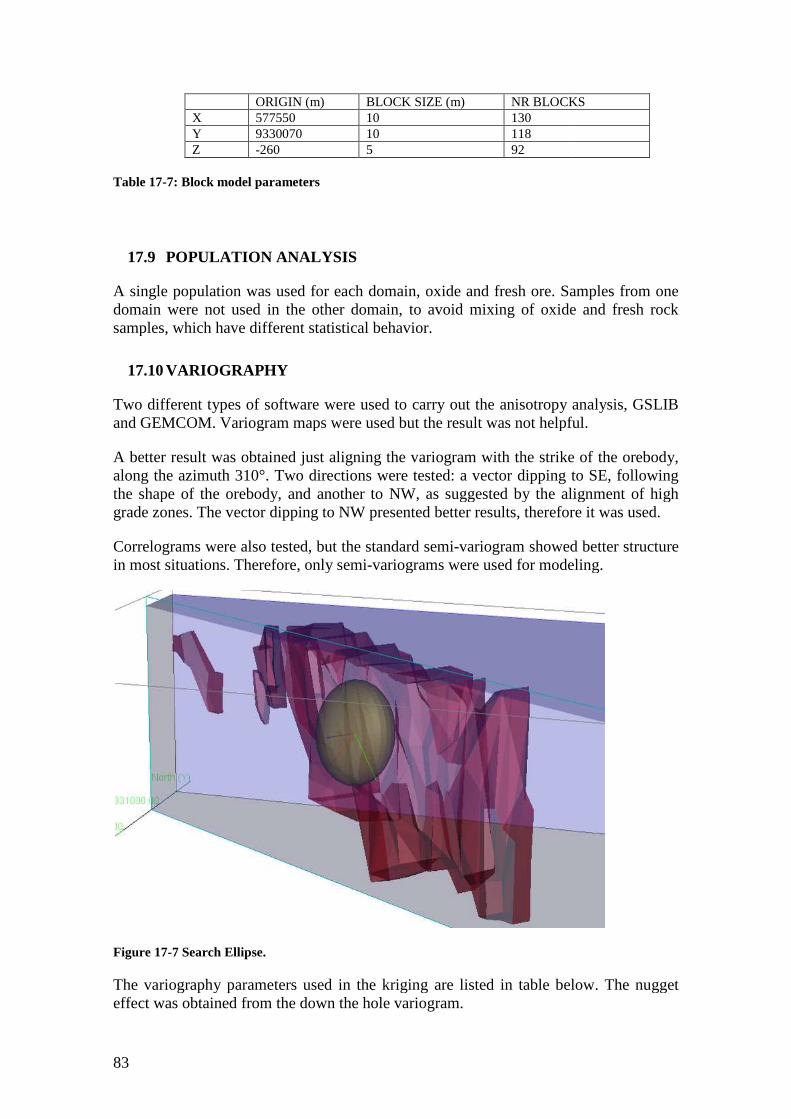
83
ORIGIN (m)X 577550Y 9330070Z -260
Table 17-7: Block model parameters
17.9 POPULATION ANALYSIS
A single population was used for each domain,domain were not used in the other domain, to avoid mixing of oxide and fresh rock samples, which have different statistical behavior.
17.10 VARIOGRAPHY
Two different types of software were used to carry out the anisotropy and GEMCOM. Variogram maps were used but the result was not helpful.
A better result was obtained just aligning the variogram with the strike of the orebody, along the azimuth 310°. Two directions were tested: a vector dipping to SE, follothe shape of the orebody, and another to NW, as suggested by the alignment of high grade zones. The vector dipping to NW presented better results, therefore it was used.
Correlograms were also tested, but the standard semiin most situations. Therefore, only semi
Figure 17-7 Search Ellipse.
The variography parameters used in the kriging are listed in table below. The nugget effect was obtained from the down the hole variogram.
ORIGIN (m) BLOCK SIZE (m) NR BLOCKS577550 10 130 9330070 10 118
5 92
Block model parameters
POPULATION ANALYSIS
A single population was used for each domain, oxide and fresh ore. Samples from one domain were not used in the other domain, to avoid mixing of oxide and fresh rock samples, which have different statistical behavior.
VARIOGRAPHY
Two different types of software were used to carry out the anisotropy analysis, GSLIB and GEMCOM. Variogram maps were used but the result was not helpful.
A better result was obtained just aligning the variogram with the strike of the orebody, along the azimuth 310°. Two directions were tested: a vector dipping to SE, follothe shape of the orebody, and another to NW, as suggested by the alignment of high grade zones. The vector dipping to NW presented better results, therefore it was used.
Correlograms were also tested, but the standard semi-variogram showed better strin most situations. Therefore, only semi-variograms were used for modeling.
The variography parameters used in the kriging are listed in table below. The nugget as obtained from the down the hole variogram.
NR BLOCKS
oxide and fresh ore. Samples from one domain were not used in the other domain, to avoid mixing of oxide and fresh rock
analysis, GSLIB and GEMCOM. Variogram maps were used but the result was not helpful.
A better result was obtained just aligning the variogram with the strike of the orebody, along the azimuth 310°. Two directions were tested: a vector dipping to SE, following the shape of the orebody, and another to NW, as suggested by the alignment of high grade zones. The vector dipping to NW presented better results, therefore it was used.
variogram showed better structure variograms were used for modeling.
The variography parameters used in the kriging are listed in table below. The nugget
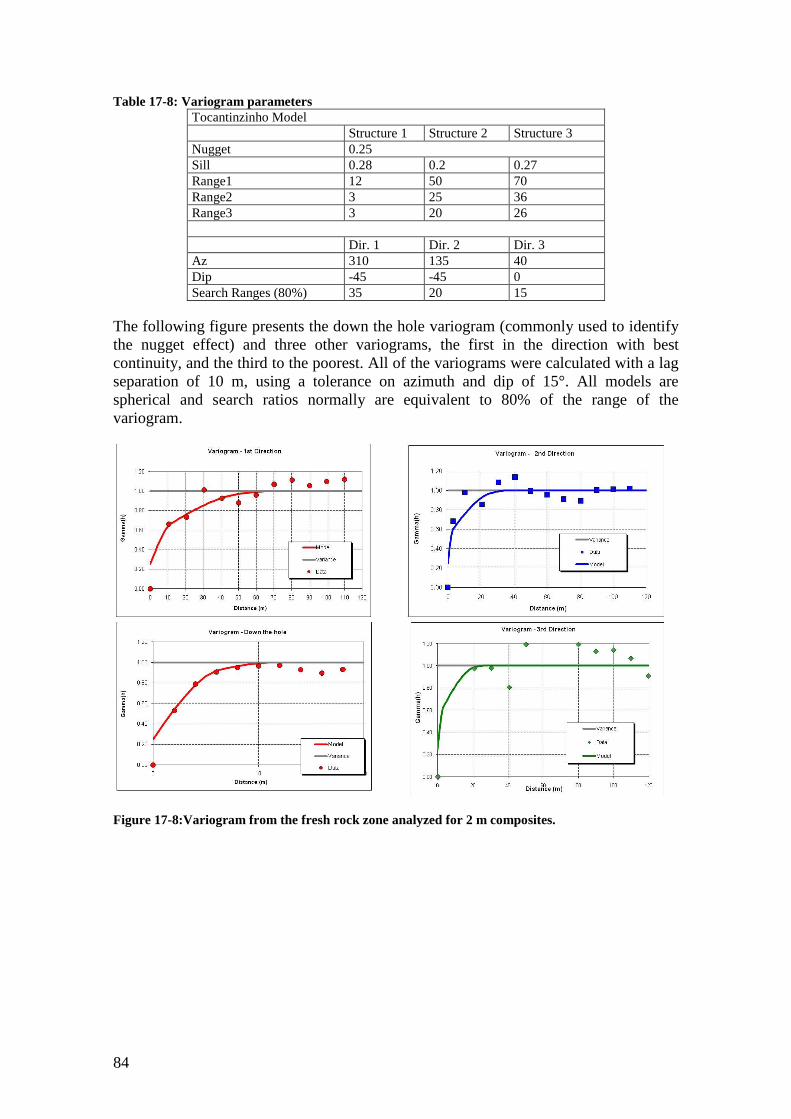
84
Table 17-8: Variogram parameters Tocantinzinho Model Structure 1 Structure 2 Structure 3 Nugget 0.25 Sill 0.28 0.2 0.27 Range1 12 50 70 Range2 3 25 36 Range3 3 20 26 Dir. 1 Dir. 2 Dir. 3 Az 310 135 40 Dip -45 -45 0 Search Ranges (80%) 35 20 15
The following figure presents the down the hole variogram (commonly used to identify the nugget effect) and three other variograms, the first in the direction with best continuity, and the third to the poorest. All of the variograms were calculated with a lag separation of 10 m, using a tolerance on azimuth and dip of 15°. All models are spherical and search ratios normally are equivalent to 80% of the range of the variogram.
Figure 17-8:Variogram from the fresh rock zone analyzed for 2 m composites.
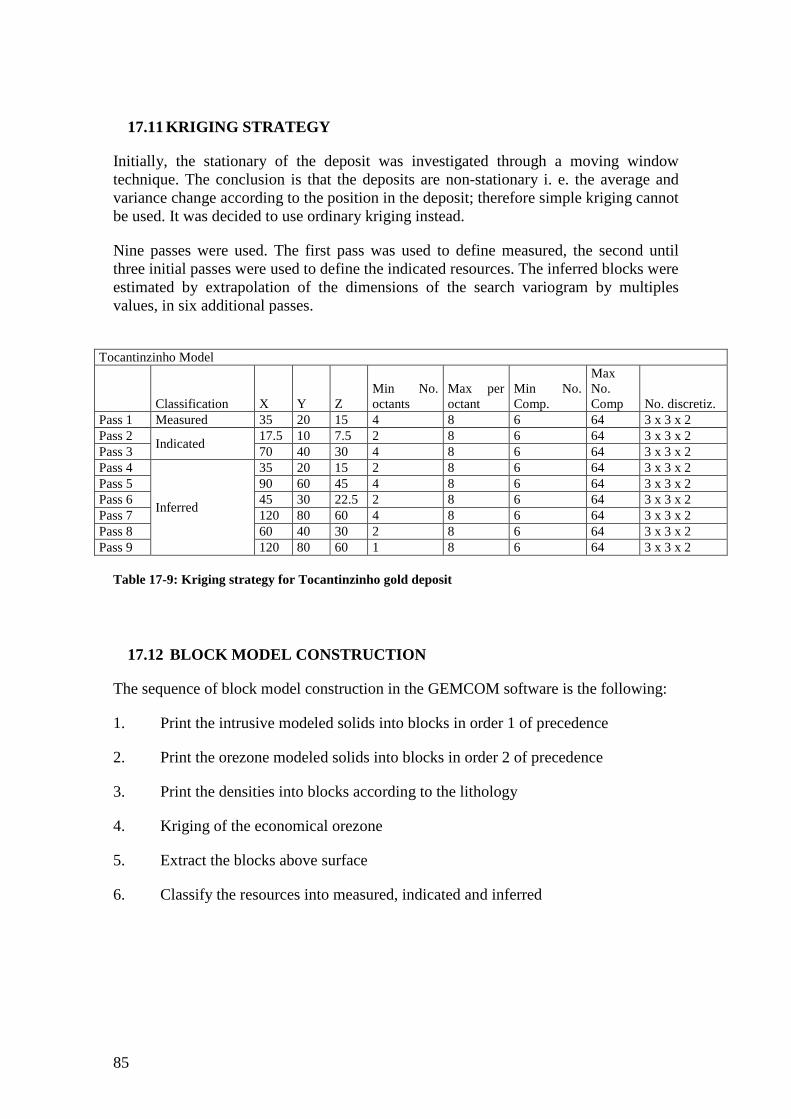
85
17.11 KRIGING STRATEGY
Initially, the stationary of the deposit was investigated through a moving window technique. The conclusion is that the deposits are non-stationary i. e. the average and variance change according to the position in the deposit; therefore simple kriging cannot be used. It was decided to use ordinary kriging instead.
Nine passes were used. The first pass was used to define measured, the second until three initial passes were used to define the indicated resources. The inferred blocks were estimated by extrapolation of the dimensions of the search variogram by multiples values, in six additional passes.
Tocantinzinho Model
Classification X Y Z Min No. octants
Max per octant
Min No. Comp.
Max No. Comp No. discretiz.
Pass 1 Measured 35 20 15 4 8 6 64 3 x 3 x 2 Pass 2
Indicated 17.5 10 7.5 2 8 6 64 3 x 3 x 2
Pass 3 70 40 30 4 8 6 64 3 x 3 x 2 Pass 4
Inferred
35 20 15 2 8 6 64 3 x 3 x 2 Pass 5 90 60 45 4 8 6 64 3 x 3 x 2 Pass 6 45 30 22.5 2 8 6 64 3 x 3 x 2 Pass 7 120 80 60 4 8 6 64 3 x 3 x 2 Pass 8 60 40 30 2 8 6 64 3 x 3 x 2 Pass 9 120 80 60 1 8 6 64 3 x 3 x 2
Table 17-9: Kriging strategy for Tocantinzinho gold deposit
17.12 BLOCK MODEL CONSTRUCTION
The sequence of block model construction in the GEMCOM software is the following:
1. Print the intrusive modeled solids into blocks in order 1 of precedence
2. Print the orezone modeled solids into blocks in order 2 of precedence
3. Print the densities into blocks according to the lithology
4. Kriging of the economical orezone
5. Extract the blocks above surface
6. Classify the resources into measured, indicated and inferred

86
17.13 MINERAL RESOURCE CRITERIA
17.13.1Classification method
The classification methodology adopted by NCL and the criteria used follows:
Measured resources: Blocks with at least two drillholes within the search ellipsoid, which was defined as the distance where the variogram model reach 80% of the variance (D80). This distance is equivalent to 35 m along plunge, 20 m across the plunge and within the mineralized zone and 15 m perpendicular to the mineralized zone.
Indicated resources: Blocks with at least two octants filled within the search ellipsoid, defined up to 2.5 times the search range defined by the variogram. The kriging passes up to number four were used for this, as depicted in the table 9.
Inferred resources: Blocks estimated in the kriging passes 5 to 9, representing an ellipsoid with a maximum of 120 x 80 x 60 m with a single drillhole.
17.13.2 Resource Reporting Criteria
The basic criteria followed in this estimation are as follows:
Cut-off based on costs and recovery taken from average industry values under similar conditions as Tocantinzinho. The open pit optimizer software “Whittle” was utilized to define the portions of the block model with reasonable prospects of being economical by open pit methods. All blocks above cut-off and above the Whittle envelope were considered resources.
Parameters selected by NCL and used for Whittle optimization and cut-off definition are as Table 17-10 below:
Gold Price US$/oz 1 200
Process and G&A US$/ton 9.00
Mining Cost- Open Pit US$/ton 1.20
Global slope angle ° 55°
Metallurgical recovery-Oxides % 80%
Metallurgical recovery-Sulphide % 93%
Table 17-10: Parameters used for Whittle
The cut-off grade value chosen was 0.254 g/t.
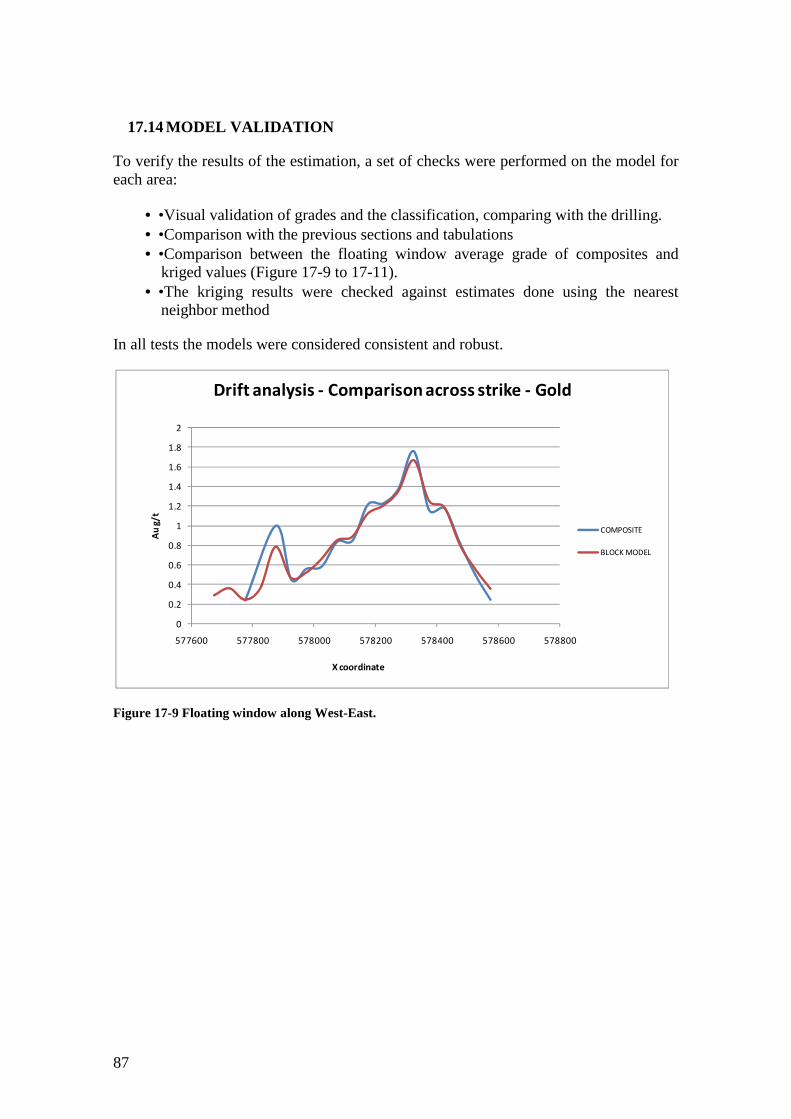
87
17.14 MODEL VALIDATION
To verify the results of the estimation, a set of checks were performed on the model for each area:
• •Visual validation of grades and the classification, comparing with the drilling. • •Comparison with the previous sections and tabulations • •Comparison between the floating window average grade of composites and
kriged values (Figure 17-9 to 17-11). • •The kriging results were checked against estimates done using the nearest
neighbor method
In all tests the models were considered consistent and robust.
Figure 17-9 Floating window along West-East.
0
0.2
0.4
0.6
0.8
1
1.2
1.4
1.6
1.8
2
577600 577800 578000 578200 578400 578600 578800
Au
g/
t
X coordinate
Drift analysis - Comparison across strike - Gold
COMPOSITE
BLOCK MODEL
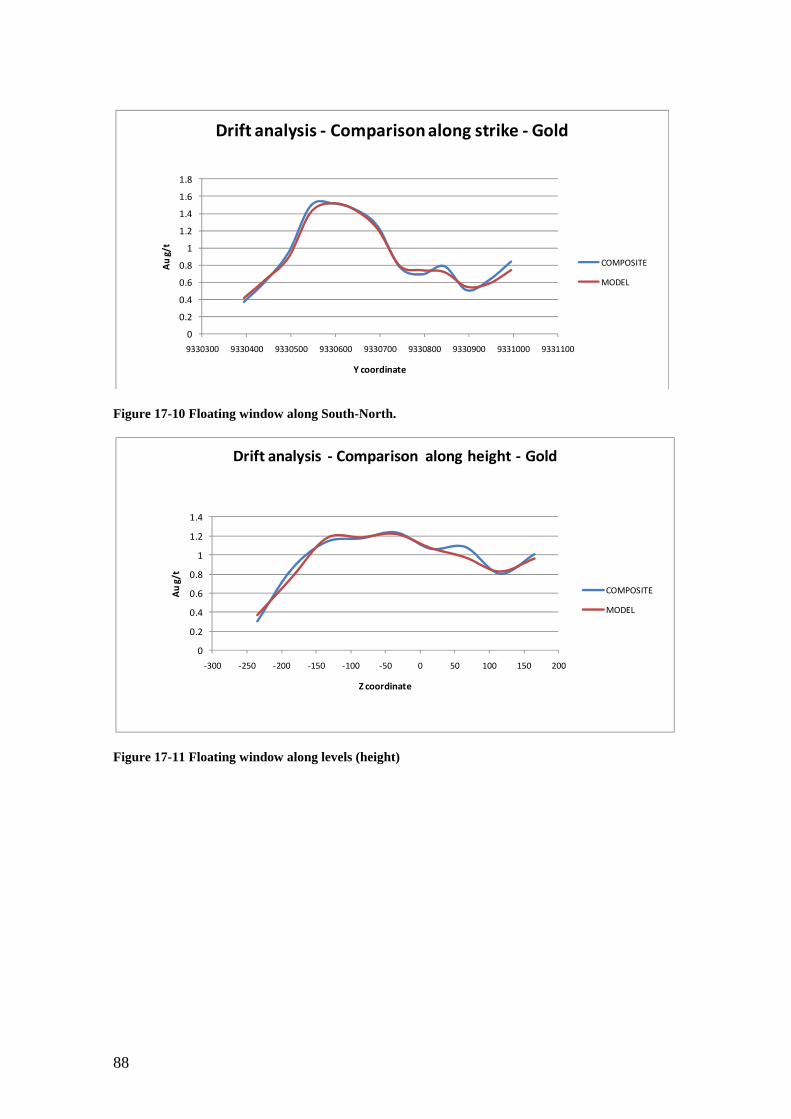
88
Figure 17-10 Floating window along South-North.
Figure 17-11 Floating window along levels (height)
0
0.2
0.4
0.6
0.8
1
1.2
1.4
1.6
1.8
9330300 9330400 9330500 9330600 9330700 9330800 9330900 9331000 9331100
Au
g/t
Y coordinate
Drift analysis - Comparison along strike - Gold
COMPOSITE
MODEL
|
0
0.2
0.4
0.6
0.8
1
1.2
1.4
-300 -250 -200 -150 -100 -50 0 50 100 150 200
Au
g/t
Z coordinate
Drift analysis - Comparison along height - Gold
COMPOSITE
MODEL|

89
17.15 RESULTS
Table 17-11 summarizes the mineral resources above 0.254 g/t Au. Table 17-12 shows the grade/tonnage per cutoff.
Table 17-11 Mineral Resources Statement
Oxide Fresh Rock Total
KTons Au g/t Koz Au KTons Au g/t Koz Au Tons Au g/t Koz Au
Measured 364 0.90 11 15,470 1.24 618 15,834 1.23 629
Indicated 1,257 0.91 37 34,316 1.11 1,227 35,572 1.10 1,264
M&I 1,620 0.91 47 49,785 1.15 1,845 51,406 1.14 1,892
Inferred 1,201 0.81 31 11,199 0.99 358 12,400 0.98 389
Obs: Blocks above Cutoff 0.254 g Au/t and inside the whittle shell at US$ 1200/oz
The graphic of tonnage and gold grade divided by rock type (fresh and oxide rock) can be observed on Figure 17-12 which shows the tonnage and grade at different cut-off grades.
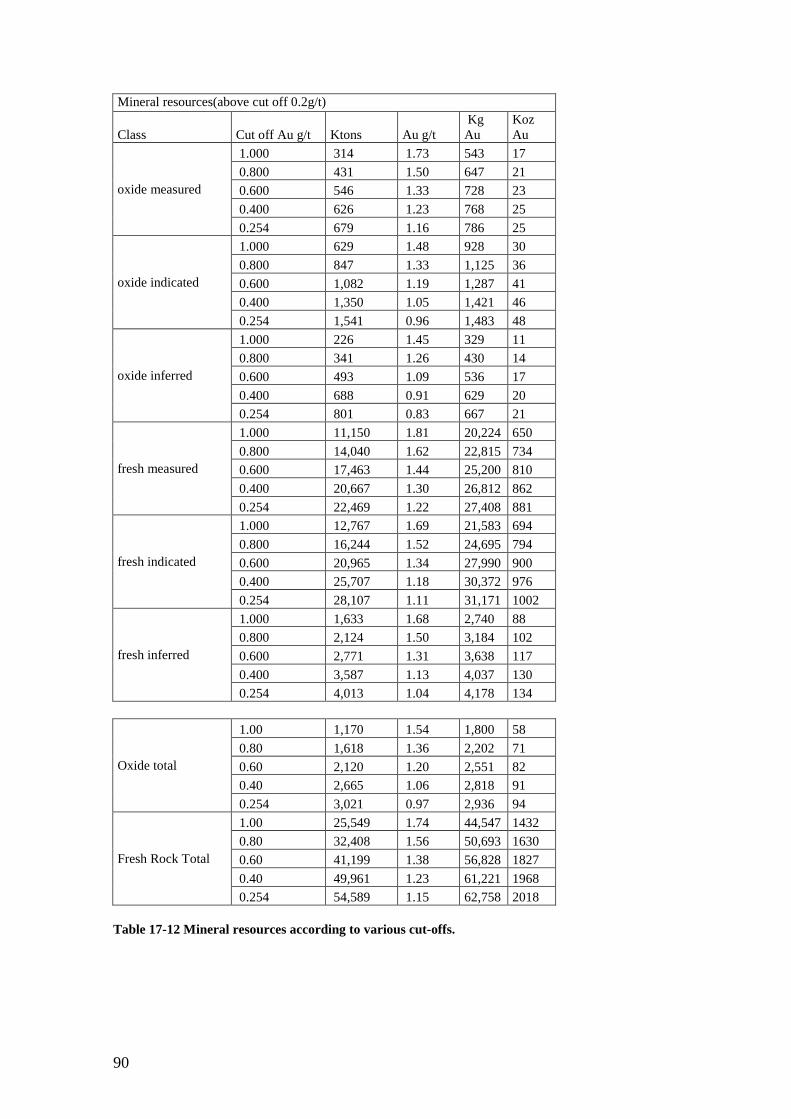
90
Mineral resources(above cut off 0.2g/t)
Class Cut off Au g/t Ktons Au g/t Kg Au
Koz Au
oxide measured
1.000 314 1.73 543 17
0.800 431 1.50 647 21
0.600 546 1.33 728 23
0.400 626 1.23 768 25
0.254 679 1.16 786 25
oxide indicated
1.000 629 1.48 928 30
0.800 847 1.33 1,125 36
0.600 1,082 1.19 1,287 41
0.400 1,350 1.05 1,421 46
0.254 1,541 0.96 1,483 48
oxide inferred
1.000 226 1.45 329 11
0.800 341 1.26 430 14
0.600 493 1.09 536 17
0.400 688 0.91 629 20
0.254 801 0.83 667 21
fresh measured
1.000 11,150 1.81 20,224 650
0.800 14,040 1.62 22,815 734
0.600 17,463 1.44 25,200 810
0.400 20,667 1.30 26,812 862
0.254 22,469 1.22 27,408 881
fresh indicated
1.000 12,767 1.69 21,583 694
0.800 16,244 1.52 24,695 794
0.600 20,965 1.34 27,990 900
0.400 25,707 1.18 30,372 976
0.254 28,107 1.11 31,171 1002
fresh inferred
1.000 1,633 1.68 2,740 88
0.800 2,124 1.50 3,184 102
0.600 2,771 1.31 3,638 117
0.400 3,587 1.13 4,037 130
0.254 4,013 1.04 4,178 134
Oxide total
1.00 1,170 1.54 1,800 58
0.80 1,618 1.36 2,202 71
0.60 2,120 1.20 2,551 82
0.40 2,665 1.06 2,818 91
0.254 3,021 0.97 2,936 94
Fresh Rock Total
1.00 25,549 1.74 44,547 1432
0.80 32,408 1.56 50,693 1630
0.60 41,199 1.38 56,828 1827
0.40 49,961 1.23 61,221 1968
0.254 54,589 1.15 62,758 2018
Table 17-12 Mineral resources according to various cut-offs.
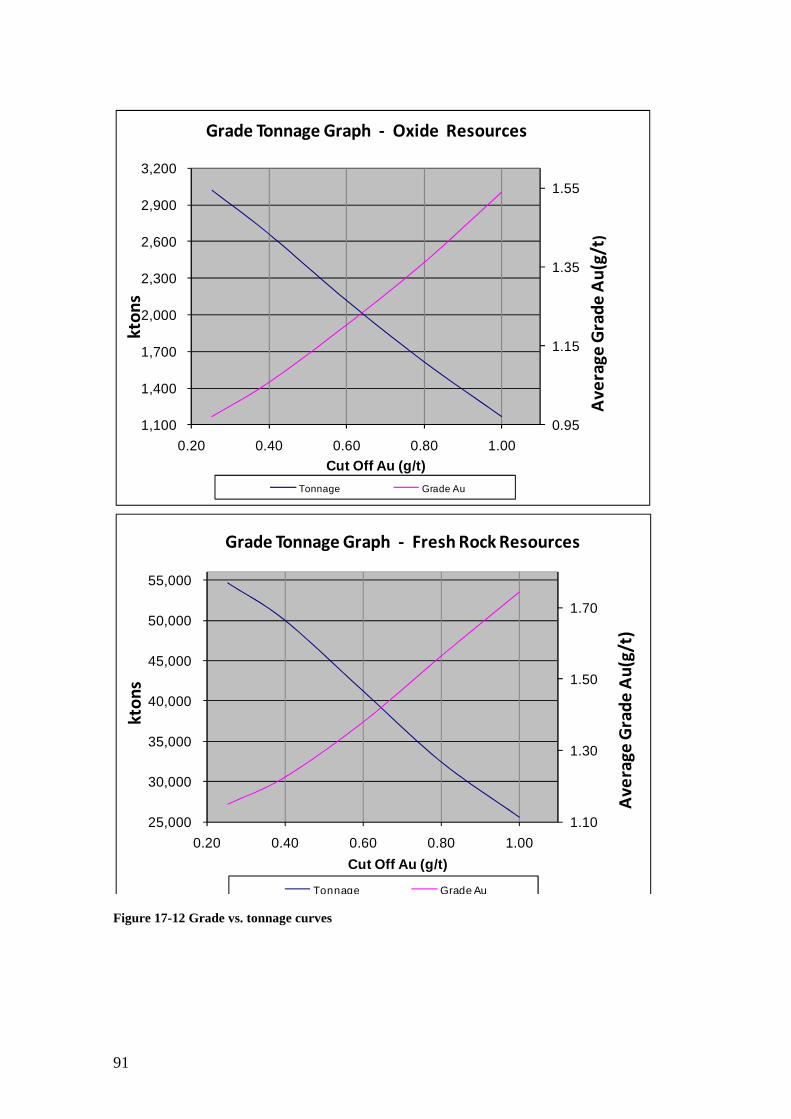
91
Figure 17-12 Grade vs. tonnage curves
0.95
1.15
1.35
1.55
1,100
1,400
1,700
2,000
2,300
2,600
2,900
3,200
0.20 0.40 0.60 0.80 1.00
Av
era
ge
Gra
de
Au
(g/t
)
kto
ns
Cut Off Au (g/t)
Grade Tonnage Graph - Oxide Resources
Tonnage Grade Au
1.10
1.30
1.50
1.70
25,000
30,000
35,000
40,000
45,000
50,000
55,000
0.20 0.40 0.60 0.80 1.00
Av
era
ge
Gra
de
Au
(g/t
)
kto
ns
Cut Off Au (g/t)
Grade Tonnage Graph - Fresh Rock Resources
Tonnage Grade Au
92
17.16 CONCLUSIONS AND RECOMMENDATIONS
NCL estimated the Tocantinzinho gold deposit using 3D modeling and ordinary kriging, basing on additional exploration information produced by Brazauro and Eldorado Gold, including 15496 m of diamond drilling and 298 m of auger drilling, as compared with the resource evaluation published in March 2009. Also important, this new estimate benefits from improvements in the topographic survey and in the geological knowledge of the deposit.
Some recommendations are:
• Enhance the usage of geology to define the mineralized body, instead of just a grade shell as presently used. Should be useful the analysis of markers of hydrothermal alteration and structural geology, as compared with gold mineralization.
• To investigate the possible influence of gold nuggets in the estimation, bulk samples should be considered in order to assure that the sampling is representative of the deposit. A sampling size study using the Gy’s theory should be important for better understanding of the deposit.
The resource classification based on sample proximity and positioning should be complemented by geological interpretation, perusing each section and adjusting the classification according to the geological criteria.
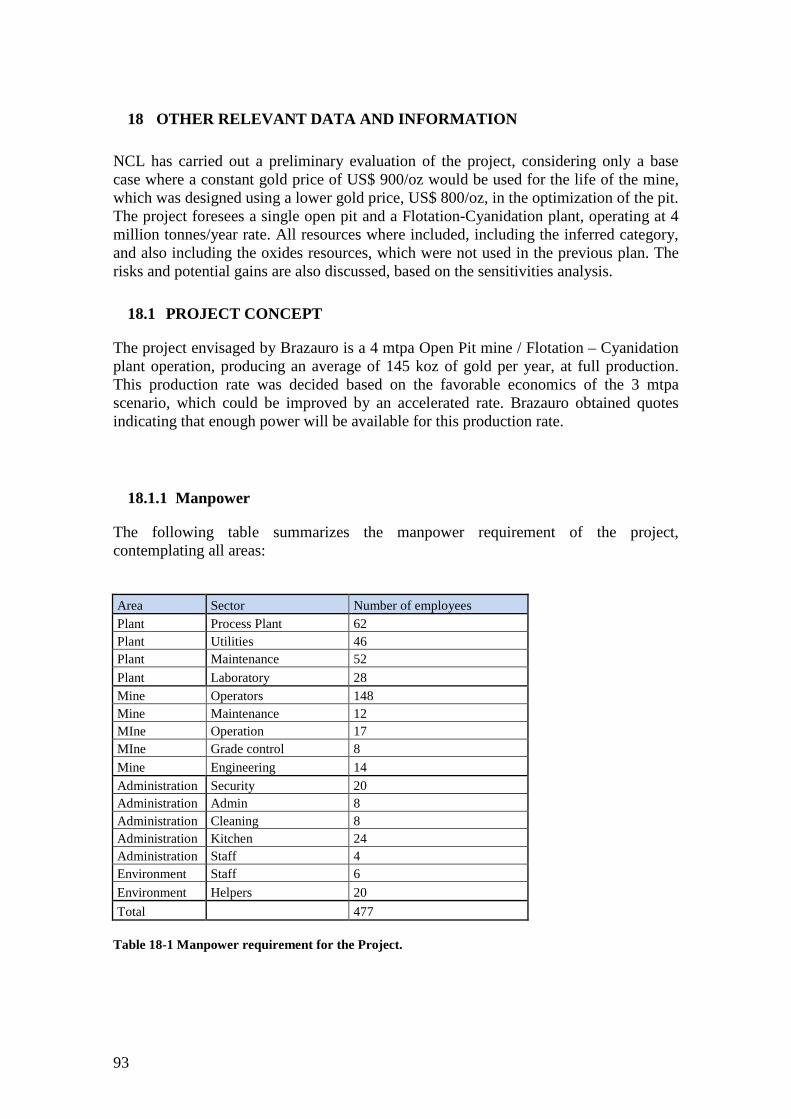
93
18 OTHER RELEVANT DATA AND INFORMATION
NCL has carried out a preliminary evaluation of the project, considering only a base case where a constant gold price of US$ 900/oz would be used for the life of the mine, which was designed using a lower gold price, US$ 800/oz, in the optimization of the pit. The project foresees a single open pit and a Flotation-Cyanidation plant, operating at 4 million tonnes/year rate. All resources where included, including the inferred category, and also including the oxides resources, which were not used in the previous plan. The risks and potential gains are also discussed, based on the sensitivities analysis.
18.1 PROJECT CONCEPT
The project envisaged by Brazauro is a 4 mtpa Open Pit mine / Flotation – Cyanidation plant operation, producing an average of 145 koz of gold per year, at full production. This production rate was decided based on the favorable economics of the 3 mtpa scenario, which could be improved by an accelerated rate. Brazauro obtained quotes indicating that enough power will be available for this production rate.
18.1.1 Manpower
The following table summarizes the manpower requirement of the project, contemplating all areas:
Area Sector Number of employees Plant Process Plant 62 Plant Utilities 46 Plant Maintenance 52
Plant Laboratory 28 Mine Operators 148 Mine Maintenance 12 MIne Operation 17 MIne Grade control 8
Mine Engineering 14 Administration Security 20 Administration Admin 8 Administration Cleaning 8 Administration Kitchen 24 Administration Staff 4 Environment Staff 6
Environment Helpers 20
Total 477
Table 18-1 Manpower requirement for the Project.
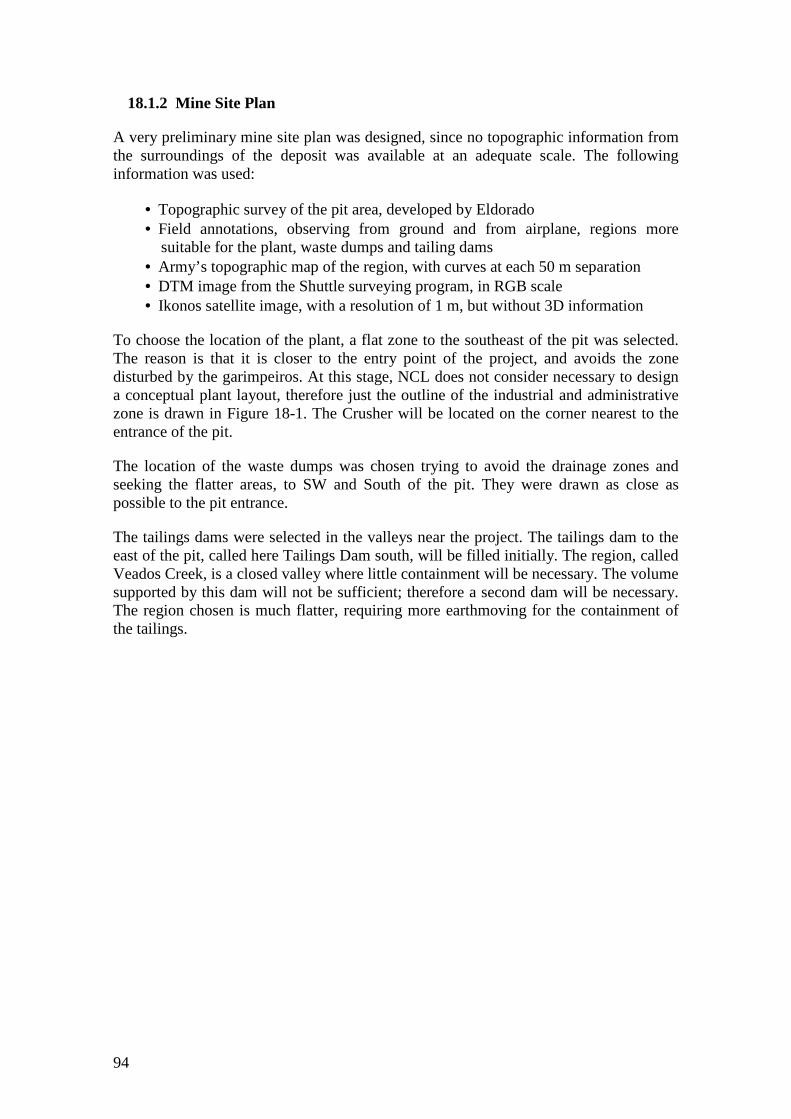
94
18.1.2 Mine Site Plan
A very preliminary mine site plan was designed, since no topographic information from the surroundings of the deposit was available at an adequate scale. The following information was used:
• Topographic survey of the pit area, developed by Eldorado • Field annotations, observing from ground and from airplane, regions more
suitable for the plant, waste dumps and tailing dams • Army’s topographic map of the region, with curves at each 50 m separation • DTM image from the Shuttle surveying program, in RGB scale • Ikonos satellite image, with a resolution of 1 m, but without 3D information
To choose the location of the plant, a flat zone to the southeast of the pit was selected. The reason is that it is closer to the entry point of the project, and avoids the zone disturbed by the garimpeiros. At this stage, NCL does not consider necessary to design a conceptual plant layout, therefore just the outline of the industrial and administrative zone is drawn in Figure 18-1. The Crusher will be located on the corner nearest to the entrance of the pit.
The location of the waste dumps was chosen trying to avoid the drainage zones and seeking the flatter areas, to SW and South of the pit. They were drawn as close as possible to the pit entrance.
The tailings dams were selected in the valleys near the project. The tailings dam to the east of the pit, called here Tailings Dam south, will be filled initially. The region, called Veados Creek, is a closed valley where little containment will be necessary. The volume supported by this dam will not be sufficient; therefore a second dam will be necessary. The region chosen is much flatter, requiring more earthmoving for the containment of the tailings.
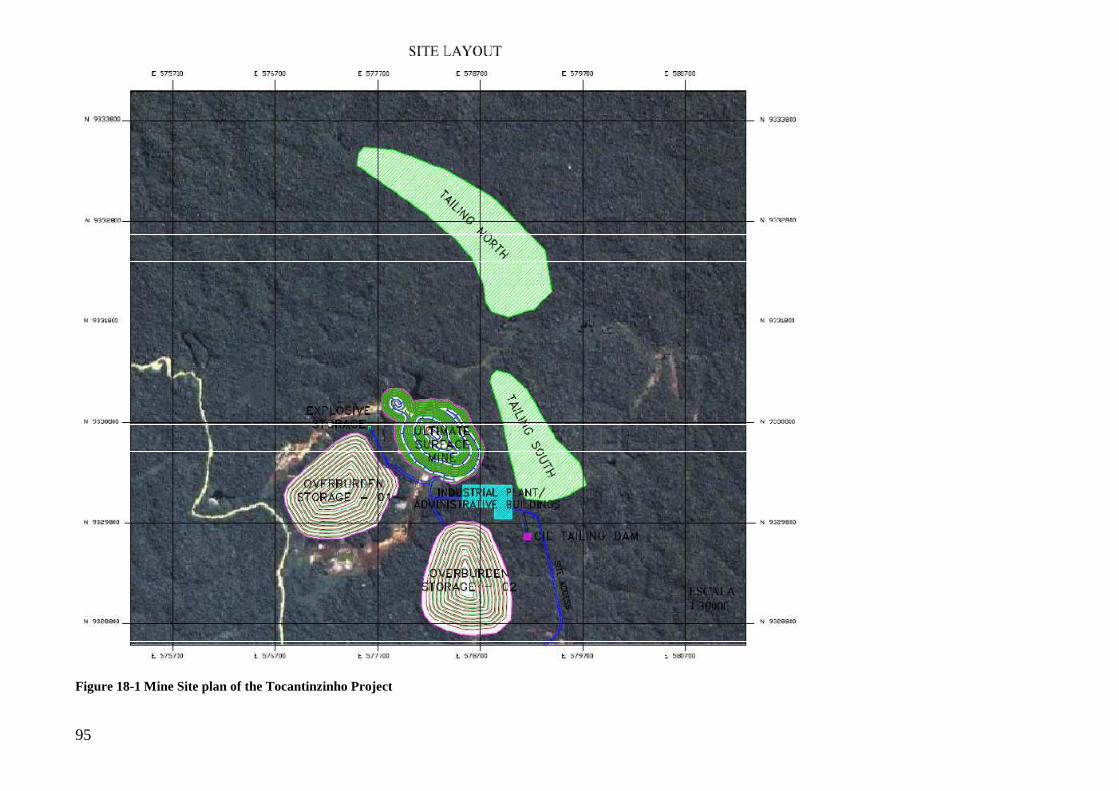
95
Figure 18-1 Mine Site plan of the Tocantinzinho Project
96
18.2 POWER SUPPLY
This section has been prepared by Eduardo Maldonado, specialist on power supply issues, with experience in several countries of Latin America.
Brazauro has indicated that it needs up to 30 MW of capacity and the associated energy for the operation of the Project beginning in the last quarter of 2012. Brazauro has also indicated that it wishes that the Project be connected to Brazil's national interconnected electricity system (the "lnterconnected System"). Given its power needs and location, at a minimum a 138 kV transmission system has to be constructed and operated for the delivery of power for the Project. A 230 kV transmission system could also be considered to achieve said objective, to accommodate any expected future increase in the Project's power needs.
For purposes of preparing this report two trips were made to Sao Paulo, Brazil, in December 2009. These trips were scheduled to meet with the principals of the Brazilian subsidiary of Duke Energy ("Duke"), one of the largest energy companies in the United States, Alusa Engenheria ("Alusa"), and its sister company, Alupar ("Alupar"), and Grupo Rede ("Rede").
In Brazil, Duke owns and operates power plants with a combined capacity of approximately 2,200 MW. These plants are located in the south of the country but are interconnected to the Interconnected System.
Alusa and Alupar are very active in the transmission and generation of electricity in Brazil and provide engineering services to third parties. The companies in which Alusa and/or Alupar are shareholders are operating or will operate 4,725 km of high voltage transmission lines in Brazil. Two of these companies operate in the State of Pará: Empresa Paraense de Transmissao de Energia S.A. - ETEP and Empresa Regional de Transmissao de Energia S.A. - ERTE. Rede is one of the largest private business groups in the electricity sector in Brazil. Rede's total installed generation capacity is 1,130 MW and in 2007 it generated 4,559 GWh of electricity. Rede owns several electricity distribution companies in Brazil, acting as electricity distribution concessionaire in the States were they operate. One of these companies is Centrais Elétricas do Pará S.A. – CELPA ("CELPA"), which has the electricity distribution concession for the State of Pará. In 2007, the distribution services rendered by CELPA benefited an estimated population of 7.1 million inhabitants through the supply of 5,117 GWh to 1,498,154 customers (clients), 84.8"/o of which were residential customers. Rede also has an electricity marketing company, Rede Comercializadora de Energia S/A ("Rede Comercializadora"), that markets electricity to large consumers of electricity.
18.2.1 Alternatives for the Delivery of Power.
As can be seen in the map prepared by CELPA, Figure 18-2, considering the existing and planned electricity transmission infrastructure in the area of the Pará State where it is located, at present and in the next five years the closest 138 kV transmission substations to the Project connected to the Interconnected System are the 138 kV Novo Progresso Substation and the 138 kV Itaituba Substation, owned and operated by CELPA. The Novo Progresso Substation and the ltaituba Substation are located 190 km
97
and 290 km from the center of the Project, respectively. The closest 230 kV transmission substation to the Project connected to the Interconnected System is the Rur6polis 230 kV Substation, which is located 370 km from the center of the Project.
Figure 18-2 Distribution of the power grid in the vicinity of the project
After the meeting with Rede, the Engineering Division of the Superintendent of Planning of the System of Rede prepared an estimate of the total capital expenditures, excluding applicable taxes, of constructing and putting into commercial operation a transmission system for the delivery of power to the Project, including basic permitting, land acquisition and environmental licensing costs. The alternatives included in the Estimate and the capital costs associated therewith assuming an exchange rate of R$ 1.72 per USD$ 1.00, are the following:
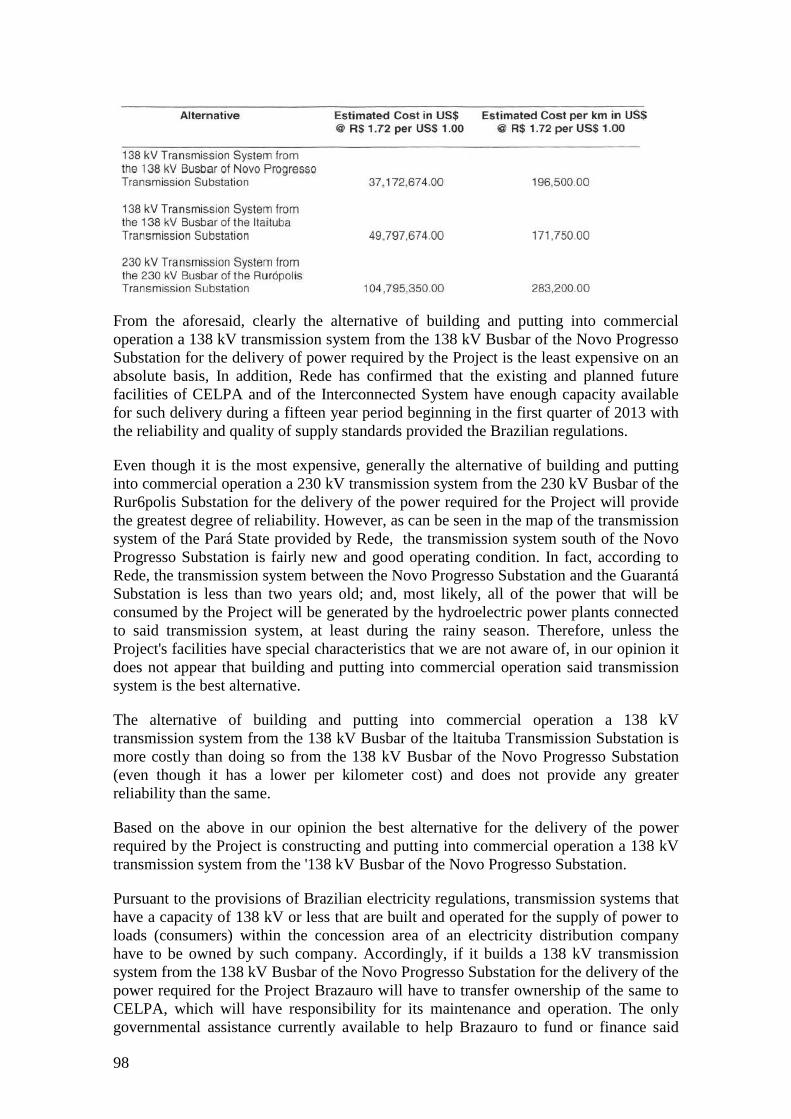
98
From the aforesaid, clearly the alternative of building and putting into commercial operation a 138 kV transmission system from the 138 kV Busbar of the Novo Progresso Substation for the delivery of power required by the Project is the least expensive on an absolute basis, In addition, Rede has confirmed that the existing and planned future facilities of CELPA and of the Interconnected System have enough capacity available for such delivery during a fifteen year period beginning in the first quarter of 2013 with the reliability and quality of supply standards provided the Brazilian regulations.
Even though it is the most expensive, generally the alternative of building and putting into commercial operation a 230 kV transmission system from the 230 kV Busbar of the Rur6polis Substation for the delivery of the power required for the Project will provide the greatest degree of reliability. However, as can be seen in the map of the transmission system of the Pará State provided by Rede, the transmission system south of the Novo Progresso Substation is fairly new and good operating condition. In fact, according to Rede, the transmission system between the Novo Progresso Substation and the Guarantá Substation is less than two years old; and, most likely, all of the power that will be consumed by the Project will be generated by the hydroelectric power plants connected to said transmission system, at least during the rainy season. Therefore, unless the Project's facilities have special characteristics that we are not aware of, in our opinion it does not appear that building and putting into commercial operation said transmission system is the best alternative.
The alternative of building and putting into commercial operation a 138 kV transmission system from the 138 kV Busbar of the ltaituba Transmission Substation is more costly than doing so from the 138 kV Busbar of the Novo Progresso Substation (even though it has a lower per kilometer cost) and does not provide any greater reliability than the same.
Based on the above in our opinion the best alternative for the delivery of the power required by the Project is constructing and putting into commercial operation a 138 kV transmission system from the '138 kV Busbar of the Novo Progresso Substation.
Pursuant to the provisions of Brazilian electricity regulations, transmission systems that have a capacity of 138 kV or less that are built and operated for the supply of power to loads (consumers) within the concession area of an electricity distribution company have to be owned by such company. Accordingly, if it builds a 138 kV transmission system from the 138 kV Busbar of the Novo Progresso Substation for the delivery of the power required for the Project Brazauro will have to transfer ownership of the same to CELPA, which will have responsibility for its maintenance and operation. The only governmental assistance currently available to help Brazauro to fund or finance said
99
costs that we have identified is a soft loan from the Brazilian government. Other sources might be developed or available. The main facilities that will have to be part of the 138 kV transmission system from the 138 kV Busbar of the Novo Progresso Substation are set forth in Table No. 1 of the Estimate. Said facilities are: a 190 km single circuit 138 kV transmission line, a 138 kV connection bay at the Novo Progresso Substation and a 45 MVAr Condenser Bank at the transmission substation located at the Project. Please note that Alusa has estimated that it can build and put into commercial operation a similar transmission system for R$ 59,000.000.00, which at an exchange rate of R$ 1.72 per US$ 1.00 is US$ 34,302,325,00.
On January 7, 2010, Rede submitted a turn-key engineering, procurement and construction proposal to Brazauro for constructing and putting into commercial operation a 138 kV transmission system from the 138 kV Busbar of the Novo Progresso Substation for the delivery of the power required for the Project (the "EPC Proposal").
In accordance with the terms of the EPC Proposal, Rede will undertake the engineering, procurement and construction of the aforesaid 138 kV transmission system as described in the EPC Proposal (the "EPC 138 kV System") for an all-in price of R$ 69,800,000.00, including all applicable taxes, which at an exchange rate of R$ 1.72 per US$ 1.00 is equal to US$ 40,581,395.00 (the "EPC Price"). The EPC Proposal is an all-inclusive proposal and there under Rede will assume responsibility for obtaining the land and environmental permits and authorizations required for construction and operation of the EPC 138 kV System, including the payment of all compensations for securing any right-of-way needed for such purpose.
The EPC Price is 9.17% higher than the corresponding amount set forth in the Estimate but as indicated the EPC Proposal includes all cost items and taxes. The EPC Price will be subject to one annual review to adjust it for Brazilian inflation. A 10% down payment of the EPC Price will be due and payable on the date of execution by the parties of the corresponding EPC contract (the "EPC Contract").
The remainder of the EPC Price will be paid in accordance with the milestone schedule included in numeral 3 of the EPC Proposal.
Under the EPC Proposal the time for building and putting into commercial operation the EPC 138 kV System is twenty-four (24) months from the date of execution by the parties of the EPC Contract. A detailed construction schedule will be developed prior to said execution and will be included as part of the EPC Contract.
18.2.2 Power Supplv.
Since the Project's total electricity demand is more than 3 MW, under Brazilian electricity regulations Brazauro is considered to be a free client (customer) of power, This means that Brazauro can enter into electricity supply contracts with third parties at freely negotiated energy prices. Generally, the transmission tolls and charges for the wheeling of the energy purchased under said contracts will be set by the Brazilian electricity regulatory authority - Agencia Nacional de Energia Eletrica - ANEEL ("ANEEL").
100
On the other hand, Brazauro can choose to purchase the power required for the Project from CELPA at a regulated price fixed by ANEEL. As previously indicated, CELPA has the electricity distribution concession in the Pará State where the Project is located. Alternatively, Brazauro can decide to buy existing or build and operate new power plants and associated transmission systems to generate and transmit such power and sell any excess power generated by such plants to third parties. For this purpose, please note that Rede and Alusa estimate that the installed cost of each megawatt of a small hydroelectric power plant (a power plant that has a capacity of 30 MW or less) is US$ 3,000.00 and the time required for building it and putting it into commercial operation is three years. This cost can be substantially lower if the hydroelectric plant is a run of the river hydroelectric plant, but said plant cannot reliably generate the power required by the Project during the dry season.
Given the aforesaid we have concentrated our efforts in obtaining offers for the supply of the power required by the Project from reputable third parties considering that Brazauro is a free client and in obtaining an offer for said supply from CELPA, assuming that Brazauro would be a captive client of said electricity distribution company. Please note that except as otherwise agreed changing the status of captive client to free client or vice-versa requires the delivery by Brazauro of a five (5) years prior notice to CELPA.
Duke's Brazilian subsidiary declined to make an offer to Brazauro for the supply of the power required by the Project, indicating that their existing and planned generation is too far from the area of the Project and that they have a policy against signing contracts for the supply of power in the Northern part of Brazil Alusa/Alupar also declined to submit said offer saying that without more specific information about the Project's start-up date and characteristics they could not deliver said offer.
Rede through Rede Comercializadora did make an offer for the supply of the power required by the Project. CELPA has also indicated its willingness to supply such power to Brazauro as one of CELPA's captive clients. Under the Supply Offer, Rede is offering to supply to Brazauro the power required by the Project at an energy price of R$ 160.00/MWh adjusted annually for Brazilian inflation plus the amount of R$ 29.20/MWh for the fixed transmission tolls (considering a 50% discount allowed for hydroelectric power plants of 30 MW of capacity or less) and the amount of R$ 17.77/MWh for charges, assuming a 90% load factor. The last two amounts could be adjusted upwards or downwards annually and/or every four (4) years by ANEEL. Thus the total all-in price for supply of power, excluding applicable taxes, adjusted as indicated herein that Rede has offered is R$ 206.97lMWh, which at an exchange rate of R$ 1.72 per US$ 1.00, is US$ 120.33/MWh. The sale of energy is subject to a 25% value added tax in the State of Pará. Accordingly, a 25% value added tax will be assessed on the energy price of R$ 160.00/MWh. According to Rede, no other taxes are currently applicable to the sale by Rede Comercializadora to Brazauro of the electricity required by the Project.
The Supply Offer requires that Brazauro commits to acquire 90% of the maximum contracted capacity and associated energy on a take-or-pay basis. In other words, Brazauro will have to purchase 27 MW and the associated energy on a take-or-pay basis. We believe that this requirement can be negotiated down to a take-or-pay commitment of 70-80%. We further believe that the energy price of R$ 160.00/MWh can be negotiated down by up to 20%.
101
Under the Supply Offer, Rede agrees to let Brazauro become a captive client of CELPA with just a one hundred and eighty (180) days notice to CELPA. Likewise, Rede agrees that CELPA will immediately authorize Brazauro becoming a free client of Rede Comercializadora.
As a captive client, CELPA will supply to Brazauro the power required for the Project at an all-in price resulting from the application of the corresponding rates set forth in the tariff resolution in force from time to time issued by ANEEL. The current rates that ANEEL is authorized to charge to its captive clients are set forth in ANEEL's Resolução Homologatória No. 857 dated August 4, 2009. Applying such rates and assuming a 90% load factor for the Project the current total all-in price, excluding applicable taxes, which according to Rede at present only include a 25% value added tax on the energy sold in the State of Pará, for the electricity required for the Project (energy plus fixed transmission tolls and charges) would be R$ 157,69/MWh, which at an exchange rate of R$ 1.72 per US$ 1.00 is US$ 91.68/MWh. There is no take-or-pay requirement under the corresponding electricity supply contract. Assuming that the regulated energy rates go up by 2.5% annually said price will be US$ 98.73/MWh in 2013, excluding applicable taxes, which according to Rede at present only include a 25% value added tax on the energy sold in the State of Pará/ CELPA is very interested in the construction by Brazauro of the 138 kV transmission system for the delivery of power required for the Project. This situation should help in the negotiations with Rede.
Given the aforesaid, we recommend that Brazauro enters into an electricity supply contract with CELPA for the supply of the power required by the Project as a captive client for five years beginning in the last quarter of 2013 and thereafter enters into an electricity supply contract with Rede's marketing company or another third party for the supply of said power as a free client. We estimate that at present taking these actions will yield a total all-in price for said power, excluding applicable taxes, that according to Rede at present are a 25% value added tax on the energy sold, of between US$ 100.00/MWh and US$ 110.00/MWh, which will be adjusted as indicated herein over a fifteen year period.
18.2.3 Conclusions.
1. Based on the information received from Brazauro and Rede, the best alternative for the delivery of the power required by the Project during the required fifteen years period is constructing and putting into commercial operation a 138 kV transmission system from the 138 kV Busbar of the Novo Progresso Substation. Existing and planned transmission facilities of CELPA and the lnterconnected System do not require any update or reinforcement except for the construction of said 138 kV transmission system to allow such delivery.
2. The total estimated cost, excluding applicable taxes, of building and putting into commercial operation a 138 kV transmission system from the 138 kV Busbar of the Novo Progresso Substation is US$ 37,172,674.00. Under the EPC Proposal, Rede has offered to build and put into commercial operation such system as described therein for an all-in price (including engineering, procurement, construction, licensing and environmental permitting and taxes) of R$ 69,800,000.00, which at an exchange rate of R$ 1.72 per US$ 1.00 is US$ 40,581,395.00. The only governmental assistance currently available to help Brazauro to fund or finance said costs that we have identified
102
is a 'soft loan' from the Brazilian government. Other sources might be developed or available.
3. The all-in price, excluding applicable taxes, which according to Rede at present only include a 25% value added tax on the energy sold in the State of Pará, that Brazauro will have to pay to purchase the power required for the Project if Brazauro enters into an electricity supply contract as a free client with Rede's electricity marketing subsidiary would be US$ 120.33/MWh prior to any negotiation.
In our opinion, after negotiation the energy price offered by Rede of R$ 160.00/MWh can be negotiated down by up to 20%. The energy component of this price will be adjusted annually for Brazilian inflation. The fixed transmission tolls and charges components of said all-in price could be adjusted annually and/or every four years, as described herein above. Under said contract Brazauro will have to assume a take-or-pay commitment to purchase 90% of the energy associated with the maximum contracted capacity, in other words the energy associated with 27 MW.
4. The all-in price, excluding applicable taxes, which according to Rede at present only include a 25% value added tax on the energy sold in the State of Pará., that Brazauro will have to pay to purchase the power required for the Project if Brazauro enters into an electricity supply contract with CELPA as a captive client would be a regulated price of US$ 98.73/MWh, beginning in the first quarter of 2013. There would not be a take-or-pay commitment under this contract. This price could be adjusted upwards or downwards annually and/or every four years, as provided herein above.
5. We recommend that Brazauro enters into an electricity supply contract with CELPA for the supply of the power required by the Project as a captive client for five (5) years beginning in the last quarter of 2012 and thereafter enters into an electricity supply contract with Rede Comercializadora or another third party for the supply of said power as a free client. We estimate that at present taking these actions will yield a total all-in price for said power, excluding applicable taxes, which according to Rede at present only include a 25% value added tax on the energy sold in the State of Pará, of between US$ 100.00/MWh and US$ 110.00/MWh, adjusted as indicated herein, over a fifteen year period.
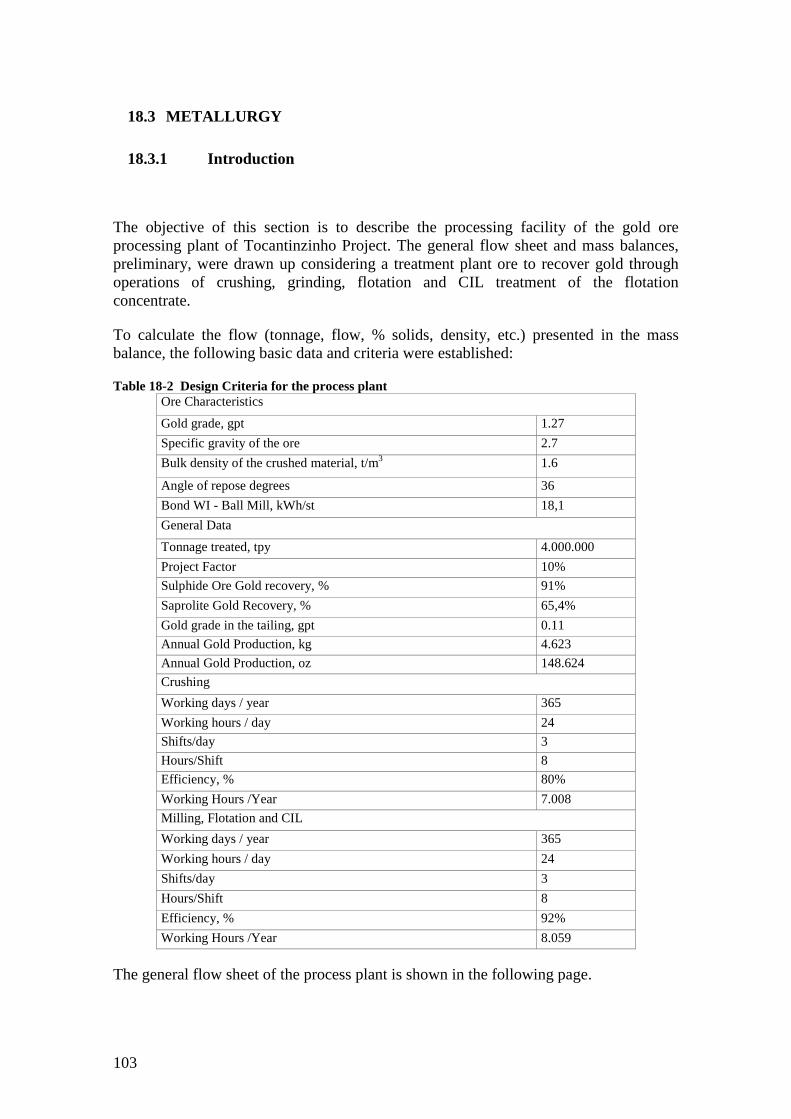
103
18.3 METALLURGY
18.3.1 Introduction
The objective of this section is to describe the processing facility of the gold ore processing plant of Tocantinzinho Project. The general flow sheet and mass balances, preliminary, were drawn up considering a treatment plant ore to recover gold through operations of crushing, grinding, flotation and CIL treatment of the flotation concentrate.
To calculate the flow (tonnage, flow, % solids, density, etc.) presented in the mass balance, the following basic data and criteria were established:
Table 18-2 Design Criteria for the process plant Ore Characteristics
Gold grade, gpt 1.27
Specific gravity of the ore 2.7
Bulk density of the crushed material, t/m3 1.6
Angle of repose degrees 36
Bond WI - Ball Mill, kWh/st 18,1
General Data
Tonnage treated, tpy 4.000.000
Project Factor 10%
Sulphide Ore Gold recovery, % 91%
Saprolite Gold Recovery, % 65,4%
Gold grade in the tailing, gpt 0.11
Annual Gold Production, kg 4.623
Annual Gold Production, oz 148.624
Crushing
Working days / year 365
Working hours / day 24
Shifts/day 3
Hours/Shift 8
Efficiency, % 80%
Working Hours /Year 7.008
Milling, Flotation and CIL
Working days / year 365
Working hours / day 24
Shifts/day 3
Hours/Shift 8
Efficiency, % 92%
Working Hours /Year 8.059
The general flow sheet of the process plant is shown in the following page.
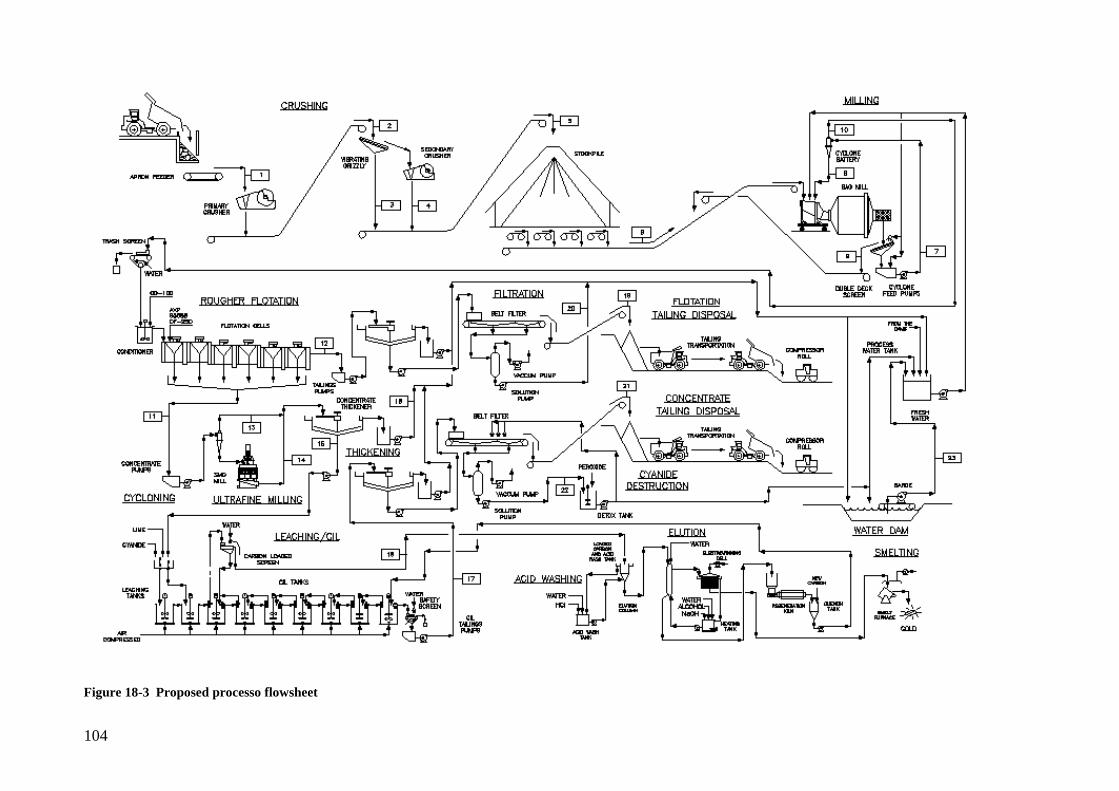
104
Figure 18-3 Proposed processo flowsheet
105
18.3.2 Process Description
18.3.2.1 Crushing
The crushing process consists of a primary and secondary crushing circuit, bins and feeders. The equipment chosen for this circuit include a C200 primary jaw crusher following by a C145 jaw crusher.
Run of mine (ROM) will be transported to the primary crushing unit by off-road trucks.
Ore will be direct dumped loaded into the 80 m3 capacity bin. The bin is fitted with a 500 mm x 500 mm aperture static grizzly that prevents oversize rocks from entering the primary crusher. The +500 mm material retained on this grid will be subsequently broken by the impact breaker prior to being fed into the primary jaw crusher, C200.
The crushed product (which has an aperture of 180mm) discharges to the primary crusher discharge conveyor. The material on the primary crusher discharge conveyor will transfer into a chute and feed a 125mm aperture vibrating grizzly. The oversize material reports directly to the secondary crusher jaw crusher, C145.
The undersize material from vibrating grizzly together with the crusher product feed a belt conveyor and, after passing through a scrap metal detector and extraction system, goes to the crushed stockpile with a capacity for two day’s operation. This system will either extract the scrap metal or will simply stop the belt conveyor for subsequent manual metal removal.
Experience gained from operating sites indicates that direct feed systems such as this have a maximum availability of around 80% due to downtime associated with the crushing and feed system. This will allow discharge to the emergency stockpile or the SAG mill during normal primary crushing operation.
The emergency stockpile included in the design is therefore used to regulate the main plant feed. The stockpile is designed to be able to store up to 22000 tons.
18.3.2.2 Grinding
The comminution process consists of SAG and a regrind ball mill. The major equipment chosen for this circuit includes a SAG mill 34’ diameter x 20’ long, 2 x 7 MW.
This SAG mill is characterized by its large diameter and short length and is designed for a maximum ball charge of 15%. This mill will have a grizzly discharge, with 25 to 50 mm openings, as well as a discharge trommel with 20 mm opening. The SAG mill will be driven by two motors with total power of around 14.0 MW. Trommel undersize flows into the mill discharge hopper.
The SAG mill vendor package is provided with numerous measurement and control systems for load measurement, lubrication systems and vibration monitoring. The trommel oversize material (scats) discharges onto a recycle conveyor and transfers the material back to the SAG mill feed conveyor.
106
Ball feed into the SAG is done via a hoist that will lift the balls into the SAG mill feed bin. The SAG mill discharge is pumped to the primary classification cyclone cluster.
The cyclone overflow has been designed to classify at 80% passing (P80) 120 µm with a pulp density of 33% before flowing by gravity to a linear screen and, after removing all the scraps, goes to the flotation circuit feed conditioner.
The underflow from the cyclone cluster is directed back to the SAG mill feed. This stream at normal operating conditions represents a nominal circulating load of 300%.
18.3.2.3 Rougher Flotation
The flotation circuit receives cyclone overflow from the SAG milling circuit and separates this stream into valuable flotation concentrate and tailing streams. The flotation circuit consists of a rougher circuit with 7 (seven) Smart Cells (WEMCO 70 m3), or similar. The SAG mill cyclone overflow is fed into a conditioner prior to feeding the rougher flotation cells. The flotation concentrate is pumped to the cyclone cluster that separate the pulp in two parts: the underflow feed the regrinding mill while the overflow goes direct to the concentrate thickener.
The flotation tailing stream is pumped to a thickener before deposition in a conventional dam structure. Decanted solutions are returned to the grinding circuits for reuse.
Reagents for flotation i.e. activator, promoters and collector, are fed into the flotation feed conditioner. The collector can also be fed directly into the first rougher flotation cell along with the frother.
18.3.2.4 Concentrate Regrinding
The function of the regrind circuit is to produce concentrate slurry suitable for introduction to the downstream CIL in terms of particle size distribution and slurry density.
The regrind circuit operates in open circuit. The regrind mill is an overflow design, an SMD, METSO or similar with 3.0 m diameter x 7.0 m long fitted with a 600 kW drive.
The regrind mill discharge is combined with the overflow of the concentrate cyclone circuit reports to the concentrate thickener.
107
18.3.2.5 Thickening
All of the concentrate streams from the regrind circuit and the overflow of the concentrate cyclone circuit are thickened in a 12 m diameter vertical thickener (GLV or similar) prior to CIL treatment. A target thickener underflow pulp density of 45% is proposed to minimize the size of the CIL circuit.
Flocculant is added to the concentrate thickener to assist with settling of the concentrate and is provided from the flocculant preparation package.
The thickener overflow gravitates to the thickener overflow tank from where it is pumped to the process water tanks for use around the concentrator.
The concentrate thickener underflow is pumped to the CIL circuit. The underflow pumps are variable speed and are controlled based on either bed pressure or underflow pulp density.
18.3.2.6 Leach/CIL Circuit
The Leach/CIL circuit consists of a two stage pre-leaching circuit followed by a seven stage CIL circuit. This circuit has been sized on the basis of 48 hours residence time, arriving at 9 tanks with nominally 5.3 hours residence time each.
Slurry pumped from the thickener underflow enters the first tank and lime and cyanide is added. After a nominal residence time of 10.6 hours, (two leaching tanks), final adjustment of the pH and cyanide occurs and the slurry is now ready for the CIL section of the circuit. Cyanide solution is added to the first CIL tank and if necessary, further down the leach train.
Slurry flows from the leaching tanks into CIL tank number 1 and continues in series through to CIL tank number 7 until finally discharging to the cyanide destruction circuit where hydrogen peroxide is added to destroy the residual cyanide. Neutralized tailing with be pumped into the tailing dam.
Activated carbon enters the circuit at CIL tank number 7 and is progressed forward at a rate of 2.8 t/d from one downstream tank to another upstream one. Carbon is pumped between tanks by recessed impeller slurry pumps specifically designed to minimize carbon losses. The carbon laden slurry is pumped over a screen situated above the destination tank to separate the carbon from the slurry. The slurry returns from the screen to the tank of origin and the carbon drops into the destination tank, thus minimizing the impact of slurry backflow in each tank.
The activated carbon with a nominal loading of 5000 g/t is retrieved from the tank number 1 by pumping the carbon laden slurry over the loaded carbon screen. The screen has two wash troughs incorporated into its design and therefore has the dual function of separating and washing the carbon prior to feeding one of the two desorption columns.
The CIL tanks are fitted with mechanically wiped intertank screens for carbon retention. Air is sparged into each CIL tank to provide oxygen for the leaching process.
108
18.3.2.7 Elution
A modified Zadra desorption process has been chosen for the project. This process offers shorter elution cycles that allow higher elution frequency should the need arise. The process also provides a cleaner barren carbon product than other competitive systems.
18.3.2.8 Carbon acid washing and Elution
The loaded carbon tank is used as acid wash column. It will be fabricated from acid resistant material (fiber glass) that allows carbon acid washing. When the column is full of carbon, it is filled with a 3% hydrochloric acid solution and allowed to soak for 30 minutes. Acid solution is flushed out with two bed volumes of clean water. Carbon then is washed down into the elution column for the next sequence including the following steps:
• Carbon preheat • Elution with caustic soda, sodium cyanide solution and alcohol. • Carbon cooling • Carbon transfer
During the elution step pregnant gold solution feeds two electrowinning cells in which gold is recover onto stainless steel cathodes. Solution that comes out from the second electrowinning cell is pumped to barren eluate tank where alcohol, caustic soda and cyanide concentrations are corrected and solution returned to the elution column. Cyanide and caustic soda addition control in barren elute tank will be made by sampling the solution by a hand sampler to be located in the electrolysis exit piping, analyzing solution pH and cyanide content. That sampled solution may be used as well for contained gold analysis. When gold concentration in the solution is reduced to less than 5mg/L, it is discarded to the head of the CIL circuit in which residual gold and reagents are recovered. When the cathodes are fully loaded they are washed and removed to the smelt house to produce gold doré bars.
18.3.2.9 Carbon reactivation
The barren carbon is transferred from the elution column via the carbon dewatering screen to a feed bin above the carbon reactivation kiln. After draining for at least one hour, carbon is reactivated at 700 °C through a horizontal gas fired reactivation kiln and return.
18.3.3 Plant Capital Expenditure (CAPEX) for Construction
For this estimation, costs from other similar projects (data bank) and direct vendor quotations were used. A detailed equipment list was prepared. Table Table 18-28 shows the summary of the CAPEX.
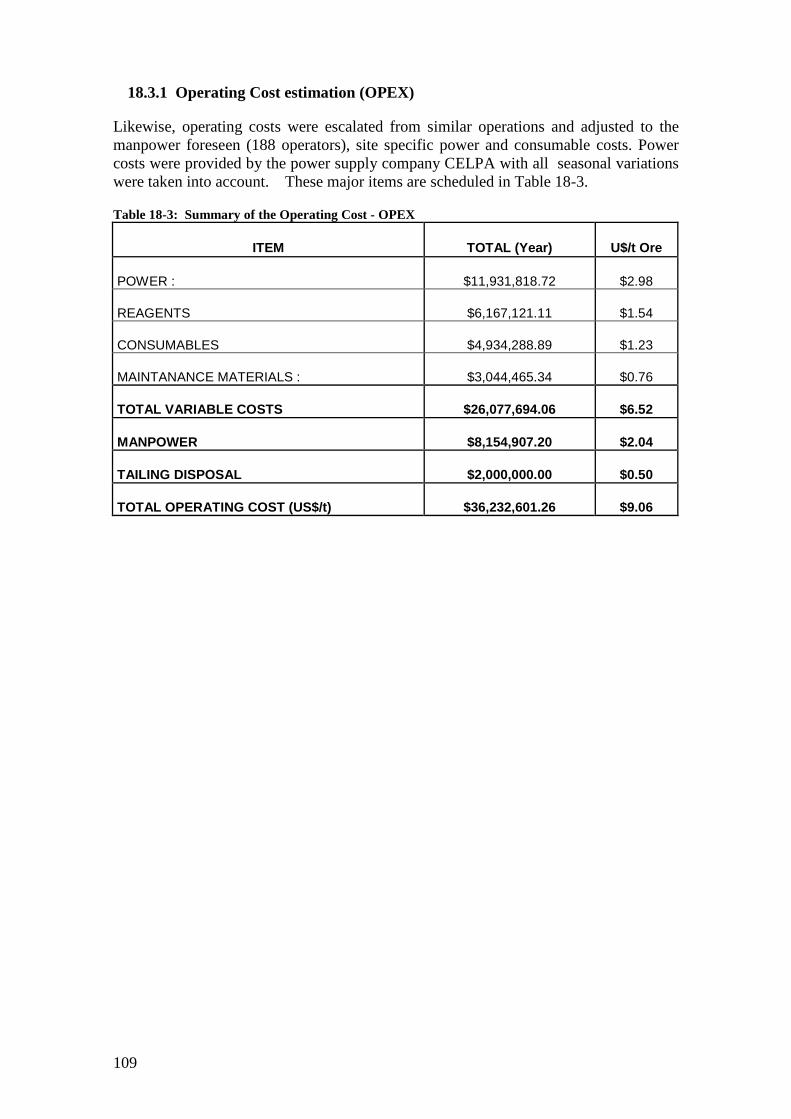
109
18.3.1 Operating Cost estimation (OPEX)
Likewise, operating costs were escalated from similar operations and adjusted to the manpower foreseen (188 operators), site specific power and consumable costs. Power costs were provided by the power supply company CELPA with all seasonal variations were taken into account. These major items are scheduled in Table 18-3.
Table 18-3: Summary of the Operating Cost - OPEX
ITEM TOTAL (Year) U$/t Ore
POWER : $11,931,818.72 $2.98
REAGENTS $6,167,121.11 $1.54
CONSUMABLES $4,934,288.89 $1.23
MAINTANANCE MATERIALS : $3,044,465.34 $0.76
TOTAL VARIABLE COSTS $26,077,694.06 $6.52
MANPOWER $8,154,907.20 $2.04
TAILING DISPOSAL $2,000,000.00 $0.50
TOTAL OPERATING COST (US$/t) $36,232,601.26 $9.06
110
18.4 GEOTECHNICAL
Golder’s Associates reviewed the available data to assess the reasonableness of the slope designs, and the potential for steeper slopes. No site visit or detail investigation was performed, being the following assessment and conclusions drawn from documentation made available by Brazauro. This study is dated of January 2010.
18.4.1 Stability assessment
There is no subsurface structural or strength data to provide a quantitative assessment of slope stability. Golder’s assessment is therefore based on the general geological characterization that suggests:
• The Andesite cap will be mined out and is not a slope stability issue • The Regolith (Laterite/Saprolite/Saprock) is up to 50 m thick, but may be thinner
at the pit crest • Groundwater is expected to be close to the ground surface and to saturate the
Saprolite at least seasonally in areas of lower topographic elevation • The indicated rock quality is Good, and for the moderate slope heights proposed
there does not appear to be a significant risk of rock mass failure • No large-scale structures that could potentially control large-scale slope stability
have been identified • Core photographs suggest that there is systematic structure within the competent
bedrock that could potentially control bench-scale and multi-bench stability, but its orientation has not been documented
• Surface mapping indicates that structure is predominantly steeply-dipping, which is consistent with the geological setting
• Steeply-dipping joints and other structure would be favorable for slope stability, but at present we have not seen any subsurface structural data to support this assumption; such favorable structural conditions must be verified by factual data to support a
• Defensible pit slope design • There is no significant clay alteration affecting mechanical characteristics • The geotechnical characteristics of the waste rock that will form the pit slopes is
assumed to be similar to the ore and representative core photographs, although alteration zoning and structural preparation in advance of mineralization can often result in substantially different characteristics of ore and waste
18.4.2 CONCLUSIONS
• No geotechnical strength or subsurface structural data has been provided to support the pit slope design assumptions of the Preliminary Assessment
• Slope stability in Laterite, Saprolite, and Saprock will be sensitive to slope height; slope designs through these units should be based on strength testing and engineering analyses, and should incorporate erosion protection and slope depressurization designs
111
• Maximizing slope angles in Regolith units will require effective de-pressurization
• Current slope designs in Regolith units are optimistic for wet slopes up to 50 m high
• The design catch bench width of 5.8 m is narrow, and the design batter angle of 75 degrees is steep by usual standards, implying very good blasting and operating practices to produce steep and stable bench faces
• The slope design assumptions imply good quality rock with no structural control of benchscale or larger slope stability in addition to very good operating practices
• The design inter-ramp slope angle is typical and reasonable for pit slopes developed in good quality rock without structural control of bench-scale and larger stability, and where good perimeter blasting practices are implemented
• Steeper bedrock slope angles may be feasible for the quality of the rock and the favorable structural conditions currently indicated, and inter-ramp slope designs up to 55 degrees could be used for sensitivity analyses, but such steeper slope angles should not be used as a basis for defensible economic analyses until supporting factual strength, structural, and rock quality data are available in a geotechnical model that accounts for spatial variability and geological controls of rock quality
• Steep inter-ramp slopes in excess of 55 degrees have been developed at some mining operations under highly favorable geological conditions with excellent operating practices as part of slope optimization processes, and may be feasible at Tocantinzinho, but such aggressive slope designs are only warranted based on reliably documented geological conditions and demonstrated operating practices that consistently produce steep, stable bench faces
• Sensitivity of competent bedrock slopes to groundwater pressures is unknown because potential failure mechanisms
112
18.5 MINING
A preliminary mine plan was developed for Tocantinzinho Gold Project to process 4.00 million tonnes of ore per year with a peak total material rate of 27.4 million tonnes per year and 13 years mine life. Run of mine (ROM) ore transported by haul trucks to the crusher circuit at the process plant where the mineral will be treated in a standard gold extraction and recovery plant. The mine is scheduled to work seven days per week, 365 days per year. Each day will consist of three 8-hour shifts. Four mining crews will cover the operation. Included in these operations will be conventional drilling, blasting, loading and hauling activities, as well as the supporting functions of dewatering, grade control and equipment maintenance.
The study is based on operating the Tocantinzinho mine with front end loaders of 11.5 cubic metre capacity and haul trucks each with a capacity of 90 tonnes in 10 metre passes, for ore and waste. This type of equipment is able to develop the required productivity to achieve an annual total material peak movement of 27.4 million tonnes and also have good mining selectivity with the minor excavators as defined by the grade control activities.
18.5.1 Pit Optimization and Mine Design
Whittle Four-X pit optimization software was applied in conjunction with Gemcom for the mining model preparation and actual optimization runs.
The economic parameters assume a nominal 4.00 million tonnes per year treatment plant throughput rate. This rate has been determined as optimal, based on the project’s potential mineral inventory, its capital requirements and operating cost profile.
Whittle Pit Optimization Model Construction
The Whittle Four-X model development was carried out using Gemcom software. Whittle Four-X uses the amount of metal in a block for assessment, rather than the block’s grade value. The process calculates the grade from the supplied tonnage and metal content, which are provided for each model block. The metal content for each block is calculated using the grade derived from the resource estimate.
Base Parameters
Table 18-4 summarises the base case economic parameters used for Whittle Four-X economic shells analysis and mine design.
The mining cost estimate for the pit optimization process incorporated information from NCL’s database of similar projects in Brazil. The estimated average life of project mining cost was separated into various components such as fuel, explosives, tyres, spare parts, salaries etc. according to similar current operations in Brazil. This resulted in the mining cost estimate of approximately US$ 1,36 per tonne shown in Table 18-4.
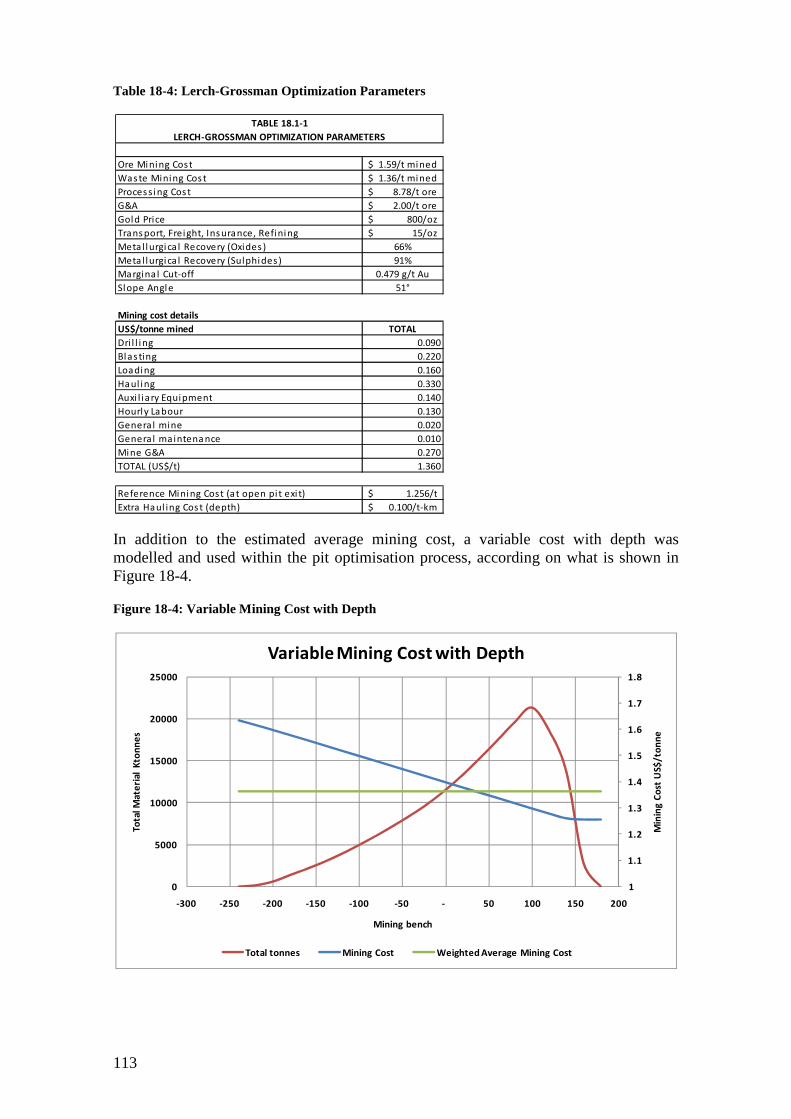
113
Table 18-4: Lerch-Grossman Optimization Parameters
In addition to the estimated average mining cost, a variable cost with depth was modelled and used within the pit optimisation process, according on what is shown in Figure 18-4.
Figure 18-4: Variable Mining Cost with Depth
Ore Mining Cos t 1.59/t mined$
Was te Mining Cos t 1.36/t mined$
Proces s ing Cos t 8.78/t ore$
G&A 2.00/t ore$
Gold Price 800/oz$
Trans port, Freight, Ins urance, Refining 15/oz$
Meta l lurgica l Recovery (Oxides ) 66%
Metal lurgica l Recovery (Sulphides ) 91%
Margina l Cut-off 0.479 g/t Au
Slope Angle 51°
Mining cost details
US$/tonne mined TOTAL
Dri l l ing 0.090
Blas ting 0.220
Loading 0.160
Haul ing 0.330
Auxi l iary Equipment 0.140
Hourly Labour 0.130
Genera l mine 0.020
Genera l maintena nce 0.010
Mine G&A 0.270
TOTAL (US$/t) 1.360
Reference Mining Cost (at open pi t exi t) 1.256/t$
Extra Haul ing Cos t (depth) 0.100/t-km$
TABLE 18.1-1
LERCH-GROSSMAN OPTIMIZATION PARAMETERS
1
1.1
1.2
1.3
1.4
1.5
1.6
1.7
1.8
0
5000
10000
15000
20000
25000
-300 -250 -200 -150 -100 -50 - 50 100 150 200
Min
ing
Co
st U
S$
/to
nn
e
To
tal
Ma
teri
al K
ton
ne
s
Mining bench
Variable Mining Cost with Depth
Total tonnes Mining Cost Weighted Average Mining Cost
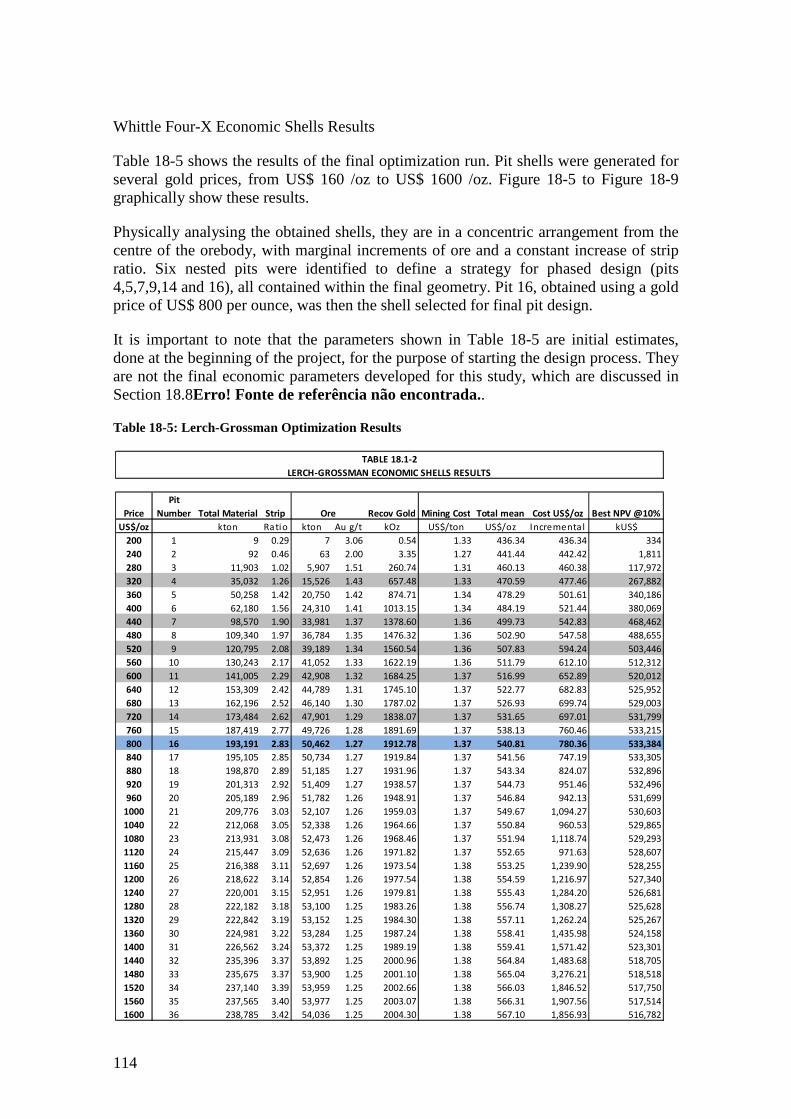
114
Whittle Four-X Economic Shells Results
Table 18-5 shows the results of the final optimization run. Pit shells were generated for several gold prices, from US$ 160 /oz to US$ 1600 /oz. Figure 18-5 to Figure 18-9 graphically show these results.
Physically analysing the obtained shells, they are in a concentric arrangement from the centre of the orebody, with marginal increments of ore and a constant increase of strip ratio. Six nested pits were identified to define a strategy for phased design (pits 4,5,7,9,14 and 16), all contained within the final geometry. Pit 16, obtained using a gold price of US$ 800 per ounce, was then the shell selected for final pit design.
It is important to note that the parameters shown in Table 18-5 are initial estimates, done at the beginning of the project, for the purpose of starting the design process. They are not the final economic parameters developed for this study, which are discussed in Section 18.8Erro! Fonte de referência não encontrada..
Table 18-5: Lerch-Grossman Optimization Results
Price Cost US$/oz Best NPV @10%
US$/oz kton Ratio kton Au g/t kOz US$/ton US$/oz Incremental kUS$
200 1 9 0.29 7 3.06 0.54 1.33 436.34 436.34 334
240 2 92 0.46 63 2.00 3.35 1.27 441.44 442.42 1,811
280 3 11,903 1.02 5,907 1.51 260.74 1.31 460.13 460.38 117,972
320 4 35,032 1.26 15,526 1.43 657.48 1.33 470.59 477.46 267,882
360 5 50,258 1.42 20,750 1.42 874.71 1.34 478.29 501.61 340,186
400 6 62,180 1.56 24,310 1.41 1013.15 1.34 484.19 521.44 380,069
440 7 98,570 1.90 33,981 1.37 1378.60 1.36 499.73 542.83 468,462
480 8 109,340 1.97 36,784 1.35 1476.32 1.36 502.90 547.58 488,655
520 9 120,795 2.08 39,189 1.34 1560.54 1.36 507.83 594.24 503,446
560 10 130,243 2.17 41,052 1.33 1622.19 1.36 511.79 612.10 512,312
600 11 141,005 2.29 42,908 1.32 1684.25 1.37 516.99 652.89 520,012
640 12 153,309 2.42 44,789 1.31 1745.10 1.37 522.77 682.83 525,952
680 13 162,196 2.52 46,140 1.30 1787.02 1.37 526.93 699.74 529,003
720 14 173,484 2.62 47,901 1.29 1838.07 1.37 531.65 697.01 531,799
760 15 187,419 2.77 49,726 1.28 1891.69 1.37 538.13 760.46 533,215
800 16 193,191 2.83 50,462 1.27 1912.78 1.37 540.81 780.36 533,384
840 17 195,105 2.85 50,734 1.27 1919.84 1.37 541.56 747.19 533,305
880 18 198,870 2.89 51,185 1.27 1931.96 1.37 543.34 824.07 532,896
920 19 201,313 2.92 51,409 1.27 1938.57 1.37 544.73 951.46 532,496
960 20 205,189 2.96 51,782 1.26 1948.91 1.37 546.84 942.13 531,699
1000 21 209,776 3.03 52,107 1.26 1959.03 1.37 549.67 1,094.27 530,603
1040 22 212,068 3.05 52,338 1.26 1964.66 1.37 550.84 960.53 529,865
1080 23 213,931 3.08 52,473 1.26 1968.46 1.37 551.94 1,118.74 529,293
1120 24 215,447 3.09 52,636 1.26 1971.82 1.37 552.65 971.63 528,607
1160 25 216,388 3.11 52,697 1.26 1973.54 1.38 553.25 1,239.90 528,255
1200 26 218,622 3.14 52,854 1.26 1977.54 1.38 554.59 1,216.97 527,340
1240 27 220,001 3.15 52,951 1.26 1979.81 1.38 555.43 1,284.20 526,681
1280 28 222,182 3.18 53,100 1.25 1983.26 1.38 556.74 1,308.27 525,628
1320 29 222,842 3.19 53,152 1.25 1984.30 1.38 557.11 1,262.24 525,267
1360 30 224,981 3.22 53,284 1.25 1987.24 1.38 558.41 1,435.98 524,158
1400 31 226,562 3.24 53,372 1.25 1989.19 1.38 559.41 1,571.42 523,301
1440 32 235,396 3.37 53,892 1.25 2000.96 1.38 564.84 1,483.68 518,705
1480 33 235,675 3.37 53,900 1.25 2001.10 1.38 565.04 3,276.21 518,518
1520 34 237,140 3.39 53,959 1.25 2002.66 1.38 566.03 1,846.52 517,750
1560 35 237,565 3.40 53,977 1.25 2003.07 1.38 566.31 1,907.56 517,514
1600 36 238,785 3.42 54,036 1.25 2004.30 1.38 567.10 1,856.93 516,782
Total mean
TABLE 18.1-2
LERCH-GROSSMAN ECONOMIC SHELLS RESULTS
Pit
Number Total Material Strip Ore Recov Gold Mining Cost
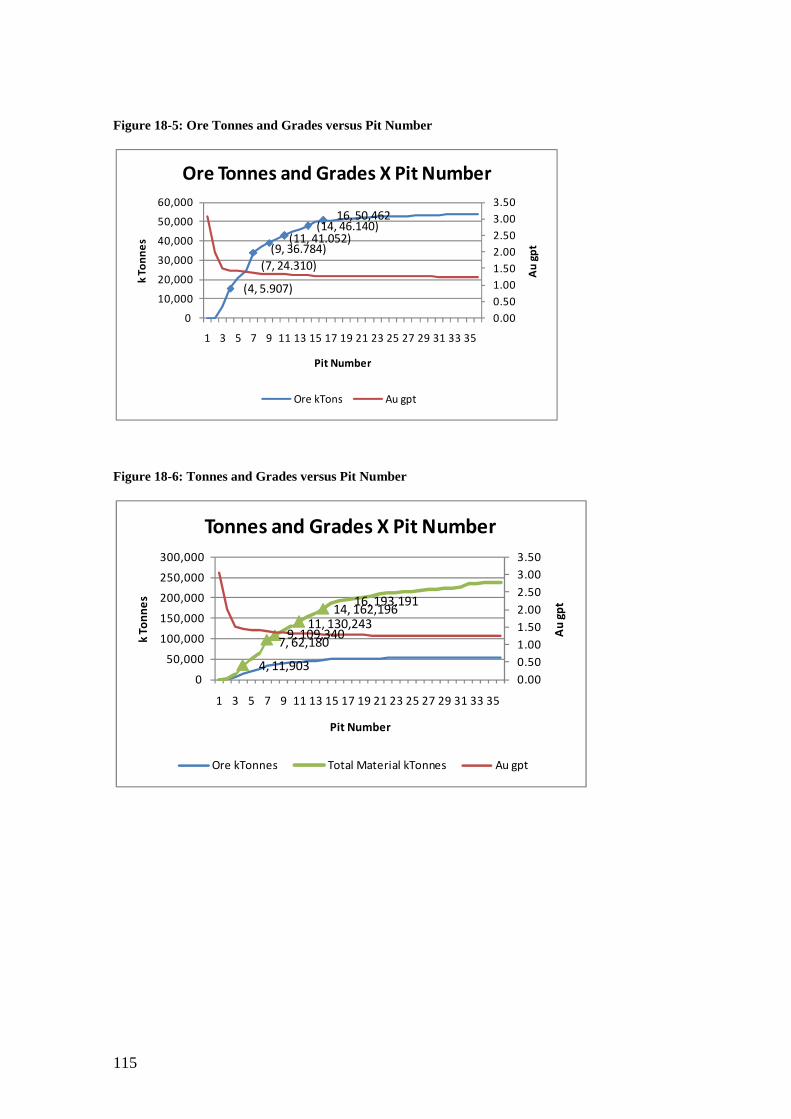
115
Figure 18-5: Ore Tonnes and Grades versus Pit Number
Figure 18-6: Tonnes and Grades versus Pit Number
(4, 5.907)
(9, 36.784)(11, 41.052)
(14, 46.140)16, 50,462
(7, 24.310)
0.00
0.50
1.00
1.50
2.00
2.50
3.00
3.50
0
10,000
20,000
30,000
40,000
50,000
60,000
1 3 5 7 9 11 13 15 17 19 21 23 25 27 29 31 33 35
Au
gp
t
k To
nn
es
Pit Number
Ore Tonnes and Grades X Pit Number
Ore kTons Au gpt
4, 11,903
7, 62,1809, 109,340
11, 130,24314, 162,196
16, 193,191
0.00
0.50
1.00
1.50
2.00
2.50
3.00
3.50
0
50,000
100,000
150,000
200,000
250,000
300,000
1 3 5 7 9 11 13 15 17 19 21 23 25 27 29 31 33 35
Au
gp
t
k To
nn
es
Pit Number
Tonnes and Grades X Pit Number
Ore kTonnes Total Material kTonnes Au gpt
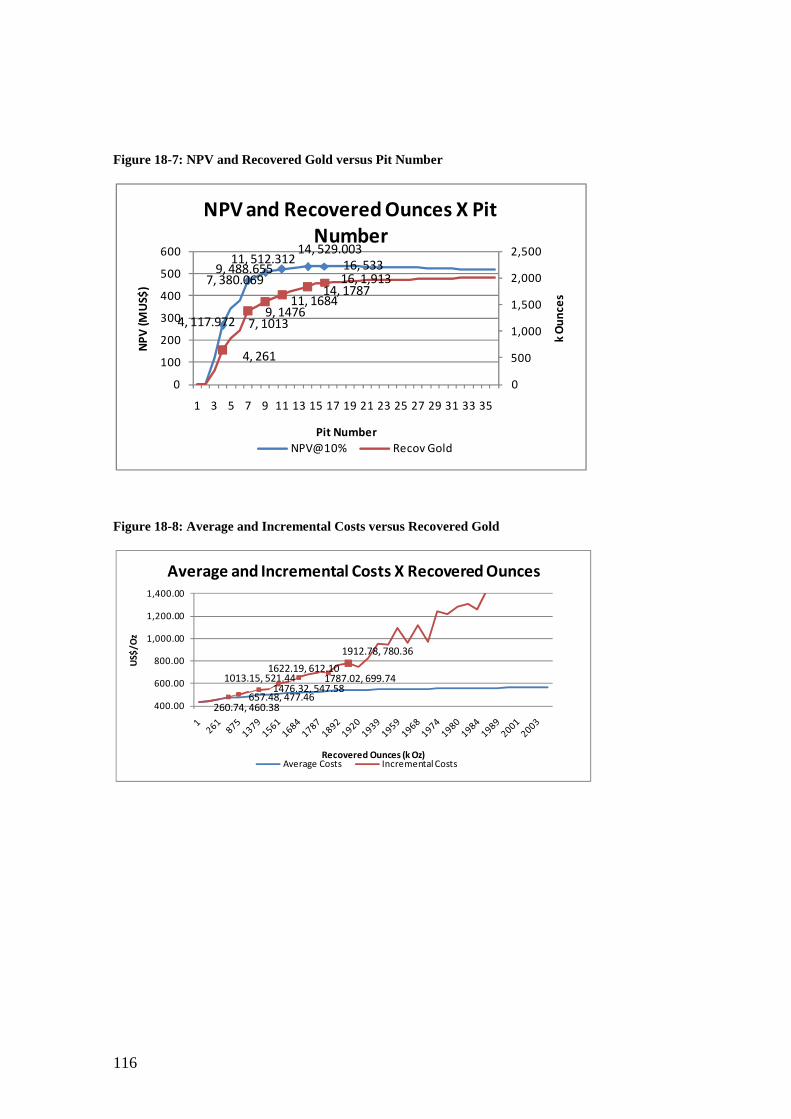
116
Figure 18-7: NPV and Recovered Gold versus Pit Number
Figure 18-8: Average and Incremental Costs versus Recovered Gold
4, 117.972
7, 380.0699, 488.655
11, 512.31214, 529.003
16, 533
4, 261
7, 10139, 1476
11, 168414, 1787
16, 1,913
0
500
1,000
1,500
2,000
2,500
0
100
200
300
400
500
600
1 3 5 7 9 11 13 15 17 19 21 23 25 27 29 31 33 35
k O
un
ces
NP
V (M
US$
)
Pit Number
NPV and Recovered Ounces X Pit
Number
NPV@10% Recov Gold
260.74, 460.38657.48, 477.46
1013.15, 521.441476.32, 547.58
1622.19, 612.101787.02, 699.74
1912.78, 780.36
400.00
600.00
800.00
1,000.00
1,200.00
1,400.00
US$
/Oz
Recovered Ounces (k Oz)
Average and Incremental Costs X Recovered Ounces
Average Costs Incremental Costs
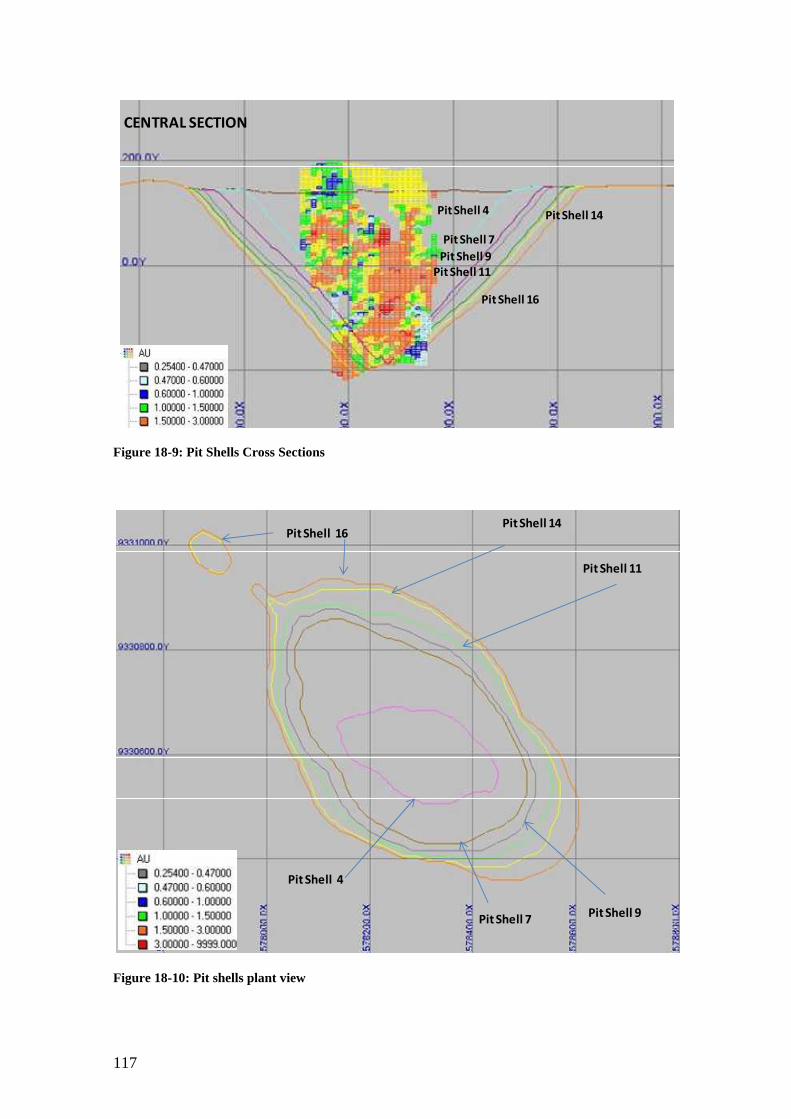
117
Figure 18-9: Pit Shells Cross Sections
Figure 18-10: Pit shells plant view
CENTRAL SECTION
Pit Shell 16
Pit Shell 7
Pit Shell 11
Pit Shell 9
Pit Shell 4 Pit Shell 14
Pit Shell 16
Pit Shell 4
Pit Shell 7
Pit Shell 14
Pit Shell 9
Pit Shell 11
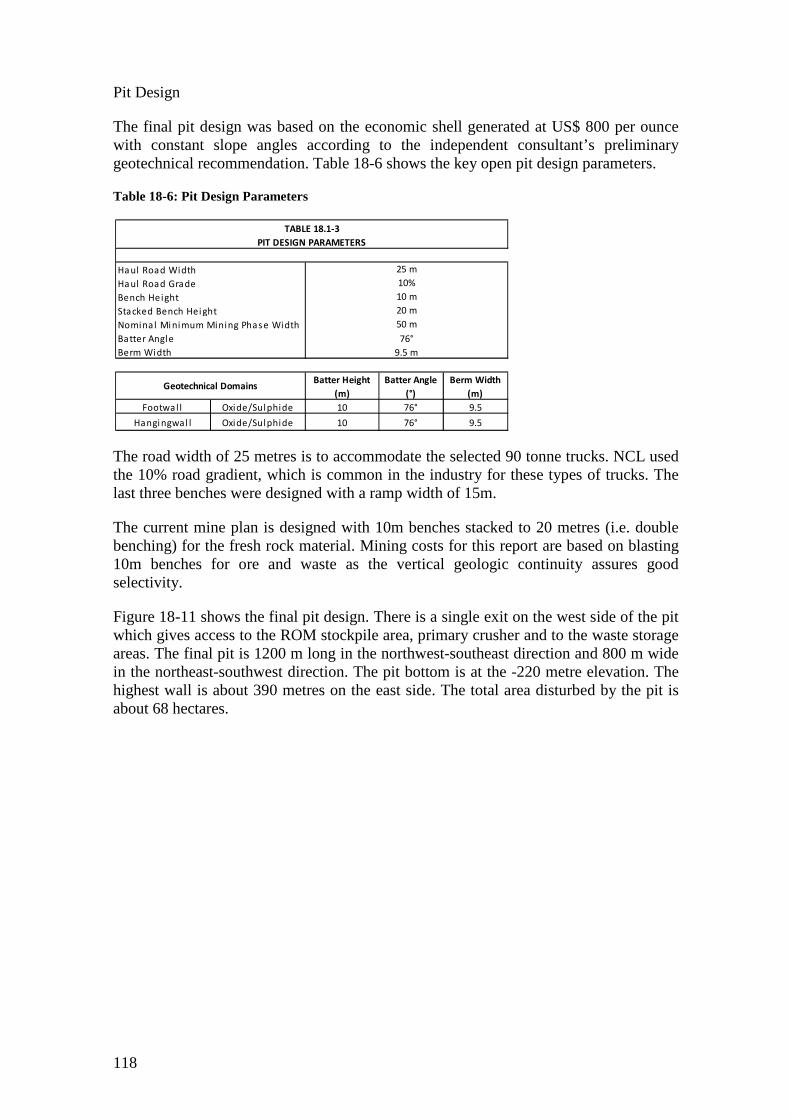
118
Pit Design
The final pit design was based on the economic shell generated at US$ 800 per ounce with constant slope angles according to the independent consultant’s preliminary geotechnical recommendation. Table 18-6 shows the key open pit design parameters.
Table 18-6: Pit Design Parameters
The road width of 25 metres is to accommodate the selected 90 tonne trucks. NCL used the 10% road gradient, which is common in the industry for these types of trucks. The last three benches were designed with a ramp width of 15m.
The current mine plan is designed with 10m benches stacked to 20 metres (i.e. double benching) for the fresh rock material. Mining costs for this report are based on blasting 10m benches for ore and waste as the vertical geologic continuity assures good selectivity.
Figure 18-11 shows the final pit design. There is a single exit on the west side of the pit which gives access to the ROM stockpile area, primary crusher and to the waste storage areas. The final pit is 1200 m long in the northwest-southeast direction and 800 m wide in the northeast-southwest direction. The pit bottom is at the -220 metre elevation. The highest wall is about 390 metres on the east side. The total area disturbed by the pit is about 68 hectares.
Batter Height
(m)
Batter Angle
(°)
Berm Width
(m)
Footwal l Oxide/Sulphide 10 76° 9.5
Hangi ngwal l Oxide/Sulphide 10 76° 9.5
Geotechnical Domains
TABLE 18.1-3
PIT DESIGN PARAMETERS
20 m
50 m
76°
9.5 m
25 m
10%
10 m
Ha ul Road Width
Ha ul Road Grade
Bench Height
Stacked Bench Hei ght
Nominal Mi nimum Mining Phase Width
Batter Angle
Berm Width
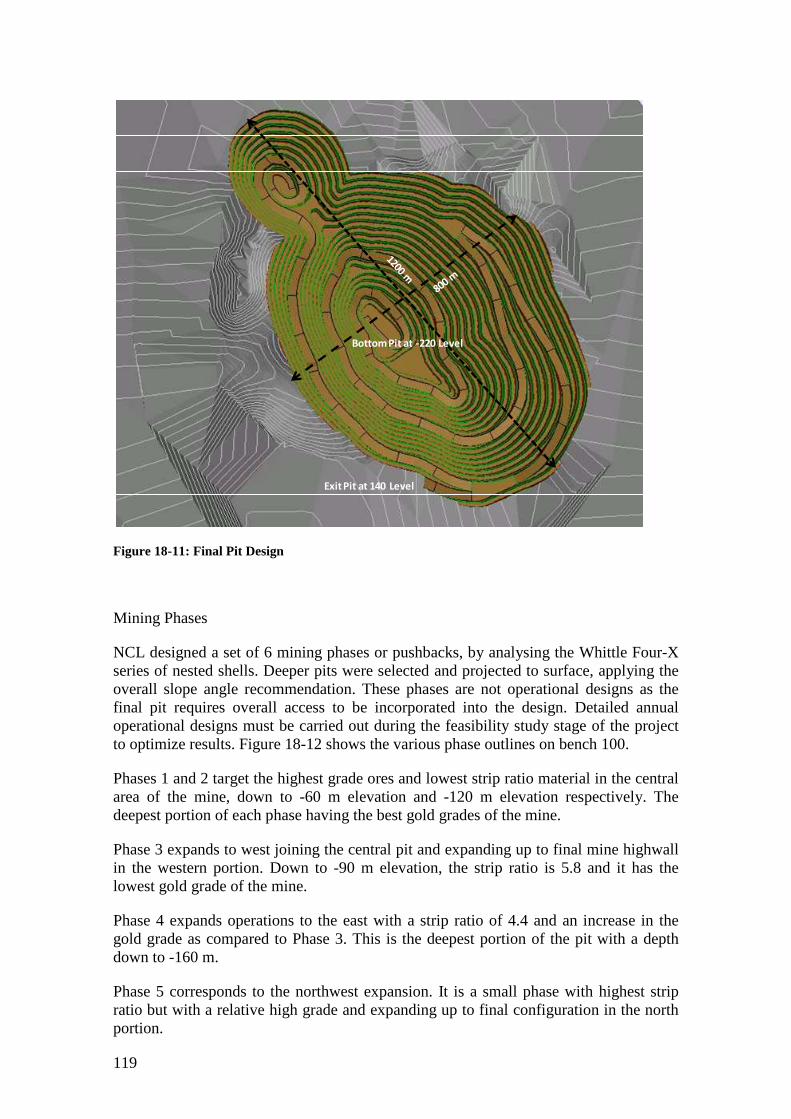
119
Figure 18-11: Final Pit Design
Mining Phases
NCL designed a set of 6 mining phases or pushbacks, by analysing the Whittle Four-X series of nested shells. Deeper pits were selected and projected to surface, applying the overall slope angle recommendation. These phases are not operational designs as the final pit requires overall access to be incorporated into the design. Detailed annual operational designs must be carried out during the feasibility study stage of the project to optimize results. Figure 18-12 shows the various phase outlines on bench 100.
Phases 1 and 2 target the highest grade ores and lowest strip ratio material in the central area of the mine, down to -60 m elevation and -120 m elevation respectively. The deepest portion of each phase having the best gold grades of the mine.
Phase 3 expands to west joining the central pit and expanding up to final mine highwall in the western portion. Down to -90 m elevation, the strip ratio is 5.8 and it has the lowest gold grade of the mine.
Phase 4 expands operations to the east with a strip ratio of 4.4 and an increase in the gold grade as compared to Phase 3. This is the deepest portion of the pit with a depth down to -160 m.
Phase 5 corresponds to the northwest expansion. It is a small phase with highest strip ratio but with a relative high grade and expanding up to final configuration in the north portion.
Bottom Pit at -220 Level
Exit Pit at 140 Level

120
Phase 6 corresponds to the final eastern expansion and deepens the mine to the final configuration at -210m elevation. This phase has the highest strip ratio and a significant amount of ounces contained.
Figure 18-12: Mining Phases on Bench 100
18.5.2 Pit Contained Resources
Table 18-7 summarises the contained resources for the final pit for lithology and category, and Table 18-8 is for the individual mining phases. The tables include measured, indicated and inferred resources using the updated November 2009 block model.
According to the cautionary statement required by NI 43-101, it should be noted that this assessment is preliminary in nature since it includes inferred mineral resources that cannot be categorized as reserves at this time and as such there is no certainty that the preliminary assessment and economics will be realized.
Phase 1
Phase 5
Phase 6
Phase 4
Phase 3Phase 2
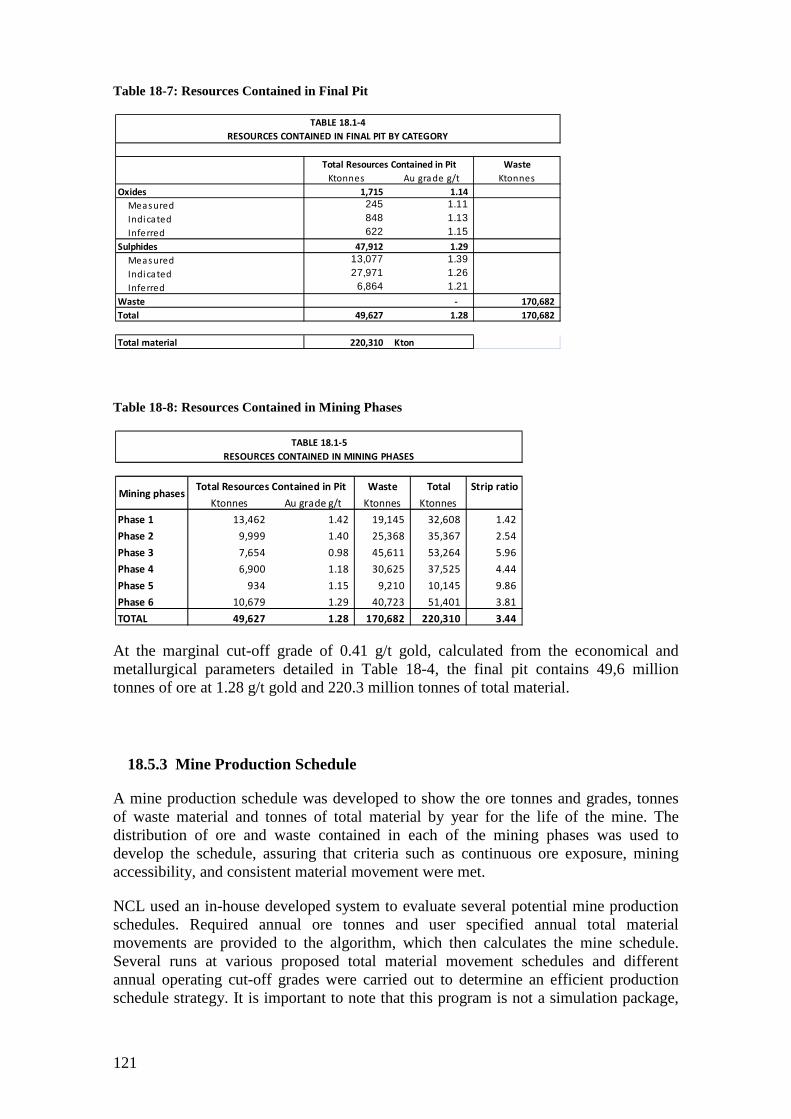
121
Table 18-7: Resources Contained in Final Pit
Table 18-8: Resources Contained in Mining Phases
At the marginal cut-off grade of 0.41 g/t gold, calculated from the economical and metallurgical parameters detailed in Table 18-4, the final pit contains 49,6 million tonnes of ore at 1.28 g/t gold and 220.3 million tonnes of total material.
18.5.3 Mine Production Schedule
A mine production schedule was developed to show the ore tonnes and grades, tonnes of waste material and tonnes of total material by year for the life of the mine. The distribution of ore and waste contained in each of the mining phases was used to develop the schedule, assuring that criteria such as continuous ore exposure, mining accessibility, and consistent material movement were met.
NCL used an in-house developed system to evaluate several potential mine production schedules. Required annual ore tonnes and user specified annual total material movements are provided to the algorithm, which then calculates the mine schedule. Several runs at various proposed total material movement schedules and different annual operating cut-off grades were carried out to determine an efficient production schedule strategy. It is important to note that this program is not a simulation package,
Waste
Ktonnes Au gra de g/t Ktonnes
Oxides 1,715 1.14
Measured 245 1.11
Indi cated 848 1.13
Inferred 622 1.15
Sulphides 47,912 1.29
Measured 13,077 1.39
Indi cated 27,971 1.26
Inferred 6,864 1.21
Waste - 170,682
Total 49,627 1.28 170,682
Total material 220,310 Kton
Total Resources Contained in Pit
TABLE 18.1-4
RESOURCES CONTAINED IN FINAL PIT BY CATEGORY
Waste Total Strip ratio
Ktonnes Au grade g/t Ktonnes Ktonnes
Phase 1 13,462 1.42 19,145 32,608 1.42
Phase 2 9,999 1.40 25,368 35,367 2.54
Phase 3 7,654 0.98 45,611 53,264 5.96
Phase 4 6,900 1.18 30,625 37,525 4.44
Phase 5 934 1.15 9,210 10,145 9.86
Phase 6 10,679 1.29 40,723 51,401 3.81
TOTAL 49,627 1.28 170,682 220,310 3.44
Mining phasesTotal Resources Contained in Pit
TABLE 18.1-5
RESOURCES CONTAINED IN MINING PHASES

122
but rather a tool for calculating the mine schedule and haulage profiles for a given set of phases and constraints that must be set by the user.
The mine plan developed by NCL includes a 3% factor to account for dilution, applied directly to the in situ grades. This criteria means that 3% of the plant feed is exchanged in the mine by waste with no grade, because of mining practices. The low value is because of the massive expression of the ore zones.
Mining recovery has been set to 97%. This is to allow for ore loss as a result of blasting, edge effects of cutbacks and wedges of potential mill feed left as a function of bench face advancement with pit depth.
Ore control efforts will require taking advantage of all the experience of selective mining to assure the ore classes are properly defined and extracted. These efforts should include the following standard procedures:
Implement an intense and systematic program of sampling, mapping, laboratory analyses, and reporting.
Utilize specialized in-pit, bench sampling drills for sampling well ahead of production drilling and blasting.
Use small excavators and benches no higher than 6 metres (as presently planned) to selectively mine ore zones.
Maintain top laboratory staff, equipment, and procedures to provide accurate and timely assay reporting.
Utilize trained geologists and technicians to work with excavator operators in identifying, marking, and selectively mining and dispatching crusher ore, ROM, and waste.
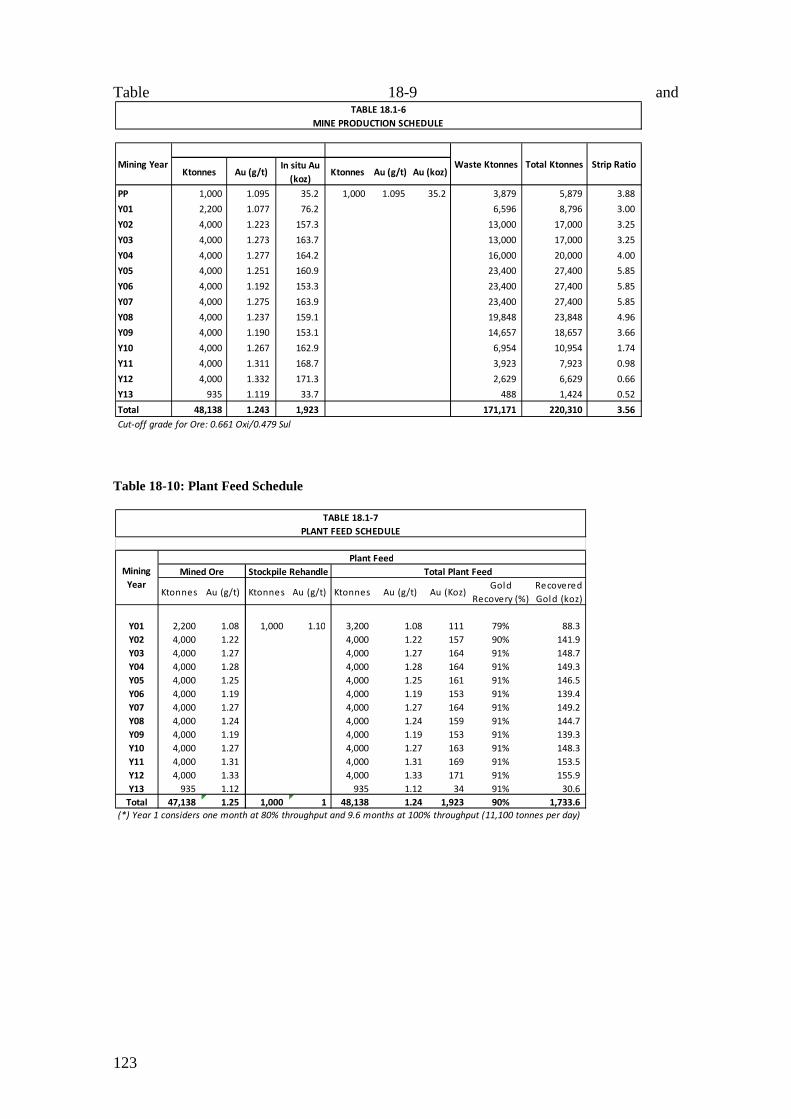
123
Table 18-9 and
Table 18-10: Plant Feed Schedule
Ktonnes Au (g/t)In situ Au
(koz)Ktonnes Au (g/t) Au (koz)
PP 1,000 1.095 35.2 1,000 1.095 35.2 3,879 5,879 3.88
Y01 2,200 1.077 76.2 6,596 8,796 3.00
Y02 4,000 1.223 157.3 13,000 17,000 3.25
Y03 4,000 1.273 163.7 13,000 17,000 3.25
Y04 4,000 1.277 164.2 16,000 20,000 4.00
Y05 4,000 1.251 160.9 23,400 27,400 5.85
Y06 4,000 1.192 153.3 23,400 27,400 5.85
Y07 4,000 1.275 163.9 23,400 27,400 5.85
Y08 4,000 1.237 159.1 19,848 23,848 4.96
Y09 4,000 1.190 153.1 14,657 18,657 3.66
Y10 4,000 1.267 162.9 6,954 10,954 1.74
Y11 4,000 1.311 168.7 3,923 7,923 0.98
Y12 4,000 1.332 171.3 2,629 6,629 0.66
Y13 935 1.119 33.7 488 1,424 0.52
Total 48,138 1.243 1,923 171,171 220,310 3.56
Cut-off grade for Ore: 0.661 Oxi/0.479 Sul
TABLE 18.1-6
MINE PRODUCTION SCHEDULE
Mining Year Total Ktonnes Strip RatioWaste Ktonnes
Ktonnes Au (g/t) Ktonnes Au (g/t) Ktonnes Au (g/t) Au (Koz)Gold
Recovery (%)
Recovered
Gold (koz)
Y01 2,200 1.08 1,000 1.10 3,200 1.08 111 79% 88.3
Y02 4,000 1.22 4,000 1.22 157 90% 141.9
Y03 4,000 1.27 4,000 1.27 164 91% 148.7
Y04 4,000 1.28 4,000 1.28 164 91% 149.3
Y05 4,000 1.25 4,000 1.25 161 91% 146.5
Y06 4,000 1.19 4,000 1.19 153 91% 139.4
Y07 4,000 1.27 4,000 1.27 164 91% 149.2
Y08 4,000 1.24 4,000 1.24 159 91% 144.7
Y09 4,000 1.19 4,000 1.19 153 91% 139.3
Y10 4,000 1.27 4,000 1.27 163 91% 148.3
Y11 4,000 1.31 4,000 1.31 169 91% 153.5
Y12 4,000 1.33 4,000 1.33 171 91% 155.9
Y13 935 1.12 935 1.12 34 91% 30.6
Total 47,138 1.25 1,000 1 48,138 1.24 1,923 90% 1,733.6
(*) Year 1 considers one month at 80% throughput and 9.6 months at 100% throughput (11,100 tonnes per day)
Mining
Year
TABLE 18.1-7
PLANT FEED SCHEDULE
Mined Ore Stockpile Rehandle
Plant Feed
Total Plant Feed

124
Figure 18-13: Total mine schedule by mining phases
Figure 18-14: Waste mine schedule by mining phases
-
0.20
0.40
0.60
0.80
1.00
1.20
1.40
-
5,000
10,000
15,000
20,000
25,000
30,000
PP Y01 Y02 Y03 Y04 Y05 Y06 Y07 Y08 Y09 Y10 Y11 Y12 Y13
Au
gra
de
g/t
Tota
l mat
eri
al k
ton
ne
s
Period
Total Mine Schedule
Ore Waste Au
PP Y01 Y02 Y03 Y04 Y05 Y06 Y07 Y08 Y09 Y10 Y11 Y12 Y13
F01 4,87 6,59 5,99 1,67 313 60 31 - - - - - - -
F02 - - 5,04 8,12 5,66 3,47 1,65 1,29 339 74 - - - -
F03 - - 1,96 3,19 10,0 11,7 8,25 2,64 5,23 2,81 - - - -
F04 - - - - - 4,86 6,89 9,99 3,67 3,21 1,41 781 - -
F05 - - - - - 3,28 1,19 3,29 1,45 13 - - - -
F06 - - - - - - 5,37 6,17 9,15 8,54 5,54 3,14 2,62 488
-
5,000
10,000
15,000
20,000
25,000
Tota
l mat
eri
al K
ton
ne
s
Waste Mine Schedule by Mining Phases
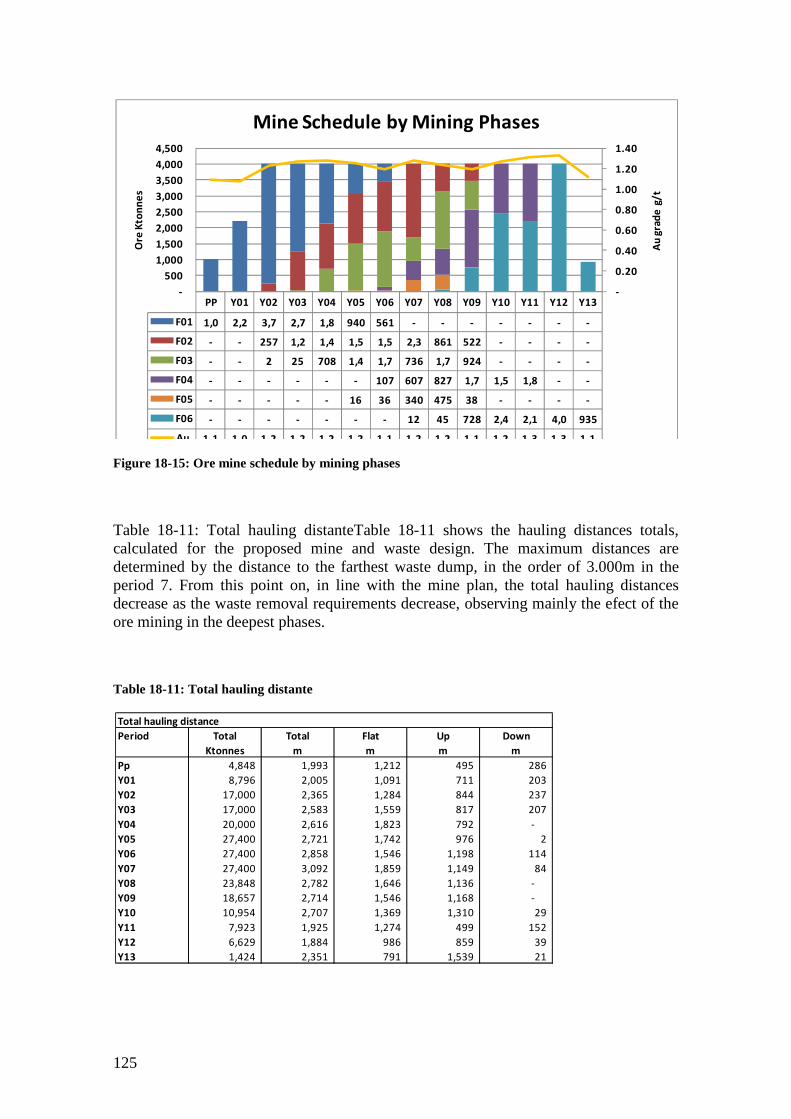
125
Figure 18-15: Ore mine schedule by mining phases
Table 18-11: Total hauling distanteTable 18-11 shows the hauling distances totals, calculated for the proposed mine and waste design. The maximum distances are determined by the distance to the farthest waste dump, in the order of 3.000m in the period 7. From this point on, in line with the mine plan, the total hauling distances decrease as the waste removal requirements decrease, observing mainly the efect of the ore mining in the deepest phases.
Table 18-11: Total hauling distante
PP Y01 Y02 Y03 Y04 Y05 Y06 Y07 Y08 Y09 Y10 Y11 Y12 Y13
F01 1,0 2,2 3,7 2,7 1,8 940 561 - - - - - - -
F02 - - 257 1,2 1,4 1,5 1,5 2,3 861 522 - - - -
F03 - - 2 25 708 1,4 1,7 736 1,7 924 - - - -
F04 - - - - - - 107 607 827 1,7 1,5 1,8 - -
F05 - - - - - 16 36 340 475 38 - - - -
F06 - - - - - - - 12 45 728 2,4 2,1 4,0 935
Au 1.1 1.0 1.2 1.2 1.2 1.2 1.1 1.2 1.2 1.1 1.2 1.3 1.3 1.1
-
0.20
0.40
0.60
0.80
1.00
1.20
1.40
-
500
1,000
1,500
2,000
2,500
3,000
3,500
4,000
4,500
Au
gra
de
g/
t
Ore
Kto
nn
es
Mine Schedule by Mining Phases
Total hauling distance
Period Total Total Flat Up Down
Ktonnes m m m m
Pp 4,848 1,993 1,212 495 286
Y01 8,796 2,005 1,091 711 203
Y02 17,000 2,365 1,284 844 237
Y03 17,000 2,583 1,559 817 207
Y04 20,000 2,616 1,823 792 -
Y05 27,400 2,721 1,742 976 2
Y06 27,400 2,858 1,546 1,198 114
Y07 27,400 3,092 1,859 1,149 84
Y08 23,848 2,782 1,646 1,136 -
Y09 18,657 2,714 1,546 1,168 -
Y10 10,954 2,707 1,369 1,310 29
Y11 7,923 1,925 1,274 499 152
Y12 6,629 1,884 986 859 39
Y13 1,424 2,351 791 1,539 21
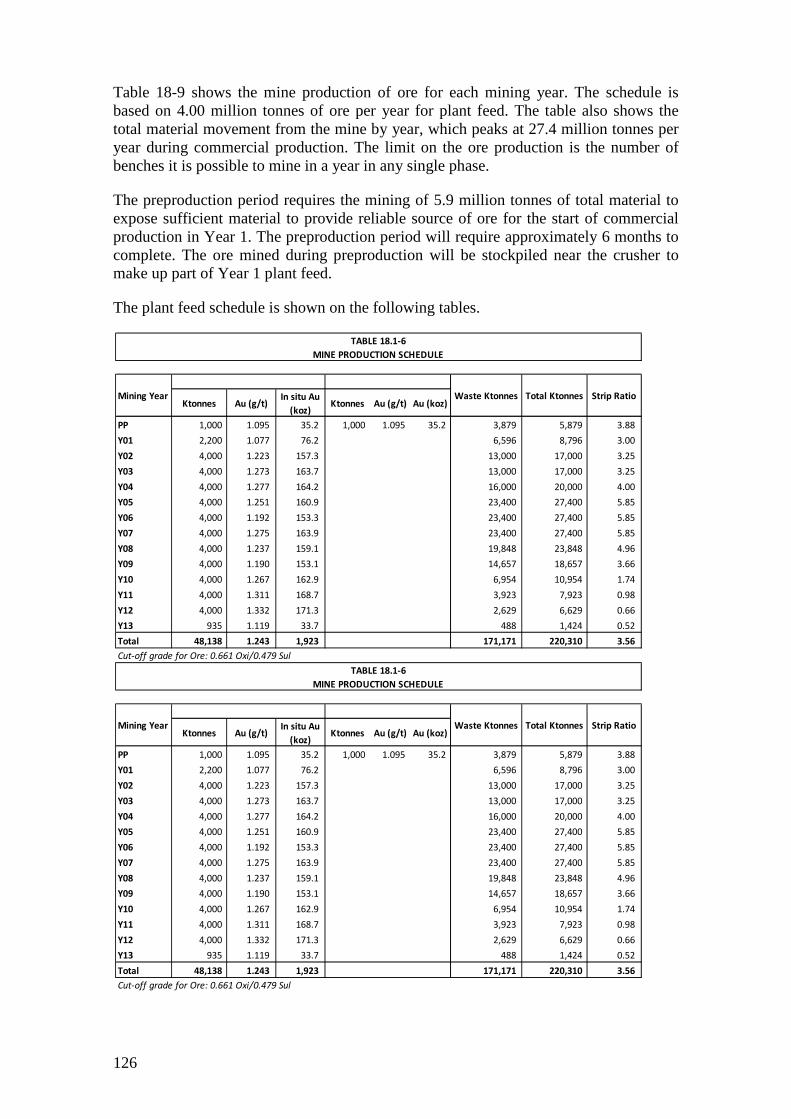
126
Table 18-9 shows the mine production of ore for each mining year. The schedule is based on 4.00 million tonnes of ore per year for plant feed. The table also shows the total material movement from the mine by year, which peaks at 27.4 million tonnes per year during commercial production. The limit on the ore production is the number of benches it is possible to mine in a year in any single phase.
The preproduction period requires the mining of 5.9 million tonnes of total material to expose sufficient material to provide reliable source of ore for the start of commercial production in Year 1. The preproduction period will require approximately 6 months to complete. The ore mined during preproduction will be stockpiled near the crusher to make up part of Year 1 plant feed.
The plant feed schedule is shown on the following tables.
Ktonnes Au (g/t)In situ Au
(koz)Ktonnes Au (g/t) Au (koz)
PP 1,000 1.095 35.2 1,000 1.095 35.2 3,879 5,879 3.88
Y01 2,200 1.077 76.2 6,596 8,796 3.00
Y02 4,000 1.223 157.3 13,000 17,000 3.25
Y03 4,000 1.273 163.7 13,000 17,000 3.25
Y04 4,000 1.277 164.2 16,000 20,000 4.00
Y05 4,000 1.251 160.9 23,400 27,400 5.85
Y06 4,000 1.192 153.3 23,400 27,400 5.85
Y07 4,000 1.275 163.9 23,400 27,400 5.85
Y08 4,000 1.237 159.1 19,848 23,848 4.96
Y09 4,000 1.190 153.1 14,657 18,657 3.66
Y10 4,000 1.267 162.9 6,954 10,954 1.74
Y11 4,000 1.311 168.7 3,923 7,923 0.98
Y12 4,000 1.332 171.3 2,629 6,629 0.66
Y13 935 1.119 33.7 488 1,424 0.52
Total 48,138 1.243 1,923 171,171 220,310 3.56
Cut-off grade for Ore: 0.661 Oxi/0.479 Sul
TABLE 18.1-6
MINE PRODUCTION SCHEDULE
Mining Year Total Ktonnes Strip RatioWaste Ktonnes
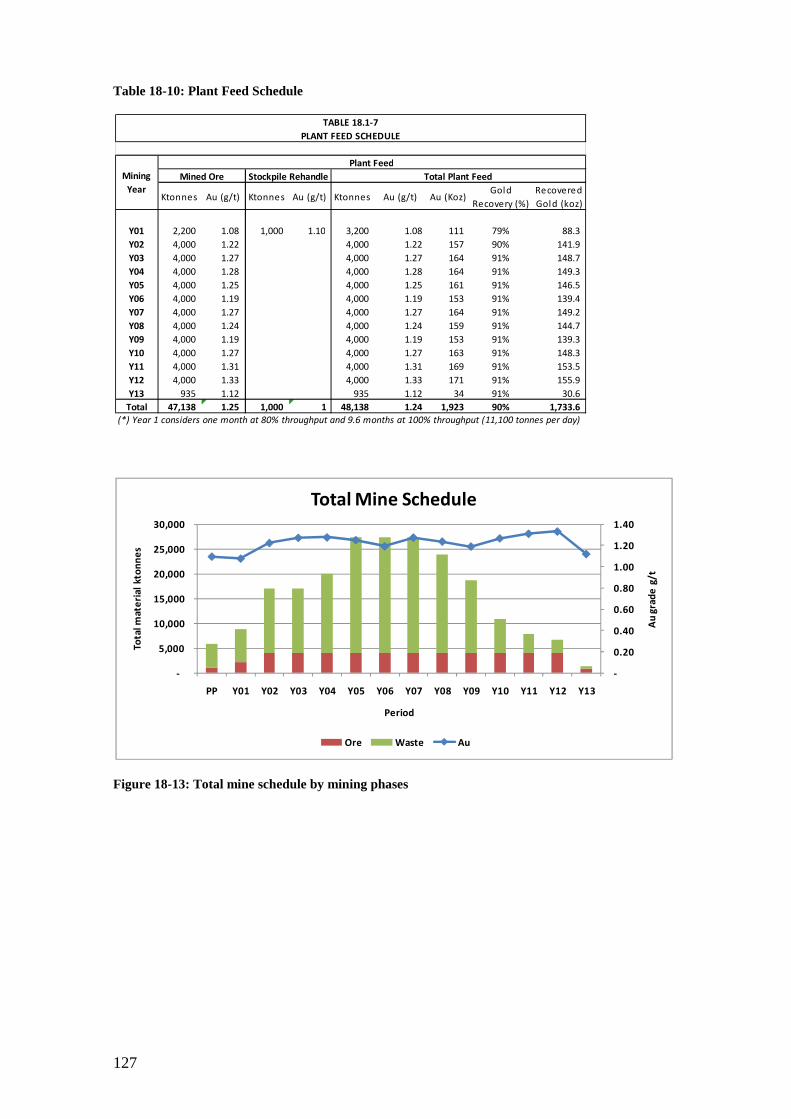
127
Table 18-10: Plant Feed Schedule
Figure 18-13: Total mine schedule by mining phases
Ktonnes Au (g/t) Ktonnes Au (g/t) Ktonnes Au (g/t) Au (Koz)Gold
Recovery (%)
Recovered
Gold (koz)
Y01 2,200 1.08 1,000 1.10 3,200 1.08 111 79% 88.3
Y02 4,000 1.22 4,000 1.22 157 90% 141.9
Y03 4,000 1.27 4,000 1.27 164 91% 148.7
Y04 4,000 1.28 4,000 1.28 164 91% 149.3
Y05 4,000 1.25 4,000 1.25 161 91% 146.5
Y06 4,000 1.19 4,000 1.19 153 91% 139.4
Y07 4,000 1.27 4,000 1.27 164 91% 149.2
Y08 4,000 1.24 4,000 1.24 159 91% 144.7
Y09 4,000 1.19 4,000 1.19 153 91% 139.3
Y10 4,000 1.27 4,000 1.27 163 91% 148.3
Y11 4,000 1.31 4,000 1.31 169 91% 153.5
Y12 4,000 1.33 4,000 1.33 171 91% 155.9
Y13 935 1.12 935 1.12 34 91% 30.6
Total 47,138 1.25 1,000 1 48,138 1.24 1,923 90% 1,733.6
(*) Year 1 considers one month at 80% throughput and 9.6 months at 100% throughput (11,100 tonnes per day)
Mining
Year
TABLE 18.1-7
PLANT FEED SCHEDULE
Mined Ore Stockpile Rehandle
Plant Feed
Total Plant Feed
-
0.20
0.40
0.60
0.80
1.00
1.20
1.40
-
5,000
10,000
15,000
20,000
25,000
30,000
PP Y01 Y02 Y03 Y04 Y05 Y06 Y07 Y08 Y09 Y10 Y11 Y12 Y13
Au
gra
de
g/t
Tota
l mat
eri
al k
ton
ne
s
Period
Total Mine Schedule
Ore Waste Au
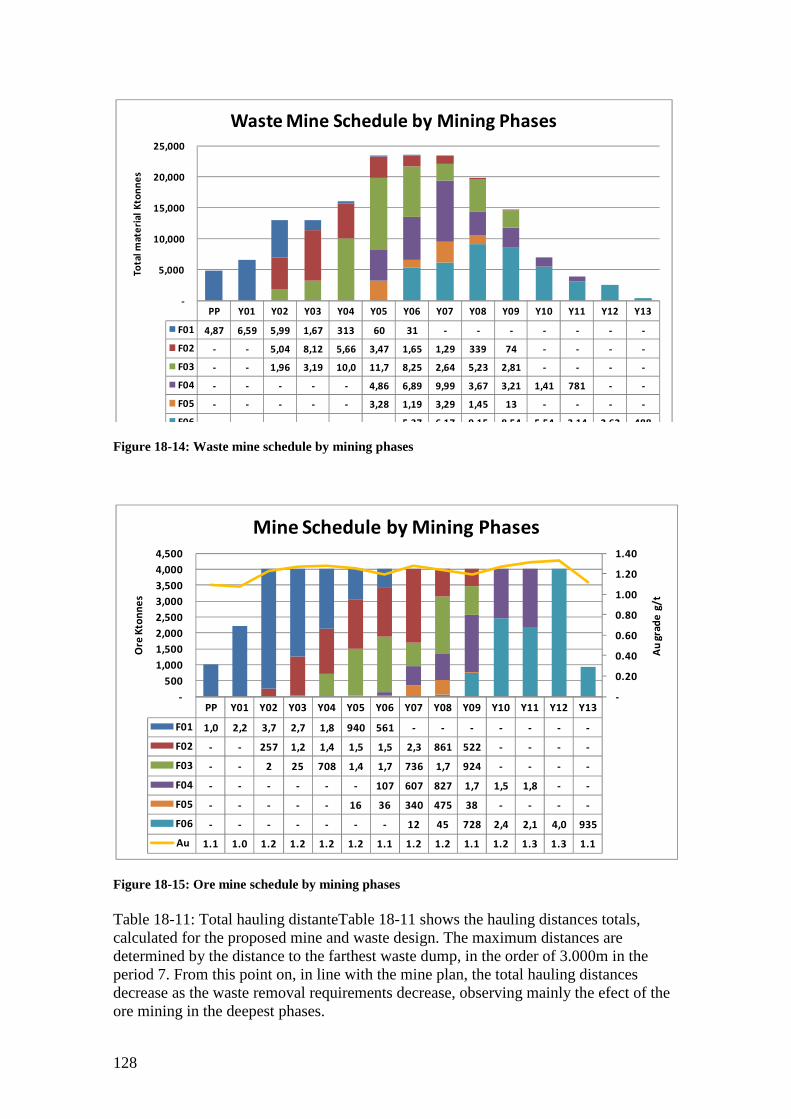
128
Figure 18-14: Waste mine schedule by mining phases
Figure 18-15: Ore mine schedule by mining phases Table 18-11: Total hauling distanteTable 18-11 shows the hauling distances totals, calculated for the proposed mine and waste design. The maximum distances are determined by the distance to the farthest waste dump, in the order of 3.000m in the period 7. From this point on, in line with the mine plan, the total hauling distances decrease as the waste removal requirements decrease, observing mainly the efect of the ore mining in the deepest phases.
PP Y01 Y02 Y03 Y04 Y05 Y06 Y07 Y08 Y09 Y10 Y11 Y12 Y13
F01 4,87 6,59 5,99 1,67 313 60 31 - - - - - - -
F02 - - 5,04 8,12 5,66 3,47 1,65 1,29 339 74 - - - -
F03 - - 1,96 3,19 10,0 11,7 8,25 2,64 5,23 2,81 - - - -
F04 - - - - - 4,86 6,89 9,99 3,67 3,21 1,41 781 - -
F05 - - - - - 3,28 1,19 3,29 1,45 13 - - - -
F06 - - - - - - 5,37 6,17 9,15 8,54 5,54 3,14 2,62 488
-
5,000
10,000
15,000
20,000
25,000 To
tal m
ate
rial
Kto
nn
es
Waste Mine Schedule by Mining Phases
PP Y01 Y02 Y03 Y04 Y05 Y06 Y07 Y08 Y09 Y10 Y11 Y12 Y13
F01 1,0 2,2 3,7 2,7 1,8 940 561 - - - - - - -
F02 - - 257 1,2 1,4 1,5 1,5 2,3 861 522 - - - -
F03 - - 2 25 708 1,4 1,7 736 1,7 924 - - - -
F04 - - - - - - 107 607 827 1,7 1,5 1,8 - -
F05 - - - - - 16 36 340 475 38 - - - -
F06 - - - - - - - 12 45 728 2,4 2,1 4,0 935
Au 1.1 1.0 1.2 1.2 1.2 1.2 1.1 1.2 1.2 1.1 1.2 1.3 1.3 1.1
-
0.20
0.40
0.60
0.80
1.00
1.20
1.40
-
500
1,000
1,500
2,000
2,500
3,000
3,500
4,000
4,500
Au
gra
de
g/t
Ore
Kto
nn
es
Mine Schedule by Mining Phases
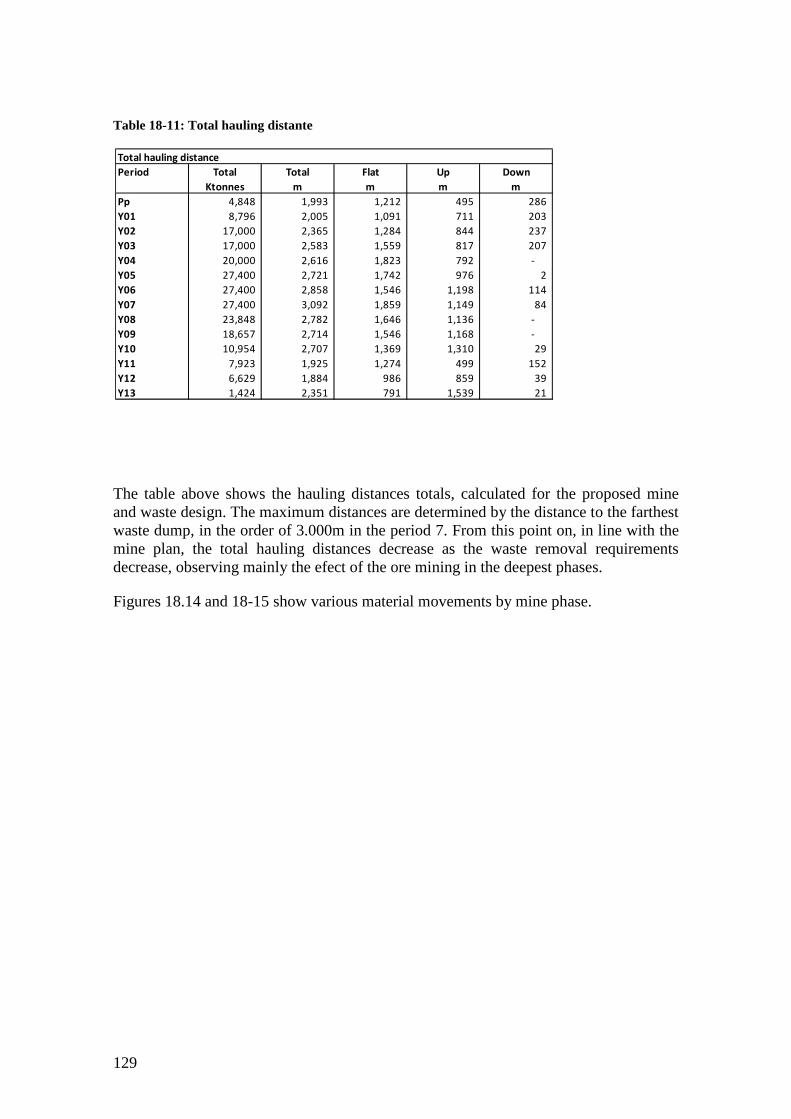
129
Table 18-11: Total hauling distante
The table above shows the hauling distances totals, calculated for the proposed mine and waste design. The maximum distances are determined by the distance to the farthest waste dump, in the order of 3.000m in the period 7. From this point on, in line with the mine plan, the total hauling distances decrease as the waste removal requirements decrease, observing mainly the efect of the ore mining in the deepest phases.
Figures 18.14 and 18-15 show various material movements by mine phase.
Total hauling distance
Period Total Total Flat Up Down
Ktonnes m m m m
Pp 4,848 1,993 1,212 495 286
Y01 8,796 2,005 1,091 711 203
Y02 17,000 2,365 1,284 844 237
Y03 17,000 2,583 1,559 817 207
Y04 20,000 2,616 1,823 792 -
Y05 27,400 2,721 1,742 976 2
Y06 27,400 2,858 1,546 1,198 114
Y07 27,400 3,092 1,859 1,149 84
Y08 23,848 2,782 1,646 1,136 -
Y09 18,657 2,714 1,546 1,168 -
Y10 10,954 2,707 1,369 1,310 29
Y11 7,923 1,925 1,274 499 152
Y12 6,629 1,884 986 859 39
Y13 1,424 2,351 791 1,539 21

130
Table 18-9: Mine Production Schedule
Table 18-10: Plant Feed Schedule
Ktonnes Au (g/t)In situ Au
(koz)Ktonnes Au (g/t) Au (koz)
PP 1,000 1.095 35.2 1,000 1.095 35.2 3,879 5,879 3.88
Y01 2,200 1.077 76.2 6,596 8,796 3.00
Y02 4,000 1.223 157.3 13,000 17,000 3.25
Y03 4,000 1.273 163.7 13,000 17,000 3.25
Y04 4,000 1.277 164.2 16,000 20,000 4.00
Y05 4,000 1.251 160.9 23,400 27,400 5.85
Y06 4,000 1.192 153.3 23,400 27,400 5.85
Y07 4,000 1.275 163.9 23,400 27,400 5.85
Y08 4,000 1.237 159.1 19,848 23,848 4.96
Y09 4,000 1.190 153.1 14,657 18,657 3.66
Y10 4,000 1.267 162.9 6,954 10,954 1.74
Y11 4,000 1.311 168.7 3,923 7,923 0.98
Y12 4,000 1.332 171.3 2,629 6,629 0.66
Y13 935 1.119 33.7 488 1,424 0.52
Total 48,138 1.243 1,923 171,171 220,310 3.56
Cut-off grade for Ore: 0.661 Oxi/0.479 Sul
TABLE 18.1-6
MINE PRODUCTION SCHEDULE
Mining Year Total Ktonnes Strip RatioWaste Ktonnes
Ktonnes Au (g/t) Ktonnes Au (g/t) Ktonnes Au (g/t) Au (Koz)Gold
Recovery (%)
Recovered
Gold (koz)
Y01 2,200 1.08 1,000 1.10 3,200 1.08 111 79% 88.3
Y02 4,000 1.22 4,000 1.22 157 90% 141.9
Y03 4,000 1.27 4,000 1.27 164 91% 148.7
Y04 4,000 1.28 4,000 1.28 164 91% 149.3
Y05 4,000 1.25 4,000 1.25 161 91% 146.5
Y06 4,000 1.19 4,000 1.19 153 91% 139.4
Y07 4,000 1.27 4,000 1.27 164 91% 149.2
Y08 4,000 1.24 4,000 1.24 159 91% 144.7
Y09 4,000 1.19 4,000 1.19 153 91% 139.3
Y10 4,000 1.27 4,000 1.27 163 91% 148.3
Y11 4,000 1.31 4,000 1.31 169 91% 153.5
Y12 4,000 1.33 4,000 1.33 171 91% 155.9
Y13 935 1.12 935 1.12 34 91% 30.6
Total 47,138 1.25 1,000 1 48,138 1.24 1,923 90% 1,733.6
(*) Year 1 considers one month at 80% throughput and 9.6 months at 100% throughput (11,100 tonnes per day)
Mining
Year
TABLE 18.1-7
PLANT FEED SCHEDULE
Mined Ore Stockpile Rehandle
Plant Feed
Total Plant Feed
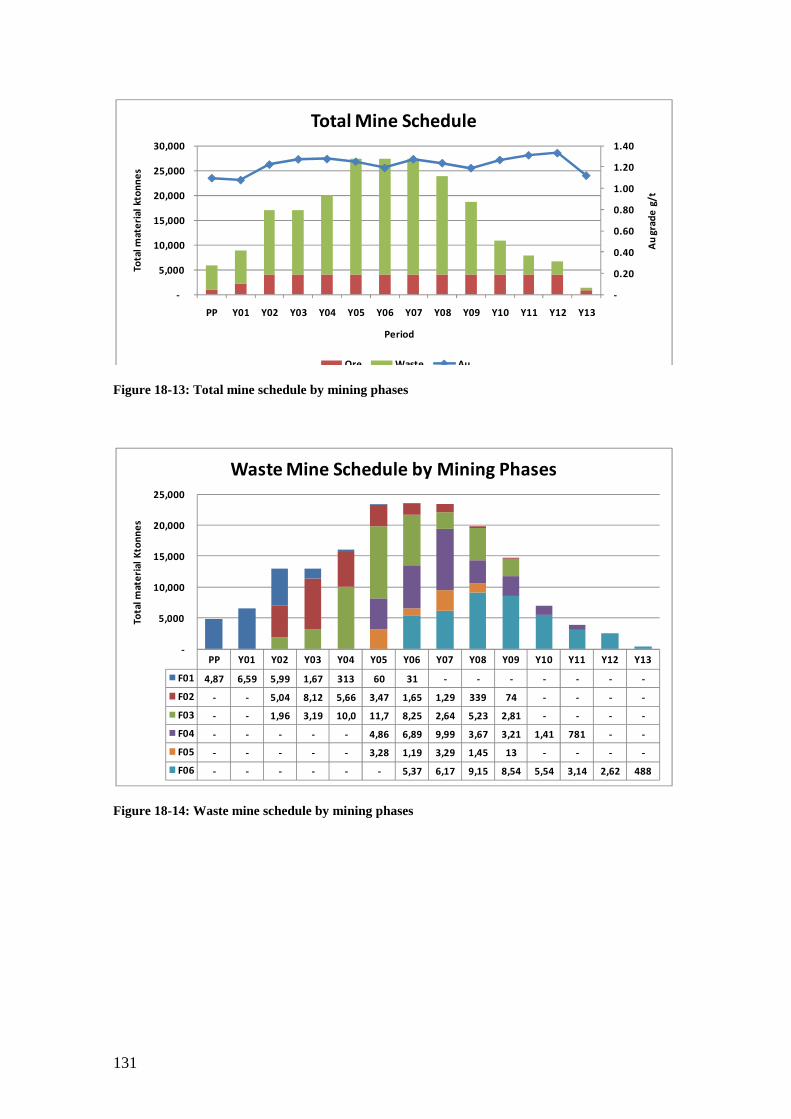
131
Figure 18-13: Total mine schedule by mining phases
Figure 18-14: Waste mine schedule by mining phases
-
0.20
0.40
0.60
0.80
1.00
1.20
1.40
-
5,000
10,000
15,000
20,000
25,000
30,000
PP Y01 Y02 Y03 Y04 Y05 Y06 Y07 Y08 Y09 Y10 Y11 Y12 Y13
Au
gra
de
g/t
Tota
l mat
eri
al k
ton
ne
s
Period
Total Mine Schedule
Ore Waste Au
PP Y01 Y02 Y03 Y04 Y05 Y06 Y07 Y08 Y09 Y10 Y11 Y12 Y13
F01 4,87 6,59 5,99 1,67 313 60 31 - - - - - - -
F02 - - 5,04 8,12 5,66 3,47 1,65 1,29 339 74 - - - -
F03 - - 1,96 3,19 10,0 11,7 8,25 2,64 5,23 2,81 - - - -
F04 - - - - - 4,86 6,89 9,99 3,67 3,21 1,41 781 - -
F05 - - - - - 3,28 1,19 3,29 1,45 13 - - - -
F06 - - - - - - 5,37 6,17 9,15 8,54 5,54 3,14 2,62 488
-
5,000
10,000
15,000
20,000
25,000
Tota
l mat
eri
al K
ton
ne
s
Waste Mine Schedule by Mining Phases

132
Figure 18-15: Ore mine schedule by mining phases
Table 18-11: Total hauling distanteTable 18-11 shows the hauling distances totals, calculated for the proposed mine and waste design. The maximum distances are determined by the distance to the farthest waste dump, in the order of 3.000m in the period 7. From this point on, in line with the mine plan, the total hauling distances decrease as the waste removal requirements decrease, observing mainly the efect of the ore mining in the deepest phases.
Table 18-11: Total hauling distante
PP Y01 Y02 Y03 Y04 Y05 Y06 Y07 Y08 Y09 Y10 Y11 Y12 Y13
F01 1,0 2,2 3,7 2,7 1,8 940 561 - - - - - - -
F02 - - 257 1,2 1,4 1,5 1,5 2,3 861 522 - - - -
F03 - - 2 25 708 1,4 1,7 736 1,7 924 - - - -
F04 - - - - - - 107 607 827 1,7 1,5 1,8 - -
F05 - - - - - 16 36 340 475 38 - - - -
F06 - - - - - - - 12 45 728 2,4 2,1 4,0 935
Au 1.1 1.0 1.2 1.2 1.2 1.2 1.1 1.2 1.2 1.1 1.2 1.3 1.3 1.1
-
0.20
0.40
0.60
0.80
1.00
1.20
1.40
-
500
1,000
1,500
2,000
2,500
3,000
3,500
4,000
4,500
Au
gra
de
g/
t
Ore
Kto
nn
es
Mine Schedule by Mining Phases
Total hauling distance
Period Total Total Flat Up Down
Ktonnes m m m m
Pp 4,848 1,993 1,212 495 286
Y01 8,796 2,005 1,091 711 203
Y02 17,000 2,365 1,284 844 237
Y03 17,000 2,583 1,559 817 207
Y04 20,000 2,616 1,823 792 -
Y05 27,400 2,721 1,742 976 2
Y06 27,400 2,858 1,546 1,198 114
Y07 27,400 3,092 1,859 1,149 84
Y08 23,848 2,782 1,646 1,136 -
Y09 18,657 2,714 1,546 1,168 -
Y10 10,954 2,707 1,369 1,310 29
Y11 7,923 1,925 1,274 499 152
Y12 6,629 1,884 986 859 39
Y13 1,424 2,351 791 1,539 21
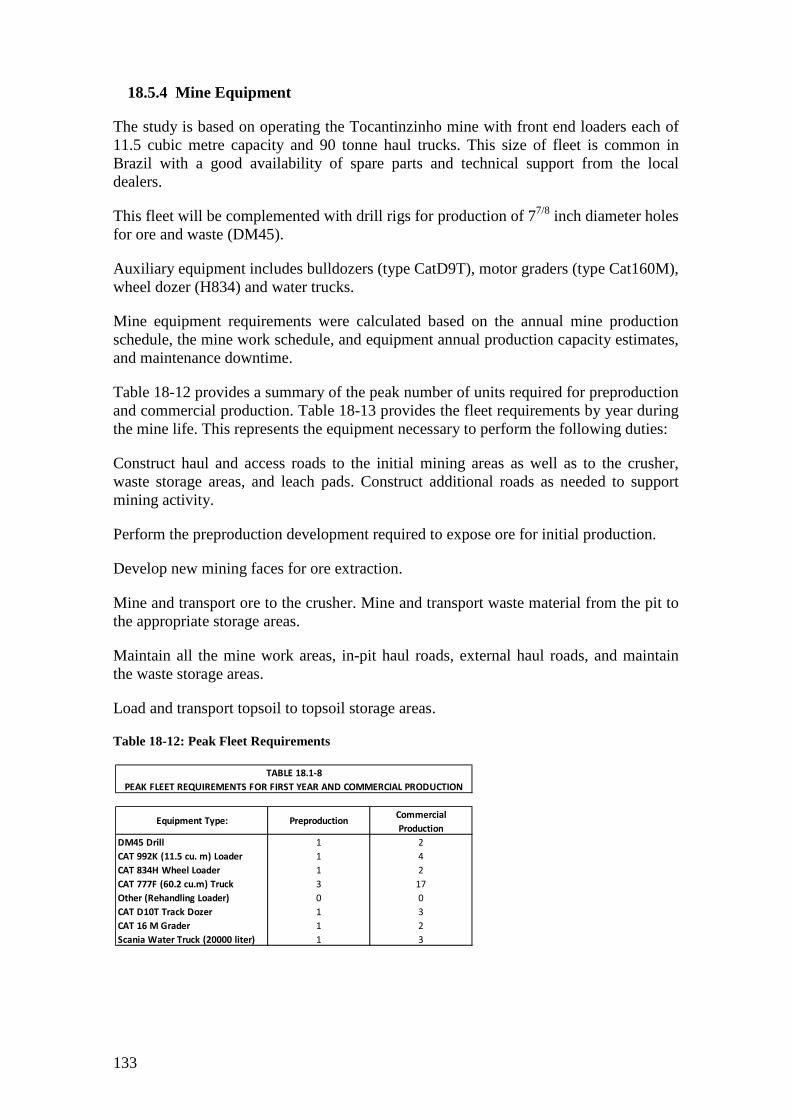
133
18.5.4 Mine Equipment
The study is based on operating the Tocantinzinho mine with front end loaders each of 11.5 cubic metre capacity and 90 tonne haul trucks. This size of fleet is common in Brazil with a good availability of spare parts and technical support from the local dealers.
This fleet will be complemented with drill rigs for production of 77/8 inch diameter holes for ore and waste (DM45).
Auxiliary equipment includes bulldozers (type CatD9T), motor graders (type Cat160M), wheel dozer (H834) and water trucks.
Mine equipment requirements were calculated based on the annual mine production schedule, the mine work schedule, and equipment annual production capacity estimates, and maintenance downtime.
Table 18-12 provides a summary of the peak number of units required for preproduction and commercial production. Table 18-13 provides the fleet requirements by year during the mine life. This represents the equipment necessary to perform the following duties:
Construct haul and access roads to the initial mining areas as well as to the crusher, waste storage areas, and leach pads. Construct additional roads as needed to support mining activity.
Perform the preproduction development required to expose ore for initial production.
Develop new mining faces for ore extraction.
Mine and transport ore to the crusher. Mine and transport waste material from the pit to the appropriate storage areas.
Maintain all the mine work areas, in-pit haul roads, external haul roads, and maintain the waste storage areas.
Load and transport topsoil to topsoil storage areas.
Table 18-12: Peak Fleet Requirements
Commercial
Production
DM45 Drill 1 2
CAT 992K (11.5 cu. m) Loader 1 4
CAT 834H Wheel Loader 1 2
CAT 777F (60.2 cu.m) Truck 3 17
Other (Rehandling Loader) 0 0
CAT D10T Track Dozer 1 3
CAT 16 M Grader 1 2
Scania Water Truck (20000 liter) 1 3
Equipment Type:
TABLE 18.1-8
PEAK FLEET REQUIREMENTS FOR FIRST YEAR AND COMMERCIAL PRODUCTION
Preproduction
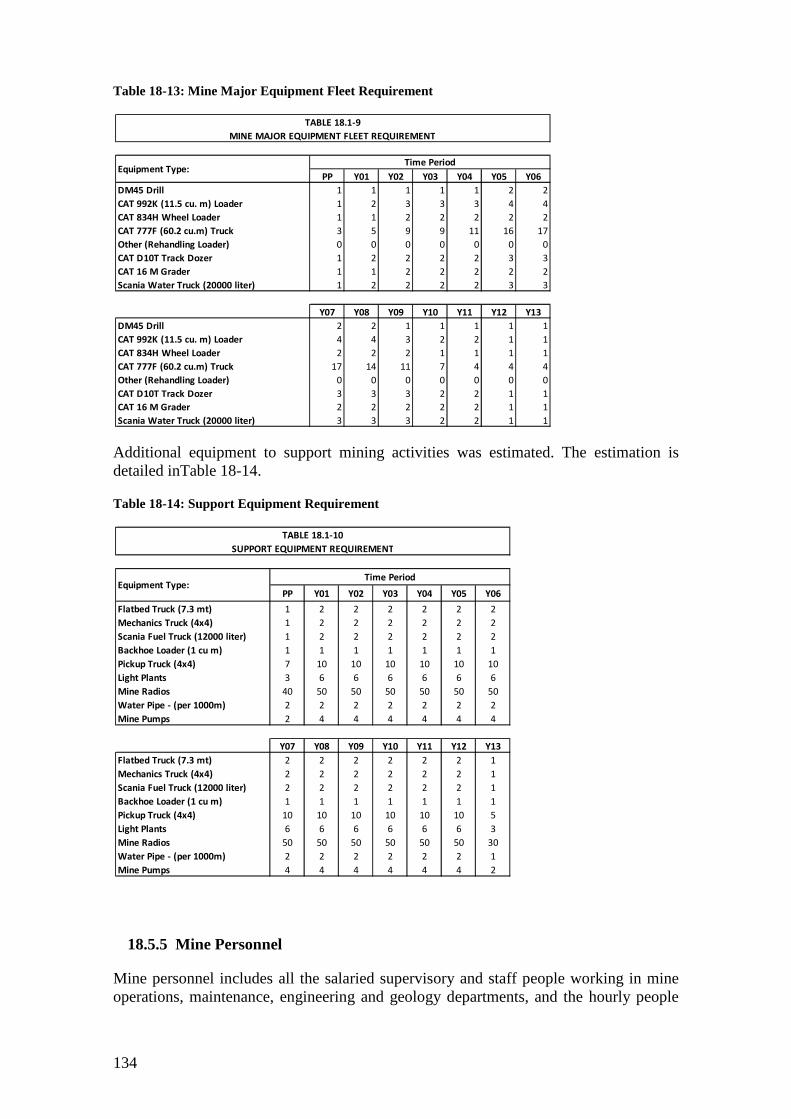
134
Table 18-13: Mine Major Equipment Fleet Requirement
Additional equipment to support mining activities was estimated. The estimation is detailed inTable 18-14.
Table 18-14: Support Equipment Requirement
18.5.5 Mine Personnel
Mine personnel includes all the salaried supervisory and staff people working in mine operations, maintenance, engineering and geology departments, and the hourly people
PP Y01 Y02 Y03 Y04 Y05 Y06
DM45 Drill 1 1 1 1 1 2 2
CAT 992K (11.5 cu. m) Loader 1 2 3 3 3 4 4
CAT 834H Wheel Loader 1 1 2 2 2 2 2
CAT 777F (60.2 cu.m) Truck 3 5 9 9 11 16 17
Other (Rehandling Loader) 0 0 0 0 0 0 0
CAT D10T Track Dozer 1 2 2 2 2 3 3
CAT 16 M Grader 1 1 2 2 2 2 2
Scania Water Truck (20000 liter) 1 2 2 2 2 3 3
Y07 Y08 Y09 Y10 Y11 Y12 Y13
DM45 Drill 2 2 1 1 1 1 1
CAT 992K (11.5 cu. m) Loader 4 4 3 2 2 1 1
CAT 834H Wheel Loader 2 2 2 1 1 1 1
CAT 777F (60.2 cu.m) Truck 17 14 11 7 4 4 4
Other (Rehandling Loader) 0 0 0 0 0 0 0
CAT D10T Track Dozer 3 3 3 2 2 1 1
CAT 16 M Grader 2 2 2 2 2 1 1
Scania Water Truck (20000 liter) 3 3 3 2 2 1 1
Equipment Type:Time Period
TABLE 18.1-9
MINE MAJOR EQUIPMENT FLEET REQUIREMENT
PP Y01 Y02 Y03 Y04 Y05 Y06
Flatbed Truck (7.3 mt) 1 2 2 2 2 2 2
Mechanics Truck (4x4) 1 2 2 2 2 2 2
Scania Fuel Truck (12000 liter) 1 2 2 2 2 2 2
Backhoe Loader (1 cu m) 1 1 1 1 1 1 1
Pickup Truck (4x4) 7 10 10 10 10 10 10
Light Plants 3 6 6 6 6 6 6
Mine Radios 40 50 50 50 50 50 50
Water Pipe - (per 1000m) 2 2 2 2 2 2 2
Mine Pumps 2 4 4 4 4 4 4
Y07 Y08 Y09 Y10 Y11 Y12 Y13
Flatbed Truck (7.3 mt) 2 2 2 2 2 2 1
Mechanics Truck (4x4) 2 2 2 2 2 2 1
Scania Fuel Truck (12000 liter) 2 2 2 2 2 2 1
Backhoe Loader (1 cu m) 1 1 1 1 1 1 1
Pickup Truck (4x4) 10 10 10 10 10 10 5
Light Plants 6 6 6 6 6 6 3
Mine Radios 50 50 50 50 50 50 30
Water Pipe - (per 1000m) 2 2 2 2 2 2 1
Mine Pumps 4 4 4 4 4 4 2
Equipment Type:Time Period
TABLE 18.1-10
SUPPORT EQUIPMENT REQUIREMENT
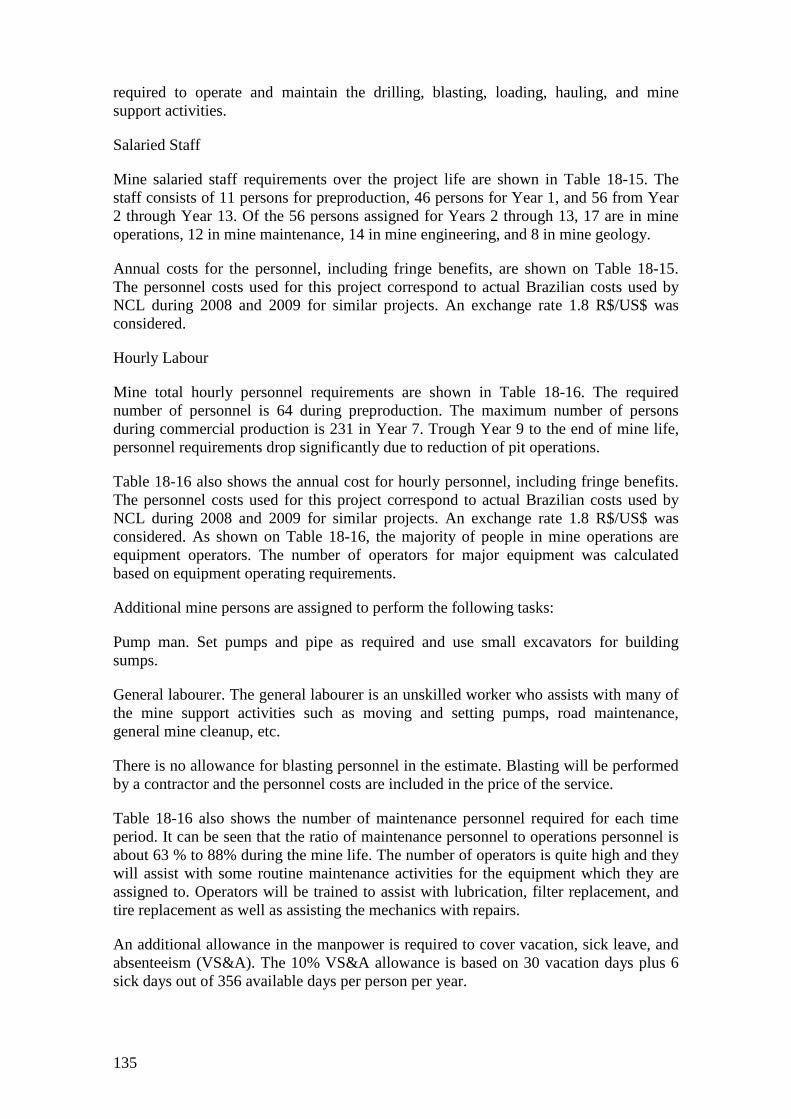
135
required to operate and maintain the drilling, blasting, loading, hauling, and mine support activities.
Salaried Staff
Mine salaried staff requirements over the project life are shown in Table 18-15. The staff consists of 11 persons for preproduction, 46 persons for Year 1, and 56 from Year 2 through Year 13. Of the 56 persons assigned for Years 2 through 13, 17 are in mine operations, 12 in mine maintenance, 14 in mine engineering, and 8 in mine geology.
Annual costs for the personnel, including fringe benefits, are shown on Table 18-15. The personnel costs used for this project correspond to actual Brazilian costs used by NCL during 2008 and 2009 for similar projects. An exchange rate 1.8 R$/US$ was considered.
Hourly Labour
Mine total hourly personnel requirements are shown in Table 18-16. The required number of personnel is 64 during preproduction. The maximum number of persons during commercial production is 231 in Year 7. Trough Year 9 to the end of mine life, personnel requirements drop significantly due to reduction of pit operations.
Table 18-16 also shows the annual cost for hourly personnel, including fringe benefits. The personnel costs used for this project correspond to actual Brazilian costs used by NCL during 2008 and 2009 for similar projects. An exchange rate 1.8 R$/US$ was considered. As shown on Table 18-16, the majority of people in mine operations are equipment operators. The number of operators for major equipment was calculated based on equipment operating requirements.
Additional mine persons are assigned to perform the following tasks:
Pump man. Set pumps and pipe as required and use small excavators for building sumps.
General labourer. The general labourer is an unskilled worker who assists with many of the mine support activities such as moving and setting pumps, road maintenance, general mine cleanup, etc.
There is no allowance for blasting personnel in the estimate. Blasting will be performed by a contractor and the personnel costs are included in the price of the service.
Table 18-16 also shows the number of maintenance personnel required for each time period. It can be seen that the ratio of maintenance personnel to operations personnel is about 63 % to 88% during the mine life. The number of operators is quite high and they will assist with some routine maintenance activities for the equipment which they are assigned to. Operators will be trained to assist with lubrication, filter replacement, and tire replacement as well as assisting the mechanics with repairs.
An additional allowance in the manpower is required to cover vacation, sick leave, and absenteeism (VS&A). The 10% VS&A allowance is based on 30 vacation days plus 6 sick days out of 356 available days per person per year.
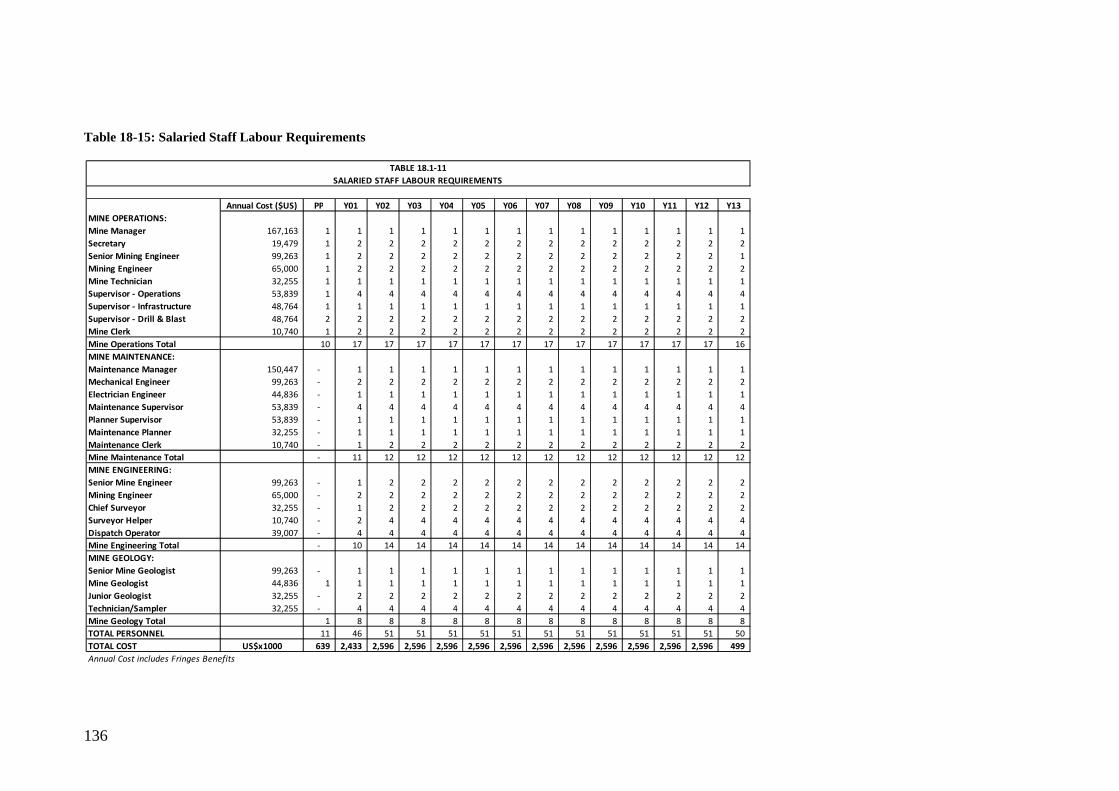
136
Table 18-15: Salaried Staff Labour Requirements
PP Y01 Y02 Y03 Y04 Y05 Y06 Y07 Y08 Y09 Y10 Y11 Y12 Y13
MINE OPERATIONS:
Mine Manager 167,163 1 1 1 1 1 1 1 1 1 1 1 1 1 1
Secretary 19,479 1 2 2 2 2 2 2 2 2 2 2 2 2 2
Senior Mining Engineer 99,263 1 2 2 2 2 2 2 2 2 2 2 2 2 1
Mining Engineer 65,000 1 2 2 2 2 2 2 2 2 2 2 2 2 2
Mine Technician 32,255 1 1 1 1 1 1 1 1 1 1 1 1 1 1
Supervisor - Operations 53,839 1 4 4 4 4 4 4 4 4 4 4 4 4 4
Supervisor - Infrastructure 48,764 1 1 1 1 1 1 1 1 1 1 1 1 1 1
Supervisor - Drill & Blast 48,764 2 2 2 2 2 2 2 2 2 2 2 2 2 2
Mine Clerk 10,740 1 2 2 2 2 2 2 2 2 2 2 2 2 2
Mine Operations Total 10 17 17 17 17 17 17 17 17 17 17 17 17 16
MINE MAINTENANCE:
Maintenance Manager 150,447 - 1 1 1 1 1 1 1 1 1 1 1 1 1
Mechanical Engineer 99,263 - 2 2 2 2 2 2 2 2 2 2 2 2 2
Electrician Engineer 44,836 - 1 1 1 1 1 1 1 1 1 1 1 1 1
Maintenance Supervisor 53,839 - 4 4 4 4 4 4 4 4 4 4 4 4 4
Planner Supervisor 53,839 - 1 1 1 1 1 1 1 1 1 1 1 1 1
Maintenance Planner 32,255 - 1 1 1 1 1 1 1 1 1 1 1 1 1
Maintenance Clerk 10,740 - 1 2 2 2 2 2 2 2 2 2 2 2 2
Mine Maintenance Total - 11 12 12 12 12 12 12 12 12 12 12 12 12
MINE ENGINEERING:
Senior Mine Engineer 99,263 - 1 2 2 2 2 2 2 2 2 2 2 2 2
Mining Engineer 65,000 - 2 2 2 2 2 2 2 2 2 2 2 2 2
Chief Surveyor 32,255 - 1 2 2 2 2 2 2 2 2 2 2 2 2
Surveyor Helper 10,740 - 2 4 4 4 4 4 4 4 4 4 4 4 4
Dispatch Operator 39,007 - 4 4 4 4 4 4 4 4 4 4 4 4 4
Mine Engineering Total - 10 14 14 14 14 14 14 14 14 14 14 14 14
MINE GEOLOGY:
Senior Mine Geologist 99,263 - 1 1 1 1 1 1 1 1 1 1 1 1 1
Mine Geologist 44,836 1 1 1 1 1 1 1 1 1 1 1 1 1 1
Junior Geologist 32,255 - 2 2 2 2 2 2 2 2 2 2 2 2 2
Technician/Sampler 32,255 - 4 4 4 4 4 4 4 4 4 4 4 4 4
Mine Geology Total 1 8 8 8 8 8 8 8 8 8 8 8 8 8
TOTAL PERSONNEL 11 46 51 51 51 51 51 51 51 51 51 51 51 50
TOTAL COST US$x1000 639 2,433 2,596 2,596 2,596 2,596 2,596 2,596 2,596 2,596 2,596 2,596 2,596 499
Annual Cost includes Fringes Benefits
TABLE 18.1-11
SALARIED STAFF LABOUR REQUIREMENTS
Annual Cost ($US)
137
Table 18-16: Mine Hourly Labour Requirements
Y0 Y01-13
MINE OPERATIONS:
Drilling 28,759 28,759 1 2 3 3 3 4 4 4 4 3 2 2 2 1
Loading 28,759 28,759 3 5 9 9 11 15 15 15 13 10 6 4 4 3
Hauling 28,759 28,759 10 17 35 36 42 61 66 69 56 44 27 15 13 16
Stockpile Loading 28,759 28,759 0 1 0 0 0 0 0 0 0 0 0 0 0 0
Main Equipment 14 25 47 48 56 80 85 88 73 57 35 21 19 20
Track Dozer 28,759 28,759 5 6 8 8 8 10 11 11 11 9 7 7 5 4
Wheel Dozer 21,449 21,449 3 4 6 6 6 7 8 8 8 7 5 5 3 3
Grader 21,449 21,449 3 5 7 7 7 8 8 8 8 7 6 6 4 3
Water Truck 21,449 21,449 5 6 8 8 8 10 10 10 10 9 7 7 4 4
Auxiliary Equipment 16 21 29 29 29 35 37 37 37 32 25 25 16 14
Laborer 15,602 15,602 3 3 3 3 3 3 3 3 3 3 3 3 3 3
Pumpman 15,602 15,602 1 1 1 1 1 1 1 1 1 1 1 1 1 1
General Mining 4 4 4 4 4 4 4 4 4 4 4 4 4 4
Total Operators 34 50 80 81 89 119 126 129 114 93 64 50 39 38
MINE MAINTENANCE:
Mechanic 28,759 28,759 6 20 24 24 24 32 32 32 32 24 20 10 10 8
Mechanic´s Helper 15,602 15,602 4 8 12 12 12 16 16 16 16 12 10 5 5 4
Welder 28,759 28,759 3 5 8 8 8 11 11 11 11 8 8 5 5 4
Mine Maintenance 13 33 44 44 44 59 59 59 59 44 38 20 20 16
Electrician 28,759 28,759 4 4 6 6 6 8 8 8 8 6 6 4 4 4
Fuel Man 15,602 15,602 4 4 6 6 6 8 8 8 8 6 6 4 4 4
Laborer 15,602 15,602 3 3 5 5 5 6 6 6 6 5 5 3 3 3
General Maintenance 11 11 17 17 17 22 22 22 22 17 17 11 11 11
Maintenance Total 24 44 61 61 61 81 81 81 81 61 55 31 31 27
HOURLY LABOUR COST 1390 2344 3546 3575 3805 5122 5316 5402 4971 3906 2962 1987 1722 320
VS&A Allowance 6 9 14 14 15 20 21 21 20 15 12 8 7 7
VS&A COST 137 216 339 340 368 497 522 523 492 366 288 186 166 33
TOTAL LABOUR REQUIREMENT 64 103 155 156 165 220 228 231 215 169 131 89 77 72
TOTAL HOURLY LABOUR COST 1527 2560 3886 3915 4173 5619 5838 5925 5463 4271 3250 2173 1888 353
Maint/Operations Ratio 71% 88% 76% 75% 69% 68% 64% 63% 71% 66% 86% 62% 79% 71%
TABLE 18.1-12
MINE HOURLY LABOUR REQUIREMENTS
Vacations , Si ck leave and Abs enteeis m (VS&A) i s bas ed on 30 vacation days and 6 s ick days/pers on out of 365 scheduled days/person per year.
Annual Cost ($US)PP Y01 Y02 Y03 Y04 Y05 Y06 Y07 Y08 Y09 Y10 Y11 Y12 Y13
Annual Cost includes Fringes Benefits .
US$x1000
10%
US$x1000
US$x1000
138
18.5.6 Mine Capital Cost
The estimated mine capital cost includes the following items:
1. Mine major equipment.
2. Mine support equipment.
3. Shop tools.
4. Initial spare parts.
5. Engineering and geology equipment.
6. Mine preproduction development expense.
This estimate does not include the following mine physical structures:
1. Fuel and lubricant storage facilities.
2. Explosive storage facilities.
3. The mine shop, offices, and warehouse.
It is anticipated that the vendors will provide storage for fuel, lubricants, and explosives as part of their contract of work and that the prices for these items are included in the delivered price. The mine shop and warehouse was estimated based on a published feasibility study of an recently constructed open pit mine in Brazil. Its cost was estimate as US$ 5.19 million.
Table 18-17 summarizes the mine capital costs by category for initial capital period. The initial capital period is the 24 month period from preproduction (12 months)”PP” through Year 1. Mine preproduction development of US$ 9.3 million during PP is based on the estimated mine operating costs during this time. Details of this calculation are discussed in Section 18.5.7.
Mine equipment includes all the items in Table 18-17 except preproduction development. Initial mine equipment capital is US$ 24.9 million during PP and Year 1. Sustaining capital is required because mine fleet size increases and replacement during mine lifetime and amounts to US$ 53.3 million.
An equipment salvage credit amounts to US$ 1.8 million at the end of the project life. The salvage value was set to 10%, because of the low operating hours, for all of the equipment at the end of the useful life. This credit occurs when replacement is required, but most was allocated around to Year 8 (Table 18-19). For this update equipment salvage was not deducted from the Capex estimate.
Table 18-18 also shows the equipment unit prices used for this study. The following is noted:
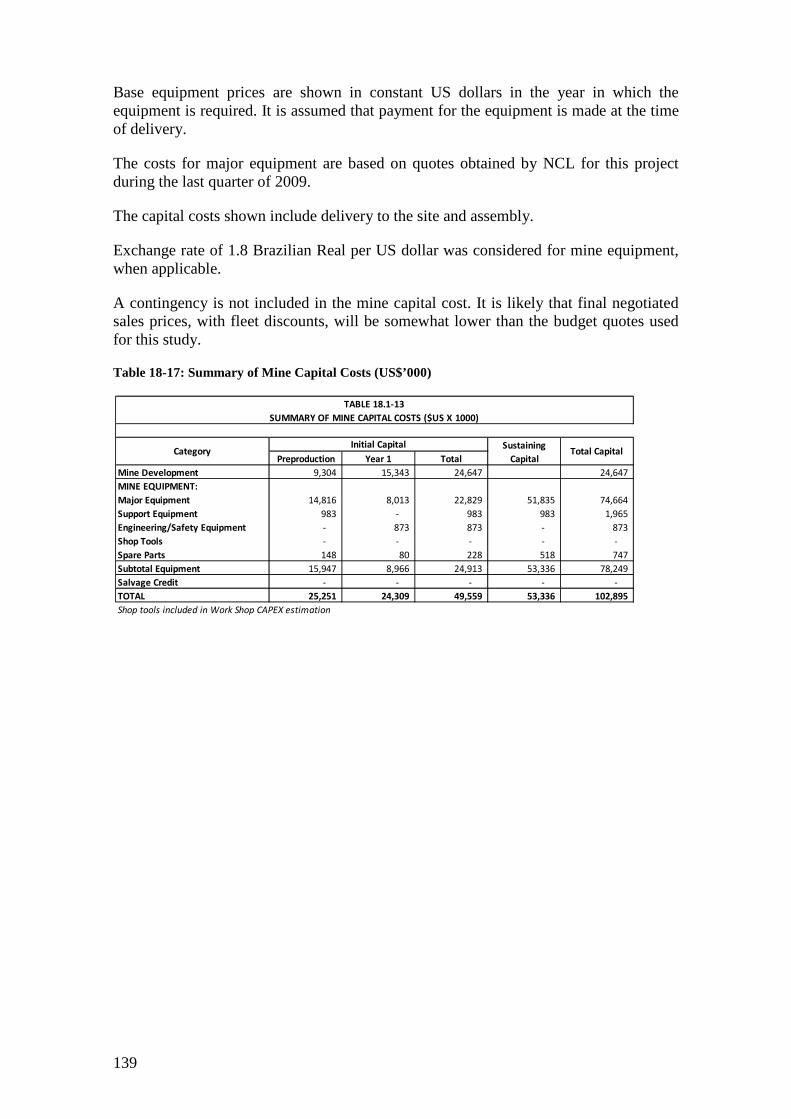
139
Base equipment prices are shown in constant US dollars in the year in which the equipment is required. It is assumed that payment for the equipment is made at the time of delivery.
The costs for major equipment are based on quotes obtained by NCL for this project during the last quarter of 2009.
The capital costs shown include delivery to the site and assembly.
Exchange rate of 1.8 Brazilian Real per US dollar was considered for mine equipment, when applicable.
A contingency is not included in the mine capital cost. It is likely that final negotiated sales prices, with fleet discounts, will be somewhat lower than the budget quotes used for this study.
Table 18-17: Summary of Mine Capital Costs (US$’000)
Preproduction Year 1 Total
Mine Development 9,304 15,343 24,647 24,647
MINE EQUIPMENT:
Major Equipment 14,816 8,013 22,829 51,835 74,664
Support Equipment 983 - 983 983 1,965
Engineering/Safety Equipment - 873 873 - 873
Shop Tools - - - - -
Spare Parts 148 80 228 518 747
Subtotal Equipment 15,947 8,966 24,913 53,336 78,249
Salvage Credit - - - - -
TOTAL 25,251 24,309 49,559 53,336 102,895
Shop tools included in Work Shop CAPEX estimation
Initial CapitalCategory
Sustaining
CapitalTotal Capital
TABLE 18.1-13
SUMMARY OF MINE CAPITAL COSTS ($US X 1000)
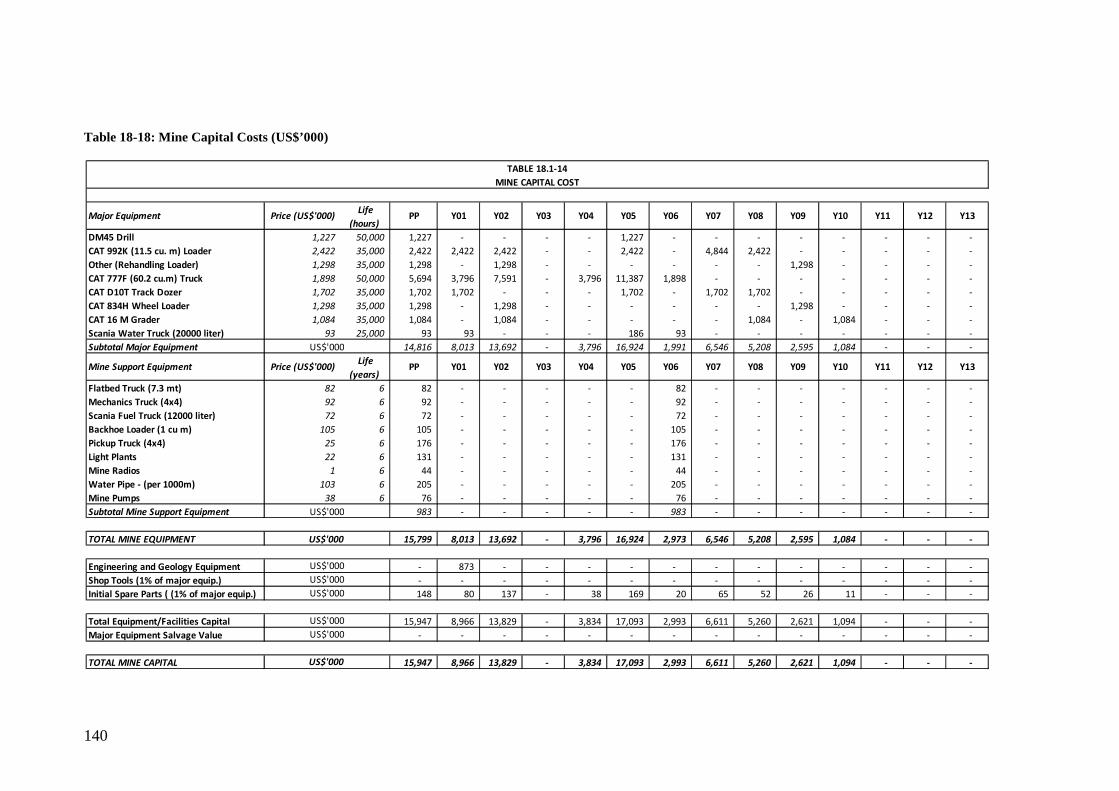
140
Table 18-18: Mine Capital Costs (US$’000)
DM45 Drill 1,227 50,000 1,227 - - - - 1,227 - - - - - - - -
CAT 992K (11.5 cu. m) Loader 2,422 35,000 2,422 2,422 2,422 - - 2,422 - 4,844 2,422 - - - - -
Other (Rehandling Loader) 1,298 35,000 1,298 - 1,298 - - - - - - 1,298 - - - -
CAT 777F (60.2 cu.m) Truck 1,898 50,000 5,694 3,796 7,591 - 3,796 11,387 1,898 - - - - - - -
CAT D10T Track Dozer 1,702 35,000 1,702 1,702 - - - 1,702 - 1,702 1,702 - - - - -
CAT 834H Wheel Loader 1,298 35,000 1,298 - 1,298 - - - - - - 1,298 - - - -
CAT 16 M Grader 1,084 35,000 1,084 - 1,084 - - - - - 1,084 - 1,084 - - -
Scania Water Truck (20000 liter) 93 25,000 93 93 - - - 186 93 - - - - - - -
Subtotal Major Equipment 14,816 8,013 13,692 - 3,796 16,924 1,991 6,546 5,208 2,595 1,084 - - -
Flatbed Truck (7.3 mt) 82 6 82 - - - - - 82 - - - - - - -
Mechanics Truck (4x4) 92 6 92 - - - - - 92 - - - - - - -
Scania Fuel Truck (12000 liter) 72 6 72 - - - - - 72 - - - - - - -
Backhoe Loader (1 cu m) 105 6 105 - - - - - 105 - - - - - - -
Pickup Truck (4x4) 25 6 176 - - - - - 176 - - - - - - -
Light Plants 22 6 131 - - - - - 131 - - - - - - -
Mine Radios 1 6 44 - - - - - 44 - - - - - - -
Water Pipe - (per 1000m) 103 6 205 - - - - - 205 - - - - - - -
Mine Pumps 38 6 76 - - - - - 76 - - - - - - -
Subtotal Mine Support Equipment 983 - - - - - 983 - - - - - - -
TOTAL MINE EQUIPMENT 15,799 8,013 13,692 - 3,796 16,924 2,973 6,546 5,208 2,595 1,084 - - -
Engineering and Geology Equipment - 873 - - - - - - - - - - - -
Shop Tools (1% of major equip.) - - - - - - - - - - - - - -
Initial Spare Parts ( (1% of major equip.) 148 80 137 - 38 169 20 65 52 26 11 - - -
Total Equipment/Facilities Capital 15,947 8,966 13,829 - 3,834 17,093 2,993 6,611 5,260 2,621 1,094 - - -
Major Equipment Salvage Value - - - - - - - - - - - - - -
TOTAL MINE CAPITAL 15,947 8,966 13,829 - 3,834 17,093 2,993 6,611 5,260 2,621 1,094 - - -
Y03
Y03 Y08
Y04 Y05 Y06 Y07 Y08
Y06 Y07Y04 Y05
PP Y01
PP Y01
Y02
Y02
TABLE 18.1-14
MINE CAPITAL COST
Y13
Y13
Y09 Y10 Y11 Y12
Y09 Y10 Y11 Y12
Price (US$'000)
Price (US$'000)
Major Equipment Life
(hours)
Mine Support Equipment
US$'000
US$'000
US$'000
US$'000
US$'000
US$'000
US$'000
US$'000
US$'000
Life
(years)
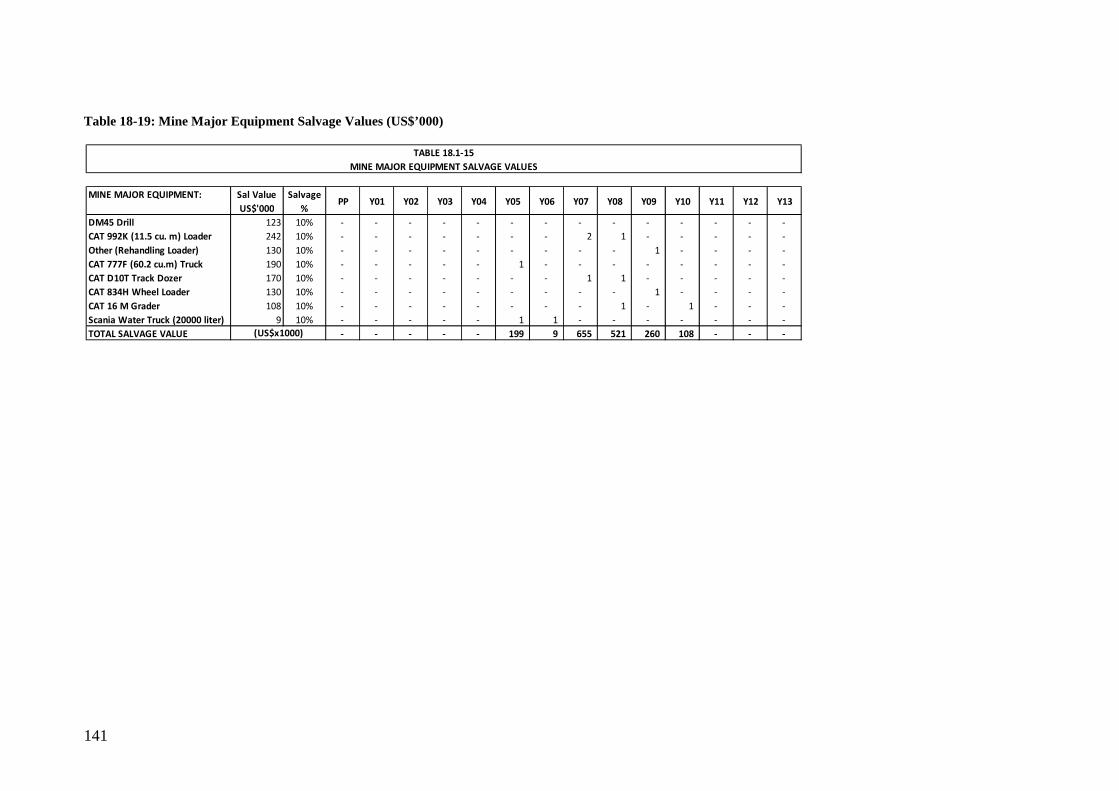
141
Table 18-19: Mine Major Equipment Salvage Values (US$’000)
MINE MAJOR EQUIPMENT: Sal Value
US$'000
Salvage
%PP Y01 Y02 Y03 Y04 Y05 Y06 Y07 Y08 Y09 Y10 Y11 Y12 Y13
DM45 Drill 123 10% - - - - - - - - - - - - - -
CAT 992K (11.5 cu. m) Loader 242 10% - - - - - - - 2 1 - - - - -
Other (Rehandling Loader) 130 10% - - - - - - - - - 1 - - - -
CAT 777F (60.2 cu.m) Truck 190 10% - - - - - 1 - - - - - - - -
CAT D10T Track Dozer 170 10% - - - - - - - 1 1 - - - - -
CAT 834H Wheel Loader 130 10% - - - - - - - - - 1 - - - -
CAT 16 M Grader 108 10% - - - - - - - - 1 - 1 - - -
Scania Water Truck (20000 liter) 9 10% - - - - - 1 1 - - - - - - -
TOTAL SALVAGE VALUE - - - - - 199 9 655 521 260 108 - - - (US$x1000)
TABLE 18.1-15
MINE MAJOR EQUIPMENT SALVAGE VALUES
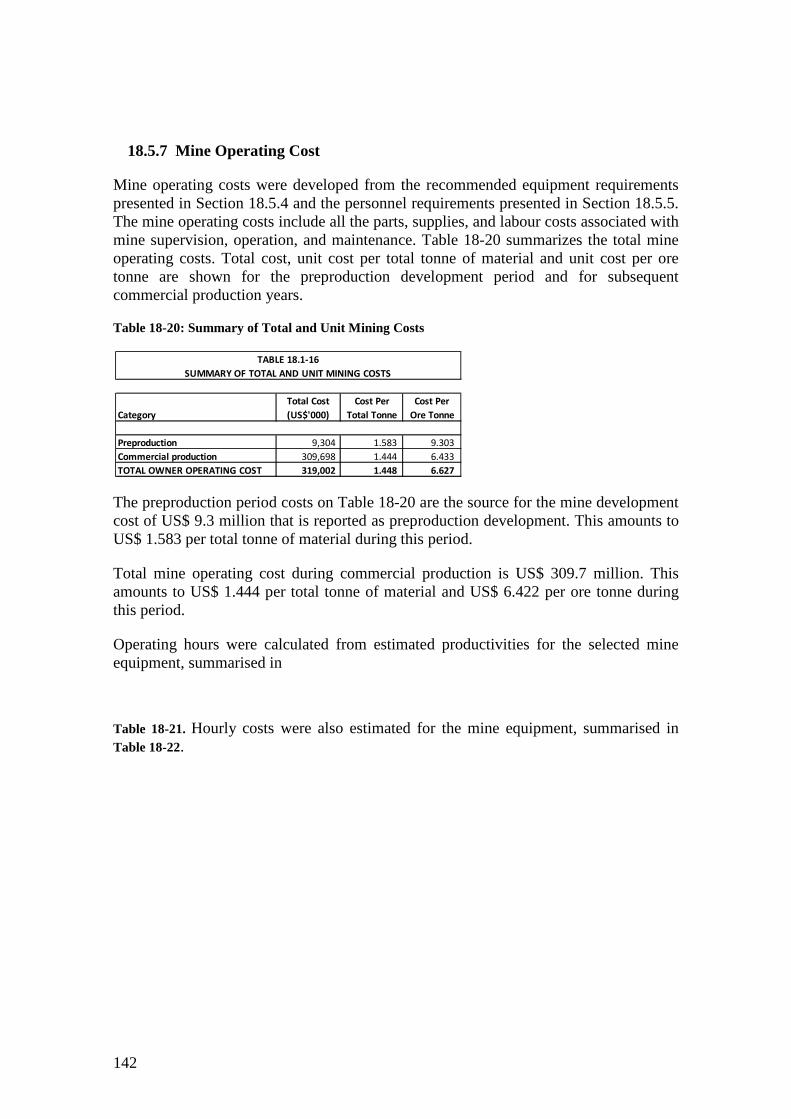
142
18.5.7 Mine Operating Cost
Mine operating costs were developed from the recommended equipment requirements presented in Section 18.5.4 and the personnel requirements presented in Section 18.5.5. The mine operating costs include all the parts, supplies, and labour costs associated with mine supervision, operation, and maintenance. Table 18-20 summarizes the total mine operating costs. Total cost, unit cost per total tonne of material and unit cost per ore tonne are shown for the preproduction development period and for subsequent commercial production years.
Table 18-20: Summary of Total and Unit Mining Costs
The preproduction period costs on Table 18-20 are the source for the mine development cost of US$ 9.3 million that is reported as preproduction development. This amounts to US$ 1.583 per total tonne of material during this period.
Total mine operating cost during commercial production is US$ 309.7 million. This amounts to US$ 1.444 per total tonne of material and US$ 6.422 per ore tonne during this period.
Operating hours were calculated from estimated productivities for the selected mine equipment, summarised in
Table 18-21. Hourly costs were also estimated for the mine equipment, summarised in Table 18-22.
Total Cost Cost Per Cost Per
(US$'000) Total Tonne Ore Tonne
Preproduction 9,304 1.583 9.303
Commercial production 309,698 1.444 6.433
TOTAL OWNER OPERATING COST 319,002 1.448 6.627
Category
TABLE 18.1-16
SUMMARY OF TOTAL AND UNIT MINING COSTS
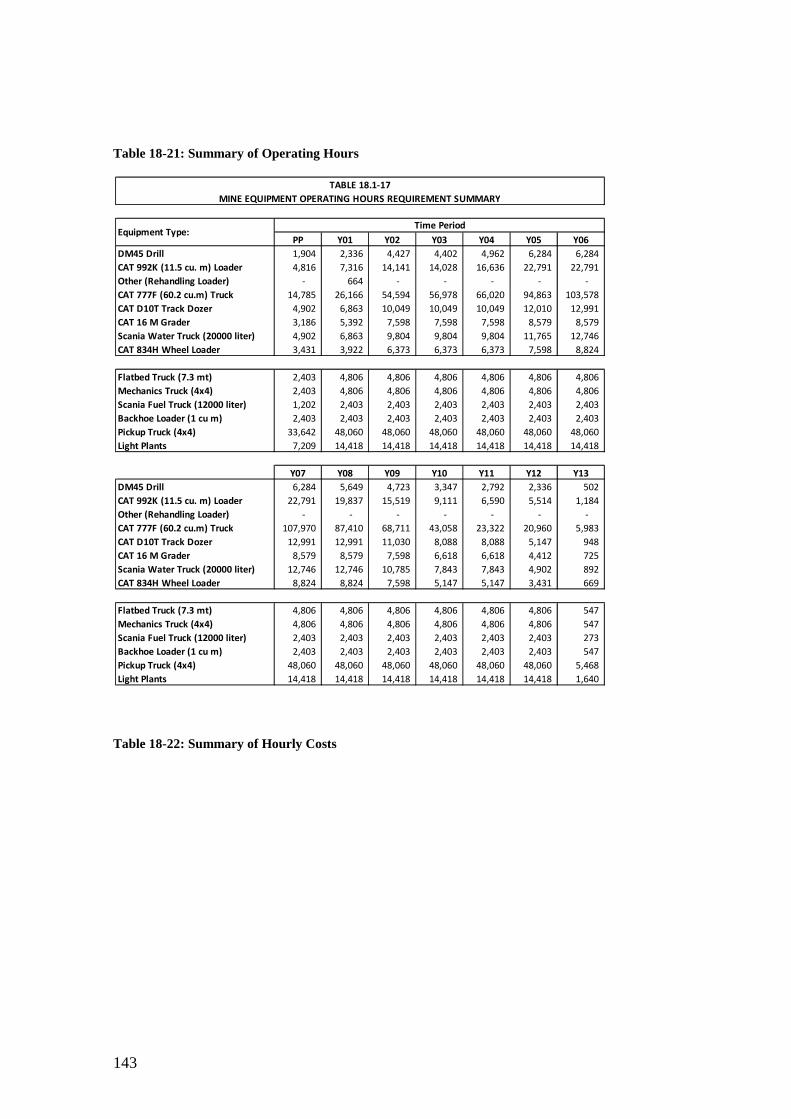
143
Table 18-21: Summary of Operating Hours
Table 18-22: Summary of Hourly Costs
PP Y01 Y02 Y03 Y04 Y05 Y06
DM45 Drill 1,904 2,336 4,427 4,402 4,962 6,284 6,284
CAT 992K (11.5 cu. m) Loader 4,816 7,316 14,141 14,028 16,636 22,791 22,791
Other (Rehandling Loader) - 664 - - - - -
CAT 777F (60.2 cu.m) Truck 14,785 26,166 54,594 56,978 66,020 94,863 103,578
CAT D10T Track Dozer 4,902 6,863 10,049 10,049 10,049 12,010 12,991
CAT 16 M Grader 3,186 5,392 7,598 7,598 7,598 8,579 8,579
Scania Water Truck (20000 liter) 4,902 6,863 9,804 9,804 9,804 11,765 12,746
CAT 834H Wheel Loader 3,431 3,922 6,373 6,373 6,373 7,598 8,824
Flatbed Truck (7.3 mt) 2,403 4,806 4,806 4,806 4,806 4,806 4,806
Mechanics Truck (4x4) 2,403 4,806 4,806 4,806 4,806 4,806 4,806
Scania Fuel Truck (12000 liter) 1,202 2,403 2,403 2,403 2,403 2,403 2,403
Backhoe Loader (1 cu m) 2,403 2,403 2,403 2,403 2,403 2,403 2,403
Pickup Truck (4x4) 33,642 48,060 48,060 48,060 48,060 48,060 48,060
Light Plants 7,209 14,418 14,418 14,418 14,418 14,418 14,418
Y07 Y08 Y09 Y10 Y11 Y12 Y13
DM45 Drill 6,284 5,649 4,723 3,347 2,792 2,336 502
CAT 992K (11.5 cu. m) Loader 22,791 19,837 15,519 9,111 6,590 5,514 1,184
Other (Rehandling Loader) - - - - - - -
CAT 777F (60.2 cu.m) Truck 107,970 87,410 68,711 43,058 23,322 20,960 5,983
CAT D10T Track Dozer 12,991 12,991 11,030 8,088 8,088 5,147 948
CAT 16 M Grader 8,579 8,579 7,598 6,618 6,618 4,412 725
Scania Water Truck (20000 liter) 12,746 12,746 10,785 7,843 7,843 4,902 892
CAT 834H Wheel Loader 8,824 8,824 7,598 5,147 5,147 3,431 669
Flatbed Truck (7.3 mt) 4,806 4,806 4,806 4,806 4,806 4,806 547
Mechanics Truck (4x4) 4,806 4,806 4,806 4,806 4,806 4,806 547
Scania Fuel Truck (12000 liter) 2,403 2,403 2,403 2,403 2,403 2,403 273
Backhoe Loader (1 cu m) 2,403 2,403 2,403 2,403 2,403 2,403 547
Pickup Truck (4x4) 48,060 48,060 48,060 48,060 48,060 48,060 5,468
Light Plants 14,418 14,418 14,418 14,418 14,418 14,418 1,640
Equipment Type:Time Period
TABLE 18.1-17
MINE EQUIPMENT OPERATING HOURS REQUIREMENT SUMMARY
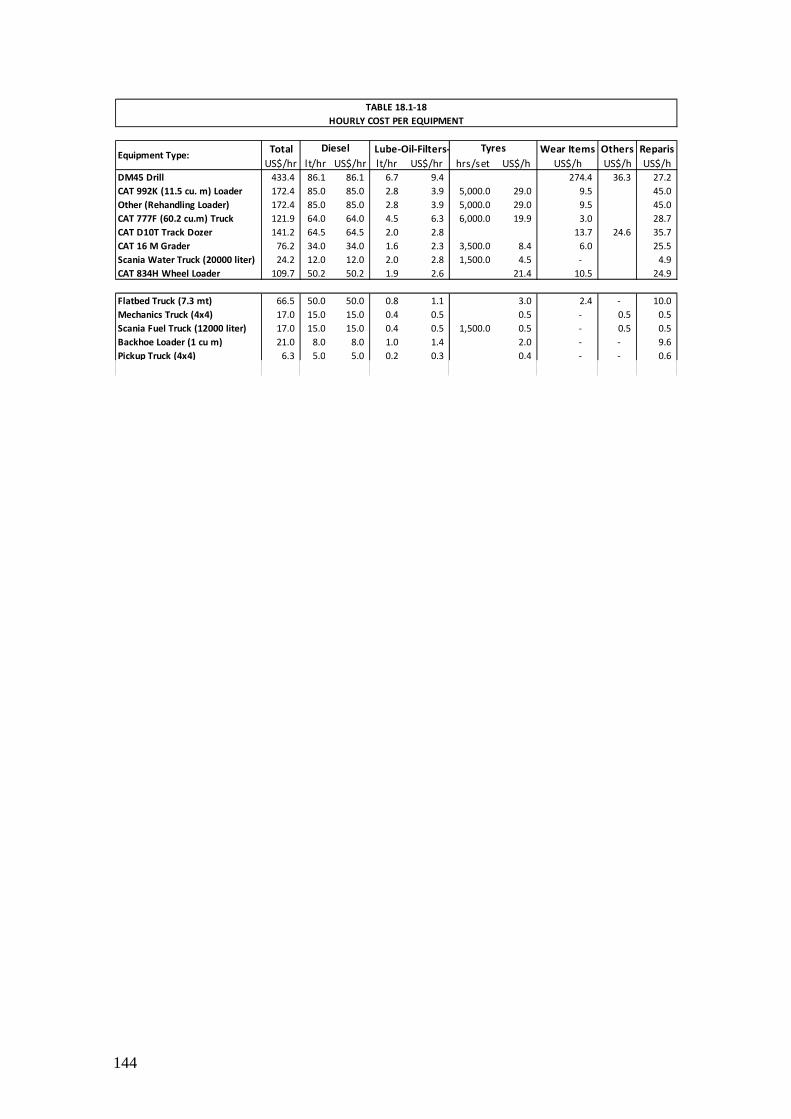
144
Total Wear Items Others Reparis
US$/hr lt/hr US$/hr lt/hr US$/hr hrs/set US$/h US$/h US$/h US$/h
DM45 Drill 433.4 86.1 86.1 6.7 9.4 274.4 36.3 27.2
CAT 992K (11.5 cu. m) Loader 172.4 85.0 85.0 2.8 3.9 5,000.0 29.0 9.5 45.0
Other (Rehandling Loader) 172.4 85.0 85.0 2.8 3.9 5,000.0 29.0 9.5 45.0
CAT 777F (60.2 cu.m) Truck 121.9 64.0 64.0 4.5 6.3 6,000.0 19.9 3.0 28.7
CAT D10T Track Dozer 141.2 64.5 64.5 2.0 2.8 13.7 24.6 35.7
CAT 16 M Grader 76.2 34.0 34.0 1.6 2.3 3,500.0 8.4 6.0 25.5
Scania Water Truck (20000 liter) 24.2 12.0 12.0 2.0 2.8 1,500.0 4.5 - 4.9
CAT 834H Wheel Loader 109.7 50.2 50.2 1.9 2.6 21.4 10.5 24.9
Flatbed Truck (7.3 mt) 66.5 50.0 50.0 0.8 1.1 3.0 2.4 - 10.0
Mechanics Truck (4x4) 17.0 15.0 15.0 0.4 0.5 0.5 - 0.5 0.5
Scania Fuel Truck (12000 liter) 17.0 15.0 15.0 0.4 0.5 1,500.0 0.5 - 0.5 0.5
Backhoe Loader (1 cu m) 21.0 8.0 8.0 1.0 1.4 2.0 - - 9.6
Pickup Truck (4x4) 6.3 5.0 5.0 0.2 0.3 0.4 - - 0.6
Equipment Type:Diesel Lube-Oil-Filters- Tyres
TABLE 18.1-18
HOURLY COST PER EQUIPMENT
145
Table 18-23 presents the mining costs in total dollars by the various cost centres (drilling blasting, loading, etc.) for each year. Table 18-24 presents a similar summary in dollars per total tonne.
The following factors are considered for the operating cost calculations:
• Local unit costs for consumable items such as diesel fuel and blasting agents. • Local hourly labour rates and fringe benefits were used. • Local costs for tires and spare parts were used. • Constant exchange rate of 1.80 Brazilian Real per US dollar. • The general activities that are included in the operating cost estimate are as
follows: • Construct the initial out-of-pit mine access roads from the pit area to the ore
crusher, waste storage areas, and stockpile areas. • Removal and storage of the topsoil within the pit area. • Preproduction development required to expose ore for initial production. • Mine and transport ore to the crusher area. Loading and transport ore from the
stockpile area to the crusher. Mine and transport waste material from the pit to the waste storage areas.
• Maintain all the mine work areas, in-pit haul roads, and external haul roads. Also maintain the waste storage areas.
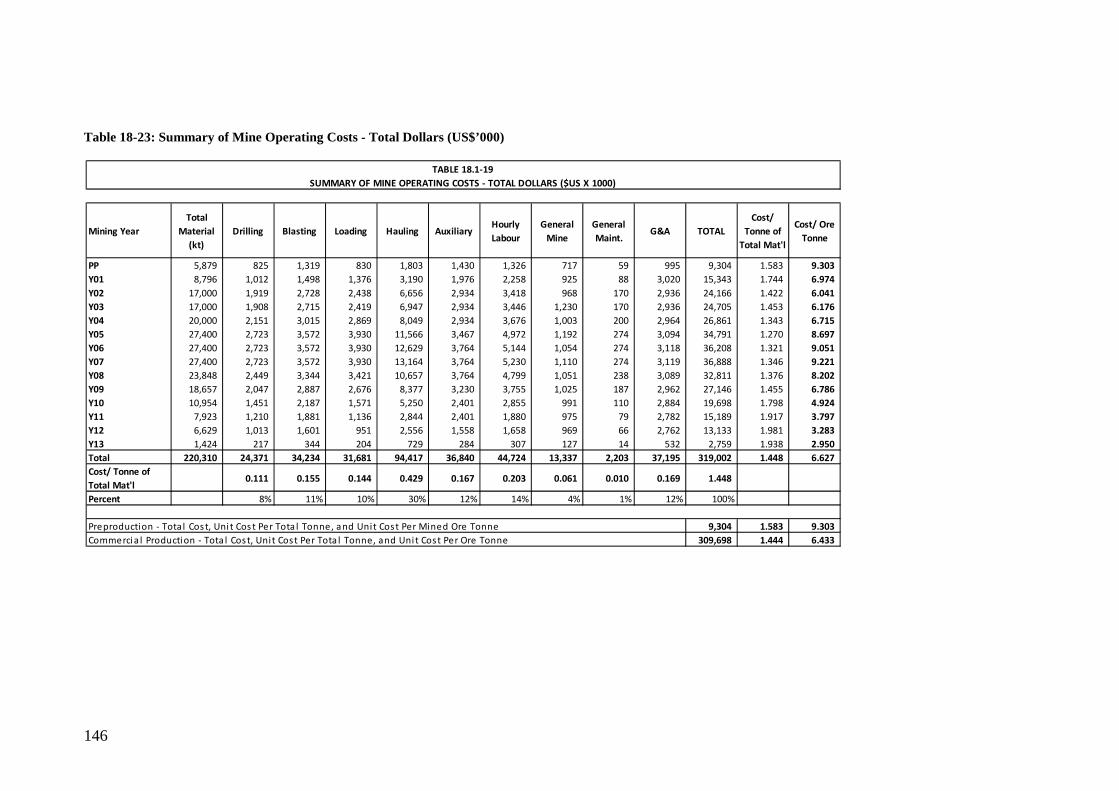
146
Table 18-23: Summary of Mine Operating Costs - Total Dollars (US$’000)
Mining Year
Total
Material
(kt)
Drilling Blasting Loading Hauling AuxiliaryHourly
Labour
General
Mine
General
Maint.G&A TOTAL
Cost/
Tonne of
Total Mat'l
Cost/ Ore
Tonne
PP 5,879 825 1,319 830 1,803 1,430 1,326 717 59 995 9,304 1.583 9.303
Y01 8,796 1,012 1,498 1,376 3,190 1,976 2,258 925 88 3,020 15,343 1.744 6.974
Y02 17,000 1,919 2,728 2,438 6,656 2,934 3,418 968 170 2,936 24,166 1.422 6.041
Y03 17,000 1,908 2,715 2,419 6,947 2,934 3,446 1,230 170 2,936 24,705 1.453 6.176
Y04 20,000 2,151 3,015 2,869 8,049 2,934 3,676 1,003 200 2,964 26,861 1.343 6.715
Y05 27,400 2,723 3,572 3,930 11,566 3,467 4,972 1,192 274 3,094 34,791 1.270 8.697
Y06 27,400 2,723 3,572 3,930 12,629 3,764 5,144 1,054 274 3,118 36,208 1.321 9.051
Y07 27,400 2,723 3,572 3,930 13,164 3,764 5,230 1,110 274 3,119 36,888 1.346 9.221
Y08 23,848 2,449 3,344 3,421 10,657 3,764 4,799 1,051 238 3,089 32,811 1.376 8.202
Y09 18,657 2,047 2,887 2,676 8,377 3,230 3,755 1,025 187 2,962 27,146 1.455 6.786
Y10 10,954 1,451 2,187 1,571 5,250 2,401 2,855 991 110 2,884 19,698 1.798 4.924
Y11 7,923 1,210 1,881 1,136 2,844 2,401 1,880 975 79 2,782 15,189 1.917 3.797
Y12 6,629 1,013 1,601 951 2,556 1,558 1,658 969 66 2,762 13,133 1.981 3.283
Y13 1,424 217 344 204 729 284 307 127 14 532 2,759 1.938 2.950
Total 220,310 24,371 34,234 31,681 94,417 36,840 44,724 13,337 2,203 37,195 319,002 1.448 6.627
Cost/ Tonne of
Total Mat'l 0.111 0.155 0.144 0.429 0.167 0.203 0.061 0.010 0.169 1.448
Percent 8% 11% 10% 30% 12% 14% 4% 1% 12% 100%
9,304 1.583 9.303
309,698 1.444 6.433
Preproduction - Total Cost, Uni t Cos t Per Tota l Tonne, and Unit Cost Per Mined Ore Tonne
Commercia l Production - Tota l Cost, Unit Cost Per Tota l Tonne, and Uni t Cost Per Ore Tonne
TABLE 18.1-19
SUMMARY OF MINE OPERATING COSTS - TOTAL DOLLARS ($US X 1000)
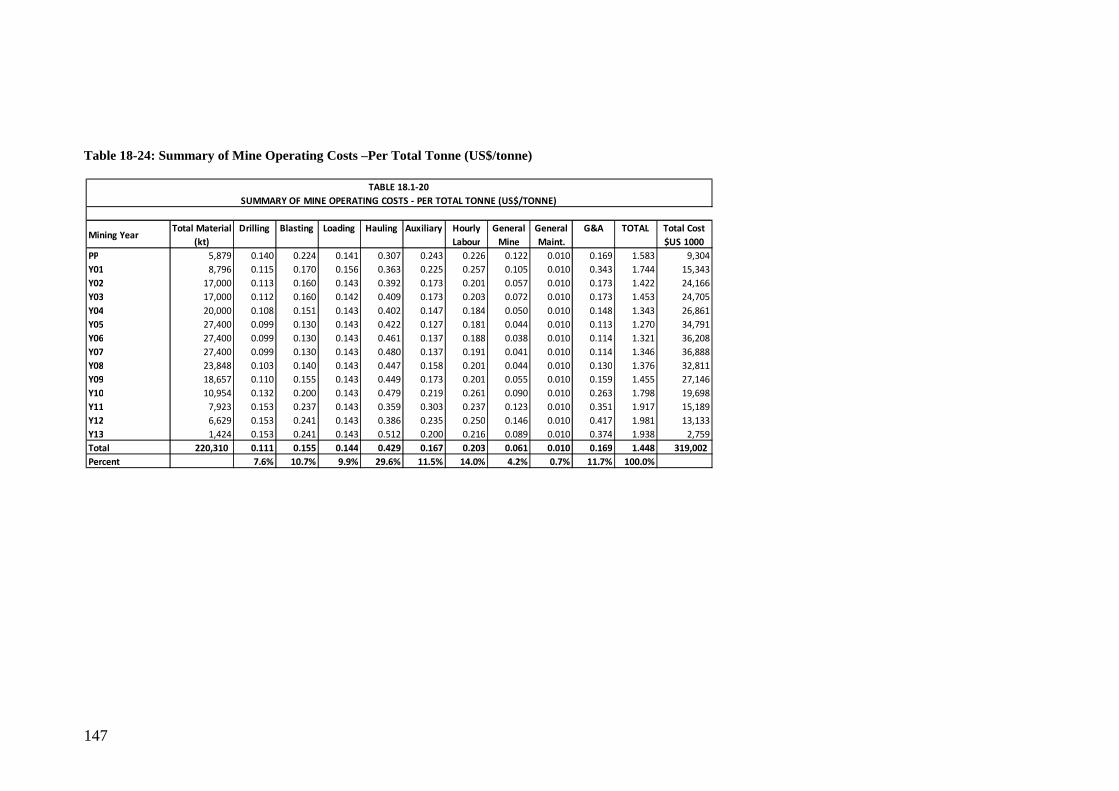
147
Table 18-24: Summary of Mine Operating Costs –Per Total Tonne (US$/tonne)
Mining YearTotal Material
(kt)
Drilling Blasting Loading Hauling Auxiliary Hourly
Labour
General
Mine
General
Maint.
G&A TOTAL Total Cost
$US 1000
PP 5,879 0.140 0.224 0.141 0.307 0.243 0.226 0.122 0.010 0.169 1.583 9,304
Y01 8,796 0.115 0.170 0.156 0.363 0.225 0.257 0.105 0.010 0.343 1.744 15,343
Y02 17,000 0.113 0.160 0.143 0.392 0.173 0.201 0.057 0.010 0.173 1.422 24,166
Y03 17,000 0.112 0.160 0.142 0.409 0.173 0.203 0.072 0.010 0.173 1.453 24,705
Y04 20,000 0.108 0.151 0.143 0.402 0.147 0.184 0.050 0.010 0.148 1.343 26,861
Y05 27,400 0.099 0.130 0.143 0.422 0.127 0.181 0.044 0.010 0.113 1.270 34,791
Y06 27,400 0.099 0.130 0.143 0.461 0.137 0.188 0.038 0.010 0.114 1.321 36,208
Y07 27,400 0.099 0.130 0.143 0.480 0.137 0.191 0.041 0.010 0.114 1.346 36,888
Y08 23,848 0.103 0.140 0.143 0.447 0.158 0.201 0.044 0.010 0.130 1.376 32,811
Y09 18,657 0.110 0.155 0.143 0.449 0.173 0.201 0.055 0.010 0.159 1.455 27,146
Y10 10,954 0.132 0.200 0.143 0.479 0.219 0.261 0.090 0.010 0.263 1.798 19,698
Y11 7,923 0.153 0.237 0.143 0.359 0.303 0.237 0.123 0.010 0.351 1.917 15,189
Y12 6,629 0.153 0.241 0.143 0.386 0.235 0.250 0.146 0.010 0.417 1.981 13,133
Y13 1,424 0.153 0.241 0.143 0.512 0.200 0.216 0.089 0.010 0.374 1.938 2,759
Total 220,310 0.111 0.155 0.144 0.429 0.167 0.203 0.061 0.010 0.169 1.448 319,002
Percent 7.6% 10.7% 9.9% 29.6% 11.5% 14.0% 4.2% 0.7% 11.7% 100.0%
TABLE 18.1-20
SUMMARY OF MINE OPERATING COSTS - PER TOTAL TONNE (US$/TONNE)
148
The contents of the various cost centres mentioned in the previous tables are summarized as follows:
DRILLING
The parts and consumables cost associated with operating and maintaining the Atlas Copco ROC L8, including bits and other down the hole accessories.
BLASTING
The parts and consumables cost for blasting supplies. Blasting services are provided by a contractor and the labour cost for the blasting personnel is included in the delivered price of the explosives.
LOADING
The parts and consumables cost associated with operating and maintaining the fleet of CAT 992 loaders.
HAULING
The parts and consumables cost associated with operating and maintaining the fleet of CAT 777F90mt conventional haul trucks.
AUXILIARY
The parts and consumables cost associated with operating and maintaining the fleet of auxiliary mine equipment. This includes the Caterpillar D9T track dozers, the Caterpillar 160M graders and the water trucks.
HOURLY LABOUR
All the labour costs for operating all major and auxiliary equipments, all of the maintenance labour, general labourers and pump men, as previously detailed in Table 18-16.
The allowance in the manpower that is required to cover vacations, sick leave, and absenteeism (VS&A) and initial training costs are considered as part of Mine G&A.
Training cost was estimated as 15% of the hourly labour during preproduction and first year of commercial production.
GENERAL MINE
The parts and consumables cost associated with maintaining the small mine operations support equipment such as the flat bed trucks, pickups, light plants, etc.
Office supplies and utilities for the mine operations office, mine engineering and geology.
Pit dewatering operating cost (parts, consumables and power).
Road treatments, including chemicals and aggregate.
149
An allowance of US$$ 0.052 per tonne of total material in average is included for all the above items.
GENERAL MAINTENANCE
The parts and consumables cost associated with maintaining the mine maintenance support equipment (such as the fuel and lube truck, mechanics trucks, etc.).
Office supplies and utilities for the mine maintenance office, shop and warehouse.
An allowance of $US 0.010 per tonne of total material is included for all the above items.
MINE GENERAL AND ADMINISTRATIVE (G&A)
The labour cost of salaried personnel including fringe benefits. This includes mine operations, mine maintenance, engineering, and geology.
The labour cost for the personnel required to cover vacations, sick leave, and absenteeism (VS&A) and initial training costs.
150
18.6 ENVIRONMENTAL AND SOCIAL ASPECTS
18.6.1 Enviromental Conditions
Local physiography consists of somewhat rugged topography forming hills and valleys. Serra Leste is the highest point of land on the Tocantinzinho property and is about 50 meters above the surrounding drainages. Vegetation is typical of that found in a tropical jungle environment of the Amazon basin. The only areas not covered by jungle are those worked by the garimpeiros and the drainages filled by either tailings or swamps.
The local climate has two seasons, the rainy season from January to June, and the dry season from July to December. This climate is characteristic of much of the state of Pará. The average daytime temperature in the project area is 26.1º C. The temperatures don’t vary significantly with maximum of 33°C and a minimum of 24.5°C. Relative humidity averages 75% with an annual range from 70% to 80%. Rainfall in the project area is about 1,370 mm per year.
The project area is in the Tocantinzinho basin, which empties into Jamanxim basin. That basin empties into the Tapajós basin, which empties into the Amazon basin. The rivers near the area present sandy beds and are not very deep, making navigation difficult.
18.6.2 Social Parameters
There are no permanent inhabitants within the boundaries of Brazauro’s properties. However there are currently, about six to eight teams of local garimpeiros operating in some areas of Brazauro properties. The nearest town to Tocantinzinho with social services is Itaituba that has a population of approximately 126,000 inhabitants. Banking, postal service, health services and communications, as well as education centers, and regular air service to other major cities, such as Belem, Manaus and Cuiabá, etc. are available at Itaituba. Labor required for Project development and operations will be brought into the Project from Itaituba and other Pará State cities.
There may be sufficient surface rights within the Brazauro properties for infrastructure requirements, including an extended airstrip. Brazauro is investigating the possibility of connecting the Project area by road to the nearby logging road system, a distance of about 12 kilometers. This road would allow access via the Mamoal garimpo to the main N-S road system.
Water for Tocantinzinho is abundant, with the Tocantins River within 1,000 meters. No electric power is available within the Project’s vicinity.
Fuel and other major supplies are currently brought into the Tocantinzinho area by water ways. People, food supplies and other items are brought into the area by small airplanes from Itaituba.
151
18.6.3 Brazilian Permitting Process
When a Class II mineral extraction project (as defined in the Mining Code) is presented for development, a multidisciplinary technical review team is appointed by the State Council for Environmental Matters (CEPRAM) to review the project. This team sets the Terms of Reference for the environmental impact assessment (EIA) and the RIMA (Relatório de Impacto Ambiental). A RIMA is a document that summarizes the full impact assessment for review by the public. The permitting process is as follows:
• The project EIA, has to be submitted to the Pará State Environmental Agency (CRA);
• CRA’s review of the EIA/RIMA is expected to take place during the date defined on the report. Since no specific time limit is attached to this review, the completion date for this process is unknown;
• Once the review is complete, the government announces the publication in the official Gazette, initiating a 45-day public review period;
• During this review period, the company also makes a presentation, in a public forum, at which time public comments may be received;
• Depending upon the results of the review, and taking into consideration public comments, the project will be granted (or denied) a Licença Prévia (Preliminary License) to proceed with development.
• Following issuance of the Preliminary License, the proponent can proceed with application for a Construction / Implementation License which is expected to take 60 to 90 days to process;
• An Operational License is applied after construction and requires review and renewal after three years.
18.6.4 International Financing
If international financing is sought, there are a number of updates that need to be made to the environmental and social components of the project. An update of the environmental and social impact assessment (ESIA) to international standards will be necessary on the feasibility design.
In particular, current water quality, hydrology and meteorology data need to be collected. Waste rock and tailings geochemical characterization and water quality modeling need to be completed. A public consultation and disclosure plan will need to be prepared as part of the ESIA. Detailed environmental and social action plans will need to be developed prior to construction.
152
18.6.5 Social and Environmental Contribution
The Tocantinzinho Project will be important to development of the region, giving social support and necessary infrastructure for neighborhood, generating 488 direct jobs and 1500 indirect jobs.
Besides the investments made to the implementation phases, Brazauro also has a reclamation plan to the area. The total investment to mine closure reaches 3.2 million dollars and includes demolition and remobilization of mine infrastructure and area reforestation. This total is divided as follow: US$ 1.2 million as operational costs (over the normal expense of US$ 0.60/ton for environment protection) in the last six years of operation, and US$ 2 million for demolition and final closure, after the end of the operation.
Acid drainage treatment it not expected to be a problem because of high dilution, due to rainfall precipitation, and the low content in sulphide of the granite hosting the mineralization.
This project also has the concern of sustainable development, dealing with economical and social developments, respecting environment by giving a quality of life to local population.
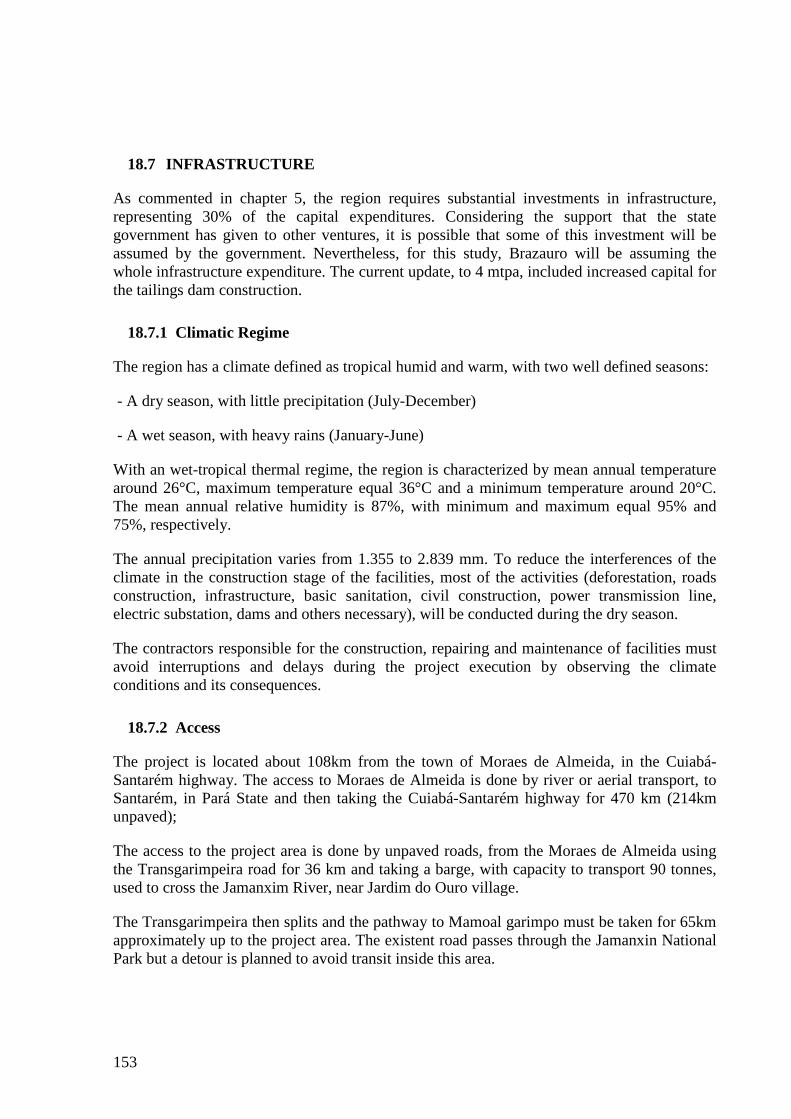
153
18.7 INFRASTRUCTURE
As commented in chapter 5, the region requires substantial investments in infrastructure, representing 30% of the capital expenditures. Considering the support that the state government has given to other ventures, it is possible that some of this investment will be assumed by the government. Nevertheless, for this study, Brazauro will be assuming the whole infrastructure expenditure. The current update, to 4 mtpa, included increased capital for the tailings dam construction.
18.7.1 Climatic Regime
The region has a climate defined as tropical humid and warm, with two well defined seasons:
- A dry season, with little precipitation (July-December)
- A wet season, with heavy rains (January-June)
With an wet-tropical thermal regime, the region is characterized by mean annual temperature around 26°C, maximum temperature equal 36°C and a minimum temperature around 20°C. The mean annual relative humidity is 87%, with minimum and maximum equal 95% and 75%, respectively.
The annual precipitation varies from 1.355 to 2.839 mm. To reduce the interferences of the climate in the construction stage of the facilities, most of the activities (deforestation, roads construction, infrastructure, basic sanitation, civil construction, power transmission line, electric substation, dams and others necessary), will be conducted during the dry season.
The contractors responsible for the construction, repairing and maintenance of facilities must avoid interruptions and delays during the project execution by observing the climate conditions and its consequences.
18.7.2 Access
The project is located about 108km from the town of Moraes de Almeida, in the Cuiabá-Santarém highway. The access to Moraes de Almeida is done by river or aerial transport, to Santarém, in Pará State and then taking the Cuiabá-Santarém highway for 470 km (214km unpaved);
The access to the project area is done by unpaved roads, from the Moraes de Almeida using the Transgarimpeira road for 36 km and taking a barge, with capacity to transport 90 tonnes, used to cross the Jamanxim River, near Jardim do Ouro village.
The Transgarimpeira then splits and the pathway to Mamoal garimpo must be taken for 65km approximately up to the project area. The existent road passes through the Jamanxin National Park but a detour is planned to avoid transit inside this area.
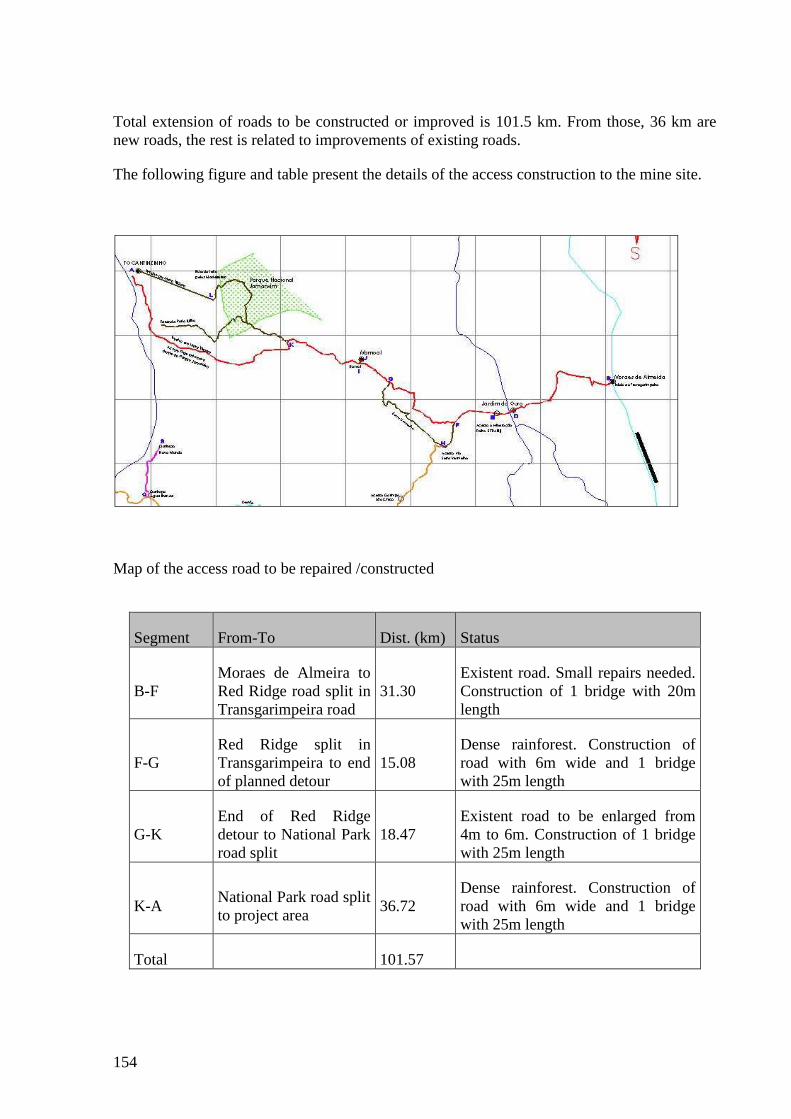
154
Total extension of roads to be constructed or improved is 101.5 km. From those, 36 km are new roads, the rest is related to improvements of existing roads.
The following figure and table present the details of the access construction to the mine site.
Map of the access road to be repaired /constructed
Segment From-To Dist. (km) Status
B-F Moraes de Almeira to Red Ridge road split in Transgarimpeira road
31.30 Existent road. Small repairs needed. Construction of 1 bridge with 20m length
F-G Red Ridge split in Transgarimpeira to end of planned detour
15.08 Dense rainforest. Construction of road with 6m wide and 1 bridge with 25m length
G-K End of Red Ridge detour to National Park road split
18.47 Existent road to be enlarged from 4m to 6m. Construction of 1 bridge with 25m length
K-A National Park road split to project area
36.72 Dense rainforest. Construction of road with 6m wide and 1 bridge with 25m length
Total 101.57
155
18.7.3 Access construction details
The access modifications (planned access and planned detour) are recommended because of minor impact in the National Park site and to avoid the Red Ridge (Serra Vermelha) topography.
The main use of this trajectory will be due to project activities and this will prevent high cost maintenance of the roads.
With 7m wide, the Transgarimpeira road will be used by the project activities in 31km of its extension. Repairing and improvement of this portion is recommended. This may include 15cm gravel cover, drainage apparatus installation and substitution and removal of undesirable material over the road.
Nearby Moraes de Almeida in the first kilometers of Transgarimpeira, a timber bridge with 20m long must be substituted by a concrete one. A timber culvert must be also substituted by ARMCO-like pipe between Jardim do Ouro village and planned detour road split.
Internal roads of the project will have about 10km long, with 15m wide. Deforestation of additional 3m at each side of the roads is planned. For better luminosity and evaporation of roads and to avoid fall of vegetation over the road, large diameter trees must be removed within a buffer area equal 27m around the roads.
18.7.4 Earthmoving
The earthmoving necessary is the leveling of an area in the approximated dimension of 500m x 400m, for the erection of the project’s plant. The platforms to be generated will have benches, which protection are to be done using drainage devices and grass seeding and other solutions that may be applied.
Deforestation should be executed observing the area of earthmoving and an additional area of 3m around the platforms.
Dykes for deviation of rain water are also considered, for the protection of the pit area.
18.7.5 Dams: Tailing/Water Containment
Two dams will be constructed for the tailings retention, as well as a number of smaller dams designed for fines collection, water reservoir and water deviation from the pit area. No waterproofing is projected in the tailings dam, assuming that the tailings will be non-pollutant.
A smaller dam will be built to contain the rejects of the CIL plant, which will require lining.
18.7.6 Explosives Deposit
Earthmoving and deforestation will be required for the construction of the explosives deposit that may have dimensions of at least 20x20m.

156
18.7.7 Airstrip
An existent airstrip near the project area is to be enlarged and improved. Its dimensions will be increased from 7 x 350m to 30 x 1100m. To conform the airstrip in the terrain, benches may be protected against erosion using grass seeding, drainage systems and any other techniques that may be applied.
Deforestation will follow the same settings described in the items above, with additional 3m of total removal of vegetation and selective tree removal within 27m around the airstrip.
Lateritic gravel will be used to cover all the airstrip extension at a depth of 30cm. Also, a building for administrative support besides the airstrip will be erected.
18.7.8 Basic Sanitation
This item includes reception, pumping, treatment, storage and distribution of industrial and drinkable water and sanitary facilities with sewer treatment.
Investments in basic sanitation will include:
• Raw water treatment and pumping station (30m³/hour) • Raw water adductor, from Veados Creek to the plant center • Sewage treatment station and installations (500 persons) • Lifted drinkable water disposal with 5000 litres capacity • Lifted industrial water disposal with 20,000 litres capacity • Water distribution net - drinkable and industrial.
18.7.9 Other Works
Administrative office buildings must be constructed using prefabricated timber walls and will have approximately 800m².
Other works listed in the infrastructure Capex are:
• Staff lodgment – 50 persons, 200m²;
• Operators’ lodgment – 250 persons, 650m²;
• Leisure area: 300m²;
• Laundry: 50m²
• Sanitary and washroom: 80m². Installations within administrative and industrial buildings. It may be dimensioned as 1 piece for 20 persons;
• Chemical sanitary (6 units): to be used in mobile activities;
• Kitchen and dining hall: 200m²;
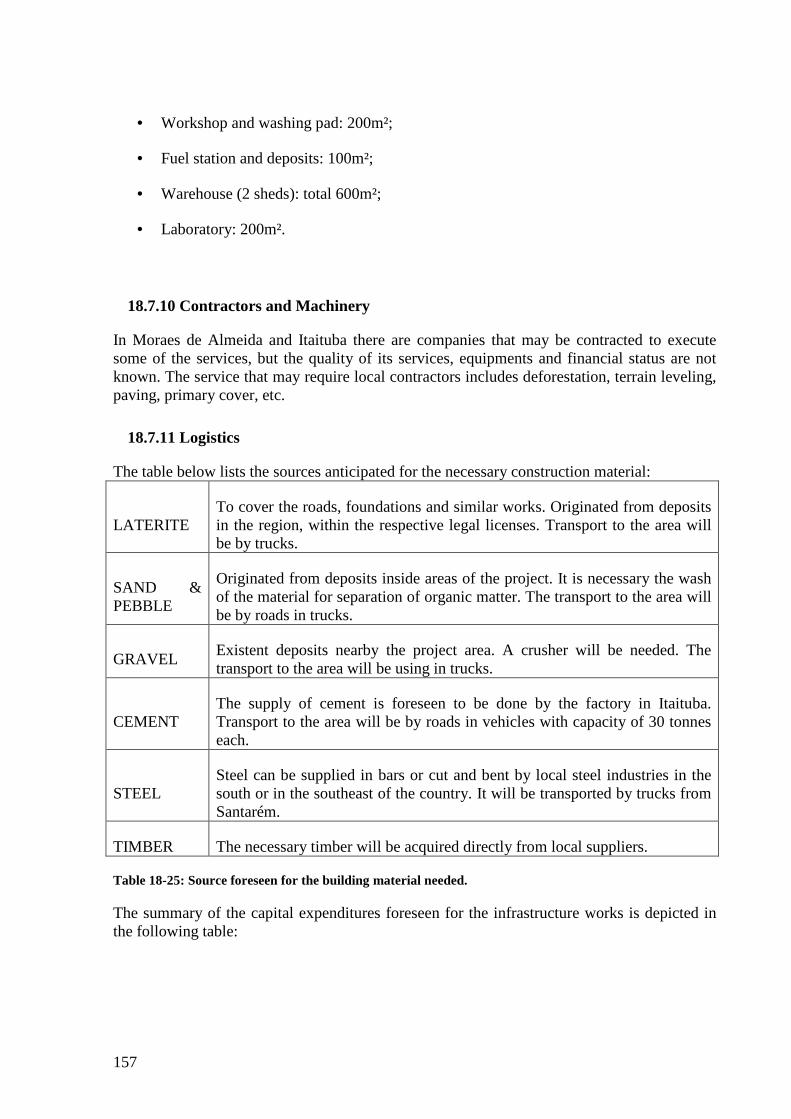
157
• Workshop and washing pad: 200m²;
• Fuel station and deposits: 100m²;
• Warehouse (2 sheds): total 600m²;
• Laboratory: 200m².
18.7.10 Contractors and Machinery
In Moraes de Almeida and Itaituba there are companies that may be contracted to execute some of the services, but the quality of its services, equipments and financial status are not known. The service that may require local contractors includes deforestation, terrain leveling, paving, primary cover, etc.
18.7.11 Logistics
The table below lists the sources anticipated for the necessary construction material:
LATERITE To cover the roads, foundations and similar works. Originated from deposits in the region, within the respective legal licenses. Transport to the area will be by trucks.
SAND & PEBBLE
Originated from deposits inside areas of the project. It is necessary the wash of the material for separation of organic matter. The transport to the area will be by roads in trucks.
GRAVEL Existent deposits nearby the project area. A crusher will be needed. The transport to the area will be using in trucks.
CEMENT The supply of cement is foreseen to be done by the factory in Itaituba. Transport to the area will be by roads in vehicles with capacity of 30 tonnes each.
STEEL Steel can be supplied in bars or cut and bent by local steel industries in the south or in the southeast of the country. It will be transported by trucks from Santarém.
TIMBER The necessary timber will be acquired directly from local suppliers.
Table 18-25: Source foreseen for the building material needed.
The summary of the capital expenditures foreseen for the infrastructure works is depicted in the following table:
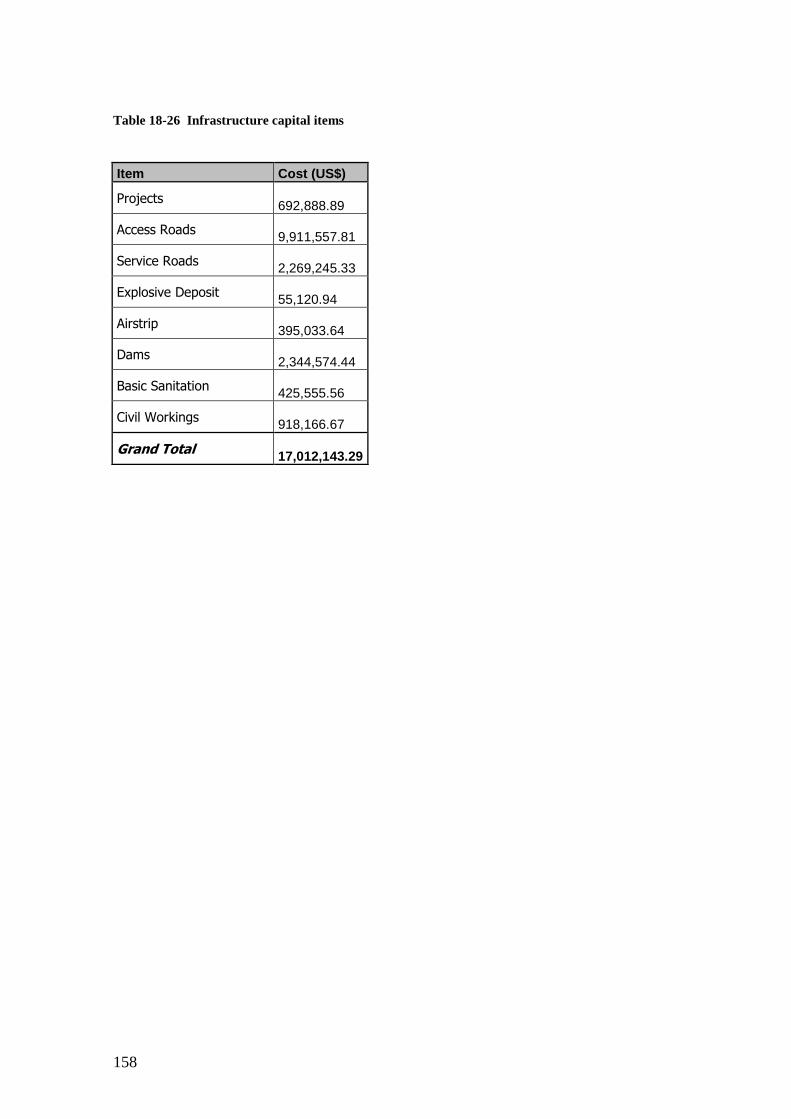
158
Table 18-26 Infrastructure capital items
Item Cost (US$)
Projects 692,888.89
Access Roads 9,911,557.81
Service Roads 2,269,245.33
Explosive Deposit 55,120.94
Airstrip 395,033.64
Dams 2,344,574.44
Basic Sanitation 425,555.56
Civil Workings 918,166.67
Grand Total 17,012,143.29
159
18.8 PROJECT ECONOMICS
18.8.1 Assumptions used
Valuation Parameters: Tocantinzinho was valued with projected cash flows being discounted at a rate of 5% in nominal terms. A fixed Brazilian exchange rate of R$ 1.80 / 1 US$ was used.
Financing: For project evaluation purposes, no financing has been considered. Nonetheless, for this size of project, it is possible to use the credit lines of BNDES, the Brazilian development bank, which has long-term credit facilities for projects in general, available in local currency (Reais) and also indexed to a currency basket. More attractive conditions may be available for a project in the Amazon region.
Gold Price: For pit optimization and subsequent cash flow projection a gold price of US$ 900/oz was used.
Sunk Costs: The current exercise considers all the expenses incurred with the project, such as the acquisition of the property and exploration directly linked to the deposit. These values were used to reduce the taxable profit, since the Brazilian law allows the deduction of the mine depletion. For the acquisition of the property, the total spent was US$ 4,665 million. In capitalized exploration (the expenses related directly to the discovery and delineation of the deposit), the total spent was US$ 5,100 million. Both values were used to deduct profits, in a straight line, as allowed by the Brazilian law. Costs incurred by Eldorado were not included in this estimation.
Royalties: Two royalties have been included in the valuation:
•The state royalty of 1%, which is the rate applicable to gold, on sales.
•The NSR royalty of 1.5%, payable to Alan Carter and Dennis Moore, the previous owners of the project. Capital costs of US$ 5.5 million have been foreseen in the project capital, order to bring down this rate from the current 3.5% agreed (see section 4.2.1)
In this assessment, the land owner royalty has not been included because the land is public, no legal owner exists to claim this right. For information, it represents 50% of the state royalty, or 0.50% of the revenue.
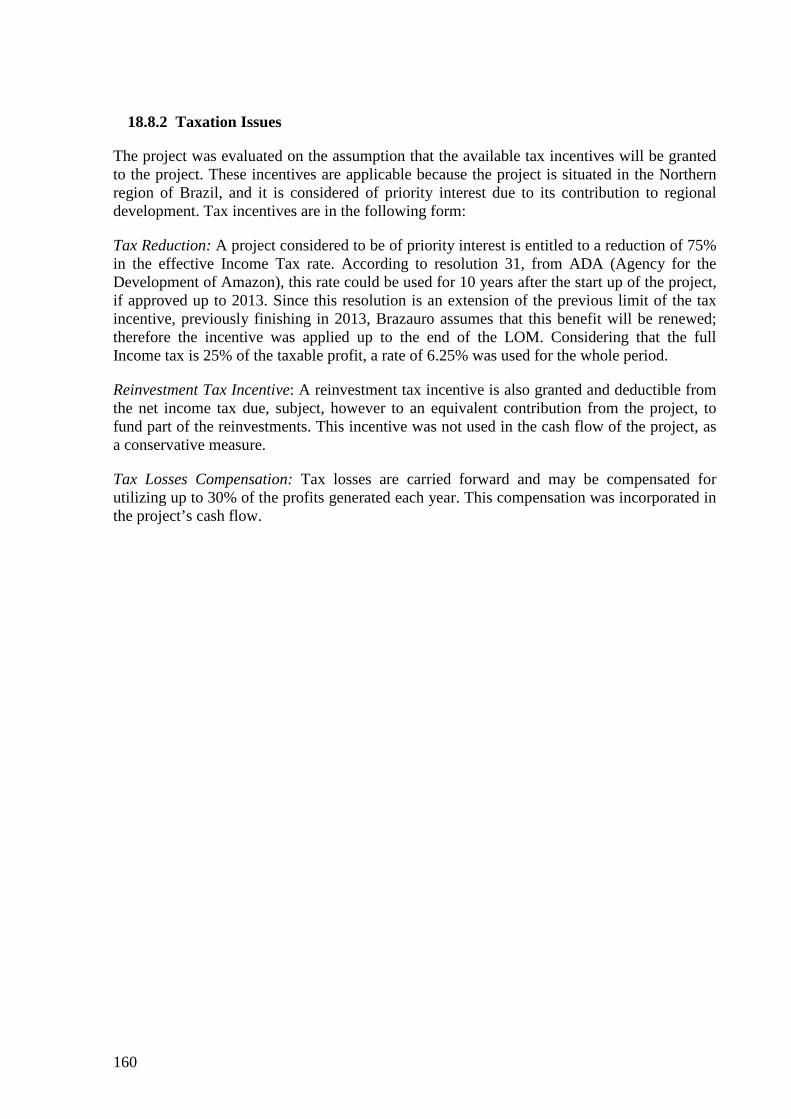
160
18.8.2 Taxation Issues
The project was evaluated on the assumption that the available tax incentives will be granted to the project. These incentives are applicable because the project is situated in the Northern region of Brazil, and it is considered of priority interest due to its contribution to regional development. Tax incentives are in the following form:
Tax Reduction: A project considered to be of priority interest is entitled to a reduction of 75% in the effective Income Tax rate. According to resolution 31, from ADA (Agency for the Development of Amazon), this rate could be used for 10 years after the start up of the project, if approved up to 2013. Since this resolution is an extension of the previous limit of the tax incentive, previously finishing in 2013, Brazauro assumes that this benefit will be renewed; therefore the incentive was applied up to the end of the LOM. Considering that the full Income tax is 25% of the taxable profit, a rate of 6.25% was used for the whole period.
Reinvestment Tax Incentive: A reinvestment tax incentive is also granted and deductible from the net income tax due, subject, however to an equivalent contribution from the project, to fund part of the reinvestments. This incentive was not used in the cash flow of the project, as a conservative measure.
Tax Losses Compensation: Tax losses are carried forward and may be compensated for utilizing up to 30% of the profits generated each year. This compensation was incorporated in the project’s cash flow.
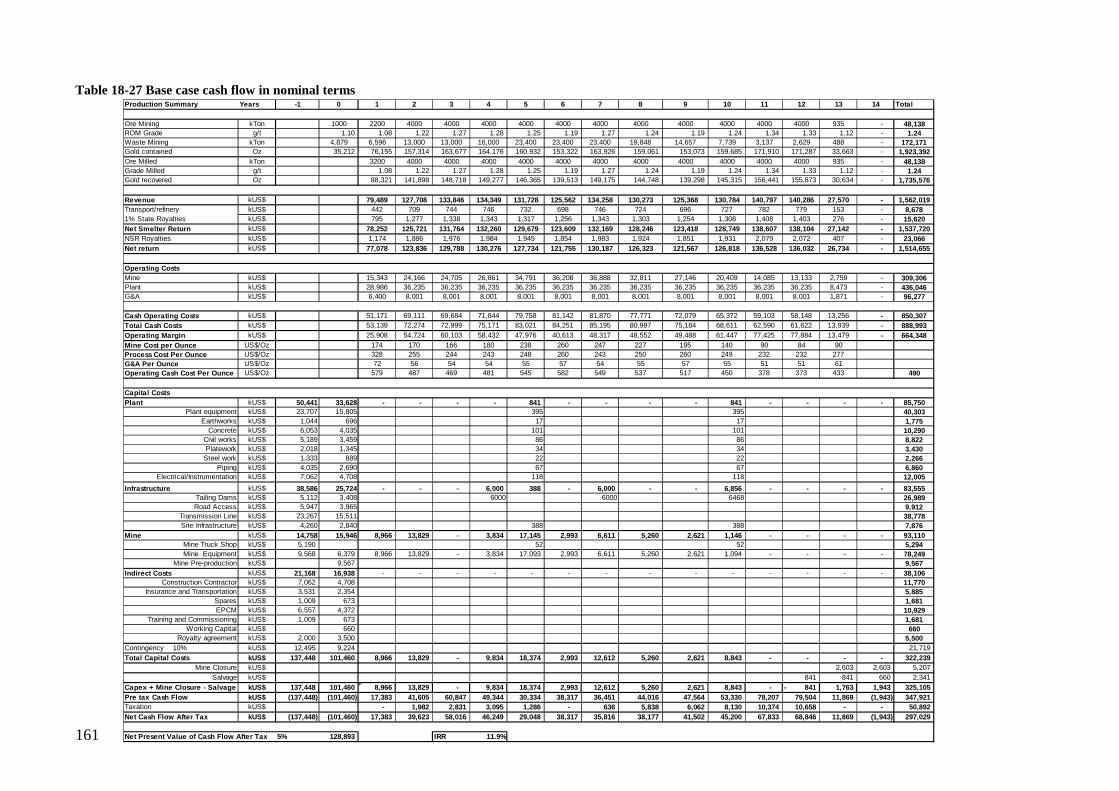
161
Table 18-27 Base case cash flow in nominal terms
Production Summary Years -1 0 1 2 3 4 5 6 7 8 9 10 11 12 13 14 Total
Ore Mining kTon 1000 2200 4000 4000 4000 4000 4000 4000 4000 4000 4000 4000 4000 935 - 48,138ROM Grade g/t 1.10 1.08 1.22 1.27 1.28 1.25 1.19 1.27 1.24 1.19 1.24 1.34 1.33 1.12 - 1.24Waste Mining kTon 4,879 6,596 13,000 13,000 16,000 23,400 23,400 23,400 19,848 14,657 7,739 3,137 2,629 488 - 172,171Gold contained Oz 35,212 76,155 157,314 163,677 164,176 160,932 153,322 163,926 159,061 153,073 159,685 171,910 171,287 33,663 - 1,923,392Ore Milled kTon 3200 4000 4000 4000 4000 4000 4000 4000 4000 4000 4000 4000 935 - 48,138Grade Milled g/t 1.08 1.22 1.27 1.28 1.25 1.19 1.27 1.24 1.19 1.24 1.34 1.33 1.12 - 1.24Gold recovered Oz 88,321 141,898 148,718 149,277 146,365 139,513 149,175 144,748 139,298 145,315 156,441 155,873 30,634 - 1,735,576
Revenue kUS$ 79,489 127,708 133,846 134,349 131,728 125,562 134,258 130,273 125,368 130,784 140,797 140,286 27,570 - 1,562,019Transport/refinery kUS$ 442 709 744 746 732 698 746 724 696 727 782 779 153 - 8,6781% State Royalties kUS$ 795 1,277 1,338 1,343 1,317 1,256 1,343 1,303 1,254 1,308 1,408 1,403 276 - 15,620Net Smelter Return kUS$ 78,252 125,721 131,764 132,260 129,679 123,609 132,169 128,246 123,418 128,749 138,607 138,104 27,142 - 1,537,720NSR Royalties kUS$ 1,174 1,886 1,976 1,984 1,945 1,854 1,983 1,924 1,851 1,931 2,079 2,072 407 - 23,066Net return kUS$ 77,078 123,836 129,788 130,276 127,734 121,755 130,187 126,323 121,567 126,818 136,528 136,032 26,734 - 1,514,655
Operating CostsMine kUS$ 15,343 24,166 24,705 26,861 34,791 36,208 36,888 32,811 27,146 20,409 14,085 13,133 2,759 - 309,306Plant kUS$ 28,986 36,235 36,235 36,235 36,235 36,235 36,235 36,235 36,235 36,235 36,235 36,235 8,473 - 436,046G&A kUS$ 6,400 8,001 8,001 8,001 8,001 8,001 8,001 8,001 8,001 8,001 8,001 8,001 1,871 - 96,277
Cash Operating Costs kUS$ 51,171 69,111 69,684 71,844 79,758 81,142 81,870 77,771 72,079 65,372 59,103 58,148 13,256 - 850,307Total Cash Costs kUS$ 53,139 72,274 72,999 75,171 83,021 84,251 85,195 80,997 75,184 68,611 62,590 61,622 13,939 - 888,993Operating Margin kUS$ 25,908 54,724 60,103 58,432 47,976 40,613 48,317 48,552 49,488 61,447 77,425 77,884 13,479 - 664,348Mine Cost per Ounce US$/Oz 174 170 166 180 238 260 247 227 195 140 90 84 90Process Cost Per Ounce US$/Oz 328 255 244 243 248 260 243 250 260 249 232 232 277G&A Per Ounce US$/Oz 72 56 54 54 55 57 54 55 57 55 51 51 61Operating Cash Cost Per Ounce US$/Oz 579 487 469 481 545 582 549 537 517 450 378 373 433 490
Capital CostsPlant kUS$ 50,441 33,628 - - - - 841 - - - - 841 - - - - 85,750
Plant equipment kUS$ 23,707 15,805 395 395 40,303Earthworks kUS$ 1,044 696 17 17 1,775
Concrete kUS$ 6,053 4,035 101 101 10,290Civil works kUS$ 5,189 3,459 86 86 8,822Platework kUS$ 2,018 1,345 34 34 3,430
Steel work kUS$ 1,333 889 22 22 2,266Piping kUS$ 4,035 2,690 67 67 6,860
Electrical/Instrumentation kUS$ 7,062 4,708 118 118 12,005
Infrastructure kUS$ 38,586 25,724 - - - 6,000 388 - 6,000 - - 6,856 - - - - 83,555Tailing Dams kUS$ 5,112 3,408 6000 6000 6468 26,989Road Access kUS$ 5,947 3,965 9,912
Transmission Line kUS$ 23,267 15,511 38,778Site Infrastructure kUS$ 4,260 2,840 388 388 7,876
Mine kUS$ 14,758 15,946 8,966 13,829 - 3,834 17,145 2,993 6,611 5,260 2,621 1,146 - - - - 93,110Mine Truck Shop kUS$ 5,190 52 52 5,294Mine Equipment kUS$ 9,568 6,379 8,966 13,829 - 3,834 17,093 2,993 6,611 5,260 2,621 1,094 - - - - 78,249
Mine Pre-production kUS$ 9,567 9,567Indirect Costs kUS$ 21,168 16,938 - - - - - - - - - - - - - - 38,106
Construction Contractor kUS$ 7,062 4,708 11,770Insurance and Transportation kUS$ 3,531 2,354 5,885
Spares kUS$ 1,009 673 1,681EPCM kUS$ 6,557 4,372 10,929
Training and Commissioning kUS$ 1,009 673 1,681Working Capital kUS$ 660 660
Royalty agreement kUS$ 2,000 3,500 5,500Contingency 10% kUS$ 12,495 9,224 21,719 Total Capital Costs kUS$ 137,448 101,460 8,966 13,829 - 9,834 18,374 2,993 12,612 5,260 2,621 8,843 - - - - 322,239
Mine Closure kUS$ 2,603 2,603 5,207 Salvage kUS$ 841 841 660 2,341
Capex + Mine Closure - Salvage kUS$ 137,448 101,460 8,966 13,829 - 9,834 18,374 2,993 12,612 5,260 2,621 8,843 - 841- 1,763 1,943 325,105 Pre tax Cash Flow kUS$ (137,448) (101,460) 17,383 41,605 60,847 49,344 30,334 38,317 36,451 44,016 47,564 53,330 78,207 79,504 11,869 (1,943) 347,921 Taxation kUS$ - 1,982 2,831 3,095 1,286 - 636 5,838 6,062 8,130 10,374 10,658 - - 50,892 Net Cash Flow After Tax kUS$ (137,448) (101,460) 17,383 39,623 58,016 46,249 29,048 38,317 35,816 38,177 41,502 45,200 67,833 68,846 11,869 (1,943) 297,029
Net Present Value of Cash Flow After Tax 5% 128,893 IRR 11.9%
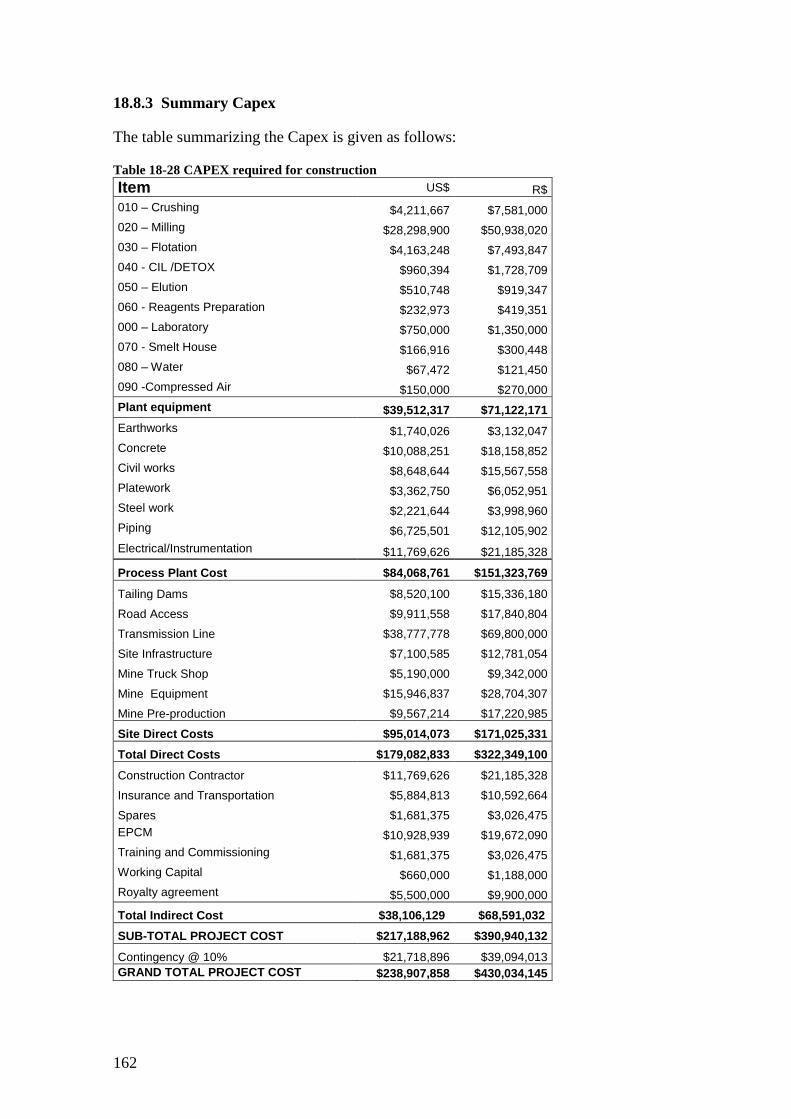
162
18.8.3 Summary Capex
The table summarizing the Capex is given as follows:
Table 18-28 CAPEX required for construction Item US$ R$
010 – Crushing $4,211,667 $7,581,000 020 – Milling $28,298,900 $50,938,020 030 – Flotation $4,163,248 $7,493,847 040 - CIL /DETOX $960,394 $1,728,709 050 – Elution $510,748 $919,347 060 - Reagents Preparation $232,973 $419,351 000 – Laboratory $750,000 $1,350,000 070 - Smelt House $166,916 $300,448 080 – Water $67,472 $121,450 090 -Compressed Air $150,000 $270,000 Plant equipment $39,512,317 $71,122,171
Earthworks $1,740,026 $3,132,047 Concrete $10,088,251 $18,158,852 Civil works $8,648,644 $15,567,558 Platework $3,362,750 $6,052,951 Steel work $2,221,644 $3,998,960 Piping $6,725,501 $12,105,902
Electrical/Instrumentation $11,769,626 $21,185,328
Process Plant Cost $84,068,761 $151,323,769
Tailing Dams $8,520,100 $15,336,180
Road Access $9,911,558 $17,840,804
Transmission Line $38,777,778 $69,800,000
Site Infrastructure $7,100,585 $12,781,054
Mine Truck Shop $5,190,000 $9,342,000
Mine Equipment $15,946,837 $28,704,307
Mine Pre-production $9,567,214 $17,220,985
Site Direct Costs $95,014,073 $171,025,331
Total Direct Costs $179,082,833 $322,349,100
Construction Contractor $11,769,626 $21,185,328
Insurance and Transportation $5,884,813 $10,592,664
Spares $1,681,375 $3,026,475 EPCM $10,928,939 $19,672,090 Training and Commissioning $1,681,375 $3,026,475 Working Capital $660,000 $1,188,000 Royalty agreement $5,500,000 $9,900,000
Total Indirect Cost $38,106,129 $68,591,032
SUB-TOTAL PROJECT COST $217,188,962 $390,940,132
Contingency @ 10% $21,718,896 $39,094,013 GRAND TOTAL PROJECT COST $238,907,858 $430,034,145
163
18.8.4 Project Sensitivities
Sensitivities were prepared looking to the impact of possible variations in the main variables. They are all based on the proposed case of 4 mtpa ore mining rate.
The table below shows the different NPV and IRR for gold prices ranging from US$ 750 to 110 per troy ounce of gold:
Table 18-29: Sensitivities for gold price
Gold Price NPV at 0% NPV at 5% IRR
(US$) (US$) (US$) %
750 76.9 Million -25 Million 3.5%
800 153.1 Million 28.4 Million 6.6%
850 225.1 Million 79 Million 9.4%
900 297 Million 128.9 Million 11.9%
950 369 Million 178.7 Million 14.3%
1000 440.9 Million 228.4 Million 16.5%
1050 512.8 Million 278.1 Million 18.6%
1100 584.5 Million 327.7 Million 20.6%
NPV and IRR for different gold prices:
Gold Price: NPV & IRR Sensitivities
(50000)
0
50000
100000
150000
200000
250000
300000
350000
400000
750 800 850 900 950 1000 1050 1100 1150
Gold US$/Oz
NPV@5% U$ x1000
0%
5%
10%
15%
20%
25%
IRR
%
NPV IRR
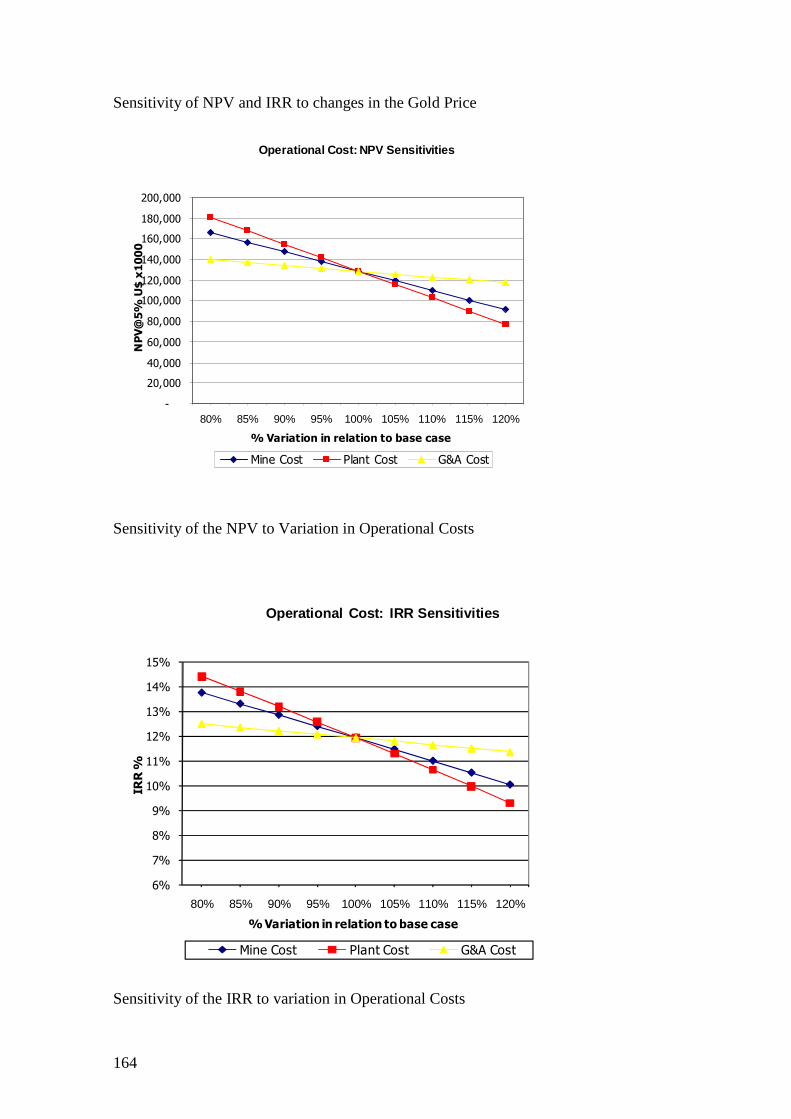
164
Sensitivity of NPV and IRR to changes in the Gold Price
Sensitivity of the NPV to Variation in Operational Costs
Sensitivity of the IRR to variation in Operational Costs
Operational Cost: NPV Sensitivities
-
20,000
40,000
60,000
80,000
100,000
120,000
140,000
160,000
180,000
200,000
80% 85% 90% 95% 100% 105% 110% 115% 120%
% Variation in relation to base case
NPV@5% U$ x1000
Mine Cost Plant Cost G&A Cost
6%
7%
8%
9%
10%
11%
12%
13%
14%
15%
80% 85% 90% 95% 100% 105% 110% 115% 120%
IRR %
% Variation in relation to base case
Operational Cost: IRR Sensitivities
Mine Cost Plant Cost G&A Cost
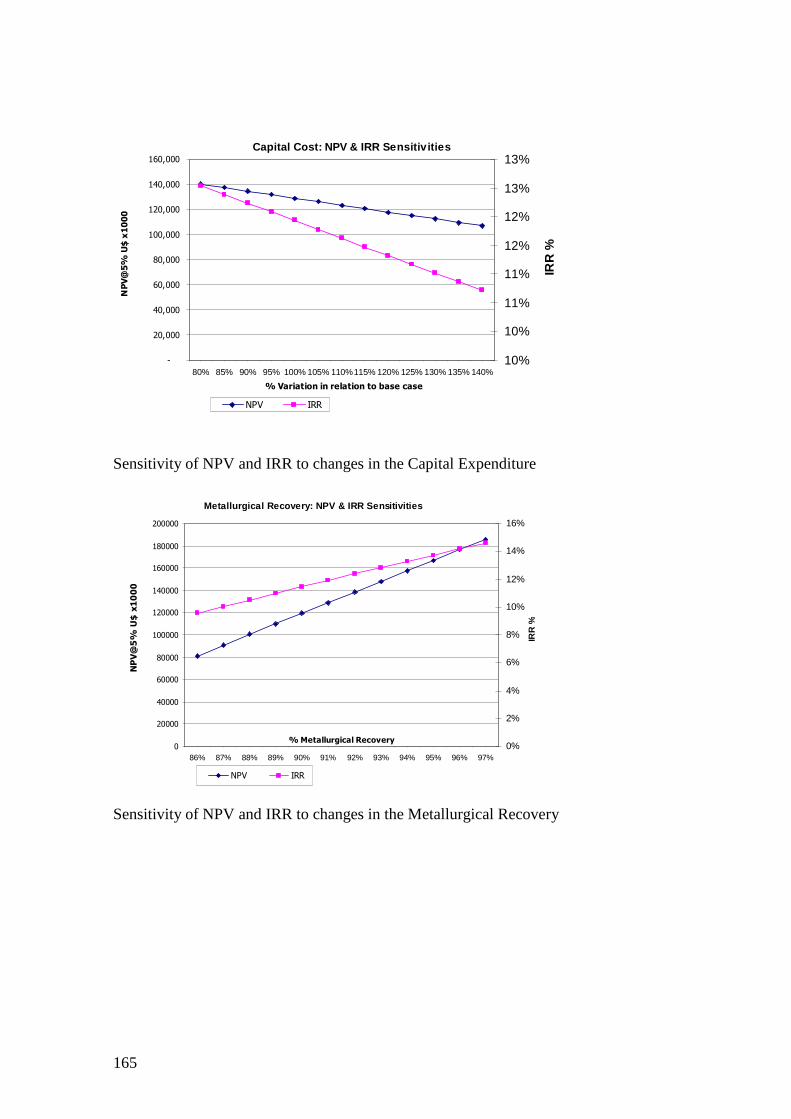
165
Sensitivity of NPV and IRR to changes in the Capital Expenditure
Sensitivity of NPV and IRR to changes in the Metallurgical Recovery
Capital Cost: NPV & IRR Sensitivities
-
20,000
40,000
60,000
80,000
100,000
120,000
140,000
160,000
80% 85% 90% 95% 100% 105% 110%115% 120% 125% 130% 135% 140%
% Variation in relation to base case
NPV@5% U$ x1000
10%
10%
11%
11%
12%
12%
13%
13%
IRR
%
NPV IRR
Metallurgical Recovery: NPV & IRR Sensitivities
0
20000
40000
60000
80000
100000
120000
140000
160000
180000
200000
86% 87% 88% 89% 90% 91% 92% 93% 94% 95% 96% 97%
% Metallurgical Recovery
NPV@5% U$ x1000
0%
2%
4%
6%
8%
10%
12%
14%
16%IR
R %
NPV IRR

166
Comments: From the above graphs, it is evident that the most relevant factors affecting the economic return of the project are the metallurgical recovery and the gold price. Since there is no control on the gold price, it is advisable to extend the metallurgical tests in order to ensure the recovery rate that will be used for the cash flow projections.
The operational costs may increase up to 20% in variation, and the project will still be attractive. However, attention should be given to the plant costs, since they are the most important element in the operational costs. Regarding the Capex, it is interesting to note that the project supports an increase of 30% in the capital costs and still keeps its attractiveness.

167
19 INTERPRETATION AND CONCLUSIONS
19.1 KEY STATISTICS
Key parameters of the study are given in Following Tables:
Table 19-1 Key Operational Parameters
OPERATIONAL PARAMETERS UNIT/TYPE AMOUNT
Waste Mining (LOM) tonnes (000) 172,171
W:O ratio 2.84
Ore Milled (LOM) tonnes (000) 48,138
Au g/t 1.24
Ore Milled – Annual production tonnes (000) 4,000
Years in Construction Unit 2
Years in Operation Unit 13
Average annual gold production Au koz 134
Manpower Workers 477
Payback period Years 6.25
Table 19-2: Unit costs
UNIT COSTS US$
Mining cost per tonne mined 1.44
Mining cost per tonne milled 6.43
Processing cost per tonne milled 9.06
General & Admin cost per tonne milled 2.00
Total cash cost per tonne milled 18.47
Cash operating cost per gold ounce produced 490
Total cash cost per gold ounce produced 512
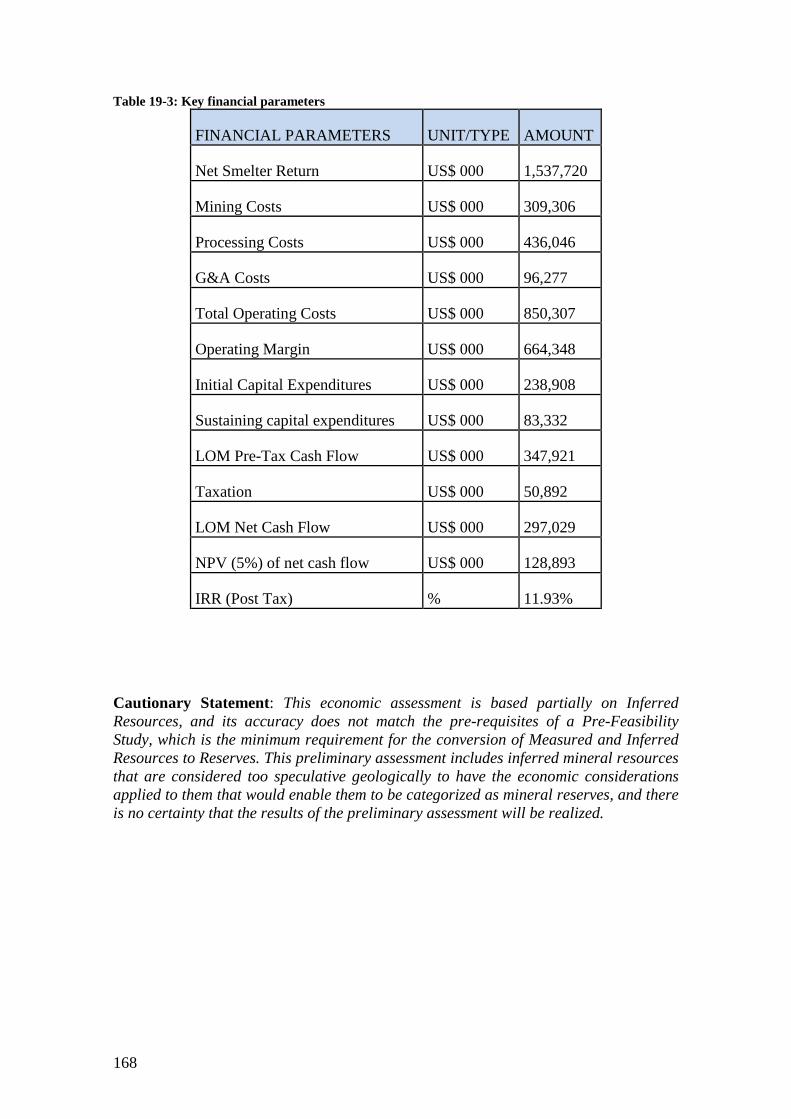
168
Table 19-3: Key financial parameters
FINANCIAL PARAMETERS UNIT/TYPE AMOUNT
Net Smelter Return US$ 000 1,537,720
Mining Costs US$ 000 309,306
Processing Costs US$ 000 436,046
G&A Costs US$ 000 96,277
Total Operating Costs US$ 000 850,307
Operating Margin US$ 000 664,348
Initial Capital Expenditures US$ 000 238,908
Sustaining capital expenditures US$ 000 83,332
LOM Pre-Tax Cash Flow US$ 000 347,921
Taxation US$ 000 50,892
LOM Net Cash Flow US$ 000 297,029
NPV (5%) of net cash flow US$ 000 128,893
IRR (Post Tax) % 11.93%
Cautionary Statement: This economic assessment is based partially on Inferred Resources, and its accuracy does not match the pre-requisites of a Pre-Feasibility Study, which is the minimum requirement for the conversion of Measured and Inferred Resources to Reserves. This preliminary assessment includes inferred mineral resources that are considered too speculative geologically to have the economic considerations applied to them that would enable them to be categorized as mineral reserves, and there is no certainty that the results of the preliminary assessment will be realized.
169
19.2 COMMENTS
Brazauro has benefited from the Option Agreement with Eldorado, who in-filled the project with close to 20000 meters of diamond drilling and undertook other metallurgical and geological investigation which confirmed or enhanced the confidence on the previous findings from Brazauro.
NCL estimated the necessary Capital Expenditure to construct a 4 million tonnes/year operation as a total of US$ 239 million. Although the area is remote, presenting some challenges to bring infrastructure, the project economics are solid and can support this expenditure. The operating cash costs were estimated as US$ 490 / oz, which are in line with other projects under similar conditions.
There are a number of blue-sky opportunities in the Tocantinzinho Project that needs to be taken into account to correctly appreciate the potential of this project. They are:
• Other deposits relatively close to the project, like the Agua Branca project, have good potential to extend the life of the project or increase the gold production.
• The processing of the garimpeiros tailings may bring a substantial contribution to the gold production, since it is known that the gold recovery obtained by the artisanal methods is poor.
As inherent to every mining project, there are risks that need to be considered: • Geology risks have been lowered with the infill campaign, but are still present,
with 15% of the cash flow of this estimate based on inferred resources • Metallurgical recovery could vary, if pilot tests using bulk samples are
undertaken.
Other risks that may be mentioned are the environmental risk and those related to cost estimation. Further studies should minimize these risks.
170
20 RECOMMENDATIONS
The following recommendations can be made to improve the understanding of this project:
• Prepare a geotechnical study following the guidelines set up by Golder
Associates. • Engage a team of surveyors and improve the topographic survey of the area,
especially the area destined for tailing dams and waste dumps • With better knowledge of the terrain, study the alternatives for tailings
disposition. • Engage a company specialized in environmental studies and start the preparation
of an EIA-RIMA study, destined to obtain a LP (Provisory License), a process that usually takes more than one year, which may delay a quick start up of the project, if so decided.
• Proceed with the negotiations with the power companies, following recommendations set up by the power consultant
• Resume the metallurgical tests currently on hold • Proceed to the next stage of studies, preparing a Pre-Feasibility or even a full
Feasibility study.

171
21 REFERENCES
• SGS Lakefield Research Limited, LR 10974-001- Final Report, April 27, 2005, An Investigation of Gold Recovery from Tocantinzinho Properties Samples. Prepared for Brazauro Resources.
• Bruce Geller, Advanced Geologic Services, May 27, 2004, Tocantinzinho Petrographic Report prepared for Jaguar Resources Corporation.
• Bruce Geller, Advanced Geologic Services, July 18, 2004, Tocantinzinho Petrographic Report prepared for Jaguar Resources Corporation.
• James R. Shannon, Ph. D., Research Associate, Colorado School of Mines, January 14, 2005 Petrological Report Prepared for Brazauro Resources Corp.
• Brandt Meio Ambiente, October, 2005, Consultation Process for the Definition of Conservation Areas Along BR-163 on the Tapajós River Valley, State of Pará, Brazil. Prepared for Jaguar Resources Do Brasil Ltda.
• Brazauro Resources Corporation, November, 2005, Tocantinzinho, Mamoal and Batalha Gold Projects. Tapajós Gold District; Pará State, Brazil.
• Reference to the above documents also includes the electronic spreadsheets, maps, and text included with the publication.
• Sandor Ringhoffer, Tocantinzinho Cross Sectional Resource Estimate. November 10, 2006.
• Pincock, Allen & Holt, September 2006, Tocantinzinho exploration property geologic modeling and resource estimates.
• Pincock, Allen & Holt, November 2006, Technical Review of the Tocantinzinho Exploration Project in the Tapaĵós District, Pará State, Brazil (43.101 report).
• Faraco, M.T.L.; Carvalho, J.M. de A.; Klein, E.L. 1996. Carta Metalogenética da Província Aurífera do Tapajós. V. Simpósio de Geologia da Amazônia
• NCL, December 2007, a Preliminary Assessment of the Tocantinzinho Gold Project, Tapajós Gold District, Pará State, Brazil, 3 Million Tons/Year Scenario (43.101 report)
• NCL, September 2007, a Preliminary Assessment of the Tocantinzinho Gold Project, Tapajós Gold District, Pará State, Brazil, 2 Million Tons/Year Scenario (43.101 report).
• Eldorado Gold, November 2009, drilling information, sections and geological plans
172
22 DATE AND SIGNATURE PAGE
CERTIFICATE OF AUTHOR
As the author of this report on Tocantinzinho gold deposit, pertaining to Brazauro Resources Corp, I, Rodrigo Mello do hereby certify that:
1. I am associated to, and carried out this assignment for, NCL Brasil Ltda Alameda da Serra 500/315, Vale do Sereno Nova Lima, MG Brasil 34000-000 Tel: 5531-31946900 Email:[email protected]
2. I hold the following academic qualifications:
B.Sc. (Geology) Minas Gerais University 1985 Specialization (Computing) Goiás Catholic University 1999 3. I am a registered Geologist with the Regional Council of Engineering,
Minas Gerais (membership number 40/462-D); as well, I am a member in good standing of some other technical associations and societies, including the Australasian Institute of Mining and Metallurgy (Member).
4. I have worked as a geologist and project manager in the minerals
industry for 24 years.
5. I am familiar with NI 43-101 and, by reason of education, experience
and professional registration, I fulfill the requirements of a Qualified Person as defined in NI 43-101. My work experience includes 9 years as a exploration geologist/manager working in Proterozoic and tertiary environments, 9 years as a mineral resource analyst working in the evaluation of gold, copper, zinc, nickel and silver deposits, and 3 years working in project management of a gold open pit mine in the Amazon region, dealing with all aspects of mine planning and plant construction.
6. I am responsible for the preparation of this technical report titled
“Tocantinzinho Gold Project Preliminary Economic Assessment Four Million Tons/Year Scenario Tapajós Gold District, Pará State, Brazil”, and dated February, 2010. I visited the Tocantinzinho site before starting this work, on August, 6th to 7th, 2007.
173
7. I am not aware of any material fact, or change in reported information, in connection with the subject properties, not reported or considered by me, the omission of which makes this report misleading.
8. I am independent of the parties involved in the transaction for which this
report is required, other than providing consulting services.
9. I have read NI 43-101 and, the Technical Report and I hereby certify that
the Technical Report has been prepared in accordance with NI 43-101 and meets the form requirements of Form 43-101 F1.
Dated this 1st day of March, 2010
Rodrigo de Brito Mello