
TO WHOMSOEVER IT MAY CONCERN This is to certify that ...
86
March 23, 2018 TO WHOMSOEVER IT MAY CONCERN This is to certify that Rajashekar S has completed his Internship in Edelweiss Broking Limited in Mass Affluent (Offline) group between January 1 S, 2018 to March 23, 2018. Project Name: Fundamental Analysis of Automobile Sector Edelweiss Broking Limited Corporate Identity Number : U65100Gj2008PLC77462 Register Office : Unit No . 801-804, Eighth Floor, Abhishree Avenue, Nehru Nagar , Ambawadi , Ahmedabad 380015 079 4001 9900/66629900 Corporate Office : Edelweiss House, Off CST Road, Kalian, Mumbai 400098 +91 22 4009 4400 7
Transcript of TO WHOMSOEVER IT MAY CONCERN This is to certify that ...

March 23, 2018
TO WHOMSOEVER IT MAY CONCERN
This is to certify that Rajashekar S has completed his Internship in Edelweiss Broking Limited in Mass Affluent (Offline) group between January 1 S, 2018 to March 23, 2018.
Project Name: Fundamental Analysis of Automobile Sector
Edelweiss Broking Limited Corporate Identity Number: U65100Gj2008PLC77462 Register Office: Unit No. 801-804, Eighth Floor, Abhishree Avenue, Nehru Nagar, Ambawadi, Ahmedabad 380015 079 4001 9900/66629900 Corporate Office: Edelweiss House, Off CST Road, Kalian, Mumbai 400098 +91 22 4009 4400
7

L
ACHARYA INSTITUTE OF TECHNOLOGY
(Affiliated to Visvesvaraya Technological University, Belagavi, Approved by AICTE, New Delhi and Accredited by NBA and NAAC)
Date: 18/05/2018
CERTIFICATE
This is to certify that Mr. Rajashekar S bearing USN lA Yl6MBA55
is a bonafide student of Master of Business Administration course of the
Institute 2016-18 batch, affiliated to Visvesvaraya Technological University,
Belagavi. Project report on "A Study on Fundamental Analysis of
Automobile Sector" at Edelweiss Broking Ltd, Bangalore is prepared by
him under the guidance of Prof. Mallika B K, in partial fulfillment of the
requirements for the award of the degree of Master of Business
Administration, Visvesvaraya Technological University, Belagavi, Karnataka.
Signature of Internal Guide Signaturf t~~·"~""'artment Head o f MBA
eepart,:nent o Techno\ogy Ach~rya lnstitute 0 ~ , -560 107
_§.slldevanah\li, Banga,ore
~/4~0-.>-\(
-v Signature of Principal
PRINCiPAL tiC~NWA INSTITUTt·. UF ·i·~:;_.rn~OLOGY So!uev::i,1,1l;alli 8.:11 190!01~--:::cv 1G,
Acharya Or Sarvepall1 Radhakrishnan Road. Soladevanahal l1, Acharya PO , Bangalore 560 107. Karnataka, India • www acl1drya ac 1n/a1t/ • Ph +91 -80-225 555 55 Extn 2102 • Fax +91 -80-237 002 42 • E-mail: principala11@acharya ac 111
DECLARATION
I, Rajashekar S, hereby declare that the Project report entitled "Fundamental Analysis of
Automobile Sector" with reference to "Edelweiss Broking Ltds Bangalore" prepared by
me under the guidance ofMallika.B. K, faculty of M.B.A Department, Acharya Institute of
Technology and external assistance by Monish.B~ Manager in Edelweiss Broking Ltd.
I also declare that this Project work is towards the partial fulfilment of the university
Regulations for the award of degree of Master of Business Administration by Visvesvaraya
Technological University, Belgaum.
I have undergone a summer project for a period of Twelve weeks. I further declare that this
Project is based onthe original study undertaken by me and has not been submitted for the
award of any degree/diploma from any other University / Institution.
Place: ~ .. - -~ ---~ ....,....
Date:~~ - c~ - ~ Sign~~Tu.e student

Acknowledgement
I would like to thank many people who have helped and supported me while doing my
project report and work.
There is not enough word to offer my vote of thanks to Prof. Dr. Nijaguna , Head of
Department of MBA, AIT Bangalore for his help in initiating the project report in advance
for the regular motivation, my guides Mr.Monish , Manager in Edelweiss Broking Ltd,
Bangalore and Asst prof. Mallika.B.K, Faculty of MBA Department, AIT Bangalore for
their admirable help, suggestions and opinions on the contribution during and after the project
work period.
Thanks a lot, and appreciation to helping nature of employees at Edelweiss for their supports.
`
Place Bengaluru Rajashekar.S
Date USN 1AY16MBA55

Index
CHAPTER NO TITLE PG.NO
1 Introduction
1.1 Introduction 1
1.2 Industry Profile 1-16
1.3 Company profile 16-31
2 Conceptual background & literature review
2.1 Theoretical background of the study 34-37
2.2 Literature review 37-40
3
Research design
3.1: Statement of problem 42
3.2 Need of the Study 42
3.3 Objectives of the Study 42-43
3.4 Scope of the study 43
3.5 Research methodology 43-44
3.6 Hypothesis frame work
3.7 Limitation of the study 44
4 Data analysis & interpreta12tion
4.1 Company Analysis 46-56
4.2 Interpretation 57-60
5 Findings Suggestions & Conclusions
5.1 Findings 62
5.2 Suggestions 63
5.3 Conclusions 64
Bibliography & Annexure

List of Table Table No.
Particular Pg .No
1.2.5 Automobile Productions Trends 12
1.2.6 Automobile Sales Trends 14
1.2.7 Automobile Export Trends 15
1.7.1 Profit & Loss Account of Edelweiss Lt 30
1.7.2 Balance Sheet of Edelweiss Ltd
31
2.1.1.1 GDP Rates in India 34
4.1.1.1 Return on Equity of Tata Motors Ltd
48
4.1.1.2 Earnings per Share Tata Motors Ltd 48
4.1.1.3 Book Value Per Share Tata Motors Ltd 48
4.1.1.4 Dividend per Share Tata Motors Ltd 49
4.1.1.5 Debt Equity Ratio Tata Motors Ltd 49
4.1.1.6 Dividend Pay-out Ratio Tata Motors Ltd 49
4.1.2.1
Return on Equity Mahindra & Mahindra Ltd 52
4.1.2.2 Earnings per Share Mahindra & Mahindra Ltd 53
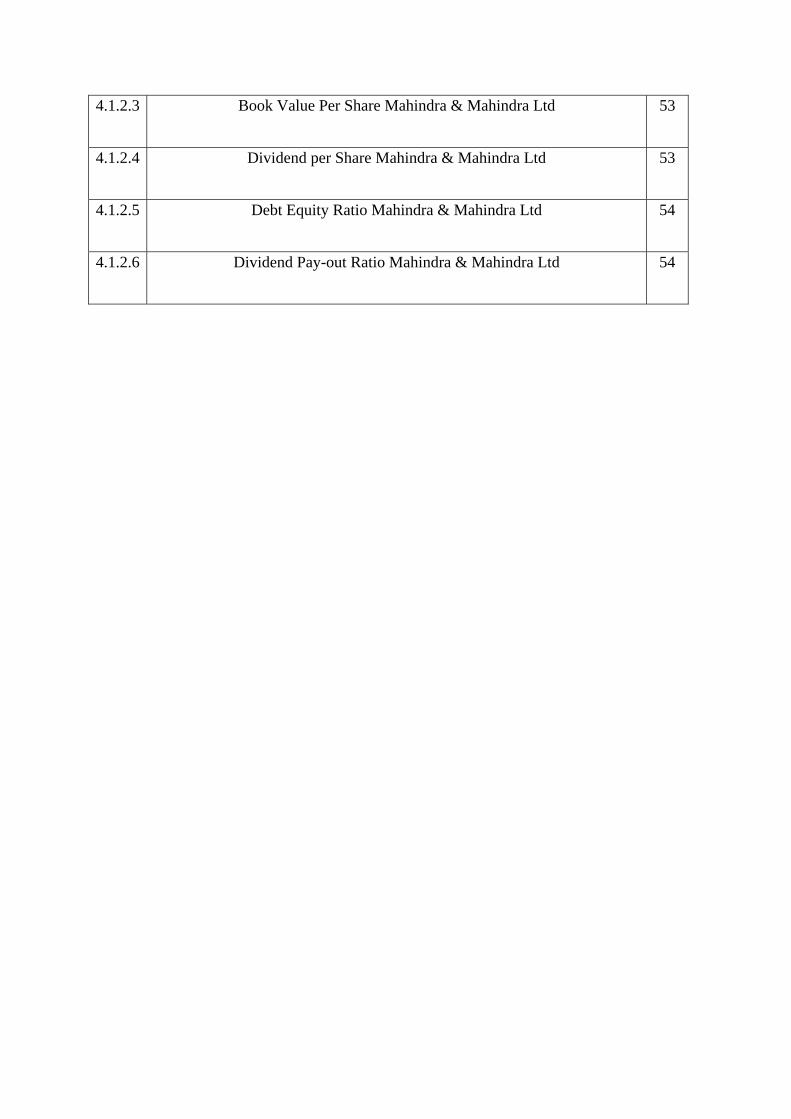
4.1.2.3 Book Value Per Share Mahindra & Mahindra Ltd 53
4.1.2.4 Dividend per Share Mahindra & Mahindra Ltd 53
4.1.2.5 Debt Equity Ratio Mahindra & Mahindra Ltd 54
4.1.2.6 Dividend Pay-out Ratio Mahindra & Mahindra Ltd 54

List of Charts Chart No Particular Pg No
1.2.5 Automobile Productions Trends 13
1.2.6 Automobile Sales Trends 14
1.2.7 Automobile Export Trends 16
2.1.1.2 Inflation Rates 35

Page | 1
EXECUTIVE SUMMARY
The present examination manages the analysis financial performance of Selected
organizations of automobile industry in India, which depend on the fragment that the
organizations which deliver both passenger cars and business vehicles. This examination is
inspected money related execution of chose organizations of automobile industry in India
industry in India. Automobile industry is turned out to be one of the essential business of the
economy. Car Industry, all around, also in India, is one of the key divisions of the economy.
Because of its profound forward and in reverse linkages with a few key portions of the
economy, car industry has a solid multiplier impact and goes about as one of the drivers of
financial development. The very much created Indian car industry delivers a wide assortment
of vehicles: traveler autos, light, medium and overwhelming business vehicles, multi-utility
vehicles, for example, jeeps, bikes, engine cycles, mopeds, three wheelers, tractors and other
rural types of gear and so forth. The segment has gigantic potential for giving work. It has
close linkages with the other piece of the economy and with the solid duplicating impact. The
Indian Automobile industry incorporates two - wheelers, trucks, autos, transports and three –
wheelers which assume an essential part being developed of the Indian economy. One of the
major mechanical divisions in India is the vehicle segment. Resulting to the advancement, the
car division has been appropriately portrayed as the dawn area of the Indian economy as this
part has seen enormous development. For investigation of money related execution of chose
organizations of Indian Automobile Industry five Companies of car industry have been
selected. Utilizing different methods, for example, proportion analysis has made examination
of chose units. The Financial execution of chose organizations of Indian Automobile Industry
is broke down based on Profitability examination, financial structure investigation, Activity
investigation and Liquidity analysis. This contemplate depends on money related
proclamations of organizations, which is optional information. Information are gathered from
yearly reports of the chose organizations. Additional data acquired from Society of Indian
vehicle makers (SIAM), Magazines, News Papers, different Journals and sites and so on. It is
trusted that the postulation will be of massive help and use to honing, Management,
Government authorities, workers, Shareholders, Academicians and research scholars. The
present investigation is partitioned into five sections, the main part is the Introduction the
second section is Review of Literature. The third section is related with the Research
Methodology. In the fourth chapter profitability section manages the Activity Analysis of
chose organizations of Indian Automobile Industry. In the last part reasonable proposals have

Page | 2
been made. This examination was useful to dissect and assess the monetary execution of
chose organizations of vehicle industry in India and make recommendations for development
and improvement.

Page | 3
CHAPTER – 1
INTRODUCTION

Page | 4
1.1 INTRODUCTION TO THE STUDY:
Fundamental analysis is the study of a company’s financial strength, based on historical data.
It is a stock valuation method that uses financial and economic analysis to predict the
movement of stock prices. The analysis attempts to find out the intrinsic value of a security
that helps investors to make decisions. The fundamental information that is analysed can
include a company’s financial report and non-financial information such as estimates of the
growth of demand for the product sold by the company, industry comparisons, and economy-
wide changes, changes in government policies etc.
• Fundamental analysis focuses on what is ought to happen while technical
analysis focuses on what has already happened.
• Fundamental analysis analyses the economic indicators and financial statements while
technical analysis makes use of the historic market data
• Fundamental Analysis advocates that every security has an intrinsic value
which is not reflected by the market price while technical analysis
advocates that market price accounts for everything.
• Fundamental Analysis uses tools like ratio analysis other valuation
methods to find the intrinsic value while Technical Analysis primarily depends on
charts and technical indicators.
INDUSTRY AND COMPANY PROFILE:
This chapter deals with the industry and company profile of the company where the two-
month internship was performed. The company where the internship project was carried out
was Edelweiss Broking Ltd., Which falls under financial service industry.
1.2. INDUSTRY PROFILE
Introduction
The financial services industry in India is a vast sector that has a lot of scope of aggressive
expansion. It has been said by many experts that the Indian financial markets have not been
utilized to its full potential yet. There is a huge scope of progress in this sector. There are
many players in this sector. There are numerous players in this part. Some of them are banks,

Page | 5
insurance agencies, non-saving money budgetary organizations, business firms, annuity
stores, common assets and other monetary substances. In any case, money related
administrations division in India is prevalently a managing an account segment with business
banks representing over 64% of the aggregate resources held by the monetary framework.
Equity or Stock Market
The market place for immediate settlement of transaction involving commodities and
securities. In an equity market, the exchange of goods and money between the seller and the
buyer takes place in the present, as opposed to the futures market where such an exchange
takes place on a specified future date.
Also known as the spot market, since transaction are settled “on the spot.”
The securities market has two interdependent segments: the primary (new issues) market and
the secondary market. The primary market is where new issues are first offered, with any
subsequent trading going on in the secondary market. The primary market provides the
channel for the sale of new securities. Secondary market refers to a market where securities
are traded after being initially offered to the public in the primary market and/OT listed on
the stock exchange. The majority of the trading is done in the secondary market. Secondary
market comprises of equity markets and debt markets.
SEBI
Chairman- Ajay Tyagi
The “Securities and Exchange Board of India (SEBI) is the controller the securities advance
in India. It was produced in the year 1988 and given statutory powers on 30 January 1992
through the SEBI Act, 1922. Securities and Exchange Board of India (SEBI) was set up in the
year 1988 AQE as a non-statutory body for managing the securities advance.”
1.2.3 The Reserve Bank of India (RBI) is India's focal keeping money establishment, which
controls the financial strategy of the Indian rupee. It initiated its task on 1 April 1935 amid
the British Rule as per the arrangements of the Reserve Bank of India Act, 1934
Issue of currency
The bank issues and trades cash note and coins and decimates a similar when they are not fit
for dissemination. “RBI keeps up the monetary structure of the nation with the goal that it can

Page | 6
accomplish the objects of value steadiness and also financial advancement on the grounds
that the two destinations are different in themselves.”
Development role
The “national bank needs to play out an extensive variety of special capacities to help
national targets and businesses. The RBI faces a considerable measure between sectoral and
nearby swelling relates issues. A portion of these issues are the aftereffects of the prevailing
piece of the general population area.”
Related functions
The “RBI is additionally a broker to the administration and performs vendor saving money
elements of the focal and state governments. It additionally goes about as their investor. RBI
on 7 August 2012 said that Indian managing an account framework ids sufficiently strong to
confront the pressure caused by the dry season like circumstance as a result of poor storm this
year.”
The Indian Stock Market
With more than 25 million investors, Indian has the third biggest speculator base on the
planet after USA and Japan. More than 7500 organizations are recorded on the Indian stock
trade. The Indian capital market is huge as far as the level of improvement, volume of
exchanging, straightforwardness and its enormous development potential. India's market
capitalization was the most noteworthy among the developing markets. The real trade, to be
specific the National Stock Exchange (NSE) and the Bombay Stock Exchange (BSE)
positioned no. 3 and 5 on the planet, figured by the quantity of every day exchanges done on
the trades.
Bombay Stock Exchange
Bombay Stock Exchange is the most seasoned stock trade not just in India in whole Asia. It
got the Government of India's acknowledgment as a stock trade in 1956 under the Securities
Contracts (Regulation) Act, 1956. At the season of its cause, it was a relationship of people,
however now it has been changed into a corporate and demutualised substance. BSE is spread
all finished India and is available in 417 towns and urban areas. The aggregate number of
Page | 7
organizations recorded in BSE is around 3500. The fundamental file of BSE is called BSE
SENSEX or basically SENSEX
National Stock Exchange
National Stock Exchange (NSE) established, albeit later than BSE, is right now the main
stock trade in India as far as aggregate volume exchanged. It is additionally situated in
Mumbai yet has its essence in more than 1500 towns and urban communities. As far as
market capitalization, NSE is a moment biggest base in South Asia. NSE's driving record is
Nifty 50 or famously Nifty and is made out of 50 broadened benchmark Indian organization
stocks. Clever is contracted based on weighted normal market capitalization technique
Derivatives
Subsidiaries might be characterized as "A security or contract composed such that its cost
gets from the cost of a basic resource" The cost of the subordinate security isn't subjective. It
is connected to the Price of hidden resources. Changes in the cost of basic resources influence
the cost of subordinate security. A genuine subordinate instrument requires no development
of important assets. It is these qualities that make them such helpful instrument to fence and
to go for broke.
For the most part, subsidiaries can be named takes after:
Futures, Forwards, Options
Futures
A future contract is refers to “buy or sell a standard amount of or predetermined grades of
certain commodity (i.e. Commodity futures) or financial instruments or currency (that is
financial futures) on a predetermined future day at an agreed price.
It is “an agreement between two parties to buy or sell a commodity or financial instrument at
a predetermined future date at a price agreed when he contract is a made”.
Options
It is “a contract between two parties whereby one party acquires the right, but not the
obligation to buy or sell a particular commodity or financial instrument at a specified date”.
Options s are two writes

Page | 8
(a) Call Options
(b) Put Options
1.2.1 INDUSTRY ANALYSIS
INTRODUCTION
“The Indian car industry is one of the greatest on the planet. The business speaks to 7.1% of
the country's Gross Domestic Product (GDP). As of FY 2014-15, around 31% of the little
cars sold all around are created in India.”
The two-wheelers with 81% piece of the overall industry is the pioneer if the Indian
automobile industry. The developing of the organizations hoping to venture into the
provincial markets additionally supported the development of the division. The general
traveler vehicle portion has a 13 % piece of the overall industry.India is additionally
noteworthy auto exporter and as a strong export growth expectation post the not so distant
future. The main aspects covered under this industry analysis are:
➢ History of the industry in India
➢ “Segmentation of the industry”
➢ “Key players in the industry”
➢ “Automobile production trends”
➢ Automobile domestic sales trends
➢ Automobile export trends
1.2.2 HISTORY OF AUTOMOBILE INDUSTRY IN INDIA
The main auto that kept running on the Indian streets was in 1897. Through the 1930's, autos
were imports just, and in little numbers
Automotive industry rise in India in the 1940's. Hindustan motor were propelled in 1942, and
its long-lasting rival chief in 1944, building Chrysler, Dodge and Fiat items individually.

Page | 9
Liberalisation in 1991, gave a boost to this industry as reductions of restrictions allowed
foreign players to enter India to do business and there were variety of joint ventures with
Indian companies.
Multinational automakers like “Suzuki and Toyota of Japan and Hyundai of south Korea,
were permitted to put resources into the Indian market, advancing the foundation of a car
industry in India. Maruti Suzuki was the first and best of these new passages. By 2000, there
were 12 substantial car organizations in the Indian market; the majority of them teamed up
with worldwide organizations.”
1.2.3 SEGEMENTATION OF THR INDSTRY
The Indian automobile industry is segmented into four categories:
a. Passenger Vehicles
b. Commercial Vehicles
c. Three Wheelers
d. Two Wheelers
The growth prospect of India shoes a positive end as seen before in the economy analysis,
which indicates a rise in the standard of living of people. Usually as the standard of living of
people increases, people tend to shift from two wheelers to passenger vehicles like cars and
SUV’s. this aspect shows us that is tremendous potential in the passenger segment to grow.
1.2.4 KEY PLAYERS OF THE INDUSTRY
As we have seen in the history of Indian automobile industry, the pre-liberalization period
contained a very less number of competitors in the industry, but after liberalization in 1991, a
lot of new players emerged, both domestic and foreign. Most of them collaborated and grew,
showing the potential of both the companies to claim their stake in the auto industry in India.
Those companies that have technological edge and goodwill are seen as the market leaders
and those who still do not possess them are still trying to innovate and compete. Very nearly
“8 out of 10 worldwide companied including General Motors, BMW and so on have their
essence in India contributing 25% of the nation's creation. The best organizations in the car
business are: Maruti Suzuki Ltd., Tata Motors, Hyundai Motors India Ltd., Mahindra and

Page | 10
Mahindra Ltd., Hero MotoCorp, Bajaj Auto, Toyota,” TVS and General Motors Pvt Ltd. A
significant number of these organizations are available in excess of one fragment of the
business.
TATA MOTORS: : It is the in business vehicles and among the best three in traveler
vehicles. Tata Motors were winning items in the minimal, medium size auto and utility
vehicle fragments. In 2004, it gained the Deawoo Commercial Vehicles Company, South
Korea's second biggest truck producer. The rechristened “in the Korean market, while
likewise trading these items to a few worldwide markets. Today 66% of substantial business
vehicle sends out of South Korea are from Tata Deawoo. In 2005, Tata Motors obtained a
21% stake in Hispano Carrocera, a presumed Spanish transport and mentor producer, and in
this way the rest of the stake in 2009. Hispano's essence is being ventured into different
markets.”
MARUTI SUZUKI INDIA: Piece of the pie: “Pássenger Vehicles 46.07%. Máruti Suzuki
India Limited, a reinforcement of Suzuki Motor Corporation of Japan, is India's greatest
voyager auto association, speaking to over 45% of the neighborhood auto publicize. The
association offers an aggregate extent of cárs from entry level Máruti-800 and Alto, to sweet
hatchback Ritz, A star, Swift, Wagon-R, Estillo and autos DZire, SX4 and Sports Utility
vehicle awesome Vitára. Since start in 1983, Maruti Suzuki India has made and sold in
excess of 7.5 million vehicles in India and conveyed in excess of 500,000 units to Europe and
diverse countries. The association's wage for the money related 2008-09 stayed over USD 4
billion and Profits after cost at over USB 243 million.”
HYUNDAI MOTOR INDIA: Piece of the overall industry: “Pássenger Vehicles 14.15%.
Hyundai Motor Indiá Limited is a totally guaranteed reinforcement of world's fifth greatest
vehicle association, Hyundai Motor Company, South Korea, and is the greatest explorer auto
exporter. Hyundai Motor before long business parts 49 varieties of voyager automobiles
across finished sections. These consolidate the Santro in the B segment, the i10, the first rate
hatchback i20 in the B+ part, the Accent and the Verna in the C divide, the Sonata Transform
in the E piece. Hyundai Motor, continuing with its custom of being the snappiest creating
voyager automobile creator, selected indicate offers of 559,880 vehicles in the year 2009, a
development of 14.4% more than 2008. In the nearby market it planned an improvement of
18.1% when appeared differently in relation to 2008 with 289,863 units, while abroad
Page | 11
arrangements created by 10.7% with the admission of 270,017 units. Hyundai Motor at
exhibit passages cars to more than 110 countries across finished Europe Union, African,
Middle East, Latin Americá and Asia. It has been the primary exporter of voyager auto of the
country for the sixth year in progression. In scarcely a long time since Hyundai has been
accessible in Indiá, it has transformed into the primary exporter of voyager cars with a bit of
the general business of 66% of the total passages of explorer cars from India, making it a
basic supporter of the Indian vehicle industry. In 2009, ignoring an overall log stick, Hyundái
Motor Indiá's passages created by 10.7%. In 2010 Hyundai needs to incorporate 10 new
markets with Austrália being the latest challenger to the summary. The essential shipment to
Australiá is around 500 units of the i20 and the total i20 charges to Australia are depended
upon to be in the region of 15,000 for every ánnum.”
MAHINDRA AND MAHINDRA: Piece of the overall industry: “Commerciál Vehicles
10.01% explorer vehicles 6.50%, bicycles 1.31% Mahindra ánd Mahindra is generally
involved with the multi utility vehicle and three-wheeler segment direct. The association
fights in the light business vehicle parcel through its joint meander assistánt, Mahindra
Navistar Automotive Limited and in explorer auto part through another joint meander
reinforcement Mahindra Renault. In the year 2009, on the private arrangements front, the
association close by its assistants sold a total 220,213 vehicles (tallying 44.533 three-wheeler,
13,423 cárs through Mahindra Renault), recording an advancement of 0.6% over the prior
year. The association's nearby multi utility vehicle bargains volumes extended by 3.3%, as
against a rot of 7.4% for industry multi bargains Mahindra and Mahindra furthermore
strengthened its control of the family multi utility vehicle sub-section in the midst of the
year,” growing its bit of the pie to 57.2% over the forerunners bit of the pie of 51.3%.
Mahindra and Mahindra is broadening its impression in the abroad market.
ASHOK LEYLAND: “Piece of the pie: Commercial Vehicles 16.47% against the landscape
of the sharp hang mainstream for business vehicles, in the midst of 2008-09, Ashok Leyland
enrolled offers of 47,118 medium ánd overpowering business vehicles (M&HCV), 37.5% not
precisely in the prior yeár. This fuses 16,049 M&HCV transports and 31,069 M&HCV trucks
separately, 8.7% ánd 46.3% not precisely in the prior year. The association lost 1.8% bit of
the pie in the Indián medium and overpowering business vehicle promote in the midst of the
fiscal year 2008-09, generally due to loss of offers in the truck area. This addresses a
reducing of around 6.5% over the prior year. Mean industry volume related to abroad markets
to which the association conveys, (for instance, Sri Lanká, the Middle East) saw a decline of
Page | 12
around 25% over the prior year. To fight the impact of the decline in CV bargains, the
association focused on non-tedious associations in the portfolio. The association conveyed in
each one of the 54,049 vehicles in the midst of the year. To contain costs and visit cash, the
association worked just around half of the working dáys in áll its gathering units in the midst
of the second hálf of the year.”
HERO HONDA MOTORS: : Piece of the overall industry: bicycles “41.35%. Saint Hondá
has been the greatest in wheeler association on the planet for eight progressive years. The
association crossed the 15 million unit's advancements over a 25-year navigate. Saint Honda
sold a bigger number of bicycles than the second, third and fourth set bicycle associations set
up together. As one of the world's development pioneers in the auto part, Honda has had the
ability to dependably give specific know-how, design points of interest and R&D headways.
Holy person Honda bikes are sold and updated through an arrangement of in excess of 3500
customer touch centers, including a mix of vendors, advantage centers and stockists arranged
ácross finished nation and urban India. It sold more bicycle in the midst of the year than the
combined volumes of the second, third and fourth put contender. Overall, the association sold
3.72 million bicycles, an improvement of 12% over the prior year. Bicycle bargains in family
promote, which speak to more than 95% of Hero Honda's arrangements, were up by 11&.
The association posted offers of USD 2.4 billion and advantage after appraisal of USD
256.40 million in the midst of the year 2008-09. In the midst of the year, the association
turned in a frolicking execution with its bicycle portfolio, with a 49% improvement in private
arrangements to 156,210 units. This execution állowed Hero Honda to increáse in its offer in
the nearby bicycle feature by more than” three rate centers. Holy person Honda's execution
in the bicycle business was the fundamental champion execution in the midst of the year
among the immense players.
BAJAJ AUTO:. In spite of falling interest in the bike section, the organization has prevailing
with regards to keeping up a working EBITDA (profit before intrigue, expenses, deterioration
and amortization) edge of “13.6% of net deals and other working wage. From 1.66 million
cruisers in 2007-09, the organization's household deals fell by 23% and 1.258 million units in
2008-09. Bajaj Auto is the organization's biggest exporter of two and three wheelers. Amid
2008-09, Bajaj Auto's worldwide deals accomplished an untouched high of 772,519 units of
two and three wheelers, speaking to a development of 25% over the earlier year. The

Page | 13
development was driven by the fare of bikes, which expanded by 31% more than 2007-08 to
accomplish offers of 633,463 units in 2008-09. The organization extended its impression in
Africa and Middle East, where the locale's offer rose from 30% of the fare business in 2007-
08 to 43% of every 2008-09. The aggregate estimation of fares was USD 528 million,
speaking to a development of 29%. The organization's local offers of three wheelers in 2008-
09 were 12% lower contrasted with the earlier year and remained at 135,473 units. Fares of
three wheelers developed by 2% to 139,056 units.”
1.2.5 AUTOMOBILE PRODUCTION TRENDS
The following table and graph shows the automobile production trends for 6 years:
TABLE 1.2.5: AUTOMOBILE PRODUCTION TRENDS
CATEGORY 2011-12 2012-13 2014-15 2015-16 2016-17 2018-19
PASSENGER
VEHICLES
31,46,070 32,31,05 30,87,974 32,21,420 34,65,046 37,91,541
COMMERCIAL
VEHICLE
9,29,137 8,32,650 6,99,036 6,98,299 7,86,693 8,10,287
THREE
WHEELERS
8,79,290 8,39,747 8,30,10 9,49,020 9,34,105 7,83,150
TWO
WHEELERS
1,54,27,533 1,57,44,157 1,68,83,050 1,84,89,312 1,88,30,228 1,99,29,486
GRAND
TOTAL
2,03,82,030 2,06,47,65 2,15,00,24 2,33,58,051 2,40,16,072 2,53,14,464
FIGURE1.2.5 AUTOMOBILE PRODUCTION TRENDS

Page | 14
From the above table and chart, we can see that there has been a continuous increase in
production in the two-wheeler segment with an overall production rise % from the year 2011-
12 to 2016-17. The passenger vehicle segment has growing trend till 2013*14: it fell a little
in 2014-15 but again showed an increasing trend till 2016-17.
Live Mint (2013): Passenger car sales declined to 1.89 million units in 2012-13 from 2.03
million a year earlier, the society of Indian Automobiles Manufactures (SIAM) said on
Wednesday, as new launches, discounts and freebies failed to attract customers in a depressed
economy and increasing fuel prices. The wheels came off India’s much-vaunted car market in
the year to 31 March, with sales falling 6.7%, the first drop in 12 years.
Commercial vehicles and three wheelers have been showing a declining trend expect in 2012
as the fuel prices were at its peak because of which people shifted to public transport. This
led to fall in production as mentioned above of passenger vehicles. But at the prices eased
and CSN alternatives were present, the production of passenger vehicles started increasing
and trend of commercial vehicles started falling.
1.2.6 AUTOMOBILE DOMESTIC SALES TRENDS
The following table and chart shows the domestic sales trends in the automobile industry for
6 years:

Page | 15
TABLE 1.2.6: AUTOMOBILE DOMESTIC SALES TRENDS
CATEGORY 2011-12 2012-13 2014-15 2015-16 2016-17 2018-19
PASSENGER
VEHICLES
26,29,84 26,65,016 25,03,510 26,01,237 27,89,209 30,46,728
COMMERCIAL
VEHICLE
8,09,400 7,93,212 6,32,852 6,14,949 6,85,705 7,14,233
THREE
WHEELERS
5,13,282 5,38,291 4,80,086 5,32,627 5,38,209 5,11,659
TWO
WHEELERS
1,34,09,151 1,37,97,186 1,48,06,789 1,59,75,562 1,64,55,852 1,75,89,512
GRAND
TOTAL
1,73,61,773 1,77,93,705 1,84,23,227 1,97,24,375 2,,04,68,974 2,18,62,132
FIGURE 1.2.6: AUTOMOBILE DOMESTIC SALES TRENDS
The above table and graph shows the trend in the sales in the domestic region. From the table
it is very clear that the overall sales trends in the industry has been increasing year on year
though the percentage of growth may be different. The sales of two wheelers has been very
consistent across the 6years as seen from the figures. Since the overall sales I showing an

Page | 16
increasing trend, it would be safe to assume that it keeps on increasing in the coming years as
well.
1.2.7 AUTOMOBILE EXPORT TRENDS
The following table and graph depicts the export trend of Indian automobile industry of 6
years:
TABLE 1.2.7: AUTOMOBILE EXPORT TRENDS
Category 2011-12 2012-13 2014-15 2015-16 2016-17 2018-19
Passenger
Vehicles
5,08,784 5,59,415 5,96,143 6,21,342 6,53,054 7,58,831
Commercial
Vehicle
92,259 80,028 77,051 86,940 1,03,125 1,08,272
Three
Wheelers
3,61,754 3,03,089 3,53,393 4,07,601 4,04,442 2,71,895
Two
Wheelers
19,75,112 19,56,379 20,84,001 24,57,467 24,82,877 23,39,274
Grand
Total
29,37,909 28,98,911 31,10,588 35,73,350 36,43,498 34,78,272
FIG 1.2.7: AUTOMOBILE EXPORT TRENDS

Page | 17
From the above chart and table, we can see that the auto exports in the industry have fallen in
the year 2013-14, due to slow economic growth, but since then it has risen consistently in
almost every segment. There is a rise of almost 60% in the exports in six years. With the
make in India initiative, India would be seen as a hub for technology, investment and
innovation. This can impact the auto exports positively the future years.
1.3. COMPANY PROFILE
INTRODUCTION
Edelweiss Broking Limited was openly joined on 7 February 2008 after the Edelweiss Group
has gotten last administrative endorsement from the Securities and Exchange of India (SEBI)
to begin its common reserve business by 2008. The Stockbroker gained retail specialist
Anagram Capital Limited on Jan 2010. On December 12, 2012 the organization was recorded
under the National Stock Exchange with enlistment number INE231311631. It was recorded
on a MCX stock trade constrained with an enlistment number INE261311634
Page | 18
Edelweiss Financial Services Limited is a holding organization. The organization is occupied
with demonstrating speculation saving money and warning administrations and holding
exercises/ventures. The Company's fragments incorporate Agency business, Capital based
business and Life Insurance. Its Agency business understanding is occupied with
demonstrating broken, warning, item appropriation and other Dee-based administrations..
The Company arranges its business into three gatherings: credit, non-credit and protection. Its
credit business incorporates structures collateralized credit, bothered credit, resources, land
back, home loans, and little and medium-sized undertakings (SME) and Agri financing. Its
non-credit business comprises of riches administration, resource administration and capital
markets.
Edelweiss Broking Ltd, is an Indian administrations organization situated in Mumbai, India.
The organization distinguishing proof number (CIN) is U65100GJ2008PLC077462. It goes
about as a shared store wholesaler and has an AMFI Registration Number – 70892. Edelweiss
Broking Limited gives wares brooking and exchanging administrations. The company was
formerly known as Edelweiss Investment and Advisory Limited. The company was founded
in 2008 and is based in Mumbai, India. The company operates as a subsidiary of Edelweiss
Edelweiss provides commodities pricing and trading services. Edelweiss Broking serves
clients in India
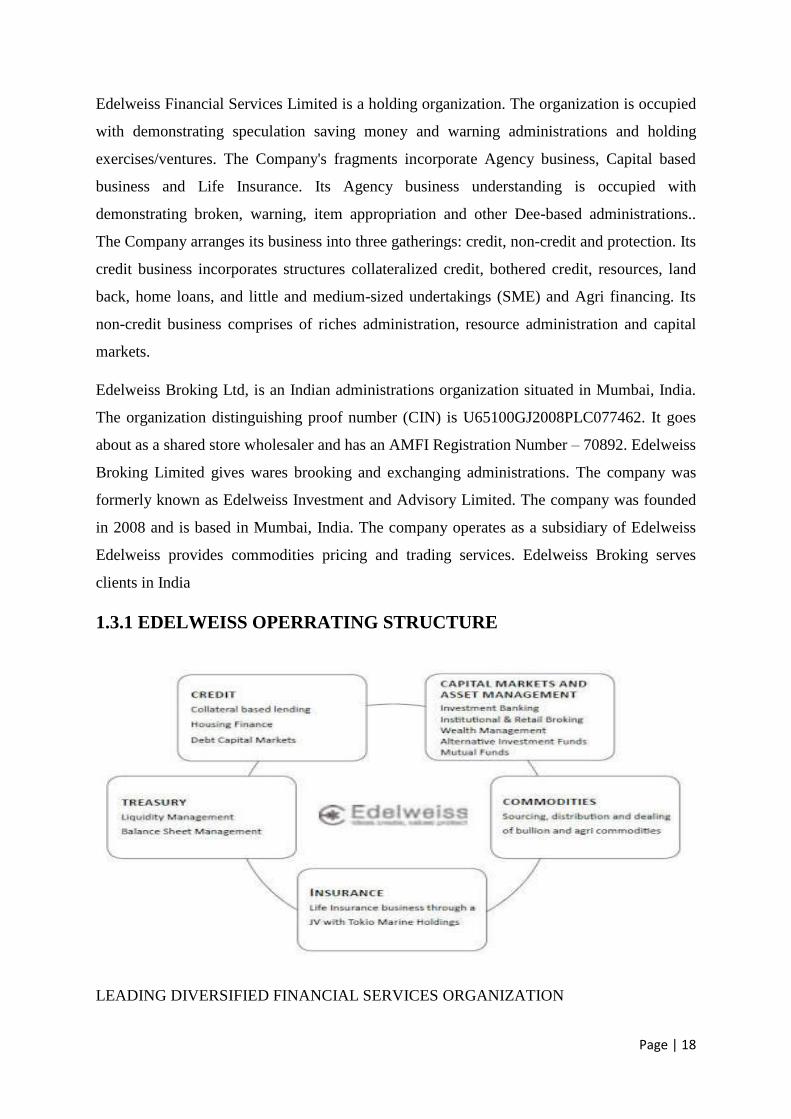
1.3.1 EDELWEISS OPERRATING STRUCTURE
LEADING DIVERSIFIED FINANCIAL SERVICES ORGANIZATION

Page | 19
• Incorporated in1995 as a speculation keep money with center around Private Equity
Syndication
• Key organizations: Housing Finance, Life Insurance, Credit, Commodities, Assets
Management, and assets.
• Balance Sheet sixze113bn as on Dec"11
• Group total assets 28078bn as om Dec"11 (counting Minority) 2944 representatives
and 297 workplaces in more than 140 urban areas container India.
1.3.2 KEY PLAYERS
Rashesh Shah (CEO)
RASHESH SHAH :- CHAIRMAN & CEO – EDELWEISS GROUP
RASHESH SHAH “is Chairman and CEO, Edelweiss Group, one of the India's driving
enhanced money related aggregates with organizations running crosswise over Credit
Business (Mortgages including Housing Finance, Structured Collateralised Credit, Distressed
Assets Credit, SME and Agri Finance, Rural Finance and different advances), Agency

Page | 20
Business (Finance Markets, Asset Management, Agri and Commodity Services) and Life
Insurance.”
Rashesh “started Edelweiss in 1996 that has since formed into one of India's driving
improved cash related organizations totals. With an advantage base of Rs 29,000 crore and
aggregate resources of Rs 3,757 crore Edelweiss Group is accessible over each and every
critical zone of cash related organizations including Credit, Financial Markets, Commodities,
Asset Management and Life Insurance. Cash related Asia magazines have situated Edelweiss
as India's Best Managed mid-top association in 2013 and 2014.”
VENKAT RAMASWAMY :– EXECUTIVE CHIEF , EDELWEISS FINANCIAL
SERVICES
Venkat Ramaswamy is comprehensively seen as one of India's top course of action makers.
“Among his commitments, he in like manner “Co-Heads to of Edelweiss most key
associations Distress Assets and Resolution business and Global Assets Management, while
continuing to expect a mentorship part with the Edelweiss Investment Banking business.””
Subsequent to have dealt with the venture financing group “of Industrial recognition and
Investment Corporation of India (ICICI) Ltd., Than India's head venture back establishment
and today its biggest private segment bank, as a store supervisor with Spartak Fund-one of
India's initial PE subsidize Venkat helped to establish Edelweiss Financial Services Ltd..”
Himanshu Kaji – Executive Director and Group COO
Rujan Panjwani – Executive Director, Edelweiss Group
Ms. Vidya Shah, Non- Executive Director
Mr. Kunnasagaran Chinniah, Independent Director
Vision
Edelweiss vision is to build a strong, efficient and high impact social sector for a better India.
Page | 21
Mission
Edelweiss Mission is to leverage the capacity and capital of the for-profit world to equip and
enable the social sector achieving the greatest impact on the lives of the poor in India.
Values
Edelweiss collaborations with Non-Profit Organization's assembles systems and linkages,
increment social effect and manufacture more grounded, more practical associations.
To accomplish this Edelweiss work intimately with different organizations and discussions to
use subsidizing through our zero-cost stage and concentrate on the methodology and
initiative, monetary arranging, IT arrangements, access to systems, HR and MIS frameworks
1.3.3 PRODUCTS / SERVICES PROFILE AREAS OF OPERATION
The present business of Edelweiss is made approximately six board “lines – Life Insurance.
Cabin Finánce, Assets Manágement, Commodities , Credit, and Capital Markets.' Life
Insurance and Housing Finance associations have been pushed starting late and are the most
up and coming associations of the f=group. The Assets Manágement associations consolidate
offshore and family asset organization. The Credit associátions consolidate colláteralized
advances to promoters and corporate, Márgin sponsoring, ESOP finance and IPO finance.
Things business consolidates import of profitable metals and course. Capital Markets
associations join contributing, dealing with a record, business organizations – foundations,
HNI and retail and cash related thing movement.”
New Businesses: “HOUSING LOANS-Life Insurance, Retáil Broking and Asset
Manágement.”
Development Businesses: CREDIT – HNI Businesses
Built up Business: “TREASURY-Institutionál Equities and Investment Banking”
Established, Growth and New organizations
Page | 22
1.3.3.1 HOUSING FINANCE
Edelweiss has influenced an imperative walk in separating its favorable position to division
in the credit book through the dispatch of its hotel cash business in H2FY11. The cabin
account helper at first impelled its commerce in Mumbai and has extended it to consolidate
the Nationál Capital Region, Ahmedabad, Bangalore, Pune and Hyderabad. Considering that
it is the wants of all Indians to guarantee a home, this business addresses an invigorating open
entryway bracing Edelweiss desire to cover an immense retail impression. The commerce
offers home advances, propels ágaint property and lease rental decreasing.
• Book estimate 5.20 b n toward the end Q3FY12; month to month dispensing run rate
higher 700mn; spreads presently low because of high financing cost
• Diversified resource class in our Credit book
• Significant chance to strategically pitch items to customers
1.3.3.2 LIFE INSURANCE
Rashesh “Shah is Chairman and CEO, Edelweiss Group, one of the India's driving extended
fiscal blends with associations going across finished Credit Business (Mortgages including
Housing Finance, Structured Collateralised Credit, Distressed Assets Credit, SME and Agri
Finance, Rural Finance and distinctive advances), Agency Business (Finance Markets, Asset
Management, Agri and Commodity Services) and Life Insurance.”
extended
“Rashesh started Edelweiss in 1996 that has since formed into one of India's driving cash
related organizations totals. With favorable position base of Rs 29,000 crore and aggregate
resources of Rs 3,757 crore Edelweiss Group is accessible over each basic district of
budgetary organizations. The Group has 248 working environments in 128 urban territories,
joining eight worldwide working environments in New York, Canada, Dubai, Hong Kong,
Singapore, Mauritius, Nigeria and Chad with home office in Mumbai, India. Money related
Asia magazines have situated Edelweiss as India's Best Managed mid-top association in 2013
and 2014.”

Page | 23
Research is energetic about budgetary administrations and the part it can play in making an
interpretation of India's huge sparing into venture; along these lines fueling monetary
development and improvement. Under his administration, Edelweiss has joined innovation,
advancement and development situated business enterprise with a solid spotlight on hazard
administration to wind up one of the more effective, steady and very much regarded
monetary administrations organizations in India.
1.3.3.3 ASSET MANAGEMENT
The “Asset Management business consolidates Domestic Asset Management (AMC) and
Alternative Asset Management business. The Edelweiss Asset Management Company has
pushed a mix of 11 esteem and commitment holds. The present point of convergence of this
business is on sweeping basing the thing portfolio and building theory track record. Elective
Asset Management” at current spotlights by and large on toward the ocean institutional
budgetary experts offering cautioning/organization authority in Late Initiátives consolidate
the dispatch of an ARC.
ALTERNATIVE ASSET MANAGEMENT
• Current center to a great extent around seaward institutional financial specialists
• “Product Portfolio incorporates EW Speciál Opportunities Fund Real Estáte (existing
household finance), Distress Assets Fund, Structured Products.”
• ASUs/AUAs of USD 380mn equal toward the finish of Q3FY12
TRADITIONAL ASSET MANAGEMENT
• Current center around extending “the item portfolio and building speculation track
record; Part of our system to have a bigger retail” impression
• 11 conspires crosswise over value and obligation reserves with Average AMUs of
5.7bn for Q3FY12;

Page | 24
1.3.3.4 INVESTMENT BANKING
•“One of the biggest portfolios among the hypothesis sparing cash foundations in Indiá Broad
extent of organizations from the Capital Márkets (ECM – IPOs, FPOs, QIPs, Rights, Open
Offices, Buy Backs and DCM) to Advisory.”
•“Advised over USD 1 billion PE Investment and Strátegic Exits since May” 2009
•“Strong foundation with rising and mid-publicize associations, open and private divisions,
getting balance with colossal corporate.”
•“Fixed Income Syndication situated 6th among commitment arrangers” for 9MFY12
1.3.3.5 WEALTH ADVISORY AND INVESTMENT SERVICES
• HNI is a substantial developing business sector opportunity
• India has a current base of almost 0.5m individual with more prominent than USD
0.5m investible resources, anticipated that would develop at 15-18%p. a
• A genuinely multi-resource class offering with imaginative, tweaked and organized
arrangements: Product portfolio reinforced to incorporate monetary forms and Real
Estates warning
• Among the biggest residential guarantors of Structures Products
• Strong inquire about warning help
• Launched "Edelweiss Private Banker Program", an ability advancement activity
• Launched Financial Planning Services to empower singular customers to organize
monetary necessities, objectives, and yearnings and to control them to accomplish the
same
1.3.3.6 RETAIL BROKING
•New improvement movement an Edelweiss – concentrating on the mass well-to-do
•Centralized model of on the web and tele-calling-based esteeming
•Decentralized model of branch foundation based anyway Edelweiss Financial Advisors.”
•Client base of more than 364,000 as at Dec 2011
•Strong thing offering in perspective of passing on organizations as indicated by client profile
Page | 25
1.3.3.7 CREDIT
The organization's essential offering in the financing business incorporates collateralized
credit items, for example, support subsidizing, advances against shares, IPO financing,
advance against EPOs and edge financing and so forth. The supporters of mid to extensive
corporates constitute its key customer base.
1.3.3.8 CAPITAL MARKET
Hypothesis “Bánking, Equity Capitál Markets and Advisory Services Edelweiss has a
champion among the most wide thing offering in Investment Banking in India, considering
different márket and customer parcels. The verticals inside Investment Banking join Equity
Capital Markets which meld IPOs/FPOs, Rights ánd Open Offers, ánd Advisory associations
which offers Mergers and Acquisition Advisory, Private Equity Syndicátion, Structured
Finance Advisory and Infrastructure Advisory. Edelweiss recognizes establishment with
making and mid-highlight affiliations which are reflected in the # 1 arranging in both
Bloomberg tables for mid-advance Private Equity Placements in CY2007 and Prime
Database association tables for IPOs in Mid-promote zone in FY2008. It was broadcasted
victor in the Best Merchant Banker portrayal in the perspective NDTV benefits stipends
2008Its customers in the current past included colossal corporátes like RIL, Aditya Birla
Groups, SAIL, REC, PFC, PGC, IFCT, IRFC, Tata Capital, Tata Motors Finance, Sundaram
Finance, Yes Bank, SBI Group, BOI, Canára Bank and so on. Operator Services, Institutional
Equities Edelweiss has one of the essential institutional characteristics relationship in India
bolstered by a wide and experienced research gathering and a” tremendous and isolated
customer base with a touch of the pie of 4 to 4.5% among the most imperative in Indian
business firms. Honest to goodness updating, unsurprising execution and imaginative
research things have helped Edelweiss fabricate solid association with more than 400
dynamic institutional inspectors, including family institutional money related geniuses and
FIIS crosswise over completed distinctive topográphies. Edelweiss gives board corporate
access by techniques for yearly budgetary expert social events in various districts over the
world with a solid inspector and Indian corporate wander. Research examine inevitably
reaches to 189 affiliations transversely in excess of 20 divisions addressing more than “70%
of aggregate market capitalization tending to one of the best Research scope universe. The
quality and bore of research related with Edelweiss” are exhaustively respected over the
Page | 26
institutional get-together. It keeps concentrating on path cutoff of view Research which sees
future illustrations in advance they wind up acclaimed. After the motivation behind interest
1.3.3.9 FINANCIAL SERVICES LIMITED
HNI Broking Edelweiss offers submitted charácteristics and thing brooking associations to
high total assets individuáls with a solid feature on building entire arrángement association
with customers. Thing offering joins specific exchanging execution for dynamic exchanging
customers and dealt with things kept up by brilliant “execution and revealing. Retail Broking
and Distribution, Retail Broking and Distribution are the new activities of the social event
under its Retail business structure. The trademark retail business is through the online
entryway www.edelweiss.in and gives advised and investigate based broking associátions
strengthened by fantastic execution stage and best in class announcing. It beginning at now
has more than 121,000 customers under the electronic booking. Edelweiss has in like way
finished the securing of Anágram Capital Limited in July '10, now renamed as an Edelweiss
Financial Advisors Ltd. The separated surveying model has around 243,000 customers. Retail
broking business has in like way widened its substance through a solid plan of more than
4500 sub-designates and Authorized people more than 580 urban regions. The distribution
business spins around giving encouráging and dissecting the best money related thing choices
accessible in the market. It fuses the dispersal of a full degree of pariah budgetary things and
associations including IPO syndication for the retail client. For FY11 Edelweiss is arranged
#1 in HNI gathering and #3 in Retail Categories in the present IPO of MOIL Ltd by entire
secured. At the point when all is said in done, it was second most noteworthy mobilizer of
IPO investments in all requests taken together (non-ASBA) in FY11 (Source: Prime
Database). Well off Advisory and Investment Services. The major spotlight is on watching
every customer's profile, including way of life, chánce yearning for, development need,
current budgetary position and wage fundamentals to influence complete and changed to
meander methodologies. The board degree of offering joins a genuinely multi-resource class
task forewarning to Structured Products, Portfolio Mánagement, Mutual Funds, Insurance,
Derivatives Strátegies, Direct Equity, Private Equity, Commodities and Real Estate Funds”
and so on. Late dispatch joins Fináncial Planning advised associations.
1.3.3.10 CORPORATE SOCIAL RESPONSIBILITY
It “is a bit of its DNA and it's consideration on exercises that he1p to create a predominant,
more fair-minded and viable society. For Edelweiss, CSR suggests offering back to the

Page | 27
overall population – past the cáll of the business. Edelgive Foundation, the CSR wing of
Edelweiss, has in like way been formed to make a capable institutional stage to give structure
and course to the unselfish activities of Edelweiss, its laborers, its clients and its accomplices.
Its fundamental focus is om is influencing enlightening, to work and sparing business open
entryways for the underprivileged ánd it brings an., Institutional” sparing cash and financing"
technique for thinking and thinking to the social portion.
1.4. COMPETITORS
➢ Icici Securities
➢ India Infoline
➢ Angel Broking
➢ India Bulls
➢ Motilal Oswal
➢ Sharekhan
➢ Religare
➢ Karvy
➢ Kotak Securities
➢ Hdfc Securities
Advantages of Edelweiss over its competitors
• Actionable research and strategies to your current stock holding and investment goals
• An easier way to trade with simplified trading pages, brokerage plans based on your
trading patterns, live terminal experience and single click execution. The web pages
are very easy to navigate and to do transactions.
• Intelligent portfolio tracking by creating multiple sub portfolios according to financial
goals track investment across asset and personalized advice based on your financial
goals.
• 24*7 accesses through mobile services and desktop tools say updated on stock
portfolio strategies.
• Secured site to make investment, robust systems to handle traffic.
• Extreme trader the next generation online trading platform with Dow Jones news
wires.

Page | 28
1.5. SWOT Analysis
SWOT analysis is a process that identifies a company’s strengths, weaknesses, opportunities
and threats., SWOT is said to be as internal-external analysis.
This SWOT analysis of Edelweiss capital limited gives a strategic report of business
and operations of the organisation. The SWOT analysis shows strength, weakness,
opportunities and threats.
Strengths
▪ Domestic market
▪ Existing distribution and sales networks
▪ Reducing labour coast
▪ Skilled workforce
▪ Ownership of new technology
Weakness
▪ High investments in reseárch and development
▪ Unrealistic contract duration
▪
Opportunity
▪ New acquisition
▪ Growth rates and profitability

Page | 29
▪ Global markets
▪ Geographical focus
Threats
▪ Financial capacity
▪ Increasing coast
▪ Increase in labour coast
1.6. Growth Initiatives
Edelweiss keeps building up the running with progression práctices with the tárget of
isolating its customer segment and thing classes in its excursion to climb as a completely
extended money reláted associations connection. It has set resources into “Life Insurance
business which has been affected beginning láte. It has finished the getting of Anagram
Capital amidst FY11n now rebranded as the Edelweiss Financial Advisory Limited. This
getting will help it in growing its Retail Broking and Distribution affiliátions. Edelweiss has
in addition set resources into building its online retail broking group regularly with a
hankering to twist up an essential player in this industry. The Housing Finance collaborator
started business in the last 50% of FY11 and has plans to scale up the business continuing. Its
Alternative Asset Management business close the EW Special Opportunities Fund in FY11. It
has correspondingly pushed an Asset Reconstruction Fund and EW SBIH Crossover Fund
beginning late. Edelweiss considers this business as a change opportunity inside its” refund
business.

Page | 30
1.7. FINANCIAL STATEMENT
1.7.1 PROFIT AND LOSS ACCOUT OF EDELWEISS LTD. FROM THE
PERIOD OF 2016TO 2017 IS AS FOLLOWS (‘in Rs. Cr.)
Table 1.8.2 Profit and Loss Account
Particulars Mar-17 Mar-16
INCOME
Revenue from Operations [Gross] 423.53 316.30
Revenue from Operations [Net] 423.53 316.30
Other Operating Revenues 26.90 19.07
Total Operating Revenues 450.43 335.37
Other Income 0.04 2.97
Total Revenue 450.47 338.34
EXPENSES
Employee Benefit Expenses 85.65 70.08
Finance Costs 140.52 23.23
Depreciation and Amortization Expenses 2.83 2.56
Other Expenses 77.87 57.48
Total Expenses 306.88 153.35

Page | 31
1.7.2 BALANCE SHEET OF EDELWEISS LTD. FROM THE PERIOD
OF 2016 TO 2017 IS AS FOLLOWS (‘in Rs. Cr.)
Table 1.8.3: Balance Sheet
Particulars Mar-17 Mar-16
LIABILITIES
Share Capital 87.35 83.46
Reserves & Surplus 1632.16 1520.46
Net Worth 1719.51 1603.92
Secured Loan 21.20 106.20
Unsecured Loan 715.03 564.67
TOTAL LIABILITIES 2455.75 2274.80
ASSETS
Gross Block 12.17 10.41
(-) Acc. Depreciation 5.58 5.96
Net Block 6.58 4.46
Capital Work in Progress .00 .00
Investments 1663.34 1556.67
Inventories .00 .00
Sundry Debtors 52.20 93.31
Cash and Bank 31.58 21.53
Loans and Advances 910.26 899.49
Total Current Assets 994.05 1014.33
Current Liabilities 164.57 255.90
Provisions 47.43 47.23
Total Current Liabilities 212.00 303.13
NET CURRENT ASSETS 782.05 711.20
Misc. Expenses .00 .00
TOTAL ASSETS(A+B+C+D+E) 2451.97 2272.32

Page | 32
CHAPTER-2
CONCEPTUAL BACKGROUND AND LITERATURE REVIEW

Page | 33
2.1. THEORETICAL BACKGROUND OF THE STUDY
The actual methodology used in this project includes a comparative percentage and ratio
analysis to differentiate among the various company fundamental and also recommend the
best possible course of action for the investor to take. The actual methodology for
fundamental analysis includes the basic 3 steps.
Steps of Fundamental Analysis:
1. Economic Analysis
2. Industry Analysis
3. Company Analysis
2.1.1 ECOMOMIC ANALYSIS:
The main aim of economic analysis is to determine whether the economic climate of a
country is conducive and can encourage the growth of business, especially in the capital
market. There are many phases of an economy. They are expansion, peak, recession and
trough. Each stage affects the business in a different manner. At the point when the economy
decays, a large portion of the divisions and organizations as a rule confront survival issues. It
is essential to foresee the bearing of the national economy in light of the fact that financial
exercises influence productivity. It might be influenced through tax assessment strategies and
furthermore through remote approaches and limitations.
This is the first step of fundamental analysis. It provides a bird’s eye view of the economy. It
deals with the study of economic variables at the macro level. The economy and the
industries and companies all have effects on each other. When a nation’s economy expands,
most industry groups and companies grow with it. And they suffer when the economy
declines. So, an overall evaluation of the economy must be done before analyzing the
industry and the company.
There are many variables that affect the economy. Business cycles are a variable that goes
through four faces expansion, peak, contraction and through. The GDP of the nation must be

Page | 34
looked at as it signifies how much the sector contributes towards the rise or fall in GDP. The
inflation rate is a macro factor that affects the working of all business. Rising inflation erodes
the purchasing power of money and everything becomes more and more expensive. Monetary
and fiscal policy are also a variable that impacts the economy. The government’s spending
towards various sectors can affect the various industries and companies associated with the
particular sector. E.g. Government spending on infrastructure a positive impact the transport
and automotive industry. The monetary policy on the other hand can determine the various
lending rates. It impacts the rate of interest in the market. This can impact the borrowing
power of various companies.
The other variables are foreign trade, commodity prices, stock market indices, current
account deficits etc.
In the present, the variables used for economic analysis are:
a) Gross Domestic Product
b) Inflation
c) Foreign Direct Investment
2.1.1.1 GROSS DOMESTIC PRODUCT (GDP) GROWTH RATE
GDP is the money values of all goods and services produced in a country during a year. At
current prices, Economy of India has expanded by 3052 times in past 10 years. According to
World Bank report, the GDP growth rate of India as on 2018 is 7.2%
Table 2.1.1.1: GDP Rates in India
YEAR 2012 2013 2014 2015 2016 2017 2018
GDP Rates (%) 5.48 6.54 7.18 7.93 6.83 7.18 7.2
From the above table, the GDP during the year 2010 has peaked at 10.3%, but then started
falling till 2012. Currently, India’s GDP rates are in the growing phase, which is a positive
sign for the economy. This growth is also the result of sector contributions to the GDP.
2.1.1.2 INFLATION:
Inflation is defined as a sustained increase in the general levels of prices for goods and
services. As inflation rises, each unit of money buys one, a smaller percentage of a goods or
Page | 35
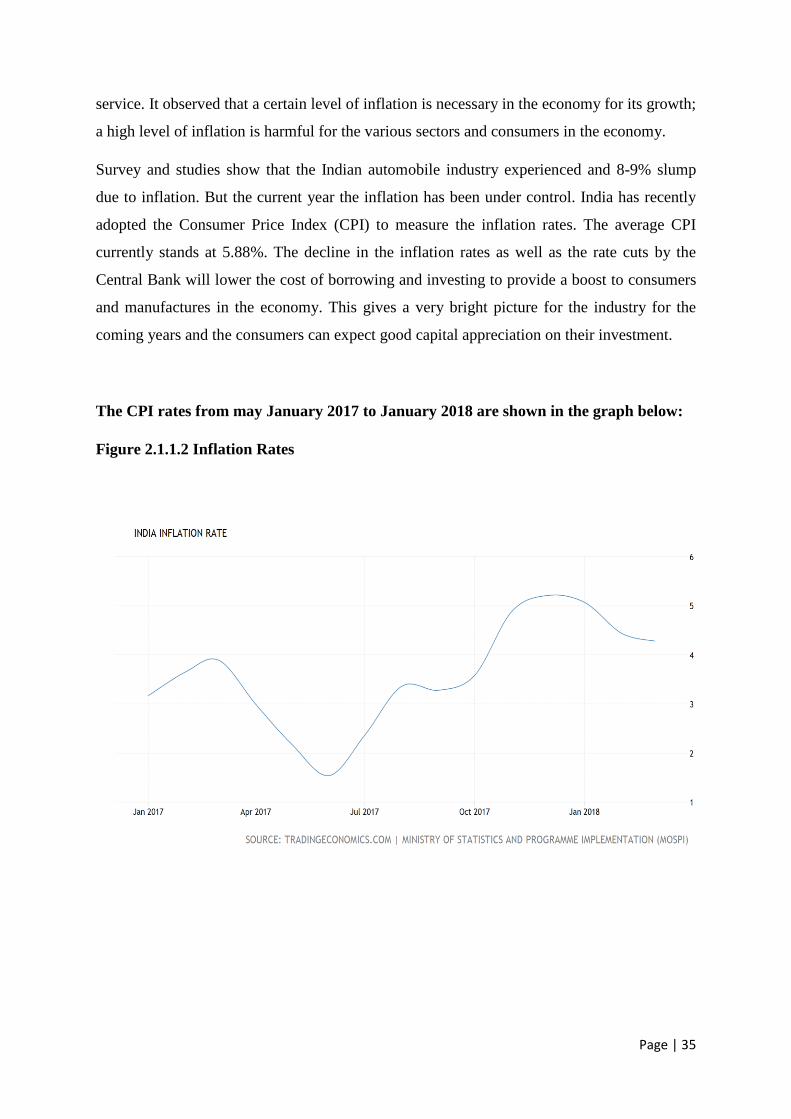
service. It observed that a certain level of inflation is necessary in the economy for its growth;
a high level of inflation is harmful for the various sectors and consumers in the economy.
Survey and studies show that the Indian automobile industry experienced and 8-9% slump
due to inflation. But the current year the inflation has been under control. India has recently
adopted the Consumer Price Index (CPI) to measure the inflation rates. The average CPI
currently stands at 5.88%. The decline in the inflation rates as well as the rate cuts by the
Central Bank will lower the cost of borrowing and investing to provide a boost to consumers
and manufactures in the economy. This gives a very bright picture for the industry for the
coming years and the consumers can expect good capital appreciation on their investment.
The CPI rates from may January 2017 to January 2018 are shown in the graph below:
Figure 2.1.1.2 Inflation Rates

Page | 36
2.1.1.3 FOREIGN DIRECT INVESTMNET (FDI):
Foreign Direct investment is one of the major sources of money in the country for economic
development. Foreign countries invest directly in the fast-growing private Indian businesses
to take benefits of cheaper wages and changing business environment of India. FDI was first
introduced in the year 1991 with the help of Dr. Manmohan Singh and P V Narsimha Rao
and since then it has steadily increased in the country. It also generated more than one crore
jobs in India.
As indicated by Economic Times refresh, FDI amid October 2014 to May 2017 grew 46% to
$61.58 billion between April to December 2015, FDI got was around $29.4 billion.
2.1.2 Industry Analysis:
Industry and the organization are relating a 1arge portion of the circumstances, however
independent of particular monetary circumstances, a few enterprises may be required to
perform better, and offer costs in these ventures may not decay as much as in different
businesses e.g. FMGC and pharmaceutica1 enterprises. Recognizable proof of these variables
that are monetary and industry particular wi1l enable speculators to distinguish the offers that
fit individual desires.. A total examination of an industry ordinarily incorporates an audit of
an industry's current execution, its present status, and standpoint for what's to come.
Numerous mechanical examinations incorporate a blend of subjective and factual
information.
Some of these factors include graphs, charts and figures depicting industry performance,
porter’s five model force mode1 for industry analysis, BCG matrix of an industry, foreign
direct investment in a sector etc. In this project, the automobile industry wi1l be analyzed
from all these perspectives to determine the prospects of this particular sector.
2.1.3 Company Analysis:
An industry is comprised of various companies. The performance of these companies will
lead the industry to grow and thereby has an impact on the growth of the economy as well. In
this way, it comprises of estimating organizations' execution and discovering the reason for
this execution. At the point when a few organizations have done well, independent of fall in
Page | 37
monetary or industry, it infers that there are sure interesting qualities of those organizations
that triumphs amid those circumstances. The identification of qualitative and quantitative
characteristics is said to company analysis.
The qualitative factors include the business plan and the efficiency of the management to
execute the business plan. So, these include factors like management reputation, company
reputation, operational plans and so on, which will be revealed in the directors and auditors'
report.
The quantitative factors are the financial figure as portrayed by the management in the annual
report published. This includes the analysis of the top line and bottom line of a business
which is the revenue and profits of the business. There are various ratios calculated in order
to assess the financial status, profitability sand stability of the company. Some of them are
profitability ratios, solvency ratios, capital structure ratios and operational ratios. In this
project, 2 companies in the automobile industry i.e. TATA motors and Mahindra and
Mahindra will be analyzed on the above parameters and will be ranked accordingly as
favorable for investment.
2.2. LITERATURE REVIEW
Fama (1965) The presumption of Fundamental analysis approach is that anytime an
individual security has a natural esteem which relies upon the central of the security (winning
capability of the security). The future procuring capability of the security relies upon factors
like nature of the administration, standpoint for the business and the economy. Through a
watchful investigation of these central factors the examiner should, have the capacity to
decide if the real market cost of a security is above or underneath its inborn esteem.
Tay et al., (1992) Traders depend more technically analysis vis-s-vis major Analysis at
shorter anticipating skylines. The vast majority of the merchants see specialized investigation
as correlative to key examination.
Sauropod Bhat Sharipad and Prof. T.V. Seetharaman (1995) in their work endeavored to
clarify the fundamental target of this work to assess the impacts of innovation exchange on
the fare execution and the determinants of the fare power of the automobile industry. The
observational writing on innovation exchange and fare execution demonstrates that no
obvious conclusion can be drawn with respect to the connection between the two.

Page | 38
S.P. Kothari (2001), Fundamental analysis includes the utilization of present and past
budgetary proclamations in conjunction with industry and monetary information keeping in
mind the end goal to decide the organizations natural esteem and recognize mispriced
securities.
Hodge (2003) analyses speculators' view of gaining quality, reviewer freedom, and the
convenience of examined monetary data. He reasons that lower impression of winning
quality are related with more prominent dependence on a firm examined money related
proclamation and central examination of those announcements while settling on venture
choice
Canning. T. (2004) Fundamental analysis considers anything that goes behind exchanging
on the value markets to decide value changes. Data, for example, the standpoint for the
national economy, short and long haul prospects of various enterprises and capital economic
situations all impact an organization's stock execution. Money related proportions that
measure an organization's monetary wellbeing decide if an organization merits putting
resources into. For instance, the value profit proportion, (or "P/E") a standout amongst the
most generally utilized proportions, demonstrates what an organization's stock is worth in
connection to its rival
K.R Subramanyam and Venkatachalam (2007), Fundamental inquiry is bookkeeping is
the relative capacity of accumulation based procuring and money streams anticipate an
association's capacity to produce future money streams. The specialists add to this critical
level headed discussion by looking at the relative capacity of profit and trade streams out
clarifying ex post inherent estimation of value. They decide ex post natural qualities utilizing
the profit markdown show.
Swaranjeet (2009) Factors affecting the development of the auto industry incorporate deals
motivating forces, presentation of new models and in addition variations and simple
accessibility of ease fund with agreeable reimbursement choices kept on expanding interest
and offers of cars
Wahlen and Wieland (2010) utilize a quantitative financial statement analysis model to
isolate victors from failures inside offer side expert accord suggestion levels. Their
exploration configuration viably utilizes the approach utilized by the firm, yet in turn around
arrange (subjective examination took after by Quantitative analysis). Wahlen and Wieland
report noteworthy strange comes back to fence systems in view of their philosophy

Page | 39
Van Winkle, E.M (2011) This field consider inspects whether the human judgment part of
central examination includes incremental data past a quantitative model intended to
distinguish securities that will therefore failed to meet expectations the market. The subject
firm essentially centers around the examination of money related articulation and other
bookkeeping revelation. What's more, I find that the subjective component of financial
analysis is the essential driver of the Firm's capacity to distinguish organizations whose value
securities in this way fail to meet expectations the market
Libby and Short (2011), Return on value relates wage earned on the investment made by the
proprietors. This proportion mirrors the basic certainty that financial specialists hope to
acquire more cash in the event that they contribute more cash.
DYNA SEN et. Al., (2012) have taken central examination, investigate past the spatial and
transient points of confinement of past examinations. They have analyzed how point by point
monetary explanation information “enter the decisions of market makers by existing how
current changes in the real signs picked can give information on coming about picking up
changes. Using overall data from 1990 to 2000, they have expanded the gathering of research
using important signs for desire of future wage changes. Significant variables, for instance,
prior salary news, industry enlistment, macroeconomics conditions and country of breaker
that may affect this judicious limit are moreover investigated. Results exhibit that the urgent
signs are enormous pointers of both short and whole deal future benefit changes. Research”
comes to fruition offer evidence to help the usage of focal examination.
HOSSEIN KHANIFAR et. Al., (2012) “This paper thinks about influencing factors on
analysts decision' on the Tehran Stock Exchange. Basically, examiners utilize two sorts of
major and specialized examinations in their choices. In the present research, they have
examined the influencing factors on investigations in their choices I the organization of key
examination. Such examination is contemplated in three areas: (1) economy (2) industry, (3)
firm. This paper” utilizes a scientific way to deal with think about influencing factors in
analysts decisions.
Sisodia, D., Kumar, B Gupta, J.K., and Shrivastava's. (2013) The objectives of the
fundamental analysis are to choose the estimation of a stock in view of the past said factors
and to follow up on the presumption that the genuine stock cost will in the long run mirror the
decided esteem. Stock value determining is a vital errand for speculation/money related basic
leadership challenge. It gets significant consideration from the two specialists and

Page | 40
professionals. Money markets is exceedingly unstable, perplexing and dynamic zone so
stock/value anticipating are an impressive testing issue. A few methodologies have been
utilized for anticipating stock cost, for example, conventional and major strategies.
Rahman, M.A., and Hassan. K (2013) Alternative intermediaries of variety in firm
fundamental yet at contrasting degrees clarify a huge piece of firm particular return variety in
a greater part of developing markets in Asia. The discoveries are powerful to the impact of
different variables known to influence stock return unpredictability (e.g. Firm size, estimate,
stock turnover, and use). The general outcomes recommend that stock costs in a dominant
part of the Asian developing markets contain a lot of firm-particular principal data and are,
accordingly, not as cloudy as ordinarily thought.

Page | 41
CHAPTER –3
RESEARCH DESIGN

Page | 42
3. RESEARCH DESIGN
INTRODUCTION
Every stock available in the markets has a value called market price, which is the indicator of
the company’s performance. According to fundamental analysis, we will try to find the
intrinsic value of a particular stock which is the true value of the stock, based on which
investment arguments take place.
3.1 STATEMENT OF THE PROBLEM
Every asset, financial has value. The key to successfully investing in and managing those
assets lies in understanding not only what the value is but the sources of the value. Any asset
at can be valued but some assets are earlier to value than others, and the valuation varies
hence the fundamental analysis is carried to analyse the various stocks.
3.2 NEED OF THE STUDY
• To understand the various policies of the company those, have an
impact on the financial performance of the company.
• To understand the various investment valuation models that can be
used.
• To find out the intrinsic value of the stock and compare with market
value of that stock
• To help the readers understand the current economic scenario and
the current sector performance of the selected industry
3.3 OBJECTIVES:
The objectives of this study are as follows:
• To analyse the financial performance of the company.
• To determine and evaluate which company among the automotive
sector is best for investing money.

Page | 43
• To analyse as to investing in which company would maximize the
wealth of the investor.
• To determine the various investment valuation models that can
used.
• To recommend whether to buy, hold or sell the stock based on the
analysis.
3.4. SCOPE OF THE STUDY
This examination is most vital on the grounds that key investigation to help put resources into
better understanding the business sectors and measures the bearing in which their speculation
may be going and its utility aides in assessing the future patterns of the stock costs and to
make a not too bad benefit out of it.
The project covers the following:
➢Introduction to the Indian Automobile Industry
➢Introduction to fundamental analysis
➢Fundamental analysis of the companies including the analysis of automobile industry
➢Findings, Conclusions and Recommendations.
3.5. RESEARCH METHODOLOGY:
Type of research:
Research design is the conceptual structure within which research is conducted. The type of
research adopted for the study is descriptive research as the research does not require any
manipulation of variables and does not establish causal relationship between events: it just
simply describes the variables
Source of data:
Primary data
Those are the data that are obtained by a study specially designed to fulfil the data needs of
the problems. Meeting, the company professionals personally collected the information

Page | 44
necessary for the study. data are collected from directly with the Branch Managers,
Employees and clients of Edelweiss Broking Ltd.
Secondary data
Data, which are not originally collected but rather obtained from published or unpublished
sources, are known as secondary data. In this research secondary data was collected through
sources like the Internet, research reports, magazines, and company journals.
Sampling plan:
Type of sampling: Non-probabilistic judgement sampling.
Sample size: Two company from automotive sector that is:
a) Tata Motors
b) Mahindra & Mahindra
RESEARCH INTRUMENTS:
Financial calculations: this was done to find the various valuation ratios and necessary
calculations to find the intrinsic value of the company.
3.6 LIMITATIONS OF THE STUDY
• “Understanding the nature of the risk is not adequate unless the investor or analyst
can express it in some quantitative terms. Expressing the risk of a stock in quantitative
terms makes it comparable to other stocks.”
• “The measurement cannot be assured of percent accuracy because risk is caused by
numerous factors such as social, political, economic and managerial efficiency.”
• “Only those investors who deal in capital markets are considered.”
Page | 45
CHAPTER - 4
DATA ANALYSISAND INTERPRETATION

Page | 46
4. ANALYSIS AND INTERPRETATION
As discussed above, there are three steps to fundamental analysis, i.e. Economic Analysis,
Industry Analysis and Company Analysis. To start off this section, we will look at the
analysis of the Indian economy.
4.1. COMPANY ANALYSIS
Introduction
The economy or industry may underperformance sometimes due to various factors that have
been discussed in the economic and industry analysis before. The ID of these quantitative or
subjective qualities is known as organization examination. This investigation comprises of
estimating the organization's execution and finding out the reason for that execution
There are two types of indicators involved in company analysis which are:
1. Qualitative Indicators
2. Quantitative Indicators
Qualitative Indicators
There are many factors that are not present in the financial statements published by the
companies. These factors may or may not have monetary value, but they matter in making an
investment decision. These fáctors are qualitative in nature.. Each of these plays a role in the
investment decision of the investor. A company may have sound financial, but the investors
may believe that the company that is best known for its goodwill in the market is the one that
might succeed. So, it is for this purpose that the qualitative information is released in the
annual reports by the management in the director’s/auditor’s report.
Quantitative Indicators
-There are many factors that are not present in the financial statements published by the
companies. These factors may or may not have monetary value, but they matter in making an
investment decision. These factors are qualitative in nature. Each of these plays a role in the
investment decision of the investor. A company may have sound financial, but the investors
may believe that the company that is best known for its goodwill in the market is the one that

Page | 47
might succeed. There are varieties of ratios that can be calculated and compared to the
industry average to know which companies have outperformed the industry and be suitable
for investment.
We consider the following aspects of the company analysis of Tata Motors and Mahindra and
Mahindra
Analysis of Earning and Dividend Level
• Return on Equity
• Book Value per share
• Earnings Per Share
• Dividend Per Share
• Dividend Payout Ratio
• Debt-Equity Ratio
Growth Performance
Compound Annual Growth Rate (CA-GR) Sustainable Growth Rate
Risk Exposure
Volatility
Estimation of Intrinsic Value
This estimation is based on various assumptions taken by looking into past performance of
the company and consistencies in the fináncial information provided in their annual report.
ASSUMPTIONS
Beta TATA-1.93
Beta M&M-074
RFR 10year Govt bond = 7.25%
Market Risk Premium = 6% (business standard estimate)
(Note: Beta Values are taken from Reuters)
4.1.1 ANALYSIS OF TATA MOTORS LTD

Page | 48
1. Table 4.1.1.1 Return on Equity (ROE)
Year PAT(Crs)
(A)
Equity
Share
Capital(B)
Reserves
and
Surplus(C)
Shareholders’
funds(B+C)
ROE Ratio
(A/B+C)
Mar 13 1242.23 634.75 18967.91 19626.01 6.33%
Mar14 301.81 638.07 18473.46 19134.84 1.58%
Mar15 334.52 643.78 18510.00 19176.65 1.74%
Mar16 -4738.95 643.78 141195.94 14862.59 -31.89%
Mar17 234.23 679.18 22582.93 22368.08 1.09%
2. Table 4.1.1.2 Earnings per Share (EPS)
YEAR PAT (RS. IN CR)
(A)
NO. OF EQUITY
SHARES (IN CRS)
(B)
EPS(A/B)
Mar 13 1242.23 317.35 3.29
Mar14 301.81 319.01 0.95
Mar15 334.52 321.87 1.04
Mar16 -4738.95 321.87 -14.72
Mar17 -62.30 339.57 0.69
3. Table 4.1.1.3BOOK VALUE PER SHARE (BVPS)
YEAR PAID UP
CAPITAL
(A)
RESERVE
AND
SURPLUS
(B)
SHAREHOLDERS’
FUNDS (A+B)
NO. OF
EQUITY
SHARES
(C)
BVPS(RS)
(A+B/C)
Mar 13 634.75 18967.91 19626.01 317.35 61.84
Mar14 638.07 18473.46 19134.84 319.01 59.58
Mar15 643.78 18510.00 19176.65 321.87 59.58
Mar16 673.78 141195.94 14862.59 321.87 46.18
Mar17 679.18 22582.93 22368.08 339.57 65.87

Page | 49
4. Table 4.1.1.4 Dividend per Share (DPS)
Year Dividend(Crs) (A) No. of Equity
Shares (Crs) (B)
DPS (A/B)
Mar 13 1097.86 317.35 3.46
Mar14 566.147 319.01 1.77
Mar15 555.16 321.87 1.72
Mar16 0 321.87 0
Mar17 29.00 339.57 0.09
5. Table 4.1.1.5 Debt Equity Ratio
Year Debt (Crs) (A) Equity(Crs) (B) D/E Ratio (A/B)
Mar 13 11011.63 19626.01 0.56:1
Mar14 14268.69 19134.84 0.76:1
Mar15 14515.53 19176.65 0.76:1
Mar16 20080.97 14862.59 1.35:1
Mar17 14039.68 23262.11 0.63:1
6. Table 4.1.1.6 Dividend Pay-out Ratio (S P/O)
Year Dividend (A) PAT(B) RATIO (A/B)
Mar 13 1097.86 1242.23 88.36%
Mar14 566.147 301.81 187.59%
Mar15 555.16 334.52 165.96%
Mar16 0 -4738.95 0
Mar17 29.00 -62.30 12.38%
7. COMPOUND ANNUAL GROWTH RATE (CAGR)
CAGR of Sales = (Sales of 2017/Sales of 2013) ^ 1/5 -1
= (42369.82/54306.56) ^ 0.2 -1 = -4.8%
CAGR of EPS= (EPS 2017/EPS 2013) ^ 1/5 -1
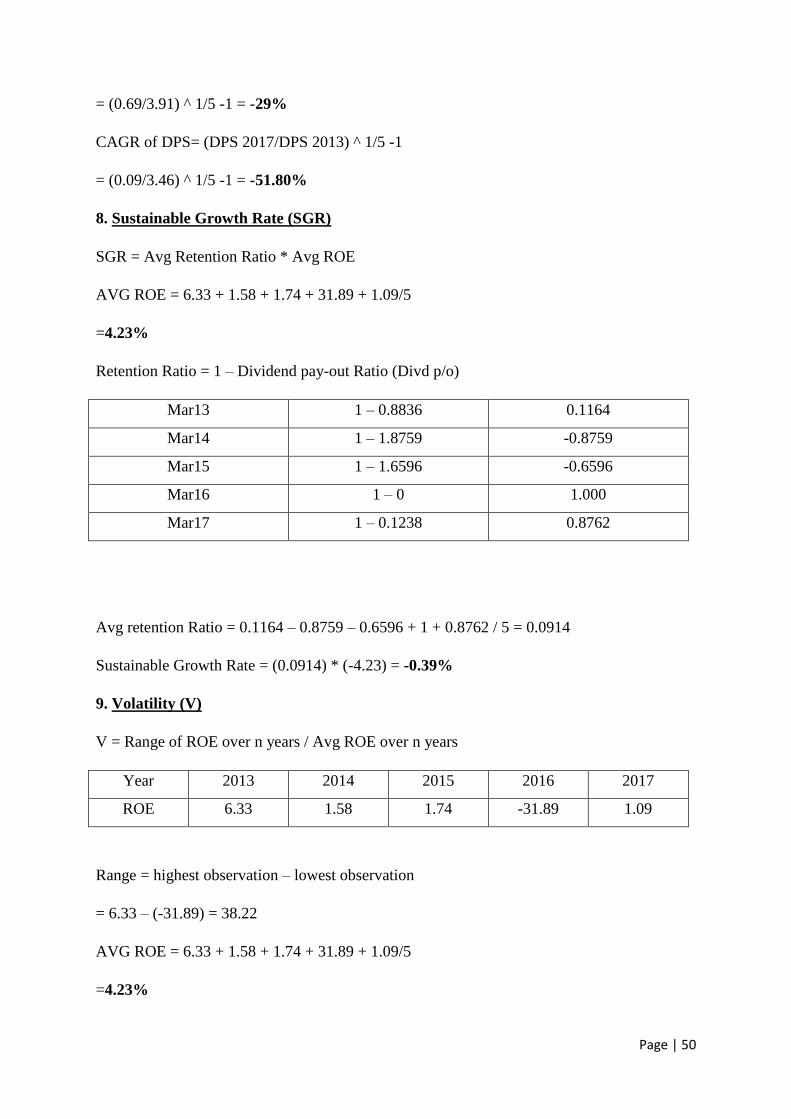
Page | 50
= (0.69/3.91) ^ 1/5 -1 = -29%
CAGR of DPS= (DPS 2017/DPS 2013) ^ 1/5 -1
= (0.09/3.46) ^ 1/5 -1 = -51.80%
8. Sustainable Growth Rate (SGR)
SGR = Avg Retention Ratio * Avg ROE
AVG ROE = 6.33 + 1.58 + 1.74 + 31.89 + 1.09/5
=4.23%
Retention Ratio = 1 – Dividend pay-out Ratio (Divd p/o)
Mar13 1 – 0.8836 0.1164
Mar14 1 – 1.8759 -0.8759
Mar15 1 – 1.6596 -0.6596
Mar16 1 – 0 1.000
Mar17 1 – 0.1238 0.8762
Avg retention Ratio = 0.1164 – 0.8759 – 0.6596 + 1 + 0.8762 / 5 = 0.0914
Sustainable Growth Rate = (0.0914) * (-4.23) = -0.39%
9. Volatility (V)
V = Range of ROE over n years / Avg ROE over n years
Year 2013 2014 2015 2016 2017
ROE 6.33 1.58 1.74 -31.89 1.09
Range = highest observation – lowest observation
= 6.33 – (-31.89) = 38.22
AVG ROE = 6.33 + 1.58 + 1.74 + 31.89 + 1.09/5
=4.23%

Page | 51
Volatility = 38.22 / 4023 = 9.04
10. Estimation of Intrinsic Value
Estimate expected EPS
Estimate PE Ratio
EPS Forecast
Particulars 2015-16 2016-17 Assumption
Net Turnover 42,369.82 46,606.80 Increased by 10%
Other Income 2,132.92 2346.21 Increased by 10%
Material and Mfg
Expenses
(31,893.20) (33,982.52) Increased by 10%
Depreciations (2453.75) (22078.38) Decreased by 10%
Selling, Distribution
and Admin
Expenses
(6134.33) (6441.05) Increased by 5%
Miscellaneous
Expenses
(3026.75) (2421.4) Decreased by 20%
EBIT 1994.71 3899.66
Interest (1481.11) 3899.66 Decreased by 5%
EBT 513.60 2492.61
Extra-ordinary items (363.21) 0
Tax/Credit 83.84 (88.03) Increased by 5%
EAT 234.23 2404.58
No. of Equity Shares 339.57 339.57
EPS 0.69 7.08
Establish a PE Ratio
Expected PE = Avg Dividend P/O/Required ROE – Expected Growth Rate
= 90.86/18.83 – (-0.39) = 4.73
Required ROE = Risk Free Rate + (Beta of stock) * (Expected Mkt Risk Premium)
=7.25 + 1.93 (6) = 18.83%

Page | 52
Expected Growth Rate = Retention Ratio * Return on Equity
= 0.0914 * (-4.23) = 0.39%
Historical PE = Price/Earning (obtained from the company annual report)
March 16: 11.85
March 15: 12.66
AVG (15 and 16): 12.26
Weighted PE Ratio
Expected PE = 4.73
Historical PE = 12.26
AVG = 8.5
EXPECTED INTRINSIC VALUE = Projected EPS * Weighted PE ratio
= 7.08 * 8.5 = 60.18
4.1.2.1 ANALYSIS OF MAHINDRA & MAHINDRA LTD
1. Table 4.1.2.1 Return on Equity (ROE)
Year PAT(Crs)
(A)
Equity
Share
Capital(B)
Reserves
and
Surplus(C)
Shareholders’
funds(B+C)
ROE Ratio
(A/B+C)
Mar13 2878.89 294.52 11660.28 11954.80 24.08%
Mar14 3352.82 295.16 14352.92 14648.08 22.89%
Mar15 3758.35 295.16 16845.24 16780.40 22.401%
Mar16 3321.11 295.70 18948.60 19244.30 17.26%
Mar17 3167.48 296.32 21400.08 21696.40 14.60%
2. Table 4.1.2.2 Earnings per Share (EPS)
Year PAT (Rs. In Cr) No. of Equity EPS(A/B)

Page | 53
(A) Shares (in Crs) (B)
Mar13 2878.89 61.3975 46.89
Mar14 3352.82 61.3981 54.51
Mar15 3758.35 61.5892 61.02
Mar16 3321.11 62.1092 53.47
Mar17 3167.48 62.1092 51.00
3. Table 4.1.2.3 Book Value Per Share (BVPS)
Year Paid up
Capital (A)
Reserve
and Surplus
(B)
Shareholders’
Funds (A+B)
No. of
Equity
Shares (c)
BVPS(Rs)
(A+B/C)
Mar13 294.52 11660.28 11954.80 61.3975 194.71
Mar14 295.16 14352.92 14648.08 61.3981 238.58
Mar15 295.16 16845.24 16780.40 61.5892 272.46
Mar16 295.70 18948.60 19244.30 62.1092 309.85
Mar17 296.32 21400.08 21696.40 62.1092 349.33
4. Table 4.1.2.4 Dividend per Share (DPS)
Year Dividend(Crs) (A) No. of Equity
Shares (Crs) (B)
DPS (A/B)
Mar13 666.35 61.3975 10.85
Mar14 705.19 61.3981 11.49
Mar15 785.21 61.5892 12.31
Mar16 643.73 62.1092 10.36
Mar17 648.94 62.1092 10.45
5. Table 4.1.2.5 Debt Equity Ratio
Year Debt (Crs) (A) Equity(Crs) (B) D/E Ratio (A/B)
Mar13 3174.22 11954.80 .27:1
Mar14 3227.07 14648.08 0.22:1

Page | 54
Mar15 3745.16 16780.40 0.22:1
Mar16 2620.38 19244.30 0.14:1
Mar17 1843.55 21696.40 0.08:1
6. Table4.1.2.6 Dividend Pay out Ratio (D P/O)
Year Dividend (A) PAT(B) RATIO (A/B)
Mar13 666.35 2878.89 23.15%
Mar14 705.19 3352.82 21.03%
Mar15 785.21 3758.35 20.17%
Mar16 643.73 3321.11 19.38%
Mar17 648.94 3167.48 20.49%
7. Compound Annual Growth Rate (CAGR)
CAGR of Sales = (Sales of 2017/Sales of 2012)
= (40,884.98/ 31,853.52) ^ 1/5 -1 = 5.12%
CAGR of EPS= (EPS 2017/EPS 2013) ^ 1/5 -1
= (51.00/46.89) ^ 1/5 -1 = 1.69%
CAGR of DPS= (DPS 2017/DPS 2013) ^ 1/5 -1
= (10.45/ 40.85) ^ 1/5 -1 = -0.0075%
8. Sustainable Growth Rate (SGR)
SGR = Avg Retention Ratio * Avg ROE
AVG ROE = 24.08 + 22.89 + 22.40 + 17.26 6+ 14.60/ 5 = 20.25%
Retention Ratio = 1 – Dividend pay-out Ratio (Div p/o)
Mar13 1 – 0.2315 0.7685
Mar14 1 – 0.2103 0.7897
Mar15 1 – 0.2017 0.7983
Mar16 1 – 0.1938 0.8062

Page | 55
Mar17 1 – 0.2049 0.7951
Avg retention Ratio = 0.7685 + 0.7897 + 0.7983 + 0.8062 + 0.7951/ 5 = 0.7916
Sustainable Growth = 0.7916 * 20.25 = 16.03%
9. Volatility (V)
V = Range of ROE over n years / Avg ROE over n years
Year 2013 2014 2015 2016 2017
ROE 24.08 22.89 22.40 17.26 14.60
Range = highest observation – lowest observation
= 24.08 – 14.60 = 9.48
AVG ROE = 24.08 + 22.89 + 22.40 + 17.26 6+ 14.60/ 5 = 20.25%
Volatility = 9.48/20.25 = 0.47
10. Estimation of Intrinsic Value
Estimate expected EPS
Estimate PE Ratio
EPS Forecast
Particulars 2015-16 2016-17 Assumption
Net Turnover 40,884.98 44,973.48 Increased by 10%
Other Income 854.85 875.59 Increased by 5%
Material and Mfg
Expenses
(29,950.31) 32,945.34 Increased by 10%
Depreciations (1108.61) 1241.64 Increased by 12%
Selling, Distribution
and Admin
Expenses
(4022.31) 4424.54 Increased by 10%
Miscellaneous
Expenses
(2342.15) 2549.26 Increased by 5%

Page | 56
EBIT 4316.45 4710.29
Interest (155.29) 147.53 Decreased by 5%
EBT 4161.16 4562.76
Extra-ordinary items (68.74) 0
Tax/Credit (1062.42) 1168.66 Increased by 10%
EAT 3167.48 3394.10
No. of Equity Shares 62.1092 62.1092
EPS 51.00 54.65
Establish a PE Ratio
Expected PE = Avg Dividend P/O/Required ROE – Expected Growth Rate
=20.84/11.69 – 16.03 = 4.80
Required ROE = Risk Free Rate + (Beta of stock) * (Expected Mkt Risk Premium)
= 7.250+0(0.74) * (6) = 11.69%
Expected Growth Rate = Retention Ratio * Return on Equity
= 0.7916 * (20.25) = 16.03%
Historical PE = Price/Earning (obtained from the company annual report)
March 16: 22.61
March 15: 21.14
AVG (16 and 15): 21
Weighted PE Ratio
Expected PE = 4.80
Historical PE = 21.88
AVG = 13.34
EXPECTED INTRINSIC VALUE = Projected EPS * Weighted PE ratio
= 54.65 * 13.34 = 729.03

Page | 57
4.2. INTERPRETATION
a. Return on Equity (ROE)
This is calculated by dividing the net profit after tax by the equity shareholders’ funds.
From the above tables we can say that for Tata Motors, have been less than impressive due to
lower margin of profits and a high capitalization. There are miniscule profits to an increasing
range of equity shareholders. In the year 2015-16, the company made a huge stand-alone loss
of Rs. 4783.95 crores due to which the ROE showed a negative figure of 31.89%. During the
next year by using cost cutting and increasing revenue, the company has managed to turn
around the loss to a marginal amount of profit and the ROE also become positive. For
Mahindra & Mahindra, the profits have shown both increasing and decreasing trends among
the five years, but the shareholders’ funds have shown an increasing trend only. So, the ROE
has shown a decreasing trend, 24.08% being the rate in the first year and 14.6% being the
latest rate.
b. Earnings Per Share (EPS)
EPS is a portion of a company’s profit allocated to each outstanding share of common stock.
It is an indicator of the company profitability. It is calculated by dividing the net profit after
shares and after paying the preference dividends by the number of equity shares outstanding
during the period.
The position of Tata Motors on the other hand, in terms of EPS. Is poor. The EPS of Tata is
reducing year or year and in the year 2015 the EPS was a negative figure of -14.72 which a
reduction in the wealth of equity shareholders. In the latest year, the EPS has become positive
due to increase in profit compared to the previous year. The EPS of Mahindra & Mahindra
has shown a very consistent performance, the highlights being, the performance in the 2014-
15 with the highest EPS of RS. 61.02. The EPS ever since has been reduced, but still in the
range of 50’s.
c. Book Value Per Share (BVPS)
It is the per share value of a company based on its equity available to its common
shareholders. Higher the ratio indicates the good position of the company. It is calculated
dividing the total equity shareholders funds by the number of equity shares outstanding
during that period.
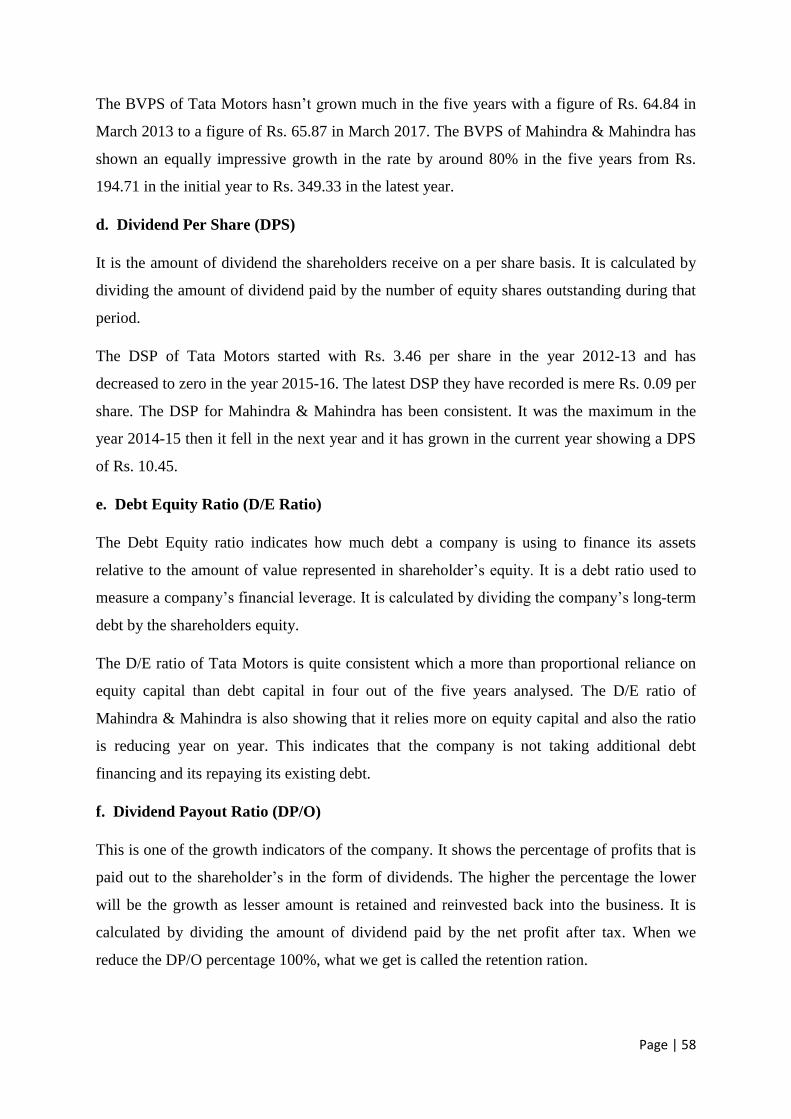
Page | 58
The BVPS of Tata Motors hasn’t grown much in the five years with a figure of Rs. 64.84 in
March 2013 to a figure of Rs. 65.87 in March 2017. The BVPS of Mahindra & Mahindra has
shown an equally impressive growth in the rate by around 80% in the five years from Rs.
194.71 in the initial year to Rs. 349.33 in the latest year.
d. Dividend Per Share (DPS)
It is the amount of dividend the shareholders receive on a per share basis. It is calculated by
dividing the amount of dividend paid by the number of equity shares outstanding during that
period.
The DSP of Tata Motors started with Rs. 3.46 per share in the year 2012-13 and has
decreased to zero in the year 2015-16. The latest DSP they have recorded is mere Rs. 0.09 per
share. The DSP for Mahindra & Mahindra has been consistent. It was the maximum in the
year 2014-15 then it fell in the next year and it has grown in the current year showing a DPS
of Rs. 10.45.
e. Debt Equity Ratio (D/E Ratio)
The Debt Equity ratio indicates how much debt a company is using to finance its assets
relative to the amount of value represented in shareholder’s equity. It is a debt ratio used to
measure a company’s financial leverage. It is calculated by dividing the company’s long-term
debt by the shareholders equity.
The D/E ratio of Tata Motors is quite consistent which a more than proportional reliance on
equity capital than debt capital in four out of the five years analysed. The D/E ratio of
Mahindra & Mahindra is also showing that it relies more on equity capital and also the ratio
is reducing year on year. This indicates that the company is not taking additional debt
financing and its repaying its existing debt.
f. Dividend Payout Ratio (DP/O)
This is one of the growth indicators of the company. It shows the percentage of profits that is
paid out to the shareholder’s in the form of dividends. The higher the percentage the lower
will be the growth as lesser amount is retained and reinvested back into the business. It is
calculated by dividing the amount of dividend paid by the net profit after tax. When we
reduce the DP/O percentage 100%, what we get is called the retention ration.

Page | 59
For Tata Motors, in the initial three years the payout ratio is too high the maximum being
187.59%, indicating that it has paid more dividends than the profit it has made in that year.
This indicates it has paid some portion of dividends from its reserves. Since March 2016 has
recorded losses the payout ratio was zero and in the following year the company has a DP/O
of 12.38%. The Dividend Payout of Mahindra & Mahindra have averaged around 21%
showing a consistent payout and retention.
g. Compound Annual Growth Rate (CAGR)
CAGR Tata Motors Mahindra & Mahindra
Sales -4.8% 5.12%
EPS -29% 1.69%
DPS -51.80% -0.0075%
CAGR is a tool used to determine the annual rate of growth of a variable whose value has
fluctuated widely from one period to the next. From the table above, we can interpret that
among the two companies the annual rate of growth is best in the case of Mahindra &
Mahindra and worst in the case of Tata Motor.
h. Sustainable Growth Rate (SGR)
The sustainable growth rate is the maximum rate of growth that a firm can sustain without
having to increase financial leverage or look for outside financing. It is measure of how large
and how quickly a firm can grow without borrowing money. It is calculated by multiplying
the company’s return on shareholder’s equity with the retention ratio of the company.
Avg Return on
Equity
Avg Retention
Ratio
Sustainable
Growth Rate
Mahindra 20.25% 0.7916 16.03%
Tata Motors -4.23% 0.0914 -0.39%
The SGR Tata Motors is showing a negative figure of -0.39%, indicating that it must take
outside funding for growth and expansion.
i. Volatility (V)

Page | 60
It is the degree of variation of a variable over time as measured by standard deviation of the
returns. The variable considered here is Return on Equity. So, it shows much a company’s
ROE fluctuates showing the riskiness of investing in the company. It is calculated by finding
out the range of the ROE values and dividing it by the average of ROE values. Higher the
range higher will be the volatility. Lower the volatility better for the investors.
Range of ROE Avg ROE Volatility
Mahindra 9.48 20.25 0.47
Tata Motors 38.22 4.23 9.04
From the above table, the lowest volatility of ROE is for Mahindra & Mahindra. The
volatility of ROE Tata Motors is very high indicating high degree of risk.
j. Intrinsic Value
the intrinsic value is the actual value of the company, stock or product determined through
fundamental analysis without reference to its trend in market value. It is also known as
fundamental value. This value may not be same as the current market value. It is perception
that it the market is higher than the intrinsic value, we say that the company stock is
overpriced and if the intrinsic value is higher than the company stock than the company is
undervalued. It is a figure arrived through assumptions about the company’s future
performance.
Projected EPS Weighted PE Ratio Expected Intrinsic
Value
Mahindra 133.08 13.98 1860.46
Tata Motors 7.08 8.5 60.18

Page | 61
CHAPTER – 5
FINDINGS, CONCLUSION AND SUGGESTIONS

Page | 62
5. FINDINGS, RECOMMENDATIONS AND CONCLUSIONS
5.1 FINDINGS
a. Finding of Economic Analysis
From the economic analysis of India, we can say that the GDP target of the country is at a
very good rate of 7.6%. The policies and initiatives of the government are in favour of
development. The increasing trend in GDP can be interpreted as a sign for economic growth
and industrial development. We also found out that the contribution of the automobile
industry to the GDP is 7.1%.
A certain amount of inflation is necessary to bolster growth f the economy. After the
economic analysis we found that the inflation stands at 5.88% CPI. We found that high rate
of inflation adversely affects the automobile industry.
With regards to foreign direct investment, we found that the automobile industry has 100%
FDI permission through the automatic route. And according to the Financial Times, India has
overtaken China and US as the top destination for FDI. FDI grew 46% to 61.58% billion after
the launch of make in India programme. The introduction of GST is set to cap the indirect tax
rate to 18% which otherwise would have been around 27% overall for the automobile
industry
b. Finding of Industry Analysis
From the analysis of the automobile industry we can say that with the entry of new players
the automobile industry has become very competitive with prices of various segments
becoming stagnant. The industry players have bargaining power over its suppliers but have
no bargaining power over its buyers. The leading auto maker Maruti Suzuki expects the
Indian passenger car market to reach 4 million units by 2020, up from 1.97 million units in
2014-15. This industry has the capacity to create 65 million additional jobs and contribute
over 12% to India ‘s GDP.
c. Finding of Company Analysis
After doing the company analysis of the two companies, we found out that not all companies
can perform consistently in this industry. Mahindra & Mahindra have performed the most
consistently between two companies and Tata Motors has performed most poorly among the
two. We calculated various ratios and all the numbers led to the conclusion above.

Page | 63
5.2 RECOMMENDATION
Intrinsic Value Analysis
Particulars Intrinsic Value Current Market
Price
Decision
Tata Motors
1255.11 503.55 Sell
Mahindra & Mahindra
1374.23 1170.45 Sell
Purely based on intrinsic value, selling the stock is recommended. The companies that have
their stock price closer to the intrinsic value are the ones that can achieve intrinsic value
much faster and produce faster returns; in case of Tata Motors. But intrinsic value alone
cannot be the deciding factor. There are many factors that can affect the gain part of the
stock.
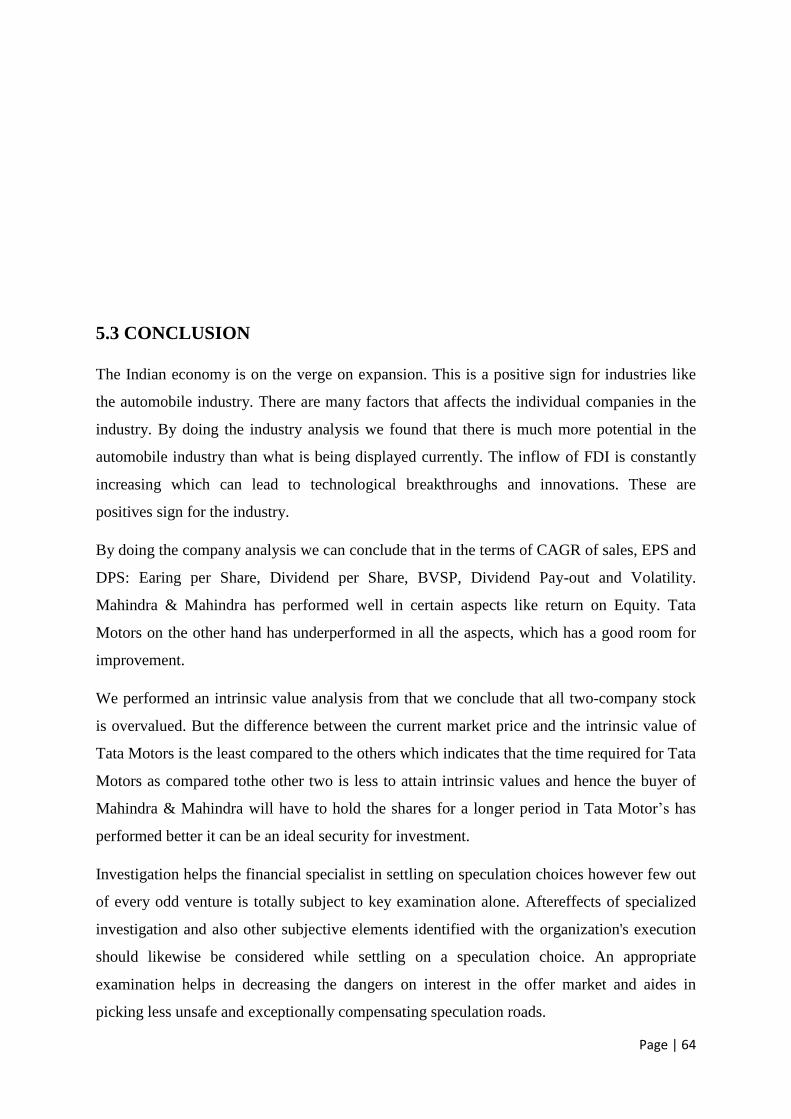
Page | 64
5.3 CONCLUSION
The Indian economy is on the verge on expansion. This is a positive sign for industries like
the automobile industry. There are many factors that affects the individual companies in the
industry. By doing the industry analysis we found that there is much more potential in the
automobile industry than what is being displayed currently. The inflow of FDI is constantly
increasing which can lead to technological breakthroughs and innovations. These are
positives sign for the industry.
By doing the company analysis we can conclude that in the terms of CAGR of sales, EPS and
DPS: Earing per Share, Dividend per Share, BVSP, Dividend Pay-out and Volatility.
Mahindra & Mahindra has performed well in certain aspects like return on Equity. Tata
Motors on the other hand has underperformed in all the aspects, which has a good room for
improvement.
We performed an intrinsic value analysis from that we conclude that all two-company stock
is overvalued. But the difference between the current market price and the intrinsic value of
Tata Motors is the least compared to the others which indicates that the time required for Tata
Motors as compared tothe other two is less to attain intrinsic values and hence the buyer of
Mahindra & Mahindra will have to hold the shares for a longer period in Tata Motor’s has
performed better it can be an ideal security for investment.
Investigation helps the financial specialist in settling on speculation choices however few out
of every odd venture is totally subject to key examination alone. Aftereffects of specialized
investigation and also other subjective elements identified with the organization's execution
should likewise be considered while settling on a speculation choice. An appropriate
examination helps in decreasing the dangers on interest in the offer market and aides in
picking less unsafe and exceptionally compensating speculation roads.

Page | 65
BIBLIOGRAPHY
• Kumar, N., Mohapatra, S., & Sandhu, G. (2013) Importance of Fundamental analysis
and strategic factors in the Indian stock market.
Management Review: An International Journal, 8(1), 38-75
• Bihari, S. C., & Charde, S. K (2014) intrinsic value of stocks: does market appreciate
it. A study on three private banks in India. Economics, Management and Financial
Markets
• Rajiv Kumar Bhatt (2011), - Recent Global Recession and Indian Economy: An
Analysis, International Journal of Trade, Economics and Finance.
• KR Subramanyam, Mohan Venkatachalam (2007), Earnings, cash flows, and ex post
intrinsic value of equity, The Accounting Review, Vol. 82, Issue 2, Pages 457-481
• Gaddam, J.C. (2016). Analysis of growth exports and geographic concentration of
automobile industry in India, Productivity, 57(1), 59-67
• Van Winkle, E.M. (2011). The incremental value of qualitative fundamental analysis
to quantitative fundamental analysis
• Bhat, Sharipad and Prof. T. V. Setharaman (1995), Technology Transfer and Export
Performance: A Case Study of Indian Automobile Industry. The Indian Economic
Journal, 43(2), October-December.
• Srinivasa A. (2010) “Relevance of Macro Economic factors for the Indian Stock
Market”. Decision, Vol. 37, No. 3 pp, 69-89.
• Swaranjeet (2009) – Automobile Industry in India, http://www.prlog.org/10241787-
automobile industry- inindia.pdfaccessed as on 29th January, 2011.
WEBSITES:
• www.moneycontrol.com
• Edelweissfin.com
• www.autoindustries.com
• www.investopedia.com
• www.economictimes.com

ANNEXURE
Edelweiss Broking Ltd CEO Rashesh Shah
-
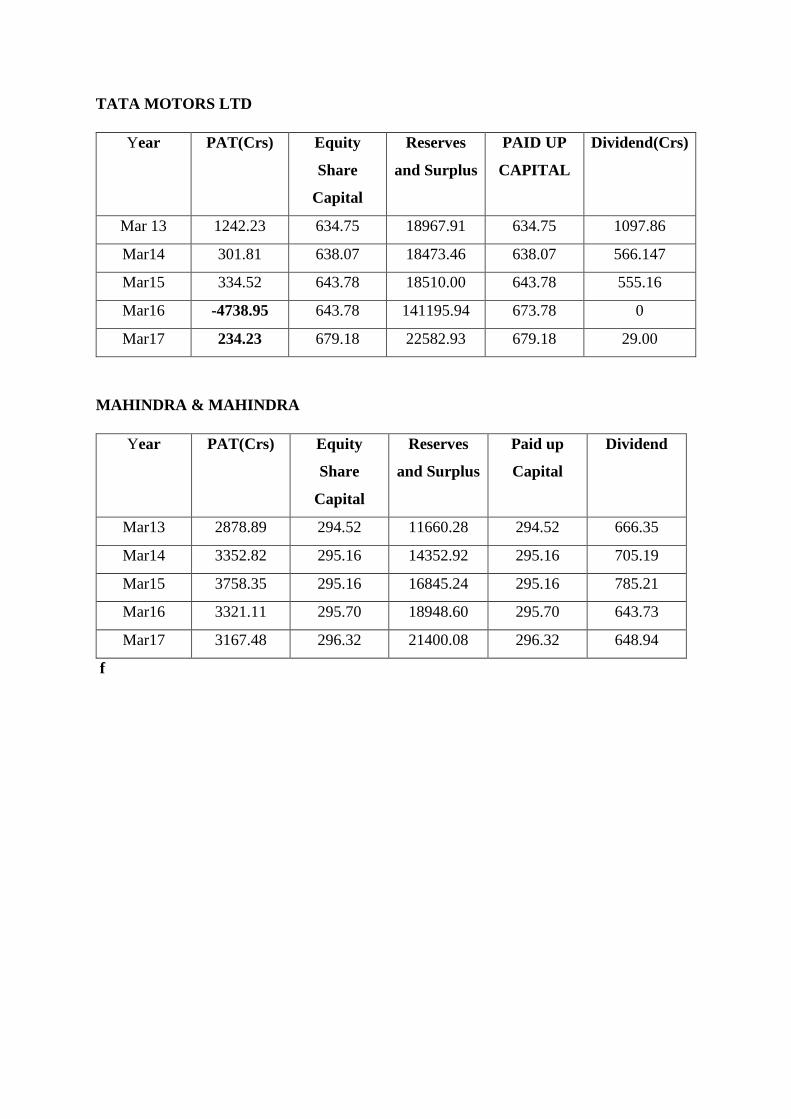
TATA MOTORS LTD
Year PAT(Crs)
Equity
Share
Capital
Reserves
and Surplus
PAID UP
CAPITAL
Dividend(Crs)
Mar 13 1242.23 634.75 18967.91 634.75 1097.86
Mar14 301.81 638.07 18473.46 638.07 566.147
Mar15 334.52 643.78 18510.00 643.78 555.16
Mar16 -4738.95 643.78 141195.94 673.78 0
Mar17 234.23 679.18 22582.93 679.18 29.00
MAHINDRA & MAHINDRA
Year PAT(Crs)
Equity
Share
Capital
Reserves
and Surplus
Paid up
Capital
Dividend
Mar13 2878.89 294.52 11660.28 294.52 666.35
Mar14 3352.82 295.16 14352.92 295.16 705.19
Mar15 3758.35 295.16 16845.24 295.16 785.21
Mar16 3321.11 295.70 18948.60 295.70 643.73
Mar17 3167.48 296.32 21400.08 296.32 648.94
f


~• .... : ACHARA YA INSTITUTE OF TECHNOLOGY DEPARTMENT OF MANAGEMENT STUDIES
IV Semester Internship 2016-18 Batch
ACHARYA I N STITUTES
Report No.: 1
Name of the Company Name of the student
USN Number
Title of the Project
Date
SI. Date/ No. Day
1 22st January
2 23th January
24th January
3
25th January
4
Sig~ of-~ ;fstudent
I WEEKL y PROGRESS REPORT I Week No.: 2
: EDELWEISS BROKING LTD : RAJASHEKAR .S
: 1AY16MBASS
: "A Study on fundamental Analysis of Automobile Sector''
: From: 22st January to: 25th
January
Details of the activities
Doing the research call to client.
Doing the research call to client .
Processing the demat accounts.
My mentor asked me to do work done on various topics for one week at
home. Different topics given are definition and examples of stock market,
equity market, commodities, ROI, ROE, PBT and different ratios with
calculations.
~ Signature of Internal Guide
Hecid of the Departm~nt / Du,Jai°tmen t of MG;.\
... ,, .... , -
. c. _,rya ! r·titute of Teel~· c , : .- : .. c . 1, I I n , ,., , "' ~ .. • .. .• ,.,v .... n:.1 . 1, '-~~.tngJ,..,r• ..

ACHARA YA INSTITUTE OF TECHNOLOGY DEPARTMENT OF MANAGEMENT STUDIES
IV Semester Internship 2016-18 Batch
ACHARYA INSTITUTES
Report No.: 1
Name of the Company
Name of the student
USN Number
Title of the Project
Date
SI. Date/ No. Day
1 29
th January
2 30th January
31t h January 3
4 1st February
5 2' t February
6 3st February
-~~ Signature oftll~ Student
IWEEKLY PROGRESS REPORT] Week No.: 3
: EDELWEISS BROKING LTD
RAJASHEKAR .S
: 1AY16MBASS
: "A Study on fundamental Analysis of Automobile Sector"
: From: __ it'.'..January __ to: 3th February
Details of the activities
Entering brokerage charges of clients.
Opening a demat Accounts.
My mentor has asked me to do ppt on topics like basic concepts of
inflation, deflation, causes, types, economic growth rate, GDP, GNP,
circular flow.
Entering brokerage charges of clients.
He asked me to do research on your topics.
Discussions about project report topic.
Jy . Signature of Internal Guide
...,,,,..,.-.. -. .. , .....r r- "~ ...
,/ • ,_, ,_._, •,# - ' -.:
/ \:,, ~ .-------1 •'· . ' 1·' J... \ ,, •.
f \ 1~ ·. ~· , 1
t I
t - t"'-:--
Signatur of External , _~\de
---- ---

~• ... ACHARYA INSTITUTES
Report No.: 1
ACHARA YA INSTITUTE OF TECHNOLOGY DEPARTMENT OF MANAGEMENT STUDIES
IV Semester Internship 2016-18 Batch
r WEEKL y PROGRESS REPORT 1
Week No: 4
Name of the Company
Name of the student
: EDELWEISS BROKING LTD
RAJASHEKAR .S
USN Number : 1AY16MBASS
Title of the Project : "A Study on fundamental Analysis of Automobile Sector"
Date : From: 12th February to: 17th February
SI. Date I Details of the activities
No. Day
1 12t h February Opening a demat Accounts.
2 14th February Opening a demat Accounts.
15th February Opening a demat Accounts. 3
4 16th February Reporting in college
Presentation about general topics like RBI policy, budget et c.
5 17th February
\-2~~. i Signature oHhe ·student Signatur! ~-~,!,:i..,t.~[ nal Guide n,.. ,... ...
Head o{ th~ !. · -i · ,.\
D Pat~ ,- ·~•\ ; · ·1 ' ·,-'·111 . e _G .•. ·., ••• , · • ' ·:,· . '.;JY ... -~rya 1•·; .,_-- ,~ -:; . ., , : ·- , . . _, J fEH'
. ~ ... . , , r. ··\1 C 1 ' $ QVA ; ~ --i -1 ; •, • ,-1 . , , ....

~• ... ACHARYA INSTI'fUTES
A CHARA YA INSTITUTE OF TECHNOLOGY DEPARTMENT OF MANAGEMENT STUDIES
IV Semester Internship 2016-18 Batch
lwEEKLY PROGREss REPORT/ Report No.: 1
Name of the Company
Name of the student
USN Number
Week No.: S : EDELWEISS BROKING LTD
: RAJASHEKAR .S
: 1AY16MBASS
Title of the Project
Date
: "A Study on fundamental Analysis of Automobile Sector"
: From: ~February_ to: _24th February
SI. Date I Details of the activities
No. Day
Entering brokerage charges of clients.
1 19thFebruary
Opening a demat Accounts.
2 20th February
21thFebruary My mentor has asked me to do ppt on topics like basic concepts of 3 inflation, deflation, causes, types, economic growth rate, GDP, GNP,
circular flow.
4 2ih February Entering brokerage charges of clients.
5 23th February Reporting to college.
6 241
h February Presentation on export import ratio, mutual funds etc .
.... ~......,,. ..... . 1•• '"~• , 1 r
,t ~ ----.. • • ,t /
~ .s>.. 17 5:2 Signature-;,ffh~ Student Signature of Internal Guide
'·L:;.;d uf the Dep~utm:,nt D 1p~rtrrH-i!i t or MBA
!',c r'/::1 I rntl tute ot ~·ochnolog/ .:,n!dE:v~r,ahlll. Bangalore-560 1 C·,
' '

ACHARAYA INSTITUTE OF TECHNOLOGY DEPARTMENT OF MANAGEMENT STUDIES
IV Semester Internship 2016-18 Batch
ACHARYA INSTITUTES
Report No.: 1 Name of the Company
Name of the student
USN Number
Title of the Project
Date
SI. Date I No. Day
1 th b 19 Fe ruary
2 20th February
21 thFebruary 3
4 22th February
s 23th February
6 241 h February
~ \ . Q.Q~
Signature offfie Student
\WEEKLY PROGRESS REPORT I Week No.: 6
: EDELWEISS BROKING LTD
: RAJASHEKAR .S
: 1AY16MBA55
: "A Study on fundamental Analysis of Automobile Sector''
: From: ~February_ to: _24 th February
Details of the activities
Entering brokerage charges of clients.
Opening a demat Accounts.
My mentor has asked me to do ppt on topics like basic concepts of
inflation, deflation, causes, types, economic growth rate, GDP, GNP,
circular flow.
Entering brokerage charges of clients.
Reporting to college.
Presentation on export import ratio, mutual funds etc.
Signature of Internal Guide
"') .. ..

ACHARAYA INSTITUTE OF TECHNOLOGY DEPARTMENT OF MANAGEMENT STUDIES
IV Semester Internship 2016-18 Batch
\WEEKI,_Y ~ROGRESS REPORT I ACHARYA INSTIT UTES
Report No.: 1
Name of the Company
Name of the student
USN Number
Title of the Project
Date
SI. Date/ No. Day
1 26th February
2 2ih February
3 28th February
4 ih February
s 3th February
Sig~ Student
Week No: 7
: EDELWEISS BROKING LTD
: RAJASHEKAR .S
: 1AY16MBASS
: "A Study on fundamental Analysis of Automobile Sector''
: From: 26th February to : 3th March
Details of the activities
Opening a demat Accounts and fil ling form .
Opening a demat Accounts and filling form .
Opening a ?emat Accounts and filling form.
Reporting in college
Presentat ion about general topics like emerging market and bond market.
.. r- ---· . -
~ I/ ~
, . '
Signature of Internal Guide Signatur~ rnal guide

ACHARYA JN STITUTES
ACHARA YA INSTITUTE OF TECHNOLOGY DEPARTMENT OF MANAGEMENT STUDIES
IV Semester Internship 2016-18 Batch
/WEEKLY PROGRESS REPORT! Report No.: 1
Week No. : 8
Name of the Company EDELWEISS BROKING LTD
Name of the student : RAJASHEKAR .S
USN Number : 1AY16MBA55
Title of the Project : "A Study on fundamental Analysis of Automobile Sector"
Date : From : ~March to: _10th march
SI. Date/ Details of the activities
No. Day · · ade on 1 have to fill demat account form and detailed discussion ,s m
5 thMarch Edelweiss SIP (systematic Investment plan). 1
1 have asked to fill demat account form and detailed discussion is made
2 6 th March on mutual funds and debentures.
3 7 th March 1 have asked to do on topic of RBOPS, commercial papers, REPO, risk adjusted returns, economic conditions, aggregate demand.
4 g th March Entering b~okerage charges of clients.
5 9 th March Reporting to college.
6 10th March Presentation on RBOPS, commercial papers, REPO, risk adjusted returns,
economic conditions, aggregate demand.
Student Jv
Signature of Internal Guide
l'f:' . " r .'1, , ....
k~ / /. Signature of°'Externa~guide'
.. ,t :,
;·\.'
. ... ,-.,ioyV . , .,Jc., ,galore-560 107

I
ACHARYA INSTITUTES
Report No.: 1
ACHARA YA INSTITUTE OF TECHNOLOGY DEPARTMENT OF MANAGEMENT STUDIES
IV Semester Internship 2016-18 Batch
/WEEKLY PROGRESS REPORT/
Name of the Company Week No.: 9
: EDELWEISS BROKING LTD
Name of the student
USN Number
: RAJASHEKAR .S
: 1AY16MBA55
Title of the Project : "A Study on fundamental Analysis of Automobile Sector''
Date : From: ~March_ to: _17 th March
SI. Date/ Details of the activities No. Day
I have asked to do topics of FRS, federal discount rate, FOMC act of 1913.
12thMarch 1
Reporting to college.
2 13th March
I have asked to create commodity account and fill commodity account
3 14th March form .
4 15th March Watching the markets and its movements and try to analyse it.
5 16th March watching the markets and its movements and try to analyse it
6 17th March Presentation on put option and call option strategy tool in equity derivatives, export import ratio, mutual funds etc.
~ n n \'> . Signat~ e Student t<
Signature of Internal Guide
f-' . fea~ot e Depari'mo t
- Depar. en t of MBA n Acharyn /· . 9 of Te
Soldevan ·- Ji 8 chnolo~. , angalore-:;60 .-
..., ., I

ACHARYA IN ST ITUTES
Report No.: 1
A CHARA YA INSTITUTE OF TECHNOLOGY DEPARTMENT OF MANAGEMENT STUDIES
IV Semester Internship 2016-18 Batch
I WEEKL y PROGRESS REPORT I Week No. : 10
Name of the Company EDELWEISS BROKING LTD
: RAJASHEKAR .S Name of the student
USN Number : 1AY16MBASS
Title of the Project : "A Study on fundamental Analysis of Automobile Sector"
Date : From: _1.2.'.'.'..March_ to: _24 th March
SI. Date/ Details of the activities
No. Day Analyse an
d invest in Automobile Stock and also stock practical exposure
19t h March to strategies in Fundamental analysis.
1
Analyse and invest in Automobile Stock and also stock practical exposure
20th March to strategies in Fundamental analysis. 2
Analyse and invest in Automobile Stock and also stock practical exposure
3 21t h March to strategies in Fundamental analysis.
Analyse and invest in Automobile Stock and also stock practical exposure
4 22 th March to strategies in Fundamental analysis.
Analyse and invest in Automobile Stock and also stock practical exposure
s 23t h
March to strategies in Fundamental analysis.
Analyse and invest in Automobile Stock and also stock practical exposure 6 24 th March to strategies in Fundamental analysis
.
e Student Signatu,t ernal Guide
-~y , 1.07
J


![Untitled-1 [] · 2018. 7. 21. · LH. No. : LILAVATI HOSPITAL AND RESEARCH CENTRE 10th April, 2018 LH00398057 To Whomsoever It May Concern: This is to certify that, Ms. Vaibhavi Sanjay](https://static.fdocuments.net/doc/165x107/5fe2bb5ad9f5085cb36d4a5f/untitled-1-2018-7-21-lh-no-lilavati-hospital-and-research-centre-10th.jpg)


