To Understand Consumer s Preference and Consumer s Buying ... A paper-based questionnaire was...
15
The International Journal of Multi-Disciplinary Research ISSN: 3471-7102, ISBN: 978-9982-70-318-5 1 Paper-ID: CFP/826/2018 www.ijmdr.net To Understand Consumer’s Preference and Consumer’s Buying Behavior of Soft Drinks in Kitwe. (Conference ID: CFP/826/2018) Eddie Katota Chiyesu School of Business Information & Communications University Lusaka, Zambia [email protected] Mr. Kelvin Chibomba School of Business Information & Communication University Lusaka, Zambia [email protected] Abstract— The soft drink business is one of the manufacturing industries with the widest and deepest base compared to others globally and locally. A number of brands are available in the market; hence it has become highly competitive environment companies most now protect the interest of the consumers to enhance profit and customer loyalty. To this regard, a study was carried out to examine the factors influencing consumer’s preference and consumer buying behavior with reference to perceived; product, price, place, promotion usefulness and the social factors. A paper-based questionnaire was designed and distributed to 100 customers in Kitwe District, Copperbelt province of Zambia as a primary data collection method. All 100 questionnaires distributed were successfully returned and used for analysis yielding a 100% response rate. The results indicate that price, quality, promotion and a healthier soft drink have a significant influence on consumer preference and buying behavior. Keywords: consumer preference, buying behavior, soft drinks, Copperbelt province. 1. Introduction Consumers everyday often face situations that require choosing among several brands and different types of soft drinks in the marketplace hence globalization has widened the choice set of consumers in under developed country like Zambia when quality, pricing, packaging and healthy soft drinks were not a factor. Coca-Cola and Californian beverages had the monopoly in the market. When Coca-Cola company under Zambian Breweries would adjust the price upward and the market fundamentals will still remain the same because no other product was a substitution that would provide the same utility until Pepsi company under Varum joined the market it has been the game charger. The consumers have a choice over packaging whether to buy a canned, PET or RGB packaging. In the rapid growth of the soft drinks industry with new entrants like trade kings and imported non-carbonated soft drinks like Fruit tree, Ceres, Ambia and joy and consumer preferences and demand the local industry is encountering challenges and opportunities. The changing consumer demands and preferences require new ways of maintaining current customers and attracting new ones. According to Ries and Trout (1986), Marketing battles are fought inside the mind of the prospect. The mind is
Transcript of To Understand Consumer s Preference and Consumer s Buying ... A paper-based questionnaire was...

The International Journal of Multi-Disciplinary Research ISSN: 3471-7102, ISBN: 978-9982-70-318-5
1
Paper-ID: CFP/826/2018 www.ijmdr.net
To Understand Consumer’s Preference and Consumer’s
Buying Behavior of Soft Drinks in Kitwe.
(Conference ID: CFP/826/2018)
Eddie Katota Chiyesu
School of Business
Information & Communications University
Lusaka, Zambia
Mr. Kelvin Chibomba
School of Business
Information & Communication University
Lusaka, Zambia
Abstract— The soft drink business is one of the
manufacturing industries with the widest and
deepest base compared to others globally and
locally. A number of brands are available in the
market; hence it has become highly competitive
environment companies most now protect the
interest of the consumers to enhance profit and
customer loyalty. To this regard, a study was
carried out to examine the factors influencing
consumer’s preference and consumer buying
behavior with reference to perceived; product,
price, place, promotion usefulness and the social
factors.
A paper-based questionnaire was designed and
distributed to 100 customers in Kitwe District,
Copperbelt province of Zambia as a primary data
collection method. All 100 questionnaires
distributed were successfully returned and used for
analysis yielding a 100% response rate.
The results indicate that price, quality, promotion
and a healthier soft drink have a significant
influence on consumer preference and buying
behavior.
Keywords: consumer preference, buying behavior,
soft drinks, Copperbelt province.
1. Introduction
Consumers everyday often face situations that
require choosing among several brands and
different types of soft drinks in the marketplace
hence globalization has widened the choice set of
consumers in under developed country like
Zambia when quality, pricing, packaging and
healthy soft drinks were not a factor. Coca-Cola
and Californian beverages had the monopoly in the
market. When Coca-Cola company under Zambian
Breweries would adjust the price upward and the
market fundamentals will still remain the same
because no other product was a substitution that
would provide the same utility until Pepsi
company under Varum joined the market it has
been the game charger. The consumers have a
choice over packaging whether to buy a canned,
PET or RGB packaging. In the rapid growth of the
soft drinks industry with new entrants like trade
kings and imported non-carbonated soft drinks like
Fruit tree, Ceres, Ambia and joy and consumer
preferences and demand the local industry is
encountering challenges and opportunities. The
changing consumer demands and preferences
require new ways of maintaining current
customers and attracting new ones. According to
Ries and Trout (1986), Marketing battles are
fought inside the mind of the prospect. The mind is

The International Journal of Multi-Disciplinary Research ISSN: 3471-7102, ISBN: 978-9982-70-318-5
2
Paper-ID: CFP/826/2018 www.ijmdr.net
the battleground. A terrain that is tricky and
difficult to understand.
Hence, the beverage companies must focus
towards customers and offer high quality products,
efficiently advertise, ensure healthy and keep
prices low for the affordability for all. While
exploiting new markets by launching new
products. Recent developments in soft drink
consumption and challenges in marketing have
heightened the need for searching the consumers'
preference and consumer buying behavior. It is
hard to ignore the existence of soft drink in today's
markets and since the inception of soft drink in the
1830’s; its consumption has steadily increased
with technological advances in production and
increased product availability.
Hence, the study sought to examine the
consumers’ preference and buying behavior and to
identify key factors influence to attract new and
retain existing customers towards soft drinks in
Kitwe.
1.2 Statement of the Problem
Statement of the Problem The study is conducted
to investigate the relationship of consumer
preference and consumer buying behavior of soft
drinks. The soft drinks products on the local
market target everyone from children, adults,
middle age and the older. However, a need has
arisen from the campaigns over heavily sugared
and carbonated drinks against giving to children
below five years and the elderly a need for a non-
carbonated and nutritional drink for the children
and those advanced in age. The soft drink market
is flooded with foreign as well as indigenous
products. In this situation, an analysis on the
factors that influence consumer preference and
buying behavior for soft drinks are essential for
market growth.
elderly a need for a non-carbonated and nutritional
drink for the children and those advanced in age
.The soft drink market is flooded with foreign as
well as indigenous products. In this situation, an
analysis on the factors that influence consumer
preference and buying behavior for soft drinks are
essential for market growth.
1.3 Significance of the Study
The benefits that accrue from this study are
numerous it will Customers to understand their
soft drinks types and what to take according to the
lifestyle. It will give an understanding
manufacturer of soft drinks in understanding
different consumer tastes and preferences so as to
meet diverse consumer needs and the marketing
strategy to employ. It will be a great benefit to
other researchers to determine consumer
preferences and buying behavior.
1.4 Research Objectives
The overall or general objective of this study was
to examine the factors influencing the consumer
preference and consumer buying behavior. The
specific objectives of this study were to:
i. To determine the effect of demographic factors
on consumer purchasing behavior
ii. To examine the effect social factors on
consumer purchasing behavior
iii. To determine consumer’s awareness of
imported soft drinks
1.5 Research Questions
The research was planned and conducted in the
manner that the following questions were to be
answered:
Does price affect the buying behavior of soft
drinks?
Does advertisement have an influence on
consumer purchasing behavior
Do non-carbonated have soft drinks have an
impact on the market over carbonated drinks?
1.6 Limitation of Study
The study was limited to Kitwe District due
limited of funds and time. Moreover, the
researcher found the District to be the most
convenient in terms of transportation and

The International Journal of Multi-Disciplinary Research ISSN: 3471-7102, ISBN: 978-9982-70-318-5
3
Paper-ID: CFP/826/2018 www.ijmdr.net
accommodation. The study population consisted of
100 from riverside suburb which the Copperbelt
University is part of the community.
1.7 Conceptual Framework
A conceptual framework is a set of broad ideas
and principles taken from relevant fields of inquiry
and used to structure a subsequent presentation. It
is a tool used to make conceptual distinctions,
organize ideas and develop awareness and
understanding of the situation under scrutiny. The
framework shows that perceived price, perceived
promotion, perceived quality and perceived
promotion influence the consumer buying
behavior intention to buy soft drinks products
which in turn determines the actual soft drink
brand consumption.
1.8 Operational Definitions
Soft drink: is also called soda, pop, coke, soda
pop, tonic, mineral or carbonated beverage which
is a beverage that typically contains water, a
sweetener and a flavoring agent. The sweetener
may be sugar, high-fructose corn syrup or a sugar
substitute. A soft drink may also contain caffeine,
fruit juice or both (Van Wymelbeke, Beridot-
Therond, de La Gueronniere & Fantino, 2014).
Perceived quality is defined as the consumers’
judgment about an entity’s (service’s) overall
excellence or superiority (Zeithaml, 1988 and
Rowley, 1998). Research also indicates that
consumers value global brands especially for their
assumed high quality and prestigious image (e.g.,
Nguyen, Barrett and Miller 2005; Steenkamp,
Batra and Alden 2003). An internationally well-
established brand name can act as a "halo"
constructs that effects quality beliefs (Han 1989).
If a brand is perceived as globally available,
consumers are likely to attribute a superior quality
to the brand, since such quality is thought of as a
prerequisite for international acceptance.
Price is a factor affecting consumer behavior.
According to Evans et al., (1996), price can be
defined as the thing that a consumer has to give up
to buy and obtain a certain product. In addition,
Evans et al., (1996) states that, - when a consumer
makes a purchase, the value of the purchased item
must be greater than its costs. In other words, the
perceived benefits of a product must exceed the
expenses of acquiring it (Thagunna & Khanal,
2013).
Culture is “the set of basic values, perceptions,
wants and behaviors learned by a member of
society from family and other important
institutions” (Ibid, p. 256), and is the primary
reason behind a person’s wants and behavior.
Although different societal groups have their own
culture that affects consumers‟ buying behavior,
the extent to which it influences the behavior
might vary from country to country. Each cultural
group can be divided into groups consisting of
people with common life experiences and
situations, also known as subcultures (Kotler et al.,
2005), such as nationality, racial groups, religion,
Consumer’
s
preference
Consume
rs buying
behavior
Perceived
Price
Perceived
product
Perceived
Quality
Perceived
Place
Percei
ved
Prom
otion
Personal
Factors
Social
factor
Psychol
ogical
Factors
Cul
tur
e

The International Journal of Multi-Disciplinary Research ISSN: 3471-7102, ISBN: 978-9982-70-318-5
4
Paper-ID: CFP/826/2018 www.ijmdr.net
and geographical areas. The third cultural factor is
social class, which is constituted upon among
other variables: occupation, income, education,
and wealth
Advertising: The promotion of goods, services or
ideas through paid communications (Harris P2009,
9)
Brand: A name, symbol, term, design or a
combination of them intended to identify the
goods and services of a company or group of
companies and to differentiate them from
competitors (Kotler et al., 2009, 866).
Culture: A blend of the values, norms, material
and spiritual traditions of ethnically diverse people
(eBizguides Zambia 2006, 259)
Marketing: The process of planning and
executing the conception, promotion, pricing, and
distribution ideas, goods and services to create
exchanges that satisfy individual and
organizational objectives (Kotler et al., 2009,866).
3.0 Research Methodology
The study was undertaken to evaluate the
consumers preference and consumer buying
behavior of soft drinks due to trade liberalization
we have both locally manufactured soft drinks,
COO soft drinks but locally manufactured soft
drinks and those which are just imported and
putting these factors together all thesis have had a
profound impact on the competitive strategies of
the industry players. In this chapter, the researcher
deals with the research design, population, Sample
size, sampling tool, sampling procedure, data
collection and data Analysis.
3.1 Research Design
This was an intensive study case study of
understanding consumer preference and buying
behavior of soft drinks which are readily to be
taken that re packaged in RGB and PET which
constitutes 95% of the packaging. The study
employed a case study approach . According to
Robson (2002) a case study is an approach for
carrying out a research which includes an
empirical examination of a specific current
phenomenon contained by its framework
genuinely using several sources to support the
provided evidence. In highlighting the importance
of context in a case study, Morris and Wood
(1991) points that within a case study, the
boundaries between the phenomenon being studied
, the importance and the context within which it is
being studied are not clearly evident. The strategy
was taken to gain much understanding of the
context of the research and the processes being
enacted (Morris and Wood, 1991).Since the
problem was structured one where the information
required was unknown and the research question
stated in chapter 1.Hence the descriptive research
was used as the overall strategy to get information
and the case study strategy was also used as well
for its exploratory research nature and therefore
adopted a case study strategy with multiple cases.
3.2 Sample Design
The sampling design used in the study was
probability sampling. A random sample of
residential areas was taken.
3.3 Sample Population
The population target for the study comprised all
the consumers in the Kitwe District, Copperbelt
province of Zambia. The researcher took Kitwe
district as a geographical area to draw the sample
size and study due two (2) factors. Firstly, Kitwe is
one of the industrial cities of the Copperbelt
Province with a high-density population and
inhabitants are people from different parts of the
country with different consumer preferences and
consumer buying behavior and their main
occupations are mining, trading, schooling from
the second largest government university in the
country, working for government and private
companies and other business activities. The
second reason is that Kitwe district based on sales
and volume historically and currently constitutes
the major market for soft drinks being the second

The International Journal of Multi-Disciplinary Research ISSN: 3471-7102, ISBN: 978-9982-70-318-5
5
Paper-ID: CFP/826/2018 www.ijmdr.net
populated city from Lusaka. The consumer
preference determines the sales performance in
terms of profit and survival of the company. The
sample was drawn from the following residential;
Chimwemwe, Parklands, Kamfisa, Town Centre,
Nkana West and East, Ndeke and Wusakile. The
sample was also drawn from two trading areas
namely; Kitwe central business area and Kitwe
second class.
3.4 Sample Size
Sample size does affect the precision of the survey
results. Ideally, the sample is supposed to
represent some pre-specified level of accuracy to
show the character of the population to accomplish
the research objectives. In reality, the research
modified to reflect time and resources constraints.
According to Ghauri et al, (1995) a typical sample
size for studies of human populations at regional
level is between 500 -1000.No formulae was used
to arrive to the sample size of 100.Using judgment
100 consumers was considered as a representative
sample with constraint of time and economic
challenges in mind.
3.5 Data Collection
The data collection method used (questionnaires,
interviews and observation. The research aimed at
achieving the stated objectives as stated in Chapter
one (1). The questionnaire was tested prior to
administering. The questionnaires were then
administered by personal interviews. The primary
data collected included age, incomes, perceived
prices, quality, promotion, culture, opinion and
knowledge related to consumer preference and
buying behavior. According to Churchill (1979),
qualitative and quantitative data are mutually
complementary in a study. Some of the main types
of qualitative methods are focus group, one-on-one
interviews and mystery shopping. (Edmunds 1996,
11-12)
3.6 Data Analysis Method
According to Churchill (1979), both qualitative
and quantitative data are usually required in
complete evaluation, since they complementary to
each other rather mutually exclusive. The collected
data was coded and entered into the Statistical
Package for Social Sciences (SPSS) program
according to each variable of the study for
analysis. This study used descriptive statistics.
According to Polonsky (2015), descriptive analysis
involves a process of transforming a mass of raw
data into tables, charts, with frequency distribution
and percentages, which are a vital part of making
sense of the data. In this study, the descriptive
statistics such as percentages and frequency
distribution were used to analyze the demographic
profile of the participants. Qualitative and
quantitative methods of analysis were therefore
used in the analysis of results. The responses of
consumer were used to draw conclusions on the
possible causes of consumer’s preferences and
consumer buying behavior of soft drinks.
3.7 Population and Sample Characteristics
The population for the study was taken from Kitwe
District, Copperbelt province of Zambia. The
researcher took Kitwe district as a geographical
area to draw the sample size and soft drink
consumption as a case study. Kitwe is one of the
industrial cities of the Copperbelt Province with a
high-density population. The inhabitants are
people from different parts of the country and their
main occupations of are mining, trading, schooling
from the second largest government university in
the country, working for government and private
companies and other business activities. The
sample size of one hundred (100) customers was
employed to represent the whole population. A
simple random sampling procedure was employed
in selecting the respondents. This sampling
method was chosen because it enables every
member of the population the equal chance of
being selected.

The International Journal of Multi-Disciplinary Research ISSN: 3471-7102, ISBN: 978-9982-70-318-5
6
Paper-ID: CFP/826/2018 www.ijmdr.net
3.8 Data Analysis Tools
Data analysis was conducted on the collected
primary data by using Statistical techniques and
data is presented with the help of tables.
Percentage Analysis:
By percentage method we mean the number of
respondents divided by total sample size and then
multiplied by 100. Percentage is used in making
comparison between two (or) more series of data.
The percentage analysis is calculated by using the
following formula
No. of respondents
Percentage = (Number of respondents/Total
Sample) x100
4.0 RESULTS OF FINDINGS
4.1 Introduction
In this chapter, detailed information acquired from
the questionnaire survey is presented according to
the research objectives. The purpose of this study
was to understand the consumer's preference and
consumer behavior towards carbonate and non-
carbonated soft drinks. This chapter discusses the
interpretation of the graphs, pie charts and tables
4.1 General Information of the Participants
To draw demographic profile of the respondents,
the study used frequencies to determine the
number of times a respondent answered a
particular question. Questions on gender, age and
education were asked.
4.1.1 Gender of Respondents
From Table 1 below, out of the 100 respondents
surveyed, 68 or 68% were female, compared to 32
or 32% for male. The findings imply that more
females took part in the study than the male
Gender No. of Respondent Percentage
Male 32 32
Female 68 68
Total 100 100
Source: Field Data, 2018
Table 1: Gender of Respondents
4.1.2 Age of Respondents
From Table 2 below majority of the respondents
(65%) were in the age bracket of 16-30 years, 27%
were in the age bracket of 31-45 years, 6% were in
the bracket of 46-59 years and 2% were 60 years
and above
AGE No. of.
Respondent
Percentage
16-25 42 42
26-35 27 27
36-45 18 18
Above 46 13 13
Total 100 100
Source: Field Data, 2018
Table 2: Age of Respondents
4.1.3 Occupation of Respondents
From below Table 3, it is observed that 40%
respondents Work, 38% were students and 22%
respondents do other kinds works
Occupation No. of
Respondent
Percentage
Student 38 38
Working 40 40
Others 22 22
Total 100 100
Source: Field Data, 2018
Table 3: Occupation of Respondents
4.1.4 Incomes of Respondents
From the Table 4 The respondent were answering
to the question of how much is your income and
below the survey the majority (47%) of the
respondents earn below K1000 in this bracket it
can mean you earn an income or not below 1000.
The second majority of earners are in the bracket
between k1001-2500 at 28%, followed by 16% of
the respondents who earn above K 3501 and the
least group of respondents are those who earn
between K2601 – 3500 at 9%.

The International Journal of Multi-Disciplinary Research ISSN: 3471-7102, ISBN: 978-9982-70-318-5
7
Paper-ID: CFP/826/2018 www.ijmdr.net
Income No. of
respondent
Percentage
Under K1000 47 38
K1001 – 2500 28 48
K2501- K3500 9 7
Above k 3501 16 7
Source: - Field data 2018
Table 4: Incomes by Age
4.1.4.1 Incomes of Respondents by age
From the table5 below 100 sample respondents,
(37%) of the majority are in the age bracket of 16-
25 have income below 1000, and (17%) of the
ages between 26-35 of age have incomes between
K2501-3500.
INCOM
ES
16-25
26-35 36-45 Above
46
No. of
respond
ent
No. of
respond
ent
No. of
respond
ent
No. of
respond
ent
Under
1000
37 5 3 2
K1001-
2500
2 17 7 2
K2501 -
3500
1 1 5 2
Above
3501
2 4 3 8
Total 42 27 18 13
Source: - Field data 2018
Table 4.1: Incomes of Respondents by age
4.2 Consumers’ Preference towards Soft Drinks
From table 4.7 below 54 per cent of respondents
surveyed preferred the soft drinks moderately in
the study area and 38 per cent of respondents
“highly like” the soft. Only 5 per cent of the
respondents viewed soft drinks unfavorably
Particula
rs
Highly
Prefer
red
Modera
tely
Preferre
d
Low
Prefere
nce
Not at
all
Prefer
red
Tot
al
Respond
ents
38 54 4 4 100
Percenta
ge (%)
38 54 4 4 100
Source: - Field data 2018
Table 5: Consumers’ Preference towards Soft
Drinks
4.3 What type of soft drinks do you take?
From The figure 1 below as it can be noticed, the
respondents selected in great number the
carbonated
Drinks option at 53%, followed by both at 27%
and Non-Fizzy at 15%.
Source: - Field data 2018
Figure 1: Type of soft drinks Consumers take
4.4 What kind of containment (packaging) do
you prefer
From the figure 2 below the consumers prefer
PET (plastic) bottle for easy handling and drinking
while the aseptic packing mostly used for packing
fruit beverages are not liked by the consumers.
Source: - Field data 2018
Figure 2: Consumers’ Preference towards
packaging material
53
2027
0
10
20
30
40
50
60
Carbonated Non-Fuss Both
What type of soft drink do you take
73
915
3
0
10
20
30
40
50
60
70
80
PET(Plastic) RGB(glass) Canned Aseptic
In what containment (packaging) is your preferred
choice
The International Journal of Multi-Disciplinary Research ISSN: 3471-7102, ISBN: 978-9982-70-318-5
8
Paper-ID: CFP/826/2018 www.ijmdr.net
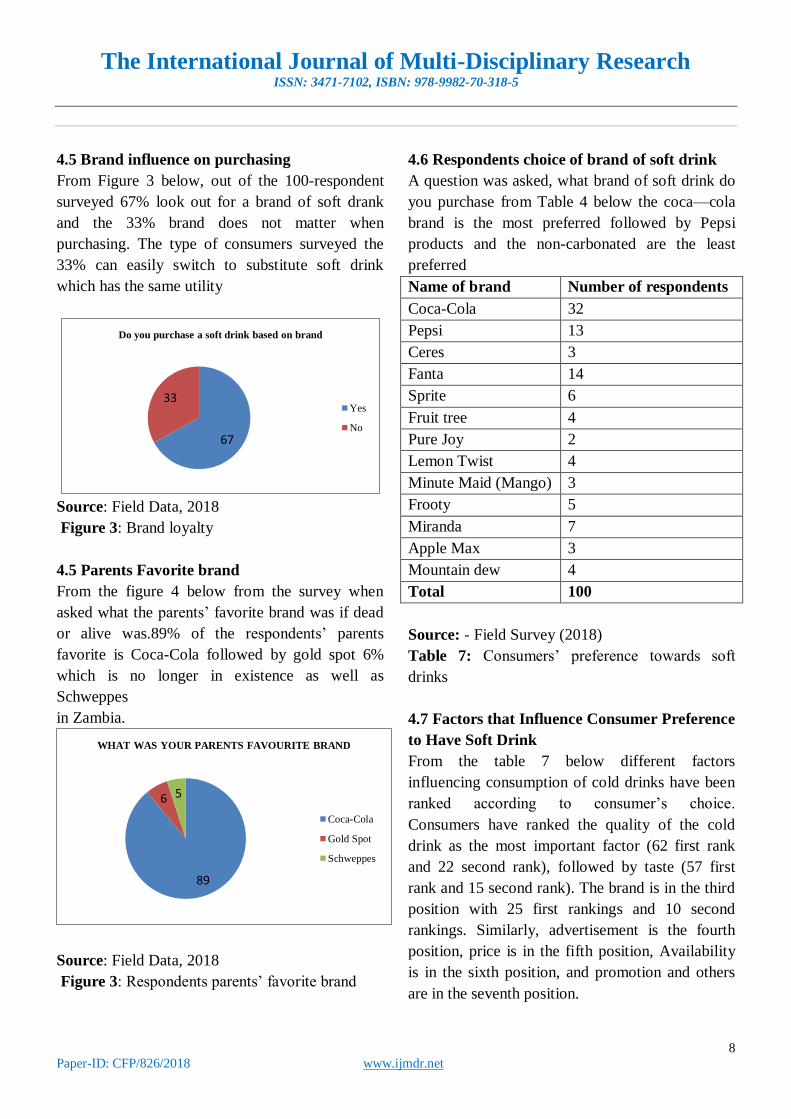
4.5 Brand influence on purchasing
From Figure 3 below, out of the 100-respondent
surveyed 67% look out for a brand of soft drank
and the 33% brand does not matter when
purchasing. The type of consumers surveyed the
33% can easily switch to substitute soft drink
which has the same utility
Source: Field Data, 2018
Figure 3: Brand loyalty
4.5 Parents Favorite brand
From the figure 4 below from the survey when
asked what the parents’ favorite brand was if dead
or alive was.89% of the respondents’ parents
favorite is Coca-Cola followed by gold spot 6%
which is no longer in existence as well as
Schweppes
in Zambia.
Source: Field Data, 2018
Figure 3: Respondents parents’ favorite brand
4.6 Respondents choice of brand of soft drink
A question was asked, what brand of soft drink do
you purchase from Table 4 below the coca—cola
brand is the most preferred followed by Pepsi
products and the non-carbonated are the least
preferred
Name of brand Number of respondents
Coca-Cola 32
Pepsi 13
Ceres 3
Fanta 14
Sprite 6
Fruit tree 4
Pure Joy 2
Lemon Twist 4
Minute Maid (Mango) 3
Frooty 5
Miranda 7
Apple Max 3
Mountain dew 4
Total 100
Source: - Field Survey (2018)
Table 7: Consumers’ preference towards soft
drinks
4.7 Factors that Influence Consumer Preference
to Have Soft Drink
From the table 7 below different factors
influencing consumption of cold drinks have been
ranked according to consumer’s choice.
Consumers have ranked the quality of the cold
drink as the most important factor (62 first rank
and 22 second rank), followed by taste (57 first
rank and 15 second rank). The brand is in the third
position with 25 first rankings and 10 second
rankings. Similarly, advertisement is the fourth
position, price is in the fifth position, Availability
is in the sixth position, and promotion and others
are in the seventh position.
67
33
Do you purchase a soft drink based on brand
Yes
No
89
6 5
WHAT WAS YOUR PARENTS FAVOURITE BRAND
Coca-Cola
Gold Spot
Schweppes

The International Journal of Multi-Disciplinary Research ISSN: 3471-7102, ISBN: 978-9982-70-318-5
9
Paper-ID: CFP/826/2018 www.ijmdr.net
This indicates that consumers give higher
preference to the quality, taste and brand name in
the choice of cold drink, moderate lever preference
to availability, advertisement and price factors, and
lower preference to the promotion and other
factors.
Factor
rank
1 2
n
d
3r
d
4t
h
5t
h
6t
h
7t
h
8t
h
To
tal
Taste 5
7
15 7 8 4 3 2 4 10
0
Availabil
ity
8 9 2
2
2
8
5 1
0
5 1
3
10
0
Brand
image
2
5
10 1
5
2
3
1
0
5 7 5 10
0
Price 1
1
21 2
8
5 1
7
9 5 4 10
0
Advertis
ement
1
5
20 2
2
1
1
1
4
6 8 4 10
0
Promotio
n
4 6 9 1
3
1
7
2
7
3
4
2
4
10
0
Quality 6
2
22 5 3 3 2 2 1 10
0
Health
drink
7
5
10 8 4 2 1 0 0 10
0
Source: - Field Survey 2018
Table 8: Consumer brand preference
4.8: Mode of Awareness about of the Soft
Drinks
Pertaining to the sources of information used by
the respondents to gather data, a question was
asked comprising the following sources: TV, radio
Internet, Newspaper, poster, Friends, Store, Family
and Social media. Stores, TV, friends, Poster are
the most effective sources of soft drinks. Stores
was at 87% as the most effective way in terms of
display of the soft drink ,TV is the second at
75%,friends at 68% and the least is social media
because none of the beverages companies have
Facebook pages .
Source: Field Data, 2018
Figure 5: Sources of information of soft drink
4.9 What is the best way of advertising to you?
From the figure the best ways of advertising is the
use of social media (Whatsapp and facebook) and
the second best traditional media still remains to
be the Television. Companies should find a way of
putting their adverts on facebook and whatsapp
because a lot of people are using social media.
Source: Field Data, 2018
Figure 6: Best way of advertising
75
249 15
63 59
87
68
6
0
20
40
60
80
100
select the sources of information on soft drinks
0
20
40
60
80
100
what do you think is best way of advertising and
conviennt to you

The International Journal of Multi-Disciplinary Research ISSN: 3471-7102, ISBN: 978-9982-70-318-5
10
Paper-ID: CFP/826/2018 www.ijmdr.net
4.10 Are you influenced by promotion of soft
drinks?
From the figure 7 below different 40% are not
moved by promotion to switch over to another
brand, while 35% are moved by promotion. Price
is a major factor in under developed countries like
Zambia.
Source: Field Data, 2018
Figure 7: slashed prices effects on respondents
4.12 Analysis of consumers’ loyalty on favourite
brand
From the table below most of the respondents are
brand loyalists
Opinio
n
Strongl
y
disagre
e
Disagr
ee
Do
not
Kno
w
Agre
e
Strongl
y
Agree
I
usually
purcha
se one
brand
6 4 8 17 65
If the
brand I
usually
buy is
not
availab
le I
would
LOOK
for it in
another
7 42 9 15 27
shop
If the
brand I
usually
buy is
NOT
availab
le I
would
buy
another
one
8 59 5 16 12
Source: Field Data, 2018
Table 9: respondent loyalty to a brand
Section B: Country of Origin Awareness
4.2.1 Brand preference between local vs. foreign
products
From the figure below the consumers have
preference for both local and foreign brands but
with which the majority of 53% preferring local
brands, 22% prefer both local and foreign brands
and thirdly by 18% who prefer strongly for the
local brands and the least is 2% of the consumers
who prefer strongly foreign brands
Source: Field Data, 2018
Figure 8: brand preference of soft drinks
5 8
3540
12
0
10
20
30
40
50
Do you purchase a different brand of soft drink due to
promotion?
0 10 20 30 40 50 60
I prefer strongly local brands
I prefer local brands
I prefer both local and foreign
brands
I prefer foreign brands
I prefer strongly foreign brands
Brand preference of soft drinks

The International Journal of Multi-Disciplinary Research ISSN: 3471-7102, ISBN: 978-9982-70-318-5
11
Paper-ID: CFP/826/2018 www.ijmdr.net
4.2.1 Price level of foreign products
From the figure 8 the Price for the foreign
products is expensive comparing them with the
local manufacturing product. According to
Bondari (2010) pricing provides the base for
customers to search for their suitable products that
are within a particular price category while
ignoring those that are not part of it.
Source: Field Data, 2018
Figure 9: Price analysis of foreign products
4.2.2 Availability of foreign products
Analysis of figure 10 The reason behind the
availability is that products are imported are of low
import tax and has a moderate price for consumers
so they come in large quantities. Generally,
consumers will look for products that are of good
quality since quality has a direct link with
customer satisfaction (Kotler & Keller 2006). For
consumers to be highly ethnocentric there is the
need for the local products made in the country to
be of good quality (Sheth et. al. 1999).
Consumers search for products that will give them
the benefits desired (Kotler 2003). Vida and
Dmitrovic (2001) are of the view that if consumers
believe that foreign products will give them more
benefits than those made in their own country,
purchase decisions will more often in favor of
foreign products. The only exceptions are those
consumers who are highly ethnocentric who may
make decisions in favor of local products despite
their deficiency in quality (Watson & Wright
2000, Maheswaran 1994). However, the situation
is good in Zambia our local products are of good
quality.
Source: Field Data, 2018
Figure 9: Price analysis of foreign products
4.2.3 Reason of purchasing foreign soft drinks
products
From Figure 10 below Quality has become the
major important factor with those with money and
some education and quality is defined simply as
freedom from defect and the ability of the product
to perform what it is supposed to do (Kotler 2003).
It is also described as the ability of the product to
satisfy stated or implied needs according to Kotler
& Keller 2006). Especially, non-carbonated are not
manufactured in Zambia, with the healthy
campaigns those who are elderly and children
prefer to buy and to purchase for the children
Ceres, pure joy and fruit tree because of their
naturalness or fruitiness.
Source: Field Data, 2018
Figure 10: Reasons for purchasing foreign brand
1 118 23
57
0102030405060
Price level of foreign soft drinks
15
3545
5
Availability of imported soft drinks
Always accessible
often accessible
Sometimes accessible
Rarely accessible
Never accessible
0
10
20
30
40
50
60
70
Quality Attractiveness Brand Name Brand Loyalty
Reasons for buying foreign soft drinks

The International Journal of Multi-Disciplinary Research ISSN: 3471-7102, ISBN: 978-9982-70-318-5
12
Paper-ID: CFP/826/2018 www.ijmdr.net
4.2.4 Analysis of purchase decision
From figure 11 represents the finding on the
impact of country of origin on the consumer
buying behavior in Zambia. It was indicated from
the survey that 5% of respondents always consider
the country of origin before they purchase
products and these are not in support of proudly
Zambian products. Their attitude towards Proudly
Zambian products is, therefore, positive. Also, 8%
of consumers often consider the country of origin
while 35 % of the respondents sometimes think
about it before making purchase decision in favour
of products made from other countries.45 %
indicates rarely, while the 12 % of the respondents
opted that it never affects their purchasing
decision. This category of consumers is, thus,
more ethnocentric. It can be deduced that this suit
well for Zambia as a developing country. We are
going in the right track as a country.
Source: Field Data, 2018
Figure 11: Consumer Purchase Decisions
4.3 Campaign against consumption of
carbonated drinks
The table below presents the results of the survey
by the age of the respondents. There are 4 age
groups, 16-25, 26- 35, 36 - 45 and above 46. The
largest group of respondents who are getting
influenced to stop sugared soft drinks is the group
between 36 - 45 years and the age bracket above
46 years and above due to fear of healthy issues
like high blood pressure and getting over weight
Influence 16-25 26-35 36-45 Above 46
Yes 1 2 14 11
No 41 25 4 2
Total 42 27 18 13
Source: Field Data, 2018
Figure 10: influence against consumption of soft
drinks
5.0 DISCUSSION OF FINDINGS
This discussion will maximally utilize the research
objectives to establish the discrepancy and
similarities between this research findings and the
literature revealed.
5.1 Effect of Demographic Factors on
Consumer Purchasing Behavior
The findings revealed that 32% of the respondents
were male and 68% females. The survey indicates
that majority of the respondents were females.
There no relationship between the gender and the
consumption of soft drinks because soft drinks are
not gender biased products neither was it high in
men. The findings contradict Elfhag et al. (2007)
study that showed that the rate of consumption rate
was higher among men. The consumption of non-
carbonated beverages (soft drinks) is high among
consumers of the older ages above 31 years. Wei
et al. (2003) notes that malt-based drinks are
known for their nutritional value, a message that is
attractive for manufacturers to carry across in
today’s climate of increasing health awareness.
The finding confirms Putnam & Allshouse (2007)
view that soda soft drinks may be displacing milk
in the diet. The consumption of milk was second
last on other alternative drinks. The findings may
be supported by Vereecken et al. (2005) findings
that a higher proportion of daily fruit consumers
have a lower proportion of daily soft drink and the
same can apply to malt soft drinks. In addition,
low consumption of malt soft drinks may be
associated with high consumption of nutrients
among young adults at the campus by Njoroge
(2017)
5 8
3540
12
0
20
40
60
Always Often sometimes Rarely Never
purchase decision

The International Journal of Multi-Disciplinary Research ISSN: 3471-7102, ISBN: 978-9982-70-318-5
13
Paper-ID: CFP/826/2018 www.ijmdr.net
5.2 Social Factors on Consumer Purchasing
Behavior
The presence of non-carbonated soft drinks at
home and school was strongly linked with its
consumption. A large number of respondents
claimed that they take non-carbonated soft drinks
because it provided by parents who are easily
available at home and in school. Non-carbonated
soft drinks are widely available almost everywhere
and therefore can drive its consumption. The
findings are supported by Story, Hayes & Kalina
(2006) study that the availability of soft drinks in
the home and the presence of soft drink at home
were strongly associated with healthy soft drink
consumption.
Clearly the consumption pattern of malt soft drinks
is associated with parents. The respondents
mentioned that they consume malt soft drinks
because it can be provided for by their parents.
The influence of parental soft drink intake is
stronger than peer influence, which may be
reflected by the importance of the family. Grimm,
Harnack and Story (2004) notes that soft drink
consumption may be influence children because
parents serve as role models. Also, those parents
who consume soft drinks on a regular basis may be
less apt to restrict or have rules regarding their
children’s soft drink consumption. This
demonstrates that there was a clear relationship
between consumption of malt soft drink and
family influence. The respondents also claimed
that they consume non-carbonated soft drinks
because of family influence. Family affluence
represents an influence in the consumption of non-
carbonated soft drinks Social support from friends
and peers has also emerged as a predictor of malt
soft drink consumption. These findings are similar
to those of Liu (2007) indicating that friends and
peers constituted important influences on behavior.
Hence, these findings contributed to the
understanding that friends may influence the
consumption of non-carbonated soft drinks.
5.3 Country of Origin influence on Consumer
Purchasing Behavior
From the research results country of origin has an
influence on the consumer preference and buying
behavior. The consumer was aware of the soft
drinks imported in our country and not produced in
the country the relationship between COO is
insignificant. From the consumers’ perspective,
increased exposure to foreign countries and their
products through traveling and media and the
growing presence of foreign products in domestic
markets bring about greater awareness and
acceptance of these products and the related
country-of-origin image. Also, as the market and
Products become more complex; consumers are
likely to increasingly seek means of simplifying
information processing through use of some
specific product cues, including a product’s
country of origin, in their decision making. The
results of this study suggest that when the price of
a product decreases, consumers are more likely to
buy the product even if they have a bias against the
product’s country of origin. In contrast, Heslop,
Liefeld and Wall (1987) found that pricing policies
and well-known brand names could not improve a
negative country-of-origin effect.
6.0 Conclusion and Recommendations
From the discussion and analysis of the results
presented in chapter five, we conclude as follows:
6.1 Demographic Factors on Consumer Purchasing
Behavior
Though there was no significant relationship
between gender and the consumption of soft
drinks. The consumption of non-carbonated soft
drinks does not coincide with a person being single
or married. Soft drink has no significant
relationship with the low income.
6.2 Social Factors on Consumer Purchasing
Behavior
The presence of non-carbonated on the market and
getting a share of the market shows that Family
and the campaigns against sugared soft drinks is

The International Journal of Multi-Disciplinary Research ISSN: 3471-7102, ISBN: 978-9982-70-318-5
14
Paper-ID: CFP/826/2018 www.ijmdr.net
having a strong influence on parents and society.
The consumers are seeking a healthier drink
especially for the elderly in age and the young one
below five years.
6.3 Country of Origin influence on Consumer
Purchasing Behavior
From the research survey the consumers aware of
the country of origin of the products that are
available on the market .it was discovered that the
prices are moderate and of good quality. It has
more advantages to have the market shares
because some of the taxes that the local companies
pay the foreign companies with imported products
do not pay. With the consumers preference to
purchase quality and healthy soft drinks. The
effect is currently not felt but, on the years, to
come carbonated drinks will have slag on the
market share especially the local manufacturing
companies.
6.4 Recommendations and Future Work
6.4.1Effect of Demographic Factors on
Consumer Purchasing Behavior
The study recommends that manufacturer such
Coca-Cola should advertise and lower the price for
non-carbonated such as minute maid, while Pepsi
under Varum should manufacture a soft drink that
may promote the nutritious beverages.
Californian beverages should package the non-
carbonated soft drink like Frooty in smaller
packages for a lower price to increase the profit
margin and also to promote healthy living by
drinking healthy products. All the local soft drink
manufacturing companies should create a
complete image of the brand in the mind of the
audience and reinforce the brand image created
and use market analysts to monitor the customer's
needs at different times
6.4.2 Social Factors on Consumer Purchasing
Behavior
The study recommends that it is important that
parents serve as positive role models, and their
influence should be considered in designing
interventions to promote healthful beverage
choices by young adults. There may be a need for
policies and regulations to limit the availability of
soft drinks in schools to promote health and good
nutrition for young adults. Consideration should be
given to developing public service announcements
promoting healthful eating behaviors, such as
avoiding carbonated drinks and choosing water,
milk and non- carbonated soft drinks as beverages
for young adults. Also, parents may to be more
restrict or have rules regarding their children’s soft
drink consumption. In addition, consideration
needs to be given to the effect of soft drink
vending in schools on nutrition and health.
6.5. Future Work
This work has investigated consumer preferences
and consumer buying behavior of soft drinks for
carbonated and non- carbonated in Kitwe. We
propose that in future, researchers can conduct a
study on consumer preference and buying behavior
of non-carbonated drinks in all the ten provinces.
The International Journal of Multi-Disciplinary Research ISSN: 3471-7102, ISBN: 978-9982-70-318-5
15
Paper-ID: CFP/826/2018 www.ijmdr.net
REFERENCES
[1] Devaraj, B., & Enid, M. (2011). Subjective
Norms That Affect the Consumer Attitude on
Their Consumption Behavior with Reference
to Carbonated Soft Drinks. International
Journal of Business Economics and
Management Research, 2(4), 104–113.
[2] Draškoviæ, N., Temperley, J., & Pavièiæ, J.
(2009). Comparative Perception(s) of
Consumer Goods Packaging: Croatian
Consumers Perspective(s). International
Journal of Management Cases, 11(Special
Issue: CIRCLE Conference 2009), 154–163.
https:// doi.org/10.5848/APBJ.2009.00028
[3] Gupta, S., Maity, M., & Pandey, S. C. (2014).
Sponsor, Ambusher, and Other: Consumer
Response to Three Strategies. Vikalpa, 39(1),
75–86.
[4] Prakash, G., & Pathak, P. (2014).
Understanding rural buying behaviour: a study
with special reference to FMCG products.
Indian Journal of Marketing, 44(8), 43–55.
https://doi.org/
5.17010/ijom/2014/v44/i8/80132 Wulf, K. De,
Odekerken-Schröder, G., Goedertier, F., &
Ossel, G. Van. (2005). Consumer perceptions
of store brands versus
[5] Nirrmala R (2002), “A study on brand loyalty
and brand preference towards health
beverages in Coimbatore city”, May 2002
[6] Sashay’s (2005), “consumer awareness and
brand preference for health drinks”, December
2005.
[7] Gayathri. C (2003) “consumer awareness and
brand preference for health drinks with special
reference to rural consumers.”2003
[8] David L. Loudon and Albert Dellabitta, “A
text book of consumer behaviour, concepts
and Applications”, Tata MC Graw-Hill
Publications, New Delhi. Fourth Edition-
2002.
[9] David A. Aaker, “Managing Brand Equity”,
thee free piers, New York.
[10] Del I Hawkins, “Consumer Behaviour:
“Building Marketing Strategy”, Irwin
professional agency, august 1997.
[11] Ganesan K-“Marketing Management”,
Rainbow Publication, Coimbatore-1986.
[12] S.P. Gupta, “Statistical methods”, Thirty-six
Revised Edition, Sultan Chand & Sons, New
Delhi, 2008.
[13] Dr. (Mrs.) S. Banupathy, Miss. M.
Hemameena, ‘Analysis of Brand