To trust is good, but to control is better: How investors ... ANNUAL MEETINGS/2017-Athens... · To...
52
To trust is good, but to control is better: How investors discipline nancial advisorsactivity Riccardo Calcagno y , Maela GiofrØ z , Maria Cesira Urz-Brancati x EMLYON Business School, University of Turin, CeRP-Collegio Carlo Alberto, International Longevity Centre - UK First draft: April 2015. This draft: January 2017 Abstract Using a survey of clients from one of the largest Italian banks, we nd that investors with low level of trust in professional advisors seek nancial counselling, but make their decisions autonomously. We investigate whether these investors exert some form of control over the quality of the recommendations they receive, and, if so, which one. Half of these investors do not exert any form of control over the advisors activity. The investors who are more likely to control the quality of the advice received are those with high self-assessed nancial competence. The mechanism through which investors discipline advisors depends instead on the investorsdegree of test-based nancial literacy. Investors with high nancial literacy directly monitor the advisorsactivity themselves. Instead, investors with low nancial literacy are more likely to seek a second experts opinion that supports the recommendations previously received, such as in the case of credence services. Our ndings suggest that improving investors nancial knowledge may foster direct control of the advisors activity. Moreover, facilitating the comparability of nancial products and the access to di/erent nancial institutions may fulll the same disciplining objective for poorly literate investors. Keywords : Financial advice, Financial literacy, Credence services JEL Classications: G11, G24, D80 We thank Annamaria Lusardi, Olivia Mitchell, Chiara Monticone, and seminar participants at the Cherry Blossom Financial Education Spring Institute (George Washington School of Business, April 2015), SKEMA Business School (Lille, October 2014), the EEA Annual Conference 2016 (Geneva), the FMA Annual Conference 2016 (Las Vegas) and the 1st Conference on Behavioral Economics and Financial Literacy (Barcelona) for helpful comments and discussions. Moreover, we also thank Laura Marzorati at Pioneer Investments for providing access to the Unicredit Customers Survey. We kindly acknowledge nancial support from the European Commission through the Seventh Framework Programme for the project Mobilising the Potential of Active Ageing in Europe. y EMYLON Business School and CeRPCollegio Carlo Alberto; e-mail: [email protected] z University of Turin and CeRPCollegio Carlo Alberto; email: [email protected] x ILC-UK (International Longevity Centre - UK); email: [email protected] 1
Transcript of To trust is good, but to control is better: How investors ... ANNUAL MEETINGS/2017-Athens... · To...
To trust is good, but to control is better: How investors discipline�nancial advisors�activity�
Riccardo Calcagnoy, Maela Giofréz, Maria Cesira Urzì-Brancatix
EMLYON Business School, University of Turin, CeRP-Collegio Carlo Alberto, International Longevity Centre - UK
First draft: April 2015. This draft: January 2017
Abstract
Using a survey of clients from one of the largest Italian banks, we �nd that investors with low levelof trust in professional advisors seek �nancial counselling, but make their decisions autonomously. Weinvestigate whether these investors exert some form of control over the quality of the recommendationsthey receive, and, if so, which one. Half of these investors do not exert any form of control over theadvisor�s activity. The investors who are more likely to control the quality of the advice received are thosewith high self-assessed �nancial competence. The mechanism through which investors discipline advisorsdepends instead on the investors� degree of test-based �nancial literacy. Investors with high �nancialliteracy directly monitor the advisors�activity themselves. Instead, investors with low �nancial literacyare more likely to seek a second expert�s opinion that supports the recommendations previously received,such as in the case of credence services. Our �ndings suggest that improving investors �nancial knowledgemay foster direct control of the advisor�s activity. Moreover, facilitating the comparability of �nancialproducts and the access to di¤erent �nancial institutions may ful�ll the same disciplining objective forpoorly literate investors.
Keywords: Financial advice, Financial literacy, Credence services
JEL Classi�cations: G11, G24, D80
�We thank Annamaria Lusardi, Olivia Mitchell, Chiara Monticone, and seminar participants at the Cherry Blossom FinancialEducation Spring Institute (George Washington School of Business, April 2015), SKEMA Business School (Lille, October 2014),the EEA Annual Conference 2016 (Geneva), the FMA Annual Conference 2016 (Las Vegas) and the 1st Conference on BehavioralEconomics and Financial Literacy (Barcelona) for helpful comments and discussions. Moreover, we also thank Laura Marzoratiat Pioneer Investments for providing access to the Unicredit Customers Survey. We kindly acknowledge �nancial support fromthe European Commission through the Seventh Framework Programme for the project �Mobilising the Potential of ActiveAgeing in Europe�.
yEMYLON Business School and CeRP�Collegio Carlo Alberto; e-mail: [email protected] of Turin and CeRP�Collegio Carlo Alberto; email: [email protected] (International Longevity Centre - UK); email: [email protected]
1

1 Introduction
Investors are being confronted with increasingly complex �nancial decisions, partly because shifting economic
policies have forced them to take on more responsibilities and partly because the menu of retail �nancial
products has been growing steadily. This poses a serious challenge to investors who want to buy the best
possible �nancial product, given their lifetime needs. Several authors (Georgarakos and Inderst, 2011;
Inderst and Ottaviani, 2012a,c) argue that the optimal �nancial choice depends on investor-speci�c need
and personal characteristics. For example, the best real estate mortgage, the optimal pension scheme or
long-term saving plan depend, respectively, on the client�s expected income stream, desired level of well-being
at retirement, risk attitude, or tax bracket. In accordance to this view, �nancial advice can be considered
as a credence service similar to medicine, where "money doctors help investors to get the most appropriate
treatment" (Gennaioli et al., 2015, p.92). As for medical treatments, the accuracy of the expert in solving
the client problem is not observable, the �nal success of the service is not contractible, and the expert�s
e¤ort is costly, so that the investor�advisor relation is a¤ected by moral hazard (Pesendorfer and Wolinsky,
2003; Fong, 2005; Dulleck and Kerchmbamer, 2006). Hence, investors who rely on professional �nancial
advice either do so because they trust their advisors (Gennaioli et al., 2015), or because they are naive
investors and not aware of advisors�moral hazard (Inderst and Ottaviani, 2009; 2012c), or because, despite
anticipating a con�ict of interest with the advisor, they think they are able to control e¤ectively the quality
of the recommendations they receive.
This paper studies whether investors exert some form of control over the quality of the recommendations
made by professional advisors. When this is the case, we investigate how investors� degree of �nancial
knowledge, measured both in subjective terms, i.e. self-assessed, and objectively, i.e. test-based, a¤ects the
control mechanism they enact.
For this purpose, we use the 2007 Unicredit Investors Survey (UCS) conducted on a sample of 1,676
individuals with a current account in one of the banks of the largest Italian banking group. We �nd that,
irrespective of their level of �nancial education, investors with high trust in their advisors fully delegate
them their �nancial decisions, as predicted by Gennaioli et al. (2015). However, we observe that in our
dataset more than two thirds of investors who demand professional advice make decisions autonomously,
after having received professional recommendations. These investors trust their advisors less than those who
fully delegate their investment decisions. Overall less than forty percent of investors seeking advice exert
2

some form of control on the activity of their advisors, which suggests either a widespread investors�inertia
(Bhattacharya et al., 2012) or a large presence of naive investors (Inderst and Ottaviani, 2012c).
We then investigate which investors�characteristics explain whether they discipline the advisor�s activity
and the type of control mechanism enacted. Pesendorfer and Wolinsky (2003) consider the search for second
professional opinions as the most appropriate disciplining mechanism for standard credence goods, such as
medical advice. Unlike in medical counselling, �nancially educated investors when confronted with �nancial
advice could try to verify the accuracy of the expert�s recommendation by themselves, since monitoring
costs are probably lower for investors with higher �nancial competence.
We �nd that the self-assessed level of �nancial competence is strongly related to some form of control
activity: Investors who are more con�dent in their own �nancial knowledge are more likely to check the
quality of advisors�recommendations. As suggested by Allgood and Walstad (2016), self-assessed literacy
re�ects a person�s self-image and is then natural to observe that self-con�dent investors rely on their own
judgement to exert control over the quality of the recommendation received.
The test-based degree of �nancial literacy impacts the disciplining mechanism used by investors. We
�nd that those with the highest level of test-based �nancial literacy exert a direct form of control on
advisor activity. Instead, investors with the lowest level of �nancial literacy are more likely to compare the
recommendations they receive with second opinions, as postulated by Pesendorfer and Wolinsky (2003) for
standard credence services. These results are robust if we take into account the potential endogeneity of
both the level of trust in advisors and the degree of �nancial literacy.
We believe that identifying the mechanism of control put in place by investors who seek advice and are
aware of the agency bias of experts is important in order to design e¤ective investors protection rules. Given
that investors with a low degree of �nancial literacy are more likely to search for second opinions, we can
deduce that they rationally do not demand professional advice in the �rst place if the search cost is too
high. Policy interventions should be designed to increase the fraction of investors aware of the potential
con�ict of interests with advisors, and to reduce the costs for investors to discipline advisors�activity. On
the one hand, policies aimed to improve �nancial knowledge can spread awareness of the advisors�bias and
reduce the monitoring costs for investors. On the other hand, facilitating access to experts other than an
investor�s own bank advisor could bene�t unsophisticated investors, enabling them to identify economically
sound advice more easily.
Our �ndings are consistent with some results in the literature. For example, Bhattacharya et al. (2012)
3

report that investors with low trust in the advisors and a low level of �nancial sophistication are less likely
to demand professional advice, even when this is certi�ed as unbiased. According to the credence service
view adopted in our paper, investors with low trust in �nancial institutions probably do not believe they
are being o¤ered unbiased recommendations. Therefore, they decide to seek advice only if they believe
they can a¤ord the cost to verify its quality, either by themselves if they have enough �nancial knowledge,
or by asking to a second expert. In our paper, we observe that investors who think to know more about
�nancial matters are more likely to control the quality of the advice they receive. This could explain why
more �nancially knowledgeable households follow the advice they receive in a lesser extent than the less
knowledgeable ones, as reported by Stolper and Walter (2015). The more knowledgeable investors may
carefully check the recommendations and consider that they are not accurate enough, deciding then not to
follow them.
The remainder of this paper is structured as follows. Section 2 describes the related literature. Section 3
reports the empirical analysis and Section 4 concludes the paper. In the Appendix A we describe thoroughly
all the main variables used in our analysis, while Appendix B collects additional robustness checks�tables.
2 Related literature
Inderst and Ottaviani (2012b) argue that, in many important �nancial decisions, the value realized by
an investor operating a �nancial transaction depends on the match between the investor�s needs and the
characteristics of the selected product, and only a professional advisor is able to identify the correct match.
These characteristics are speci�c to credence goods, which are �goods and services where an expert knows
more about the quality a consumer needs than the consumer himself� (Dulleck and Kerchmbamer, 2006,
p.5).
The credence goods approach is not new in the industrial organization literature (Wolinski, 1993, 1997;
Fong, 2005).1 In �nance, Gennaioli et al. (2015) explicitly refer to �nancial advice as a credence service
through which professionals guide investors with little knowledge in the acquisition of risky assets. The
authors argue that investors delegate their risky investments to the advisor they trust the most because
they are less anxious to take risks if they are counselled to do so than on their own, just as patients follow
the treatment prescribed by a doctor they trust.2 Other works also highlight the positive e¤ect of trust
1For an exceptionally comprehensive review, see Dulleck and Kerchmbamer (2006).2Recently, Pauls et al. (2015) argue that the level of trust in professional advisors is not homogenous across �nancial
4

on stock market participation, as, for example, Guiso et al. (2008) and Georgarakos and Inderst (2011),
especially for households with low �nancial capability. A peculiar characteristic of the model of Gennaioli
et al. (2015) is that an investor with high trust in an advisor dismisses the latter�s agency bias (Inderst and
Ottaviani, 2012a,b), his incentive to sell products with higher fees (von Gaudecker, 2015), and his incentive
to mis-sell products (Inderst and Ottaviani, 2009).3
We conjecture that some investors with low con�dence in their advisor could instead rationally anticipate
the potential con�ict of interest in the client�expert relation and exert some form of control to overcome
it. Considering the case of clients aware of the moral hazard inherent in credence services, Pesendorfer and
Wolinsky (2003) study the e¤ects of a mechanism that allows them to discipline it, that is, the search for
a second opinion. Alternatively, an investor could verify the quality of the advisor�s recommendation by
paying monitoring costs.
Our work aims to contribute to the vast literature studying the relationship between �nancial knowledge
and the demand for professional advice.4 Some papers argue that the objective level of �nancial literacy
of investors explains their demand for advice. Using the 2009 Financial Industry Regulatory Authority
(FINRA) Financial Capability Survey, Collins (2012) �nds that more knowledgeable investors are more
likely to seek �nancial advice than those with lower �nancial literacy. This same result is con�rmed by van
Rooij et al. (2011), Bucher-Koenen and Koenen (2011), and Calcagno and Monticone (2015) using di¤erent
datasets. Instead, Georgarakos and Inderst (2011) �nd that investors who choose to participate in the stock
market rely on advice only if their own level of �nancial education is su¢ ciently low. In addition, Hung
and Yoong (2013) support the idea that demand for professional advice could substitute for the level of
�nancial knowledge, while Hacketal et al. (2012) suggest that �nancial advisors are matched with wealthier
and higher income households. Other papers emphasize the relation between the subjective, i.e., the self-
assessed, level of �nancial literacy and the demand of advice. Kramer (2016) reports that households with
higher con�dence in their own �nancial literacy are less likely to seek professional advice.
We add to this literature by showing that both objective and subjective measures of �nancial literacy
impact the control activity that investors exert on advisors. More self-con�dent investors are more likely to
intermediaries. They �nd that the level of trustworthiness of �nancial advisors acting in community banks is larger than thatof advisors of large banks.
3With reference to the mortgage market, Woodward and Hall (2000) emphasize that mortgage loans are leading examplesof transactions where experts on one side of the market take advantage of consumers�lack of knowledge and experience. Theauthors �nd that confused borrowers overpay for brokers�services and that borrowers sacri�ce at least $1,000 due to shoppingfrom too few brokers.
4See Kim et al. (2016) for a study on the optimal delegation of investment management in a life cycle setting.
5
put in place some form of control on their advisors. Investors with the highest degree of �nancial literacy
check the quality of the recommendations they receive by themselves while the least �nancially literate ones
are more likely to seek a second expert�s opinion.
Several papers have documented that investors do not follow advice even when it has been certi�ed as
unbiased. Hacketal et al. (2010) analyze investor decisions to follow a recommendation that is truthfully
certi�ed as unbiased. Studying the trading behaviour of the retail clients of a German brokerage �rm, the
authors show that the greater the investor�s �nancial knowledge and perception of con�icts of interest, the
less likely the investor is to follow the expert�s advice. This result is also con�rmed by Stolper and Walter
(2015) regarding basic retirement choices and the insurance of major life risks.
Some papers study whether the degree of �nancial education a¤ects the likelihood to seek advice. Bhat-
tacharya et al. (2012) highlight that the mere availability of unbiased �nancial advice is a necessary but not
su¢ cient condition for bene�ting retail investors. They �nd that investors who lack �nancial sophistication
and trust are less likely to seek advice, even when this is unbiased and o¤ered for free. Calcagno and Mon-
ticone (2015) �nd that investors with higher �nancial literacy are more likely to consult �nancial advisors
than investors with a low degree of �nancial literacy because the former anticipate that they will receive
valuable information from advisors.
Our paper suggests that both the choices to seek and to follow professional advice can be driven by the
availability of a¤ordable control mechanisms. Investors who do not delegate their portfolio management
because of luck of trust (Gennaioli et al., 2015), may not follow or even not ask for advice in the �rst place,
if they anticipate the advisor�s bias cannot be disciplined either by asking for a second expert�s opinion or
by directly monitoring the advisors�recommendation.
3 Data and preliminary results
The empirical analysis relies on the 2007 Unicredit Survey (UCS), which draws from the population of
clients of one of the three largest European banking groups.5 The 2007 wave interviewed 1,676 individuals
with a current account in one of the banks of the Unicredit Group based in Italy. The sample consists of
clients in the age group 21�75 years, holding a current account and at least 10,000 euros. Due to these
5The UCS survey was repeated for the last time in 2009, but this last wave contained only a very limited number of questions,mostly concerning the respondents�degree of risk aversion. Therefore, we could not exploit this last wave for our purposes. Bycomparing the 2007 and 2009 waves, Guiso et al. (2013) �nd that risk aversion increased substantially after the �nancial crisisof 2008.
6
two last restrictions, the UCS over-samples rich investors with respect to the Italian population. For this
reason, whenever it is possible, we compare our results with the ones contained in SHIW, the Bank of
Italy�s Survey on Household Income and Wealth, in CONSOB (2016) and in Gentile et al. (2016) which are
all based on representative samples of the Italian population. The UCS goal is to study retail customers�
�nancial behaviour and their expectations towards the bank. It provides detailed information on households
demographic structure, labour market position, individual �nancial assets holding (both within and outside
the bank), and income.6 Furthermore, the survey contains data on the attitudes towards saving, �nancial
investment, risk propensity and, more importantly for our purposes, it collects information on the degree
of �nancial literacy of households and their relation with banks and �nancial advisors. In particular, the
survey explicitly measures the degree of trust of the respondents in their �nancial advisor, and the nature
and frequency of this relationship. In terms of information collected, our data set is comparable to the one
recently analyzed in Kramer (2016), obtained from one of the largest retail banks in the Netherlands. Table
1 reports the main descriptive statistics of the variables considered in our analysis.7
The sample selected for our study includes only account holders who report that Unicredit is their
main or only bank, leaving us with 1,581 observations. After accounting for sample selection, we focus on
1,116 investors holding risky assets,8 representing about 70% of the entire sample.9 In our sample, 713
investors, representing 45% of the entire sample, seek some form of professional advice (either "Advice" or
"Delegate"), while 518 investors (33% of the sample) seek advice but decide their investment autonomously
("Advice").10 Overall, the UCS sample covers individuals who participate more to �nancial markets than the
general Italian population and who are more likely to seek professional advice (CONSOB, 2016). Although
these data are not representative of the Italian population, we believe that they are well suited to answer
our key research question, i.e. whether investors seeking professional advice exert some form of control over
it, and if so, which one. The UCS does not cover households without a current account, and those belonging
to the lowest fraction of the population in terms of wealth. But these are unlikely to hold risky assets (van
Rooij et al., 2011) and to demand professional advice (Hacketal et al., 2012).
6As illustrated by Guiso and Jappelli (2009), the individuals in the UCS sample are older than in the SHIW study which isrepresentative of the whole Italian population.
7For further information on the UCS, see Guiso and Jappelli (2009) and Calcagno and Monticone (2015).8The survey considers as risky assets: bonds, stocks, mutual funds, insurance-based investment products, index funds,
personalised portfolio management and derivatives.9Note that this is higher than the level of �nancial markets participation across the whole population (CONSOB, 2016), i.e.
55%.10On the whole population, CONSOB (2016) �nds that 38% of households seek professional advice when confronted to an
investment decision.
7
The main variables of interest for our analysis are related to characteristics of the investors, such as trust
in advisors and �nancial knowledge, as well as to characteristics of the investor-advisor relation. Please refer
to Appendix A for a precise de�nition of all the variables we use in this paper and for the precise wording
of the survey questions.
The degree of trust in advisors is obtained from the answer (on a scale of one to �ve) to a speci�c
question on the investor�s level of trust in bank or �nancial advisors. The median level of trust is quite high
(4 over 5), as well as its standard deviation (almost 20%). The objective measure (or test-based) of �nancial
literacy is constructed as in Guiso and Jappelli (2009) and Calcagno and Monticone (2015): it is related
to the correct answer to eight questions regarding in�ation, interest rate compounding, risk diversi�cation,
and products�riskiness, similarly to the questions in van Rooij et al. (2011) and Kramer (2016). The overall
distribution of the correct answers is shown in Fig. 1. The average respondent answers correctly to 4.6
questions (57.5% of the total), and the median number of correct answers is �ve (62.5%). Our test-based
degree of �nancial literacy is higher than the one obtained by Gentile et al. (2016) using similar questions
on a sample representative of the whole Italian population: this is to be expected, since the literature widely
reports a positive relation between �nancial literacy and wealth (van Rooij et al., 2011, among others).
The degree of self-assessed �nancial knowledge is equal to the self-reported ability to manage �nancial
investment (on a scale of one to �ve) relative to the average. Lusardi and Mitchell (2014) and Kramer
(2016) report a frequent substantial mismatch between individuals�self-assessed knowledge and their actual
knowledge. More speci�cally, for the UCS sample, Guiso and Jappelli (2009) �nd that these two measures
are only weakly correlated and can therefore have independent predictive power. From Table 2, which
reports the correlation matrix of the relevant regressors (and instruments) considered in the analysis, we can
observe that the correlation coe¢ cient between self-assessed and test-based �nancial literacy is statistically
signi�cant and equal to 0.33. The pattern of correlations of other variables matches what previously found
in the literature: �nancial competence is positively associated with income, education, �nancial sector
employment, experience in �nancial markets, and negatively associated with risk aversion and the female
dummy (Lusardi and Mitchell, 2007; Hacketal et al., 2012).
The survey also provides information about other characteristics of the investor�advisor relationship
crucial for our analysis. Speci�cally, it asks the respondent whether he/she ever asked the bank about
products managed by other banks or �nancial institutions ("Second Opinion") and how often he/she meets
the �nancial advisor at the bank (variable "Monitoring"). Concerning the "Second Opinion", only 6% of
8

the sample has ever asked to the main bank, i.e. Unicredit, for products proposed by other banks, while the
median respondent never did so.
To measure the frequency of meetings between investors and their advisors we adopt a three-category
ordered variable equal to 0 ("Rarely") if the frequency of meetings is lower than once a year, 1 ("Sometimes")
if the investors meets the advisor from once a year to once every three months, and 2 ("Frequently") if the
meetings are more frequent than once per month. We observe that the median respondent meets the advisor
once (over a scale from zero to two), i.e. less frequently than once every quarter but more than once per
year. In Section 3 we use these two variables to quantify the control mechanisms which are the key focus or
the present paper and discuss our methodology thoroughly.
The variable "Frequency of trading" captures the duration at which the respondent revises its investment
position: the average respondent executes an order less than once per year. The measure "Satisfaction
advice" is obtained from a question asking the investor its level of satisfaction for the way the bank manages
its �nancial investment, and it varies on a scale from zero to �ve. The average level of satisfaction is
approximately 2.8 (56%), but also this variable shows an important standard deviation (approx. 18%). The
other variables described in Table 1 are standard.
The UCS contains information about the way individuals manage their �nancial investment, that is,
whether they decide autonomously (Self ), ask for advisor counselling but decide independently (Advice),
or fully delegate their choice to a professional advisor (Delegation). In Table 3, we report the percentages
of investors falling in these three categories, as well as for the subsample of those holding risky assets. The
fraction of investors asking for advice but deciding independently is the largest, representing the 48% of the
full sample and the 69% of investors holding risky assets.
From Table 3 one can see that the higher the level of trust in the advisor, the more likely the investor fully
delegates his choice to the latter. This preliminary evidence supports Gennaioli et al. (2015), who argue that
investors who unconditionally trust their advisor fully delegate their �nancial decisions. The level of trust
could be correlated with other variables in�uencing the way investors make their decisions, notably their
�nancial competence. Table 3 also reports the level of test-based and self-assessed �nancial knowledge for the
three groups of investors chosing the di¤erent management styles "Self", "Advice", "Delegation". Low levels
of �nancial literacy, either test-based or self-assessed, predict a higher probability to fully delegate investment
decisions to professional advisors. The relation between �nancial competence and the choice to self-direct
portfolio investment is less clear-cut. While higher self-con�dence seems to predict a higher probability to
9

decide autonomously rather than seeking advice, test-based �nancial literacy points to the opposite direction:
a higher �nancial literacy is associated with investors seeking advice but deciding autonomously.
To assess more precisely the e¤ect of trust and �nancial competence on the investors�demand of advice we
consider a multivariate regression setting that includes the standard control variables used in the literature:
demographics, income, wealth, the experience with the �nancial sector, and the area of residence. Given
that the UCS asks only respondents who hold risky assets how they manage their investment we estimate
an ordered probit model with sample selection. Table 4 presents the results of this regression model.
In column (1) of Table 4, we report the estimates of a probit model in which investors either hold risky
assets or not. We use the level of risk aversion as exclusion restriction here. More risk-averse investors are
less likely to hold risky assets, as expected. The results again con�rm the predictions of Gennaioli et al.
(2015): Investors who trust their advisors more are more likely to invest in risky assets. In addition, the
test-based level of �nancial literacy has a strong positive impact on holding risky assets, as in (Guiso and
Jappelli, 2009; van Rooij et al., 2011; Clark et al., 2016), as does the measure of self-assessed �nancial
capability.
In columns (2a) to (2c) of Table 4, we present the e¤ects of trust, test-based �nancial literacy, and self-
assessed �nancial competence on the way investors use professional counselling. We run a Heckman ordered
probit model in which the dependent variable is, respectively, Self (column (2a)), Advice (column (2b)),
or Delegation (column (2c)). The level of trust increases the probability of full delegation, as predicted
by Gennaioli et al. (2015), while it decreases the probabilities of both asking for advice and investing
autonomously. While both �nancial literacy and self-assessed �nancial knowledge drive the choice to hold
risky assets, only the latter appears to have a signi�cant impact on the choice to rely on professional advice,
consistent with Kramer (2016).
Investors who received professional advice and spent time with their advisors are more likely to develop
a higher level of �nancial sophistication and they may trust advisors more. This consideration suggests
that trust and �nancial competence may be endogenous with respect to the investor choice. To address this
potential endogeneity of trust and �nancial literacy, we report in columns (3) and (4a) to (4c) of Table 4
the instrumented version of the previous model.11 We instrument the level of trust in advisors with two
11The instrumental variable approach is implemented in the selection equation, since the Wu�Hausman test of endogeneityrejects the hypothesis of exogeneity of the two (potentially endogenous) regressors in the selection equation (p-value=0.00), butnot in the outcome equation (p-value=0.12).
10

variables capturing the general level of trust.12 To instrument �nancial literacy, we adopt the regional level
of �nancial literacy derived from the Bank of Italy�s SHIW and a dummy variable indicating whether the
head of household was in the group of best students when attending school at ages 11�14.13 The regressors�
correlation matrix of Table 2 also con�rms that the instruments are signi�cantly positively correlated with
the endogenous variables. Dealing with ordered probit models, we adopt the control function approach,
that is, a two�stage residual inclusion (2SRI) estimation, as described by Wooldridge (2010).14 Also this
instrumented version of the ordered probit model con�rms the positive role of trust in the choice to fully
delegate.15
4 The control mechanisms: direct investor monitoring and search for a
second opinion
The key contribution of our paper is to identify the disciplining mechanisms that investors put in place in
order to control the quality of the recommendations they receive, if any.
Table 3 shows that about 69% of the investors who hold risky assets regularly consult their advisor
but decide autonomously how to invest (Advice). They trust professional counselling signi�cantly less than
investors who fully delegate their decisions. We expect then that investors choosing "Advice" are relatively
more aware that the recommendations they receive can be biased, as the wary investors described in the
literature (Woodward and Hall, 2012; Inderst and Ottaviani, 2009, 2012c), and are therefore more likely to
discipline their advisors�activity (Inderst and Ottaviani, 2012c) than the ones who decide to fully delegate
their portfolio decisions (Delegate).
To verify this conjecture, we report in Table 516 the percentages of investors who enact any form of
control on the advisor�s activity. The �rst row refers to the sample of individuals who rely on some form of
12See Appendix A for further details on the instruments.13Note that the number of observations for the instrumented version of the selection and outcome equations drops from
1,581 and 1,116, to 1,550 and 1,098, respectively. This is due to missing observations (31 in the full sample, 18 in the selectedsample) after instrumenting individuals��nancial literacy with the average regional �nancial level in the SHIW dataset (it beingimpossible to associate any Italian birth region for clients born abroad).14Since the �tted residuals from the �rst-stage are included in the second stage-regression as a additional regressors, the
standard errors need to be corrected (Wooldridge, 2010, pp.126�129). Standard error correction is achieved by bootstrappingthe relevant equation estimation.15Since the system of equations is over-identi�ed, we report at the bottom of Table 3 standard test statistics that con�rm the
validity of the adopted instruments.16From here on I have inverted the sequence of two following tables...old Table 6 becomes Table 5, and viceversa old Table 5
becomes Table 6.
11

professional advice (advice/delegate), while the second row refers to the subsample of those asking advice
and deciding autonomously (advice only): as expected, the latter display a higher - even if only marginally
- probability to put in place any form of control. Also, we �nd that more than 60% of investors do not exert
any form of control on the advisor�s activity, con�rming some form of inertia (?Stolper and Walter, 2015).
Interestingly, only a small subsample (about 5%) exert both types of controls, i.e. direct monitoring and
asking for a second opinion, which in general are selected alternatively. About one third of investors controls
the advisor through direct monitoring, while only one tenth chooses the second opinion as a disciplining
device.17
Inderst and Ottaviani (2009) argue that less literate households may be less aware of the agency bias of
professional �nancial advisors, and therefore they may exert less control on their recommendations. Several
other papers have argued that also the self-assessed degree of �nancial knowledge a¤ect households �nancial
behavior: Kramer (2016) �nds that investors with a higher con�dence in their own �nancial literacy are
less likely to seek professional advice. Allgood and Walstad (2016) report evidence that the subjective
degree of �nancial knowledge has predictive power over the test-based measure of �nancial knowledge to
explain �nancial behavior. These studies suggest that not only the objective measure of �nancial literacy, but
also its subjective perception a¤ects the likelihood that investors exert some form of control over advisors�
recommendation.
Hypothesis 1: among investors chosing to rely on professional counselling, both the degree of �nancial
literacy objectively measured with a test and the one subjectively assessed by the investor a¤ect the likelihood
to put in place some form of control over the advisor�s activity.
Given the similarities between �nancial advice and credence services suggested by Gennaioli et al. (2015),
we refer to Pesendorfer and Wolinsky (2003) to predict the behaviour of wary investors asking for advice.
Pesendorfer and Wolinsky (2003) present a model of standard credence goods where clients can discipline an
expert�s activity only by seeking a second professional opinion that con�rms the recommendation previously
received. For standard credence services such as medical advice, the cost of checking whether the doctor�s
recommendation is accurate is too high for most patients. This cost is likely to be similar across patients
endowed with di¤erent levels of education, except for those who studied medicine. Instead, for a service
such as �nancial advice, the degree of investor competence could play a role in the strategic interaction
17 If we consider only investors choosing at most one mechanism of control (i.e., we exclude those who use both channels), thepercentage of investors who directly monitor the advisor or rely on second opinion shrinks to about 28 percent and 5 percent,respectively.
12

between advisor and client (Collins, 2012; van Rooij et al., 2011; Hung and Yoong, 2013). More �nancially
educated investors are better able to �nd good advisors (Hacketal et al., 2012; Lusardi and Mitchell, 2014),
to understand better the characteristics of the advised portfolios (Bucher-Koenen and Koenen, 2011), and
generally pay lower costs in evaluating a recommendation. Instead of relying on second opinions, these
investors can verify the accuracy of the advisor�s choice by directly monitoring the expert�s activity at a
cost that decreases with their degree of �nancial literacy.
Hypothesis 2: among investors relying on professional counselling, those with a high degree of test-
based �nancial literacy control the advisors by directly monitoring their activity, while less literate investors
are more likely to seek a second opinion.
To test the two above predictions we need to perform a further selection step among investors holding
risky assets in order to exclude those who invest without any professional counselling. We build on the model
of Pesendorfer and Wolinsky (2003) and construct a measure proxying for the expected payo¤ the investor
earns by referring to a professional advisor. While the expected bene�t of seeking advice is proportional
to the quality of the advice, the disciplining cost depends on the investor�s ability to control the advisor�s
activity. A rational investor asks for advice only if the expected bene�t of doing so exceeds the expected
cost. Hence we should observe that investors obtaining lower bene�ts from advice or paying higher control
costs are less likely to ask for advice. We measure the net bene�t of asking for advice with the variable
Expected payo¤ of advice/delegate. A client is predicted to have high expected payo¤ of advice/delegation
if, in choosing a bank, he highly values a large variety of products, competitiveness of prices and product
performance as well as consultants�competence, and, at the same time, he considers the proximity to home
and the availability of telephone/internet services.18
In Table 6, we run a Heckman probit regression with double sample selection. In the �rst column, we
report the result of the �rst sample selection, which restricts to investors holding risky assets. Column (2)
shows the results of the second selection equation, which identi�es investors who ask for �nancial counselling.
The exclusion restriction adopted in the second selection is precisely the Expected payo¤ of advice/delegate:
The larger this payo¤, the more likely the investor asks for �nancial advice. Indeed, we �nd that this
measure signi�cantly explains (coe¤. = 0.070) the choice between asking for advice or to fully delegate. The
level of trust also has a very strong, positive e¤ect on this decision.
As a proxy measure of direct monitoring, we use the frequency of meetings between investors and their
18See Appendix A for details on the construction of this variable.
13

advisors, i.e. the variable "Monitoring". We interpret frequent meetings as a signal of investors following
closely the work of their advisor, repeatedly asking him for information and clari�cations, therefore pushing
the latter to spend time on his case.19 To capture the fact that an investor seeks for a second opinion, we
use the variable "Second Opinion", a binary question asking whether the respondent ever asked their bank
about products provided by other banks or �nancial institutions. We interpret a positive answer to this
question as a signal that the investor controls advisor�s recommendations through a comparison mechanism,
similar to seeking a second opinion: Investors who ask their advisor at Unicredit products sold by other
banks reveal to be aware of the existence of these products and, possibly, their intention to compare di¤erent
products before purchasing one of them. These investors are likely to use the same attitude with respect to
the products o¤ered by Unicredit.20
In columns (3a) to (3c) of Table 6, we observe that a higher test-based measure of �nancial literacy
increases the probability that investors frequently meet the advisor (coe¤.= 0.182). The objective measure of
�nancial literacy is instead negatively correlated with the probability of rarely (coe¤.= -0.108) or sometimes
(coe¤.= -0.074) meeting the advisor. These results con�rm our hypothesis that investors with high �nancial
literacy are more likely to monitor the activity of advisors by themselves. The self-assessed measure of
�nancial literacy does not a¤ect signi�cantly the monitoring activity directly performed by the investor.
According to our second prediction, less literate investors are expected to discipline the advisor activity
by seeking a second opinion (Pesendorfer and Wolinsky, 2003). In column (4) of Table 6 we see that the sign
of the coe¢ cient for the objective measure of �nancial literacy is negative as expected, but not statistically
di¤erent from zero. Instead, the degree of self-assessed �nancial knowledge is positively and signi�cantly
related to the search of a second opinion.
In Table 6a, we run the same analysis on all investors relying on professional advice, i.e. both the investors
choosing "Advice" and "Delegation". Interestingly, the results relative to direct monitoring in columns (3a)
to (3c) are con�rmed, while the coe¢ cient of �nancial literacy for second opinion is now positive, though
close to zero: the negative coe¢ cient, though not statistically signi�cant, emerges only in the subsample of
investors asking advice only.
To check the robustness of these results, we recode the test-based �nancial literacy variable on a scale of
19We acknowledge that this variable may also re�ect the frequency of trading. In Table 10, we speci�cally deal with thisissue. Please refer to Section 3.1 for a thorough discussion.20See Section 3.2 for a critical discussion about the interpretation of this variable, and its pertinence as a proxy measure of
the search for a second opinion.
14

three values, low, medium and high.21 Then we run again the Heckman ordered probit model with double
sample selection presented in Table 6. We collect the results in Table 7.22
In columns (1a) to (2c) of Table 7 we observe that investors in the lowest percentiles of the distribution
are less likely to monitor directly (i.e. to meet frequently) their advisors (coe¤. = -0.130), while those in
the medium and high percentiles of the distribution are more likely to do so (coe¤. = 0.181 and 0.261,
respectively). The models in columns (3) and (4) of Table 7 also show that the coe¢ cients of the recoded
�nancial literacy variable are statistically signi�cant and are helpful in predicting the search for second
opinion. In column (3) we observe that the investors at the bottom of the distribution of �nancial literacy
are more likely to control their advisor by seeking a second opinion (coe¤: = 0.085), while medium and highly
literate investors are both less likely to search for a second opinion (coe¤.=-0.091 and -0.072 in column (4),
respectively). This further con�rms our third hypothesis. The self-assessed degree of �nancial knowledge
positively a¤ects the likelihood to search for a second opinion in a highly signi�cant way (columns (3) and
(4)).
In Table 7a, we perform the same analysis as in Table 7, but extended to the overall selected sample
(Advice/Delegate). While the �ndings relative to direct monitoring are qualitatively con�rmed, the coef-
�cients of �nancial literacy (low, medium or high) relative to the search for second opinion are no longer
signi�cant. These �nding corroborates the credence service view taken in the paper: only investors who
ask for advice but manage their portfolio autonomously seek a second opinion to discipline the advisor�s
activity. Moreover, a lower level of �nancial literacy is associated with a more intense search for a second
opinion while highly literate investors are more likely to directly monitor the advisors�activity.
Tables 7 and 7a show a positive and signi�cant correlation between the self-assessed degree of �nancial
literacy and the probability of exerting some form of control over advisors, either by asking a second
opinion of through direct monitoring. This �nding uncovers two distinct and independent roles for the
self-assessed �nancial competence and the test-based �nancial literacy in the strategic interaction between
21We introduce: A dummy variable Financial Literacy_low, which equals one for investors scoring at most three out of eightcorrect answers, representing approximately the lowest 20% of the selected subsample, and zero otherwise; a dummy variableFinancial Literacy_medium, equal to one if the investors score four (median) or �ve out of eight correct answers, and zerootherwise; and a dummy variable Financial Literacy_high equal to one for those investors scoring at least six out of eightcorrect answers, representing approximately the highest 10% of the distribution, and zero otherwise. In Figures 1 and 2, weplot the frequency and cumulative distribution functions, respectively, of the variable Financial Literacy. Since the variable isdiscrete, we are not allowed to choose any desired percentile level. In Section 3.4, we also discuss �ndings relying on alternativemeasures of �nancial literacy, also to dispel doubt about the �nancial literacy percentiles used in the main speci�cation.22We report in Table 7 only the results relative to the outcome equations - Monitoring and Second opinion - that are estimated,
as in Table 6, following the Heckman ordered probit models with double sample selection and 2SRI estimation model to treatendogeneity.
15

investor and advisor. The degree of self-con�dence in �nancial topics a¤ects the probability of control of
the advisor�s activity, while the test-based �nancial knowledge drives the choice of the control mechanism
put in place by the investor. Among investors who ask for advice but decide autonomously, those who
are more con�dent in their own �nancial knowledge exert some form of control over the advisor activity.
Those at the top of the distribution of the test-based �nancial literacy distribution discipline their advisors
through direct monitoring, while those at the bottom control their advisors�behaviour by comparing di¤erent
recommendations.
Up to this point we have implicitly assumed that a client alternatively choses one of the two disciplining
devices, i.e. direct control or the search for a second opinion, in order to obtain an accurate recommendation
from the advisor. Table 5, however, highlights that 60 percent of investors asking advice does not put in
place any form of control, and that only a very small fraction of investors adopt both disciplining channels
(about 5%). In Tables 8 and 9 we check whether our previous results are con�rmed when we include these
two groups of investors in the analysis.
In column (1) and (2) of Table 8 we study the characteristics of investors who do not exert any control,
i.e., who do not meet frequently the advisor ("Monitoring" 6= 2) and who do not search for a second
opinion ("Second opinion" = 0). The degree of test-based �nancial literacy does not predict signi�cantly
this behavior. However, the non-controlling investors have a low self-con�dence in their own �nancial
knowledge. This �nding is consistent with the results reported in Table 7: a high self-assessed �nancial
competence is associated with a stronger propensity to control the advisor�s activity. Columns (3) and (4)
of Table 8 report the e¤ect of trust and �nancial competence on the probability that investors implement
both control mechanisms: interestingly, neither the test-based nor the self-assessed �nancial competence
signi�cantly predict this behaviour. Finally, Table 9 presents the same regression analysis as in Table 7, but
excluding from the sample those (29) investors choosing both disciplining channels. Investors belonging to
the lower percentiles of �nancial literacy are still signi�cantly associated with a more intense search for a
second opinion (coe¤.=0.063).
4.1 Additional tests on the measures of monitoring and second opinion
The variables that we have adopted in order to measure the intensity of the investors direct monitoring
activity and their search for a second opinion may raise some questions in terms of interpretation. In this
section we discuss the pertinence of these measures more in depth.
16

4.1.1 Direct monitoring activity
We proxy the intensity of the direct monitoring activity using the frequency of meetings between investor
and advisor. We interpret frequent meetings as a signal of investors following closely the work of their
advisor thus pushing the latter to study accurately his case. Alternatively, one can argue that investors
meet their advisors more frequently if they want to change their portfolio more often. In columns (1a) to
(1c) of Table 10, we control for the frequency of trading in the regression speci�cation of Table 6.23 The
variable "Frequency of trading" is recoded in a three-category ordered variable ("Rarely", "Sometimes",
"Frequently") in order to closely match the monitoring measure. As expected, frequency of trading a¤ects
the monitoring intensity (i.e. the frequency of meetings) in a positive and signi�cant way. However, the
degree of �nancial literacy is still positively and signi�cantly related to monitoring. The economic size of
the coe¢ cient linking these two variables is only marginally reduced if compared to Table 6 (from 0.182 to
0.166),24 which con�rms the e¤ect of test-based �nancial literacy on the investor�s monitoring activity. In
order to rule out a possible spurious correlaction between �nancial literacy and the frequency of trading, in
columns (2a) to (2c) of Table 11 we consider the latter as a dependent variable. The results show that �nancial
literacy does not a¤ect trading frequency in a signi�cant way. Consistently with the literature (Grinblatt
and Keloharju, 2009), the frequency of trading is instead signi�cantly related with the self-assessed level of
�nancial knowledge.
If, as we claim, the linkage between �nancial literacy and frequency of meeting is due to the need to
monitor the advisor�s activity, its strength should be weaker the higher is the trust in the advisor and/or
the satisfaction for his activity. In Table 11, we study these testable implications. In columns (1a) to (1c) of
Table 11 we include the interaction between �nancial literacy and trust in the advisor. If our conjecture is
correct, we expect a negative sign of the interaction variable�s coe¢ cient: this is indeed the case, although
the coe¢ cient is (marginally) non signi�cant (p-value=0.11).
In columns (2a) to (2c), we consider instead the interaction between �nancial literacy and the level of
satisfaction in the advisor�s activity, measured on a scale 1 to 5.25 One can argue that the intensity of the
23Table 10, 11 and 12 follow a speci�cation close to Table 6, considering "Financial literacy" (0 to 8) as regressor, ratherthan the three-segment version (low, medium, high) adopted in Table 7. Results under this alternative de�nition of Financialliteracy are consistent with the ones reported here.24Note that we did not include "frequency of trading" as a regressor in the main speci�cation to avoid a further source of
endogeneity due to reverse causality: the advisor might increase the (need of) frequency of meeting with the investor in orderto increase the frequency of trading and then earn more from transactions.25See Appendix A, for a precise de�nition of this variable.
17

monitoring activity also depends on the level of satisfaction of the investors when dealing with his advisor.
A higher satisfaction is likely to increase the frequency of meeting, due to a component of pleasure of the
investor to chat with his advisor. This is con�rmed by our data: a higher degree of satisfaction signi�cantly
increases the frequency of the meetings between the investor and the advisor. However, the coe¢ cient of the
interaction term between �nancial literacy and satisfaction of advice is negative and statistically di¤erent
from zero: the higher is the satisfaction with the service provided, the less compelling is the role of �nancial
literacy in monitoring the advisor.
The relationship between �nancial literacy and satisfaction of advice is a priori far from obvious. A
higher �nancial literacy might induce the advisor to provide better recommendations, as emphasized by the
literature stressing the complementary relationship between advisor and investor (Calcagno and Monticone,
2015). Investors with higher �nancial literacy might therefore end up being relatively more satis�ed in the
advisor�s activity. Conversely, if the client�s higher �nancial literacy is associated with a closer monitoring
behavior, then the probability to detect opportunistic deviations of the advisors might be higher and the
satisfaction for the �nancial services might be lower. A negative relation between the test-based measure
of �nancial literacy and the level of satisfaction could therefore be considered as supporting our conjecture
about the direct monitoring behavior of highly literate investors. In column (3) of Table 11 we test this
conjecture. The variable "Low satisfaction advice" is equal to one if the respondent�s satisfaction is low
(1 to 3, out of 5), and 0, otherwise. This variable is associated as expected with a low level of trust in
the advisor and, more importantly for our purposes, with a high level of �nancial literacy, thus con�rming
hypothesis 3.
As a further robustness check, we consider an alternative proxy measure for the intensity of the monitor-
ing activity, the dichotomous variable "Monitoring_1". This variable is equal to one if the investor meets
frequently with the advisor (variable "Monitor" = 2) and if he is not satis�ed with the services provided
(variable "Low satisfaction advice" = 1); while it equals zero otherwise. We present the results in column
(4) of Table 11. The impact of the test-based degree of �nancial literacy on this alternative measure of mon-
itoring is positive, thus providing further support to our prediction that high objective �nancial knowledge
increases the direct monitoring activity.
18

4.1.2 Search for a second opinion
The variable "Second opinion" is constructed using the answer to a binary question asking whether the
respondent ever asked their bank about products provided by other banks or �nancial institutions. We
interpret a positive answer to this question as a signal that the investor compares di¤erent products and
di¤erent recommendations as by seeking a second opinion. However, this survey question does not directly
reveal whether the investor actually consult with di¤erent intermediaries. Luckily, in the questionnaire
the respondent is also explicitly asked whether he/she or his/her relatives make transactions with other
banks/�nancial intermediaries beyond Unicredit Bank. Therefore, we restrict our sample to respondents
who a¢ rmatively answer this question and we test whether the less literate investors among this group
search for a second opinion. We report the results in Table 12.
Columns #a refer to the subgroup of respondents who a¢ rm to directly deal with other intermediaries,
while #b refer to respondents stating that their relatives are involved with other banks. In columns (1a)
and (1b), we show that the objective degree of �nancial literacy has a negative and signi�cant e¤ect on
the likelihood to search for a second opinion. The self-assessed measure of �nancial knowledge is instead
positively and signi�cantly related to this control mechanims, con�rming our prediction that �nancial advice
is similar to a credence service.
Those clients who report to have contact with multiple banks or �nancial intermediaries are further asked
the reason for this choice. The respondent is told a list of possible answers among which one states: "to
make banks compete and therefore to get better conditions". We consider a positive answer to this question
as a signal of the respondent�s intention to compare the o¤ers made by di¤erent �nancial intermediaries. We
use this variable to proxy the search of a second opinion ("Second opinion_1")26 and we report the results
of the same regression model as above in columns (2a) and (2b) of Table 12. We �nd that the coe¢ cient
of the test-based �nancial literacy measure is negative and statistically signi�cant, thus con�rming that a
lower level of �nancial literacy is associated with a more intense search for a second opinion. However,
the subjective degree of �nancial literacy does not have a signi�cant impact on this alternative measure of
search.26See Appendix A, for a precise de�nition of this variable.
19
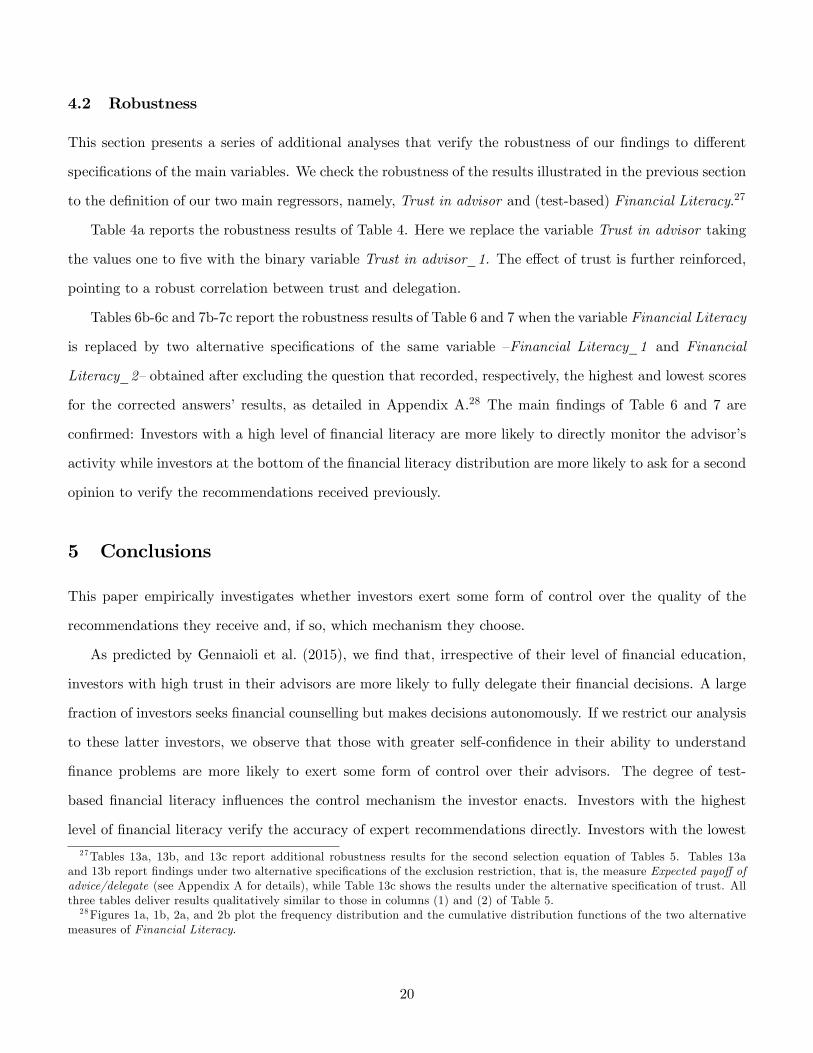
4.2 Robustness
This section presents a series of additional analyses that verify the robustness of our �ndings to di¤erent
speci�cations of the main variables. We check the robustness of the results illustrated in the previous section
to the de�nition of our two main regressors, namely, Trust in advisor and (test-based) Financial Literacy.27
Table 4a reports the robustness results of Table 4. Here we replace the variable Trust in advisor taking
the values one to �ve with the binary variable Trust in advisor_1. The e¤ect of trust is further reinforced,
pointing to a robust correlation between trust and delegation.
Tables 6b-6c and 7b-7c report the robustness results of Table 6 and 7 when the variable Financial Literacy
is replaced by two alternative speci�cations of the same variable �Financial Literacy_1 and Financial
Literacy_2�obtained after excluding the question that recorded, respectively, the highest and lowest scores
for the corrected answers� results, as detailed in Appendix A.28 The main �ndings of Table 6 and 7 are
con�rmed: Investors with a high level of �nancial literacy are more likely to directly monitor the advisor�s
activity while investors at the bottom of the �nancial literacy distribution are more likely to ask for a second
opinion to verify the recommendations received previously.
5 Conclusions
This paper empirically investigates whether investors exert some form of control over the quality of the
recommendations they receive and, if so, which mechanism they choose.
As predicted by Gennaioli et al. (2015), we �nd that, irrespective of their level of �nancial education,
investors with high trust in their advisors are more likely to fully delegate their �nancial decisions. A large
fraction of investors seeks �nancial counselling but makes decisions autonomously. If we restrict our analysis
to these latter investors, we observe that those with greater self-con�dence in their ability to understand
�nance problems are more likely to exert some form of control over their advisors. The degree of test-
based �nancial literacy in�uences the control mechanism the investor enacts. Investors with the highest
level of �nancial literacy verify the accuracy of expert recommendations directly. Investors with the lowest
27Tables 13a, 13b, and 13c report additional robustness results for the second selection equation of Tables 5. Tables 13aand 13b report �ndings under two alternative speci�cations of the exclusion restriction, that is, the measure Expected payo¤ ofadvice/delegate (see Appendix A for details), while Table 13c shows the results under the alternative speci�cation of trust. Allthree tables deliver results qualitatively similar to those in columns (1) and (2) of Table 5.28Figures 1a, 1b, 2a, and 2b plot the frequency distribution and the cumulative distribution functions of the two alternative
measures of Financial Literacy.
20

level of �nancial literacy instead seek a second expert opinion that con�rms the recommendation previously
received. This latter control mechanism implies that, for �nancially illiterate investors, �nancial advice can
be considered as a credence service, as for Pesendorfer and Wolinsky (2003). Our results suggest that easy
access to several di¤erent experts�opinions can be particularly bene�cial for the least �nancially educated
investors.
21

References
Allgood, S. and W. Walstad (2016). The e¤ects of perceived and actual �nancial literacy on �nancialbehaviors. Economic Inquiry 54(1), 675�697.
Bhattacharya, U., A. Hackethal, S. Kaesler, B. Loos, and S. Meyer (2012). Is unbiased �nancial advice toretail investors su¢ cient? answers from a large �eld study. Review of Financial Studies 25, 975�1032.
Bucher-Koenen, T. and J. Koenen (2011). Do smarter consumers get better advice? an analytical frameworkand evidence from private pensions. CDSE Discussion Paper 105.
Calcagno, R. and C. Monticone (2015). Financial literacy and the demand for �nancial advice. Journal ofBanking and Finance 50, 363�380.
Clark, R., A. Lusardi, and O. Mitchell (2016). Financial knowledge and 401(k) investment performance: acase study. Journal of Pension Economics and Finance forthcoming.
Collins, J. (2012). Financial advice: a substitute for �nancial literacy? Financial Services Review 21,307�322.
CONSOB (2016). Report on �nancial investments of italian households: Behavioural attitudes and ap-proaches. Statistics and analyses on the 2016 Survey (by N. Linciano, M. Gentile and P. Soccorso).
Dulleck, U. and R. Kerchmbamer (2006). On doctors, mechanics, and computer specialists: the economicsof credence goods. Journal of Economic Literature 44, 5�42.
Fong, Y. (2005). When do experts cheat and whom do they target? Rand Journal of Economics 36,113�130.
Gennaioli, N., A. Shleifer, and R. Vishny (2015). Money doctors. Journal of Finance 70, 91�114.
Gentile, M., N. Linciano, and P. Soccorso (2016). Financial advice seeking, �nancial knowledge and over-con�dence. evidence from the italian market. Quaderni di Finanza 83.
Georgarakos, D. and G. Inderst (2011). Financial advice and stock market participation. ECB WorkingPaper Series No. 1296.
Grinblatt, M. and M. Keloharju (2009). Sensation seeking, overcon�dence, and trading activity. Journal ofFinance 64(2), 549�578.
Guiso, L. and T. Jappelli (2009). Financial literacy and portfolio diversi�cation. CSEF Working Papers 212.
Guiso, L., P.Sapienza, and L. Zingales (2008). Trusting the stock market. Journal of Finance 63(6).
Guiso, L., P.Sapienza, and L. Zingales (2013). Time varying risk aversion. NBER Working Papers 19284.
Hacketal, A., M. Haliassos, and T. Jappelli (2012). Financial advisors: A case of babysitters? Journal ofBanking and Finance 36, 509�524.
Hacketal, A., R. Inderst, and S. Meyer (2010). Trading on advice. CEPR Discussion Paper DP8091.
Hung, A. and J. Yoong (2013). Asking for help: Survey and experimental evidence on �nancial advice andbehavior change. in O. Mitchell and K. Smetters, The Market for Retirement Financial Advice, OxfordUniversity Press.
22

Inderst, R. and M. Ottaviani (2009). Misselling through agents. American Economic Review 99, 883�908.
Inderst, R. and M. Ottaviani (2012a). Competition through commissions and kickbacks. American EconomicReview 102(2), 780�809.
Inderst, R. and M. Ottaviani (2012b). Financial advice. Journal of Economic Literature 50, 494�512.
Inderst, R. and M. Ottaviani (2012c). How (not) to pay for advice: A framework for consumer �nancialprotection. Journal of Financial Economics 105(2), 393�411.
Kim, H., R. Maurer, and O. Mitchell (2016). Time is money: Rational life cycle inertia and the delegationof investment management. Journal of Financial Economics forthcoming.
Kramer, H. (2016). Financial literacy, con�dence and �nancial advice seeking. Journal of Economic Behaviorand Organization 131, 198�217.
Lusardi, A. and O. Mitchell (2007). Baby boomers retirement security: the role of planning, �nancial literacyand housing wealth. Journal of Monetary Economics 54, 205�224.
Lusardi, A. and O. Mitchell (2014). The economic importance of �nancial literacy: Theory and evidence.Journal of Economic Literature 52, 5�44.
Pauls, T., O. Stolper, and A. Walter (2015). Trust and the supply side of �nancial advice. Available atSSRN: http://ssrn.com/abstract=2670484 .
Pesendorfer, W. and A. Wolinsky (2003). Second opinion and price competition: ine¢ ciency in the marketfor expert advice. Review of Economic Studies 70, 417�437.
Stolper, O. and A. Walter (2015). It takes two to tango: Households�response to �nancial advice and therole of �nancial sophistication. Available at SSRN: http://ssrn.com/abstract=2670511 July.
van Rooij, M., A. Lusardi, and R. Alessie (2011). Financial literacy and stock market participation. Journalof Financial Economics 101, 449�472.
von Gaudecker, H. (2015). How does household portfolio diversi�cation vary with �nancial sophisticationand advice? Journal of Finance 70(2), 489�507.
Wolinski, A. (1993). Competition in a market for informed experts�services. Rand Journal of Economics 24,380�398.
Wolinski, A. (1997). Credence goods and fraudolent experts. Rand Journal of Economics 28, 107�119.
Woodward, S. and R. Hall (2000). Consumer confusion in the mortgage market: Evidence of less than aperfectly transparent and competitive market. American Economic Review: Papers and Proceedings 100,511�515.
Woodward, S. and R. Hall (2012). Diagnosis consumer confusion and sub-optimal shopping e¤ort: Theoryand mortgage-market evidence. American Economic Review 102, 3249�3276.
Wooldridge, J. (2010). Econometric analysis of cross section and panel data. 2nd Ed. MIT Press. Cambridge,Massachusetts.
23

Tables
Table 1. Descriptive statisticsThis table reports standard descriptive statistics of the variables considered throughout the analysis. Note that
the estimation sample may vary across variables, as the tree-structure of the questionnaire implies that some questionsare asked only to sub-samples of clients.
Variable Mean Median Std. dev Min Max
Variables in main specificationTrust in advisor 3.798 4 0.905 1 5Financial Literacy 4.658 5 1.476 0 8Selfassessed financial knowledge 2.877 2.9 0.846 1 5Second Opinion 0.062 0 0.241 0 1Second Opinion_1 0.135 0 0.342 0 1Monitoring 1.187 1 0.645 0 2Monitoring_1 0.018 0 0.134 0 1Frequency of trading 0.759 1 0.728 0 2Satisfaction advice 2.832 3 0.870 0 4Risk aversion 2.886 3 0.719 1 4Expected payoff of advice/delegate 0.674 1 0.469 0 1Experience (years) 13.038 11 12.753 0 53Finance sector 0.034 0 0.180 0 1Financial wealth: 1050 k 0.183 0 0.387 0 1Financial wealth: 50100 k 0.232 0 0.422 0 1Financial wealth: 100150 k 0.201 0 0.401 0 1Financial wealth: 150250 k 0.175 0 0.380 0 1Financial wealth: 250500 k 0.157 0 0.364 0 1Financial wealth: >500 k 0.052 0 0.222 0 1Individual income (thousands euro) 49.947 31 67.933 0.2 822Female 0.306 0 0.461 0 1Age 54.827 57 12.313 25 89Years at school 12.381 13 3.905 0 20Retired 0.336 0 0.473 0 1Selfemployed 0.267 0 0.442 0 1Years at Unicredit: <1 0.011 0 0.103 0 1Years at Unicredit: 15 0.100 0 0.300 0 1Years at Unicredit: 610 0.187 0 0.390 0 1Years at Unicredit: 1120 0.236 0 0.425 0 1Years at Unicredit: >20 0.466 0 0.499 0 1North west 0.221 0 0.415 0 1North east 0.288 0 0.453 0 1Center 0.243 0 0.429 0 1SouthIslands 0.248 0 0.432 0 1
Variables in alternative specificationsFinancial Literacy_1 4.143 4 1.353 0 7Financial Literacy_2 4.530 5 1.417 0 7Trust in advisor_1 0.729 1 0.444 0 1Expected payoff of advice/delegate_1 0.194 0 0.395 0 1Expected payoff of advice/delegate_2 0.690 1 0.463 0 1
InstrumentsRegional Financial literacy (average) 1.577 1.498 0.335 0.781 1.961School performance 0.166 0 0.373 0 1Generalized trust_1 0.260 0 0.439 0 1Generalized trust_2 4.187 4 0.853 1 5
Source: UCS (2007)
24

Table 2. Correlation matrix of main regressorsThis table reports the correlation matrix of main regressors and instruments. Statistically signi�cant correlation
coe¢ cients (at 10% con�dence interval) are reported in bold.
(1) (2) (3) (4) (5) (6) (7) (8) (9) (10) (11) (12) (13) (14) (15)
Selfassessed financial knowledge (1) 1Financial Literacy (2) 0.330 1School performance (3) 0.149 0.134 1Regional Financial literacy (average) (4) 0.102 0.100 0.018 1Trust in advisor (5) 0.057 0.000 0.014 0.028 1Generalized trust_1 (6) 0.028 0.012 0.033 0.001 0.080 1Generalized trust_2 (7) 0.088 0.146 0.127 0.006 0.169 0.149 1Risk aversion (8) 0.296 0.105 0.073 0.013 0.104 0.019 0.054 1Expected payoff of advice/delegate (9) 0.143 0.118 0.030 0.020 0.090 0.030 0.094 0.082 1Experience (years) (10) 0.296 0.252 0.113 0.203 0.093 0.006 0.152 0.109 0.067 1Finance sector (11) 0.111 0.062 0.049 0.007 0.052 0.042 0.021 0.029 0.017 0.080 1Years at school (12) 0.288 0.188 0.264 0.118 0.013 0.086 0.162 0.176 0.053 0.072 0.079 1Individual income (log) (13) 0.245 0.124 0.092 0.016 0.032 0.066 0.034 0.142 0.033 0.166 0.054 0.250 1Age (14) 0.030 0.031 0.015 0.083 0.088 0.027 0.034 0.081 0.087 0.362 0.010 0.242 0.027 1Female (15) 0.212 0.119 0.002 0.011 0.094 0.005 0.004 0.143 0.007 0.139 0.063 0.029 0.222 0.010 1
Source: UCS (2007)
Table 3. Descriptive statistics on trust, �nancial literacy, self-assessed �nancial knowledge,and the demand for advice
Full sample
Percent Percent Mean Std.dev Mean Std.dev Mean Std.devDemand for adviceSelf 7.84 11.11 3.53 0.87 4.88 0.92 3.38 0.79Advice 48.39 68.55 4.02 0.72 4.95 1.24 3.10 0.75Delegate 14.36 20.34 4.39 0.67 4.56 1.34 2.68 0.82
Does not hold risky assets 29.41
Total 100 100# observations 1581
Selfassessedfinancial
knowledge
1116
Sample holding risky assets
Trust in advisorFinancial literacy
(testbased)
Source: UCS (2007)
25

Table 4. Demand for advice and trustThis table reports the marginal e¤ects on conditional probability of an ordered probit model with sample selection.
Column (1) reports results of the selection equation "Hold risky assets" while columns (2a)-(2c) report results of theoutcome equation "Self-Advice-Delegation" estimated as an Heckman ordered probit model with sample selection.The endogenous regressors Financial Literacy and Trust in advisor are instrumented by Regional Financial literacy,School performance, Generalized Trust (1) and Generalized Trust (2) (see Appendix A for details on the variables).Consistently with the results of the Wu-Hausman test, the Instrumental Variable regression is implemented in theselection equation. Tests of instruments�validity are reported at the bottom of the table. Heteroskedasticity robuststandard errors are reported in parentheses. ***, **, and * indicate signi�cance at the 1, 5, and 10% levels, respectively.
Hold risky assets Self Advice Delegation Hold risky assets Self Advice Delegation
(1) (2a) (2b) (2c) (3) (4a) (4b) (4c)
Trust in advisor 0.041 *** 0.089 *** 0.053 *** 0.142 *** 0.316 *** 0.085 *** 0.054 *** 0.139 ***( 0.011 ) ( 0.009 ) ( 0.009 ) ( 0.013 ) ( 0.063 ) ( 0.009 ) ( 0.009 ) ( 0.013 )
Financial Literacy 0.042 *** 0.001 0.001 0.002 0.224 *** 0.000 0.000 0.000( 0.007 ) ( 0.006 ) ( 0.004 ) ( 0.010 ) ( 0.057 ) ( 0.005 ) ( 0.003 ) ( 0.009 )
Selfassessed financial knowledge 0.030 ** 0.019 ** 0.011 * 0.030 ** 0.051 ** 0.021 ** 0.014 ** 0.035 **( 0.014 ) ( 0.009 ) ( 0.006 ) ( 0.015 ) ( 0.026 ) ( 0.009 ) ( 0.006 ) ( 0.015 )
Risk aversion 0.064 *** 0.061 ***( 0.015 ) ( 0.015 )*** *** *** *** *** *** *** *** *** ***
Demographics yes yes
Income and wealth yes yes
Macroarea yes yes
#obs 1581 1550Pseudo R2 0.22 0.24
Instrumented endogenous regressors: Financial l iteracyTrust in advisor
WuHausman test (χ2(2) pvalue) 0.00 0.12
Test of instruments' validity: Ftest : Financial l iteracy 7.84 pvalue 0.00 Trust in advisor 12.10 pvalue 0.00 HansenJ statistic : 0.58 χ2 (2) pvalue 0.75
Heckman ordered probit with selection Heckman ordered probit with selection (IV)Selection
yes
yes
Selection
yes
yes
1098
0.14
yes yes
1116
0.13
Notes: Demographics includes age, age squared , dummy for �nance sector, dummy for gender, dummy for self-employm ent, dummy for retirem ent status,
number of years of exp erience w ith �nancia l instrum ents, number of years at Unicred it Bank. Income and wealth includes the (log of ) ind iv idual incom e and
the �nancia l wealth brackets. Macroarea considers the North-West, the North-East, the Center and the South-Islands geographical areas.
Source: UCS (2007)..
Table 5. Sub-samples by control mechanism
secondopinion
monitoring nonesecond
opinion onlymonitoring
onlyboth total
subsample
69 227 454 32 190 37 7139.7% 31.8% 63.7% 4.5% 26.6% 5.2% 100%
53 173 321 24 144 29 51810.2% 33.4% 62.0% 4.6% 27.8% 5.6% 100%
advice/delegate
advice only
control mechanism
Source: UCS (2007).
26

Table 6. Control mechanism: Monitoring and Second opinion (Advice only)This table reports the marginal e¤ects on conditional probability of an ordered probit model with double sample
selection. Column (1) reports results of the 1st level selection equation "Hold risky assets" while columns (2) reportsresults of the 2nd level selection equation of seeking for �nancial counseling (either "Advice" or "Delegate"). "Riskaversion" is the exclusion restriction of the 1st level selection equation while "Expected payo¤ of advice/delegate"is the exclusion restriction of the 2nd level selection equation. The columns (3a)-(3c) report results of the outcomeequation "Monitoring", estimated as an Heckman ordered probit model with double sample selection. The column (4)reports results of the outcome equation "Second opinion", estimated as an Heckman probit model with double sampleselection. The reported results are relative to the sub-sample of investors asking advice and deciding autonomously(advice only). The endogenous regressors Financial Literacy and Trust in advisor are instrumented by RegionalFinancial literacy, School performance, Generalized Trust (1) and Generalized Trust (2) (see Appendix A for detailson the variables). Consistently with the results of the Wu-Hausman test reported, the Instrumental Variable regressionis implemented in the 1st level selection equation and for the "Monitoring" outcome equation. Tests of instruments�validity are reported at the bottom of the table. Heteroskedasticity robust standard errors are reported in parentheses.***, **, and * indicate signi�cance at the 1, 5, and 10% levels, respectively.
1st level selection 2nd level selectionHold risky assets Advice/Delegate
Rarely Sometimes Frequently
(1) (2) (3a) (3b) (3c) (4)
Trust in advisor 0.323 *** 0.148 *** 0.006 0.004 0.011 0.046( 0.064 ) ( 0.015 ) ( 0.105 ) ( 0.072 ) ( 0.178 ) ( 0.330 )
Financial Literacy 0.223 *** 0.019 0.108 * 0.074 * 0.182 * 0.100( 0.057 ) ( 0.012 ) ( 0.061 ) ( 0.041 ) ( 0.101 ) ( 0.074 )
Selfassessed financial knowledge 0.049 * 0.040 * 0.034 0.023 0.058 0.539 ***( 0.026 ) ( 0.021 ) ( 0.028 ) ( 0.020 ) ( 0.048 ) ( 0.156 )
Expected payoff of advice/delegate 0.036 0.070 **( 0.024 ) ( 0.031 )
Risk aversion 0.060 ***( 0.015 ) *** *** *** *** *** ***
Demographics yes yes yes yes
Income and wealth yes yes yes yes
Macroarea yes yes yes yes
#obs 1550 1098 510 510
Pseudo R2 0.24 0.12 0.10 0.18
Instrumented endogenous regressors: Financial l iteracyTrust in advisor
WuHausman test (χ2(2) pvalue) 0.00 0.39 0.08 0.12
Test of instruments' validity: Ftest : Financial l iteracy 7.75 pvalue 0.00 Trust in advisor 11.33 pvalue 0.00 HansenJ statistic : 0.71 χ2 (2) pvalue 0.70
outcome equation (Advice only)
Financial l iteracyTrust in advisor
Control mechanismMonitoring Second opinion
2.570.043.100.022.060.36
Notes: Demographics includes age, age squared , dummy for �nance sector, dummy for gender, dummy for self-employm ent, dummy for retirem ent status,
number of years of exp erience w ith �nancia l instrum ents, number of years at Unicred it Bank. Income and wealth includes the (log of ) ind iv idual incom e and
the �nancia l wealth brackets. Macroarea considers the North-West, the North-East, the Center and the South-Islands geographical areas.
Source: UCS (2007).
27

Table 6a. Control mechanism: Monitoring and Second opinion (Advice/Delegate)This table reports �ndings of the same analysis of Table 6, but relative to the overall sample (advice/delegate)
rather than to the subsample of those asking advice and deciding autonomously (advice only). Heteroskedasticity robuststandard errors are reported in parentheses. ***, **, and * indicate signi�cance at the 1, 5, and 10% levels, respectively.
1st level selection 2nd level selectionHold risky assets Advice/Delegate
Rarely Sometimes Frequently
(1) (2) (3a) (3b) (3c) (4)
Trust in advisor 0.323 *** 0.148 *** 0.012 0.007 0.019 0.214( 0.064 ) ( 0.015 ) ( 0.088 ) ( 0.055 ) ( 0.142 ) ( 0.276 )
Financial Literacy 0.223 *** 0.019 0.117 ** 0.073 ** 0.191 ** 0.000( 0.057 ) ( 0.012 ) ( 0.049 ) ( 0.032 ) ( 0.079 ) ( 0.066 )
Selfassessed financial knowledge 0.049 * 0.040 * 0.019 0.012 0.031 0.460 ***( 0.026 ) ( 0.021 ) ( 0.023 ) ( 0.014 ) ( 0.037 ) ( 0.133 )
Expected payoff of advice/delegate 0.036 0.070 **( 0.024 ) ( 0.031 )
Risk aversion 0.060 ***( 0.015 ) *** *** *** *** *** ***
Demographics yes yes yes yes
Income and wealth yes yes yes yes
Macroarea yes yes yes yes
#obs 1550 1098 704
Pseudo R2 0.24 0.12 0.09 0.17
Instrumented endogenous regressors : Financial l iteracyTrust in advisor
WuHausman test (χ2(2) pvalue) 0.00 0.39 0.08 0.12
Test of instruments' validity: Ftest : Financial l iteracy 7.75 2.57 pvalue 0.00 0.04 Trust in advisor 11.33 3.10 pvalue 0.00 0.02 HansenJ statistic : 0.71 2.06 χ2 (2) pvalue 0.70 0.36
Financial l iteracyTrust in advisor
Monitoring
outcome equation (Advice/Delegate)Control mechanism
704
Second opinion
Notes: Demographics includes age, age squared , dummy for �nance sector, dummy for gender, dummy for self-employm ent, dummy for retirem ent status,
number of years of exp erience w ith �nancia l instrum ents, number of years at Unicred it Bank. Income and wealth includes the (log of ) ind iv idual incom e and
the �nancia l wealth brackets. Macroarea considers the North-West, the North-East, the Center and the South-Islands geographical areas.
Source: UCS (2007).
28
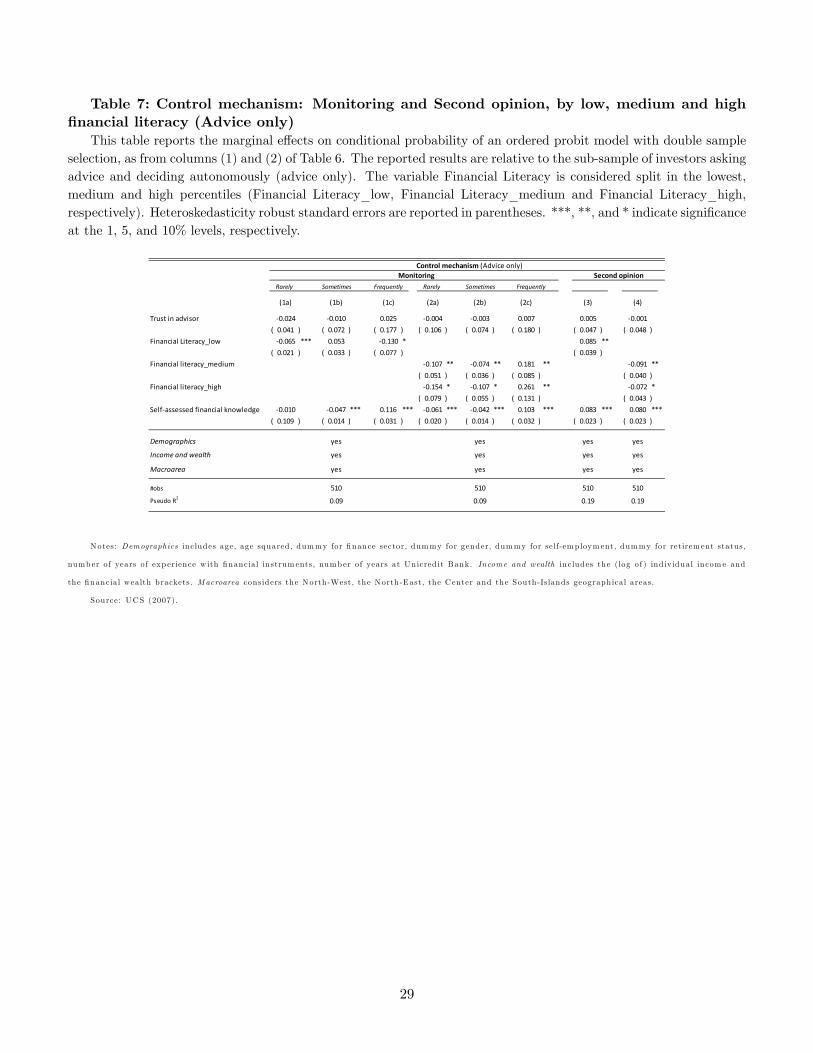
Table 7: Control mechanism: Monitoring and Second opinion, by low, medium and high�nancial literacy (Advice only)
This table reports the marginal e¤ects on conditional probability of an ordered probit model with double sampleselection, as from columns (1) and (2) of Table 6. The reported results are relative to the sub-sample of investors askingadvice and deciding autonomously (advice only). The variable Financial Literacy is considered split in the lowest,medium and high percentiles (Financial Literacy_low, Financial Literacy_medium and Financial Literacy_high,respectively). Heteroskedasticity robust standard errors are reported in parentheses. ***, **, and * indicate signi�canceat the 1, 5, and 10% levels, respectively.
Rarely Sometimes Frequently Rarely Sometimes Frequently
(1a) (1b) (1c) (2a) (2b) (2c) (3) (4)
Trust in advisor 0.024 0.010 0.025 0.004 0.003 0.007 0.005 0.001( 0.041 ) ( 0.072 ) ( 0.177 ) ( 0.106 ) ( 0.074 ) ( 0.180 ) ( 0.047 ) ( 0.048 )
Financial Literacy_low 0.065 *** 0.053 0.130 * 0.085 **( 0.021 ) ( 0.033 ) ( 0.077 ) ( 0.039 )
Financial literacy_medium 0.107 ** 0.074 ** 0.181 ** 0.091 **( 0.051 ) ( 0.036 ) ( 0.085 ) ( 0.040 )
Financial literacy_high 0.154 * 0.107 * 0.261 ** 0.072 *( 0.079 ) ( 0.055 ) ( 0.131 ) ( 0.043 )
Selfassessed financial knowledge 0.010 0.047 *** 0.116 *** 0.061 *** 0.042 *** 0.103 *** 0.083 *** 0.080 ***( 0.109 ) ( 0.014 ) ( 0.031 ) ( 0.020 ) ( 0.014 ) ( 0.032 ) ( 0.023 ) ( 0.023 )*** *** *** *** *** *** *** ***
Demographics yes yes yes yes
Income and wealth yes yes yes yes
Macroarea yes yes yes yes
#obs 510 510 510 510
Pseudo R2 0.09 0.09 0.19 0.19
Control mechanism (Advice only)Monitoring Second opinion
Notes: Demographics includes age, age squared , dummy for �nance sector, dummy for gender, dummy for self-employm ent, dummy for retirem ent status,
number of years of exp erience w ith �nancia l instrum ents, number of years at Unicred it Bank. Income and wealth includes the (log of ) ind iv idual incom e and
the �nancia l wealth brackets. Macroarea considers the North-West, the North-East, the Center and the South-Islands geographical areas.
Source: UCS (2007).
29

Table 7a. Control mechanism: Monitoring and Second opinion, by low, medium and high�nancial literacy (Advice/Delegate)
This table reports �ndings of the same analysis of Table 7, but relative to the overall sample (advice/delegate)rather than to the subsample of those asking advice and deciding autonomously (advice only). Heteroskedasticity robuststandard errors are reported in parentheses. ***, **, and * indicate signi�cance at the 1, 5, and 10% levels, respectively.
Rarely Sometimes Frequently Rarely Sometimes Frequently
(1a) (1b) (1c) (2a) (2b) (2c) (3) (4)
Trust in advisor 0.017 0.011 0.028 0.008 0.005 0.013 0.024 0.036( 0.087 ) ( 0.055 ) ( 0.142 ) ( 0.087 ) ( 0.055 ) ( 0.143 ) ( 0.037 ) ( 0.038 )
Financial Literacy_low 0.091 ** 0.058 ** 0.149 ** 0.028( 0.037 ) ( 0.025 ) ( 0.061 ) ( 0.032 )
Financial literacy_medium 0.122 *** 0.077 *** 0.200 *** 0.037( 0.042 ) ( 0.028 ) ( 0.068 ) ( 0.033 )
Financial literacy_high 0.173 *** 0.109 *** 0.282 *** 0.008( 0.064 ) ( 0.041 ) ( 0.102 ) ( 0.036 )
Selfassessed financial knowledge 0.056 *** 0.035 *** 0.091 *** 0.048 *** 0.031 *** 0.079 *** 0.069 *** 0.065 ***( 0.016 ) ( 0.010 ) ( 0.025 ) ( 0.016 ) ( 0.010 ) ( 0.025 ) ( 0.019 ) ( 0.019 )*** *** *** *** *** *** *** ***
Demographics yes yes yes yes
Income and wealth yes yes yes yes
Macroarea yes yes yes yes
#obs 704 704
Pseudo R2 0.09 0.09 0.17 0.18
Second opinionControl mechanism (Advice/Delegate)
704 704
Monitoring
Notes: Demographics includes age, age squared , dummy for �nance sector, dummy for gender, dummy for self-employm ent, dummy for retirem ent status,
number of years of exp erience w ith �nancia l instrum ents, number of years at Unicred it Bank. Income and wealth includes the (log of ) ind iv idual incom e and
the �nancia l wealth brackets. Macroarea considers the North-West, the North-East, the Center and the South-Islands geographical areas.
Source: UCS (2007).
30

Table 8: No control mechanism or both (Advice only)This table reports the marginal e¤ects on conditional probability of a probit model with double sample selection,
as from columns (1) and (2) of Table 6. The variable Financial Literacy is considered split in the lowest, mediumand high percentiles (Financial Literacy_low, Financial Literacy_medium and Financial Literacy_high, respectively).The reported results are relative to the sub-sample of investors asking advice and deciding autonomously (advice only),and investigates the characteristics predicting the probability of not exerting any control (columns (1) and (2)) and ofadopting both mechanisms of control (columns (3) and (4)). Heteroskedasticity robust standard errors are reportedin parentheses. ***, **, and * indicate signi�cance at the 1, 5, and 10% levels, respectively.
(1) (2) (3) (4)
Trust in advisor 0.170 0.175 0.008 0.024( 0.215 ) ( 0.216 ) ( 0.121 ) ( 0.158 )
Financial Literacy_low 0.117 0.023( 0.090 ) ( 0.058 )
Financial literacy_medium 0.133 0.051( 0.107 ) ( 0.105 )
Financial literacy_high 0.157 0.154( 0.168 ) ( 0.133 )
Selfassessed financial knowledge 0.134 *** 0.130 *** 0.038 0.014( 0.037 ) ( 0.039 ) ( 0.025 ) ( 0.029 )*** *** *** ***
Demographics yes yes yes yes
Income and wealth yes yes yes yes
Macroarea yes yes yes yes
#obs 510 510 510 510
Pseudo R2 0.14 0.14 0.28 0.32
Control mechanismnone both
Notes: Demographics includes age, age squared , dummy for �nance sector, dummy for gender, dummy for self-employm ent, dummy for retirem ent status,
number of years of exp erience w ith �nancia l instrum ents, number of years at Unicred it Bank. Income and wealth includes the (log of ) ind iv idual incom e and
the �nancia l wealth brackets. Macroarea considers the North-West, the North-East, the Center and the South-Islands geographical areas.
Source: UCS (2007).
31

Table 9: Alternative control mechanisms: Monitoring and Second opinion, by low, mediumand high �nancial literacy (Advice only)
This table reports the marginal e¤ects on conditional probability of an ordered probit model with double sampleselection, as from columns (1) and (2) of Table 6. The variable Financial Literacy is considered split in the lowest,medium and high percentiles (Financial Literacy_low, Financial Literacy_medium and Financial Literacy_high,respectively). The reported results are relative to the sub-sample of investors asking advice and deciding autonomously(advice only) and excludes investors who choose both mechanisms of control. Heteroskedasticity robust standard errorsare reported in parentheses. ***, **, and * indicate signi�cance at the 1, 5, and 10% levels, respectively.
Rarely Sometimes Frequently Rarely Sometimes Frequently
(1a) (1b) (1c) (2a) (2b) (2c) (3) (4)
Trust in advisor 0.015 0.006 0.016 0.003 0.002 0.005 0.001 0.028( 0.104 ) ( 0.062 ) ( 0.170 ) ( 0.111 ) ( 0.063 ) ( 0.173 ) ( 0.038 ) ( 0.473 )
Financial Literacy_low 0.077 * 0.051 * 0.141 * 0.063 **( 0.046 ) ( 0.030 ) ( 0.076 ) ( 0.030 )
Financial literacy_medium 0.109 ** 0.061 * 0.170 ** 0.761 **( 0.055 ) ( 0.034 ) ( 0.086 ) ( 0.365 )
Financial literacy_high 0.138 0.078 0.216 0.790 *( 0.087 ) ( 0.051 ) ( 0.135 ) ( 0.412 )
Selfassessed financial knowledge 0.068 *** 0.037 *** 0.101 *** 0.061 *** 0.034 *** 0.095 *** 0.059 *** 0.714 ***( 0.020 ) ( 0.013 ) ( 0.031 ) ( 0.022 ) ( 0.013 ) ( 0.032 ) ( 0.019 ) ( 0.218 )*** *** *** *** *** *** *** ***
Demographics yes yes yes yes
Income and wealth yes yes yes yes
Macroarea yes yes yes yes
#obs 481 481 481 481
Pseudo R2 0.07 0.07 0.25 0.25
Alternative control mechanismMonitoring only Second opinion only
Notes: Demographics includes age, age squared , dummy for �nance sector, dummy for gender, dummy for self-employm ent, dummy for retirem ent status,
number of years of exp erience w ith �nancia l instrum ents, number of years at Unicred it Bank. Income and wealth includes the (log of ) ind iv idual incom e and
the �nancia l wealth brackets. Macroarea considers the North-West, the North-East, the Center and the South-Islands geographical areas.
Source: UCS (2007).
32

Table 10. Further tests on the measures of control: Monitoring/1 (Advice only)This table reports the marginal e¤ects on conditional probability of an ordered probit model with double sample
selection, as from columns (1) and (2) of Table 6. The reported results are relative to the sub-sample of investors askingadvice and deciding autonomously (advice only). In columns (1a) to (1c), we add the frequency of trading variableto the regressors predicting the probability of "Monitoring". In columns (2a) to (2c) we check how our regressorspredict the frequency of trading. Heteroskedasticity robust standard errors are reported in parentheses. ***, **, and* indicate signi�cance at the 1, 5, and 10% levels, respectively.
Frequency of tradingRarely Sometimes Frequently Rarely Sometimes Frequently
(1a) (1b) (1c) (2a) (2b) (2c)
Trust in advisor 0.010 0.006 0.016 0.045 0.016 0.030( 0.101 ) ( 0.064 ) ( 0.166 ) ( 0.191 ) ( 0.066 ) ( 0.125 )
Financial Literacy (FL) 0.102 * 0.064 * 0.166 * 0.025 0.009 0.016( 0.056 ) ( 0.036 ) ( 0.090 ) ( 0.100 ) ( 0.035 ) ( 0.066 )
Frequency trading 0.134 *** 0.085 *** 0.218 ***( 0.021 ) ( 0.012 ) ( 0.023 )
Selfassessed financial knowledge 0.007 0.005 0.012 0.136 *** 0.047 *** 0.088 ***( 0.026 ) ( 0.017 ) ( 0.043 ) ( 0.047 ) ( 0.018 ) ( 0.032 )*** *** *** *** *** ***
Demographics yes yes
Income and wealth yes yes
Macroarea yes yes
#obs 510
Pseudo R2 0.17 0.07
Monitoring
510
Notes: Demographics includes age, age squared , dummy for �nance sector, dummy for gender, dummy for self-employm ent, dummy for retirem ent status,
number of years of exp erience w ith �nancia l instrum ents, number of years at Unicred it Bank. Income and wealth includes the (log of ) ind iv idual incom e and
the �nancia l wealth brackets. Macroarea considers the North-West, the North-East, the Center and the South-Islands geographical areas.
Source: UCS (2007).
33
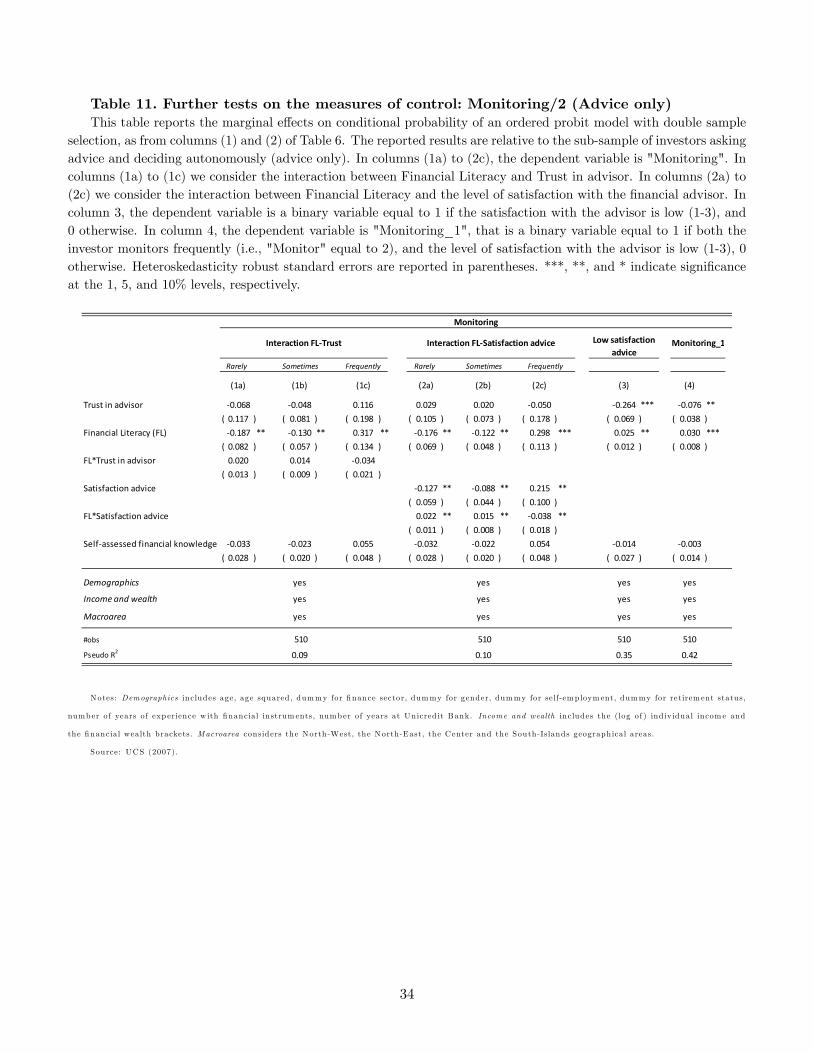
Table 11. Further tests on the measures of control: Monitoring/2 (Advice only)This table reports the marginal e¤ects on conditional probability of an ordered probit model with double sample
selection, as from columns (1) and (2) of Table 6. The reported results are relative to the sub-sample of investors askingadvice and deciding autonomously (advice only). In columns (1a) to (2c), the dependent variable is "Monitoring". Incolumns (1a) to (1c) we consider the interaction between Financial Literacy and Trust in advisor. In columns (2a) to(2c) we consider the interaction between Financial Literacy and the level of satisfaction with the �nancial advisor. Incolumn 3, the dependent variable is a binary variable equal to 1 if the satisfaction with the advisor is low (1-3), and0 otherwise. In column 4, the dependent variable is "Monitoring_1", that is a binary variable equal to 1 if both theinvestor monitors frequently (i.e., "Monitor" equal to 2), and the level of satisfaction with the advisor is low (1-3), 0otherwise. Heteroskedasticity robust standard errors are reported in parentheses. ***, **, and * indicate signi�canceat the 1, 5, and 10% levels, respectively.
Rarely Sometimes Frequently Rarely Sometimes Frequently
(1a) (1b) (1c) (2a) (2b) (2c) (3) (4)
Trust in advisor 0.068 0.048 0.116 0.029 0.020 0.050 0.264 *** 0.076 **( 0.117 ) ( 0.081 ) ( 0.198 ) ( 0.105 ) ( 0.073 ) ( 0.178 ) ( 0.069 ) ( 0.038 )
Financial Literacy (FL) 0.187 ** 0.130 ** 0.317 ** 0.176 ** 0.122 ** 0.298 *** 0.025 ** 0.030 ***( 0.082 ) ( 0.057 ) ( 0.134 ) ( 0.069 ) ( 0.048 ) ( 0.113 ) ( 0.012 ) ( 0.008 )
FL*Trust in advisor 0.020 0.014 0.034( 0.013 ) ( 0.009 ) ( 0.021 )
Satisfaction advice 0.127 ** 0.088 ** 0.215 **( 0.059 ) ( 0.044 ) ( 0.100 )
FL*Satisfaction advice 0.022 ** 0.015 ** 0.038 **( 0.011 ) ( 0.008 ) ( 0.018 )
Selfassessed financial knowledge 0.033 0.023 0.055 0.032 0.022 0.054 0.014 0.003( 0.028 ) ( 0.020 ) ( 0.048 ) ( 0.028 ) ( 0.020 ) ( 0.048 ) ( 0.027 ) ( 0.014 )*** *** *** *** *** *** *** ***
Demographics yes yes yes yes
Income and wealth yes yes yes yes
Macroarea yes yes yes yes
#obs 510 510
Pseudo R2 0.09 0.10 0.35 0.42
510 510
Monitoring
Interaction FLSatisfaction adviceInteraction FLTrust Monitoring_1Low satisfactionadvice
Notes: Demographics includes age, age squared , dummy for �nance sector, dummy for gender, dummy for self-employm ent, dummy for retirem ent status,
number of years of exp erience w ith �nancia l instrum ents, number of years at Unicred it Bank. Income and wealth includes the (log of ) ind iv idual incom e and
the �nancia l wealth brackets. Macroarea considers the North-West, the North-East, the Center and the South-Islands geographical areas.
Source: UCS (2007).
34

Table 12. Further tests on the measures of control: Second opinion (Advice only)This table reports the marginal e¤ects on conditional probability of a probit model with double sample selection,
as from columns (1) and (2) of Table 6. The reported results are relative to the sub-sample of investors asking adviceand deciding autonomously (advice only) and who have relationships with more than one bank/intermediary. Incolumns (1a) and (1b), the dependent variable is "Second opinion" analyzed in this restricted sample. In columns (2a)and (2b), the dependent variable is "Second opinion_1", that is a binary variable equal to 1 if the respondent choosesmultiple banks/intermediaries to enforce competition. Columns (#a) refer to clients directly having relationships withother banks/intermediaries (beyond Unicredit Bank). Columns (#b) refer to clients whose relatives have relationshipswith other banks/intermediaries (beyond Unicredit Bank). Heteroskedasticity robust standard errors are reported inparentheses. ***, **, and * indicate signi�cance at the 1, 5, and 10% levels, respectively.
Respondent Relatives Respondent Relatives
(1a) (1b) (2a) (2b)
Trust in advisor 0.123 0.054 0.047 0.047( 0.096 ) ( 0.077 ) ( 0.118 ) ( 0.118 )
Financial Literacy 0.040 * 0.031 * 0.065 *** 0.065 ***( 0.023 ) ( 0.019 ) ( 0.025 ) ( 0.025 )
Selfassessed financial knowledge 0.119 ** 0.119 *** 0.005 0.005( 0.048 ) ( 0.038 ) ( 0.053 ) ( 0.053 )
Experience 0.003 0.001 0.003 0.003( 0.003 ) ( 0.002 ) ( 0.003 ) ( 0.003 )
Finance sector 0.016 0.178 0.131 0.131( 0.172 ) ( 0.147 ) ( 0.144 ) ( 0.144 )*** *** *** ***
Demographics yes yes yes yes
Income and wealth yes yes yes yes
Macroarea yes yes yes yes
#obs 158 248 158 158
Pseudo R2 0.24 0.23 0.14 0.14
sample of clients with multiple banks/intermediaries
Second opinionSecond opinion Second opinion_1
Notes: Demographics includes age, age squared , dummy for �nance sector, dummy for gender, dummy for self-employm ent, dummy for retirem ent status,
number of years of exp erience w ith �nancia l instrum ents, number of years at Unicred it Bank. Income and wealth includes the (log of ) ind iv idual incom e and
the �nancia l wealth brackets. Macroarea considers the North-West, the North-East, the Center and the South-Islands geographical areas.
Source: UCS (2007).
35
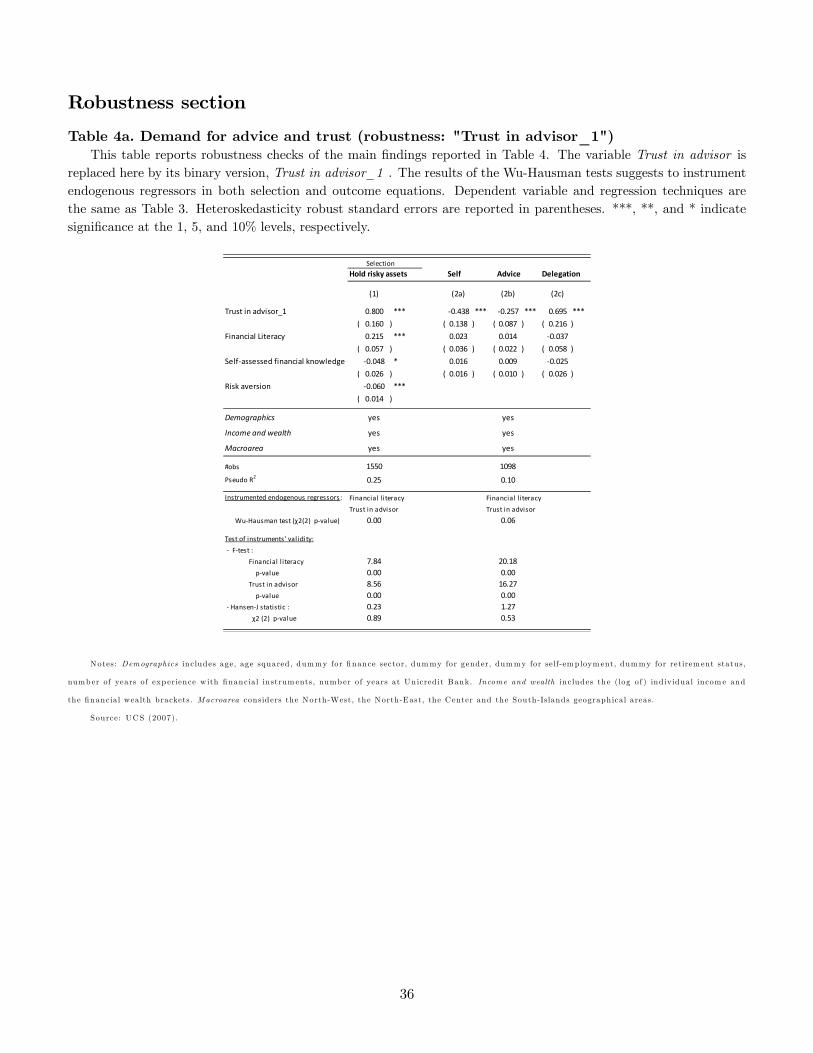
Robustness section
Table 4a. Demand for advice and trust (robustness: "Trust in advisor_1")This table reports robustness checks of the main �ndings reported in Table 4. The variable Trust in advisor is
replaced here by its binary version, Trust in advisor_1 . The results of the Wu-Hausman tests suggests to instrumentendogenous regressors in both selection and outcome equations. Dependent variable and regression techniques arethe same as Table 3. Heteroskedasticity robust standard errors are reported in parentheses. ***, **, and * indicatesigni�cance at the 1, 5, and 10% levels, respectively.
Hold risky assets Self Advice Delegation
(1) (2a) (2b) (2c)
Trust in advisor_1 0.800 *** 0.438 *** 0.257 *** 0.695 ***( 0.160 ) ( 0.138 ) ( 0.087 ) ( 0.216 )
Financial Literacy 0.215 *** 0.023 0.014 0.037( 0.057 ) ( 0.036 ) ( 0.022 ) ( 0.058 )
Selfassessed financial knowledge 0.048 * 0.016 0.009 0.025( 0.026 ) ( 0.016 ) ( 0.010 ) ( 0.026 )
Risk aversion 0.060 ***( 0.014 ) *** *** *** *** ***
Demographics yes
Income and wealth yes
Macroarea yes
#obs 1550Pseudo R2 0.25
Instrumented endogenous regressors: Financial l iteracy Financial l iteracyTrust in advisor Trust in advisor
WuHausman test (χ2(2) pvalue) 0.00 0.06
Test of instruments' validity: Ftest : Financial l iteracy 7.84 20.18 pvalue 0.00 0.00 Trust in advisor 8.56 16.27 pvalue 0.00 0.00 HansenJ statistic : 0.23 1.27 χ2 (2) pvalue 0.89 0.53
Selection
yes
yes
1098
0.10
yes
Notes: Demographics includes age, age squared , dummy for �nance sector, dummy for gender, dummy for self-employm ent, dummy for retirem ent status,
number of years of exp erience w ith �nancia l instrum ents, number of years at Unicred it Bank. Income and wealth includes the (log of ) ind iv idual incom e and
the �nancia l wealth brackets. Macroarea considers the North-West, the North-East, the Center and the South-Islands geographical areas.
Source: UCS (2007).
36

Table 5b. Control mechanism: Monitoring and Second opinion (Advice only). Robustness:Financial Literacy_1
This table reports robustness checks of the main �ndings reported in Table 6. The variable Financial Literacyis replaced by Financial Literacy_1 (see Appendix A for details on the construction of the variable). Dependentvariable and regression techniques are the same as Table 5. Heteroskedasticity robust standard errors are reported inparentheses. ***, **, and * indicate signi�cance at the 1, 5, and 10% levels, respectively.
1st level selection 2nd level selectionHold risky assets Advice/Delegate
Rarely Sometimes Frequently
(1) (2) (3a) (3b) (3c) (4)
Trust in advisor 0.290 *** 0.149 *** 0.026 0.018 0.044 0.002( 0.068 ) ( 0.015 ) ( 0.107 ) ( 0.074 ) ( 0.181 ) ( 0.049 )
Financial Literacy_1 0.248 *** 0.013 0.113 * 0.077 * 0.190 * 0.020 *( 0.062 ) ( 0.013 ) ( 0.068 ) ( 0.046 ) ( 0.112 ) ( 0.011 )
Selfassessed financial knowledge 0.046 * 0.036 * 0.037 0.026 0.063 0.077 ***( 0.025 ) ( 0.021 ) ( 0.027 ) ( 0.019 ) ( 0.046 ) ( 0.022 )
Expected payoff of advice/delegate 0.037 0.069 **( 0.024 ) ( 0.031 )
Risk aversion 0.060 ***( 0.015 ) *** *** *** *** *** ***
Demographics yes yes yes yes
Income and wealth yes yes yes yes
Macroarea yes yes yes yes
#obs 1550 1098 510 510
Pseudo R2 0.24 0.12 0.09 0.19
Instrumented endogenous regressors: Financial l iteracyTrust in advisor
WuHausman test (χ2(2) pvalue) 0.00 0.41 0.09 0.14
Test of instruments' validity: Ftest : Financial l iteracy 8.15 pvalue 0.00 Trust in advisor 11.33 pvalue 0.00 HansenJ statistic : 0.28 χ2 (2) pvalue 0.87
0.39
outcome equation (Advice only)Monitoring Second opinion
Financial l iteracy Trust in advisor
2.490.043.570.011.89
Notes: Demographics includes age, age squared , dummy for �nance sector, dummy for gender, dummy for self-employm ent, dummy for retirem ent status,
number of years of exp erience w ith �nancia l instrum ents, number of years at Unicred it Bank. Income and wealth includes the (log of ) ind iv idual incom e and
the �nancia l wealth brackets. Macroarea considers the North-West, the North-East, the Center and the South-Islands geographical areas.
Source: UCS (2007).
37

Table 5c. Control mechanism: Monitoring and Second opinion (Advice only). Robustness:Financial Literacy_2
This table reports robustness checks of the main �ndings reported in Table 6. The variable Financial Literacyis replaced by Financial Literacy_2 (see Appendix A for details on the construction of the variable). Dependentvariable and regression techniques are the same as Table 5. Heteroskedasticity robust standard errors are reported inparentheses. ***, **, and * indicate signi�cance at the 1, 5, and 10% levels, respectively.
1st level selection 2nd level selectionHold risky assets Advice/Delegate
Rarely Sometimes Frequently
(1) (2) (3a) (3b) (3c) (4)
Trust in advisor 0.268 *** 0.451 *** 0.063 0.043 0.106 0.009( 0.074 ) ( 0.052 ) ( 0.111 ) ( 0.076 ) ( 0.187 ) ( 0.048 )
Financial Literacy_2 0.292 *** 0.075 * 0.187 ** 0.128 ** 0.316 ** 0.013( 0.082 ) ( 0.039 ) ( 0.086 ) ( 0.058 ) ( 0.140 ) ( 0.012 )
Selfassessed financial knowledge 0.078 ** 0.119 * 0.000 0.000 0.001 0.079 ***( 0.036 ) ( 0.064 ) ( 0.036 ) ( 0.024 ) ( 0.060 ) ( 0.023 )
Expected payoff of advice/delegate 0.046 * 0.212 **( 0.024 ) ( 0.096 )
Risk aversion 0.060 ***( 0.015 ) *** *** *** *** *** ***
Demographics yes yes yes yes
Income and wealth yes yes yes yes
Macroarea yes yes yes yes
#obs 1550 1098 510 510
Pseudo R2 0.24 0.12 0.09 0.18
Instrumented endogenous regressors: Financial l iteracyTrust in advisor
WuHausman test (χ2(2) pvalue) 0.00 0.41 0.05 0.13
Test of instruments' validity: Ftest : Financial l iteracy 6.76 pvalue 0.00 Trust in advisor 11.33 pvalue 0.00 HansenJ statistic : 0.50 χ2 (2) pvalue 0.78
2.49
outcome equation (Advice only)Monitoring Second opinion
Financial l iteracy Trust in advisor
0.043.460.013.280.19
Notes: Demographics includes age, age squared , dummy for �nance sector, dummy for gender, dummy for self-employm ent, dummy for retirem ent status,
number of years of exp erience w ith �nancia l instrum ents, number of years at Unicred it Bank. Income and wealth includes the (log of ) ind iv idual incom e and
the �nancia l wealth brackets. Macroarea considers the North-West, the North-East, the Center and the South-Islands geographical areas.
Source: UCS (2007).
38
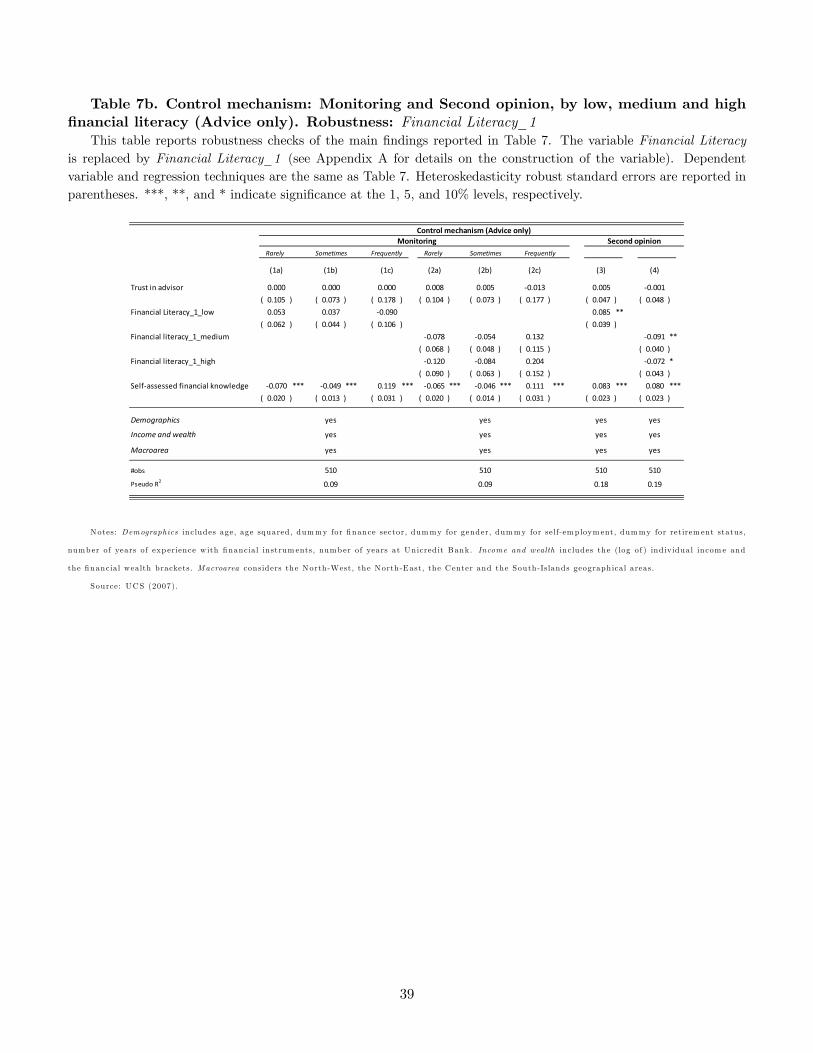
Table 7b. Control mechanism: Monitoring and Second opinion, by low, medium and high�nancial literacy (Advice only). Robustness: Financial Literacy_1
This table reports robustness checks of the main �ndings reported in Table 7. The variable Financial Literacyis replaced by Financial Literacy_1 (see Appendix A for details on the construction of the variable). Dependentvariable and regression techniques are the same as Table 7. Heteroskedasticity robust standard errors are reported inparentheses. ***, **, and * indicate signi�cance at the 1, 5, and 10% levels, respectively.
Rarely Sometimes Frequently Rarely Sometimes Frequently
(1a) (1b) (1c) (2a) (2b) (2c) (3) (4)
Trust in advisor 0.000 0.000 0.000 0.008 0.005 0.013 0.005 0.001( 0.105 ) ( 0.073 ) ( 0.178 ) ( 0.104 ) ( 0.073 ) ( 0.177 ) ( 0.047 ) ( 0.048 )
Financial Literacy_1_low 0.053 0.037 0.090 0.085 **( 0.062 ) ( 0.044 ) ( 0.106 ) ( 0.039 )
Financial literacy_1_medium 0.078 0.054 0.132 0.091 **( 0.068 ) ( 0.048 ) ( 0.115 ) ( 0.040 )
Financial literacy_1_high 0.120 0.084 0.204 0.072 *( 0.090 ) ( 0.063 ) ( 0.152 ) ( 0.043 )
Selfassessed financial knowledge 0.070 *** 0.049 *** 0.119 *** 0.065 *** 0.046 *** 0.111 *** 0.083 *** 0.080 ***( 0.020 ) ( 0.013 ) ( 0.031 ) ( 0.020 ) ( 0.014 ) ( 0.031 ) ( 0.023 ) ( 0.023 )*** *** *** *** *** *** *** ***
Demographics yes yes yes yes
Income and wealth yes yes yes yes
Macroarea yes yes yes yes
#obs 510 510 510 510
Pseudo R2 0.09 0.09 0.18 0.19
Control mechanism (Advice only)Monitoring Second opinion
Notes: Demographics includes age, age squared , dummy for �nance sector, dummy for gender, dummy for self-employm ent, dummy for retirem ent status,
number of years of exp erience w ith �nancia l instrum ents, number of years at Unicred it Bank. Income and wealth includes the (log of ) ind iv idual incom e and
the �nancia l wealth brackets. Macroarea considers the North-West, the North-East, the Center and the South-Islands geographical areas.
Source: UCS (2007).
39

Table 7c. Control mechanism: Monitoring and Second opinion, by low, medium and high�nancial literacy (Advice only). Robustness: Financial Literacy_2
This table reports robustness checks of the main �ndings reported in Table 7. The variable Financial Literacyis replaced by Financial Literacy_2 (see Appendix A for details on the construction of the variable). Dependentvariable and regression techniques are the same as Table 7. Heteroskedasticity robust standard errors are reported inparentheses. ***, **, and * indicate signi�cance at the 1, 5, and 10% levels, respectively.
Rarely Sometimes Frequently Rarely Sometimes Frequently
(1a) (1b) (1c) (2a) (2b) (2c) (3) (4)
Trust in advisor 0.003 0.002 0.004 0.028 0.020 0.048 0.005 0.001( 0.106 ) ( 0.074 ) ( 0.180 ) ( 0.106 ) ( 0.073 ) ( 0.179 ) ( 0.047 ) ( 0.048 )
Financial Literacy_2_low 0.056 0.039 0.096 0.085 **( 0.044 ) ( 0.031 ) ( 0.075 ) ( 0.039 )
Financial literacy_2_medium 0.122 ** 0.084 ** 0.206 ** 0.091 **( 0.052 ) ( 0.036 ) ( 0.086 ) ( 0.040 )
Financial literacy_2_high 0.219 *** 0.152 *** 0.371 *** 0.072 *( 0.082 ) ( 0.055 ) ( 0.132 ) ( 0.043 )
Selfassessed financial knowledge 0.068 *** 0.047 *** 0.115 *** 0.051 *** 0.035 *** 0.086 *** 0.083 *** 0.080 ***( 0.020 ) ( 0.013 ) ( 0.031 ) ( 0.019 ) ( 0.013 ) ( 0.032 ) ( 0.023 ) ( 0.023 )*** *** *** *** *** *** *** ***
Demographics yes yes yes yes
Income and wealth yes yes yes yes
Macroarea yes yes yes yes
#obs 510 510 510 510
Pseudo R2 0.09 0.09 0.18 0.18
Control mechanism (Advice only)Monitoring Second opinion
Notes: Demographics includes age, age squared , dummy for �nance sector, dummy for gender, dummy for self-employm ent, dummy for retirem ent status,
number of years of exp erience w ith �nancia l instrum ents, number of years at Unicred it Bank. Income and wealth includes the (log of ) ind iv idual incom e and
the �nancia l wealth brackets. Macroarea considers the North-West, the North-East, the Center and the South-Islands geographical areas.
Source: UCS (2007).
40

Figures
Figure 1. Financial literacy distributionThis �gure represents the distribution of the variable Financial Literacy which captures the number of correct
answers to eight questions (see Appendix A for details on the construction of the variable).
010
2030
Per
cent
0 2 4 6 8Financial Literacy
Source: UCS (2007)
Figure 1a. Financial literacy distribution (robustness: "Financial Literacy_1")This �gure represents the distribution of the variable Financial Literacy_1 which captures the number of correct
answers to seven questions (see Appendix A for details on the construction of the variable).
010
2030
Per
cent
0 2 4 6 8Financial Literacy_1
Figure 1b. Financial literacy distribution (robustness: "Financial Literacy_2")This �gure represents the distribution of the variable Financial Literacy_2 which captures the number of correct
answers to seven questions (see Appendix A for details on the construction of the variable).
010
2030
Per
cent
0 2 4 6 8Financial Literacy_2
Source: UCS (2007)
41
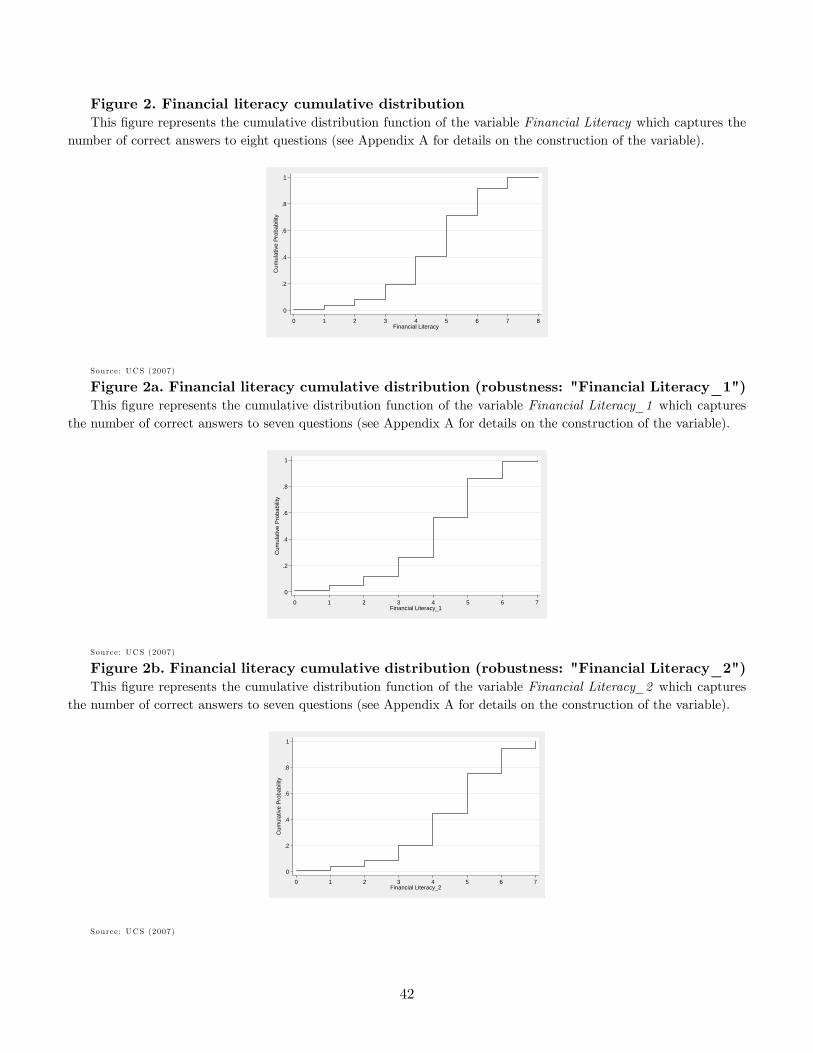
Figure 2. Financial literacy cumulative distributionThis �gure represents the cumulative distribution function of the variable Financial Literacy which captures the
number of correct answers to eight questions (see Appendix A for details on the construction of the variable).
0
.2
.4
.6
.8
1
Cum
ulat
ive
Prob
abilit
y
0 1 2 3 4 5 6 7 8Financial Literacy
Source: UCS (2007)
Figure 2a. Financial literacy cumulative distribution (robustness: "Financial Literacy_1")This �gure represents the cumulative distribution function of the variable Financial Literacy_1 which captures
the number of correct answers to seven questions (see Appendix A for details on the construction of the variable).
0
.2
.4
.6
.8
1
Cum
ulat
ive
Prob
abilit
y
0 1 2 3 4 5 6 7Financial Literacy_1
Source: UCS (2007)
Figure 2b. Financial literacy cumulative distribution (robustness: "Financial Literacy_2")This �gure represents the cumulative distribution function of the variable Financial Literacy_2 which captures
the number of correct answers to seven questions (see Appendix A for details on the construction of the variable).
0
.2
.4
.6
.8
1
Cum
ulat
ive
Pro
babi
lity
0 1 2 3 4 5 6 7Financial Literacy_2
Source: UCS (2007)
42
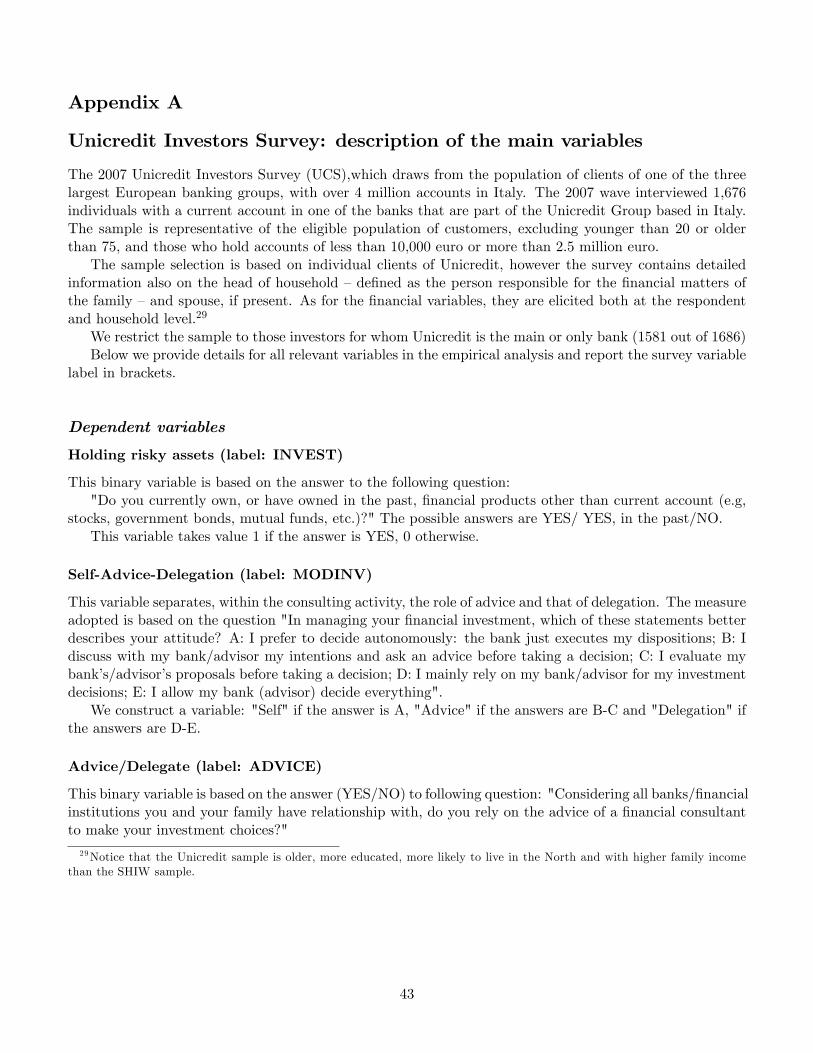
Appendix A
Unicredit Investors Survey: description of the main variables
The 2007 Unicredit Investors Survey (UCS),which draws from the population of clients of one of the threelargest European banking groups, with over 4 million accounts in Italy. The 2007 wave interviewed 1,676individuals with a current account in one of the banks that are part of the Unicredit Group based in Italy.The sample is representative of the eligible population of customers, excluding younger than 20 or olderthan 75, and those who hold accounts of less than 10,000 euro or more than 2.5 million euro.
The sample selection is based on individual clients of Unicredit, however the survey contains detailedinformation also on the head of household �de�ned as the person responsible for the �nancial matters ofthe family �and spouse, if present. As for the �nancial variables, they are elicited both at the respondentand household level.29
We restrict the sample to those investors for whom Unicredit is the main or only bank (1581 out of 1686)Below we provide details for all relevant variables in the empirical analysis and report the survey variable
label in brackets.
Dependent variables
Holding risky assets (label: INVEST)
This binary variable is based on the answer to the following question:"Do you currently own, or have owned in the past, �nancial products other than current account (e.g,
stocks, government bonds, mutual funds, etc.)?" The possible answers are YES/ YES, in the past/NO.This variable takes value 1 if the answer is YES, 0 otherwise.
Self-Advice-Delegation (label: MODINV)
This variable separates, within the consulting activity, the role of advice and that of delegation. The measureadopted is based on the question "In managing your �nancial investment, which of these statements betterdescribes your attitude? A: I prefer to decide autonomously: the bank just executes my dispositions; B: Idiscuss with my bank/advisor my intentions and ask an advice before taking a decision; C: I evaluate mybank�s/advisor�s proposals before taking a decision; D: I mainly rely on my bank/advisor for my investmentdecisions; E: I allow my bank (advisor) decide everything".
We construct a variable: "Self" if the answer is A, "Advice" if the answers are B-C and "Delegation" ifthe answers are D-E.
Advice/Delegate (label: ADVICE)
This binary variable is based on the answer (YES/NO) to following question: "Considering all banks/�nancialinstitutions you and your family have relationship with, do you rely on the advice of a �nancial consultantto make your investment choices?"
29Notice that the Unicredit sample is older, more educated, more likely to live in the North and with higher family incomethan the SHIW sample.
43

Monitoring (label: ADVFREQ)
This measure is based on the following question: "How often do you meet your �nancial advisor?"The ten possible answers range from "never" (=10) to "every day" (=1). More precisely, the full scale
is the following: "every day" (=1); "at least once a week" (=2); "approximately every two weeks" (=3);"approximately every month" (=4); "approximately once every 3 months" (=5); "approximately once every6 months" (=6); "approximately once per year" (=7); "less frequently than once per year" (=8); "wheneverI feel like" (=9); "never" (=10).
We re-coded this variable in a three-category ordered variable equal to 0 ("Rarely") if the answers rangefrom 8 to 10, 1 ("Sometimes") if answers range from 5 to 7, and 2 ("Frequently") if the answers range from1 to 4.
Monitoring_1
It is a binary variable based on the variable monitoring de�ned above and the variable capturing "LowSatisfaction of advice" (see below). This variable is equal to 1 if the investor meets frequently her/hisadvisor (i.e., if the variable "Monitoring" de�ned above is equal to 2) and if the level of satisfaction of theadvice is low (i.e., if the variable "Low Satisfaction of advice" is equal to 1),and 0 otherwise.
Second opinion (label: MARCHE)
It is a binary variable based on the answer (YES/NO) to following question:"Have you ever asked your advisor products sold by other banks or �nancial intermediaries"
Second opinion_1: Seeking bank competition (label: MULTIBA_6)
It is a variable based on the question "You told me that you make use of multiple banks. On this cardyou can read some of the reasons why one can make use of multiple banks. Can you indicate the reasonswhy you rely on more than one bank? Multiple answers are allowed". The possible reasons listed are: 1."To separate my entrepreneurial activity from personal accounts"; 2. "For privacy reasons"; 3. "To avoidmy wealth is wholly managed by a unique bank/�nancial intermediary"; 4. "It is comfortable to have onebank branch close to home, one close to o¢ ce"; 5. "Each bank has a speci�c competence on the servicerequired"; 6. "To make banks compete and then get better conditions"; 7. "Other". The variable is builton the binary (YES/NO) answer to option 6, as it reveals the respondent�s intention to compare di¤erent�nancial intermediaries.
Main regressors
Trust in advisor (label: ADVTRUST)
The respondent is asked to answer the following question: "Overall, how much do you trust your bank or�nancial advisor concerning your investments?". The possible answers are: 1 (= a lot), 2 (= quite), 3 (=not so much), 4 (= little), 5 (= not at all).
Trust in advisor_1
It is the binary version of the variable Trust in advisor. It is equal to 1 if Trust in advisor is larger than(or equal to) the median (3) and 0 otherwise
44

Financial Literacy
The respondent is awarded one point for answering correctly questions 1 to 8. The variable therefore rangesfrom 0 to 8.
1. In�ation (label: INFLATION)Suppose a bank account yields a 2% interest per annum (after expenses and taxes). If actual in�ation
is 2% per year (assuming you did not access your account) after two years, the amount deposited can buyyou (select one answer):
a) More than it can buy today; b) less than it can buy today; c) the same as it can buy today (correct);and d) cannot answer/cannot understand.
2. Interest rates (label: INTEREST)Imagine having a �tip�and knowing for certain that in six months interest rates will rise. Do you think
it is appropriate to purchase �xed rate bonds today?a) Yes; b) no (correct); c) I do not know.3. Diversi�cation 1 (label: DIVERSIF1)In relation to investments, people often talk about diversi�cation. In your opinion, to have proper
diversi�cation of one�s investments means (select one response):a) To have in one�s investment portfolio bonds and shares; b) not to invest for too long in the same �nan-
cial product; c) to invest in the greatest possible number of �nancial products; d) to invest simultaneouslyin multiple �nancial products to limit exposure to the risks associated with individual products (correct);e) to not invest in high-risk instruments; f) I do not know/cannot understand.
4. Diversi�cation 2 (label: DIVERSIF2)Which of these portfolios is better diversi�ed?a) 70% T-bills, 15% European equity fund, 15% in 2-3 Italian stocks ; b) 70% T-bills, 30% European
equity fund; c) 70% T-bills, 30% in 2-3 Italian stocks; d) 70% T-bills, 30% in stocks of companies I knowwell; e) Do not know
Four other �nancial literacy indicators are based on the question: How risky do you think these productsare?
The answers range from 1=Not risky at all, to 5=Very risky, and �Do not know�is always an option.One point is given if the respondent can correctly state that:
5. Private bonds are at least as risky as deposits (label: RISK1)6. Stocks are at least as risky as government bonds (label: RISK2)7. Stocks mutual funds are at least as risky as mutual funds (label: RISK3)8. Housing is at least as risky as deposits (label: RISK4)"Financial Literacy_low" is a binary version of the variable capturing a low level of �nancial knowledge.
It is equal to 1 if the Financial Literacy variable is smaller than (or equal to) 3, and 0 otherwise."Financial Literacy_medium" is a binary version of the variable capturing a medium level of �nancial
knowledge. It is equal to 1 if the Financial Literacy variable is equal to 4 or 5, and 0 otherwise."Financial Literacy_high" is a binary version of the variable capturing a high level of �nancial knowledge.
It is equal to 1 if the Financial Literacy variable is larger than (or equal to) 6, and 0 otherwise.
Financial Literacy_1
The variable Financial Literacy_1 is similar to Financial Literacy with the exception of the exclusion ofquestion 2, being the one with the highest score of correct answers in the block of the �rst four questions.30
30 In the second block, which is a composite test on the knowledge of risk, all four �nancial literacy indicators display a largerresponse rate than question 2 but we chose not to modify the second block. Indeed, by eliminating one of them the overall teston the knowledge of riskiness would be undermined while by eliminating all of them the variability of the variable would haveshrunk from 0-8 to 0-4, thus making meaningless the split of the population in percentiles.
45

The variable therefore ranges from 0 to 7.
"Financial Literacy_1_low" is a binary version of the variable capturing a low level of �nancial knowl-edge. It is equal to 1 if the Financial Literacy_1 variable is smaller than (or equal to) 2, and 0 otherwise.
"Financial Literacy_1_medium" is a binary version of the variable capturing a medium level of �nancialknowledge. It is equal to 1 if the Financial_1 Literacy variable is equal to 3, 4 or 5, and 0 otherwise.
"Financial Literacy_1_high" is a binary version of the variable capturing a high level of �nancialknowledge. It is equal to 1 if the Financial Literacy_1 variable is larger than (or equal to) 6, and 0otherwise.
Financial Literacy_2
The variable Financial Literacy_2 is similar to Financial Literacy with the exception of the exclusion ofquestion 4, being the one with the lowest score of correct answers. The variable therefore ranges from 0 to7.
"Financial Literacy_2_low" is a binary version of the variable capturing a low level of �nancial knowl-edge. It is equal to 1 if the Financial Literacy_2 variable is smaller than (or equal to) 3, and 0 otherwise.
"Financial Literacy_2_medium" is a binary version of the variable capturing a medium level of �nancialknowledge. It is equal to 1 if the Financial_2 Literacy variable is equal to 4, and 0 otherwise.
"Financial Literacy_2_high" is a binary version of the variable capturing a high level of �nancialknowledge. It is equal to 1 if the Financial Literacy_2 variable is larger than (or equal to) 5, and 0otherwise.
Self-assessed �nancial knowledge (label: ABILITY)
The respondent is asked: "Which is the degree of knowledge relative to ten assets (government bonds,repurchase agreements, private bonds, mutual funds, derivatives, unit-linked or index-linked life insurance,ETFs, managed portfolios, and structured products)?". The answers range from 1 (=not at all) to 5 (=verywell). The index used in the analysis (1-5) is the average of these ten measures.
Risk aversion (label: PROPRISK)
The variable is based on the question "In managing your �nancial investment which of these attitudes doyou usually have? When I invest I usually look for Very high returns, even with a high risk of losing part ofmy principal (LOW); High returns with a fair degree of principal safety and Fair returns with high safetyfor my principal (MEDIUM); Low returns without risk of losing my principal (HIGH)". We re-code thisvariable in three levels of risk aversion (HIGH, MEDIUM, LOW).
Expected payo¤ of advice/delegate (label: MOTVBA)
This binary variable captures the expected payo¤ of seeking advice and should determine the choice ofasking advice/delegation versus self-directing own investment.
To build our measure of expected payo¤ of advice/delegate we refer to Pesendorfer and Wolinsky (2003).The expected payo¤ of advice or delegate in equilibrium is31: xV � p� s = V � p� 2s=x. V represents thevalue of the optimal recommended product, p is the price, s is the direct cost of control and x is the level
31Pesendorfer and Wolinsky (2003), equation (6), page 424. Note that the full search cost would be (d + s), where d is thedirect cost of advice, but it can be discarded because Pesendorfer and Wolinsky (2003) show that it equals 0 in equilibrium (seeProposition 1 on pag. 426)
46

of e¤ort of the advisor. 2s=x represents the expected cost of control: the higher are the direct control costs(i.e., the search costs or opportunity costs of time) and/or the lower is the e¤ort of the advisor, the higherare the expected control costs. The expression on the left-hand side is the value for investors who stop andbuy the recommended product, while the expression on the right-hand side is the value for investors whosearch for a second opinion: the two values equate in equilibrium.
To construct a proxy of this measure of "expected payo¤ of advice/delegate" we rely on the followingcomposite question:
"If you had to choose a bank for your investments, how important would be the following factorsin your �nal choice?" A. proximity to home/o¢ ce; B: ample choice of products and services; C. goodperformance of products; D. good relationship with bank employees; E. consultants�competence; F. prices�competitiveness; G. innovative products and services; H. quality and completeness of communications andinformation (current account reporting, etc.); I. telephone and internet services.
The �ve possible answers range from "Not at all" (1) to "Very important" (5).We proxy V with the factor B (the utility attached to the optimal investor-speci�c product is larger
if the choice of products is wider), p with factor F and the expected control costs with a combination offactors A and I (proxying the opportunity cost of time), and of factors C and E (proxying the e¤ort of theadvisor).
The measure adopted in the main speci�cation is a binary variable identifying a high expected payo¤ ofadvice/delegate.
It is equal to 1 if
8>>>>><>>>>>:B >= 4| {z }V high
; F >= 4| {z }p low
; A <= 3 & I <= 3| {z }low search cost
or C >= 4 & E >= 4| {z }high e¤ort| {z }
low expected control cost
9>>>>>=>>>>>;; 0 otherwise.
Expected payo¤ of seeking advice_1
This measure is a variant of the measure Expected payo¤ of advice/delegate computed above, to test thesensitivity of the �ndings to a variation in the choice of cut-o¤ answers.
It is equal to 1 if
8>>>>><>>>>>:B > 4| {z }V high
; F > 4| {z }p low
; A < 3 & I < 3| {z }low search cost
or C > 4 & E > 4| {z }high e¤ort| {z }
low expected control cost
9>>>>>=>>>>>;; 0 otherwise.
Expected payo¤ of seeking advice_2
This measure is a variant of the measure Expected payo¤ of advice/delegate computed above, to test thesensitivity of the �ndings to a variation in the de�nition of search costs. In particular, we consider only thefactor I (telephone and internet services) as proxying the opportunity cost of time of the investor.
It is equal to
8>>>>><>>>>>:B >= 4| {z }V high
; F >= 4| {z }p low
; I <= 3| {z }low search cost
or C >= 4 & E >= 4| {z }high e¤ort| {z }
low expected control cost
9>>>>>=>>>>>;; 0 otherwise.
47

Instruments
Average regional �nancial literacy (from SHIW)
This variable is average �nancial literacy at the regional level taken from the Bank of Italy�s Survey onHousehold Income and Wealth (SHIW)
School performance (label: SCHOOL)
The variable is based on the question "Where were you placed as a pupil when you attended junior highschool?
1: in the group of best students; 2: above the median; 3: about at median; 4: below the median".Our variable is constructed as a binary variable taking value 1 if the client belongs to the group 1 and
0 otherwise.
General trust_1 (label: TRUST)
TRUST: binary variable based on the answer to the following question: "Generally speaking, do you thinkthat most people can be trusted or that you have to be very careful in dealing with people?�. A value 1 isassociated to the answer "I think that most people can be trusted" and a value 0 to the answer "You cannotbe too careful in dealing with people".
General trust_2 (label: TRUST2)
TRUST2: variable based on the answer to the following question: "How important is for you to build trustrelationships with people in everyday life?" and the answer can range from 1 (=not at all important) to 5(=very important)
Other relevant variables
Satisfaction of Unicredit bank�s �nancial advice (label: UCISODD)
This variable relies on the answer to the question: "Overall, which is your level of satisfaction for the wayUnicredit manages your �nancial investments?" and the answer ranges from 5 (=not satis�ed at all) to 5(=very satis�ed). We re-code the variable to attach a higher score (5) to the higher level of satisfaction.
Low Satisfaction of advice
This is a binary version of the above-de�ned variable,equal to 1 for low level of satisfaction (1 to 3), and 0otherwise.
Frequency of trading (label: FREQMOV)
This variable relies on the question "How often do you revise your investment position, buying or sell-ing assets?" and the answer ranges from 1 (=every day) to 11 (=never). We re-coded this variable in athree-category ordered variable -to match the recoding of the monitoring variable ADVFREQ- equal to0 ("Rarely") if the answers range from 8 to 11, 1 ("Sometimes") if answers range from 5 to 7, and 2("Frequently") if the answers range from 1 to 4.
48

Wealth (label: FPATRIM)
The wealth refers to the respondent�s holdings at Unicredit (2006, 30th June) and is de�ned in brackets (1:10k-50k; 2: 50k-100k; 3: 100k-150k; 4: 150k-250k; 5: 250k-500k; 6: 500k-5000k). Note that the sampleincludes clients with a �nancial wealth in Unicredit at least equal to 10 thousands euros.
Income (label: YLIND)
This variable comprises labour income perceived by the respondent at the end of year 2006.
Experience (label: ETA)
This variables captures the experience of investors in dealing with �nancial instruments. It is equal tothe maximum experience (measured in years) attached to the three types of instruments considered, i.e.,government bonds, mutual funds and stocks.
Finance Sector (label: APSETT_IN)
This is a binary variable equal to 1 if the respondent works in the �nancial sector and 0 otherwise.
49
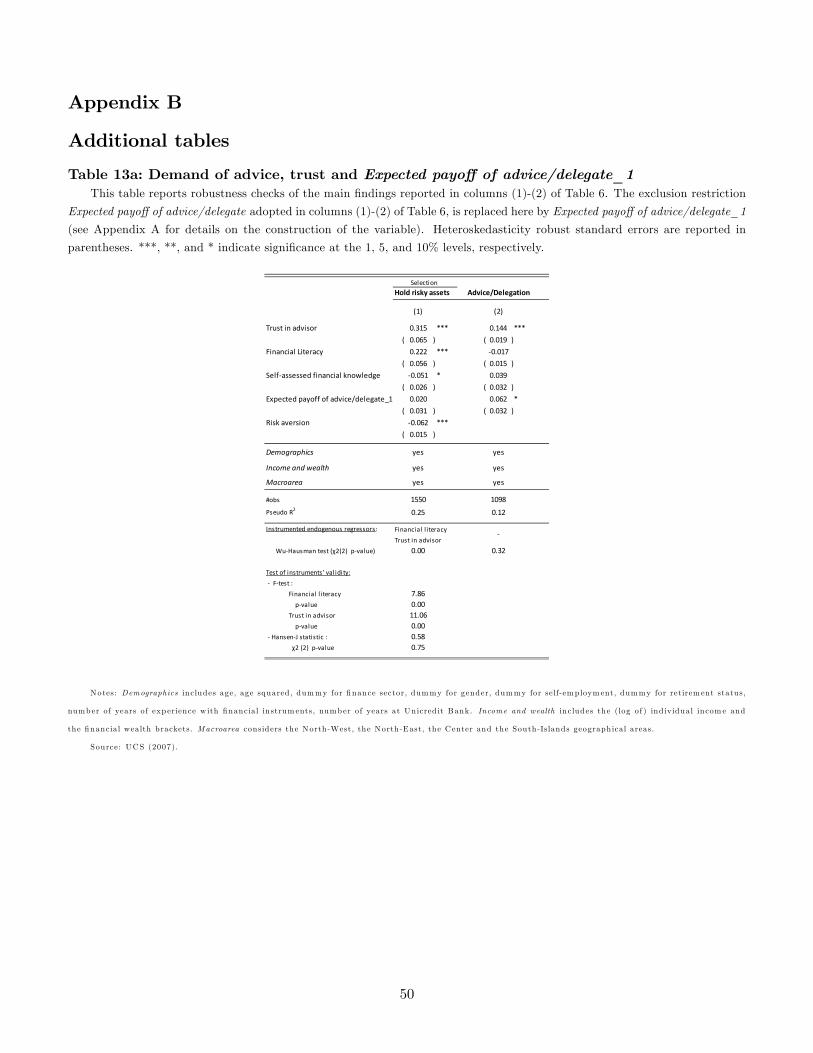
Appendix B
Additional tables
Table 13a: Demand of advice, trust and Expected payo¤ of advice/delegate_1This table reports robustness checks of the main �ndings reported in columns (1)-(2) of Table 6. The exclusion restriction
Expected payo¤ of advice/delegate adopted in columns (1)-(2) of Table 6, is replaced here by Expected payo¤ of advice/delegate_1
(see Appendix A for details on the construction of the variable). Heteroskedasticity robust standard errors are reported in
parentheses. ***, **, and * indicate signi�cance at the 1, 5, and 10% levels, respectively.
Hold risky assets Advice/Delegation
(1) (2)
Trust in advisor 0.315 *** 0.144 ***( 0.065 ) ( 0.019 )
Financial Literacy 0.222 *** 0.017( 0.056 ) ( 0.015 )
Selfassessed financial knowledge 0.051 * 0.039( 0.026 ) ( 0.032 )
Expected payoff of advice/delegate_1 0.020 0.062 *( 0.031 ) ( 0.032 )
Risk aversion 0.062 ***( 0.015 ) *** *** ***
Demographics yes yes
Income and wealth yes yes
Macroarea yes yes
#obs 1550 1098Pseudo R2 0.25 0.12
Instrumented endogenous regressors: Financial l iteracyTrust in advisor
WuHausman test (χ2(2) pvalue) 0.00 0.32
Test of instruments' validity: Ftest : Financial l iteracy 7.86 pvalue 0.00 Trust in advisor 11.06 pvalue 0.00 HansenJ statistic : 0.58 χ2 (2) pvalue 0.75
Selection
Notes: Demographics includes age, age squared , dummy for �nance sector, dummy for gender, dummy for self-employm ent, dummy for retirem ent status,
number of years of exp erience w ith �nancia l instrum ents, number of years at Unicred it Bank. Income and wealth includes the (log of ) ind iv idual incom e and
the �nancia l wealth brackets. Macroarea considers the North-West, the North-East, the Center and the South-Islands geographical areas.
Source: UCS (2007).
50

Table 13b. Demand of advice, trust and Expected payo¤ of advice/delegate_2This table reports robustness checks of the main �ndings reported in columns (1)-(2) of Table 6.The exclusion restriction
Expected payo¤ of advice/delegate adopted in columns (1)-(2) of Table 6, is replaced here by Expected payo¤ of advice/delegate_2
(see Appendix A for details on the construction of the variable). Dependent variable and regression techniques are the same
as columns (1)-(2) of Table 5. Heteroskedasticity robust standard errors are reported in parentheses. ***, **, and * indicate
signi�cance at the 1, 5, and 10% levels, respectively.
Hold risky assets Advice/Delegation
(1) (2)
Trust in advisor 0.323 *** 0.149 ***( 0.064 ) ( 0.016 )
Financial Literacy 0.223 *** 0.019( 0.057 ) ( 0.013 )
Selfassessed financial knowledge 0.049 * 0.040 *( 0.026 ) ( 0.021 )
Expected payoff of advice/delegate_2 0.032 0.063 *( 0.025 ) ( 0.034 )
Risk aversion 0.060 ***( 0.015 ) *** *** ***
Demographics yes yes
Income and wealth yes yes
Macroarea yes yes
#obs 1550 1098Pseudo R2 0.25 0.12
Instrumented endogenous regressors : Financial l iteracyTrust in advisor
WuHausman test (χ2(2) pvalue) 0.00 0.38
Test of instruments' validity: Ftest : Financial l iteracy 7.74 pvalue 0.00 Trust in advisor 11.26 pvalue 0.00 HansenJ statistic : 0.68 χ2 (2) pvalue 0.71
Selection
Notes: Demographics includes age, age squared , dummy for �nance sector, dummy for gender, dummy for self-employm ent, dummy for retirem ent status,
number of years of exp erience w ith �nancia l instrum ents, number of years at Unicred it Bank. Income and wealth includes the (log of ) ind iv idual incom e and
the �nancia l wealth brackets. Macroarea considers the North-West, the North-East, the Center and the South-Islands geographical areas.
Source: UCS (2007).
51

Table 13c. Demand of advice, Trust in advisor_1 and Expected payo¤ of advice/delegateThis table reports robustness checks of the main �ndings reported in columns (1)-(2) of Table 6. The variable Trust in
advisor is replaced here by its binary version, Trust in advisor_1. Dependent variable and regression techniques are the same
as Table 5. Heteroskedasticity robust standard errors are reported in parentheses. ***, **, and * indicate signi�cance at the 1,
5, and 10% levels, respectively.
Hold risky assets Advice/Delegation
(1) (2)
Trust in advisor_1 0.833 *** 0.283 ***( 0.166 ) ( 0.034 )
Financial Literacy 0.213 *** 0.021 *( 0.057 ) ( 0.013 )
Selfassessed financial knowledge 0.045 * 0.037 *( 0.026 ) ( 0.021 )
Expected payoff of advice/delegate 0.056 ** 0.068 **( 0.026 ) ( 0.033 )
Risk aversion 0.059 ***( 0.015 ) *** *** ***
Demographics yes yes
Income and wealth yes yes
Macroarea yes yes
#obs 1550 1098Pseudo R2 0.24 0.12
Instrumented endogenous regressors: Financial l iteracyTrust in advisor
WuHausman test (χ2(2) pvalue) 0.00 0.65
Test of instruments' validity: Ftest : Financial l iteracy 7.75 pvalue 0.00 Trust in advisor 7.70 pvalue 0.00 HansenJ statistic : 0.33 χ2 (2) pvalue 0.85
None
Selection
Notes: Demographics includes age, age squared , dummy for �nance sector, dummy for gender, dummy for self-employm ent, dummy for retirem ent status,
number of years of exp erience w ith �nancia l instrum ents, number of years at Unicred it Bank. Income and wealth includes the (log of ) ind iv idual incom e and
the �nancia l wealth brackets. Macroarea considers the North-West, the North-East, the Center and the South-Islands geographical areas.
Source: UCS (2007).
52