TO: Transportation Authority of Marin Board of · PDF file4/24/2014 · TO:...
15
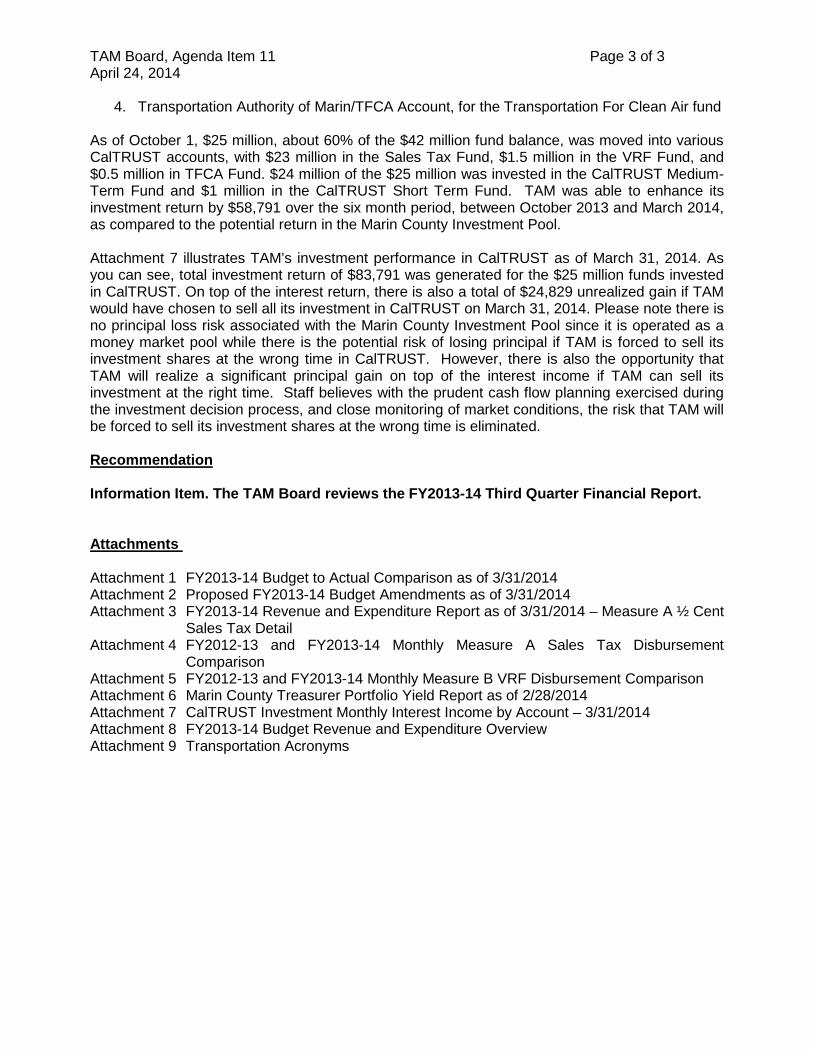
April 24, 2014 TO: Transportation Authority of Marin Board of Commissioners FROM: Dianne Steinhauser, Executive Director THROUGH: Li Zhang, Chief Financial Officer RE: FY2013-14 Third Quarter Financial Report (Information), Agenda Item 11 Dear Commissioners: Executive Summary This Quarterly Financial Report is for the period ending March 31, 2014 and covers TAM’s revenue and expenditure activities from July 1, 2013 to March 31, 2014. The following attachments are included in the report for your review: Attachment 1 FY2013-14 Budget to Actual Comparison as of 3/31/2014 Attachment 2 Proposed FY2013-14 Budget Amendments as of 3/31/2014 Attachment 3 FY2013-14 Revenue and Expenditure Report as of 3/31/2014 – Measure A ½ Cent Sales Tax Detail Attachment 4 FY2012-13 and FY2013-14 Monthly Measure A Sales Tax Disbursement Comparison Attachment 5 FY2012-13 and FY2013-14 Monthly Measure B VRF Disbursement Comparison Attachment 6 Marin County Treasurer Portfolio Yield Report as of 2/28/2014 Attachment 7 CalTRUST Investment Monthly Interest Income by Account – 3/31/2014 Attachment 8 FY2013-14 Budget Revenue and Expenditure Overview Attachment 9 Transportation Acronyms As of March 31, 2014, the total Measure A half-cent sales tax cash disbursements received from the Board of Equalization (BOE) for the nine-month period from July 2013 to March 2014 was $18.44 million, which is 8.5% higher than the total Measure A disbursements for the same period last year. As of March 31, 2014, TAM has also received a total of $1.76 million in Measure B $10 vehicle registration fee cash disbursements from the Department of Motor Vehicle (DMV) for the six-month period from July 2013 to March 2014, which is 2.7% higher than the same period last year. Expenditures are on a cash basis and are lower than the budgeted amount due to time needed by vendors to prepare and submit payment requests. Staff expects a wave of payment requests for several major fund categories will come in within the next few months. Recommendation: Information Item. The TAM Board reviews the FY2013-14 third Quarter Financial Report.
Transcript of TO: Transportation Authority of Marin Board of · PDF file4/24/2014 · TO:...
April 24, 2014 TO: Transportation Authority of Marin Board of Commissioners FROM: Dianne Steinhauser, Executive Director THROUGH: Li Zhang, Chief Financial Officer RE: FY2013-14 Third Quarter Financial Report (Information), Agenda Item 11 Dear Commissioners: Executive Summary This Quarterly Financial Report is for the period ending March 31, 2014 and covers TAM’s revenue and expenditure activities from July 1, 2013 to March 31, 2014. The following attachments are included in the report for your review: Attachment 1 FY2013-14 Budget to Actual Comparison as of 3/31/2014 Attachment 2 Proposed FY2013-14 Budget Amendments as of 3/31/2014 Attachment 3 FY2013-14 Revenue and Expenditure Report as of 3/31/2014 – Measure A ½ Cent
Sales Tax Detail Attachment 4 FY2012-13 and FY2013-14 Monthly Measure A Sales Tax Disbursement
Comparison Attachment 5 FY2012-13 and FY2013-14 Monthly Measure B VRF Disbursement Comparison Attachment 6 Marin County Treasurer Portfolio Yield Report as of 2/28/2014 Attachment 7 CalTRUST Investment Monthly Interest Income by Account – 3/31/2014 Attachment 8 FY2013-14 Budget Revenue and Expenditure Overview Attachment 9 Transportation Acronyms As of March 31, 2014, the total Measure A half-cent sales tax cash disbursements received from the Board of Equalization (BOE) for the nine-month period from July 2013 to March 2014 was $18.44 million, which is 8.5% higher than the total Measure A disbursements for the same period last year. As of March 31, 2014, TAM has also received a total of $1.76 million in Measure B $10 vehicle registration fee cash disbursements from the Department of Motor Vehicle (DMV) for the six-month period from July 2013 to March 2014, which is 2.7% higher than the same period last year. Expenditures are on a cash basis and are lower than the budgeted amount due to time needed by vendors to prepare and submit payment requests. Staff expects a wave of payment requests for several major fund categories will come in within the next few months. Recommendation: Information Item. The TAM Board reviews the FY2013-14 third Quarter Financial Report.
TAM Board, Agenda Item 11 Page 2 of 3 April 24, 2014 Background This report, along with all accompanying attachments, provides a summary of the financial activities for the period ending March 31, 2014 and covers TAM’s revenue, expenditure and investment activities from July 1, 2013 to March 31, 2014. Revenues and expenditures are presented on a cash basis for the period covered. Revenue Highlights As of March 31, 2014, the total Measure A half-cent sales tax cash disbursements received from the Board of Equalization (BOE) for the nine-month period from July 2013 to March 2014 was $18.44 million, which is 8.5% higher than the total Measure A disbursements for the same period last year. The same upward trend of sales tax revenue has continued since FY2010-11, with a 4.96% increase in FY2011-12 and an 11.07% increase in FY2012-13. This significant increase in sales tax collections is encouraging and is likely to continue with the slowly but steadily improving Marin and US economic picture. As of March 31, 2014, TAM has also received a total of $1.76 million in Measure B $10 vehicle registration fee cash disbursements from the Department of Motor Vehicle (DMV) for the six-month period from July 2013 to March 2014, which is 2.7% higher than the same period last year. However, staff expects the total revenue for this year will be at a similar level as last year; staff do not expect a significant increase in the number of registered vehicles in Marin. As of March 31, 2014, TAM received a total of $430,000 in annual contributions from cities, towns, and counties for CMA planning, programming, $99,061 in interest revenue and $989,482 reimbursements from various other funding sources. Expenditure Highlights Expenditures are on a cash basis and appear to be much lower than the budgeted amount due to time needed by vendors to prepare and submit payment requests. With the execution of various Measure A Sales Tax and Measure B VRF funding agreements, staff expect a wave of payment requests for several major fund categories will come in within the next few months. Budget Amendment No budget amendment is recommended as part of this quarterly report. CalTRUST Investment Performance Review As a result of an extensive investment option study conducted in early 2013, the TAM Board authorized staff to invest up to 2/3 of its fund balance into CalTRUST, a program organized as a Joint Powers Authority and established by public agencies in California for the purpose of pooling and investing local agency funds. The remaining funds are kept in the Marin County Investment Pool (MCIP) to meet the cash flow needs of TAM’s various transportation projects and programs. The following four accounts were set up for TAM by CalTRUST:
1. Transportation Authority of Marin/General Account, for fund balance of various funding sources that does require separate interest revenue tracking
2. Transportation Authority of Marin/Sales Tax Account, for the Measure A sales tax fund 3. Transportation Authority of Marin/VRF Account, for the Measure B vehicle registration fee
fund
TAM Board, Agenda Item 11 Page 3 of 3 April 24, 2014
4. Transportation Authority of Marin/TFCA Account, for the Transportation For Clean Air fund As of October 1, $25 million, about 60% of the $42 million fund balance, was moved into various CalTRUST accounts, with $23 million in the Sales Tax Fund, $1.5 million in the VRF Fund, and $0.5 million in TFCA Fund. $24 million of the $25 million was invested in the CalTRUST Medium-Term Fund and $1 million in the CalTRUST Short Term Fund. TAM was able to enhance its investment return by $58,791 over the six month period, between October 2013 and March 2014, as compared to the potential return in the Marin County Investment Pool. Attachment 7 illustrates TAM’s investment performance in CalTRUST as of March 31, 2014. As you can see, total investment return of $83,791 was generated for the $25 million funds invested in CalTRUST. On top of the interest return, there is also a total of $24,829 unrealized gain if TAM would have chosen to sell all its investment in CalTRUST on March 31, 2014. Please note there is no principal loss risk associated with the Marin County Investment Pool since it is operated as a money market pool while there is the potential risk of losing principal if TAM is forced to sell its investment shares at the wrong time in CalTRUST. However, there is also the opportunity that TAM will realize a significant principal gain on top of the interest income if TAM can sell its investment at the right time. Staff believes with the prudent cash flow planning exercised during the investment decision process, and close monitoring of market conditions, the risk that TAM will be forced to sell its investment shares at the wrong time is eliminated. Recommendation Information Item. The TAM Board reviews the FY2013-14 Third Quarter Financial Report. Attachments Attachment 1 FY2013-14 Budget to Actual Comparison as of 3/31/2014 Attachment 2 Proposed FY2013-14 Budget Amendments as of 3/31/2014 Attachment 3 FY2013-14 Revenue and Expenditure Report as of 3/31/2014 – Measure A ½ Cent
Sales Tax Detail Attachment 4 FY2012-13 and FY2013-14 Monthly Measure A Sales Tax Disbursement
Comparison Attachment 5 FY2012-13 and FY2013-14 Monthly Measure B VRF Disbursement Comparison Attachment 6 Marin County Treasurer Portfolio Yield Report as of 2/28/2014 Attachment 7 CalTRUST Investment Monthly Interest Income by Account – 3/31/2014 Attachment 8 FY2013-14 Budget Revenue and Expenditure Overview Attachment 9 Transportation Acronyms
Budget Line Items Annual Budget
Actual 3/31/2014 $ Difference
Actual as % of Budget
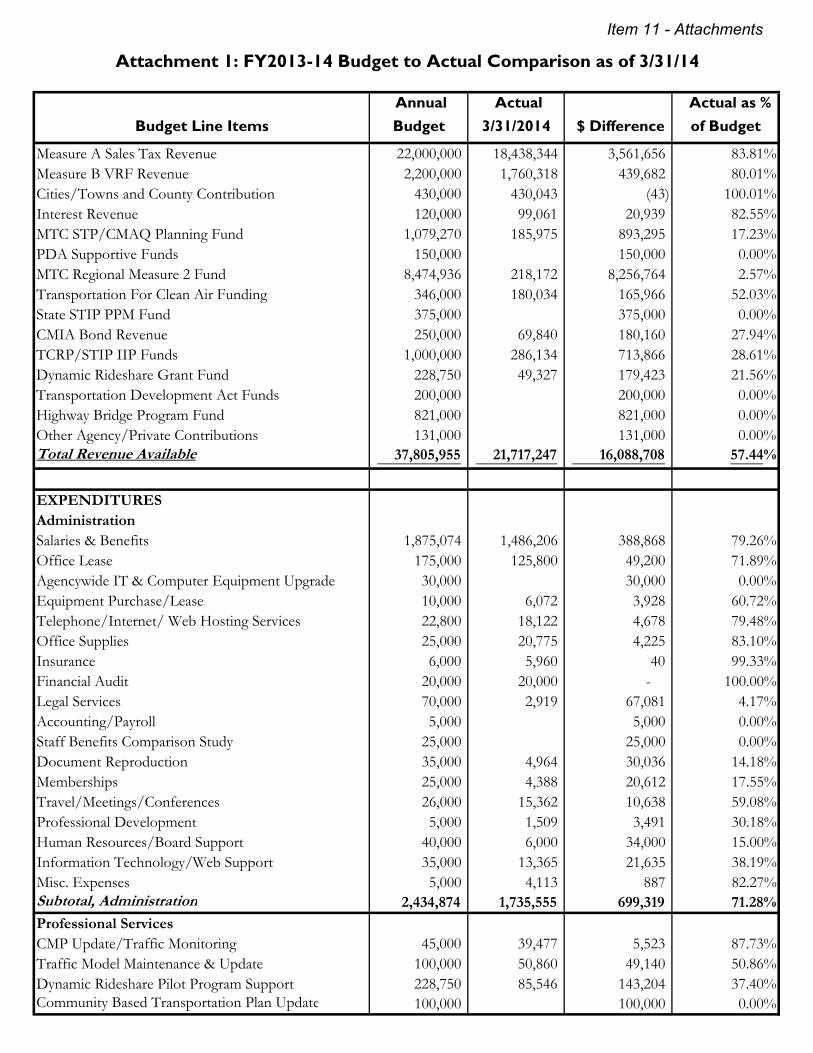
Measure A Sales Tax Revenue 22,000,000 18,438,344 3,561,656 83.81%Measure B VRF Revenue 2,200,000 1,760,318 439,682 80.01%Cities/Towns and County Contribution 430,000 430,043 (43) 100.01%Interest Revenue 120,000 99,061 20,939 82.55%MTC STP/CMAQ Planning Fund 1,079,270 185,975 893,295 17.23%PDA Supportive Funds 150,000 150,000 0.00%MTC Regional Measure 2 Fund 8,474,936 218,172 8,256,764 2.57%Transportation For Clean Air Funding 346,000 180,034 165,966 52.03%State STIP PPM Fund 375,000 375,000 0.00%CMIA Bond Revenue 250,000 69,840 180,160 27.94%TCRP/STIP IIP Funds 1,000,000 286,134 713,866 28.61%Dynamic Rideshare Grant Fund 228,750 49,327 179,423 21.56%Transportation Development Act Funds 200,000 200,000 0.00%Highway Bridge Program Fund 821,000 821,000 0.00%Other Agency/Private Contributions 131,000 131,000 0.00%Total Revenue Available 37,805,955 21,717,247 16,088,708 57.44%
EXPENDITURESAdministrationSalaries & Benefits 1,875,074 1,486,206 388,868 79.26%Office Lease 175,000 125,800 49,200 71.89%Agencywide IT & Computer Equipment Upgrade 30,000 30,000 0.00%Equipment Purchase/Lease 10,000 6,072 3,928 60.72%Telephone/Internet/ Web Hosting Services 22,800 18,122 4,678 79.48%Office Supplies 25,000 20,775 4,225 83.10%Insurance 6,000 5,960 40 99.33%Financial Audit 20,000 20,000 - 100.00%Legal Services 70,000 2,919 67,081 4.17%Accounting/Payroll 5,000 5,000 0.00%Staff Benefits Comparison Study 25,000 25,000 0.00%Document Reproduction 35,000 4,964 30,036 14.18%Memberships 25,000 4,388 20,612 17.55%Travel/Meetings/Conferences 26,000 15,362 10,638 59.08%Professional Development 5,000 1,509 3,491 30.18%Human Resources/Board Support 40,000 6,000 34,000 15.00%Information Technology/Web Support 35,000 13,365 21,635 38.19%Misc. Expenses 5,000 4,113 887 82.27%Subtotal, Administration 2,434,874 1,735,555 699,319 71.28%
Professional ServicesCMP Update/Traffic Monitoring 45,000 39,477 5,523 87.73%Traffic Model Maintenance & Update 100,000 50,860 49,140 50.86%Dynamic Rideshare Pilot Program Support 228,750 85,546 143,204 37.40%Community Based Transportation Plan Update 100,000 100,000 0.00%
Attachment 1: FY2013-14 Budget to Actual Comparison as of 3/31/14
Item 11 - Attachments
Budget Line Items Annual Budget
Actual 3/31/2014 $ Difference
Actual as % of Budget
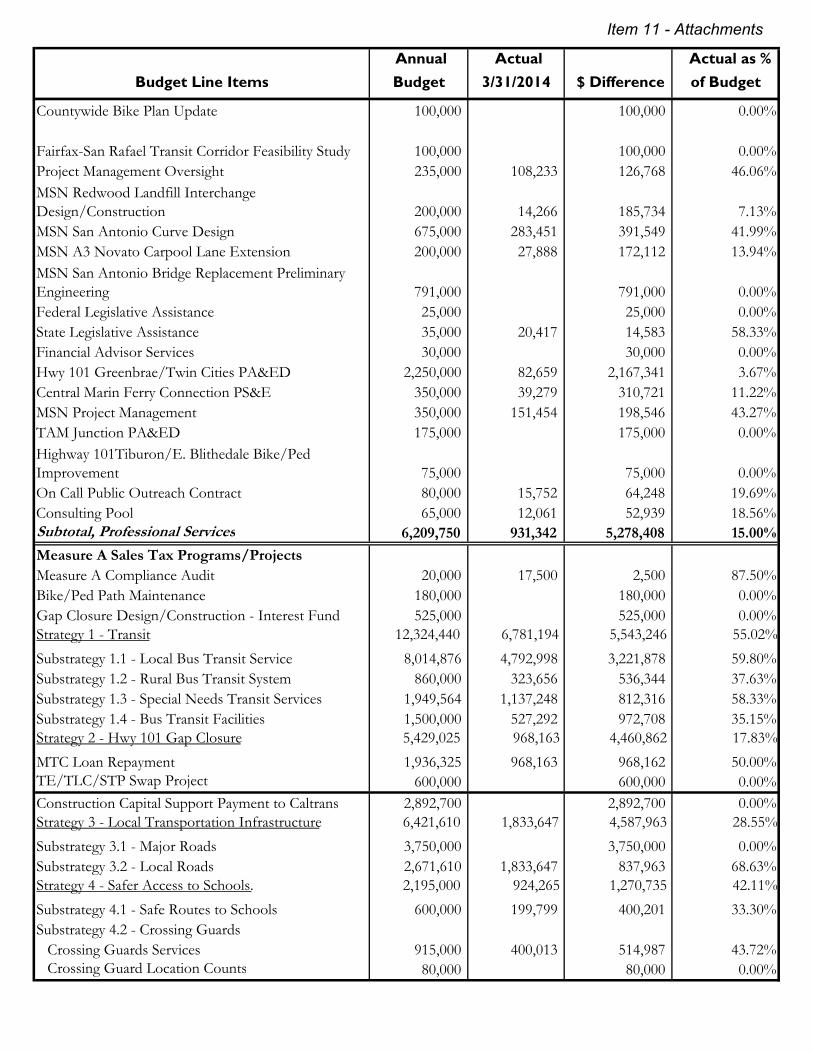
Countywide Bike Plan Update 100,000 100,000 0.00%
Fairfax-San Rafael Transit Corridor Feasibility Study 100,000 100,000 0.00%Project Management Oversight 235,000 108,233 126,768 46.06%MSN Redwood Landfill Interchange Design/Construction 200,000 14,266 185,734 7.13%MSN San Antonio Curve Design 675,000 283,451 391,549 41.99%MSN A3 Novato Carpool Lane Extension 200,000 27,888 172,112 13.94%MSN San Antonio Bridge Replacement Preliminary Engineering 791,000 791,000 0.00%Federal Legislative Assistance 25,000 25,000 0.00%State Legislative Assistance 35,000 20,417 14,583 58.33%Financial Advisor Services 30,000 30,000 0.00%Hwy 101 Greenbrae/Twin Cities PA&ED 2,250,000 82,659 2,167,341 3.67%Central Marin Ferry Connection PS&E 350,000 39,279 310,721 11.22%MSN Project Management 350,000 151,454 198,546 43.27%TAM Junction PA&ED 175,000 175,000 0.00%Highway 101Tiburon/E. Blithedale Bike/Ped Improvement 75,000 75,000 0.00%On Call Public Outreach Contract 80,000 15,752 64,248 19.69%Consulting Pool 65,000 12,061 52,939 18.56%Subtotal, Professional Services 6,209,750 931,342 5,278,408 15.00%
Measure A Sales Tax Programs/ProjectsMeasure A Compliance Audit 20,000 17,500 2,500 87.50%Bike/Ped Path Maintenance 180,000 180,000 0.00%Gap Closure Design/Construction - Interest Fund 525,000 525,000 0.00%Strategy 1 - Transit 12,324,440 6,781,194 5,543,246 55.02%Substrategy 1.1 - Local Bus Transit Service 8,014,876 4,792,998 3,221,878 59.80%Substrategy 1.2 - Rural Bus Transit System 860,000 323,656 536,344 37.63%Substrategy 1.3 - Special Needs Transit Services 1,949,564 1,137,248 812,316 58.33%Substrategy 1.4 - Bus Transit Facilities 1,500,000 527,292 972,708 35.15%Strategy 2 - Hwy 101 Gap Closure 5,429,025 968,163 4,460,862 17.83%MTC Loan Repayment 1,936,325 968,163 968,162 50.00%TE/TLC/STP Swap Project 600,000 600,000 0.00%Construction Capital Support Payment to Caltrans 2,892,700 2,892,700 0.00%Strategy 3 - Local Transportation Infrastructure 6,421,610 1,833,647 4,587,963 28.55%Substrategy 3.1 - Major Roads 3,750,000 3,750,000 0.00%Substrategy 3.2 - Local Roads 2,671,610 1,833,647 837,963 68.63%Strategy 4 - Safer Access to Schools. 2,195,000 924,265 1,270,735 42.11%Substrategy 4.1 - Safe Routes to Schools 600,000 199,799 400,201 33.30%Substrategy 4.2 - Crossing Guards
Crossing Guards Services 915,000 400,013 514,987 43.72%Crossing Guard Location Counts 80,000 80,000 0.00%
Item 11 - Attachments

Budget Line Items Annual Budget
Actual 3/31/2014 $ Difference
Actual as % of Budget
Substrategy 4.3 - Safe Pathways to School Safe Pathways Plan Development 100,000 183,761 (83,761) 183.76% Safe Pathway Capital Projects 500,000 140,693 359,307 28.14%Subtotal, Measure A Programs 27,095,075 10,524,769 16,570,305 38.84%Measure B VRF ProgramsElement 1 - Maintain Local Streets & Pathways 2,341,873 1,538,699 803,174 65.70%Element 1.1 - Local Streets 2,241,873 1,538,699 703,174 68.63%Element 1.2 - Bike/Ped Pathways Maintenance 100,000 100,000 0.00%Element 2 - Seniors & Disabled Mobility 808,178 305,158 503,020 37.76%Element 2.1 - Mobility Management Programs 137,578 80,264 57,314 58.34%
Element 2.2 - Paratransit & Low Income Scholarships 125,000 67,928 57,072 54.34%Element 2.3 - Paratransit Plus 300,000 51,270 248,730 17.09%Element 2.4 - Volunteer Drive & Gap Grant 245,600 105,696 139,904 43.04%Element 3 - Reduce Congestion & Pollution 820,000 152,127 667,873 18.55%Element 3.1 - Safe Routes to School 180,000 54,630 125,370 30.35%Element 3.2 - Trans. Demand Management 385,000 89,497 295,503 23.25%Element 3.3 - Discretionary Fuel (EV) Programs 255,000 8,000 247,000 3.14%Subtotal, Measure B Programs 3,970,051 1,995,984 1,974,067 50.28%Interagency Agreements
Old Redwood Highway Roadway Improvement - Larkspur 250,000 214,654 35,346 85.86%City of Larkspur Station Area Study Match Fund 40,000 40,000 0.00%CMFC County Agreement 5,550,000 5,550,000 0.00%CMFC SMART Agreement 50,000 50,000 0.00%CMFC Larkspur Agreement 25,000 25,000 0.00%Caltrans MSN Carpool Lane Extension Design Support 375,000 375,000 0.00%
Novato Redwood Bus Transit Facility Improvement 100,000 100,000 0.00%Marin County MSN Project Support 100,000 100,000 0.00%Highway 101 Ramp Metering Local Support 100,000 100,000 0.00%Subtotal, Interagency Agreements 6,590,000 214,654 6,375,346 3.26%Other Project/Program ExpendituresTFCA - TDM Projects/Vanpool Incentive 15,000 14,291 709 95.27%TFCA - EV Fleet and Charging Station 120,000 45,628 74,372 38.02%TFCA - Reimbursement of Capital Projects 500,000 110,000 390,000 22.00%Subtotal, Other Capital Expenditures 635,000 169,919 465,081 26.76%Total Expenditures 46,934,750 15,572,223 31,362,526 33.18%
Item 11 - Attachments

Attachment 2: Summary of FY2013-14 Budget Amendments as of 3/31/14
No Budget Amendments are recommended for this time period.
Item 11 - Attachments
Budget Line Interest5%
Reserve1%
Admin 4%
Program Stragegy
PM S - 1.1
Local BusS - 1.2
Rural BusS - 1.3Para.
S - 1.4Cap. Imp.
S - 2 Gap Closure
S - 3.1Major Roads
S - 3.2Local Roads
S - 4.1SR2S
S- 4.2C. Guards
S - 4.3Pathways CG Reimb Total
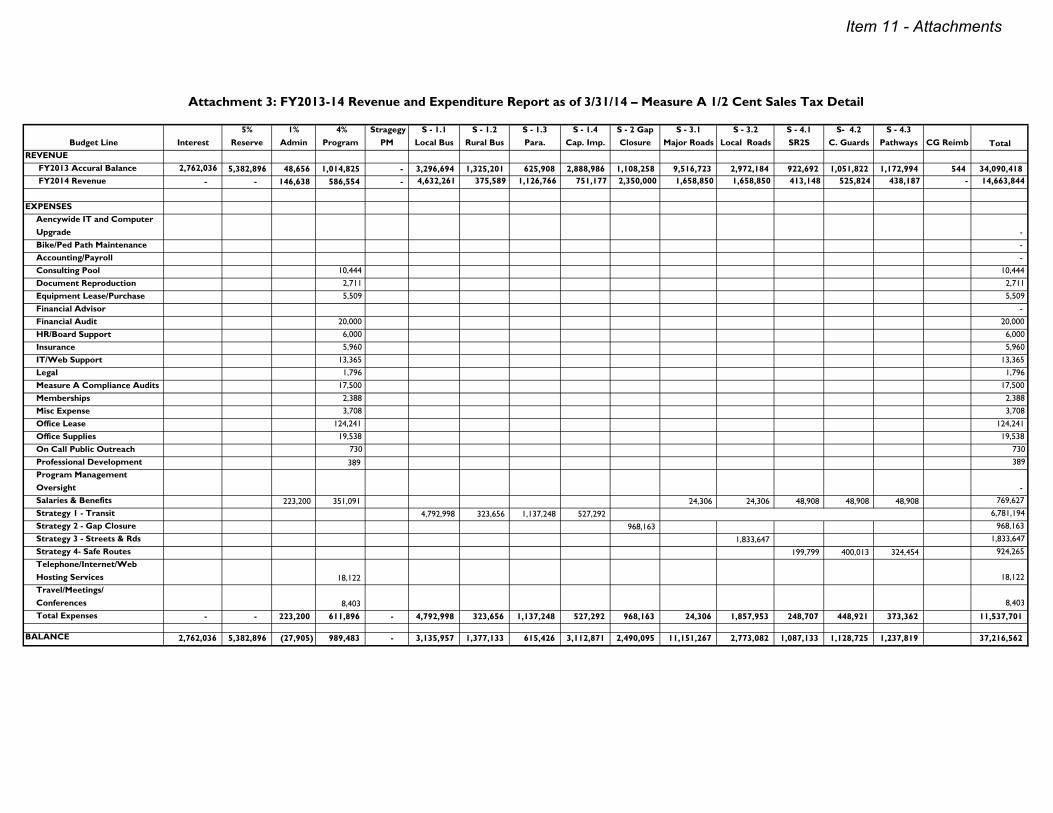
REVENUE FY2013 Accural Balance 2,762,036 5,382,896 48,656 1,014,825 - 3,296,694 1,325,201 625,908 2,888,986 1,108,258 9,516,723 2,972,184 922,692 1,051,822 1,172,994 544 34,090,418 FY2014 Revenue - - 146,638 586,554 - 4,632,261 375,589 1,126,766 751,177 2,350,000 1,658,850 1,658,850 413,148 525,824 438,187 - 14,663,844
EXPENSESAencywide IT and Computer Upgrade - Bike/Ped Path Maintenance - Accounting/Payroll - Consulting Pool 10,444 10,444 Document Reproduction 2,711 2,711 Equipment Lease/Purchase 5,509 5,509 Financial Advisor - Financial Audit 20,000 20,000 HR/Board Support 6,000 6,000 Insurance 5,960 5,960 IT/Web Support 13,365 13,365 Legal 1,796 1,796 Measure A Compliance Audits 17,500 17,500 Memberships 2,388 2,388 Misc Expense 3,708 3,708 Office Lease 124,241 124,241 Office Supplies 19,538 19,538 On Call Public Outreach 730 730 Professional Development 389 389 Program Management Oversight - Salaries & Benefits 223,200 351,091 24,306 24,306 48,908 48,908 48,908 769,627 Strategy 1 - Transit 4,792,998 323,656 1,137,248 527,292 6,781,194 Strategy 2 - Gap Closure 968,163 968,163 Strategy 3 - Streets & Rds 1,833,647 1,833,647 Strategy 4- Safe Routes 199,799 400,013 324,454 924,265 Telephone/Internet/Web Hosting Services 18,122 18,122 Travel/Meetings/Conferences 8,403 8,403 Total Expenses - - 223,200 611,896 - 4,792,998 323,656 1,137,248 527,292 968,163 24,306 1,857,953 248,707 448,921 373,362 11,537,701
BALANCE 2,762,036 5,382,896 (27,905) 989,483 - 3,135,957 1,377,133 615,426 3,112,871 2,490,095 11,151,267 2,773,082 1,087,133 1,128,725 1,237,819 37,216,562
Attachment 3: FY2013-14 Revenue and Expenditure Report as of 3/31/14 – Measure A 1/2 Cent Sales Tax Detail
Item 11 - Attachments
FY2013 FY2014 $ Difference % Difference
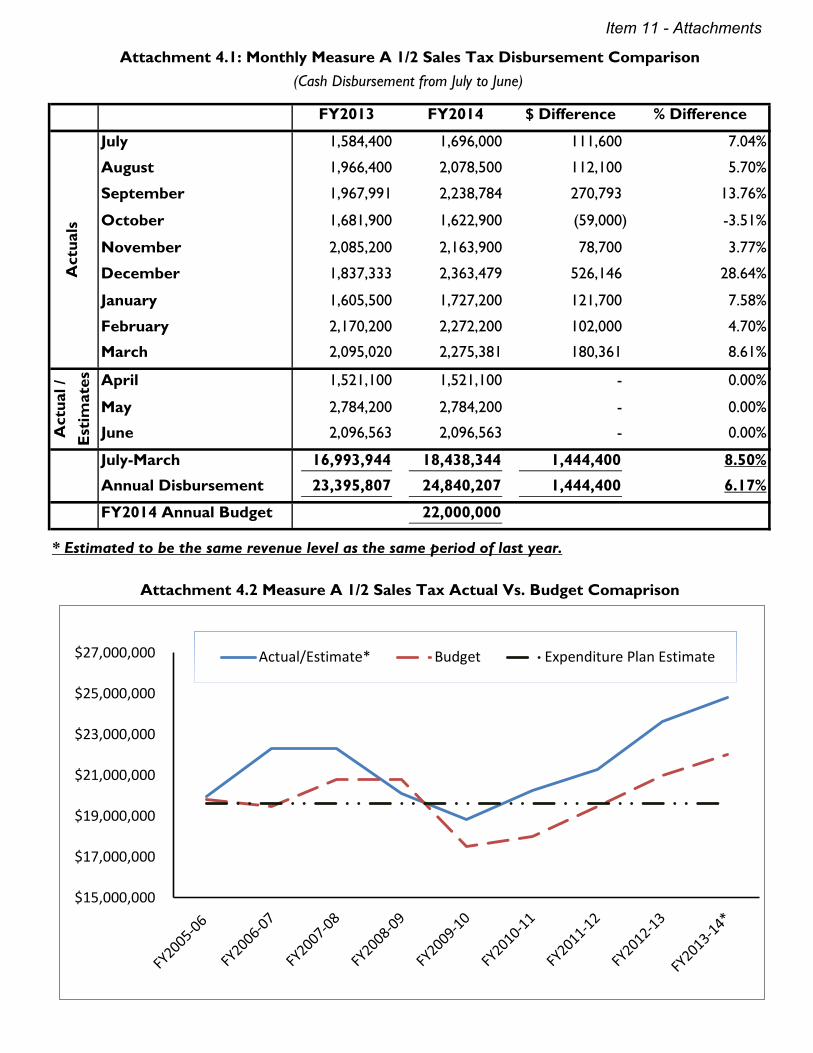
July 1,584,400 1,696,000 111,600 7.04%
August 1,966,400 2,078,500 112,100 5.70%
September 1,967,991 2,238,784 270,793 13.76%
October 1,681,900 1,622,900 (59,000) -3.51%
November 2,085,200 2,163,900 78,700 3.77%
December 1,837,333 2,363,479 526,146 28.64%
January 1,605,500 1,727,200 121,700 7.58%
February 2,170,200 2,272,200 102,000 4.70%
March 2,095,020 2,275,381 180,361 8.61%
April 1,521,100 1,521,100 - 0.00%
May 2,784,200 2,784,200 - 0.00%
June 2,096,563 2,096,563 - 0.00%
July-March 16,993,944 18,438,344 1,444,400 8.50%
Annual Disbursement 23,395,807 24,840,207 1,444,400 6.17%
FY2014 Annual Budget 22,000,000
* Estimated to be the same revenue level as the same period of last year.
Attachment 4.1: Monthly Measure A 1/2 Sales Tax Disbursement Comparison(Cash Disbursement from July to June)
Attachment 4.2 Measure A 1/2 Sales Tax Actual Vs. Budget Comaprison
Act
ual /
E
stim
ates
Act
uals
$15,000,000
$17,000,000
$19,000,000
$21,000,000
$23,000,000
$25,000,000
$27,000,000 Actual/Estimate* Budget Expenditure Plan Estimate
Item 11 - Attachments

FY2013 FY2014 $ Difference % Difference
July 203,101 209,721 6,620 3.26%
August 192,658 188,825 (3,833) -1.99%
September 198,065 214,526 16,461 8.31%
October 204,095 206,212 2,117 1.04%
November 173,140 191,365 18,225 10.53%
December 189,508 181,084 (8,423) -4.44%
January 176,508 164,153 (12,355) -7.00%
February 169,970 197,061 27,091 15.94%
March 207,091 207,550 459 0.22%
April 173,474 - - -100.00%
Actual / Estimates May 194,962 - - -100.00%
June 195,068 - - -100.00%
July-March 1,714,136 1,760,497 46,361 2.70%
Annual Disbursement 2,277,640
FY2014 Annual Budget 2,200,000
Attachment 5: FY2013 and FY2014 Monthly Measure B VRF Disbursement Comparison(Cash Disbursement from July to June)
Act
uals
Item 11 - Attachments
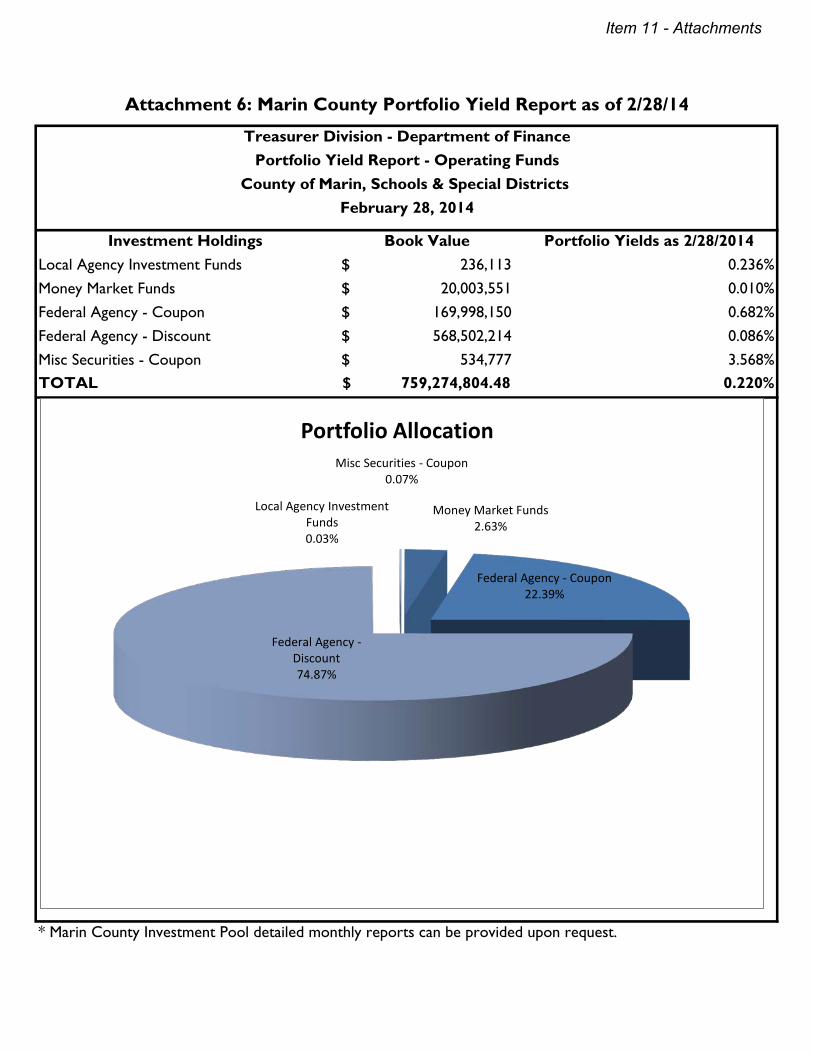
Investment Holdings Book Value Portfolio Yields as 2/28/2014Local Agency Investment Funds 236,113$ 0.236%Money Market Funds 20,003,551$ 0.010%Federal Agency - Coupon 169,998,150$ 0.682%Federal Agency - Discount 568,502,214$ 0.086%Misc Securities - Coupon 534,777$ 3.568%TOTAL 759,274,804.48$ 0.220%
* Marin County Investment Pool detailed monthly reports can be provided upon request.
February 28, 2014
Attachment 6: Marin County Portfolio Yield Report as of 2/28/14
Treasurer Division - Department of FinancePortfolio Yield Report - Operating Funds
County of Marin, Schools & Special Districts
Local Agency Investment Funds 0.03%
Money Market Funds 2.63%
Federal Agency - Coupon 22.39%
Federal Agency - Discount 74.87%
Misc Securities - Coupon 0.07%
Portfolio Allocation
Item 11 - Attachments
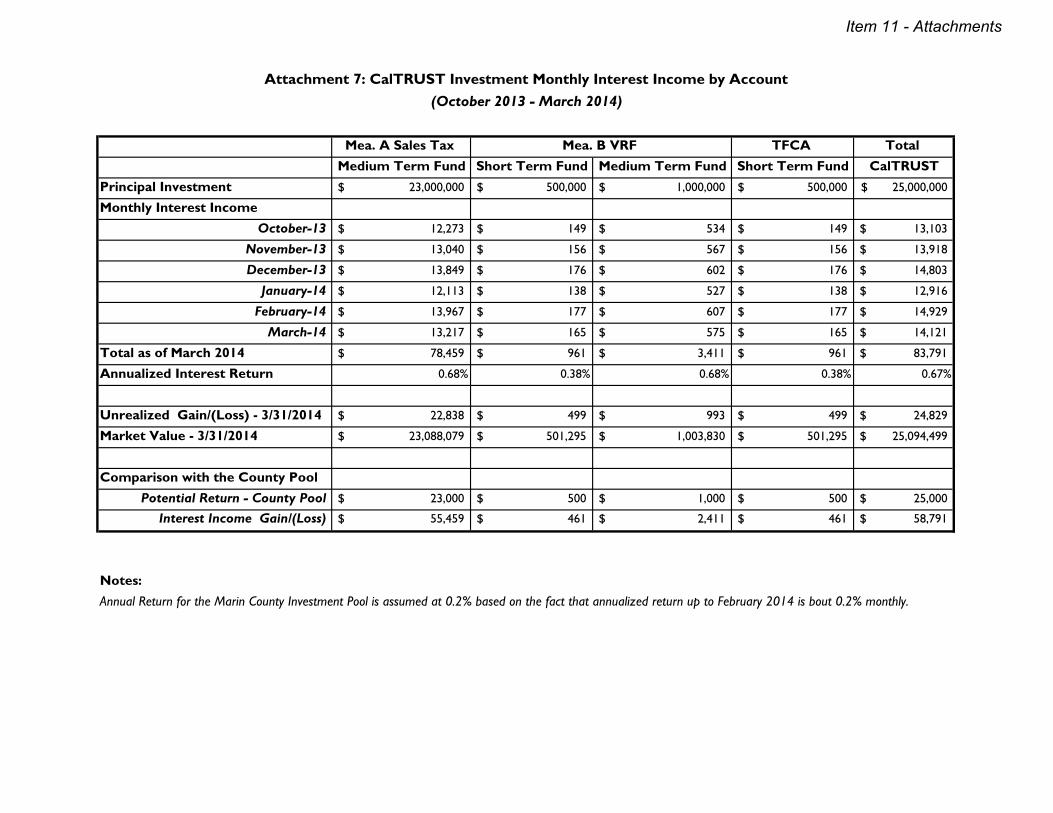
Mea. A Sales Tax TFCA Total Medium Term Fund Short Term Fund Medium Term Fund Short Term Fund CalTRUST
Principal Investment 23,000,000$ 500,000$ 1,000,000$ 500,000$ 25,000,000$
Monthly Interest IncomeOctober-13 12,273$ 149$ 534$ 149$ 13,103$
November-13 13,040$ 156$ 567$ 156$ 13,918$
December-13 13,849$ 176$ 602$ 176$ 14,803$
January-14 12,113$ 138$ 527$ 138$ 12,916$
February-14 13,967$ 177$ 607$ 177$ 14,929$
March-14 13,217$ 165$ 575$ 165$ 14,121$
Total as of March 2014 78,459$ 961$ 3,411$ 961$ 83,791$
Annualized Interest Return 0.68% 0.38% 0.68% 0.38% 0.67%
Unrealized Gain/(Loss) - 3/31/2014 22,838$ 499$ 993$ 499$ 24,829$
Market Value - 3/31/2014 23,088,079$ 501,295$ 1,003,830$ 501,295$ 25,094,499$
Comparison with the County PoolPotential Return - County Pool 23,000$ 500$ 1,000$ 500$ 25,000$
Interest Income Gain/(Loss) 55,459$ 461$ 2,411$ 461$ 58,791$
Notes:Annual Return for the Marin County Investment Pool is assumed at 0.2% based on the fact that annualized return up to February 2014 is bout 0.2% monthly.
Attachment 7: CalTRUST Investment Monthly Interest Income by Account (October 2013 - March 2014)
Mea. B VRF
Item 11 - Attachments
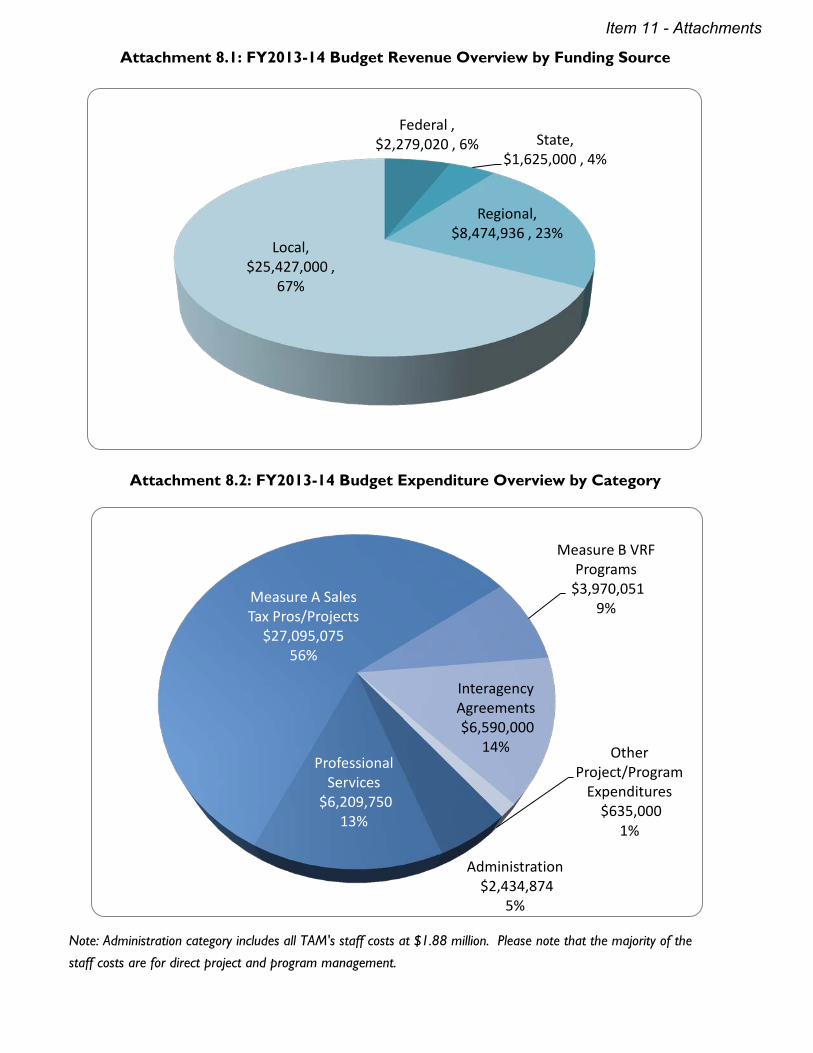
Attachment 8.1: FY2013-14 Budget Revenue Overview by Funding Source
Attachment 8.2: FY2013-14 Budget Expenditure Overview by Category
Note: Administration category includes all TAM's staff costs at $1.88 million. Please note that the majority of the staff costs are for direct project and program management.
Federal , $2,279,020 , 6% State,
$1,625,000 , 4%
Regional, $8,474,936 , 23%
Local, $25,427,000 ,
67%
Administration $2,434,874
5%
Professional Services
$6,209,750 13%
Measure A Sales Tax Pros/Projects
$27,095,075 56%
Measure B VRF Programs
$3,970,051 9%
Interagency Agreements $6,590,000
14% Other Project/Program
Expenditures $635,000
1%
Item 11 - Attachments
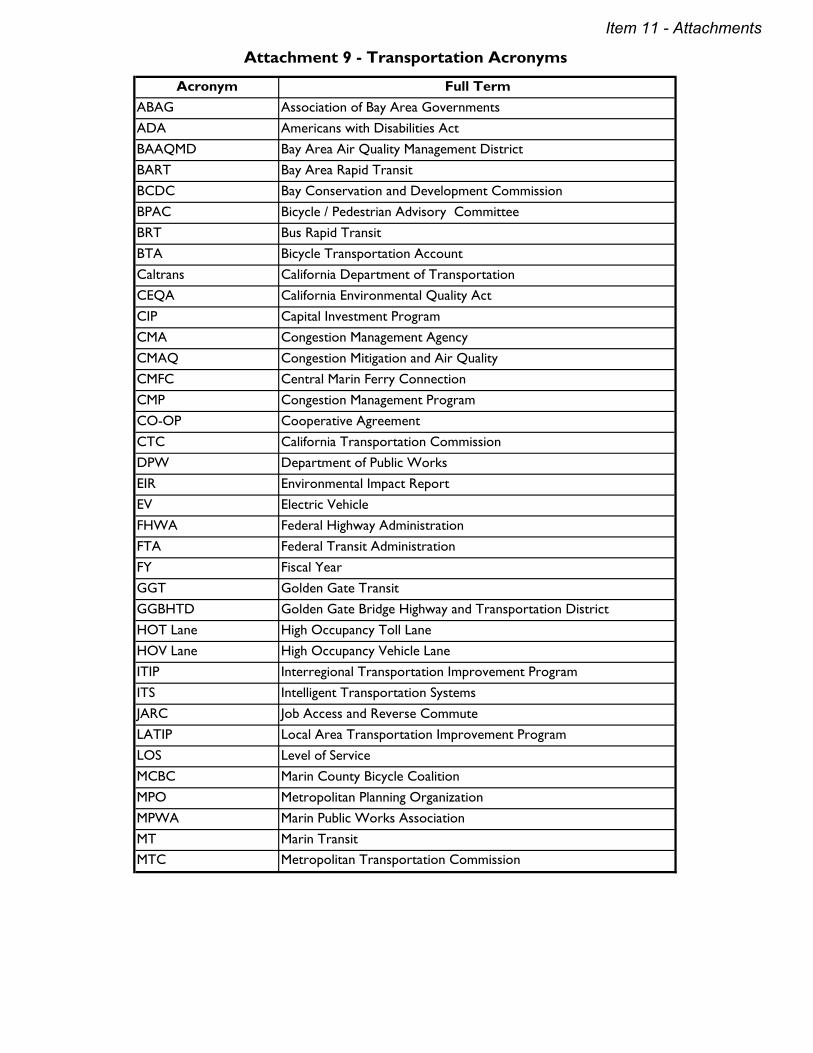
Acronym Full TermABAG Association of Bay Area GovernmentsADA Americans with Disabilities ActBAAQMD Bay Area Air Quality Management DistrictBART Bay Area Rapid TransitBCDC Bay Conservation and Development CommissionBPAC Bicycle / Pedestrian Advisory CommitteeBRT Bus Rapid TransitBTA Bicycle Transportation AccountCaltrans California Department of TransportationCEQA California Environmental Quality ActCIP Capital Investment ProgramCMA Congestion Management AgencyCMAQ Congestion Mitigation and Air QualityCMFC Central Marin Ferry ConnectionCMP Congestion Management ProgramCO-OP Cooperative AgreementCTC California Transportation CommissionDPW Department of Public WorksEIR Environmental Impact ReportEV Electric VehicleFHWA Federal Highway AdministrationFTA Federal Transit AdministrationFY Fiscal YearGGT Golden Gate TransitGGBHTD Golden Gate Bridge Highway and Transportation DistrictHOT Lane High Occupancy Toll LaneHOV Lane High Occupancy Vehicle LaneITIP Interregional Transportation Improvement ProgramITS Intelligent Transportation SystemsJARC Job Access and Reverse CommuteLATIP Local Area Transportation Improvement ProgramLOS Level of ServiceMCBC Marin County Bicycle CoalitionMPO Metropolitan Planning OrganizationMPWA Marin Public Works AssociationMT Marin TransitMTC Metropolitan Transportation Commission
Attachment 9 - Transportation Acronyms
Item 11 - Attachments
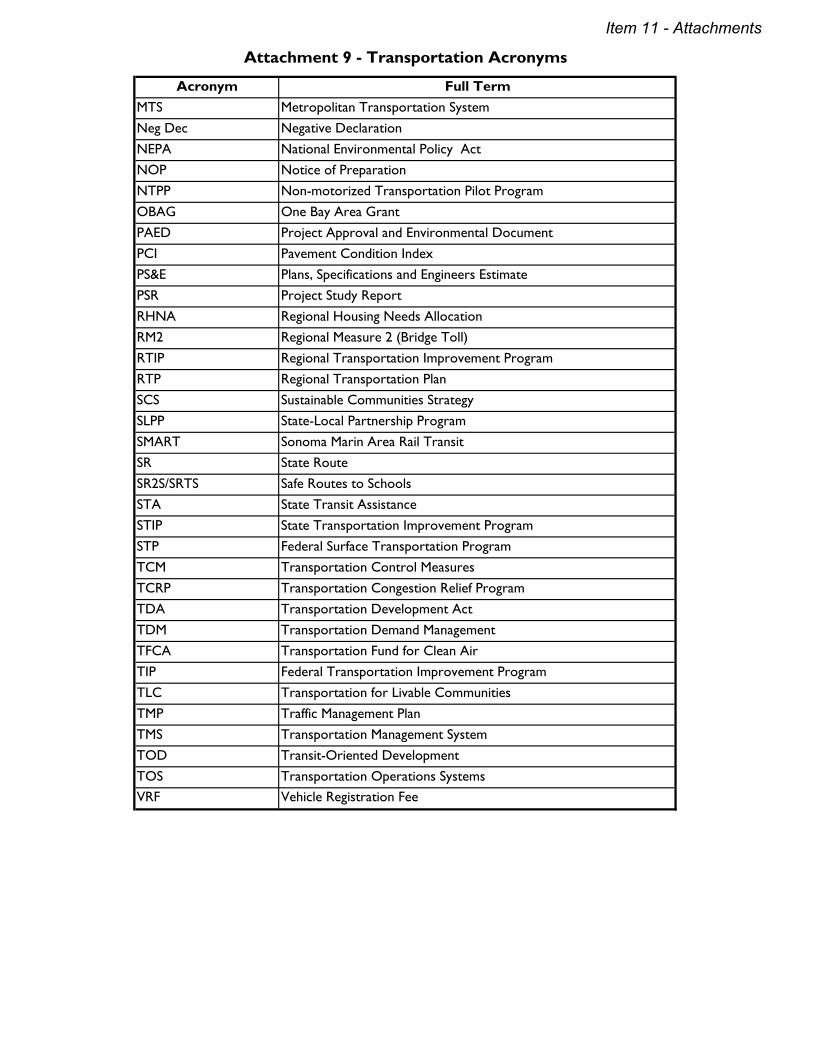
Acronym Full Term
Attachment 9 - Transportation Acronyms
MTS Metropolitan Transportation SystemNeg Dec Negative DeclarationNEPA National Environmental Policy ActNOP Notice of PreparationNTPP Non-motorized Transportation Pilot ProgramOBAG One Bay Area GrantPAED Project Approval and Environmental DocumentPCI Pavement Condition IndexPS&E Plans, Specifications and Engineers EstimatePSR Project Study ReportRHNA Regional Housing Needs AllocationRM2 Regional Measure 2 (Bridge Toll)RTIP Regional Transportation Improvement ProgramRTP Regional Transportation PlanSCS Sustainable Communities StrategySLPP State-Local Partnership ProgramSMART Sonoma Marin Area Rail TransitSR State RouteSR2S/SRTS Safe Routes to SchoolsSTA State Transit AssistanceSTIP State Transportation Improvement ProgramSTP Federal Surface Transportation ProgramTCM Transportation Control MeasuresTCRP Transportation Congestion Relief ProgramTDA Transportation Development ActTDM Transportation Demand ManagementTFCA Transportation Fund for Clean AirTIP Federal Transportation Improvement ProgramTLC Transportation for Livable CommunitiesTMP Traffic Management PlanTMS Transportation Management SystemTOD Transit-Oriented DevelopmentTOS Transportation Operations SystemsVRF Vehicle Registration Fee
Item 11 - Attachments