![Build Wealth Tax Planning eBook[1]](https://static.fdocuments.net/doc/165x107/577cd0aa1a28ab9e7892ceb5/build-wealth-tax-planning-ebook1.jpg)
To Tax or Not to Tax: Lessons from the Build America …civicresearchinstitute.com/online/PDF/To Tax...
27
1 To Tax or Not to Tax: Lessons from the Build America Bond Program about Optimal Federal Tax Policy for Municipal Bonds Shama Gamkhar and Beibei Zou* This paper seeks to explore what we can learn from the experience of the Build America Bond program about optimal federal tax policy for municipal bonds. It examines the effect of repealing the tax-exempt status of municipal bonds on their yields by com- paring tax-exempt bonds issued by state and local governments with the limited-period BAB program. The authors use an empirical model testing the effect of the tax-exempt status on the municipal bond yield, controlling for other yield determinants. The data for estimating this model are collected from the Municipal Securities Rulemaking Board for Texas for the period August to December 2010. The results from estimating the model show that the net effect of removing tax exemption on municipal interest costs is positive before considering the BAB direct subsidy. This indicates that the cost of long-term bor- rowing for state and local governments is likely to be affected by removing tax exemp- tion. The authors also find that the yield spread between taxable and tax-exempt bonds narrows with longer bond maturities and the credit rating of bonds. The size of the bond issue, risk-free interest rates, call options, and yield to first call increase the yield spread *Shama Gamkhar was an associate professor at the Lyndon B. Johnson School of Public Affairs, University of Texas at Austin, until her untimely death in a plane crash in 2013. Beibei Zou received her Ph.D. from the Lyndon B. Johnson School of Public Affairs. Dr. Zou can be reached by email at [email protected].
Transcript of To Tax or Not to Tax: Lessons from the Build America …civicresearchinstitute.com/online/PDF/To Tax...

1
To Tax or Not to Tax: Lessons from the Build America Bond Program about Optimal Federal Tax Policy for Municipal BondsShama Gamkhar and Beibei Zou*
This paper seeks to explore what we can learn from the experience of the Build America Bond program about optimal federal tax policy for municipal bonds. It examines the effect of repealing the tax-exempt status of municipal bonds on their yields by com-paring tax-exempt bonds issued by state and local governments with the limited-period BAB program. The authors use an empirical model testing the effect of the tax-exempt status on the municipal bond yield, controlling for other yield determinants. The data for estimating this model are collected from the Municipal Securities Rulemaking Board for Texas for the period August to December 2010. The results from estimating the model show that the net effect of removing tax exemption on municipal interest costs is positive before considering the BAB direct subsidy. This indicates that the cost of long-term bor-rowing for state and local governments is likely to be affected by removing tax exemp-tion. The authors also find that the yield spread between taxable and tax-exempt bonds narrows with longer bond maturities and the credit rating of bonds. The size of the bond issue, risk-free interest rates, call options, and yield to first call increase the yield spread
*Shama Gamkhar was an associate professor at the Lyndon B. Johnson School of Public Affairs, University of Texas at Austin, until her untimely death in a plane crash in 2013. Beibei Zou received her Ph.D. from the Lyndon B. Johnson School of Public Affairs. Dr. Zou can be reached by email at [email protected].

2 Municipal Finance Journal
1 The statutory history of the tax exemption of municipal bonds can be found on the website of the IRS (http://www.irs.gov/pub/irs-tege/ph1moda.pdf). Under the U.S. Consti-tution, the U.S. Supreme Court ruled in 1895 (Pollock v. Farmers’ Loan & Trust Co.) that the federal government cannot tax interest on municipal bonds. The 1895 decision was reversed by the U.S. Supreme Court in 1988 (South Carolina v. Baker), but the Congress again formally codified the exemption of state and local bonds from federal taxes in the Revenue Act of 1913, believing that such a tax would be unconstitutional. Although the Tax Reform Act of 1986 reduced the tax exemption from a number of private activity bonds, most municipal bonds have still to be exempted from the federal income tax.
between tax-exempt and taxable bonds. Additionally, the results suggest that the BAB program’s uniform subsidy of 35% of municipal bond interest cost was much larger than the cost difference between taxable BAB and tax-exempt municipal bonds.
INTRODUCTION
Tax exemption on municipal bonds was introduced in the Revenue Act of 1913.1 In its current formulation, investors holding tax- exempt municipal bonds are not taxed on the interest income from
these bonds (tax-exempt bonds), and other things being equal, this results in a lower yield on these municipal bonds compared to bonds for which interest income is taxable (taxable bonds). The rationale for the federal subsidy to state and local government borrowers is premised on the argu-ment that these bonds are used to generate funds for long-term invest-ments by governmental entities in infrastructure projects. However, due to the concern about the mounting federal debt and the downgrade of U.S. federal government Treasury ratings, reducing tax expenditures by the fed-eral government has put the option of taxing interest earned on municipal bonds on the table as one of the remedies to the federal fiscal deficit. This paper examines the effect of repealing the tax-exempt status of municipal bonds on their yields by exploring the experience of the Build America Bond (BAB) program. The BAB program was launched in April 2009 as part of the American Recovery and Reinvestment Act (ARRA) and ended in December 2010. The bonds were taxable and hence expected to have a higher yield than tax-exempt bonds issued by the state and local gov-ernments availing of this federal program. The experience of BABs can provide insights regarding optimal federal tax policy.
The way in which taxes influence municipal bond prices is an issue of importance in politics, economics, and finance (see Ang, Bhansali, and Xing, 2010b). In particular, since the 2008 financial crisis, taxing munici-pal securities has become one of the proposed remedies for federal fis-cal deficits (GAO, 2008). On August 6, 2009, the Congressional Budget Office (CBO) proposed the elimination of the tax-exempt status of state and municipal bonds to lower the federal deficit after the 2008 financial

To Tax or noT To Tax 3
2 The credit rate would be determined by the Secretary of the Treasury, and it would maintain the average interest subsidy to state and local issuers under pre-2009 law. This rate would probably be lower than the credit rate of 35% for BABs included in the ARRA (see Schroeder and Dutton, 2009).
crisis (CBO, 2009). According to the CBO: “Replacing tax-exempt bonds with tax-credit bonds, with a bondholder earning on outstanding bonds an after-tax return comparable with the return on a tax-exempt bond, would result in $3.8 billion of revenue gains from 2011 to 2014” (CBO, 2009, p. 211), and in $19.8 billion gains through 2019.2 If the tax exemption were eliminated altogether, the expected savings would be approximately $36 billion per year. The National Commission on Fiscal Responsibility and Reform suggested revoking the tax exemption of municipal bonds in December 2010 (National Commission, 2010). A similar proposal is also a part of the reforms of the federal tax code suggested by the Bipartisan Policy Center’s Debt Reduction Task Force (Hume, 2010). The President’s FY 2014 budget plan proposes a 28% federal marginal income tax rate cap on the benefits of tax exemption of interest earned on municipal bonds, and the Senate Budget Resolution includes a similar proposal (Jagoda, 2014); these are likely to be the basis for future budget talks.
Critics of the policy to repeal tax exemption of municipal bond interest contend that the political and economic effects of such a measure are likely to be significant. Tax exemption is one of the main attractions of munici-pal bonds to investors, especially individual investors in top income tax brackets (Ribeiro, 2009). Such investors could lose interest in municipal securities if this advantage were eliminated (Levisohn, 2009). A lower-ing of demand could significantly increase the borrowing cost of capital for state and local governments, which could influence the financial capa-bility of nearly every district, county, and state, in particular during the weak economy. In addition, the estimated savings from either reforming or repealing tax exemption of municipal bonds is relatively small compared to the $1.3 trillion federal deficit (Holeywell, 2010), and potential critics of these policies argue that the relatively small gains might not be worth the backlash (Schroeder and Dutton, 2009).
Responding to this critique, the proponents of repealing tax exemption of municipal bonds argue that most of the investors who would be signifi-cantly influenced by the tax-exempt status are in top tax brackets. Higher yields of taxable bonds would attract more individual investors from other tax brackets (Eizenga and Hanlon, 2011). In addition, foreign investors who cannot enjoy the tax-exemption benefit would be more interested in the U.S. municipal securities (Breckinridge, 2020). Therefore, the net effect of repealing the tax-exempt status from municipal bonds could be
4 Municipal Finance Journal
to expand the market, which might lower the borrowing cost for state and local governments instead of increasing it.
The experience of the BAB program has been used to support these arguments. The bonds were taxable and hence expected to have a higher yield than tax-exempt bonds issued by the state and local governments making use of this federal program. To offset the higher expected yield on these bonds, the federal government provided a tax credit equal to 35% of each interest payment made for the BABs issued in 2009 and 2010. The issuing jurisdiction had a choice of either keeping the credits as rev-enue (paying a higher coupon on the bond) or giving the credit subsidy to the state or local bond holder (paying a lower coupon on the bond). Most jurisdictions selected the former. Some scholars conducted evalua-tions for the BAB program and concluded that the program decreased the borrowing cost for state and local governments (Ang, Bhansali, and Xing, 2010a; Eizenga and Hanlon, 2011). In April 2010, the Department of the Treasury also reported that the BAB program would “save state and local governments around $12 billion in present value” (U.S. Department of the Treasury, 2010).
The BAB program subsidy was available only for bonds issued from 2009 through 2010 (although the subsidy will be paid for the life of the bonds issued under the program). Therefore, the BAB experiment does not efficiently answer the question of how eliminating tax exemption altogether influences the borrowing cost for state and local governments. However, by providing a comparable set of securities to the tax-exempt municipal bonds, other than the tax-exemption/tax-credit difference, the BAB pro-gram provides a near enough natural experiment by which to examine this issue. Furthermore, scholars and practitioners have realized that the yield spread of tax-exempt and taxable municipal bonds can vary across bonds with different characteristics and issuers (Ang, Bhansali, and Xing, 2010b; Green, 1993; Lin et al., 2009; Wang, Wu, and Zhang, 2008). This raises the question of how the policy of repealing tax exemption affects the yield spread between tax-exempt and taxable bonds, and also whether this yield spread varies with the maturity of the bonds and bond credit rating, as well as other characteristics of municipal bonds.
Our method for examining these questions is to use an empirical model testing the effects of the tax-exempt status on the interest cost of municipal bonds controlling for other determinants of municipal bond interest. The data for estimating this model are collected from the Municipal Securi-ties Rulemaking Board (MSRB) for Texas for selected months in the year 2010. The main finding of this study is that the yield spread between tax-exempt bonds and comparable taxable BABs is approximately 120 to 150 basis points before factoring in the BAB direct subsidy. Therefore, the net effect of removing tax exemption of municipal bonds is that the interest

To Tax or noT To Tax 5
cost of long-term borrowing will likely increase if the federal government does not replace this with another form of subsidy. Additionally, the 35% federal subsidy of the annual interest cost available to issuers of BABs was not revenue neutral. On net, the BAB federal subsidy lowered the cost of borrowing for issuers by approximately 45 basis points. Additionally, our empirical findings indicate that although bond yield varies with the matu-rity of the bond, this effect is a small positive for the tax-exempt bond, but the effect of the maturity of a taxable bond on its yield is negative. The net effect is that the yield spread between tax-exempt and taxable bonds (BABs) narrows with increased maturity of the municipal bonds issued in Texas. We also find that the yield spread between taxable and tax-exempt bonds varies with other characteristics of these bonds. For example, the yield spread decreases with improvements in the credit rating of bonds (reduction in credit risk), and it increases with the principal amount of the bond issue, risk-free interest rate, call options, and yield to first call features of the municipal bonds. We discuss these additional findings in detail later in the paper.
The next section of the paper reviews related prior research and pub-lished literature. Section three describes the data collection, variable mea-surements, empirical methodology, and hypotheses tested in this study. Sections four, five, and six provide the empirical results of the study, along with a discussion of these results and policy recommendations.
REVIEW OF LITERATURELiterature on the Effects of Taxes on Bond Yields
Theoretically, the average difference between the interest rate of a taxable security (t) and tax-exempt security (t
e), also referred to here as
“spread,” should be equal to the product of the taxable interest and the marginal tax rate (t*mtr) of the bond buyers if the bonds have comparable other characteristics such as bond maturity (Temel, 2001, p. 29):
T – te = t*mtr. (1)
However, this is barely the case in reality because of the complexity in the tax code, the diversity in investors’ preferences, and other market factors (Wang, Wu, and Zhang, 2008).
The issue of how taxes affect asset prices has generated extensive discus-sions among scholars and practitioners from various disciplines. Some stud-ies find that tax has little influence on asset pricing (Green and Odegaard, 1997), but most of the research shows significant differences in the pricing between tax-exempt and taxable securities (see Lin et al., 2009, for a sum-mary). Hildreth and Zorn (2005) summarize the evolution of the municipal debt market over the past quarter century and describe how the 1986 federal

6 Municipal Finance Journal
tax reforms influenced issuers and investors. After the 1986 reforms, only the interest on particular types of debt issued by state and local governments remained exempt from federal individual income taxation. Hildreth and Zorn (2005) show that the elimination of tax exemption for select subnational gov-ernment bonds raised the borrowing cost for these government entities.
A potential determinant of the yield spread between taxable and tax-exempt bonds is the maturity of the bonds. Green (1993) makes signifi-cant contributions to this line of research in his paper “A Simple Model of the Taxable and Tax-Exempt Yield Curves,” where, using data from June 1952 to December 1990, he examines why the differences in yields of tax-able and tax-exempt bonds are smaller than they are expected to be. Green builds a model for the yield spread of taxable and tax-exempt bonds and concludes that this yield spread increases with the maturity period of the bond. Wang, Wu, and Zhang (2008) estimate yield spreads between tax-able and tax-exempt bonds using data from July 2000 to June 2004. They use a generalized model including liquidity, default risk, and marginal tax rate to predict yields. They contend that liquidity risks of municipal bonds were not fully measured in previous studies, including the Green study. Controlling for liquidity risk, using data on municipal bond transactions, they obtain implicit tax rates of the tax-exempt municipal bond buyer:
mtr = (1 − te/t). (2)
Wang, Wu, and Zhang (2008, p. 1133) find the implicit marginal tax rate mtr to be “very close to the statutory tax rates of high-income individuals and institutional investors.” Based on this finding, they contend that the effects of taxes on bond yields are not correlated with maturities and that a substantial portion of the yield spread between municipal and Treasury bonds is accounted for by liquidity and default risks. Lin et al. (2009) find results that are consistent with the work of Wang, Wu, and Zhang. The results from their model do not show a significant relationship between yield spread of taxable and tax-exempt bonds and their maturities, and the estimated tax rate approaches the statutory tax rate. Ang, Bhansali, and Xing (2010b) also test the impacts of liquidity, default risk, and tax on yields of municipal bonds, but their conclusions are more supportive of Green’s findings. They show that neither liquidity nor default risks can explain the yield spread of municipal debt and taxable bonds. Instead, taxes matter in “determining the cross-sectional and time-series prices of tax-exempt bonds,” and “the after-tax yields of municipal bonds with the highest tax burdens are higher than can be explained” (p. 567).
Other Influential Factors of Bond YieldsBeyond the effect of the tax treatment of bond-on-bond yields, scholars
have discussed other factors determining the yields of municipal securities

To Tax or noT To Tax 7
and also the effects of eliminating tax exemption on the borrowing cost for state and local governments. A number of studies show the significant role of credit ratings on municipal bond yields; bonds with better ratings usually have lower yields than bonds with lower ratings (Allen and Dud-ney, 2008; Daniels, Ejara, and Vijayakumar, 2010; Liu and Seyyed, 1991; Longstaff and Schwartz, 1995; Sohl et al., 2008; Wang, Wu, and Zhang, 2008; Young, Faas, and Wandschneide, 1982). This is because investors, in particular individual bond buyers, rely on credit ratings to make judg-ments on the default risks of bonds (Daniels, Ejara, and Vijayakumar, 2010; Liu and Seyyed, 1991; Wang, Wu, and Zhang, 2008).
Maturity, which is associated with liquidity and default risks—also discussed above in the context of differences in taxable and tax-exempt yields—is another crucial factor for municipal bond yields; the longer the maturity, the higher the yield needs to be, because uncertainties increase over time (Daniels, Ejara, and Vijayakumar, 2010; Kalotay and Dorigan, 2009; Lin et al., 2009; Martell and Kravchuk, 2010; Wang, Wu, and Zhang, 2008).
The impacts of other factors have also been examined for their con-tributions in explaining default and liquidity issues related to municipal bonds. Bonds with insurance have, ceteris paribus, significantly lower default risks and increased liquidity relative to bonds without insurance (Brune and Liu, 2010; Daniels, Ejara, and Vijayakumar, 2010; Martell and Kravchuk, 2010). Characteristics of bonds such as who issues the bonds, whether they are general obligation or paid by project-specific revenues, and if they are callable before maturity dates, can affect the yield on bonds as well as the flexibility of trading in these bonds (Daniels, Ejara, and Vijayakumar, 2010; Kalotay and Dorigan, 2009; Martell and Kravchuk, 2010; Sohl et al., 2008; Young, Faas, and Wandschneide, 1982). Socio-economic features of a jurisdiction are also considered as influential fac-tors for bond yields and a government’s borrowing costs (Liu and Seyyed, 1991; Young, Faas, and Wandschneide, 1982).
METHODOLOGYEmpirical Model
We build a model for testing the effects of tax status and explaining variations in municipal bond yields. The model is as follows:
Yield = β0 + β
1*Tax + β
2*Iss1 +. . .+ β
6*Iss5 + β
7*Mat + β
8*Rate +
β9*Type + β
10*Ins + Β
11*Trea + β
12*Amount + β
13*Call + β
14*YTFC +
α1*Tax*Mat. . .+ α
8*Tax*Ins + α
9*Rate*Ins + ζ, (3)
where the yield of the municipal bond (Yield) is the dependent variable, defined as the yield to maturity of the municipal bond (percentage); β
0 is
8 Municipal Finance Journal
3 The credit rating considered for bonds with insurance is the bond rating after insurance, not the underlying bond rating without insurance. We did not have this latter information and could get to its effect only indirectly through another variable included in the model.
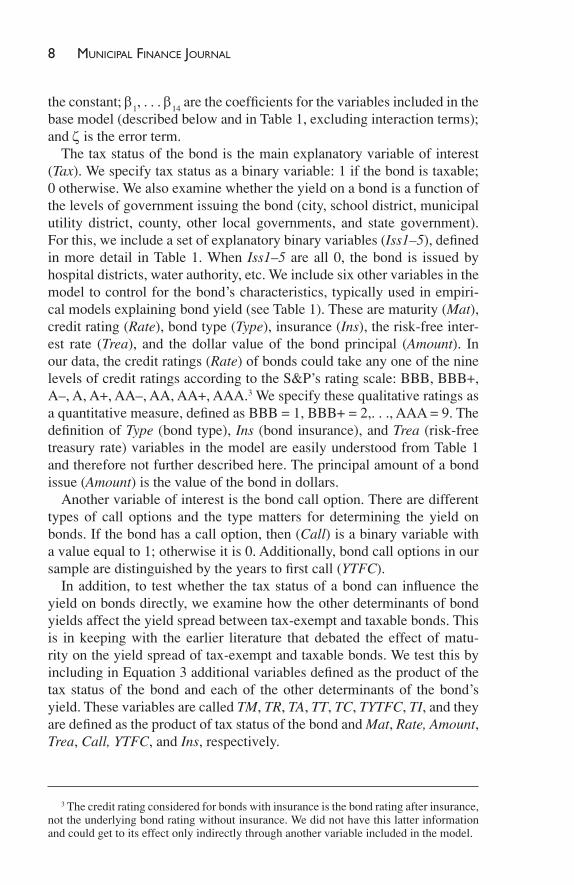
the constant; β1, . . . β
14 are the coefficients for the variables included in the
base model (described below and in Table 1, excluding interaction terms); and ζ is the error term.
The tax status of the bond is the main explanatory variable of interest (Tax). We specify tax status as a binary variable: 1 if the bond is taxable; 0 otherwise. We also examine whether the yield on a bond is a function of the levels of government issuing the bond (city, school district, municipal utility district, county, other local governments, and state government). For this, we include a set of explanatory binary variables (Iss1–5), defined in more detail in Table 1. When Iss1–5 are all 0, the bond is issued by hospital districts, water authority, etc. We include six other variables in the model to control for the bond’s characteristics, typically used in empiri-cal models explaining bond yield (see Table 1). These are maturity (Mat), credit rating (Rate), bond type (Type), insurance (Ins), the risk-free inter-est rate (Trea), and the dollar value of the bond principal (Amount). In our data, the credit ratings (Rate) of bonds could take any one of the nine levels of credit ratings according to the S&P’s rating scale: BBB, BBB+, A–, A, A+, AA–, AA, AA+, AAA.3 We specify these qualitative ratings as a quantitative measure, defined as BBB = 1, BBB+ = 2,. . ., AAA = 9. The definition of Type (bond type), Ins (bond insurance), and Trea (risk-free treasury rate) variables in the model are easily understood from Table 1 and therefore not further described here. The principal amount of a bond issue (Amount) is the value of the bond in dollars.
Another variable of interest is the bond call option. There are different types of call options and the type matters for determining the yield on bonds. If the bond has a call option, then (Call) is a binary variable with a value equal to 1; otherwise it is 0. Additionally, bond call options in our sample are distinguished by the years to first call (YTFC).
In addition, to test whether the tax status of a bond can influence the yield on bonds directly, we examine how the other determinants of bond yields affect the yield spread between tax-exempt and taxable bonds. This is in keeping with the earlier literature that debated the effect of matu-rity on the yield spread of tax-exempt and taxable bonds. We test this by including in Equation 3 additional variables defined as the product of the tax status of the bond and each of the other determinants of the bond’s yield. These variables are called TM, TR, TA, TT, TC, TYTFC, TI, and they are defined as the product of tax status of the bond and Mat, Rate, Amount, Trea, Call, YTFC, and Ins, respectively.
To Tax or noT To Tax 9
Table 1: Variables, Labels, and MeasurementVariable Label Measurement
Yield Yield Interest rate of each municipal bond (%)
Tax status Tax 1 taxable; 0 otherwise
Issuer
Iss1 1 city; 0 otherwise
Iss2 1 school district; 0 otherwise
Iss3 1 municipal utility district; 0 otherwise
Iss4 1 county; 0 otherwise
Iss5 1 state; 0 otherwise
Iss6 Iss1 through Iss5 are 0; refer to other po-litical subdivisions
Maturity Mat Maturity of each municipal bond
Credit rating Rate 1 BBB–, 2 BBB, 3 BBB+, 4 A–, 5 A, 6 A+, 7 AA–, 8 AA, 9 AA+, 10 AAA
Type of bonds Type 1 revenue; 0 general obligation
Insurance Ins 1 insured; 0 otherwise
Risk-free interest rate Trea Treasury rate corresponding to a munici-pal bond (%)
Bond amount at issuance Amount Principal in $ millions corresponding to each municipal bond
Call option Call 1 callable; 0 non-callable
Years to the first call YTFC Years from sale date to first call date
Interaction of tax and maturity TM Tax status * maturity
Interaction of tax and credit ratings TR Tax status * credit rating
Interaction of tax and amount TA Tax status * amount
Interaction of tax and Treasury rate TT Tax status * corresponding Treasury rate
Interaction of tax and call option TC Tax status * call option
Interaction of tax and yield to first call TYTFC Tax status * yield to first call
Interaction of tax and bond insurance TI Tax status * bond insurance
Interaction of credit rating and bond insurance RI Rate * bond insurance
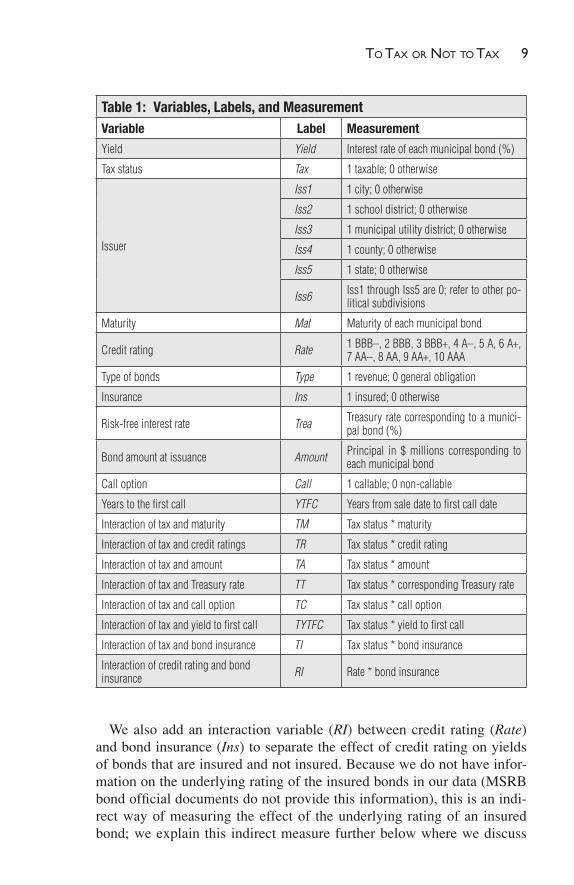
We also add an interaction variable (RI) between credit rating (Rate) and bond insurance (Ins) to separate the effect of credit rating on yields of bonds that are insured and not insured. Because we do not have infor-mation on the underlying rating of the insured bonds in our data (MSRB bond official documents do not provide this information), this is an indi-rect way of measuring the effect of the underlying rating of an insured bond; we explain this indirect measure further below where we discuss

10 Municipal Finance Journal
our empirical results. We are unable to examine the effect of liquidity risks on the yield spreads between tax-exempt and taxable bonds (also discussed in the earlier literature) due to our data restrictions (we have only primary bond issue data). We also excluded interaction variables between Tax and Issuer, as well as Tax and Type, primarily because there was no theoretical argument for expecting differences in the effects of tax status of bonds on yields across different types of issuers and across dif-ferent types of bonds.
Additionally, tax-exempt bonds might have features such as the alterna-tive minimum tax (AMT) or be subject to the AMT provisions of the federal individual income tax law. Tax-exempt bonds might also have a special feature—that they are bank qualified (BQ)—which means that private banks can receive tax exemption on interest earned from their holdings of such BQ tax-exempt bonds. Finally, municipal bonds in general can be consid-ered to be index bonds—that is, they qualify for inclusion in a bond index. In this paper, we do not distinguish bonds by these characteristics (BQ and index bond), primarily because our data are limited. We discuss these issues more fully below and also examine their implications for our results.
Research HypothesesWe postulate that taxable bonds have higher yields than tax-exempt
bonds with comparable characteristics. We also postulate that the type of issuer (Iss1. . .Iss6) has an effect on municipal bond yields. We expect that general purpose governments such as state, cities, and counties will have lower yields on their bonds than special purpose units of government (Iss6 – the omitted binary variable). This is primarily due to the diversity of reve-nue streams available to general purpose governments. Bonds with longer maturity (Mat) will have higher yields than bonds with shorter maturity, due to the greater risk associated with longer-term bonds. We also postu-late that the higher the credit rating (Rate) of the bond, the lower the yield will be. Rate measures the default risk of the bond, and Mat frequently is a proxy for liquidity risk (all else being equal, longer maturity bonds are less liquid than shorter maturity bonds). However, the best way to examine the role of liquidity risk is to observe the secondary market performance of municipal bonds (Marlowe, 2006; Wang, Wu, and Zhang 2008).
Regarding the type of bonds (Type), we expect that general obligation bonds will have lower yields than revenue bonds. Insured bonds (Ins) will have lower yields than uninsured bonds, because lowering yields is the pri-mary purpose for the seller’s purchasing of bond insurance. The yield on a municipal bond is expected to vary positively with the yield on comparable Treasury bonds (more on how we constructed this variable below). The effect of the principal (Amount) on the yield is uncertain. Typically, larger borrowing should increase the yield on the bond, but bonds above a thresh-

To Tax or noT To Tax 11
old principal of $250 million have greater liquidity because they become eligible for inclusion in a bond index; because their trading performance is likely to correlate well with the index, investors can enter into various risk-reducing hedges based on the index. Additionally, tax-exempt bonds are eligible to be bank qualified (BQ) if the issuer issues less than $30 million in aggregate for an entire year (basically a small issuer); this feature, which was not available to taxable bonds, gives smaller issuers a yield advantage. Additionally, taxable bonds were issued mostly as term bonds (a design feature that is similar to other corporate taxable bonds), and their average size was consequently larger than that of the tax-exempt bonds.
Regarding the bond call option variables, Call and YTFC, if the bond has a call option (Call = 1), we expect the yield to be higher than for bonds that do not have a call option (Call = 0). In addition, we expect that the longer the duration before the call option can be exercised (larger YTFC), the higher will be the yield, due to greater unpredictability about whether the bond issuer will exercise the call option. The interaction term RI measures the effect of the underlying bond rating—when the bond is insured—on the bond yield, and we expect this to be positive, given the state of crisis in the bond insur-ance industry. It is quite plausible that only very poorly rated bonds sought bond insurance, with the exception of school districts in Texas that were able to purchase insurance from the Texas Permanent School Fund, an AAA-rated insurance available to school districts for a nominal premium.
Additionally, considering the tax interaction variables TM, the effect of this variable is on the yield difference between taxable and tax-exempt bonds as it relates to the maturity of the bond. As per the Green (1993) hypoth-esis described above, the yield difference between taxable and tax-exempt bonds increases with the maturity of the bonds. If this is the case, then we expect the coefficient of TM in Equation 3 to be positive. We postulate that a lower credit rating will increase the bond yield more if the bond is taxable than if it is tax exempt; in this case, the coefficient of TR will be negative. The interaction term between tax status of the bond and the Amount (TA) is uncertain, as is the effect of the Amount variable described earlier.
In general, when the risk-free interest rate (Trea) is average or above average, the relative difference between tax-exempt and taxable yields can be driven by the marginal tax rate; when the risk-free interest rate is rela-tively low, there can be a “yield compression,” meaning that the relative difference between tax-exempt and taxable yields becomes smaller. In the former case, we expect TT to be positive, and in the latter case, TT is likely to be close to zero.
BABs could be issued with a number of different types of call options: (1) all BABs had an extraordinary call at par in the event that the federal government failed to appropriate or cancelled the BAB subsidy. In the early months of the program, this call feature might have cost issuers a few

12 Municipal Finance Journal
4 The assessments regarding the yield penalty differences for call provisions between BABs and tax-exempt bonds were provided by an anonymous financial industry expert.
basis points in yield, but after BAB issuance became more prevalent, this penalty disappeared; (2) all BABs had a make-whole call provision; this is generally considered a free option (no yield penalty) because the investor gets a premium over market if the bond is called; (3) a minority of BABs had a typical muni 10-year call option, and this did have a yield penalty that was slightly higher for BABs than for tax-exempt bonds (one estimate puts this difference between 30 and 60 basis points).4 Therefore, the coef-ficients of the interaction term TC and TYTFC are expected to be positive.
Finally, we also control for the difference in the yield between taxable insured bonds and tax-exempt insured bonds in Equation 3, with the inter-action variable TI. In general, we expect that TI will be positive, because the BABs had greater uncertainty about repayment due to the federal sub-sidy’s going directly to the state and local government as opposed to the taxpayer. However, the uncertainty surrounding the bond insurance indus-try during 2010 makes the effect of this variable uncertain.
Bond DataWe test the difference between the taxable municipal bonds from the
BAB program and tax-exempt bonds to indicate the effects of taxes on yields. The Texas municipal bond data on bond yield, tax status, and issuer have been collected from the MSRB database (http://emma.msrb.org/) for the period from August to December 2010. The information of other rel-evant determinants of bond yields included in our model—credit rating, maturity, bond type, insurance, call option, and bond purpose—are also obtained from the MSRB database.
According to the monthly data released by the Department of the Trea-sury (see Table 2), the period from August to December 2010 was the peak of issuance for BABs and also reflected a better understanding of these bonds by the players in the municipal bond markets. Another advantage of selecting August to December 2010 as the target time period is that the influence of the 2008 financial crisis and the follow-up recession on the municipal bond market was relatively smaller compared to the earlier months of the BAB program.
In addition, we focus on the State of Texas to conduct this analysis to abstract from the state differences in fiscal institutions, municipal bond poli-cies, and varying economic situations at the state level. Texas is also the third largest issuer of BABs (see Table 3), after California and New York. These other states have a state income tax, and their state bonds are exempt from the state income tax (an additional subsidy not available in Texas), which could complicate the measurement of the effect of eliminating the federal subsidy

To Tax or noT To Tax 13
alone. The findings may not be directly applied to other states because they have an income tax code that exempts municipal bond interests. We also focus on long-term bonds with more than 10 years of maturity.5 It is important to note that this study uses data only from the primary market because the yields in this market represent the borrowing costs of state and local governments.
Table 2: All U.S. BAB Issuances and Volumes
Period NumberVolume
$Millions % of Muni Bonds Total
2009
April 12 7,632 20.1
May 41 2,699 8.1
June 87 4,993 11.0
July 70 3,532 12.9
August 107 9,632 24.5
September 112 6,795 20.7
October 112 12,944 29.6
November 106 7,538 16.2
December 99 8,051 28.0
April to December 746 63,817 19.0
2010
January 96 7,078 21.3
February 96 7,243 25.8
March 135 12,789 26.3
April 120 6,420 23.6
May 115 9,229 21.1
June 141 9,277 26.9
July 98 7,063 24.0
August 113 5,405 16.5
September 119 9,436 26.1
October 137 12,416 27.1
November 149 15,335 26.5
December 210 15,749 47.6
January to December 1,529 117,439 26.1
Total 2,275 181,256 23.1
Source: U.S. Department of the Treasury (http://www.treasury.gov/initiatives/recovery/Pages/babs.aspx).
5 We also omitted the bonds with less than 10-year maturities in a serial bond and in-cluded only 10-year maturity term bonds in the data.

14 Municipal Finance Journal
Table 3: BAB Issuances and Volumes by State
State Number of Issues
Total Amount Issued
($Millions)
StateNumber
of Issues
Total Amount Issued
($Millions)
AK 5 358 NC 36 1,623
AL 18 614 ND 7 68
AR 3 40 NE 60 1,008
AZ 39 1,978 NH 6 355
CA 158 37,680 NJ 33 7,364
CO 63 4,074 NM 7 276
CT 19 1,915 NV 25 2,562
DC 8 1,950 NY 59 20,630
DE 6 519 OH 123 8,344
FL 75 5,537 OK 29 816
GA 17 3,729 OR 8 971
HI 7 1,268 PA 64 5,022
IA 37 760 PR 5 1,013
ID 6 143 RI 1 12
IL 245 11,231 SC 32 1,193
IN 38 2,072 SD 22 355
KS 55 1,629 TN 42 1,836
KY 105 2,975 TX 95 16,676
LA 9 949 UT 47 2,900
MA 17 4,836 VA 45 3,821
MD 40 3,465 VI 1 37
ME 3 88 VT 4 126
MI 70 2,625 WA 89 6,133
MN 115 1,495 WI 142 2,170
MO 120 2,992 WV 2 88
MS 6 765 WY 6 142
MT 1 30 Total 2,275 181,256
Source: U.S. Department of the Treasury (http://www.treasury.gov/initiatives/recovery/Pages/babs.aspx).
After applying our data filters, we obtained 3,432 bonds issued by state and local governments in Texas over our sample period. We dropped some bonds for one or more of the following reasons: We did not have access to official documents for a bond; there was no information on trading activity on a bond; or the bond was not issued by a governmental entity.

To Tax or noT To Tax 15
6 The risk-free interest rate can be found at the Federal Reserve website (http://www.federalreserve.gov/releases/h15/data.htm).
7 A financial industry specialist, who prefers to remain anonymous, informed us that in general, BABs did not have any economic advantage on the short end of the yield curve; thus, most BABs were issued on the longer end of the yield curve. This is marginally evident in our sample (see Table 4): Average maturity for BABs is 16 years and average maturity for tax-exempt bonds is 15 years.
The risk-free interest rate included in our model can be represented by the Treasury yield for the appropriate maturity Treasury bond traded on the sale date that matches the specific municipal bond. The Federal Reserve database6 lists the 10-year, 20-year, and 30-year Treasury bonds issued on each day (except December 24 and 25) in 2010. In order to obtain risk-free interest rates matching municipal bonds maturing from 10 years to 30 years, we assume a linear relationship between maturity and Treasury bond inter-est rate and calculate risk-free interest rates matching maturities between 10 and 30 years with the three given points. For instance, to calculate the interest rate for a 15-year Treasury bond, we use the function below:
RR R
R1520 10
101015 10= * +
( )( ) , (4)
where Rn refers to the n-year Treasury bond (e.g., R
15 refers to the 15-year
Treasury bond).Table 4 also shows a summary of bond characteristics for the sample
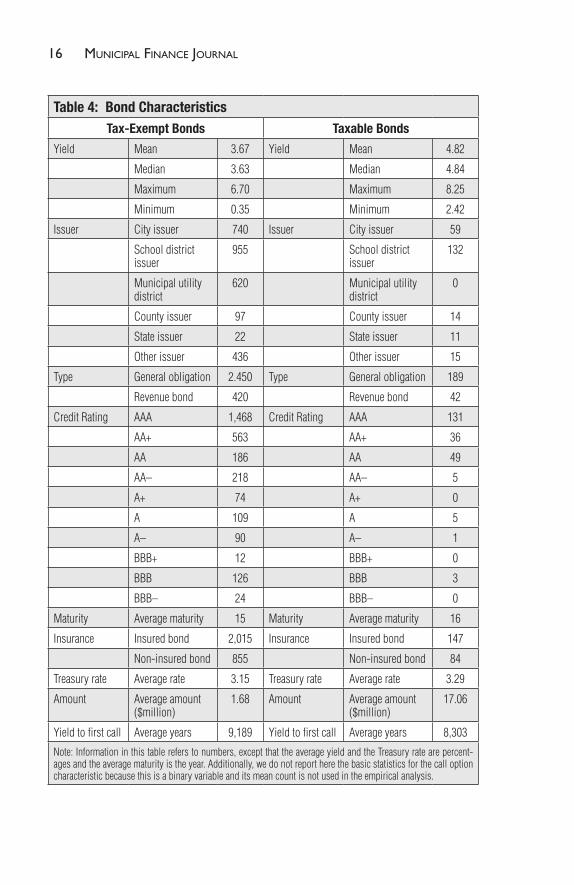
of bonds in our data, grouped by tax status. A few of these are described below. There are 231 taxable bonds from the BAB program, versus 2,870 non-taxable bonds. It is apparent that the taxable bonds have higher yields than the non-taxable bonds, with the taxable bonds having an average yield of 4.82% and the non-taxable bonds having an average yield of 3.67%—a difference of 1.15%, or 115 basis points. It is important to point out that all taxable bonds issued by Texas governments during the months of August to December 2010 that remained in our sample are BABs, after the elimina-tion described above. For this window of time, the data show that besides municipal utility districts and “other districts,” all jurisdictions (cities, school districts, county, and state) had a higher share in the issuance of BABs than their share in the issuance of tax-exempt bonds. The proportion of general obligation bonds in the BAB sample is only slightly lower than in the tax-exempt sample, but GO bonds constitute the majority of bonds issued in both cases. A lower percentage of BABs were insured as compared to tax-exempt bonds. The BABs and tax-exempt bonds had about the same average maturity.7 Overall, the average size (Amount) of the BAB issues is much larger than the average size of the tax-exempt bonds. A reason for this size difference may be that the tax-exempt bonds were generally sold as serial bonds, whereas the BABs were sold as term bonds.
16 Municipal Finance Journal
Table 4: Bond CharacteristicsTax-Exempt Bonds Taxable Bonds
Yield Mean 3.67 Yield Mean 4.82
Median 3.63 Median 4.84
Maximum 6.70 Maximum 8.25
Minimum 0.35 Minimum 2.42
Issuer City issuer 740 Issuer City issuer 59
School district issuer
955 School district issuer
132
Municipal utility district
620 Municipal utility district
0
County issuer 97 County issuer 14
State issuer 22 State issuer 11
Other issuer 436 Other issuer 15
Type General obligation 2.450 Type General obligation 189
Revenue bond 420 Revenue bond 42
Credit Rating AAA 1,468 Credit Rating AAA 131
AA+ 563 AA+ 36
AA 186 AA 49
AA– 218 AA– 5
A+ 74 A+ 0
A 109 A 5
A– 90 A– 1
BBB+ 12 BBB+ 0
BBB 126 BBB 3
BBB– 24 BBB– 0
Maturity Average maturity 15 Maturity Average maturity 16
Insurance Insured bond 2,015 Insurance Insured bond 147
Non-insured bond 855 Non-insured bond 84
Treasury rate Average rate 3.15 Treasury rate Average rate 3.29
Amount Average amount ($million)
1.68 Amount Average amount ($million)
17.06
Yield to first call Average years 9,189 Yield to first call Average years 8,303
Note: Information in this table refers to numbers, except that the average yield and the Treasury rate are percent-ages and the average maturity is the year. Additionally, we do not report here the basic statistics for the call option characteristic because this is a binary variable and its mean count is not used in the empirical analysis.

To Tax or noT To Tax 17
REGRESSION RESULTSWe estimate Equation 3 to examine how the tax status of municipal
bonds affects the yields and whether the yield spread between tax-exempt and taxable (BAB) municipal bonds is compensated by the BAB subsidy given to the state and local governments that issued BABs. The model described by Equation 3 is estimated using ordinary least squares (OLS). Table 5 lists the results for Models A through C. We do not unpack the interaction terms and other variables here because explaining determinants of municipal bond yields is not the main objective of this paper. Instead, we provide a summary of the results and their indications.
Table 5: Estimation Results of Tax Effects on Yield
Variable Model A Model B Model C
Adjusted R2 0.8034 0.8250 0.8283
Intercept 1.0101*** 1.2070*** 1.4343***
Tax 1.1972*** 0.5944*** 0.17052
Iss1 –0.1318*** –0.1455*** –0.1347***
Iss2 –0.3555*** –0.3999*** –0.3839***
Iss3 0.1881*** 0.1755*** 0.1630***
Iss4 –0.1257*** –0.1357*** –0.1353***
Iss5 –0.3156*** –0.2253*** –0.1475**
Mat 0.0248*** 0.0301*** 0.0313***
Rate –0.0889*** –0.1054*** –0.1006***
Type 0.2284*** 0.2014*** 0.2069***
Ins 0.2088*** –0.1712*** –0.1466***
Trea 0.8891*** 0.8054*** 0.8048***
Amount 0.0006 –0.0023** –0.0024**
Call 0.1788*** 0.1677*** 0.1225***
YTFC 0.0003 0.0134*** –0.0117**
TM –0.0426*** –0.0505***
TR –0.1828*** –0.2165***
TA 0.0027** 0.0031***
TT 0.9046*** 0.8853***
RI 0.0478*** 0.0423***
TC 0.3917***
TYTFC 0.0502***
TI 0.1653***
* significant at 10% significance level; ** significant at 5% significance level; *** significant at 1% significance level.

18 Municipal Finance Journal
Overall, the results indicate that taxable bonds have higher yields than tax-exempt bonds. With comparable characteristics, this difference is about 120 to 150 basis points, depending on whether we use a parsimo-nious model (A) or an expanded model (C). Model A includes all con-trol variables (Tax, Issuer, Mat, Rate, Type, Ins, Trea, Amount, Call, and YTFC) except the interaction variables. The estimated coefficients from Model A show that:
1. Tax has a large, statistically significant, and positive effect on the bond yield—the coefficient indicates that the taxable bond yield is, on average, about 120 basis points higher than the tax-exempt bond, holding the other variables the same;
2. Among the control variables, several of the issuer variables are sig-nificant—on average, most jurisdictions in Texas issued bonds with lower yields than Iss6, with the exception of Iss3 (MUDs), which issued bonds with higher yield than bonds issued by Iss6;
3. As expected, bond yields vary positively with maturity of bonds and negatively with credit ratings—yields are higher for revenue bonds than for general obligation bonds, and the Treasury rate has a positive effect on municipal bond yields;
4. Somewhat counterintuitively, bond yields are positively related to bond insurance. As discussed above, the effect of insurance is diffi-cult to predict because of the crisis situation in the insurance industry at that time. Additionally, the bond that needs insurance probably has a lower underlying rating than the bond shown after bond insurance (our data measure the latter type of credit rating). Another way to measure the effect of bond insurance on yields is to consider both insured and uninsured bonds issued by the same entity—we do not make this comparison here.
Our expanded models (Models B and C) allow us to parse out how each of the bond characteristics contributes to the difference in yield between tax-exempt and taxable bonds (yield spread); these results are summarized in Table 5. In Model B, we examine how selected determinants of bond yield affect the yield spread between tax-exempt and taxable bonds. We selected these variables based on their policy significance as described above in the paper: TM, TR, TA, and TT (to recap, these symbols represent the product of tax status of the bond with each of the following other deter-minants of bond yields: maturity, credit risk, principal amount or size of the bond issue, Treasury or risk-free interest rate, respectively). Addition-ally, we add the variable RI—interaction between bond rating and the bond insurance—to the variables included in Model A. As discussed above, RI is our proxy for the underlying rating of bonds that are insured, and we

To Tax or noT To Tax 19
8 It is worth repeating here that almost all school district bonds in Texas can purchase bond guarantees (insurance) from the State’s Permanent School Fund (PSF) at a nominal cost and thereby receive an AAA bond rating.
expect this variable to be positively related to bond yields—i.e., we expect that only bonds with relatively low underlying ratings purchased insurance during this period.8 In Model C, we add three more interaction variables: product of tax status (Tax) of the bond and the call option variables TC and TYTPC, as well as the interaction between Ins and Tax (TI). Because the estimated results of Models B and C are as expected, and adjusted R squares of these two models are only slightly higher than Model A, we select the parsimonious Model A for further analysis.
DOES THE BAB PROGRAM OVER-SUBSIDIZE MUNICIPALITIES?
Given the mean yield of the non-taxable bonds (te) of 3.67% and the mean yield of taxable bonds (t) of 4.82% (note that, in this case, these latter were all BABs), the implied marginal tax rate of the taxpayer that is neutral between tax-exempt and taxable bonds is 24%. However, given a federal BAB subsidy (s) equal to 35% of the taxable bond yield, the actual net after-tax and subsidy yield difference (NAT&SYD) in the municipal borrowing, using the BAB and tax-exempt bond mean yields, is: t* ns − te = 4.82*0.65 – 3.67 = – 0.54 (ns is the proportion of the BAB yield that is not subsidized or ns = 1 – s). This negative difference in cost, based on the mean yields of tax-exempt and taxable (BAB) bonds, suggests that the BAB program on average over-subsidizes the state and local governments by 54 basis points. Also, by this calculation, a revenue-neutral subsidy for BABs is 24%. However, this calculation of NAT&SYD, or the extent of over-subsidy in municipal borrowing cost, is biased because it does not control for the differences in yields of the tax-exempt and taxable munici-pal bonds due to determinants other than the tax status of the bond.
For an unbiased calculation of the extent of over-subsidy by the federal government of BABs relative to tax-exempt bonds, we need the predicted values of yield of taxable and tax-exempt bonds from an estimated regression equation that controls for the determinants of bond yields. We have made these calculations using the estimated coefficient values of Model A and based on the following assumptions about the independent variables in our model:
1. The bond is issued by a city (i.e., except for the city binary variable, all other issuer binary variables are set to zero in our calculation);
2. The bond has a maturity of 15 years (this is the average maturity in our sample for tax-exempt bonds—the average maturity of the tax-able bond is also close);

20 Municipal Finance Journal
3. The bond is AAA rated (an AAA rating implies that Rate = 10; code for AAA bonds included in our sample);
4. It is a general obligation bond (type = 0);
5. The bond is insured (ins = 1);
6. The comparable federal Treasury rate is approximately 3.17% (aver-age for Treasury bonds of comparable maturity to bonds included in our sample);
7. The principal amount issued is $1.68 million (average principal amount in our sample for GO bonds);
8. The bond has a call option available (call = 1); and
9. The number of years to first call is nine (this is the average for YTFC in our sample).
Again, we use the estimated Model A to make our predictions about the yields of taxable and tax-exempt bonds:
Taxable:
Yield = 1.0101 + 1.1972 – 0.1318 + 0.0248*15 – 0.0889*10 + 0.2088 + 0.8891*3.17 + 0.0006*1.68 + 0.1788 + 0.0003*9 (5a)
Tax-exempt:
Yield = 1.0101 – 0.1318 + 0.0248*15 – 0.0889*10 + 0.2088 + 0.8891*3.17 + 0.0006*1.68 + 0.1788 + 0.0003*9 (5b)
Using a parsimonious Model A, we estimate that the NAT&SYD is slightly smaller, or in this case that the BAB is over-subsidized by approx-imately 45 basis points (Table 6), as compared to the simple calculations of this over-subsidy considering the differences in actual yields. Also, by this calculation, a revenue-neutral subsidy for BABs is around 26%. In this light, the President’s FY 2014 budget plan, which proposes a 28% federal marginal income tax rate cap on the benefits of tax exemption of interest earned on municipal bonds, and the Senate Budget Resolution including a similar proposal, both appear to be reasonable. This is because any tax payer whose rate is higher than the implied marginal tax rate reaps sur-plus tax savings or the tax-saving incentive for these tax payers is greater than needed to induce their demand for municipal bonds. However, we need more research to understand the full implications of this proposal for municipal bond yields and long-term borrowing costs.
If the BAB subsidy is overly generous, as appears to be the case from anecdotal assessments and evidence provided by our research for a very specific case described in Table 6, why did jurisdictions issue any tax-exempt bonds during the time period BABs were available (i.e., 2010)? We offer a few reasons, not an exhaustive list:

To Tax or noT To Tax 21
1. The BAB program did not cover all possible new money issue sce-narios; some issuers had uses that qualified to be tax-exempt but did not qualify for BABs, such as reimbursements for capital expendi-tures made by municipal bond issuers prior to the effective inception date for the BAB program.
2. The borrowing was for reserve funds.
3. In order to keep bonds qualified as BABs, issuers had to be prepared to certify that all proceeds from these bonds plus any interest on those proceeds were spent on qualified projects.
4. Consequences of failure to comply with even a minor BAB provision (including clerical errors) could allow the IRS to cancel the subsidy on the entire issue, and some issuers did not want to take that risk.
5. Some issuers wanted to preserve the 10-year call flexibility, and as indicated above, the penalty on this was higher for BABs than for tax-exempt bonds.
CONCLUSIONSThis paper has examined the effect on the yields of municipal bonds of
repealing their tax-exempt status by comparing tax-exempt bonds issued by state and local governments with the limited-period taxable BABs. For this we developed an empirical model to test the effects of the bonds’ tax-exempt status on bond yields, controlling for other determinants of municipal bond yields.
The estimated models show that bond tax status positively influences the yields of municipal bonds. Although the removal of tax exemption of municipal bonds is expected to expand the market for these bonds beyond the niche market of higher income federal tax payers (those tax payers whose marginal tax rate makes the after-tax yield on taxable bonds lower than the tax-exempt bond yields), the experience with BABs suggests that
Table 6: Municipal Bonds Average Yields% Actual % Predicted
Taxable yield (BAB) (t) 4.82 4.80
Tax-exempt (TE) yield (te) 3.67 3.57
Difference in yield (t – te) 1.15 1.23
Implied tax rate (1 – te/t) 0.24 0.26
% of yield actually subsidized (s) 0.35 0.35
% of yield not subsidized (ns) 0.65 0.65
NAT&SYD (t*ns – te) – 0.54 – 0.45
22 Municipal Finance Journal
the expansion of the municipal bond market itself might not fully offset the yield benefit provided by the tax exemption on municipal bond yields to state and local governments—municipal bond yields are expected to rise by 120 to 150 basis points if the tax exemption of these bonds is eliminated.
The yield spread between taxable and tax-exempt bonds has been higher than the marginal tax rates of individuals purchasing these bonds. Green (1993) provides empirical evidence that suggests the yield spread between taxable and tax-exempt bonds, in addition to being explained by the mar-ginal tax rate of the buyer, is also influenced by the bonds’ maturity—i.e., the yield spread gets larger with the length of the maturity period of a bond. Wang, Wu, and Zhang (2008) disagree with this finding, and their empirical work suggests that the yield spread between tax-exempt and tax-able municipal bonds is explained by liquidity and credit risk differences in these bonds. We find that the yield spread varies with bond maturity, but it tends to decrease rather than increase (the latter was suggested by Green). Our research shows that there are several determinants of bond yields that explain the yield spread between tax-exempt bonds and taxable bonds, including:
• Thecreditratingofthebond;
• Theprincipalamountofthebond;
• Bondinsurance;
• Changesintherisk-freefederalTreasuryinterestrates;
• Sizeofthebondissue;and
• Thetypesofcalloptions.
Some additional findings of interest are that:
• Bondcreditratingshavesmalleryield-reducingbenefitsintax-exemptbonds than in taxable bonds (narrow yield spread);
• Across-the-boardinsuredmunicipalbonds,whethertax-exemptortax-able, get a smaller benefit from bond rating because the potentially low-er underlying rating of such bonds is a factor affecting their yields;
• The sizeof thebond issuehas adifferential effect on theyield fortax-exempt and taxable bonds—larger-sized bonds experience yield reduction if they are tax exempt, and the reverse is the case if the bond is taxable (enlarge the yield spread);
• Changesintherisk-freeinterestrate,calloptions,andyieldtofirstcallall increase yield spread; and
• Insuranceplaysaconfoundingroleinitseffectsonbondyieldsdur-ing this time due to the effects of the financial crises on the insurance industry.

To Tax or noT To Tax 23
9 The example considers a general obligation bond issued by a city, maturity of 15 years, AAA rated, insured, with comparable federal Treasury rate at approximately 3.17% and an amount issued of $2.67 million with a single call option available and the years to first call at nine years.
The findings of this research also suggest that a policy of a 35% federal subsidy of the interest costs of BABs is not revenue neutral; it lowers the municipal borrowing costs by more than the subsidy required to offset the additional interest costs of municipal borrowing with taxable bonds. For example, in the special case described in the previous section comparing the predicted average yields of taxable and tax-exempt bonds issued by Texas,9 the BAB program appears to be over-subsidizing municipal bonds by 45 basis points. In this special case, a revenue-neutral subsidy is around 26%. As noted, the President’s FY 2014 budget plan, with its proposed 28% cap on tax exemption of interest earned on municipal bonds, and the similar Senate Budget Resolution thus both appear to be reasonable. Any tax payer whose tax rate is higher than the implied marginal rate reaps surplus tax savings, and the tax-saving incentive for these tax payers is greater than needed to induce their demand for municipal bonds. However, we need more research to understand the full implications of this proposal for municipal bond yields and long-term borrowing costs.
More research is also needed to design a policy that provides revenue-neutral rates of subsidy for taxable municipal bonds. The results presented in this paper are a starting point for a larger study to examine these alterna-tive policy scenarios. Some of the directions for our future research include, but are not limited to, expanding our data to cover a longer period of time to observe BABs, considering secondary market data, and including more states. These will allow us to control for liquidity risks in municipal bonds (by observing various yield spreads in secondary market transactions). Other directions in which this research can be improved include adding additional determinants of municipal bond yields to the estimated equa-tion and employing more advanced estimation techniques.
ReferencesAllen, A., and D. Dudney (2008). “The Impact of Rating Agency Reputation on Local
Government Bond Yields.” Journal of Financial Service Research, 33(1), 57–76.Allen, A., G. Sanders, and D. Dudney (2009). “Should More Local Governments Purchase
a Bond Rating.” Review of Quantitative Finance and Accounting, 32(4), 421–438.Ang, A., V. Bhansali, and Y. Xing (2010a). “Build America Bonds.” The Journal of Fixed
Income, 20(1), 67–73.Ang, A., V. Bhansali, and Y. Xing (2010b). “Taxes on Tax-Exempt Bonds.” The Journal of
Finance, 65(2), 565–601.Breckinridge Capital Advisors (2010). “Building a Fixed-Income Portfolio with Taxable
Municipal Bonds.” Discussion Paper. Available at http://www.breckinridge.com/

24 Municipal Finance Journal
pdf/whitepapers/March_2010_Building_a_Fixed-Income_Portfolio_with_Taxable_Municipal_Bonds.pdf.
Brune, C., and P. Liu (2011). “The Contagion Effect of Default Risk Insurer Downgrades: The Impact on Insured Municipal Bonds.” Journal of Economics and Business, 63(5), 492–502.
Congressional Budget Office (CBO, 2009). “Budget Options, Volume 2.” August 6, 2009. Available at http://www.cbo.gov/ftpdocs/102xx/doc10294/08-06-BudgetOptions.pdf.
Daniels, K., D. Ejara, and J. Vijayakumar (2010). “Debt Maturity, Credit Risk, and Informa-tion Asymmetry: The Case of Municipal Bonds.” Financial Review, 45(3), 603–626.
Eizenga, J., and S. Hanlon (2011). “Bring Back BABs: A Proposal to Strengthen the Municipal Bond Market with Build America Bonds.” Center for American Progress, April 29, 2011. Available at http://www.americanprogress.org/issues/2011/04/pdf/build_america_bonds.pdf.
Government Accountability Office (GAO, 2008). “Report to the Committee on Finance, U.S. Senate: Tax Policy: Tax-Exempt Status of Certain Bonds Merits Reconsideration, and Apparent Noncompliance with Issuance Cost Limitations Should Be Addressed.” February 2008. Available at http://www.gao.gov/new.items/d08364.pdf.
Green, R. (1993). “A Simple Model of the Taxable and Tax-Exempt Yield Curve.” Review of Financial Studies, 6(2), 233–264.
Green, R., and B. Odegaard (1997). “Are There Tax Effects in the Relative Pricing of U.S. Government Bonds.” The Journal of Finance, 52(2), 609–633.
Hildreth, B., and K. Zorn (2005). “The Evolution of the State and Local Government Municipal Debt Market over the Past Quarter Century.” Public Budgeting & Finance 25(4S), 127–153.
Holeywell, R. (2010). “Feds Move to Tax Muni Bond Earnings.” Fedwatch, December 16, 2010. Available at http://www.governing.com/blogs/fedwatch/Feds-Tax-Muni-Bond-Earnings.html.
Hume, L. (2010). “Muni Backers Will Fight for Tax-Exempt Interest.” The Bond Buyer, December 1, 2010. Available at http://www.bondbuyer.com/issues/119_479/deficit-reduction-commission-tax-exempt-interest-1020576-1.html.
Jagoda, N. (2014). “Obama Again Proposes 28% Cap, AFF Bonds in Fiscal 2015 Bud-get.” The Bond Buyer, March 4, 2014. Available at http://www.bondbuyer.com/issues/123_43/obama-again-proposes-28-cap-aff-bonds-in-fiscal-2015-budget-1060391-1.html.
Johnson, C., and K. Kriz (2005). “Fiscal Institutions, Credit Ratings, and Borrowing Costs.” Public Budgeting and Finance, 25(1), 84–103.
Kalotay, A., and M. Dorigan (2009). “What Makes the Municipal Yield Curve Rise?” The Journal of Fixed Income, 18(3), 65–71.
Levisohn, B. (2009). “Could Municipal Bonds Lose Their Tax-Exempt Status?” Bloomberg Businessweek, August 19, 2009. Available at http://www.businessweek.com/investing/ insights/blog/archives/2009/08/could_municipal_bonds_lose_their_tax-exempt_ status.html.
Lin, H., S. Liu, J. Wang, and C. Wu (2009). “Liquidity and the Pricing of Municipal Bonds.” Available at http://www.ccfr.org.cn/cicf2010/papers/20091212143722.pdf.
Liu, P., and F.J. Seyyed (1991). “The Impact of Socioeconomic Variables and Credit Rat-ings on Municipal Bond Risk Premia.” Journal of Business Finance & Accounting, 18(5), 735–746.
Longstaff, F., and E. Schwartz (1995). “A Simple Approach to Valuing Risky Fixed and Floating Rate Debt.” The Journal of Finance, 50(3), 789–819.
Marlowe, J. (2006). “Volume, Liquidity, and Investor Risk Perceptions in the Secondary Mar-ket: Lessons from Katrina, Rita, and Wilma.” Municipal Finance Journal, 27(2), 1–37.

To Tax or noT To Tax 25
Martell, C., and R. Kravchuk (2010). “Bond Insurance and Liquidity Provision: Impacts in the Municipal Variable Rate Debt Market, 2008–09.” Public Finance Review, 38(3), 378–401.
National Commission on Fiscal Responsibility and Reform (2010). “The Moment of Truth: Report of the National Commission on Fiscal Responsibility and Reform.” December 1, 2010. Available at http://www.fiscalcommission.gov/news/moment-truth-report-national-commission-fiscal-responsibility-and-reform.
Ribeiro, A.G. (2009) “Tax-Favored Bonds Get Second Look.” Bankrate.com, September 9, 2009. Available at http://www.bankrate.com/finance/savings/tax-favored-bonds-get-second-look-1.aspx.
Schroeder, P., and A. Dutton (2009) “Congressional Budget Office Weighs Impact of Bud-get Options.” The Bond Buyer, August 10, 2009. Available at http://www.bondbuyer.com/issues/118_152/-306204-1.html.
Sohl, S., M. Peddle, K. Thurmaier, C. Wood, and G. Kuhn (2008). “An Evaluation of Bond Ratings to Financial Reporting Structures.” Paper presented at the Annual Meeting of the Association of Budgeting and Financial Management, October 23–25, Chicago, IL.
Summers, G., and T. Noland (2008). “An Introduction to the U.S. Municipal Bond Mar-ket.” International Journal of Governmental Financial Management, 8(2), 145–161.
Temel, J. (2001). The Fundamentals of Municipal Bonds. Hoboken, NJ: Wiley.U.S. Department of the Treasury (2010). “Treasury Analysis of Build America Bonds and
Issuer Net Borrowing Costs,” April 2, 2010. Available at http://www.treasury.gov/ini-tiatives/recovery/Documents/BABs-Report-4-2-2010-FINAL.pdf.
Wang, J., C. Wu, and F. Zhang (2008). “Liquidity, Default, Taxes and Yields on Municipal Bonds.” Journal of Banking and Finance, 32(6), 1133–1149.
Young, D., R. Faas, and P. Wandschneider (1982). “Factors Affecting Bond Interest Rates.” Report of Western Rural Development Center, Oregon State University.


Authorized Electronic Copy
This electronic copy was prepared for and is authorized solely for the use of the purchaser/subscriber. This material may not be photocopied, e-mailed, or otherwise
reproduced or distributed without permission, and any such reproduction or redistribution is a violation of copyright law.
For permissions, contact the Copyright Clearance Center at http://www.copyright.com/
You may also fax your request to 1-978-646-8700 or contact CCC with your permission request via email at [email protected]. If you have any questions or concerns about
this process you can reach a customer relations representative at 1-978-646-2600 from the hours of 8:00 - 5:30 eastern time.
©
Authorization.indd 59Authorization.indd 59 12/13/2014 10:07:0012/13/2014 10:07:00


