To Re-Engine or Not to Re-Engine: That is the Question...That is the Question Aviation, Aerospace &...
11
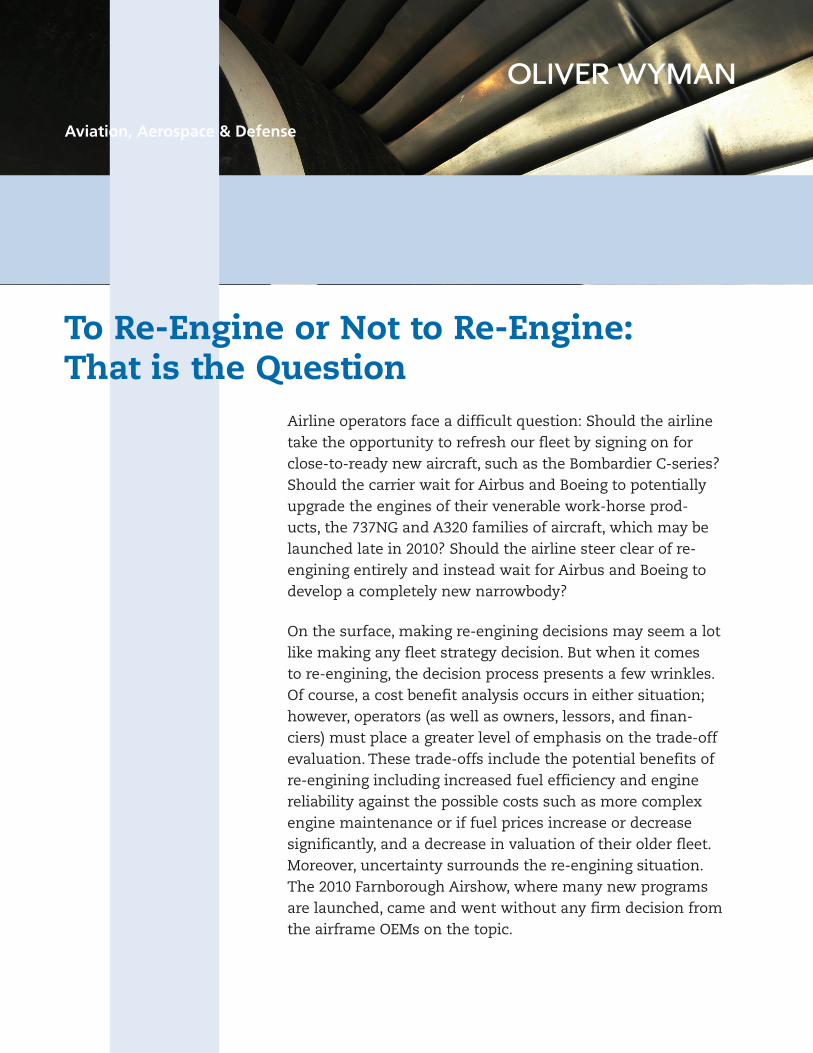
To Re-Engine or Not to Re-Engine: That is the Question Aviation, Aerospace & Defense Airline operators face a difficult question: Should the airline take the opportunity to refresh our fleet by signing on for close-to-ready new aircraft, such as the Bombardier C-series? Should the carrier wait for Airbus and Boeing to potentially upgrade the engines of their venerable work-horse prod- ucts, the 737NG and A320 families of aircraft, which may be launched late in 2010? Should the airline steer clear of re- engining entirely and instead wait for Airbus and Boeing to develop a completely new narrowbody? On the surface, making re-engining decisions may seem a lot like making any fleet strategy decision. But when it comes to re-engining, the decision process presents a few wrinkles. Of course, a cost benefit analysis occurs in either situation; however, operators (as well as owners, lessors, and finan- ciers) must place a greater level of emphasis on the trade-off evaluation. These trade-offs include the potential benefits of re-engining including increased fuel efficiency and engine reliability against the possible costs such as more complex engine maintenance or if fuel prices increase or decrease significantly, and a decrease in valuation of their older fleet. Moreover, uncertainty surrounds the re-engining situation. The 2010 Farnborough Airshow, where many new programs are launched, came and went without any firm decision from the airframe OEMs on the topic.
Transcript of To Re-Engine or Not to Re-Engine: That is the Question...That is the Question Aviation, Aerospace &...
To Re-Engine or Not to Re-Engine: That is the Question
Aviation, Aerospace & Defense
Airline operators face a difficult question: Should the airline take the opportunity to refresh our fleet by signing on for close-to-ready new aircraft, such as the Bombardier C-series? Should the carrier wait for Airbus and Boeing to potentially upgrade the engines of their venerable work-horse prod-ucts, the 737NG and A320 families of aircraft, which may be launched late in 2010? Should the airline steer clear of re-engining entirely and instead wait for Airbus and Boeing to develop a completely new narrowbody?
On the surface, making re-engining decisions may seem a lot like making any fleet strategy decision. But when it comes to re-engining, the decision process presents a few wrinkles. Of course, a cost benefit analysis occurs in either situation; however, operators (as well as owners, lessors, and finan-ciers) must place a greater level of emphasis on the trade-off evaluation. These trade-offs include the potential benefits of re-engining including increased fuel efficiency and engine reliability against the possible costs such as more complex engine maintenance or if fuel prices increase or decrease significantly, and a decrease in valuation of their older fleet. Moreover, uncertainty surrounds the re-engining situation. The 2010 Farnborough Airshow, where many new programs are launched, came and went without any firm decision from the airframe OEMs on the topic.

2
A cost-benefit analysis of re-engining will yield different insights for dif-ferent operators, depending on their unique business circumstances (such as current fleet configuration and business model). Using a disciplined approach that outlines and quantifies the risks inherent in a re-engining effort, each company can properly manage the risks and uncertainties.
In this white paper, we draw on our extensive stores of data, our analysis of past re-engining programs, and our considerable client experience to reveal the nuances behind the re-engining decision and offer recommen-dations for approaching it.
Let’s start by taking a closer look at the re-engining programs currently on the horizon.
Re-engining programs on the horizonAirbus and Boeing are both examining CFM’s Leap-X and Pratt & Whitney’s Geared Turbo Fan (GTF) engines, which are ready for near-term adoption by airframe manufacturers. These engines promise approxi-mately 12%-15% fuel-burn improvements over their predecessors in addition to maintenance-cost reductions. The engines have already been selected for in-development programs, which for the first time in decades are starting to present Boeing and Airbus with significant competition in the 100-plus seat narrowbody sector. Competitors include the Bombardier C-Series (powered by the GTF) and the Commercial Aircraft Corporation of China, (COMAC) C919 powered by the CFM Leap-X.
The re-engining programs that Airbus and Boeing are considering would involve fitting a new engine to the existing aircraft with minimal other changes. As previous re-engining programs show, this still involves sig-nificant engineering work and cost. However, the goal is to improve air-craft performance significantly while reducing development timeframes and costs. Press reports suggest that Airbus will offer the GTF and Leap-X as additional engine options, rather than as full replacements for the CFM56-5 and V2500-A5 currently powering those aircraft, and Boeing will offer the Leap-X for the 737NG.
Three considerationsAs mentioned earlier, making re-engining decisions is more complex than making ordinary fleet selection decisions. For traditional fleet selec-tion choices, most carriers use a Total Cost of Ownership approach that takes into account not just the purchase price of an aircraft, but also the cost of owning, operating, and disposing of it. However, this approach usually pits two or more new aircraft against each other, rather than comparing in-operation aircraft with proposed new aircraft. Moreover, it does not consider the impact of a newly developed aircraft on the cur-rent fleet’s value or the pros and cons of ordering the current versus the enhanced version.
3
To make the wisest possible re-engining decision, operators must go beyond the usual fleet selection process and weigh three crucial consider-ations: (1) fuel-burn reduction and future fuel prices; (2) changes in engine reliability and maintenance costs; and (3) impact on current fleet values. Key to this analysis is quantifying these potential impacts—a frustratingly difficult feat for most operators. With an eye toward attaching numbers to the three considerations, we evaluate five re-engining programs launched since the 1970s in the next section of this article and then show how our findings can be applied to the current re-engining dilemma.
Five re-engining programs As a normal course of business, engine OEMs create upgrade options and new versions during each product’s lifecycle. Occasionally an engine OEM, with an airframe OEM or another partner, will offer a new engine for a current aircraft. These offerings generally fall into two categories: retrofits for existing aircraft and new engines for new production air-craft. Retrofits are more common in military programs, but are quite rare in commercial applications with the CFM56-equipped DC-8 being the notable exception. In this study, therefore, we concentrate on the second, more common, category to draw lessons from past programs.
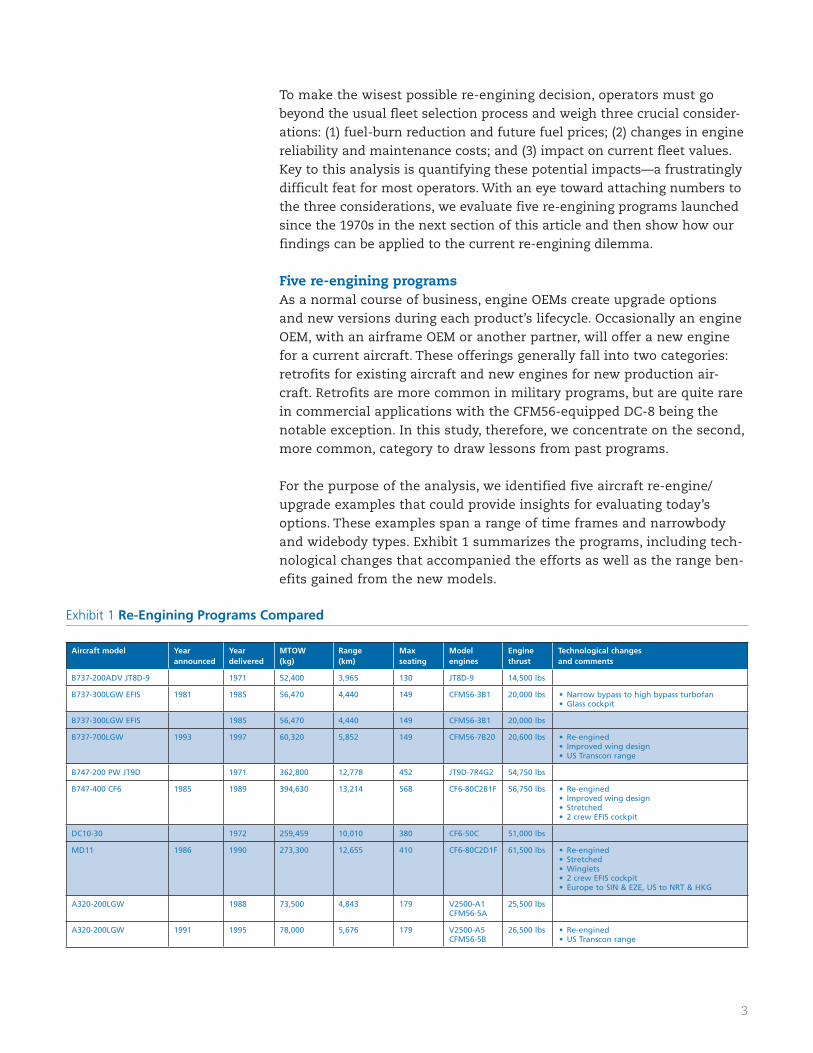
For the purpose of the analysis, we identified five aircraft re-engine/upgrade examples that could provide insights for evaluating today’s options. These examples span a range of time frames and narrowbody and widebody types. Exhibit 1 summarizes the programs, including tech-nological changes that accompanied the efforts as well as the range ben-efits gained from the new models.
Exhibit 1 Re-Engining Programs Compared
Aircraft model Yearannounced
Year delivered
MTOW (kg)
Range (km)
Max seating
Model engines
Engine thrust
Technological changes and comments
B737-200ADV JT8D-9 1971 52,400 3,965 130 JT8D-9 14,500 lbs
B737-300LGW EFIS 1981 1985 56,470 4,440 149 CFM56-3B1 20,000 lbs • Narrow bypass to high bypass turbofan• Glass cockpit
B737-300LGW EFIS 1985 56,470 4,440 149 CFM56-3B1 20,000 lbs
B737-700LGW 1993 1997 60,320 5,852 149 CFM56-7B20 20,600 lbs • Re-engined• Improved wing design• US Transcon range
B747-200 PW JT9D 1971 362,800 12,778 452 JT9D-7R4G2 54,750 lbs
B747-400 CF6 1985 1989 394,630 13,214 568 CF6-80C2B1F 56,750 lbs • Re-engined• Improved wing design • Stretched • 2 crew EFIS cockpit
DC10-30 1972 259,459 10,010 380 CF6-50C 51,000 lbs
MD11 1986 1990 273,300 12,655 410 CF6-80C2D1F 61,500 lbs • Re-engined• Stretched • Winglets • 2 crew EFIS cockpit• Europe to SIN & EZE, US to NRT & HKG
A320-200LGW 1988 73,500 4,843 179 V2500-A1 CFM56-5A
25,500 lbs
A320-200LGW 1991 1995 78,000 5,676 179 V2500-A5 CFM56-5B
26,500 lbs • Re-engined• US Transcon range

4
How did these new aircraft perform compared with their predecessors in terms of fuel burn, engine maintenance, and aircraft valuation? Let’s look.
Fuel Burn If we assess fuel consumed per block hour for US operators of these air-craft, we find a median reduction in fuel burn of 9.5% in the new aircraft. (See Exhibit 2.) This fuel burn decrease ranges from a low of 5.6% for the 737-300 over the 737-200 to a high of 9.8% for the MD11 over the DC10-30. In this context, press reports of 15% fuel-burn reductions for the re-engined 737 and A320 (before dilution from the extra weight of the new engines and modifications) appear consistent with previous programs.
Exhibit 2 Fuel-Burn Improvements: 737, DC10/MD11, and 747
Fuel Burn Improvement
Gal
lon
s p
er B
lock
Hr
Aircraft Series
DC10-30
-5.6% -9.5%
-9.8%
-9.4%
0
500
1,000
1,500
2,000
2,500
3,000
3,500
4,000
737 DC10/MD-11 747
200 400MD11200 300 700
Source: Form 41, planestats.com, Oliver Wyman analysis
This 9.5% median fuel-burn reduction isn’t surprising: The programs would not have gone forward if the OEMs had been unsure of the benefit. What is perhaps different for today’s scenario is the price of fuel con-sumed, or not consumed. Since 1991, the average price paid by US air-lines fluctuated between $0.45 per gallon in Q1 1991 and $3.74 per gallon in Q3 2008. As Exhibit 3 shows, fuel prices and variability have changed more dramatically in recent years. While no one can foresee precisely what fuel prices will do in the medium and long term, carriers can (and should) use a fuel risk management strategy to arrive at educated esti-mates and include them in their decision-making process.
Exhibit 3 Fuel Price and Variability
Fuel Price and Variability
-
0.05
0.10
0.15
0.20
0.25
0.30
0.35
0.40
Quarter
Var
iab
ility
(Sta
nd
ard
dev
iati
on
/mea
n)
$-
$0.50
$1.00
$1.50
$2.00
$2.50
$3.00
$3.50
$4.00
Pric
e p
er G
allo
n
Varibility
Price per Gallon
1991Q4
1992Q4
1993Q4
1994Q4
1995Q4
1996Q4
1997Q4
1998Q4
1999Q4
2000Q4
2001Q4
2002Q4
2003Q4
2004Q4
2005Q4
2006Q4
2007Q4
2008Q4
2009Q4
5
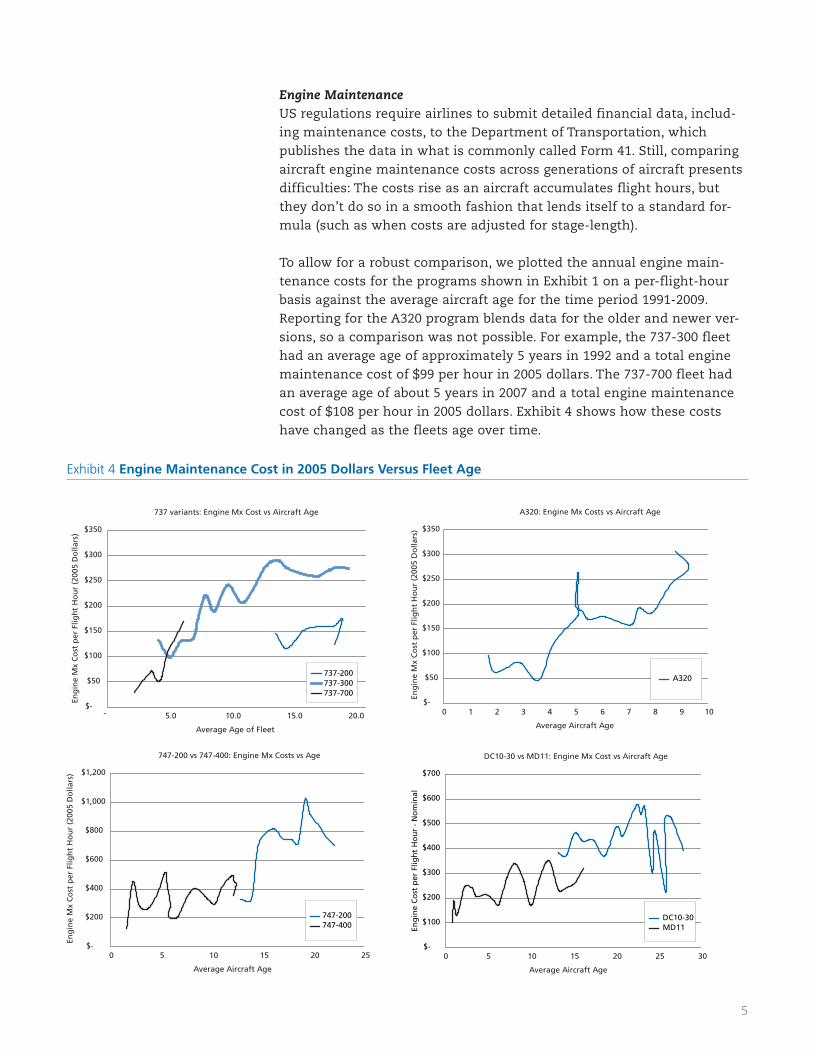
Engine Maintenance US regulations require airlines to submit detailed financial data, includ-ing maintenance costs, to the Department of Transportation, which publishes the data in what is commonly called Form 41. Still, comparing aircraft engine maintenance costs across generations of aircraft presents difficulties: The costs rise as an aircraft accumulates flight hours, but they don’t do so in a smooth fashion that lends itself to a standard for-mula (such as when costs are adjusted for stage-length).
To allow for a robust comparison, we plotted the annual engine main-tenance costs for the programs shown in Exhibit 1 on a per-flight-hour basis against the average aircraft age for the time period 1991-2009. Reporting for the A320 program blends data for the older and newer ver-sions, so a comparison was not possible. For example, the 737-300 fleet had an average age of approximately 5 years in 1992 and a total engine maintenance cost of $99 per hour in 2005 dollars. The 737-700 fleet had an average age of about 5 years in 2007 and a total engine maintenance cost of $108 per hour in 2005 dollars. Exhibit 4 shows how these costs have changed as the fleets age over time.
A320: Engine Mx Costs vs Aircraft Age
$-
$50
$100
$150
$200
$250
$300
$350
0 1 2 3 4 5 6 7 8 9 10
Average Aircraft Age
Eng
ine
Mx
Co
st p
er F
ligh
t H
ou
r (2
005
Do
llars
)
DC10-30 vs MD11: Engine Mx Cost vs Aircraft Age
$-
$100
$200
$300
$400
$500
$600
$700
0 5 10 15 20 25 30
Average Aircraft Age
Eng
ine
Co
st p
er F
ligh
t H
ou
r -
No
min
al
747-200 vs 747-400: Engine Mx Costs vs Age
$-
$200
$400
$600
$800
$1,000
$1,200
0 5 10 15 20 25
Average Aircraft Age
Eng
ine
Mx
Co
st p
er F
ligh
t H
ou
r (2
005
Do
llars
)
737 variants: Engine Mx Cost vs Aircraft Age
$-
$50
$100
$150
$200
$250
$300
$350
- 5.0 10.0 15.0 20.0
Average Age of Fleet
Eng
ine
Mx
Co
st p
er F
ligh
t H
ou
r (2
005
Do
llars
)
737-200737-300737-700
A320
747-200747-400
DC10-30MD11
Exhibit 4 Engine Maintenance Cost in 2005 Dollars Versus Fleet Age
6
Because of the staggered timeframes covered by the data set, it is not possible to create comparable full-lifecycle graphs for all generations of aircraft in our study. However, there is enough overlap and history to show that engine maintenance costs rose from the 737-200 to the 737-300 and decreased from the DC10-30 to the MD11. Cost changes were inconclusive in the other two examples.
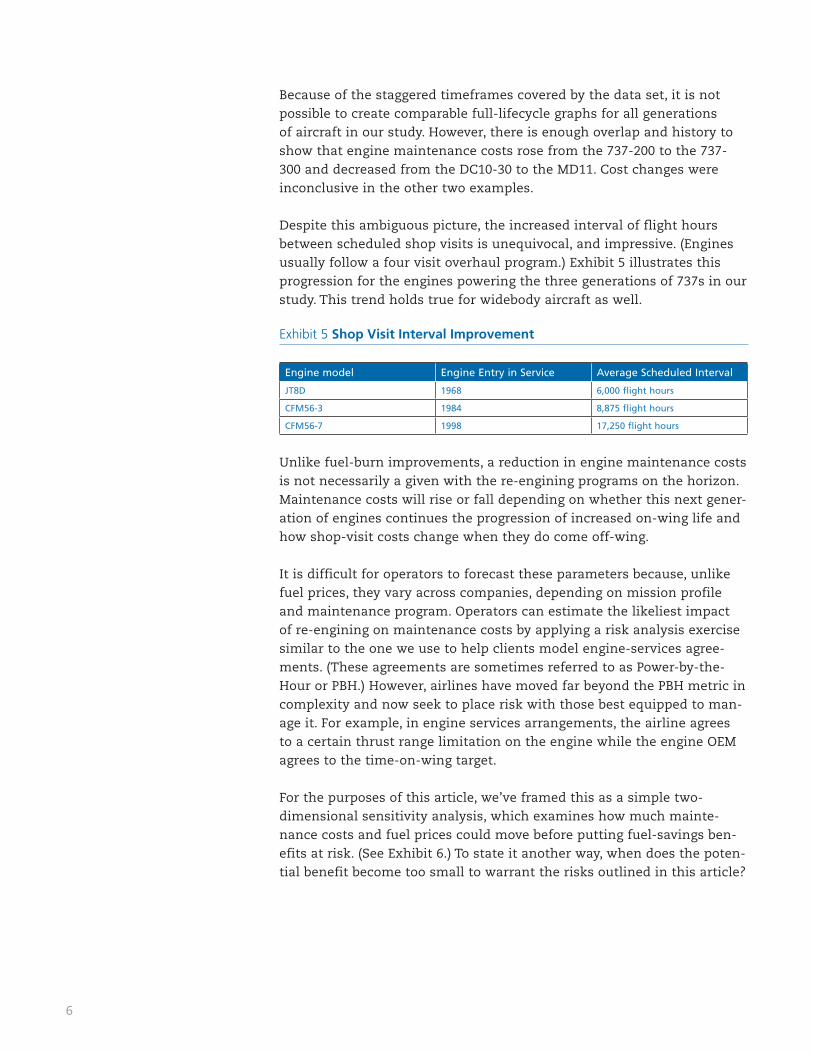
Despite this ambiguous picture, the increased interval of flight hours between scheduled shop visits is unequivocal, and impressive. (Engines usually follow a four visit overhaul program.) Exhibit 5 illustrates this progression for the engines powering the three generations of 737s in our study. This trend holds true for widebody aircraft as well.
Exhibit 5 Shop Visit Interval Improvement
Engine model Engine Entry in Service Average Scheduled Interval
JT8D 1968 6,000 flight hours
CFM56-3 1984 8,875 flight hours
CFM56-7 1998 17,250 flight hours
Unlike fuel-burn improvements, a reduction in engine maintenance costs is not necessarily a given with the re-engining programs on the horizon. Maintenance costs will rise or fall depending on whether this next gener-ation of engines continues the progression of increased on-wing life and how shop-visit costs change when they do come off-wing.
It is difficult for operators to forecast these parameters because, unlike fuel prices, they vary across companies, depending on mission profile and maintenance program. Operators can estimate the likeliest impact of re-engining on maintenance costs by applying a risk analysis exercise similar to the one we use to help clients model engine-services agree-ments. (These agreements are sometimes referred to as Power-by-the- Hour or PBH.) However, airlines have moved far beyond the PBH metric in complexity and now seek to place risk with those best equipped to man-age it. For example, in engine services arrangements, the airline agrees to a certain thrust range limitation on the engine while the engine OEM agrees to the time-on-wing target.
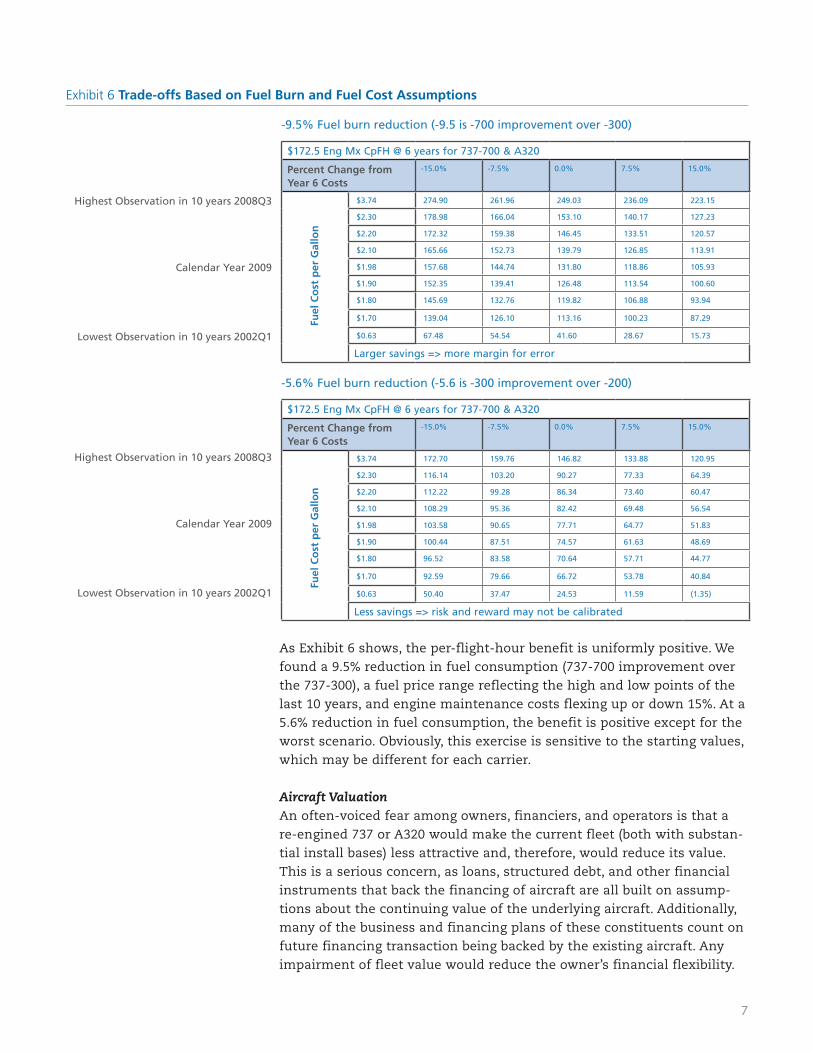
For the purposes of this article, we’ve framed this as a simple two-dimensional sensitivity analysis, which examines how much mainte-nance costs and fuel prices could move before putting fuel-savings ben-efits at risk. (See Exhibit 6.) To state it another way, when does the poten-tial benefit become too small to warrant the risks outlined in this article?
7
Exhibit 6 Trade-offs Based on Fuel Burn and Fuel Cost Assumptions
-9.5% Fuel burn reduction (-9.5 is -700 improvement over -300)
$172.5 Eng Mx CpFH @ 6 years for 737-700 & A320
Percent Change from Year 6 Costs
-15.0% -7.5% 0.0% 7.5% 15.0%
$3.74 274.90 261.96 249.03 236.09 223.15
$2.30 178.98 166.04 153.10 140.17 127.23
$2.20 172.32 159.38 146.45 133.51 120.57
$2.10 165.66 152.73 139.79 126.85 113.91
$1.98 157.68 144.74 131.80 118.86 105.93
$1.90 152.35 139.41 126.48 113.54 100.60
$1.80 145.69 132.76 119.82 106.88 93.94
$1.70 139.04 126.10 113.16 100.23 87.29
$0.63 67.48 54.54 41.60 28.67 15.73
Larger savings => more margin for error
-5.6% Fuel burn reduction (-5.6 is -300 improvement over -200)
$172.5 Eng Mx CpFH @ 6 years for 737-700 & A320
Percent Change from Year 6 Costs
-15.0% -7.5% 0.0% 7.5% 15.0%
$3.74 172.70 159.76 146.82 133.88 120.95
$2.30 116.14 103.20 90.27 77.33 64.39
$2.20 112.22 99.28 86.34 73.40 60.47
$2.10 108.29 95.36 82.42 69.48 56.54
$1.98 103.58 90.65 77.71 64.77 51.83
$1.90 100.44 87.51 74.57 61.63 48.69
$1.80 96.52 83.58 70.64 57.71 44.77
$1.70 92.59 79.66 66.72 53.78 40.84
$0.63 50.40 37.47 24.53 11.59 (1.35)
Less savings => risk and reward may not be calibrated
7
Highest Observation in 10 years 2008Q3
Calendar Year 2009
Lowest Observation in 10 years 2002Q1
Fuel
Co
st p
er G
allo
nFu
el C
ost
per
Gal
lon
Highest Observation in 10 years 2008Q3
Calendar Year 2009
Lowest Observation in 10 years 2002Q1
As Exhibit 6 shows, the per-flight-hour benefit is uniformly positive. We found a 9.5% reduction in fuel consumption (737-700 improvement over the 737-300), a fuel price range reflecting the high and low points of the last 10 years, and engine maintenance costs flexing up or down 15%. At a 5.6% reduction in fuel consumption, the benefit is positive except for the worst scenario. Obviously, this exercise is sensitive to the starting values, which may be different for each carrier.
Aircraft Valuation An often-voiced fear among owners, financiers, and operators is that a re-engined 737 or A320 would make the current fleet (both with substan-tial install bases) less attractive and, therefore, would reduce its value. This is a serious concern, as loans, structured debt, and other financial instruments that back the financing of aircraft are all built on assump-tions about the continuing value of the underlying aircraft. Additionally, many of the business and financing plans of these constituents count on future financing transaction being backed by the existing aircraft. Any impairment of fleet value would reduce the owner’s financial flexibility.
7
8
Exhibit 7 Impact of Re-Engining on Fleet Value
Re-engined aircraft introduced closer to recession => higher differential impact on out of production versionB737-300LGW to B737-700LGW
Market values
737announced737-700LGW is First 737-700LGW
is delivered
Mar
ket
Val
ue
(mill
ion
s o
f U
SD)
737-700LGW ’97 Vintage
737-300LGW ’92 Vintage
737 -300LGW ’85 Vintage
Key highlights
� 5-yr CAGR after announcement
– 1985 vintage: (2.48%)
– 1992 vintage: (2.28%)
� 5- yr CAGR after 1st delivery
– 1985 vintage: (8.61%)
– 1992 vintage: (9.33%)
– Re-engined vintage: (5.20%)0
10
20
30
40
1985
1987
1989
1991
1993
1995
1997
1999
2001
2003
2005
2007
First Re-engined A320 is delivered
Mar
ket
Val
ue
(mill
ion
s o
f U
SD)
Re-engined A320-200 ’95 Vintage
A320-200’90 Vintage
A320 -200 ’88 Vintage
CFM56-5B is announced Key highlights
� 5-yr CAGR after announcement
– 1988 vintage: (3.52%)
– 1990 vintage: (3.75%)
� 5-yr CAGR after 1st delivery
– 1988 vintage: (2.89%)
– 1990 vintage: (2.99%)
– Re-engined vintage: (3.20%)0
10
20
30
40
50
1988
1989
1990
1991
1992
1993
1994
1995
1996
1997
1998
1999
2000
2001
2002
2003
2004
2005
2006
2007
2008
Market values
Re-engined aircraft introduced well in advance recession => small impact on out of production versionA320-200
Source: AVAC database (market values), ACAS database (fleet data), Oliver Wyman analysis
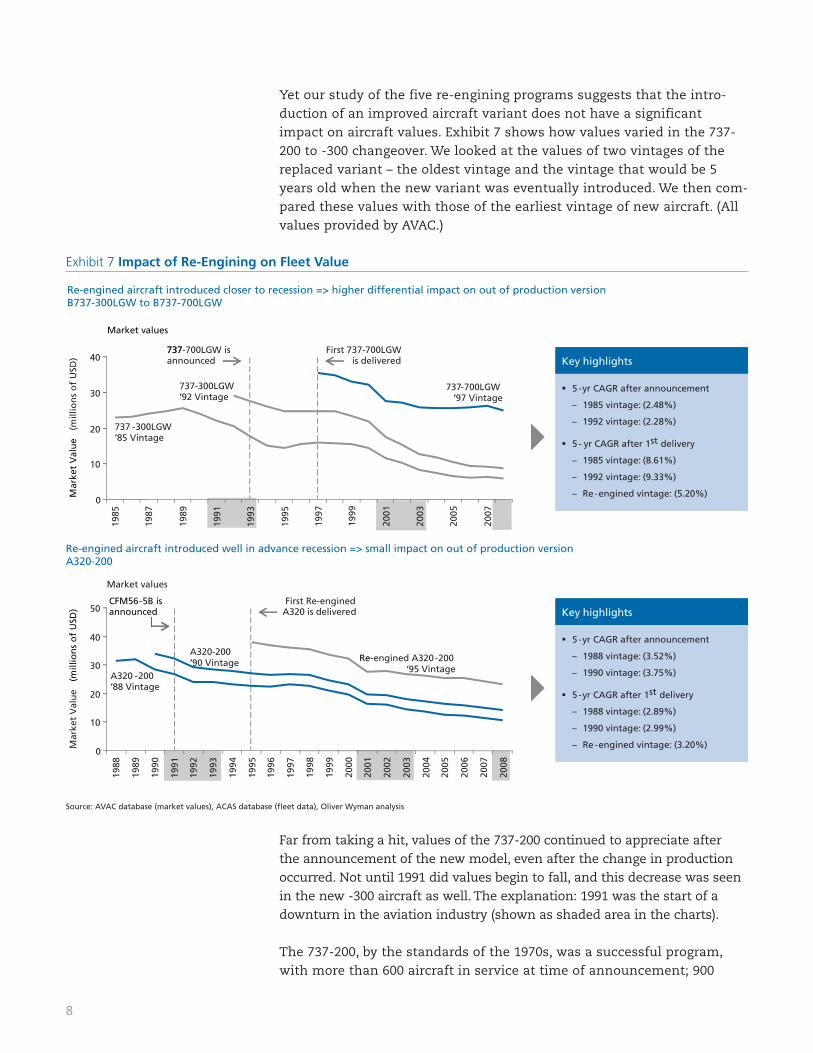
Yet our study of the five re-engining programs suggests that the intro-duction of an improved aircraft variant does not have a significant impact on aircraft values. Exhibit 7 shows how values varied in the 737-200 to -300 changeover. We looked at the values of two vintages of the replaced variant – the oldest vintage and the vintage that would be 5 years old when the new variant was eventually introduced. We then com-pared these values with those of the earliest vintage of new aircraft. (All values provided by AVAC.)
Far from taking a hit, values of the 737-200 continued to appreciate after the announcement of the new model, even after the change in production occurred. Not until 1991 did values begin to fall, and this decrease was seen in the new -300 aircraft as well. The explanation: 1991 was the start of a downturn in the aviation industry (shown as shaded area in the charts).
The 737-200, by the standards of the 1970s, was a successful program, with more than 600 aircraft in service at time of announcement; 900
9
were in service at the time NG production started. Even after -300 pro-duction started, the -200 fleet remained almost fully utilized. Operators began parking 737-200s during the downturn, but as the chart shows, they also parked some -300s.
By way of contrast, consider the introduction of the Boeing 747-400. At first glance, the data appear to show a rapid fall-off in values of the replaced -200 at the time of introduction (To view this and addi-tional data and charts, please go to http://www.planestats.com/Files/Supplemental_Impact_of_Re_Engining_examples.pdf). However, the tim-ing of the new variant preceded the 1991 downturn by only a year. As a result, parked -200s quickly appeared. In addition, the installed base of 747-200s of a single engine type was small. Although overall there were 692 747s of all variants in service in 1989, there were only about 150 PW-powered passenger configuration 747-200s. Because of significant maintenance support challenges, similar aircraft with different power plants were not readily interchangeable. Offering the 747-200 with three different engines pleased different airline customers, but it reduced the liquidity of each type. (This was a major factor in Boeing’s decision to offer the most recent 777 variants with only the GE90 engine).
While the 747-400 provided significant benefits over the -200, re-engining was only one factor among many driving the fall in -200 values after 1990. In downturns, airlines typically strive to reduce capacity, espe-cially of widebodies. The same forces affected the rest of our sample set, including reductions in capacity of widebody versus narrowbody aircraft.
Extrapolating from this analysis, the valuation question becomes, “When will the next economic downturn strike?” All aircraft suffer valuation impairments in a downturn, and we model this in our work with owners, financiers, and operators. However, older and out-of-production models don’t experience the near-symmetrical bounce-back in valuations that new models do. Some of the current 737NGs and A320s would have expe-rienced this impact in the next downturn by virtue of their age. But more recent vintages could experience permanent impairment of their value in a future downturn that they would not have otherwise seen. The size of that population would likely depend on the timing of the downturn. If it came well after introduction of the engine variant (which seems likely, as we have barely emerged from the current recession), then the valuation impact would probably be small to non-existent. We again find ourselves with something that is “unknowable” but whose probability we can assess.
Insights for Owners and OperatorsAnalyzing a re-engining program’s impact on fuel efficiency, engine maintenance costs, and fleet valuation is no small feat. For this reason, the decision to re-engine cannot be made by an airline’s fleet acquisition/finance group alone. Instead, it must be extensively informed by input
10
from maintenance and engineering, fuel hedging and fuel risk manage-ment, and strategic planning teams. Airlines must assemble a cross-func-tional team representing all of these perspectives and arm it with potent risk-measurement and management tools. They must then negotiate agreements with their counterparties to place the risks with those best able to minimize them. For example, if there is uncertainty about wheth-er the new engine will cost more to maintain, owners/operators should ask the engine OEM to bear the risk (and reward) of such costs.
For investors, we believe that fears about the potential impact of re-engining on fleet values are overblown. In our view, the main driver of current low values for in-service aircraft is the level of narrowbody sup-ply against industry demand that is only now emerging from the bottom of the latest recession. The anemic level of financing available even for 5-year-old aircraft only aggravates the problem. Our analysis suggests that the large installed base of 737NGs and A320 aircraft families and the absence of significant maintenance issues as they have aged (to date) will ensure continued demand for the aircraft, even if Airbus and Boeing shift production entirely to re-engined models.
Clearly, airlines face a situation that’s more complex than normal regard-ing their future fleet strategy. By asking the right questions, weighing the right considerations, and quantifying the potential risks and rewards, operators and other players in the industry can sweeten the odds of mak-ing the best possible decision regarding re-engining.v
Visualize your assumptions
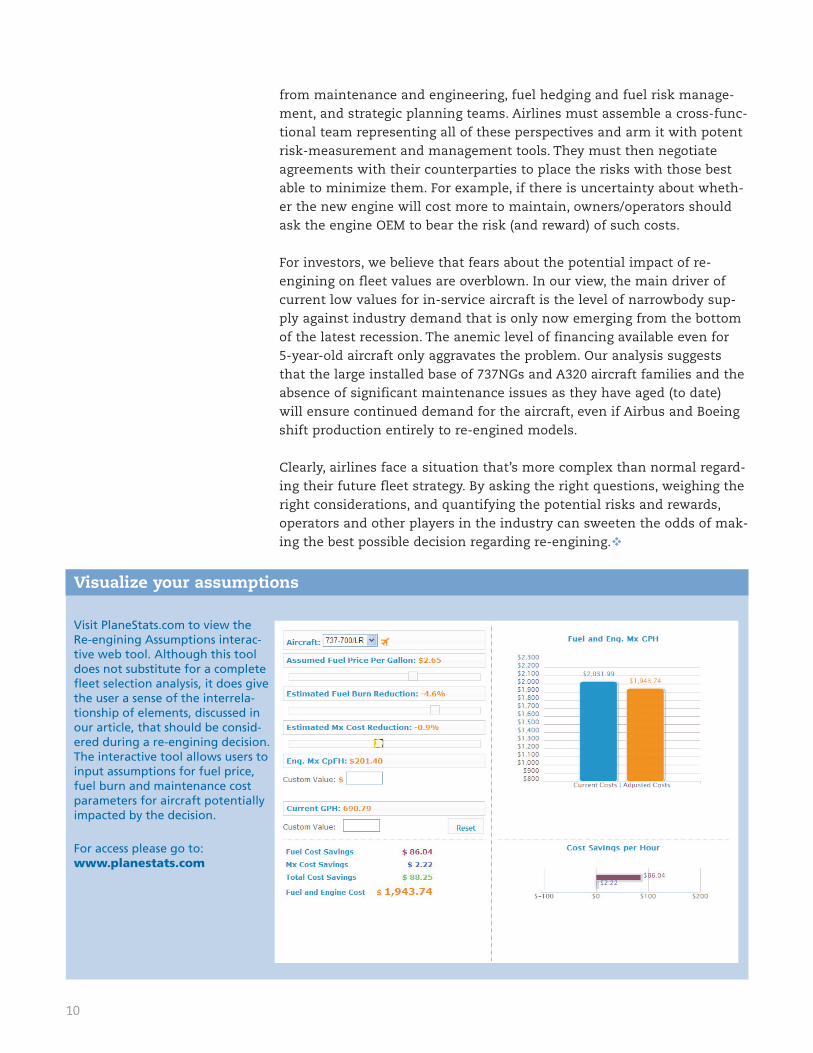
Visit PlaneStats.com to view the Re-engining Assumptions interac-tive web tool. Although this tool does not substitute for a complete fleet selection analysis, it does give the user a sense of the interrela-tionship of elements, discussed in our article, that should be consid-ered during a re-engining decision. The interactive tool allows users to input assumptions for fuel price, fuel burn and maintenance cost parameters for aircraft potentially impacted by the decision.
For access please go to: www.planestats.com
www.oliverwyman.com
About Oliver Wyman
With more than 2,900 professionals in over 40 cities around the globe, Oliver Wyman is an international management consulting firm that combines deep industry knowledge with specialized expertise in strategy, operations, risk management, organizational trans-formation, and leadership development. The firm helps clients optimize their businesses, improve their operations and risk profile, and accelerate their organizational performance to seize the most attractive opportunities. Oliver Wyman is part of Marsh & McLennan Companies [NYSE: MMC].
The Aviation, Aerospace, and Defense PracticeOliver Wyman has deep, international experience in all segments of aviation, including airports, airlines, service providers, MROs, OEMs, and investors. The Aviation, Aerospace & Defense Practice has consulted to nearly three-quarters of the Fortune 500 firms in these sectors, as well as to major airports around the world.
PlaneStats.com by Oliver Wyman brings together reliable cross-industry data and a pow-erful collection of analytical tools that facilitate the development of actionable insights. PlaneStats.com makes it possible to easily access and analyze worldwide airline schedules and fleet composition. For the U.S. market, it is also possible to analyze aircraft-specific operating costs, route-level P&L reporting, the O&D composition of onboard passenger loads, and average fare comparisons across carriers and markets.
For more information about this article, please contact:
Andrew WattersonPartner – Dallas [email protected]
Chris SpaffordPartner – Dallas [email protected]
Bert HunterPartner – Dubai [email protected]
Pablo WangermannAssociate Partner – Dallas [email protected]
Copyright © Oliver Wyman. All rights reserved.