
to bond funds to remain positive with fixed income · appetite for risk and demand for yield. ......
25
Introduction fixed income special report Q1 2015 The overall outlook for fixed income markets in 2015 looks mixed. Ratings agency Moody’s expects net inflows to bond funds to remain positive with limited credit deterioration in bond fund portfolios, while other analysts are predicting increased volatility and widening credit spreads in 2015. 1 Much of the future direction of the market depends on central bank activity – with divergent policies taking centre stage, the path of inflation and interest rates, currency volatility, liquidity as well as investor appetite for risk and demand for yield. After some worrying developments in Russia, the Ukraine and the Middle East in 2014 further geopolitical upheaval also cannot be ruled out. There are many elements dictating the sentiment towards as well as the technicals driving fixed-income markets this year. For all this – and despite somewhat uneven returns across fixed-income sectors – the asset class continues to enjoy strong popularity and remains an investment mainstay for investors as well as institutions such as pension funds and insurers who require steady and predictable income streams to match underlying liabilities. In turn, the universe of fixed income products continues to grow, presenting even the most specialised investors with an increasingly diverse range of investment opportunities. Here we explore the latest market trends and conventional and more esoteric forms of debt instruments which can help fund managers deliver returns to clients in what continues to be a highly challenging and potentially volatile global fixed-income market. 1 Bond market outlook 2015: Brace for volatility. Charles Schwab. 18.12.14 featuring expert views from BNY Mellon’s specialist investment managers
Transcript of to bond funds to remain positive with fixed income · appetite for risk and demand for yield. ......

Introductionfixedincome
specialreportQ1 2015
The overall outlook for fixed income
markets in 2015 looks mixed. Ratings
agency Moody’s expects net inflows
to bond funds to remain positive with
limited credit deterioration in bond
fund portfolios, while other analysts
are predicting increased volatility and
widening credit spreads in 2015.1
Much of the future direction of the
market depends on central bank
activity – with divergent policies
taking centre stage, the path of
inflation and interest rates, currency
volatility, liquidity as well as investor
appetite for risk and demand for yield.
After some worrying developments in
Russia, the Ukraine and the Middle
East in 2014 further geopolitical
upheaval also cannot be ruled out.
There are many elements dictating
the sentiment towards as well as
the technicals driving fixed-income
markets this year.
For all this – and despite somewhat
uneven returns across fixed-income
sectors – the asset class continues
to enjoy strong popularity and
remains an investment mainstay
for investors as well as institutions
such as pension funds and insurers
who require steady and predictable
income streams to match underlying
liabilities. In turn, the universe of fixed
income products continues to grow,
presenting even the most specialised
investors with an increasingly diverse
range of investment opportunities.
Here we explore the latest market
trends and conventional and more
esoteric forms of debt instruments
which can help fund managers deliver
returns to clients in what continues to
be a highly challenging and potentially
volatile global fixed-income market.
1 Bond market outlook 2015: Brace for volatility. Charles Schwab. 18.12.14
featuring expert views from BNY Mellon’s specialist investment managers
BNY Mellon Investment Management is an investment management organization, encompassing BNY Mellon’s affiliated investment management firms, wealth management organization and global distribution companies. BNY Mellon is the corporate brand of The Bank of New York Mellon Corporation and may also be used as a generic term to reference the Corporation as a whole or its various subsidiaries generally.
The information in this document is not intended to be investment advice, and it may be deemed a financial promotion in non-U.S. jurisdictions. Accordingly, where this document is used or distributed in any non-U.S. jurisdiction, the information provided is for Professional Clients only. This material is not for onward distribution to, or to be relied upon by Retail Clients.
Any statements and opinions expressed in this document are correct as at the date of publication, are subject to change as economic and market conditions dictate, and do not necessarily represent the views of BNY Mellon or any of its affiliates. The information contained in this document has been provided as a general market commentary only and does not constitute legal, tax, accounting, other professional counsel or investment advice, is not predictive of future performance, and should not be construed as an offer to sell or a solicitation to buy any security or make an offer where otherwise unlawful. The information has been provided without taking into account the investment objective, financial situation or needs of any particular person. BNY Mellon and its affiliates are not responsible for any subsequent investment advice given based on the information supplied. This document is not investment research or a research recommendation for regulatory purposes as it does not constitute substantive research or analysis. To the extent that these materials contain statements about future performance, such statements are forward looking and are subject to a number of risks and uncertainties. Information and opinions presented in this material have been obtained or derived from sources which BNY Mellon believed to be reliable, but BNY Mellon makes no representation to its accuracy and completeness. BNY Mellon accepts no liability for loss arising from use of this material. If nothing is indicated to the contrary, all figures are unaudited.
Any indication of past performance is not a guide to future performance. The value of investments can fall as well as rise, so you may get back less than you originally invested.
This document is not intended for distribution to, or use by, any person or entity in any jurisdiction or country in which such distribution or use would be contrary to local law or regulation. This document may not be distributed or used for the purpose of offers or solicitations in any jurisdiction or in any circumstances in which such offers or solicitations are unlawful or not authorized, or where there would be, by virtue of such distribution, new or additional registration requirements. Persons into whose possession this document comes are required to inform themselves about and to observe any restrictions that apply to the distribution of this document in their jurisdiction. The investment products and services mentioned here are not insured by the FDIC (or any other state or federal agency), are not deposits of or guaranteed by any bank, and may lose value.
This document should not be published in hard copy, electronic form, via the web or in any other medium accessible to the public, unless authorized by BNY Mellon Investment Management.
Issuing entities
This document is approved for Global distribution and is issued in the following jurisdictions by the named local entities or divisions: Europe, Middle East and Africa (excluding Germany, Brazil, Dubai): BNY Mellon Investment Management EMEA Limited, BNY Mellon Centre, 160 Queen Victoria Street, London EC4V 4LA. Registered in England No. 1118580. Authorised and regulated by the Financial Conduct Authority. • Canada: Services offered in Canada by BNY Mellon Asset Management Canada Ltd. • Germany: Meriten Investment Management GmbH which is regulated by the Bundesanstalt für Finanzdienstleistungsaufsicht. • Dubai, United Arab Emirates: Dubai branch of The Bank of New York Mellon, which is regulated by the Dubai Financial Services Authority. This material is intended for Professional Clients only and no other person should act upon it. • Singapore: BNY Mellon Investment Management Singapore Pte. Limited Co. Reg. 201230427E. Regulated by the Monetary Authority of Singapore. • Hong Kong: BNY Mellon Investment Management Hong Kong Limited. Regulated by the Hong Kong Securities and Futures Commission. • Japan: BNY Mellon Asset Management Japan Limited. BNY Mellon Asset Management Japan Limited is a Financial Instruments Business Operator with license no 406 (Kinsho) at the Commissioner of Kanto Local Finance Bureau and is a Member of the Investment Trusts Association, Japan and Japan Securities Investment Advisers Association. • Australia: BNY Mellon Investment Management Australia Ltd (ABN 56 102 482 815, AFS License No. 227865). Authorized and regulated by the Australian Securities & Investments Commission. • United States: BNY Mellon Investment Management. • Canada: Securities are offered through BNY Mellon Asset Management Canada Ltd., registered as a Portfolio Manager and Exempt Market Dealer in all provinces and territories of Canada, and as an Investment Fund Manager and Commodity Trading Manager in Ontario. • Brazil: this document is issued by ARX Investimentos Ltda., Av. Borges de Medeiros, 633, 4th floor, Rio de Janeiro, RJ, Brazil, CEP 22430-041. Authorized and regulated by the Brazilian Securities and Exchange Commission (CVM).
The issuing entities above are BNY Mellon entities ultimately owned by The Bank of New York Mellon Corporation.
BNY Mellon Company information
BNY Mellon Cash Investment Strategies is a division of The Dreyfus Corporation. • Insight Investment Management Limited and Meriten Investment Management GmbH do not offer services in the U.S. This presentation does not constitute an offer to sell, or a solicitation of an offer to purchase, any of the firms’ services or funds to any U.S. investor, or where otherwise unlawful. • BNY Mellon owns 90% of The Boston Company Asset Management, LLC and the remainder is owned by employees of the firm.• The Newton Group (“Newton”) is comprised of the following affiliated companies: Newton Investment Management Limited, Newton Capital Management Limited (NCM Ltd), Newton Capital Management LLC (NCM LLC), Newton International Investment Management Limited and Newton Fund Managers (C.I.) Limited. NCM LLC personnel are supervised persons of NCM Ltd and NCM LLC does not provide investment advice, all of which is conducted by NCM Ltd. Only NCM LLC and NCM Ltd offer services in the U.S.• BNY Mellon owns a 20% interest in Siguler Guff & Company, LP and certain related entities (including Siguler Guff Advisers LLC). GE015-31-05-2015 (6M). Issued as at 12 February 2015. GE058-06-08-2015 (6M). T1589 02/15

US strengthCommenting on the US market environment last year and likely bond market developments in 2015, Newton head of fixed income, Paul Brain, says: “In 2014 the strength of the US economy continued all year, although its influence on the bond market was overshadowed by other events around the world. As we look to the months ahead, in theory, if unemployment continues to decline and if wages continue to rise steadily, by the middle of the year the Federal Reserve should be looking to raise interest rates.”
Standish’s global macro committee notes there are indications the US labour market is rapidly approaching full employment and wage growth is beginning to perk up. Economists on the committee note the wage and salary component of personal income was up 0.5% in November 2014 and is 4.5% higher than a year ago.
Insight product specialist Andy Burgess agrees about the visibility of a stronger US employment picture. “We’re starting to see signs of more people voluntarily quitting their jobs, which typically translates into higher wage growth.” It is this type of inflation that may lead to action from the labour-focused Fed chairwoman, Janet Yellen, Burgess comments, although there is an argument the US Fed may raise rates without any inflationary pressures present as it would be, in effect, putting a tool back in the box if there were another marked downturn. Regardless, Insight believes there will be an interest rate rise in the US later in the year. “In a more normal market environment you’d have expected rates to have gone up by now,” Burgess argues.
Brain points out there may be other factors that prevent the Fed from any moves this year. He says: “As we move forward, there is a concern about the US energy sector and its high yield sector, which could lead to worries about a credit crisis in the US and more generally an importing of deflation through lower energy prices. In turn, a slowdown in emerging market demand could put the Fed on hold.”
influential energyStandish economists note that by mid-January world oil prices had plummeted some 50% from their 2014 highs. David Leduc, chief investment officer at Standish, says: “We believe the move in oil prices will be one of the most important factors shaping financial market performance in 2015. For the time being, we are keeping risk budgets low given heightened market volatility but we are positioning our portfolios to take advantage of the move in oil in several ways.”
Although Standish believes the decline in oil prices will prove to be a net benefit to the global economy in 2015, the story may not be entirely positive. Leduc says: “The decline in oil prices will keep downward pressure on the currencies of some of the major oil exporters, which increases the vulnerability of those countries and companies with large dollar-denominated liabilities. Furthermore, lower oil prices will aggravate the disinflationary forces in places such as Europe and Japan.”
Alcentra chief investment officer Paul Hatfield concurs Europe is likely to face additional deflationary pressures in 2015 from falling energy prices and while the lower oil price may be a positive for global growth it will also complicate the US and others’ monetary policies this year.
Hatfield goes on to add: “A further effect of the declining price of oil will be continued pressure on the emerging market economies which could exacerbate current geopolitical risks. Against this background, US Treasuries will probably still prove attractive as a ‘safe haven’.”
A further e�ect of the declining price of oil will be continued pressure on the emerging market economies which could exacerbate current geopolitical risks.
“
”Paul Hat�eld, Alcentra
2015 2016 2017 2018 2019 2020 2021
$bn
Tranches
40
20
60
80
100
120
140
160 350
300
250
200
150
50
100
0
High Yield Investment Grade Tranches
0
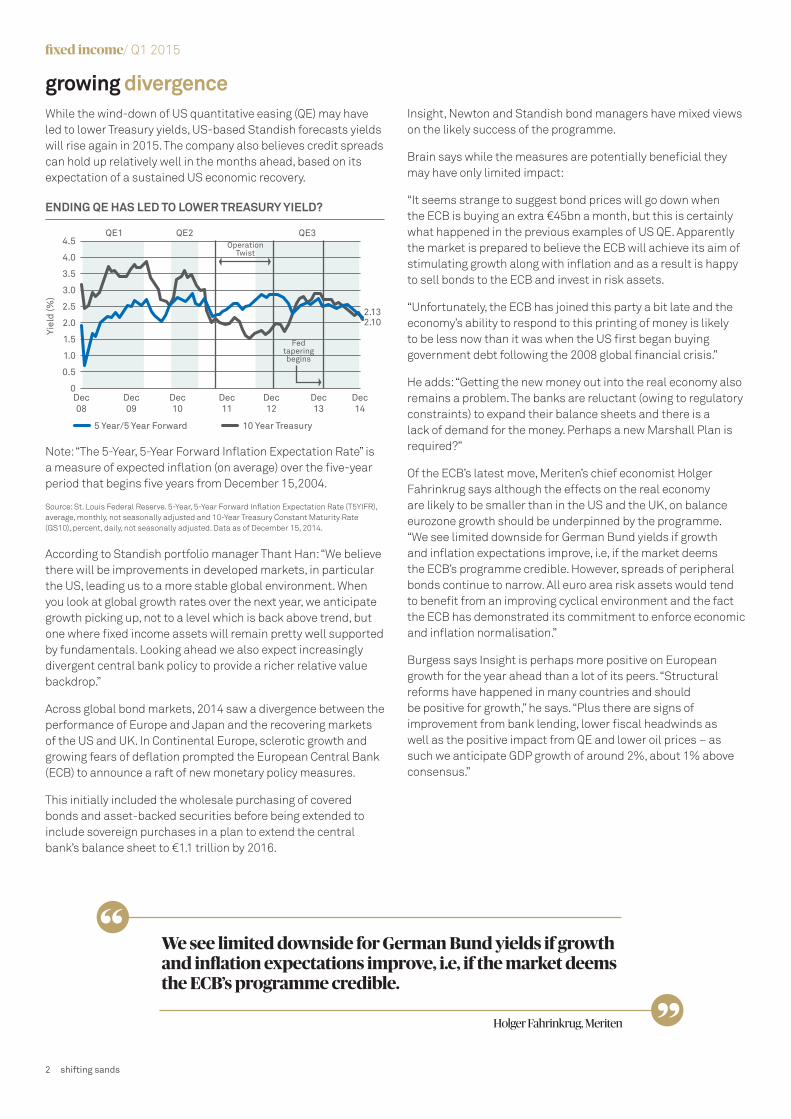
Source: Dealogic, January 2015.
OUTSTANDING GLOBAL OIL AND GAS BOND VOLUME MATURITY BY YEAR
specialreport�xed income/ Q1 2015
shifting sands
Managers across BNY Mellon’s boutiques hold faith in the sustained
attractiveness of fixed income, despite the previous volatile 12-month period. In 2014 total returns across all fixed income asset classes averaged over 7.8%, which caught many off guard having anticipated last year would be a difficult one for the sector.1 Here managers from across several of BNY Mellon’s boutiques outline their views regarding the year ahead for the fixed income market, what investors might expect and where they are currently finding opportunity.
Against a backdrop of erratic global economic growth and divergent monetary policies, many fixed income managers entered 2015 facing mixed prospects. The sustained strength of the US economy was one of few positives last year and predictions of interest rate rises in 2015 were widespread. Also due to the perceived strength of its economic recovery, the UK was seen as likely to shift its monetary policy this year. However, as 2014 progressed and most especially post the sharp drop in the price of oil in the fourth quarter, interest rate rise expectations have subsequently moved further out.
1 Caution rules in best bond year since 2002: Credit markets. Bloomberg. 30.12.14.
1 shifting sands
8-9 the road ahead
16-17 something di�erent
21 about BNY Mellon
US strengthCommenting on the US market environment last year and likely bond market developments in 2015, Newton head of fixed income, Paul Brain, says: “In 2014 the strength of the US economy continued all year, although its influence on the bond market was overshadowed by other events around the world. As we look to the months ahead, in theory, if unemployment continues to decline and if wages continue to rise steadily, by the middle of the year the Federal Reserve should be looking to raise interest rates.”
Standish’s global macro committee notes there are indications the US labour market is rapidly approaching full employment and wage growth is beginning to perk up. Economists on the committee note the wage and salary component of personal income was up 0.5% in November 2014 and is 4.5% higher than a year ago.
Insight product specialist Andy Burgess agrees about the visibility of a stronger US employment picture. “We’re starting to see signs of more people voluntarily quitting their jobs, which typically translates into higher wage growth.” It is this type of inflation that may lead to action from the labour-focused Fed chairwoman, Janet Yellen, Burgess comments, although there is an argument the US Fed may raise rates without any inflationary pressures present as it would be, in effect, putting a tool back in the box if there were another marked downturn. Regardless, Insight believes there will be an interest rate rise in the US later in the year. “In a more normal market environment you’d have expected rates to have gone up by now,” Burgess argues.
Brain points out there may be other factors that prevent the Fed from any moves this year. He says: “As we move forward, there is a concern about the US energy sector and its high yield sector, which could lead to worries about a credit crisis in the US and more generally an importing of deflation through lower energy prices. In turn, a slowdown in emerging market demand could put the Fed on hold.”
influential energyStandish economists note that by mid-January world oil prices had plummeted some 50% from their 2014 highs. David Leduc, chief investment officer at Standish, says: “We believe the move in oil prices will be one of the most important factors shaping financial market performance in 2015. For the time being, we are keeping risk budgets low given heightened market volatility but we are positioning our portfolios to take advantage of the move in oil in several ways.”
Although Standish believes the decline in oil prices will prove to be a net benefit to the global economy in 2015, the story may not be entirely positive. Leduc says: “The decline in oil prices will keep downward pressure on the currencies of some of the major oil exporters, which increases the vulnerability of those countries and companies with large dollar-denominated liabilities. Furthermore, lower oil prices will aggravate the disinflationary forces in places such as Europe and Japan.”
Alcentra chief investment officer Paul Hatfield concurs Europe is likely to face additional deflationary pressures in 2015 from falling energy prices and while the lower oil price may be a positive for global growth it will also complicate the US and others’ monetary policies this year.
Hatfield goes on to add: “A further effect of the declining price of oil will be continued pressure on the emerging market economies which could exacerbate current geopolitical risks. Against this background, US Treasuries will probably still prove attractive as a ‘safe haven’.”
A further e�ect of the declining price of oil will be continued pressure on the emerging market economies which could exacerbate current geopolitical risks.
“
”Paul Hat�eld, Alcentra
2015 2016 2017 2018 2019 2020 2021
$bn
Tranches
40
20
60
80
100
120
140
160 350
300
250
200
150
50
100
0
High Yield Investment Grade Tranches
0
Source: Dealogic, January 2015.
OUTSTANDING GLOBAL OIL AND GAS BOND VOLUME MATURITY BY YEAR
specialreport�xed income/ Q1 2015
shifting sands
Managers across BNY Mellon’s boutiques hold faith in the sustained
attractiveness of fixed income, despite the previous volatile 12-month period. In 2014 total returns across all fixed income asset classes averaged over 7.8%, which caught many off guard having anticipated last year would be a difficult one for the sector.1 Here managers from across several of BNY Mellon’s boutiques outline their views regarding the year ahead for the fixed income market, what investors might expect and where they are currently finding opportunity.
Against a backdrop of erratic global economic growth and divergent monetary policies, many fixed income managers entered 2015 facing mixed prospects. The sustained strength of the US economy was one of few positives last year and predictions of interest rate rises in 2015 were widespread. Also due to the perceived strength of its economic recovery, the UK was seen as likely to shift its monetary policy this year. However, as 2014 progressed and most especially post the sharp drop in the price of oil in the fourth quarter, interest rate rise expectations have subsequently moved further out.
1 Caution rules in best bond year since 2002: Credit markets. Bloomberg. 30.12.14.
1 shifting sands
8-9 the road ahead
16-17 something di�erent
21 about BNY Mellon
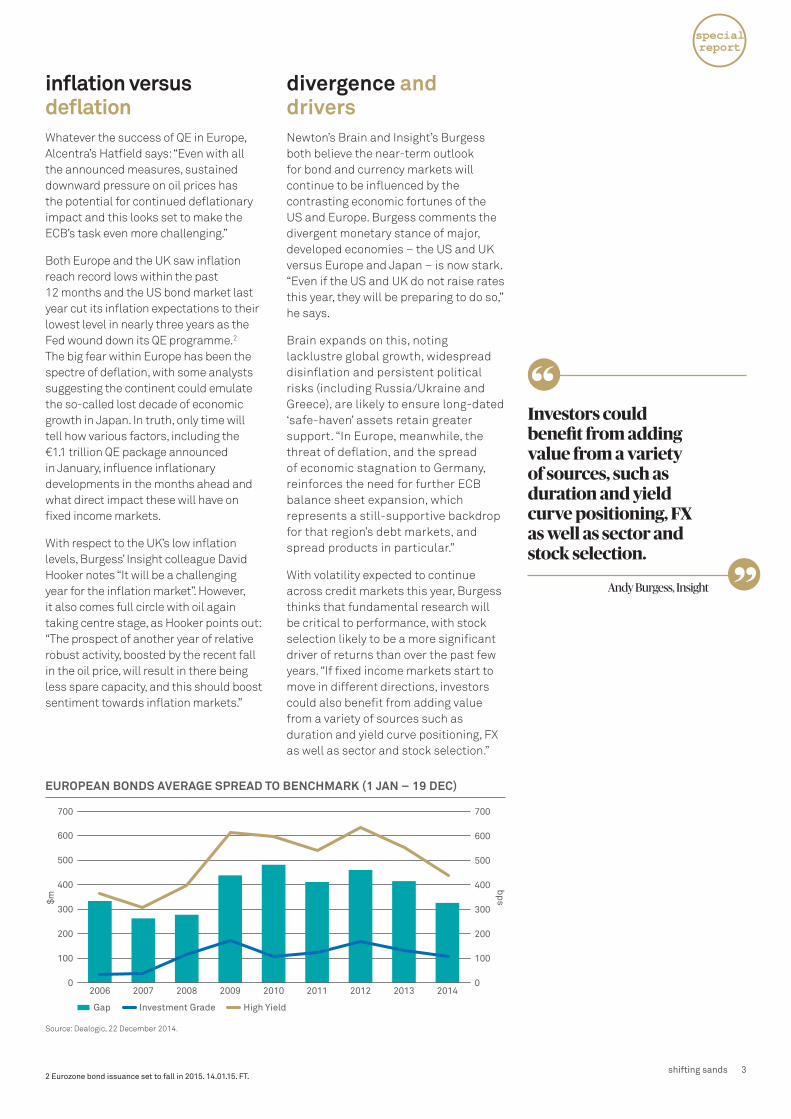
growing divergenceWhile the wind-down of US quantitative easing (QE) may have led to lower Treasury yields, US-based Standish forecasts yields will rise again in 2015. The company also believes credit spreads can hold up relatively well in the months ahead, based on its expectation of a sustained US economic recovery.
Note: “The 5-Year, 5-Year Forward Inflation Expectation Rate” is a measure of expected inflation (on average) over the five-year period that begins five years from December 15,2004.
Source: St. Louis Federal Reserve. 5-Year, 5-Year Forward Inflation Expectation Rate (T5YIFR), average, monthly, not seasonally adjusted and 10-Year Treasury Constant Maturity Rate (GS10), percent, daily, not seasonally adjusted. Data as of December 15, 2014.
According to Standish portfolio manager Thant Han: “We believe there will be improvements in developed markets, in particular the US, leading us to a more stable global environment. When you look at global growth rates over the next year, we anticipate growth picking up, not to a level which is back above trend, but one where fixed income assets will remain pretty well supported by fundamentals. Looking ahead we also expect increasingly divergent central bank policy to provide a richer relative value backdrop.”
Across global bond markets, 2014 saw a divergence between the performance of Europe and Japan and the recovering markets of the US and UK. In Continental Europe, sclerotic growth and growing fears of deflation prompted the European Central Bank (ECB) to announce a raft of new monetary policy measures.
This initially included the wholesale purchasing of covered bonds and asset-backed securities before being extended to include sovereign purchases in a plan to extend the central bank’s balance sheet to €1.1 trillion by 2016.
Insight, Newton and Standish bond managers have mixed views on the likely success of the programme.
Brain says while the measures are potentially beneficial they may have only limited impact:
“It seems strange to suggest bond prices will go down when the ECB is buying an extra €45bn a month, but this is certainly what happened in the previous examples of US QE. Apparently the market is prepared to believe the ECB will achieve its aim of stimulating growth along with inflation and as a result is happy to sell bonds to the ECB and invest in risk assets.
“Unfortunately, the ECB has joined this party a bit late and the economy’s ability to respond to this printing of money is likely to be less now than it was when the US first began buying government debt following the 2008 global financial crisis.”
He adds: “Getting the new money out into the real economy also remains a problem. The banks are reluctant (owing to regulatory constraints) to expand their balance sheets and there is a lack of demand for the money. Perhaps a new Marshall Plan is required?”
Of the ECB’s latest move, Meriten’s chief economist Holger Fahrinkrug says although the effects on the real economy are likely to be smaller than in the US and the UK, on balance eurozone growth should be underpinned by the programme. “We see limited downside for German Bund yields if growth and inflation expectations improve, i.e, if the market deems the ECB’s programme credible. However, spreads of peripheral bonds continue to narrow. All euro area risk assets would tend to benefit from an improving cyclical environment and the fact the ECB has demonstrated its commitment to enforce economic and inflation normalisation.”
Burgess says Insight is perhaps more positive on European growth for the year ahead than a lot of its peers. “Structural reforms have happened in many countries and should be positive for growth,” he says. “Plus there are signs of improvement from bank lending, lower fiscal headwinds as well as the positive impact from QE and lower oil prices – as such we anticipate GDP growth of around 2%, about 1% above consensus.”
Dec08
Dec09
QE1 QE2Operation
Twist
Fedtaperingbegins
QE3
Dec10
Dec11
Dec12
Dec13
Dec14
2.132.10
Yiel
d (%
)
1.5
1.0
0.5
2.0
2.5
3.0
3.5
4.0
4.5
5 Year/5 Year Forward 10 Year Treasury
0
ENDING QE HAS LED TO LOWER TREASURY YIELD?
We see limited downside for German Bund yields if growth and ination expectations improve, i.e, if the market deems the ECB’s programme credible.
“”Holger Fahrinkrug, Meriten
�xed income/ Q1 2015
2 shifting sands
inflation versus deflationWhatever the success of QE in Europe, Alcentra’s Hatfield says: “Even with all the announced measures, sustained downward pressure on oil prices has the potential for continued deflationary impact and this looks set to make the ECB’s task even more challenging.”
Both Europe and the UK saw inflation reach record lows within the past 12 months and the US bond market last year cut its inflation expectations to their lowest level in nearly three years as the Fed wound down its QE programme.2 The big fear within Europe has been the spectre of deflation, with some analysts suggesting the continent could emulate the so-called lost decade of economic growth in Japan. In truth, only time will tell how various factors, including the €1.1 trillion QE package announced in January, influence inflationary developments in the months ahead and what direct impact these will have on fixed income markets.
With respect to the UK’s low inflation levels, Burgess’ Insight colleague David Hooker notes “It will be a challenging year for the inflation market”. However, it also comes full circle with oil again taking centre stage, as Hooker points out: “The prospect of another year of relative robust activity, boosted by the recent fall in the oil price, will result in there being less spare capacity, and this should boost sentiment towards inflation markets.”
divergence and driversNewton’s Brain and Insight’s Burgess both believe the near-term outlook for bond and currency markets will continue to be influenced by the contrasting economic fortunes of the US and Europe. Burgess comments the divergent monetary stance of major, developed economies – the US and UK versus Europe and Japan – is now stark. “Even if the US and UK do not raise rates this year, they will be preparing to do so,” he says.
Brain expands on this, noting lacklustre global growth, widespread disinflation and persistent political risks (including Russia/Ukraine and Greece), are likely to ensure long-dated ‘safe-haven’ assets retain greater support. “In Europe, meanwhile, the threat of deflation, and the spread of economic stagnation to Germany, reinforces the need for further ECB balance sheet expansion, which represents a still-supportive backdrop for that region’s debt markets, and spread products in particular.”
With volatility expected to continue across credit markets this year, Burgess thinks that fundamental research will be critical to performance, with stock selection likely to be a more significant driver of returns than over the past few years. “If fixed income markets start to move in different directions, investors could also benefit from adding value from a variety of sources such as duration and yield curve positioning, FX as well as sector and stock selection.”
Investors could bene�t from adding value from a variety of sources, such as duration and yield curve positioning, FX as well as sector and stock selection.
“
”Andy Burgess, Insight
$m
bps
100
200
300
400
500
600
700 700
600
500
400
300
100
200
0
Gap Investment Grade High Yield
2006 2007 2008 2009 2010 2011 2012 2013 20140
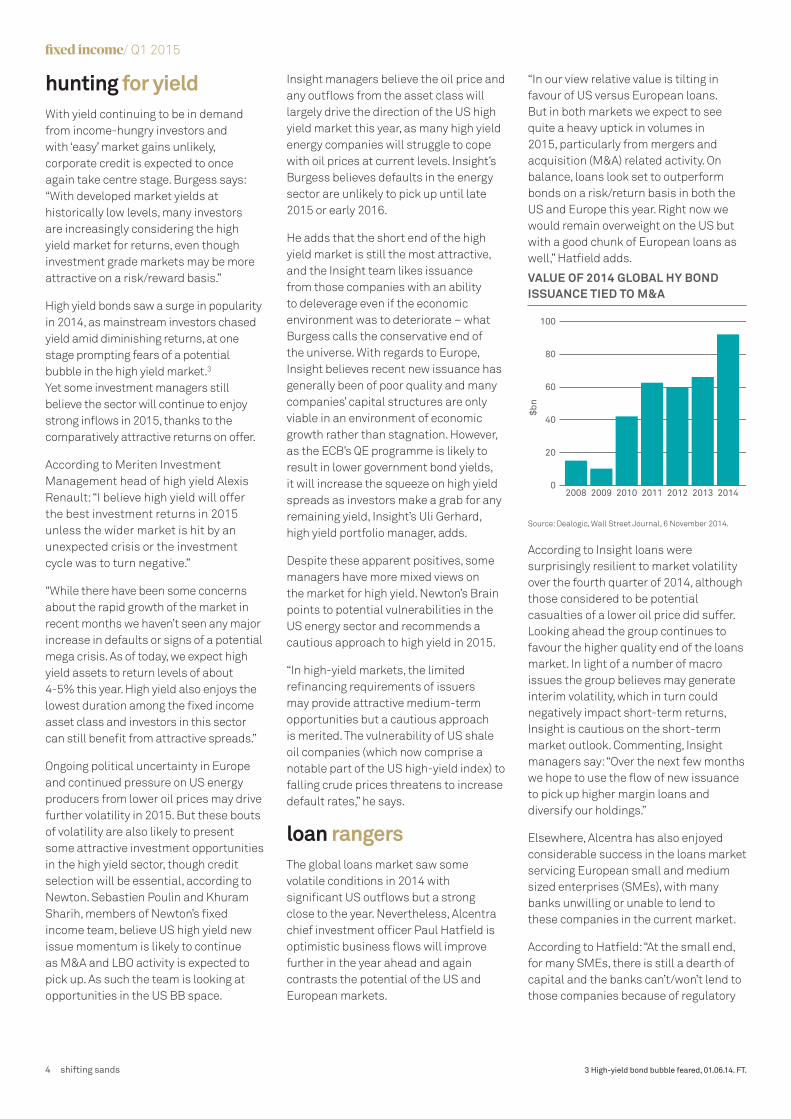
Source: Dealogic, 22 December 2014.
EUROPEAN BONDS AVERAGE SPREAD TO BENCHMARK (1 JAN – 19 DEC)
2 Eurozone bond issuance set to fall in 2015. 14.01.15. FT.
specialreport
shifting sands 3
hunting for yieldWith yield continuing to be in demand from income-hungry investors and with ‘easy’ market gains unlikely, corporate credit is expected to once again take centre stage. Burgess says: “With developed market yields at historically low levels, many investors are increasingly considering the high yield market for returns, even though investment grade markets may be more attractive on a risk/reward basis.”
High yield bonds saw a surge in popularity in 2014, as mainstream investors chased yield amid diminishing returns, at one stage prompting fears of a potential bubble in the high yield market.3 Yet some investment managers still believe the sector will continue to enjoy strong inflows in 2015, thanks to the comparatively attractive returns on offer.
According to Meriten Investment Management head of high yield Alexis Renault: “I believe high yield will offer the best investment returns in 2015 unless the wider market is hit by an unexpected crisis or the investment cycle was to turn negative.”
“While there have been some concerns about the rapid growth of the market in recent months we haven’t seen any major increase in defaults or signs of a potential mega crisis. As of today, we expect high yield assets to return levels of about 4-5% this year. High yield also enjoys the lowest duration among the fixed income asset class and investors in this sector can still benefit from attractive spreads.”
Ongoing political uncertainty in Europe and continued pressure on US energy producers from lower oil prices may drive further volatility in 2015. But these bouts of volatility are also likely to present some attractive investment opportunities in the high yield sector, though credit selection will be essential, according to Newton. Sebastien Poulin and Khuram Sharih, members of Newton’s fixed income team, believe US high yield new issue momentum is likely to continue as M&A and LBO activity is expected to pick up. As such the team is looking at opportunities in the US BB space.
Insight managers believe the oil price and any outflows from the asset class will largely drive the direction of the US high yield market this year, as many high yield energy companies will struggle to cope with oil prices at current levels. Insight’s Burgess believes defaults in the energy sector are unlikely to pick up until late 2015 or early 2016.
He adds that the short end of the high yield market is still the most attractive, and the Insight team likes issuance from those companies with an ability to deleverage even if the economic environment was to deteriorate – what Burgess calls the conservative end of the universe. With regards to Europe, Insight believes recent new issuance has generally been of poor quality and many companies’ capital structures are only viable in an environment of economic growth rather than stagnation. However, as the ECB’s QE programme is likely to result in lower government bond yields, it will increase the squeeze on high yield spreads as investors make a grab for any remaining yield, Insight’s Uli Gerhard, high yield portfolio manager, adds.
Despite these apparent positives, some managers have more mixed views on the market for high yield. Newton’s Brain points to potential vulnerabilities in the US energy sector and recommends a cautious approach to high yield in 2015.
“In high-yield markets, the limited refinancing requirements of issuers may provide attractive medium-term opportunities but a cautious approach is merited. The vulnerability of US shale oil companies (which now comprise a notable part of the US high-yield index) to falling crude prices threatens to increase default rates,” he says.
loan rangersThe global loans market saw some volatile conditions in 2014 with significant US outflows but a strong close to the year. Nevertheless, Alcentra chief investment officer Paul Hatfield is optimistic business flows will improve further in the year ahead and again contrasts the potential of the US and European markets.
“In our view relative value is tilting in favour of US versus European loans. But in both markets we expect to see quite a heavy uptick in volumes in 2015, particularly from mergers and acquisition (M&A) related activity. On balance, loans look set to outperform bonds on a risk/return basis in both the US and Europe this year. Right now we would remain overweight on the US but with a good chunk of European loans as well,” Hatfield adds.
Source: Dealogic, Wall Street Journal, 6 November 2014.
According to Insight loans were surprisingly resilient to market volatility over the fourth quarter of 2014, although those considered to be potential casualties of a lower oil price did suffer. Looking ahead the group continues to favour the higher quality end of the loans market. In light of a number of macro issues the group believes may generate interim volatility, which in turn could negatively impact short-term returns, Insight is cautious on the short-term market outlook. Commenting, Insight managers say: “Over the next few months we hope to use the flow of new issuance to pick up higher margin loans and diversify our holdings.”
Elsewhere, Alcentra has also enjoyed considerable success in the loans market servicing European small and medium sized enterprises (SMEs), with many banks unwilling or unable to lend to these companies in the current market.
According to Hatfield: “At the small end, for many SMEs, there is still a dearth of capital and the banks can’t/won’t lend to those companies because of regulatory
$bn
20
40
60
80
100
2008 2009 2010 2011 2012 2013 20140
VALUE OF 2014 GLOBAL HY BOND ISSUANCE TIED TO M&A
3 High-yield bond bubble feared, 01.06.14. FT.
�xed income/ Q1 2015
4 shifting sands

and other issues. We still continue to see good opportunities in that sector. The SME area is still very undersupplied with capital in Europe and will continue to present attractive opportunities. It is much less liquid than the broadly syndicated large company loan market and often offers higher returns.”
The biggest potential threat to loan market investors is default but Hatfield remains unfazed by current default levels and predicts a benign market environment in the year ahead.
“Default levels may go up slightly this year but not to the level that would cause many investors sleepless nights. The default environment is very benign in the loan universe within northwest Europe and the US where we are lending and recent market polls have put the likely US default rate well below 2.3% for the next couple of years,” he says.
In the current climate multi-sector credit has proved particularly attractive to investors seeking flexibility in uncertain markets. Hatfield adds: “Multi-sector credit is definitely becoming more popular. We have seen a lot of both companies wanting to take advantage of changing dynamics between loans and bonds to get cheaper financing and we have investors who want to switch between loans and bonds to get better returns versus risk as market conditions change. An increasing number of investors want to hold a core of liquid, lower risk investments with an additional tranche of illiquid and higher return securities in areas like structured credit or direct lending in the SME area or stressed and distressed sectors. Having the ability to switch between these investments, move with the cycle and take advantage of changing dynamics is becoming very attractive for investors operating in sometimes uncertain markets.”
volatile timesEmerging markets saw a volatile 2014 with a range of geopolitical events prompting widespread market uncertainty.
Despite rising geopolitical risk in specific emerging markets such as the Ukraine and the Middle East and decelerating growth in China throughout 2014, Standish believes many emerging markets continue to present positive investment potential and opportunities for investor diversification.
According to Han: “Over the past 12-24 months we have seen a lot of dislocations across trends in emerging markets. Looking ahead we expect to see continued volatility throughout 2015. But although geopolitical risks are clouding the near-term outlook, valuations in the emerging market debt space are more attractive than they were a year ago and we expect to see a resynchronisation of global growth as emerging markets recover.”
Source: Wall Street Journal/VIX Index.
While volatility has been commonplace in emerging markets over the past 18 months it has also been a persistent theme in mainstream developed fixed income markets. Several warning signs of further volatility ahead are also becoming more evident. The price of gold – viewed as a safe haven investment in volatile markets – has climbed steadily and the VIX index, which measures anticipated volatility, jumped in January, following some erratic upward spikes in the second half of 2014.5
In jittery markets any unexpected monetary move can upset markets, affecting fixed income and other sectors. In January this year a sudden move by
the Swiss National Bank to remove the ceiling on its franc currency triggered a short-lived market panic, with the franc briefly jumping 14% against the euro.6 The oil price collapse late last year also helped drive fresh bouts of market volatility and some managers fear similar market changing events look increasingly likely.
Commenting on fragile market sentiment and the potential for future problems and even possible market contagion, Newton equity fund manager Iain Stewart notes: “As the example of the oil price slump illustrates, market perceptions can rebase very sharply, despite very little new information.”
Such predictions may prove unfounded. While the oil price slump significantly upset fixed income markets, some
managers feel lower oil prices could also have a more benign long-term effect, cutting costs for business and consumers and ultimately feeding through to corporate profits and bond markets. Despite recent volatility, Brain remains optimistic on the 2015 market outlook.
“At a macroeconomic level we are fairly optimistic about growth. In recent months many commentators have seemed concerned about the negative effects of falling oil prices rather than the positive effects. But on the positive side energy prices will come down for a range of countries and industries such as plastics and packaging will see overheads reduce. While oil producers will feel the impact of falling prices, markets such as the US, UK and Europe – which are all trying to reduce their debt burden – should benefit from the change. This in turn could bring positive economic benefits to the broader global market and, ultimately, bond market investors,” he concludes.
GETTING IN THE SWING
The VIX Index 2013-2015.
CB
OE
Vol
atili
ty In
dex
0
5
15
10
20
25
30
2013
2010-2014average: 18.6
12 January 2015
20152014
4 Treasury market cuts US inflation outlook. 23.09.14. FT.5 Traders prepare for stock volatility. Wall Street Journal. 6 A tangle of anxieties. The Economist. 17.01.14.
specialreport
shifting sands 5
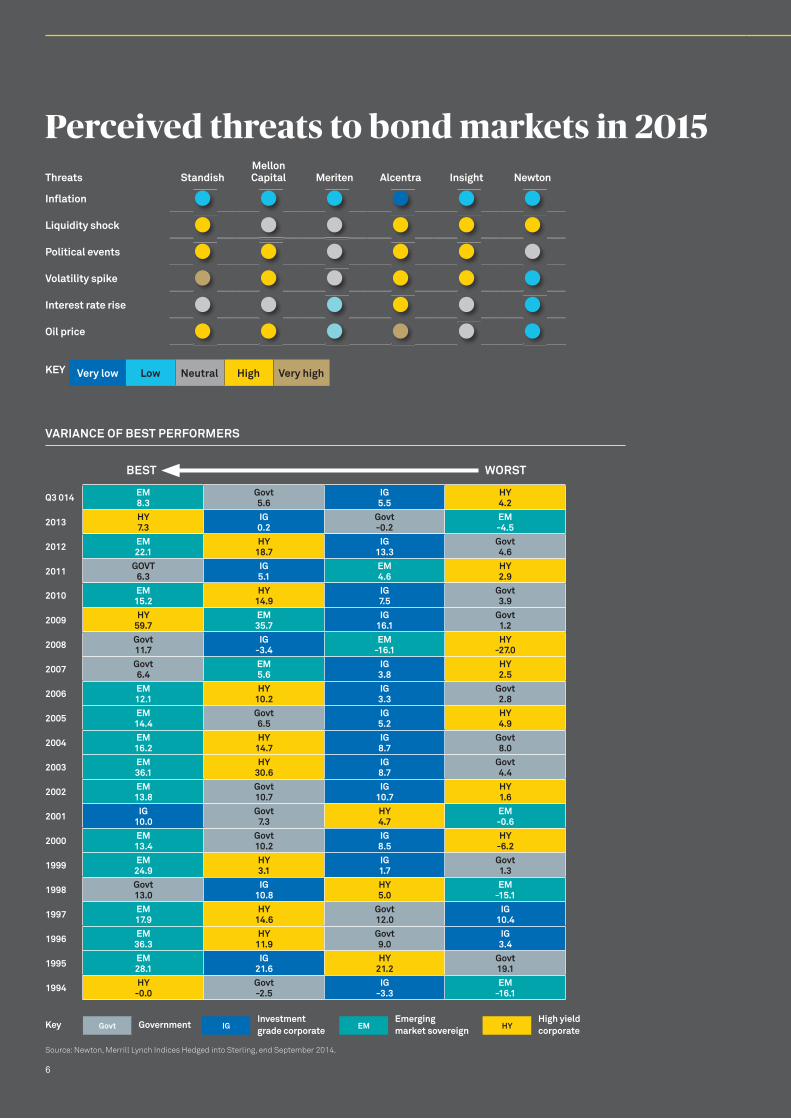
Perceived threats to bond markets in 2015
VARIANCE OF BEST PERFORMERS
Source: Newton, Merrill Lynch Indices Hedged into Sterling, end September 2014.
Threats StandishMellon Capital Meriten Alcentra Insight Newton
Inflation
Liquidity shock
Political events
Volatility spike
Interest rate rise
Oil price
Q3 014 EM 8.3
Govt 5.6
IG 5.5
HY 4.2
2013 HY 7.3
IG 0.2
Govt -0.2
EM -4.5
2012 EM 22.1
HY 18.7
IG 13.3
Govt 4.6
2011 GOVT 6.3
IG 5.1
EM 4.6
HY 2.9
2010 EM 15.2
HY 14.9
IG 7.5
Govt 3.9
2009 HY 59.7
EM 35.7
IG 16.1
Govt 1.2
2008 Govt 11.7
IG -3.4
EM -16.1
HY -27.0
2007 Govt 6.4
EM 5.6
IG 3.8
HY 2.5
2006 EM 12.1
HY 10.2
IG 3.3
Govt 2.8
2005 EM 14.4
Govt 6.5
IG 5.2
HY 4.9
2004 EM 16.2
HY 14.7
IG 8.7
Govt 8.0
2003 EM 36.1
HY 30.6
IG 8.7
Govt 4.4
2002 EM 13.8
Govt 10.7
IG 10.7
HY 1.6
2001 IG 10.0
Govt 7.3
HY 4.7
EM -0.6
2000 EM 13.4
Govt 10.2
IG 8.5
HY -6.2
1999 EM 24.9
HY 3.1
IG 1.7
Govt 1.3
1998 Govt 13.0
IG 10.8
HY 5.0
EM -15.1
1997 EM 17.9
HY 14.6
Govt 12.0
IG 10.4
1996 EM 36.3
HY 11.9
Govt 9.0
IG 3.4
1995 EM 28.1
IG 21.6
HY 21.2
Govt 19.1
1994 HY -0.0
Govt -2.5
IG -3.3
EM -16.1
Very low Low Neutral High Very highKEY
GovernmentInvestment grade corporate
Emerging market sovereign
High yield corporate
Key
BEST WORST
Govt IG EM HY
6
Perceived threats to bond markets in 2015
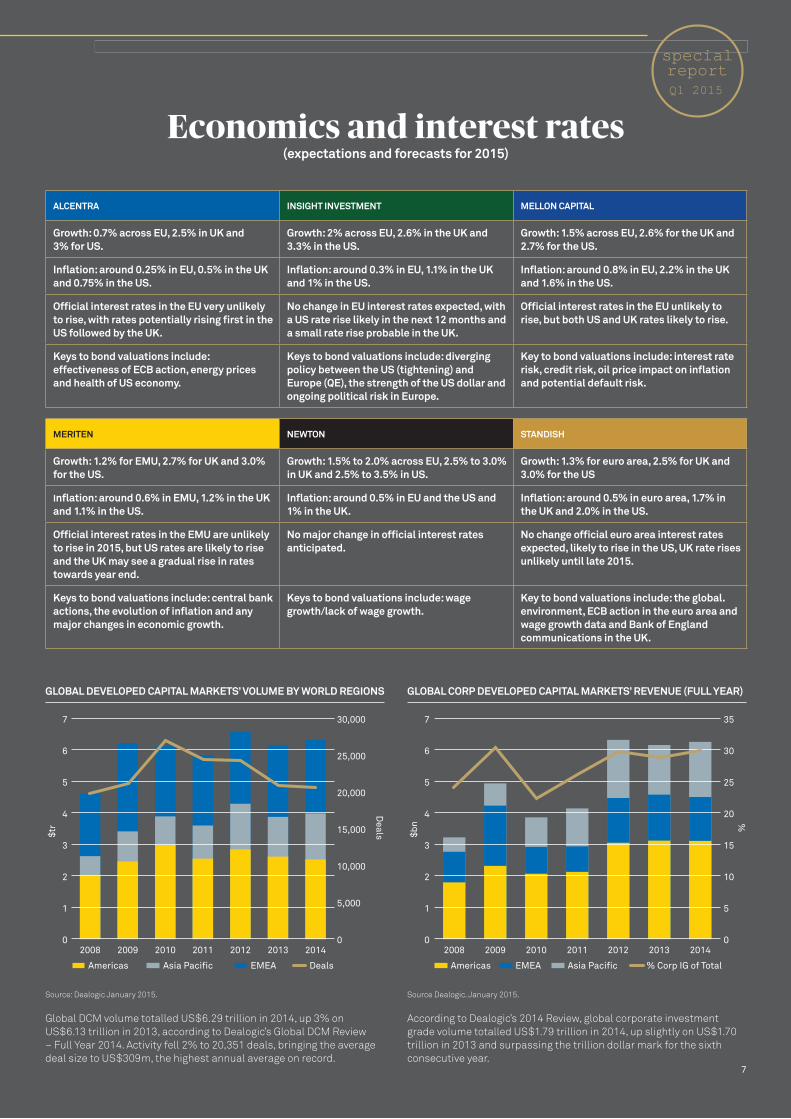
Source: Dealogic January 2015.
Global DCM volume totalled US$6.29 trillion in 2014, up 3% on US$6.13 trillion in 2013, according to Dealogic’s Global DCM Review – Full Year 2014. Activity fell 2% to 20,351 deals, bringing the average deal size to US$309m, the highest annual average on record.
GLOBAL DEVELOPED CAPITAL MARKETS’ VOLUME BY WORLD REGIONS
Source Dealogic. January 2015.
According to Dealogic’s 2014 Review, global corporate investment grade volume totalled US$1.79 trillion in 2014, up slightly on US$1.70 trillion in 2013 and surpassing the trillion dollar mark for the sixth consecutive year.
GLOBAL CORP DEVELOPED CAPITAL MARKETS’ REVENUE (FULL YEAR)
2008 2009 2010 2011 2012 2013 2014
$tr
Deals
0 0
1 5,000
210,000
3
15,000
4
20,0005
25,0006
7 30,000
Americas Asia Pacific EMEA Deals
2008 2009 2010 2011 2012 2013 2014
$bn %
0 0
1 5
2 10
3 15
4 20
5
30
25
6
7 35
Americas EMEA Asia Pacific % Corp IG of Total
Economics and interest rates (expectations and forecasts for 2015)
ALCENTRA INSIGHT INVESTMENT MELLON CAPITAL
Growth: 0.7% across EU, 2.5% in UK and 3% for US.
Growth: 2% across EU, 2.6% in the UK and 3.3% in the US.
Growth: 1.5% across EU, 2.6% for the UK and 2.7% for the US.
Inflation: around 0.25% in EU, 0.5% in the UK and 0.75% in the US.
Inflation: around 0.3% in EU, 1.1% in the UK and 1% in the US.
Inflation: around 0.8% in EU, 2.2% in the UK and 1.6% in the US.
Official interest rates in the EU very unlikely to rise, with rates potentially rising first in the US followed by the UK.
No change in EU interest rates expected, with a US rate rise likely in the next 12 months and a small rate rise probable in the UK.
Official interest rates in the EU unlikely to rise, but both US and UK rates likely to rise.
Keys to bond valuations include: effectiveness of ECB action, energy prices and health of US economy.
Keys to bond valuations include: diverging policy between the US (tightening) and Europe (QE), the strength of the US dollar and ongoing political risk in Europe.
Key to bond valuations include: interest rate risk, credit risk, oil price impact on inflation and potential default risk.
MERITEN NEWTON STANDISH
Growth: 1.2% for EMU, 2.7% for UK and 3.0% for the US.
Growth: 1.5% to 2.0% across EU, 2.5% to 3.0% in UK and 2.5% to 3.5% in US.
Growth: 1.3% for euro area, 2.5% for UK and 3.0% for the US
Inflation: around 0.6% in EMU, 1.2% in the UK and 1.1% in the US.
Inflation: around 0.5% in EU and the US and 1% in the UK.
Inflation: around 0.5% in euro area, 1.7% in the UK and 2.0% in the US.
Official interest rates in the EMU are unlikely to rise in 2015, but US rates are likely to rise and the UK may see a gradual rise in rates towards year end.
No major change in official interest rates anticipated.
No change official euro area interest rates expected, likely to rise in the US, UK rate rises unlikely until late 2015.
Keys to bond valuations include: central bank actions, the evolution of inflation and any major changes in economic growth.
Keys to bond valuations include: wage growth/lack of wage growth.
Key to bond valuations include: the global. environment, ECB action in the euro area and wage growth data and Bank of England communications in the UK.
specialreportQ1 2015
7

the road ahead
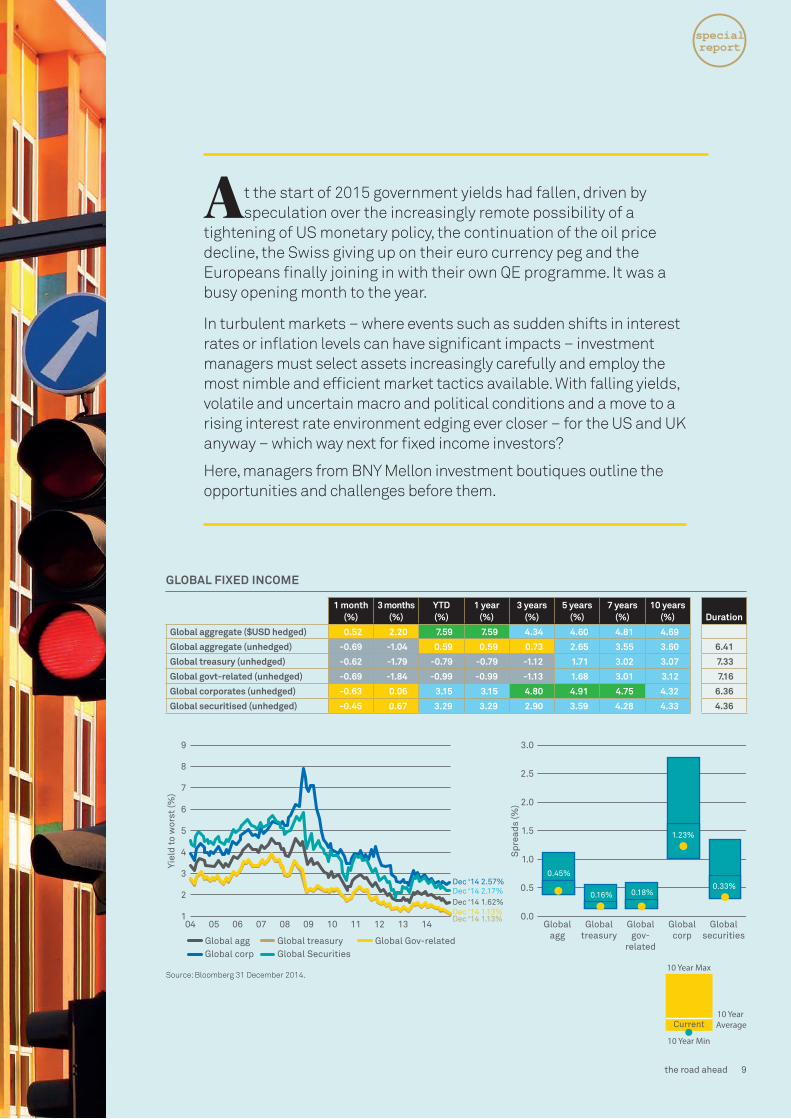
At the start of 2015 government yields had fallen, driven by speculation over the increasingly remote possibility of a
tightening of US monetary policy, the continuation of the oil price decline, the Swiss giving up on their euro currency peg and the Europeans finally joining in with their own QE programme. It was a busy opening month to the year.
In turbulent markets – where events such as sudden shifts in interest rates or inflation levels can have significant impacts – investment managers must select assets increasingly carefully and employ the most nimble and efficient market tactics available. With falling yields, volatile and uncertain macro and political conditions and a move to a rising interest rate environment edging ever closer – for the US and UK anyway – which way next for fixed income investors?
Here, managers from BNY Mellon investment boutiques outline the opportunities and challenges before them.
Yiel
d to
wor
st (%
)
Spr
eads
(%)
2
3
4
6
5
7
8
9
Global agg Global treasuryGlobal corp Global Securities
Global Gov-related
Dec ‘14 1.13%Dec ‘14 1.13%Dec ‘14 1.62%Dec ‘14 2.17%Dec ‘14 2.57%
04 05 06 07 08 09 10 11 12 13 14 Globalagg
Globaltreasury
Globalgov-
related
Globalcorp
Globalsecurities
1
1.5
1.0
0.5
2.0
2.5
3.0
0.0
0.45%
0.16% 0.18%
1.23%
0.33%
1 month (%)
3 months (%)
YTD (%)
1 year (%)
3 years (%)
5 years (%)
7 years (%)
10 years (%) Duration
Global aggregate ($USD hedged) 0.52 2.20 7.59 7.59 4.34 4.60 4.81 4.69
Global aggregate (unhedged) -0.69 -1.04 0.59 0.59 0.73 2.65 3.55 3.60 6.41
Global treasury (unhedged) -0.62 -1.79 -0.79 -0.79 -1.12 1.71 3.02 3.07 7.33
Global govt-related (unhedged) -0.69 -1.84 -0.99 -0.99 -1.13 1.68 3.01 3.12 7.16
Global corporates (unhedged) -0.63 0.06 3.15 3.15 4.80 4.91 4.75 4.32 6.36
Global securitised (unhedged) -0.45 0.67 3.29 3.29 2.90 3.59 4.28 4.33 4.36
Source: Bloomberg 31 December 2014.
GLOBAL FIXED INCOME
10 Year Average
10 Year Min
10 Year Max
Current
specialreport
the road ahead 9
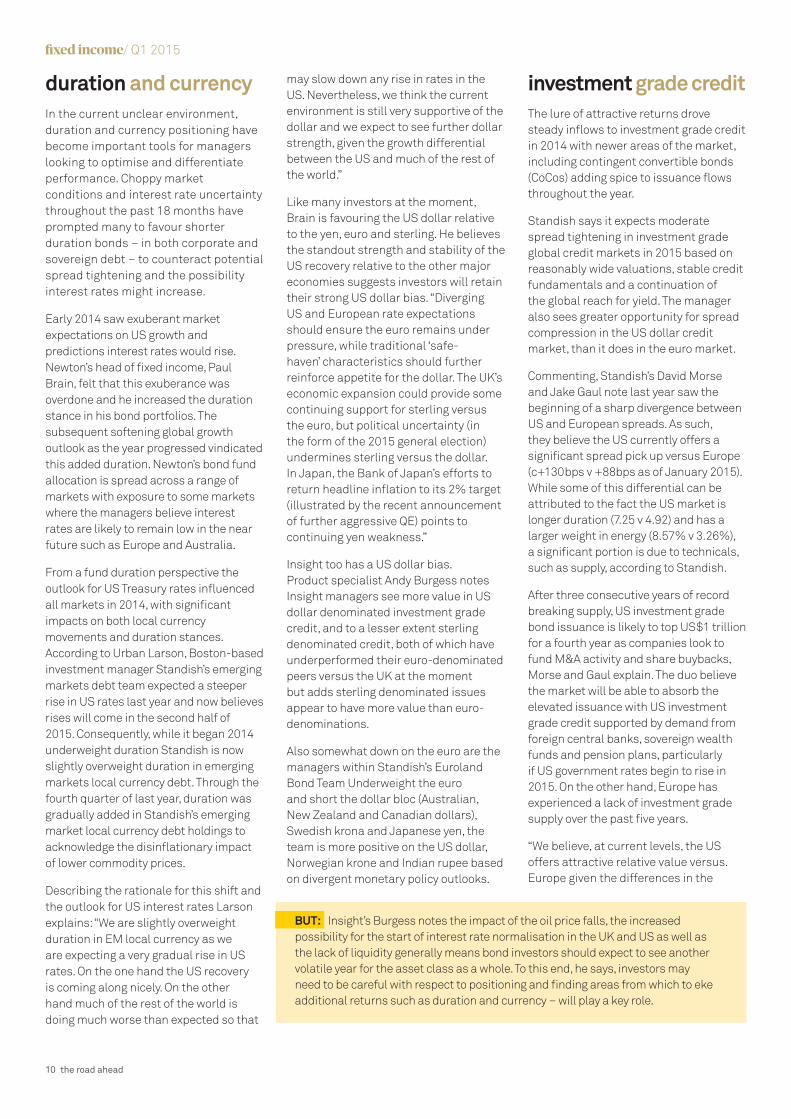
duration and currencyIn the current unclear environment, duration and currency positioning have become important tools for managers looking to optimise and differentiate performance. Choppy market conditions and interest rate uncertainty throughout the past 18 months have prompted many to favour shorter duration bonds – in both corporate and sovereign debt – to counteract potential spread tightening and the possibility interest rates might increase.
Early 2014 saw exuberant market expectations on US growth and predictions interest rates would rise. Newton’s head of fixed income, Paul Brain, felt that this exuberance was overdone and he increased the duration stance in his bond portfolios. The subsequent softening global growth outlook as the year progressed vindicated this added duration. Newton’s bond fund allocation is spread across a range of markets with exposure to some markets where the managers believe interest rates are likely to remain low in the near future such as Europe and Australia.
From a fund duration perspective the outlook for US Treasury rates influenced all markets in 2014, with significant impacts on both local currency movements and duration stances. According to Urban Larson, Boston-based investment manager Standish’s emerging markets debt team expected a steeper rise in US rates last year and now believes rises will come in the second half of 2015. Consequently, while it began 2014 underweight duration Standish is now slightly overweight duration in emerging markets local currency debt. Through the fourth quarter of last year, duration was gradually added in Standish’s emerging market local currency debt holdings to acknowledge the disinflationary impact of lower commodity prices.
Describing the rationale for this shift and the outlook for US interest rates Larson explains: “We are slightly overweight duration in EM local currency as we are expecting a very gradual rise in US rates. On the one hand the US recovery is coming along nicely. On the other hand much of the rest of the world is doing much worse than expected so that
may slow down any rise in rates in the US. Nevertheless, we think the current environment is still very supportive of the dollar and we expect to see further dollar strength, given the growth differential between the US and much of the rest of the world.”
Like many investors at the moment, Brain is favouring the US dollar relative to the yen, euro and sterling. He believes the standout strength and stability of the US recovery relative to the other major economies suggests investors will retain their strong US dollar bias. “Diverging US and European rate expectations should ensure the euro remains under pressure, while traditional ‘safe-haven’ characteristics should further reinforce appetite for the dollar. The UK’s economic expansion could provide some continuing support for sterling versus the euro, but political uncertainty (in the form of the 2015 general election) undermines sterling versus the dollar. In Japan, the Bank of Japan’s efforts to return headline inflation to its 2% target (illustrated by the recent announcement of further aggressive QE) points to continuing yen weakness.”
Insight too has a US dollar bias. Product specialist Andy Burgess notes Insight managers see more value in US dollar denominated investment grade credit, and to a lesser extent sterling denominated credit, both of which have underperformed their euro-denominated peers versus the UK at the moment but adds sterling denominated issues appear to have more value than euro-denominations.
Also somewhat down on the euro are the managers within Standish’s Euroland Bond Team Underweight the euro and short the dollar bloc (Australian, New Zealand and Canadian dollars), Swedish krona and Japanese yen, the team is more positive on the US dollar, Norwegian krone and Indian rupee based on divergent monetary policy outlooks.
investment grade creditThe lure of attractive returns drove steady inflows to investment grade credit in 2014 with newer areas of the market, including contingent convertible bonds (CoCos) adding spice to issuance flows throughout the year.
Standish says it expects moderate spread tightening in investment grade global credit markets in 2015 based on reasonably wide valuations, stable credit fundamentals and a continuation of the global reach for yield. The manager also sees greater opportunity for spread compression in the US dollar credit market, than it does in the euro market.
Commenting, Standish’s David Morse and Jake Gaul note last year saw the beginning of a sharp divergence between US and European spreads. As such, they believe the US currently offers a significant spread pick up versus Europe (c+130bps v +88bps as of January 2015). While some of this differential can be attributed to the fact the US market is longer duration (7.25 v 4.92) and has a larger weight in energy (8.57% v 3.26%), a significant portion is due to technicals, such as supply, according to Standish.
After three consecutive years of record breaking supply, US investment grade bond issuance is likely to top US$1 trillion for a fourth year as companies look to fund M&A activity and share buybacks, Morse and Gaul explain. The duo believe the market will be able to absorb the elevated issuance with US investment grade credit supported by demand from foreign central banks, sovereign wealth funds and pension plans, particularly if US government rates begin to rise in 2015. On the other hand, Europe has experienced a lack of investment grade supply over the past five years.
“We believe, at current levels, the US offers attractive relative value versus. Europe given the differences in the
BUT: Insight’s Burgess notes the impact of the oil price falls, the increased possibility for the start of interest rate normalisation in the UK and US as well as the lack of liquidity generally means bond investors should expect to see another volatile year for the asset class as a whole. To this end, he says, investors may need to be careful with respect to positioning and finding areas from which to eke additional returns such as duration and currency – will play a key role.
�xed income/ Q1 2015
10 the road ahead

future economic growth prospects and all in yields.”
Insight head of UK and global credit, Peter Bentley, currently favours US dollar and sterling-denominated issues over euro-denominated issues in the belief they are more attractively valued. “We think European credit spreads are vulnerable by comparison, given their sharp narrowing over 2014,” he says.
In noting the differential between European and US corporate bond yields, Insight’s Burgess says it is an area the company is looking to exploit or arbitrage. For example, he says, take a US-based telecom company – whose corporate debt may be 50-60bps higher in its dollar denominated paper than the comparable euro denominated bond. Bentley adds that overall he believes the current environment for corporate bonds remains supportive, as balance sheets are generally strong and default rates low and likely to remain that way for some time yet.
Higher-quality corporate bond investors must be mindful also of the potential for continued (debt-holder unfriendly) merger and acquisition activity
“
”Paul Brain, Newton
OAS YEAR TO DATE CHANGECURRENT SECTOR OAS
-50 0 50 100
-1-1
-3-4
-7-7
-9-10
-17-28
6822
139
64
31
Energy 185Basic industry 174Consumer non-cyclical 105Insurance 171Consumer cyclical 103Technology 98Finance companies 101Other financial 144Communications 137Other utility 117Electric 122Capital goods 98Transportation 119Asset managers exch. 150Banking 104REITS 128Other industrial 132Natural gas 111
-10
0
20
10
30
40
50
60
Dec 09 Dec 10 Dec 11 Dec 12 Dec 13 Dec 14-20
BARCLAYS GLOBAL AGG CORP – OAS (BPS) AS OF 31 DECEMBER 2014
10-30 SPREAD CURVE (BARCLAYS US CREDIT CORP 10+ vs 7-10) – 5 YEARS
Source: Barclays POINT as at 31 December.
Source: Barclays POINT as at 31 December 2014.
BUT: The US investment grade sector remains potentially vulnerable to any unexpected interest rates rises. Commenting, Burgess says: “If US rates were to rise significantly higher than expected then we could see some further volatility in risk markets impacting the credit sector.” Although euro denominated credit is tighter than its US dollar equivalents, Burgess notes that valuations are being supported by the ECB’s asset buying programme leading to strong investor demand.
Standish’s Morse and Gaul say: “Key drivers of success in 2015 will be how credit managers’ navigate the very wide trading energy and basics industries and how they play a historically steep credit curve. Risks to our constructive outlook for spreads include renewed fears of sovereign debt contagion in Europe, a sharp slowdown in China and market dislocations caused by the Fed hiking its policy rate.”
Newton’s fund manager Howard Cunningham also highlights a few concerns regarding corporate debt. The group’s fixed income managers say investment grade credit remains highly correlated with movements in underlying sovereign bond yields, and tight spreads (low additional yield premia) afford only modest potential for gains over and above those reaped in government markets. “Higher quality corporate bond investors must be mindful also of the potential for continued (debt-holder unfriendly) merger and acquisition activity,” says Brain.
specialreport
the road ahead 11
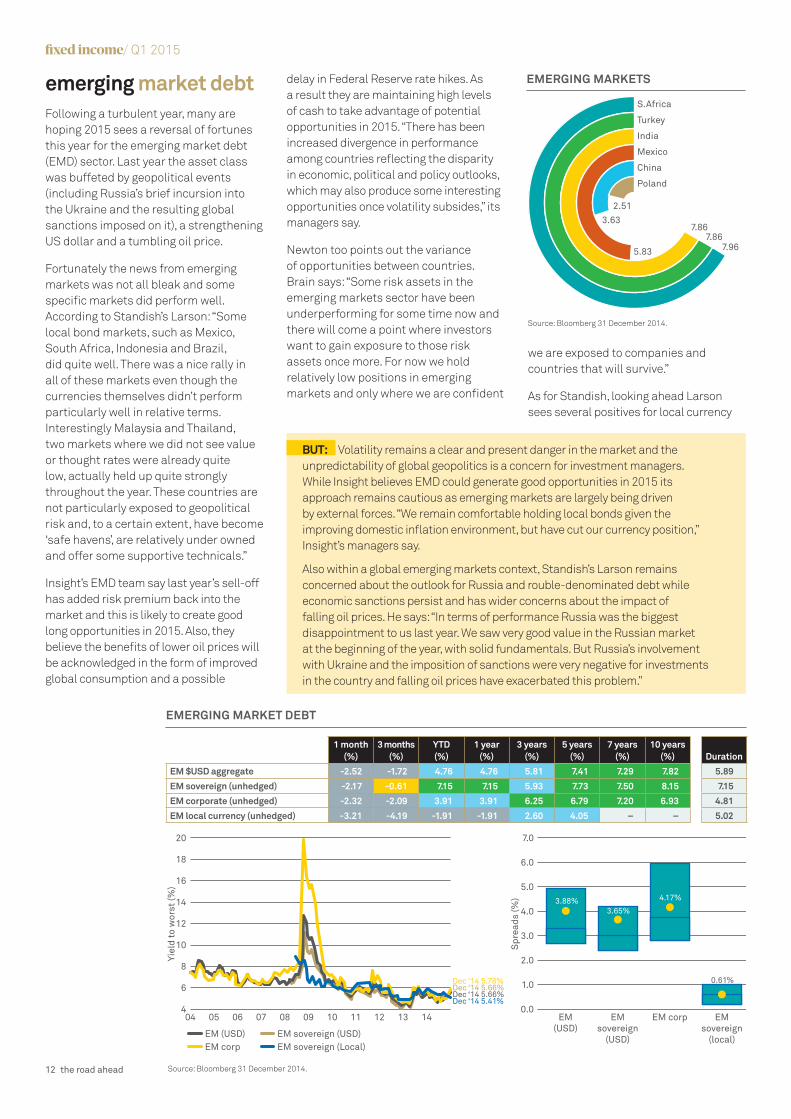
emerging market debtFollowing a turbulent year, many are hoping 2015 sees a reversal of fortunes this year for the emerging market debt (EMD) sector. Last year the asset class was buffeted by geopolitical events (including Russia’s brief incursion into the Ukraine and the resulting global sanctions imposed on it), a strengthening US dollar and a tumbling oil price.
Fortunately the news from emerging markets was not all bleak and some specific markets did perform well. According to Standish’s Larson: “Some local bond markets, such as Mexico, South Africa, Indonesia and Brazil, did quite well. There was a nice rally in all of these markets even though the currencies themselves didn’t perform particularly well in relative terms. Interestingly Malaysia and Thailand, two markets where we did not see value or thought rates were already quite low, actually held up quite strongly throughout the year. These countries are not particularly exposed to geopolitical risk and, to a certain extent, have become ‘safe havens’, are relatively under owned and offer some supportive technicals.”
Insight’s EMD team say last year’s sell-off has added risk premium back into the market and this is likely to create good long opportunities in 2015. Also, they believe the benefits of lower oil prices will be acknowledged in the form of improved global consumption and a possible
delay in Federal Reserve rate hikes. As a result they are maintaining high levels of cash to take advantage of potential opportunities in 2015. “There has been increased divergence in performance among countries reflecting the disparity in economic, political and policy outlooks, which may also produce some interesting opportunities once volatility subsides,” its managers say.
Newton too points out the variance of opportunities between countries. Brain says: “Some risk assets in the emerging markets sector have been underperforming for some time now and there will come a point where investors want to gain exposure to those risk assets once more. For now we hold relatively low positions in emerging markets and only where we are confident
we are exposed to companies and countries that will survive.”
As for Standish, looking ahead Larson sees several positives for local currency
Yiel
d to
wor
st (%
)
Spr
eads
(%)
6
8
10
14
12
16
18
20
EM (USD) EM sovereign (USD)EM corp EM sovereign (Local)
Dec ‘14 5.78%
Dec ‘14 5.66%Dec ‘14 5.66%
Dec ‘14 5.41%
04 05 06 07 08 09 10 11 12 13 14 EM(USD)
EMsovereign
(USD)
EM corp EMsovereign
(local)
4
3.0
4.0
2.0
1.0
6.0
5.0
7.0
0.0
3.88%3.65%
4.17%
0.61%
1 month (%)
3 months (%)
YTD (%)
1 year (%)
3 years (%)
5 years (%)
7 years (%)
10 years (%) Duration
EM $USD aggregate -2.52 -1.72 4.76 4.76 5.81 7.41 7.29 7.82 5.89
EM sovereign (unhedged) -2.17 -0.61 7.15 7.15 5.93 7.73 7.50 8.15 7.15
EM corporate (unhedged) -2.32 -2.09 3.91 3.91 6.25 6.79 7.20 6.93 4.81
EM local currency (unhedged) -3.21 -4.19 -1.91 -1.91 2.60 4.05 – – 5.02
S.Africa
Emerging Markets 10-Year Govt. Bond Yields (%)
Turkey
India
Mexico
China
Poland
7.867.86
7.96
2.513.63
5.83
EMERGING MARKET DEBT
Source: Bloomberg 31 December 2014.
BUT: Volatility remains a clear and present danger in the market and the unpredictability of global geopolitics is a concern for investment managers. While Insight believes EMD could generate good opportunities in 2015 its approach remains cautious as emerging markets are largely being driven by external forces. “We remain comfortable holding local bonds given the improving domestic inflation environment, but have cut our currency position,” Insight’s managers say.
Also within a global emerging markets context, Standish’s Larson remains concerned about the outlook for Russia and rouble-denominated debt while economic sanctions persist and has wider concerns about the impact of falling oil prices. He says: “In terms of performance Russia was the biggest disappointment to us last year. We saw very good value in the Russian market at the beginning of the year, with solid fundamentals. But Russia’s involvement with Ukraine and the imposition of sanctions were very negative for investments in the country and falling oil prices have exacerbated this problem.”
Source: Bloomberg 31 December 2014.
EMERGING MARKETS
�xed income/ Q1 2015
12 the road ahead
denominated EMD in 2015, not least the low level of current valuations and the considerable yield they offer. While the market for local currency EMD saw considerable volatility dent performance in 2014, Larson believes the market remains strong and continues to hold significant long-term potential with yields comparing favourably with US high yield. While he does not rule out further volatility or market shocks in 2015, he also believes the market remains resilient.
Standish EMD portfolio manager Cathy Elmore, believes US dollar-denominated emerging market corporate debt is particularly appealing in 2015 given higher spread durations and in the belief US Treasury yields are likely to stay lower for longer.
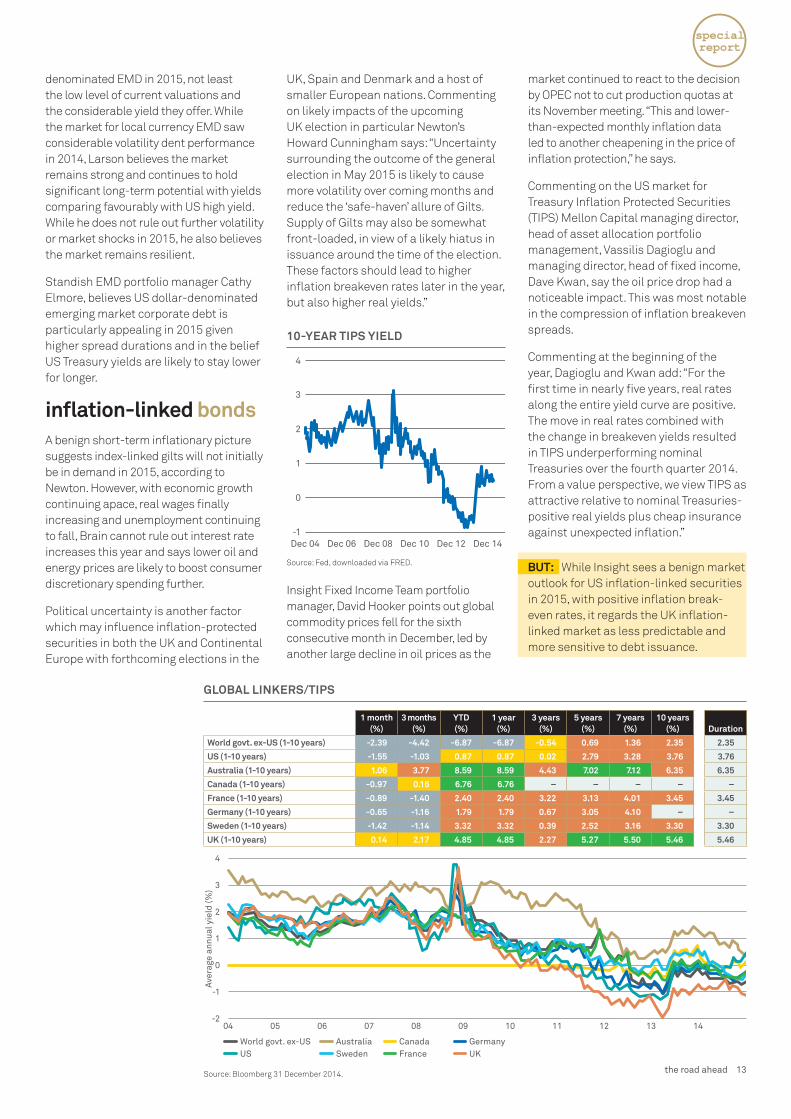
inflation-linked bondsA benign short-term inflationary picture suggests index-linked gilts will not initially be in demand in 2015, according to Newton. However, with economic growth continuing apace, real wages finally increasing and unemployment continuing to fall, Brain cannot rule out interest rate increases this year and says lower oil and energy prices are likely to boost consumer discretionary spending further.
Political uncertainty is another factor which may influence inflation-protected securities in both the UK and Continental Europe with forthcoming elections in the
UK, Spain and Denmark and a host of smaller European nations. Commenting on likely impacts of the upcoming UK election in particular Newton’s Howard Cunningham says: “Uncertainty surrounding the outcome of the general election in May 2015 is likely to cause more volatility over coming months and reduce the ‘safe-haven’ allure of Gilts. Supply of Gilts may also be somewhat front-loaded, in view of a likely hiatus in issuance around the time of the election. These factors should lead to higher inflation breakeven rates later in the year, but also higher real yields.”
Insight Fixed Income Team portfolio manager, David Hooker points out global commodity prices fell for the sixth consecutive month in December, led by another large decline in oil prices as the
market continued to react to the decision by OPEC not to cut production quotas at its November meeting. “This and lower-than-expected monthly inflation data led to another cheapening in the price of inflation protection,” he says.
Commenting on the US market for Treasury Inflation Protected Securities (TIPS) Mellon Capital managing director, head of asset allocation portfolio management, Vassilis Dagioglu and managing director, head of fixed income, Dave Kwan, say the oil price drop had a noticeable impact. This was most notable in the compression of inflation breakeven spreads.
Commenting at the beginning of the year, Dagioglu and Kwan add: “For the first time in nearly five years, real rates along the entire yield curve are positive. The move in real rates combined with the change in breakeven yields resulted in TIPS underperforming nominal Treasuries over the fourth quarter 2014. From a value perspective, we view TIPS as attractive relative to nominal Treasuries-positive real yields plus cheap insurance against unexpected inflation.”
BUT: While Insight sees a benign market outlook for US inflation-linked securities in 2015, with positive inflation break-even rates, it regards the UK inflation-linked market as less predictable and more sensitive to debt issuance.
Aver
age
annu
al y
ield
(%)
0
1
2
3
4
World govt. ex-US AustraliaUS Sweden France UK
Canada Germany
04 05 06 07 08 09 10 11 12 13 14-2
-1
1 month (%)
3 months (%)
YTD (%)
1 year (%)
3 years (%)
5 years (%)
7 years (%)
10 years (%) Duration
World govt. ex-US (1-10 years) -2.39 -4.42 -6.87 -6.87 -0.54 0.69 1.36 2.35 2.35
US (1-10 years) -1.55 -1.03 0.87 0.87 0.02 2.79 3.28 3.76 3.76
Australia (1-10 years) 1.06 3.77 8.59 8.59 4.43 7.02 7.12 6.35 6.35
Canada (1-10 years) -0.97 0.16 6.76 6.76 – – – – –
France (1-10 years) -0.89 -1.40 2.40 2.40 3.22 3.13 4.01 3.45 3.45
Germany (1-10 years) -0.65 -1.16 1.79 1.79 0.67 3.05 4.10 – –
Sweden (1-10 years) -1.42 -1.14 3.32 3.32 0.39 2.52 3.16 3.30 3.30
UK (1-10 years) 0.14 2.17 4.85 4.85 2.27 5.27 5.50 5.46 5.46
2
1
0
3
4
Dec 04 Dec 06 Dec 08 Dec 10 Dec 12 Dec 14-1
10-YEAR TIPS YIELD
Source: Fed, downloaded via FRED.
GLOBAL LINKERS/TIPS
Source: Bloomberg 31 December 2014.
specialreport
the road ahead 13
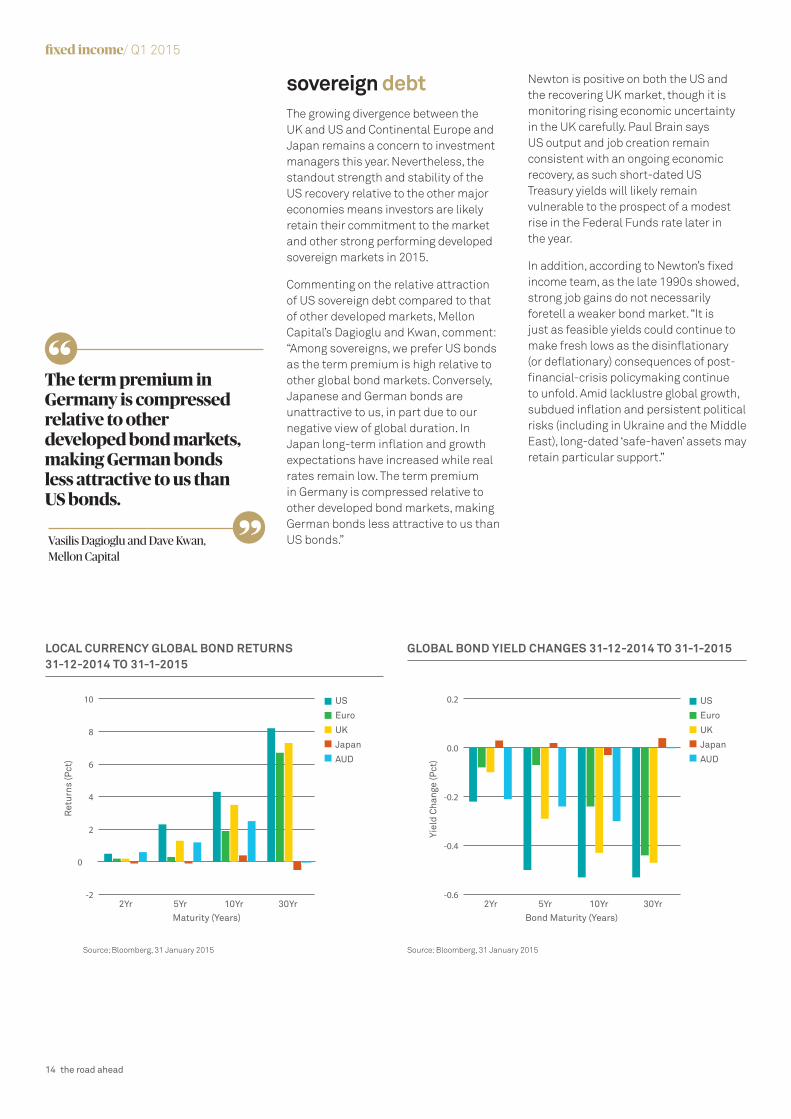
sovereign debtThe growing divergence between the UK and US and Continental Europe and Japan remains a concern to investment managers this year. Nevertheless, the standout strength and stability of the US recovery relative to the other major economies means investors are likely retain their commitment to the market and other strong performing developed sovereign markets in 2015.
Commenting on the relative attraction of US sovereign debt compared to that of other developed markets, Mellon Capital’s Dagioglu and Kwan, comment: “Among sovereigns, we prefer US bonds as the term premium is high relative to other global bond markets. Conversely, Japanese and German bonds are unattractive to us, in part due to our negative view of global duration. In Japan long-term inflation and growth expectations have increased while real rates remain low. The term premium in Germany is compressed relative to other developed bond markets, making German bonds less attractive to us than US bonds.”
Newton is positive on both the US and the recovering UK market, though it is monitoring rising economic uncertainty in the UK carefully. Paul Brain says US output and job creation remain consistent with an ongoing economic recovery, as such short-dated US Treasury yields will likely remain vulnerable to the prospect of a modest rise in the Federal Funds rate later in the year.
In addition, according to Newton’s fixed income team, as the late 1990s showed, strong job gains do not necessarily foretell a weaker bond market. “It is just as feasible yields could continue to make fresh lows as the disinflationary (or deflationary) consequences of post-financial-crisis policymaking continue to unfold. Amid lacklustre global growth, subdued inflation and persistent political risks (including in Ukraine and the Middle East), long-dated ‘safe-haven’ assets may retain particular support.”
The term premium in Germany is compressed relative to other developed bond markets, making German bonds less attractive to us than US bonds.
“
”Vasilis Dagioglu and Dave Kwan,Mellon Capital
Maturity (Years)
Ret
urns
(Pct
)
2Yr 5Yr 10Yr 30Yr
US
Euro
UK
Japan
AUD
-2
0
2
4
6
8
10
Bond Maturity (Years)
Yiel
d C
hang
e (P
ct)
2Yr 5Yr 10Yr 30Yr
US
Euro
UK
Japan
AUD
-0.6
-0.4
-0.2
0.0
0.2
Source: Bloomberg, 31 January 2015 Source: Bloomberg, 31 January 2015
LOCAL CURRENCY GLOBAL BOND RETURNS 31-12-2014 TO 31-1-2015
GLOBAL BOND YIELD CHANGES 31-12-2014 TO 31-1-2015
�xed income/ Q1 2015
14 the road ahead
UK
Developed Markets 10-Year Govt. Bond Yields (%)
USA
Canada
Spain
Germany
Japan2.17 2.17
1.79 1.60 0.540.32
DEVELOPED MARKETS
Source: Bloomberg 31 December 2014.
Insight also favours a short duration bias to US sovereign debt and is keen to explore tactical duration positioning as central banks start to take different monetary policy stances over the next year or so.
According to Insight’s Burgess: “We still expect the Fed to start raising rates at some point in 2015. The risk to this view is that prolonged commodity price weakness coupled with wage growth remaining modest could lead to the Fed waiting longer than we expect to start raising rates.”
At a macroeconomic level, the short-term bond and currency market outlook looks set to continue to be influenced by economic weakness in Europe as well as the fall in global oil prices. While some see this primarily as a threat, Newton’s Brain believes the shift could actually deliver some benefits to global markets – potentially hitting those dependant on oil production but also reducing wider inflation expectations over the mid to long-term and bringing a likely boost to oil importing countries through reduced energy/operating costs.
Assessing likely bond market impacts he adds: “Lower inflation expectations, against a backdrop of falling oil prices, could provide significant support to bond prices, even if the relatively low current levels of government bond yields suggest much of this is already priced in. Longer term, the broad exposure to fixed income markets with selective hedging of interest rate risk should produce positive returns even during periods of negative performance.”
Insight’s Bentley, says he has been building up a curve-flattening position in Italian government bonds (short 10-year versus a long at the 30-year end) as a result of a steepening in peripheral European yield curves and to take advantage of a broader asset purchase programme than expected by the market. “Diverging economic fortunes in Europe and the US and a bifurcation of monetary policy remain important drivers for the performance of European government bonds and, in our view, are likely to create opportunities for cross-market asset allocation,” he adds.
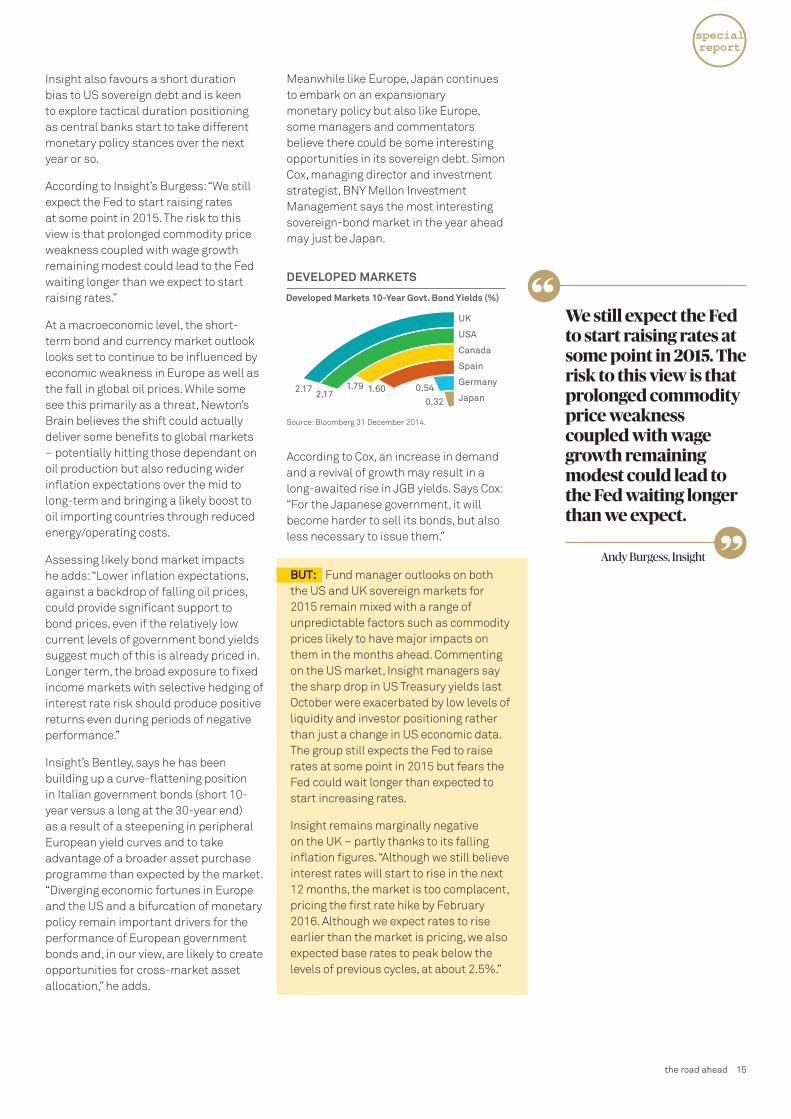
Meanwhile like Europe, Japan continues to embark on an expansionary monetary policy but also like Europe, some managers and commentators believe there could be some interesting opportunities in its sovereign debt. Simon Cox, managing director and investment strategist, BNY Mellon Investment Management says the most interesting sovereign-bond market in the year ahead may just be Japan.
According to Cox, an increase in demand and a revival of growth may result in a long-awaited rise in JGB yields. Says Cox: “For the Japanese government, it will become harder to sell its bonds, but also less necessary to issue them.”
We still expect the Fed to start raising rates at some point in 2015. The risk to this view is that prolonged commodity price weakness coupled with wage growth remaining modest could lead to the Fed waiting longer than we expect.
“
”Andy Burgess, InsightBUT: Fund manager outlooks on both the US and UK sovereign markets for 2015 remain mixed with a range of unpredictable factors such as commodity prices likely to have major impacts on them in the months ahead. Commenting on the US market, Insight managers say the sharp drop in US Treasury yields last October were exacerbated by low levels of liquidity and investor positioning rather than just a change in US economic data. The group still expects the Fed to raise rates at some point in 2015 but fears the Fed could wait longer than expected to start increasing rates.
Insight remains marginally negative on the UK – partly thanks to its falling inflation figures. “Although we still believe interest rates will start to rise in the next 12 months, the market is too complacent, pricing the first rate hike by February 2016. Although we expect rates to rise earlier than the market is pricing, we also expected base rates to peak below the levels of previous cycles, at about 2.5%.”
specialreport
the road ahead 15

Beyond the mainstream a raft of fixed income products cater to a more specialised audience and can offer potential diversification and yield benefits to investors. Here, we look
at some of the less conventional fixed income instruments and strategies in the market today.
something di�erent
16 something different
�xed income/ Q1 2015
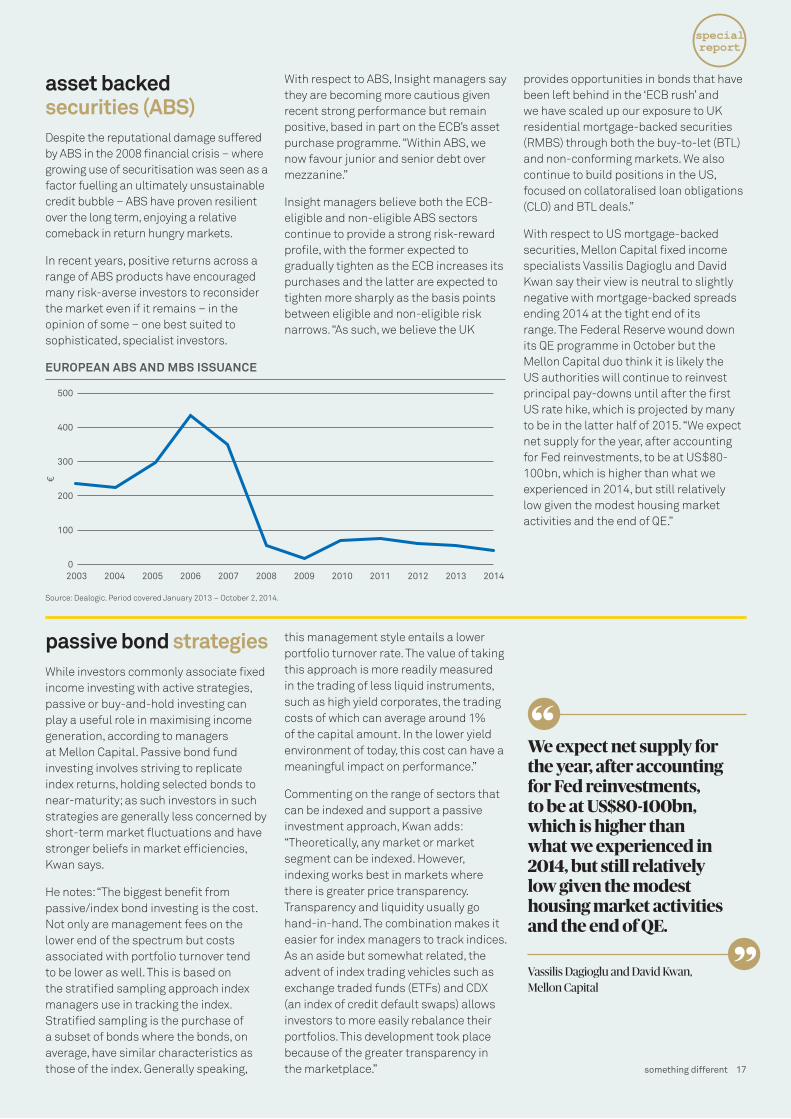
asset backed securities (ABS)Despite the reputational damage suffered by ABS in the 2008 financial crisis – where growing use of securitisation was seen as a factor fuelling an ultimately unsustainable credit bubble – ABS have proven resilient over the long term, enjoying a relative comeback in return hungry markets.
In recent years, positive returns across a range of ABS products have encouraged many risk-averse investors to reconsider the market even if it remains – in the opinion of some – one best suited to sophisticated, specialist investors.
With respect to ABS, Insight managers say they are becoming more cautious given recent strong performance but remain positive, based in part on the ECB’s asset purchase programme. “Within ABS, we now favour junior and senior debt over mezzanine.”
Insight managers believe both the ECB-eligible and non-eligible ABS sectors continue to provide a strong risk-reward profile, with the former expected to gradually tighten as the ECB increases its purchases and the latter are expected to tighten more sharply as the basis points between eligible and non-eligible risk narrows. “As such, we believe the UK
provides opportunities in bonds that have been left behind in the ‘ECB rush’ and we have scaled up our exposure to UK residential mortgage-backed securities (RMBS) through both the buy-to-let (BTL) and non-conforming markets. We also continue to build positions in the US, focused on collatoralised loan obligations (CLO) and BTL deals.”
With respect to US mortgage-backed securities, Mellon Capital fixed income specialists Vassilis Dagioglu and David Kwan say their view is neutral to slightly negative with mortgage-backed spreads ending 2014 at the tight end of its range. The Federal Reserve wound down its QE programme in October but the Mellon Capital duo think it is likely the US authorities will continue to reinvest principal pay-downs until after the first US rate hike, which is projected by many to be in the latter half of 2015. “We expect net supply for the year, after accounting for Fed reinvestments, to be at US$80-100bn, which is higher than what we experienced in 2014, but still relatively low given the modest housing market activities and the end of QE.”
passive bond strategiesWhile investors commonly associate fixed income investing with active strategies, passive or buy-and-hold investing can play a useful role in maximising income generation, according to managers at Mellon Capital. Passive bond fund investing involves striving to replicate index returns, holding selected bonds to near-maturity; as such investors in such strategies are generally less concerned by short-term market fluctuations and have stronger beliefs in market efficiencies, Kwan says.
He notes: “The biggest benefit from passive/index bond investing is the cost. Not only are management fees on the lower end of the spectrum but costs associated with portfolio turnover tend to be lower as well. This is based on the stratified sampling approach index managers use in tracking the index. Stratified sampling is the purchase of a subset of bonds where the bonds, on average, have similar characteristics as those of the index. Generally speaking,
this management style entails a lower portfolio turnover rate. The value of taking this approach is more readily measured in the trading of less liquid instruments, such as high yield corporates, the trading costs of which can average around 1% of the capital amount. In the lower yield environment of today, this cost can have a meaningful impact on performance.”
Commenting on the range of sectors that can be indexed and support a passive investment approach, Kwan adds: “Theoretically, any market or market segment can be indexed. However, indexing works best in markets where there is greater price transparency. Transparency and liquidity usually go hand-in-hand. The combination makes it easier for index managers to track indices. As an aside but somewhat related, the advent of index trading vehicles such as exchange traded funds (ETFs) and CDX (an index of credit default swaps) allows investors to more easily rebalance their portfolios. This development took place because of the greater transparency in the marketplace.”
We expect net supply for the year, after accounting for Fed reinvestments, to be at US$80-100bn, which is higher than what we experienced in 2014, but still relatively low given the modest housing market activities and the end of QE.
“
”Vassilis Dagioglu and David Kwan,Mellon Capital
€
100
200
300
400
500
02003 2004 2005 2006 2007 2008 2009 2010 2011 2012 2013 2014
EUROPEAN ABS AND MBS ISSUANCE
Source: Dealogic. Period covered January 2013 – October 2, 2014.
specialreport
something different 17
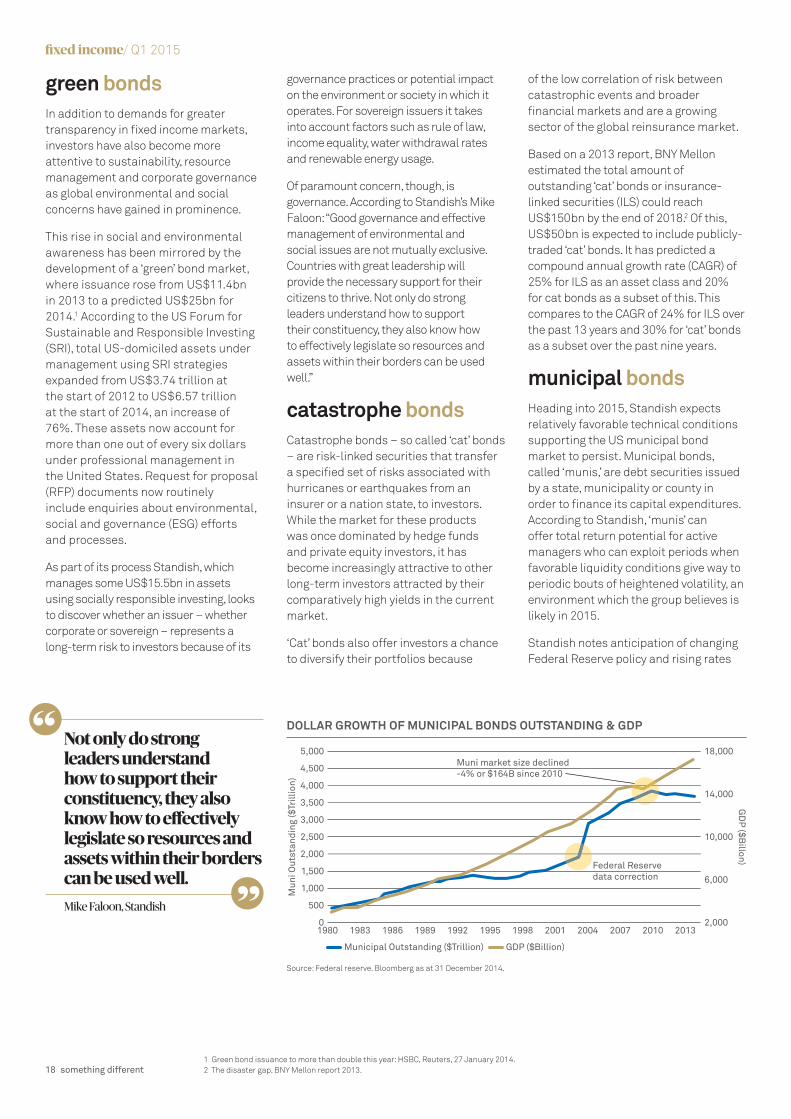
green bondsIn addition to demands for greater transparency in fixed income markets, investors have also become more attentive to sustainability, resource management and corporate governance as global environmental and social concerns have gained in prominence.
This rise in social and environmental awareness has been mirrored by the development of a ‘green’ bond market, where issuance rose from US$11.4bn in 2013 to a predicted US$25bn for 2014.1 According to the US Forum for Sustainable and Responsible Investing (SRI), total US-domiciled assets under management using SRI strategies expanded from US$3.74 trillion at the start of 2012 to US$6.57 trillion at the start of 2014, an increase of 76%. These assets now account for more than one out of every six dollars under professional management in the United States. Request for proposal (RFP) documents now routinely include enquiries about environmental, social and governance (ESG) efforts and processes.
As part of its process Standish, which manages some US$15.5bn in assets using socially responsible investing, looks to discover whether an issuer – whether corporate or sovereign – represents a long-term risk to investors because of its
governance practices or potential impact on the environment or society in which it operates. For sovereign issuers it takes into account factors such as rule of law, income equality, water withdrawal rates and renewable energy usage.
Of paramount concern, though, is governance. According to Standish’s Mike Faloon: “Good governance and effective management of environmental and social issues are not mutually exclusive. Countries with great leadership will provide the necessary support for their citizens to thrive. Not only do strong leaders understand how to support their constituency, they also know how to effectively legislate so resources and assets within their borders can be used well.”
catastrophe bondsCatastrophe bonds – so called ‘cat’ bonds – are risk-linked securities that transfer a specified set of risks associated with hurricanes or earthquakes from an insurer or a nation state, to investors. While the market for these products was once dominated by hedge funds and private equity investors, it has become increasingly attractive to other long-term investors attracted by their comparatively high yields in the current market.
‘Cat’ bonds also offer investors a chance to diversify their portfolios because
of the low correlation of risk between catastrophic events and broader financial markets and are a growing sector of the global reinsurance market.
Based on a 2013 report, BNY Mellon estimated the total amount of outstanding ‘cat’ bonds or insurance-linked securities (ILS) could reach US$150bn by the end of 2018.2 Of this, US$50bn is expected to include publicly-traded ‘cat’ bonds. It has predicted a compound annual growth rate (CAGR) of 25% for ILS as an asset class and 20% for cat bonds as a subset of this. This compares to the CAGR of 24% for ILS over the past 13 years and 30% for ‘cat’ bonds as a subset over the past nine years.
municipal bondsHeading into 2015, Standish expects relatively favorable technical conditions supporting the US municipal bond market to persist. Municipal bonds, called ‘munis,’ are debt securities issued by a state, municipality or county in order to finance its capital expenditures. According to Standish, ‘munis’ can offer total return potential for active managers who can exploit periods when favorable liquidity conditions give way to periodic bouts of heightened volatility, an environment which the group believes is likely in 2015.
Standish notes anticipation of changing Federal Reserve policy and rising rates
Not only do strong leaders understand how to support their constituency, they also know how to e�ectively legislate so resources and assets within their borders can be used well.
“
”Mike Faloon, Standish
1 Green bond issuance to more than double this year: HSBC, Reuters, 27 January 2014.2 The disaster gap. BNY Mellon report 2013.
1980 199819951992198919861983 2001 2004 2007 2010 2013
Mun
i Out
stan
ding
($Tr
illio
n)
GD
P ($B
illon)2,000
1,000
500
2,500
1,500
3,000
3,500
4,000
4,500
5,000 18,000
14,000
Federal Reservedata correction
Muni market size declined -4% or $164B since 2010
10,000
6,000
2,000
Municipal Outstanding ($Trillion) GDP ($Billion)
0
Source: Federal reserve. Bloomberg as at 31 December 2014.
DOLLAR GROWTH OF MUNICIPAL BONDS OUTSTANDING & GDP
�xed income/ Q1 2015
18 something different

could tip the fragile supply/demand balance in the ‘munis’ market. Public investment in infrastructure, health care reform, banking regulation, declining oil prices and socially aware investing are also trends that could impact prices of US municipals.
Managers at the group say: “The fundamental outlook for state and local municipalities is stable to improving, driven largely by the improvement of the US economy. Medicaid expense and growing pension liabilities remain a concern for some highly leveraged issuers and we expect continued funding pressures and budgetary challenges.”
The UK does not really have such a market – yet – but the Financial Times reported in early February the first to be issued by local authorities in the UK is expected in April. The issue is reportedly set to raise £250m-£300m with annual issuance “likely to ramp up quickly to £2bn-£3bn”.3
The fundamental outlook for state and local municipalities is stable to improving, driven largely by the improvement of the US economy.
“”Standish
3 The FT: Cash-strapped local councils to raise billions with new municipal bonds. 2 February.
Eastern promiseWith increasing issuance and exposure to a broad range of geographies, risk profiles and industry sectors, the Asian fixed income universe offers a potentially widening source of diversification.
Despite recent concerns about a Chinese slowdown, Asia remains a powerhouse of international growth. The region accounts for more than one third of global GDP and has the highest per-capita GDP growth rates in the world.
More startling is a demographic story that looks set to supercharge these numbers in the coming decades. The region has 55% of a world population that is expected to grow from a current 7.16 billion to 9.55 billion by 2050. By then, Asia will account for more than 50% of world GDP, according to the Asian Development Bank.
At the same time, major economies – China foremost among them – are pushing towards consumption rather than export-led economic models and this is
expected to drive sustainable growth in the long term, especially as the region’s emerging middle class continues to grow in size and economic clout.
Yet, despite these positives for the region, Standish’s head of credit strategy, Asian fixed income, Sarah Percy-Dove, says Asia remains something of a back-water for fixed income investors, with Asian bonds, excluding Japan, accounting for just 2.7% of the Barclays Global Aggregate Bond Index.
She believes investors neglect the region at their peril and the increasing depth and breadth of Asia’s bond market and the diversification opportunities it offers are key advantages that should not be overlooked.
Since the Asian financial crisis of 1997, Asian bond issuance has increased dramatically, particularly in local currencies. In 1995, the local currency market capitalisation of the Asian bond market – both corporate and government bonds combined – stood at just US$126bn.
specialreport
something different 19
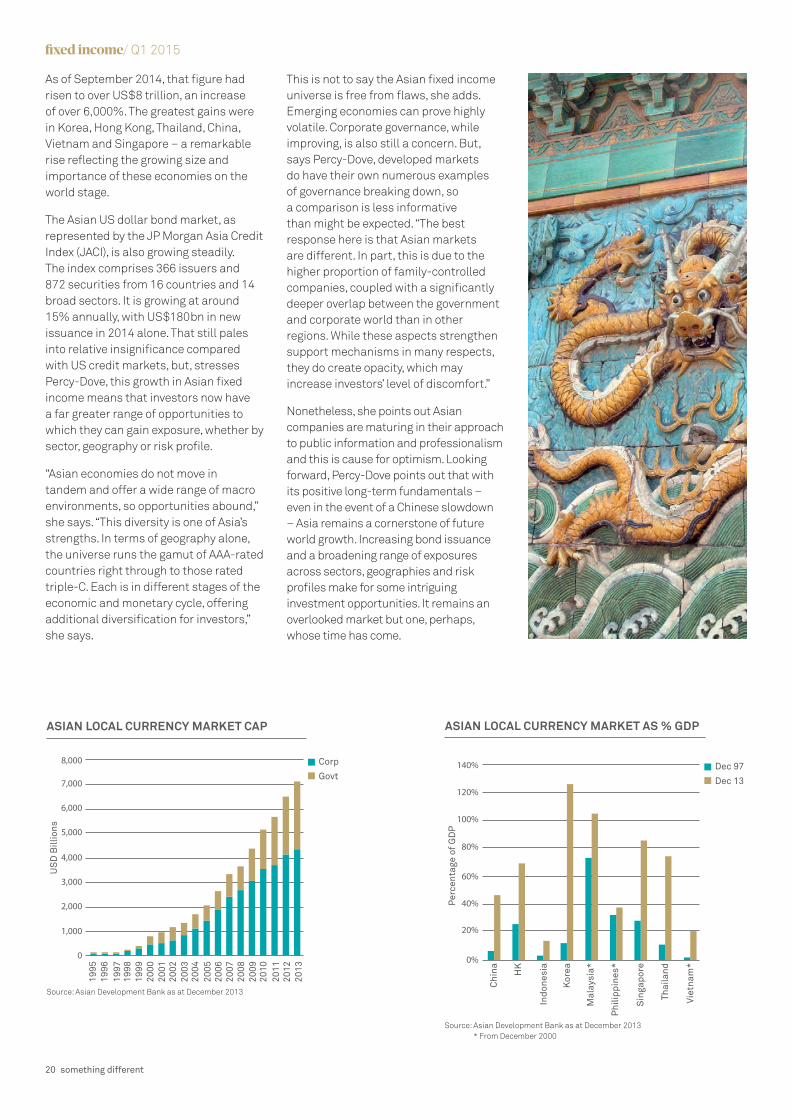
As of September 2014, that figure had risen to over US$8 trillion, an increase of over 6,000%. The greatest gains were in Korea, Hong Kong, Thailand, China, Vietnam and Singapore – a remarkable rise reflecting the growing size and importance of these economies on the world stage.
The Asian US dollar bond market, as represented by the JP Morgan Asia Credit Index (JACI), is also growing steadily. The index comprises 366 issuers and 872 securities from 16 countries and 14 broad sectors. It is growing at around 15% annually, with US$180bn in new issuance in 2014 alone. That still pales into relative insignificance compared with US credit markets, but, stresses Percy-Dove, this growth in Asian fixed income means that investors now have a far greater range of opportunities to which they can gain exposure, whether by sector, geography or risk profile.
“Asian economies do not move in tandem and offer a wide range of macro environments, so opportunities abound,” she says. “This diversity is one of Asia’s strengths. In terms of geography alone, the universe runs the gamut of AAA-rated countries right through to those rated triple-C. Each is in different stages of the economic and monetary cycle, offering additional diversification for investors,” she says.
This is not to say the Asian fixed income universe is free from flaws, she adds. Emerging economies can prove highly volatile. Corporate governance, while improving, is also still a concern. But, says Percy-Dove, developed markets do have their own numerous examples of governance breaking down, so a comparison is less informative than might be expected. “The best response here is that Asian markets are different. In part, this is due to the higher proportion of family-controlled companies, coupled with a significantly deeper overlap between the government and corporate world than in other regions. While these aspects strengthen support mechanisms in many respects, they do create opacity, which may increase investors’ level of discomfort.”
Nonetheless, she points out Asian companies are maturing in their approach to public information and professionalism and this is cause for optimism. Looking forward, Percy-Dove points out that with its positive long-term fundamentals – even in the event of a Chinese slowdown – Asia remains a cornerstone of future world growth. Increasing bond issuance and a broadening range of exposures across sectors, geographies and risk profiles make for some intriguing investment opportunities. It remains an overlooked market but one, perhaps, whose time has come.
US
D B
illio
ns
Corp
Govt
8,000
7,000
6,000
5,000
4,000
3,000
2,000
1,000
0
1995
1996
1997
1998
1999
2000
2001
2002
2003
2004
2005
2006
2007
2008
2009
2010
2011
2012
2013
Per
cent
age
of G
DP
Dec 97
Dec 13
140%
120%
100%
80%
60%
40%
20%
0%
Chi
na HK
Indo
nesi
a
Kor
ea
Mal
aysi
a*
Phi
lippi
nes*
Sin
gapo
re
Thai
land
Viet
nam
*
ASIAN LOCAL CURRENCY MARKET CAP ASIAN LOCAL CURRENCY MARKET AS % GDP
Source: Asian Development Bank as at December 2013
Source: Asian Development Bank as at December 2013 * From December 2000
�xed income/ Q1 2015
20 something different

Located in London, New York and Boston, Alcentra is a global asset management firm focused on sub-investment grade debt capital markets in Europe and the US.
Insight is a London-based asset manager specialising in investment solutions across liability driven investment, absolute return, fixed income, cash management, multi-asset and specialist equity strategies.
Meriten has an adaptable investment approach that combines fundamental and quantitative analysis. The firm is a specialist in European fixed income, equity and balanced mandates.
Mellon Capital Management Corporation offers investment capabilities ranging from indexing to alternatives with the infrastructure and skill to transact in all liquid asset classes and securities.
Newton is renowned for its distinctive approach to global thematic investing. Based in London and with over 30 years’ experience, Newton’s thematic approach is applied consistently across all strategies.
Headquartered in Boston, Massachusetts, Standish is a specialist investment manager dedicated exclusively to active fixed income and credit solutions, with a strong emphasis on fundamental credit research.
about BNY Mellon
BNY Mellon’s multi-boutique model
encompasses the skills of 13 specialised investment managers. Each is solely focused on investment
management and each has its own unique investment
philosophy and process.

Introduction
fixedincome
specialreportQ1 2015
The overall outlook for fixed income
markets in 2015 looks mixed. Ratings
agency Moody’s expects net inflows
to bond funds to remain positive with
limited credit deterioration in bond
fund portfolios, while other analysts
are predicting increased volatility and
widening credit spreads in 2015.1
Much of the future direction of the
market depends on central bank
activity – with divergent policies
taking centre stage, the path of
inflation and interest rates, currency
volatility, liquidity as well as investor
appetite for risk and demand for yield.
After some worrying developments in
Russia, the Ukraine and the Middle
East in 2014 further geopolitical
upheaval also cannot be ruled out.
There are many elements dictating
the sentiment towards as well as
the technicals driving fixed-income
markets this year.
For all this – and despite somewhat
uneven returns across fixed-income
sectors – the asset class continues
to enjoy strong popularity and
remains an investment mainstay
for investors as well as institutions
such as pension funds and insurers
who require steady and predictable
income streams to match underlying
liabilities. In turn, the universe of fixed
income products continues to grow,
presenting even the most specialised
investors with an increasingly diverse
range of investment opportunities.
Here we explore the latest market
trends and conventional and more
esoteric forms of debt instruments
which can help fund managers deliver
returns to clients in what continues to
be a highly challenging and potentially
volatile global fixed-income market.
1 Bond market outlook 2015: Brace for volatility. Charles Schwab. 18.12.14
featuring expert views from BNY Mellon’s specialist investment managers
BNY Mellon Investment Management is an investment management organization, encompassing BNY Mellon’s affiliated investment management firms, wealth management organization and global distribution companies. BNY Mellon is the corporate brand of The Bank of New York Mellon Corporation and may also be used as a generic term to reference the Corporation as a whole or its various subsidiaries generally.
The information in this document is not intended to be investment advice, and it may be deemed a financial promotion in non-U.S. jurisdictions. Accordingly, where this document is used or distributed in any non-U.S. jurisdiction, the information provided is for Professional Clients only. This material is not for onward distribution to, or to be relied upon by Retail Clients.
Any statements and opinions expressed in this document are correct as at the date of publication, are subject to change as economic and market conditions dictate, and do not necessarily represent the views of BNY Mellon or any of its affiliates. The information contained in this document has been provided as a general market commentary only and does not constitute legal, tax, accounting, other professional counsel or investment advice, is not predictive of future performance, and should not be construed as an offer to sell or a solicitation to buy any security or make an offer where otherwise unlawful. The information has been provided without taking into account the investment objective, financial situation or needs of any particular person. BNY Mellon and its affiliates are not responsible for any subsequent investment advice given based on the information supplied. This document is not investment research or a research recommendation for regulatory purposes as it does not constitute substantive research or analysis. To the extent that these materials contain statements about future performance, such statements are forward looking and are subject to a number of risks and uncertainties. Information and opinions presented in this material have been obtained or derived from sources which BNY Mellon believed to be reliable, but BNY Mellon makes no representation to its accuracy and completeness. BNY Mellon accepts no liability for loss arising from use of this material. If nothing is indicated to the contrary, all figures are unaudited.
Any indication of past performance is not a guide to future performance. The value of investments can fall as well as rise, so you may get back less than you originally invested.
This document is not intended for distribution to, or use by, any person or entity in any jurisdiction or country in which such distribution or use would be contrary to local law or regulation. This document may not be distributed or used for the purpose of offers or solicitations in any jurisdiction or in any circumstances in which such offers or solicitations are unlawful or not authorized, or where there would be, by virtue of such distribution, new or additional registration requirements. Persons into whose possession this document comes are required to inform themselves about and to observe any restrictions that apply to the distribution of this document in their jurisdiction. The investment products and services mentioned here are not insured by the FDIC (or any other state or federal agency), are not deposits of or guaranteed by any bank, and may lose value.
This document should not be published in hard copy, electronic form, via the web or in any other medium accessible to the public, unless authorized by BNY Mellon Investment Management.
Issuing entities
This document is approved for Global distribution and is issued in the following jurisdictions by the named local entities or divisions: Europe, Middle East and Africa (excluding Germany, Brazil, Dubai): BNY Mellon Investment Management EMEA Limited, BNY Mellon Centre, 160 Queen Victoria Street, London EC4V 4LA. Registered in England No. 1118580. Authorised and regulated by the Financial Conduct Authority. • Canada: Services offered in Canada by BNY Mellon Asset Management Canada Ltd. • Germany: Meriten Investment Management GmbH which is regulated by the Bundesanstalt für Finanzdienstleistungsaufsicht. • Dubai, United Arab Emirates: Dubai branch of The Bank of New York Mellon, which is regulated by the Dubai Financial Services Authority. This material is intended for Professional Clients only and no other person should act upon it. • Singapore: BNY Mellon Investment Management Singapore Pte. Limited Co. Reg. 201230427E. Regulated by the Monetary Authority of Singapore. • Hong Kong: BNY Mellon Investment Management Hong Kong Limited. Regulated by the Hong Kong Securities and Futures Commission. • Japan: BNY Mellon Asset Management Japan Limited. BNY Mellon Asset Management Japan Limited is a Financial Instruments Business Operator with license no 406 (Kinsho) at the Commissioner of Kanto Local Finance Bureau and is a Member of the Investment Trusts Association, Japan and Japan Securities Investment Advisers Association. • Australia: BNY Mellon Investment Management Australia Ltd (ABN 56 102 482 815, AFS License No. 227865). Authorized and regulated by the Australian Securities & Investments Commission. • United States: BNY Mellon Investment Management. • Canada: Securities are offered through BNY Mellon Asset Management Canada Ltd., registered as a Portfolio Manager and Exempt Market Dealer in all provinces and territories of Canada, and as an Investment Fund Manager and Commodity Trading Manager in Ontario. • Brazil: this document is issued by ARX Investimentos Ltda., Av. Borges de Medeiros, 633, 4th floor, Rio de Janeiro, RJ, Brazil, CEP 22430-041. Authorized and regulated by the Brazilian Securities and Exchange Commission (CVM).
The issuing entities above are BNY Mellon entities ultimately owned by The Bank of New York Mellon Corporation.
BNY Mellon Company information
BNY Mellon Cash Investment Strategies is a division of The Dreyfus Corporation. • Insight Investment Management Limited and Meriten Investment Management GmbH do not offer services in the U.S. This presentation does not constitute an offer to sell, or a solicitation of an offer to purchase, any of the firms’ services or funds to any U.S. investor, or where otherwise unlawful. • BNY Mellon owns 90% of The Boston Company Asset Management, LLC and the remainder is owned by employees of the firm.• The Newton Group (“Newton”) is comprised of the following affiliated companies: Newton Investment Management Limited, Newton Capital Management Limited (NCM Ltd), Newton Capital Management LLC (NCM LLC), Newton International Investment Management Limited and Newton Fund Managers (C.I.) Limited. NCM LLC personnel are supervised persons of NCM Ltd and NCM LLC does not provide investment advice, all of which is conducted by NCM Ltd. Only NCM LLC and NCM Ltd offer services in the U.S.• BNY Mellon owns a 20% interest in Siguler Guff & Company, LP and certain related entities (including Siguler Guff Advisers LLC). GE015-31-05-2015 (6M). Issued as at 12 February 2015. GE058-06-08-2015 (6M). T1589 02/15

本情報提供資料は、BNY メロン・グループ(BNY メロンを最終親会社とする
グループの総称です)の資産運用会社が提供する情報について、BNYメロン・
アセット・マネジメント・ジャパン株式会社が審査の上、掲載したものです。
当資料は情報の提供を目的としたもので、勧誘を目的としたものではありませ
ん。当資料は信頼できると思われる情報に基づき作成されていますが、その正
確性、完全性を保証するものではありません。ここに示された意見などは、作
成時点での見解であり、事前の連絡無しに変更される事もあります。
BNYメロン・アセット・マネジメント・ジャパン株式会社
BNY Mellon Asset Management Japan Limited
金融商品取引業者:関東財務局長(金商)第 406号
〔加入協会〕一般社団法人 投資信託協会
一般社団法人 日本投資顧問業協会