TO BE CONSIDERED AT THE 2014 UBCM CONVENTIONand~Policy/Policy~Papers/2014/UB… · policy paper to...
97
POLICY PAPER TO BE CONSIDERED AT THE 2014 UBCM CONVENTION SEPTEMBER 2014 PLEASE BRING THIS BOOKLET WITH YOU BOOK 01
-
Upload
phamkhuong -
Category
Documents
-
view
216 -
download
0
Transcript of TO BE CONSIDERED AT THE 2014 UBCM CONVENTIONand~Policy/Policy~Papers/2014/UB… · policy paper to...

POLICY PAPERTO BE CONSIDERED AT THE2014 UBCM CONVENTION
SEPTEMBER 2014
PLEASE BRING THIS BOOKLET WITH YOU
BOOK 01
TO: UBCM MEMBERS FROM: Director Rhona Martin, President DATE: August 25, 2014 RE: POLICY PAPER TO BE CONSIDERED AT THE 2014 UBCM
CONVENTION INTRODUCTION TO UBCM POLICY DEVELOPMENT PROCESS UBCM is a policy-driven organization. Policy established at the annual UBCM Convention provides direction to the Executive and Secretariat. Policy is established through two main routes:
• Resolutions on specific issues or concerns submitted by members, considered and endorsed at the annual Convention. Members submitted 159 resolutions this year for consideration.
• Policy papers developed and presented to Convention by the UBCM Executive where a broader comprehensive policy approach may be warranted.
Policy papers may be drafted at a number of levels of specificity:
• Overarching policies (UBCM General Policies) • General themes (e.g. environment, aboriginal treaty negotiations) • Topic specific (e.g. pension reform)
UBCM POLICY IN TOTALITY UBCM policy is comprised of both policy papers and resolutions. Making changes to legislation or provincial policy is a process that can take many years. For this reason, resolutions and policies adopted at Convention but not accepted by government are recorded as standing UBCM policy. This package – Book 1 – contains one paper: Socioeconomic Impact Analysis of BC Ferries Any other papers will be presented in Policy Book 2, which will be distributed on site at Convention. Consideration of policy papers will occur during the policy sessions, Wednesday through Friday.
UBCM: A POLICY-BASED ORGANIZATION
UBCM is directed by the policies established by its members. The two main ways members establish the organization’s policy directions are through: resolutions endorsed at annual Conventions; and policy papers endorsed at annual Conventions. This summary is included to provide some indication of the types and examples of previous policies that have guided UBCM. RESOLUTIONS The past 25 years of UBCM resolutions and government responses are available on the UBCM website (ubcm.ca). Endorsed resolutions become part of ongoing UBCM policy until achieved or superseded. Even if a resolution is not acted on by, for instance, the provincial government after being endorsed at the UBCM Convention, the resolution does not lapse. POLICY PAPERS These are comprehensive policy statements that fit under several categories of specificity. Overarching These policy papers set out broad policy. Examples are:
Statement of General Policies of the UBCM 1996 Local Government and the Constitutions 1993 Toward a Communities & Resource Strategy Paper 1993 Delegation of Environmental Responsibilities 1992
General Themes The following are examples of policy papers in this category:
Financing Local Government: Achieving Fiscal Balance 2008 Environment Action Plan 2007 Proposal for Sharing Resource Revenues with Local Governments 2004 Response to the Discussion Paper on Civil Liability 2002 Forest Policy 2002 Energy Policy Digest 2002 Evaluating the Stability of BC's Assessment Rolls 2000 UBCM Response to Bill 30: Gaming Control Act 2000
Specific Topics Finally, UBCM policy papers on specific topics would include:
Modernizing Building Code Safety Regulations 2012 Packaging & Printed Paper Product Stewardship 2012 Police Services in British Columbia: Affordability & Accountability 2009 New Deal for Cities & Communities – Key Principles & Elements to Guide UBCM 2004
in its Negotiations

TO: UBCM Members FROM: UBCM EXECUTIVE DATE: August 25, 2014 RE: SOCIOECONOMIC IMPACT ANALYSIS OF BC FERRIES
POLICY PAPER
#1
2014 UBCM CONVENTION
1. DECISION REQUEST That the UBCM membership endorse the recommendations in Policy Paper #1 in response to the findings of the attached socioeconomic impact analysis (SEIA) of BC Ferries. 2. INTRODUCTION The purpose of this policy paper is to: • provide the UBCM membership with an overview of the work undertaken to date by the joint AVICC-UBCM Special Committee on BC Ferries; and • seek member endorsement of proposed recommendations arising from the findings of the SEIA, Boatswains to the Bollards: A Socioeconomic Impact Analysis of BC Ferries. The first part of this paper provides the background to the establishment of the Special Committee on BC Ferries. A brief overview of the Special Committee’s work is followed by a summary of the key findings from the SEIA. The final section proposes a course of action in response to the findings of the SEIA and seeks the endorsement of the UBCM membership. 3. BACKGROUND UBCM member interest in BC Ferries has been consistent for over a decade. Members have endorsed a number of resolutions related to ferry fares, operations, service levels, with the majority requesting that ferries be funded, administered and managed as an extension of the provincial highway system (2001-B64; 2002-B77; 2004-B59; 2007-B18; 2010-B20; 2010-B110; 2011-A3; 2012-B6; 2013-B12). Note that resolution 2014-C1 regarding coastal ferries, sponsored by Skeena-Queen Charlotte RD, is printed in the 2014 Resolutions Book and has been referred to this policy paper.
Consequently, when the Minister of Transportation and Infrastructure announced changes to BC Ferries service levels and fares in November 20131, UBCM members, specifically coastal communities, expressed significant concerns. What was most disconcerting for local governments was the fact that the Province planned to commence implementation of these changes as early as April 2014, in the absence of any socioeconomic impact analysis. Both fare increases and service reductions, for minor routes, were implemented this past April. UBCM and AVICC voiced concerns to the Minister about implementing the changes. On February 7, 2014, the two associations agreed to establish a Special Committee on BC Ferries. In the absence of information about the potential socioeconomic impacts of the announced changes, the Special Committee was charged with overseeing the work of a consultant to fill the information gap. The Executive extends its thanks to the members of the Special Committee for their significant contribution to this project; their dedication, expertise and knowledge have been invaluable. Comprised of elected officials from UBCM, AVICC, Ferry Advisory Committee Chairs and Coastal Regional District Chairs, the Special Committee met from February to July 2014, and oversaw two phases of work. The first phase consisted of a survey of local governments, chambers of commerce, ferry advisory committees, and other stakeholders, focusing on ferry service reductions. A majority of some 400 respondents indicated that they expected negative impacts to business and tourism in response to fare increases and service reductions, and expressed concerns that there would be resulting declines in population, employment and property values for coastal communities. While the survey data was qualitatively significant, it did not quantify the socioeconomic impacts of ferry service reduction. Both associations supported the Special Committee extending its term to oversee Phase 2, a socioeconomic impact analysis (SEIA) to assess the relationship between ferry fare increases, passenger ridership levels and socioeconomic outcomes for BC communities. Peter Larose of Larose Research and Strategy was contracted to undertake the research work. Under the direction of the Special Committee and working with a tight timeline, he framed his research to answer the following questions:
1. Have ferry passenger fare increases from 2003-2013 reduced ridership levels? If so, how significant were the impacts and on which communities / routes?
2. What are the main factors that explain passenger volumes in the ferry system? 3. What is the economic impact of BC Ferries and how can we estimate its impact on
not only coastal communities in BC, but throughout the province?
1 “B.C. Charts Course for a Sustainable Coastal Ferry Service” (Nov. 18, 2013), retrieved Aug. 25, 2014, from http://www.newsroom.gov.bc.ca/2013/11/bc-charts-course-for-a-sustainable-coastal-ferry-service.html.
4. Has reduced ridership from 2003-2013 resulted in “downstream” impacts in coastal communities, such as business formations and failures, population migration, property values, consumer prices, and other areas?
5. In light of historical trends in fare and passenger levels, what are the expected future trends?
4. REVIEW AND DISCUSSION OF FINDINGS The SEIA undertaken by the consultant is the first piece of research work, to UBCM’s knowledge, that has attempted to quantify the socioeconomic impact of BC Ferries, not only to coastal communities, but to the province as a whole. The report by Peter Larose, Boatswains to the Bollards: A Socioeconomic Impact Analysis of BC Ferries, is attached for reference. The following provides a summary of his findings related to fares and ridership and overall economic impact of BC Ferries. Ridership • Ferry ridership has declined on nearly every route, with overall ridership
declining by 11%, from 2004/05 to 2013/14; The Northern Routes - most severe passenger declines of approximately 20-40%. The Minor Routes - significant ridership declines of approximately 10- 20%. The Major Routes - lowest level of ridership declines of approximately 5- 8%.
• Ferry ridership declines run counter to the trend of transportation volume increases in most other modes of transport in BC, including vehicle and air transport;
• Ferry passenger volumes are strongly (negatively) correlated with fares, and fare increases contributed to passenger volume declines from 2003-2013;
• The factors that most strongly explain variations in ferry passenger levels are changes in fares, provincial GDP, and provincial population;
• Ferry ridership declines are most strongly associated with declines in business incorporations and housing starts in coastal communities; while population migration and real estate prices in coastal communities have begun a downward trend since 2009 relative to historical trends, and when compared to non-coastal communities;
• Ferry passenger price sensitivity is estimated to be moderate overall, and increasing slightly over time.
Economic Activity
• BC Ferries stimulates a total of $1.8 billion in expenditures in BC each year, which produce $1.5 billion annually in total value-added (GDP) for the BC economy;
• The total organizational GDP of BC Ferries is estimated to be $545 million as of 2013, employing approximately 8,400 people (directly and indirectly);
• BC Ferries supports an estimated $394 million in annual taxation revenues to: federal ($210 million), provincial ($150 million), and municipal ($34.2 million) governments;
• Using a gross cash-on-cash Return on Investment (ROI) formula, for every $1.00 of tax revenues invested in BC Ferries, $8.40 of economic activity was generated – much of which is in communities that are not coastal or ferry dependent.
Foregone Economic Activity
• If fare increases had been limited to the rate of inflation from 2003-2013, it is estimated that passenger volumes would have grown 19% over the period, to 25.7 million in 2013 (compared with an actual ridership of 19.9 million in 2013);
• Foregone economic activity (gross) resulting from ferry traveller declines from 2003-2013 represents a reduction in GDP of $2.3 billion over the ten year period (2003-2013);
• The foregone economic activity (gross) related to historical fare increases from 2003-2013 resulted in an estimated cumulative loss of $609 million in tax revenues, including $325 million to the federal government, $231 million to the provincial government, and $53 million to municipal governments.
The economic impact of BC Ferries on coastal communities and the provincial economy as a whole is substantial. Over 2003-2013, when nearly all modes of transportation in BC reported volume increases (ranging from 5 to 68%), BC Ferries recorded a decrease (-6.8%). Not only has a negative correlation between increasing fares and ridership been established, the quantitative impact of this reduced ridership across both coastal and non-coastal communities is significant. Equally noteworthy is the analysis of foregone tax revenues that could have accrued to all orders of government if fare increases had been capped at the rate of inflation. Based on these findings, and others reported in the SEIA, it appears that ferry fares are having a negative impact on ridership and this decrease in ridership is significantly impacting overall provincial GDP and tax revenues accruing to all orders of government. While some routes are more price sensitive than others, in the longer term, overall ridership will continue to decline as fares
continue to increase. This downward trend does not bode well for coastal ferry sustainability. In its November 2013 announcement the provincial government articulated the goal of “an affordable, efficient and sustainable system” of coastal ferry service. It is difficult to see how the present policy of increasing ferry fares while reducing ferry service will enable the achievement of such a goal. In fact, the SEIA findings suggest that it would be wise to take a time out, or pause, in order to reflect on the policy path that has been chosen for coastal ferry service in BC, and consider whether other courses of action might now be more appropriate. UBCM does not profess to have all the answers, but in light of the SEIA findings it does appear to be time to revisit the existing policy direction and consider other options and strategies. Also in the November 2013 announcement, the Province identified a number of strategies under consideration to create an affordable and sustainable ferry system beyond 2016. Included on the list were: introduction of a gaming pilot project on major routes, looking at standardized and no-frills vessels, liquefied natural gas propulsion, other alternative technologies, a new reservation and point-of-sale system, increased operational efficiencies, passenger-only vessels, and seeking federal infrastructure funding to renew the fleet and terminals. Based on the SEIA, the strategy put forward by the Province to seek additional federal infrastructure funding has merit and could certainly be justified. Figure 18 in the SEIA indicates that while it makes an annual investment of approximately $27 million in BC Ferries, the federal government accrues $210 million annually in tax revenues. In contrast the Province finds itself in a break-even position, contributing approximately $150 million, receiving a similar amount in tax revenues. This SEIA could serve to support the Province’s funding request to the federal government. Since the federal government is a primary beneficiary of a strong and sustainable ferry system, a request to have larger return of those tax revenues invested in the system seems justifiable. The findings of the SEIA confirm that:
• ferry ridership has been impacted negatively by increasing fares; • all orders of government – federal, provincial and local – benefit from
annual tax revenues generated from BC Ferries; • all regions of the province are impacted by BC Ferries; whether through
the economic activity generated in both coastal and non-coastal communities or from the tax revenues that are returned to all regions of the province by the provincial and federal government; and
• new strategies and policy options need to be considered in order to ensure an affordable, efficient and sustainable coastal ferry system well into the future.
5. OPTIONS FOR A WAY FORWARD Learnings from the SEIA suggest that BC needs to move beyond the existing policy options and seek other approaches that will support the development of a sustainable coastal ferry system. In his January 2012 report, BC Ferry Commissioner Gord Macatee announced, “fares have reached the tipping point, imposing a hardship on coastal communities and passengers, and ridership has declined as a result.” Unfortunately the Commissioner’s recommendation to cap fare increases at the rate of inflation was not implemented, and fares on all routes are expected to continue to increase at nearly double the rate of inflation. And as the SEIA has indicated, increasing fares will only continue the downward trend of reduced ridership, resulting in significant economic impact for the province as a whole. The Province has indicated that it is looking at a number of other strategies that will reduce costs and improve the existing ferry system. While UBCM members support provincial efforts to improve the ferry system, there is concern that proposals to date reflect “one-off” approaches to deal with the shortfall in revenue, instead of taking a more comprehensive, forward looking approach that examines the ferry system in a holistic manner. It is for this reason that UBCM members have repeatedly asked the Province to develop a long-term strategy to ensure the sustainability of the coastal ferry system. Recognizing the importance of this ferry system in connecting our province, coastal communities have sought to be part of the discussion that will lead to the development of that long-term strategy. However, before steps can be taken to establish a way forward, better and more information needs to be provided to interested parties so that decisions and plans can be made with the best information possible. While the attached SEIA does not proclaim to have all the answers, it goes a long way to providing such information, and can serve as a first step toward dialogue and further analysis. We would hope that the findings of the SEIA could act as a catalyst for the provincial government to undertake further socioeconomic impact analyses that would support the development of a long-term strategy. Obviously one element of a long-term strategy would be an examination of how the ferry service is funded. The SEIA highlights the fact that fare increases are not sustainable and other options need to be considered. Founded on the SEIA findings, the Province can build a rationale for seeking additional funding from the federal government to support the coastal ferry system, based on the significant tax revenues returned to federal coffers through the positive economic impact of BC Ferries. The request for federal funding assistance could be made even stronger if the Province acknowledged that the coastal ferry system was an extension of the highway system. As such, the coastal ferry system could then be seen as the final transportation link that connects coastal BC with the rest of the highway system that then ties this country together.
The purpose of this policy paper and the attached SEIA is to encourage the Province to take action. The SEIA findings are significant and warrant consideration. If we are to find a way forward, we must recognize the existing course is not viable and more needs to be done. We hope this policy paper and the SEIA findings stimulate discussion, serve as a call to action, and set BC on the path to developing a long-term strategy for affordable, efficient and sustainable coastal ferry service. 6. RECOMMENDATION That the UBCM membership endorse the following actions:
Request that the Province reverse its November 2013 decision, and restore service levels and ferry fares to 2013 levels.
Request that the Province take a ‘pause’ or ‘time out’ to consider the results of this SEIA and commit to undertaking further socioeconomic impact analysis that will build on these findings.
Request that the Province take action to recognize the coastal ferry system
as an extension of the highway system and administer and fund it accordingly.
Request that the Province work cooperatively with coastal communities
and other interested parties on the development and implementation of a long-term strategy for the coastal ferry system, based on solid socioeconomic impact analysis, that will ensure the sustainability of coastal communities and the ferry service.

Prepared for
BOATSWAINS TO THE BOLLARDSA Socioeconomic Impact Analys is of BC Ferr ies
Prepared By LAROSE RESEARCH & STRATEGYAugust 2014

3
ACKNOWLEDGEMENTS
This report would not have been possible without the advice and input of several individuals, including the members of the UBCM / AVICC Special Committee on BC Ferries:
• Mayor Larry Cross, AVICC President, Town of Sidney
• Tony Law, Co-Chair, Ferry Advisory Committee Chairs, Hornby Island Trustee, Islands Trust
• Chair Colin Palmer, Coastal Regional District Chairs, Powell River Regional District
• Chair Jim Abram, Coastal Regional District Chairs, Strathcona Regional District
• Chair Joe Stanhope, Past President AVICC / Coastal Regional District Chairs, Nanaimo Regional District
• Chair Sheila Malcolmson, Coastal Regional District Chairs / Islands Trust
• Chair Art Kaehn, UBCM Community Economic Development Committee Chair, Regional District Fraser Fort George
• Chair Barry Pages, Skeena Queen Charlotte Regional District
• Chair Garry Nohr, Sunshine Coast Regional District
• Councillor Claire Moglove, AVICC Executive, UBCM Third Vice-President, City of Campbell River
• Councillor Barbara Price, Second Vice President, AVICC, Town of Comox
Additional advice and assistance was provided by Brian Hollingshead, Nicole Vaugeois, Ken Peacock, Mike Tretheway, Frank Bourree, and Bruce Carter.
Marie Crawford and Gary Maclsaac of UBCM provided many helpful comments and direction during the development of the report.
Several others provided information and perspectives to assist with this report, but asked to remain anonymous.
Finally, a special thank you to Gordon Clark, whose advice and assistance with the regression analysis and elasticity estimates strengthened the report’s findings considerably.
DISCLAIMER
The results in this report are estimates only, and are developed in order to provide initial assessments and guidance with respect to the impacts of ferry services on British Columbia’s coastal communities. While all efforts were made to ensure the accuracy of information presented herein, the report relies extensively on third party data and analysis, and as such the author cannot be held responsible for any errors or omissions resulting from this third party data.
Peter Larose, Principal Larose Research & Strategy
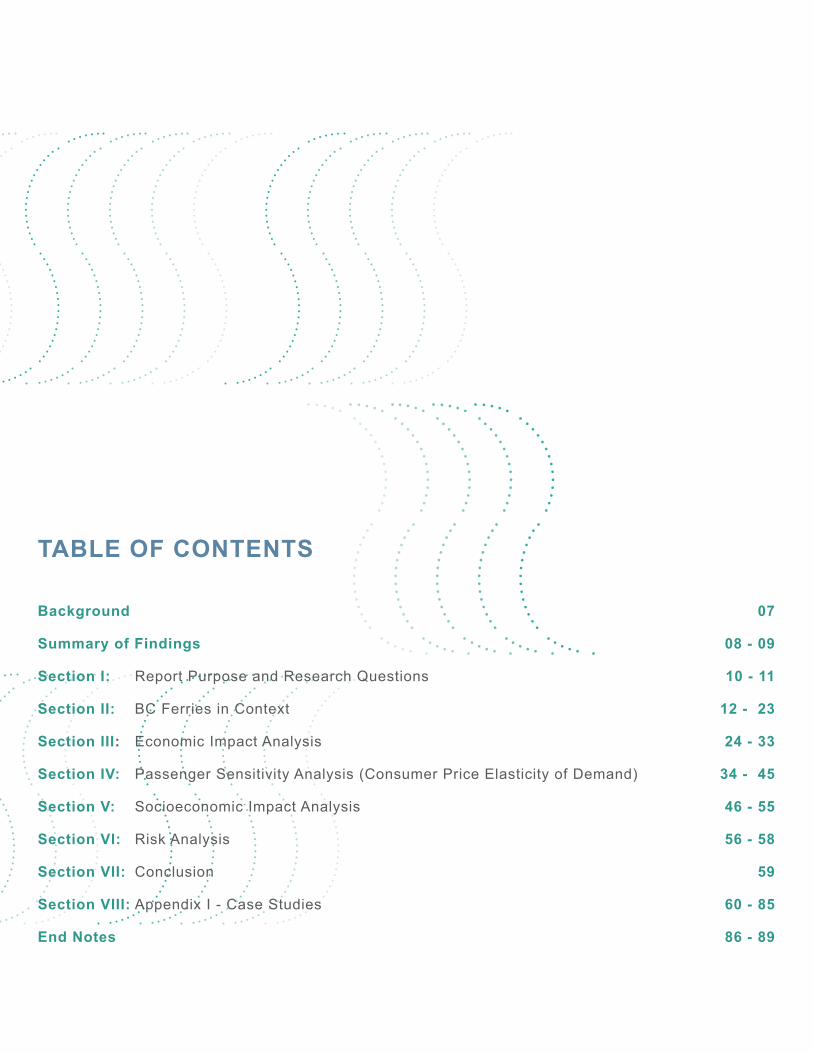
TABLE OF CONTENTS
Background 07
Summary of Findings 08 - 09
Section I: Report Purpose and Research Questions 10 - 11
Section II: BC Ferries in Context 12 - 23
Section III: Economic Impact Analysis 24 - 33
Section IV: Passenger Sensitivity Analysis (Consumer Price Elasticity of Demand) 34 - 45
Section V: Socioeconomic Impact Analysis 46 - 55
Section VI: Risk Analysis 56 - 58
Section VII: Conclusion 59
Section VIII: Appendix I - Case Studies 60 - 85
End Notes 86 - 89

7
BACKGROUND
Since 2003 BC Ferries has embarked on a series of fare increases and, more recently, service level rationalizations aimed at improving the overall financial position of the organization, and containing the level of required public investment in the organization. According to a BC Ministry of Transportation release in March 2003, the revitalized ferry system would result in “[i]mproved service and customer choice… [g]uaranteed service levels and fair rates… and [e]nhanced economic development and job creation.”
Over the next ten years, ferry fares increased at an unprecedented rate across the ferry system, with more pronounced increases on the Minor and Northern Routes, accompanied by ridership declines of varying degrees on nearly all routes. In May 2012 the BC Government amended the Coastal Ferry Act, which removed the requirement for all routes to move toward full cost-recovery, eliminated the prohibition against cross-subsidization of the Minor and Northern routes by the Major routes, and clarified the interests of ferry users with particular reference to the impacts of future fare increases on ferry travellers.
On October 1, 2012 the BC Ferry Commissioner announced the final Price Cap for the remainder of Performance Term 3, covering April 2013 through April 2015, and setting maximum fare increases to 4.1% (2013), 4.0% (2014), and 3.9% (2015). This was based on provincial government funding decisions for BC Ferries over the period, and was soon accompanied by a series of announced service level reductions, including the permanent cancellation of Route 40, which operated between Port Hardy and Bella Coola.
During this period, the provincial government and BC Ferries maintained that fare increases were required for the sustainability of the organization, and that fare increases have had little impact on past ridership levels. At the same time, numerous community representatives and business organizations were expressing concerns about declines in ferry ridership to and from their communities, citing ridership declines as the primary cause of various socioeconomic challenges, including business foreclosures, property value declines, population out-migration, and a variety of other concerns.
In response to these recent changes to the ferry system, and amid growing concerns within coastal communities, the Union of BC Municipalities (UBCM) and the Association of Vancouver Island & Coastal Communities (AVICC) commissioned Larose Research & Strategy to undertake a Socioeconomic Impact Assessment (SIEA) to assess the relationship between ferry fare increases, passenger ridership levels, and socioeconomic outcomes in coastal communities.
This report fills an important information gap. The report urges all stakeholders to send the boatswains (the head of the ship’s deck) to the bollards (mooring posts to which anchors are secured) so that we might all take a collective pause to review the evidence. In a system fraught with such entrenched and polarized opinions, accompanied by such paucity of objective evidence and analysis, a systematic review of the facts is long overdue.
8
BACKGROUND I SUMMARY OF FINDINGS
SUMMARY OF FINDINGS
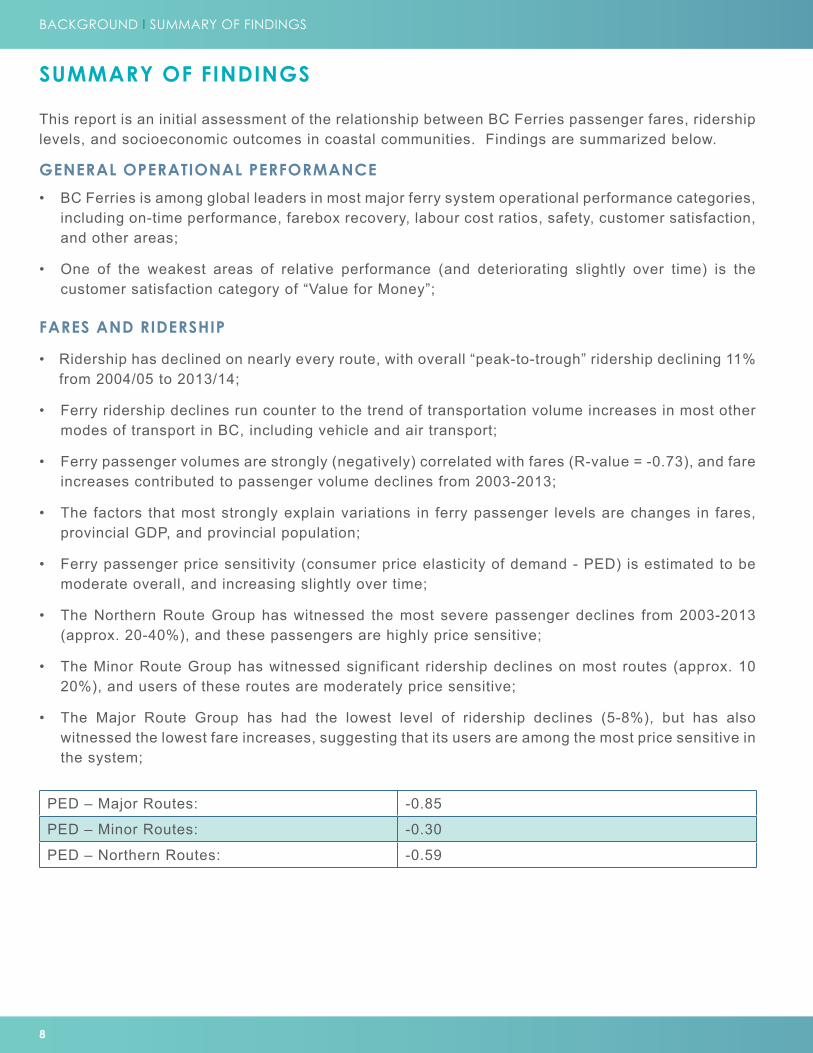
This report is an initial assessment of the relationship between BC Ferries passenger fares, ridership levels, and socioeconomic outcomes in coastal communities. Findings are summarized below.
GENERAL OPERATIONAL PERFORMANCE
• BC Ferries is among global leaders in most major ferry system operational performance categories, including on-time performance, farebox recovery, labour cost ratios, safety, customer satisfaction, and other areas;
• One of the weakest areas of relative performance (and deteriorating slightly over time) is the customer satisfaction category of “Value for Money”;
FARES AND RIDERSHIP
• Ridership has declined on nearly every route, with overall “peak-to-trough” ridership declining 11% from 2004/05 to 2013/14;
• Ferry ridership declines run counter to the trend of transportation volume increases in most other modes of transport in BC, including vehicle and air transport;
• Ferry passenger volumes are strongly (negatively) correlated with fares (R-value = -0.73), and fare increases contributed to passenger volume declines from 2003-2013;
• The factors that most strongly explain variations in ferry passenger levels are changes in fares, provincial GDP, and provincial population;
• Ferry passenger price sensitivity (consumer price elasticity of demand - PED) is estimated to be moderate overall, and increasing slightly over time;
• The Northern Route Group has witnessed the most severe passenger declines from 2003-2013 (approx. 20-40%), and these passengers are highly price sensitive;
• The Minor Route Group has witnessed significant ridership declines on most routes (approx. 10 20%), and users of these routes are moderately price sensitive;
• The Major Route Group has had the lowest level of ridership declines (5-8%), but has also witnessed the lowest fare increases, suggesting that its users are among the most price sensitive in the system;
PED – Major Routes: -0.85
PED – Minor Routes: -0.30
PED – Northern Routes: -0.59
9
ECONOMIC IMPACTS
• BC Ferries stimulates a total of $1.8 billion in expenditures in BC each year, which produce $1.5 billion annually in total value-added (GDP) for the BC economy;
• The total organizational GDP of BC Ferries is estimated to be $545 million as of 2013, employing approximately 8,400 people (directly and indirectly);
• BC Ferries supports an estimated $394 million in annual taxation revenues to federal ($210 M), provincial ($150 M), and municipal ($34.2 M) governments;
• Using a gross cash-on-cash Return on Investment (ROI) formula, for every $1.00 of tax revenues invested in BC Ferries, $8.40 of economic activity was generated – much of which is in communities that are not coastal / ferry dependent;
• If fare increases had been limited to the rate of inflation from 2003-2013, it is estimated that passenger volumes would have grown 19% over the period, to 25.7 million in 2013 (compared with an actual ridership of 19.9 million in 2013);
• Foregone economic activity (gross) resulting from ferry traveller declines from 2003-2013 represents a reduction in GDP of $2.3 billion over the ten year period (2003-2013), including $203 million in Finance, Insurance, and Real Estate, $161 million in manufacturing, and $67 million in construction;
• The foregone economic activity (gross) related to historical fare increases from 2003-2013 resulted in an estimated cumulative loss of $609 million in tax revenues, including $325 million to the federal government, $231 million to the provincial government, and $53.0 million to municipal governments;
• These economic impacts do not include impacts related to industrial input costs (including labour), export costs, commuter costs, and other non-ferry traveller related impacts.
SOCIOECONOMIC OUTCOMES IN COASTAL COMMUNITIES
• Using a combination of historical trend analysis, statistical analysis, and comparative analysis, the impacts of ridership declines were assessed in socioeconomic areas such as population migration, business development, real estate prices & sales, employment, and others;
• Ferry ridership declines are most strongly associated with declines in business incorporations and housing starts in coastal communities;
• In socioeconomic areas characterized as “lagging indicators” the evidence is less conclusive regarding the impact of ridership declines on coastal communities:
o Population migration and real estate prices have begun trending downward since 2009 relative to historical trends and non-coastal communities;
o There appears to be no relationship between reduced ridership levels and coastal community (un)employment, nor with inflation.
10
SECTION I I REPORT PURPOSE AND RESEARCH QUESTIONS
SECTION I: REPORT PURPOSE AND RESEARCH QUESTIONS
REPORT PURPOSE
The purpose of this report is to explore the relationship between historical ferry fare increases and passenger ridership, identifying quantifiable impacts on coastal communities. It is primarily retrospective in nature, but also develops some initial forward-looking projections.
The report is intended to guide coastal community representatives, provincial and federal transportation policymakers, the business community, and other relevant stakeholder groups in understanding the impacts and risks of ferry fare increases on coastal communities, as well as the province as a whole.
RESEARCH QUESTIONS
This report addresses the following questions:
1. Have ferry passenger fare increases from 2003-2013 reduced ridership levels? If so, how significant were the impacts and on which communities / routes?
2. What are the main factors that explain passenger volumes in the ferry system?
3. What is the economic impact of BC Ferries and how can we estimate its impact on not only coastal communities in BC, but throughout the province?
4. Has reduced ridership from 2003-2013 resulted in “downstream” impacts in coastal communities, such as business formations and failures, population migration, property values, consumer prices, and other areas?
5. In light of historical trends in fare and passenger levels, what are the expected future trends?
GUIDING PRINCIPLES
In light of the polarized and politically charged environment in which British Columbia’s coastal ferries operate, this report was developed with the following guiding principles:
• Transparency - project objectives, processes, methodologies, and consultations were made available to stakeholder groups.
• Objectivity - all evidence was assessed and included in the development of this report, regardless of whether it supports the interests and/or positions of any particular stakeholder group.
• Inclusivity - diverse perspectives were sought of stakeholders with specialized knowledge and/or information regarding BC’s coastal ferry system.
• Clarity - to the extent possible, the report is written in non-technical language in order to assist with non-specialist understanding.
11
CAVEATS AND LIMITATIONS
This report covers vast and complex territory. Due to its breadth, it should be considered an initial “scoping analysis” that provides initial insights into trends, impacts, and possible relationships among socioeconomic factors.
The report is guided by existing studies that have used best practices in socioeconomic impact analysis and transportation logistics. Where possible, these prior analyses have been updated with current data. Where primary research and analysis is undertaken, accepted best practices in econometric analysis, socioeconomic impact methodology, and comparative analysis are used.
Trend analysis is challenged by the fact that the reporting of BC Ferries has changed over time, making historical comparisons difficult. In many instances definitions and methodologies have also changed. Base fares began incorporating fuel surcharges from 2008/09 onward, and have also evolved from having multiple and variable rates (peak, off-peak, and shoulder rates) into a single fare for each route/user type. In some cases specific routes have alternated between Route Groups. Ferry fares also vary depending on the type of user, with frequent residential users typically utilizing Experience Cards, which have different fare structures, and for which rates of fare changes have varied from traditional cash-paying customers. All these factors compound the difficulties of this analysis, and are noted throughout.
This initial analysis should be validated using information held by government agencies and BC Ferries. Economic impact analyses using secondary sources should be updated with the BC Stats Input-Output Model. The regression analysis and elasticity modeling could be further expanded to include alternate methodologies.
Nonetheless, despite these limitations and challenges, the report’s findings are considered reliable, and it is expected that any further review and analysis will support the findings.
12
SECTION II I BC FERRIES IN CONTEXT
SECTION II: BC FERRIES in CONTEXT
This section provides an overview of BC Ferries’ structure, ridership and fare history, operational performance, and comparisons with other ferry operators around the world.
BC FERRIES – STRUCTURE AND GOVERNANCE
The BC Ferry Authority (BC Ferries) was established in 2003 by an Act of the Legislative Assembly of British Columbia - The Coastal Ferry Act. It is a non-share capital corporation, meaning it is a quasi-independent authority that is technically “owned” by the Government of British Columbia, its sole shareholder, but whose management is guided as an independent corporation, with an elected and appointed Board of Directors, as well as a Chief Executive Officer.
THE GOVERNANCE OF BC FERRIES INVOLVES THREE PRIMARY ENTITIES
1. The Government of British Columbia, through the Ministry of Transportation, which provides annual funding to the organization (the “Service Fee”), which is one of the main determinants of passenger fares. The government also sets high-level policy for the organization’s structure and governance.
2. The BC Ferry Commissioner, whose role is to provide guidance to BC Ferries on the fares it can charge to customers, as well as the frequency and capacity of sailings, based on funding provided by the Government of BC, among other expense and revenue factors. The Ferry Commissioner establishes a maximum price on fares (the fare “price cap”) which is established for Performance Terms (PTs) of four years in duration. The price cap has been historically set for three “route groups” – the Major Routes, Minor Routes, and Northern Routes.
3. BC Ferries, which develops organizational policies and procedures and manages the day-to-day operations of the organization.
FARE HISTORY AND RIDERSHIP
Since 2003, BC Ferries has, under the direction of the provincial government and guided by the Ferry Commissioner, embarked on a strategy to recover an increasing proportion of its operational expenses, primarily by increasing fares charged to customers, and reducing service capacity (number of sailings) on routes and specific sailings that have relatively lower utilization rates (percentage of capacity filled by passengers).
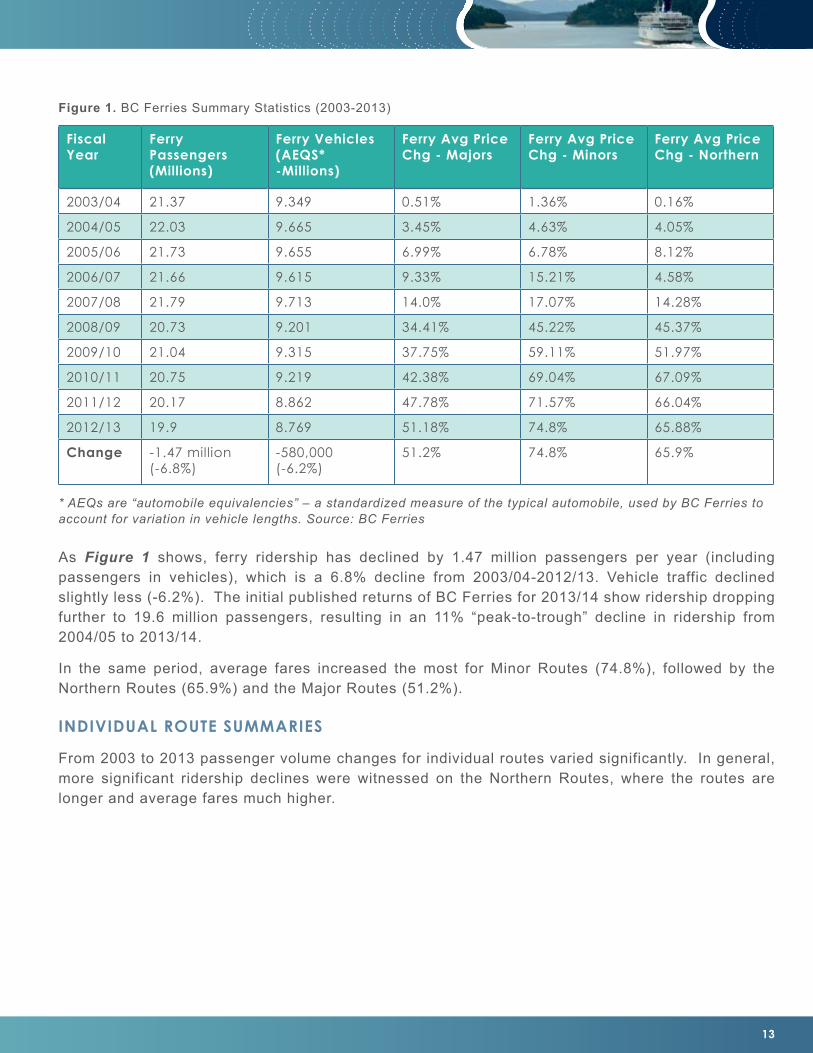
Figure 1, (right) summarizes passenger volumes and price changes for each route group from 2003-2013.
13
Fiscal Year
Ferry Passengers (Millions)
Ferry Vehicles (AEQS* -Millions)
Ferry Avg Price Chg - Majors
Ferry Avg Price Chg - Minors
Ferry Avg Price Chg - Northern
2003/04 21.37 9.349 0.51% 1.36% 0.16%
2004/05 22.03 9.665 3.45% 4.63% 4.05%
2005/06 21.73 9.655 6.99% 6.78% 8.12%
2006/07 21.66 9.615 9.33% 15.21% 4.58%
2007/08 21.79 9.713 14.0% 17.07% 14.28%
2008/09 20.73 9.201 34.41% 45.22% 45.37%
2009/10 21.04 9.315 37.75% 59.11% 51.97%
2010/11 20.75 9.219 42.38% 69.04% 67.09%
2011/12 20.17 8.862 47.78% 71.57% 66.04%
2012/13 19.9 8.769 51.18% 74.8% 65.88%
Change -1.47 million (-6.8%)
-580,000 (-6.2%)
51.2% 74.8% 65.9%
* AEQs are “automobile equivalencies” – a standardized measure of the typical automobile, used by BC Ferries to account for variation in vehicle lengths. Source: BC Ferries
Figure 1. BC Ferries Summary Statistics (2003-2013)
As Figure 1 shows, ferry ridership has declined by 1.47 million passengers per year (including passengers in vehicles), which is a 6.8% decline from 2003/04-2012/13. Vehicle traffic declined slightly less (-6.2%). The initial published returns of BC Ferries for 2013/14 show ridership dropping further to 19.6 million passengers, resulting in an 11% “peak-to-trough” decline in ridership from 2004/05 to 2013/14.
In the same period, average fares increased the most for Minor Routes (74.8%), followed by the Northern Routes (65.9%) and the Major Routes (51.2%).
INDIVIDUAL ROUTE SUMMARIES
From 2003 to 2013 passenger volume changes for individual routes varied significantly. In general, more significant ridership declines were witnessed on the Northern Routes, where the routes are longer and average fares much higher.

14
SECTION II I BC FERRIES IN CONTEXT
Route Name Route # Pass Volumes (2003/04)
Pass Volumes (2012/13)
Change
Inside Passage (Port Hardy to Prince Rupert) 10 61,178 38,108 -37.7%
Skidegate Inlet (Graham Isl to Moresby Isl) 26 126,016 87,441 -30.6%
Discovery Coast (Port Hardy to Bella Coola) 40 9,321 6,949 -25.4%
Hecate Strait (Pr Rupert to Haida Gwaii via Skidegate) 11 46,462 35,791 -23.0%
Lambert Channel (Denman Isl to Hornby Isl) 22 260,901 208,253 -20.2%
Broughton Strait (Port McNeill to Alert Bay) 25 265,996 218,417 -17.9%
Discovery Passage (Campbell River to Quadra Isl) 23 926,054 785,170 -15.2%
Northumberland Channel (Nanaimo to Gabriola Isl) 19 907,645 771,783 -15.0%
Baynes Sound (Buckley Bay to Denman Isl) 21 544,105 463,752 -14.8%
Sutil Channel (Quadra Isl to Cortes Isl) 24 112,970 96,918 -14.2%
Active Pass (Tsawwassen to Salt Spring/South Gulf Isl) 9 501,502 434,839 -13.3%
Malaspina Strait (Powell River to Texada Isl) 18 193,330 170,604 -11.8%
Swanson Channel (Swartz Bay to Southern Gulf Isl) 5 505,797 459,393 -9.2%
Satellite Channel (Swartz Bay to Salt Spring Isl) 4 670,916 619,939 -7.6%
S Georgia Strait (Tsawwassen to Swartz Bay) 1 5,968,303 5,589,971 -6.3%
Jervis Inlet (Sunshine Coast to Powell River) 7 353,591 331,679 -6.2%
Georgia Strait Central (Nanaimo to Horseshoe Bay) 2 3,514,507 3,310,473 -5.8%
Queen Charlotte Channel (Horseshoe Bay to Bowen Isl) 8 1,198,828 1,132,383 -5.5%
N Georgia Strait (Powell River to Comox) 17 372,008 352,820 -5.2%
North Stuart Channel (Chemainus to Thetis/Kuper Isl) 20 258,647 247,556 -4.3%
South Stuart Channel (Crofton to Saltspring Isl) 6 496,454 478,733 -3.6%
Howe Sound (Horseshoe Bay to Langdale) 3 2,555,463 2,501,900 -2.1%
Mid-Island Express (Tsawwassen to Nanaimo) 30 1,341,917 1,374,878 2.5%
Thornbrough Channel (Langdale to Gambier/Keats Isl) 13 43,970 46,964 6.8%
Saanich Inlet (Brentwood Bay to Mill Bay) 12 121,549 154,384 *27.0%
Total: 21,367,530 19,919,098 -6.8%
* Route 12 ridership was down significantly in 2003/04 due to the main vessel being out of service for a prolonged period. Ridership was back up to 154,000 in 2004/05, making the trend essentially flat from 2003-2013. Source: BC Ferries
Figure 2. Passenger Volume Changes – All Routes
Overall, passenger volumes on Northern Routes (#10, #26, #40, #11) decreased the most. Most of the Minor Routes witnessed volume declines in the range of 10-20%, whereas the major routes(#1, #2, #3) typically lost 2% to 6% of their passenger traffic, with the exception of Route #30 which saw a slight (2.5%) increase over the period.
Two smaller routes – one a passenger-only service (#13) and the other a short commuter route (#12)
15
– witnessed passenger volume increases during the study period.
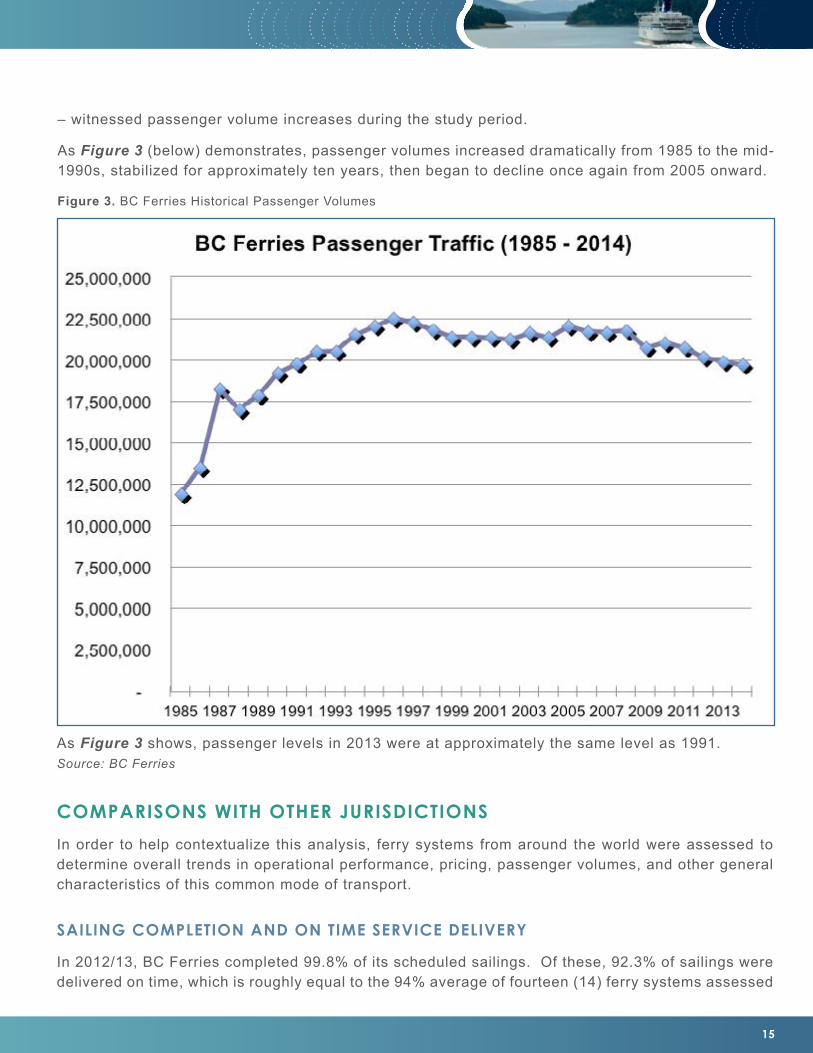
As Figure 3 (below) demonstrates, passenger volumes increased dramatically from 1985 to the mid-1990s, stabilized for approximately ten years, then began to decline once again from 2005 onward.
As Figure 3 shows, passenger levels in 2013 were at approximately the same level as 1991. Source: BC Ferries
COMPARISONS WITH OTHER JURISDICTIONS
In order to help contextualize this analysis, ferry systems from around the world were assessed to determine overall trends in operational performance, pricing, passenger volumes, and other general characteristics of this common mode of transport.
SAILING COMPLETION AND ON TIME SERVICE DELIVERY
In 2012/13, BC Ferries completed 99.8% of its scheduled sailings. Of these, 92.3% of sailings were delivered on time, which is roughly equal to the 94% average of fourteen (14) ferry systems assessed
Figure 3. BC Ferries Historical Passenger Volumes

16
SECTION II I BC FERRIES IN CONTEXT
in a 2010 study conducted by Washington State Department of Transportation. i In light of the fact that BC Ferries operates in the second most northern (and volatile) climate of the fourteen regions that were assessed, and operates a number of relatively lengthy routes, this is a notable achievement.
LABOUR COSTS
BC Ferries’ labour costs in fiscal 2012/13 were $263 million, in an operating budget of $525 million, which equates to 50.1%. ii This is just slightly higher than the average of fourteen (14) ferry operators included in the Washington State survey of operational performance, which averaged 45.1%. Most of these entities operate in less heavily regulated jurisdictions, with fewer lengthy routes, and with passenger ridership concentrated on a smaller number of major routes. A number of these were also in less developed countries, with lower labour standards and relative income levels.
Despite the very public criticism leveled at BC Ferries by various organizations for its seemingly excessive compensation levels, the organization’s labour costs remain competitive with other ferry service providers around the world.
CUSTOMER SATISFACTION
In 2012/13 BC Ferries had an overall customer satisfaction level of 88%, up from 82% in 2003/04. Its average rating was 4.2 / 5.0 in 2012/13, an increase over its score of 4.0/5.0 in 2003/04.
In the service sector, satisfaction levels of 88% and 4.2/5.0 are very high, with most travel-related industries typically scoring in the 70-80% range, with the exception of airlines which trend between 65-70%. iii
The notable exception in BC Ferries’ high customer satisfaction levels is in the category of “value for money,” which is the lowest satisfaction area, scoring only 2.98/5.0 in FY 2012/13, which is down from 3.3/10 in FY 2003/04.
FAREBOX RECOVERY – BC FERRIES
A common measure of operational performance by transportation providers – typically publicly funded agencies – is “farebox recovery” – which measures the proportion of operating expenses that are “recovered” through user fees. In the case of BC Ferries, this would be the total amount of revenues collected from fares relative to its operating expenses.
Compared with other global ferry systems and other modes of transit, BC Ferries has operated with high levels of farebox recovery, whether using only fares or fares combined with ancillary revenues (e.g., cafeteria and retail sales).
17
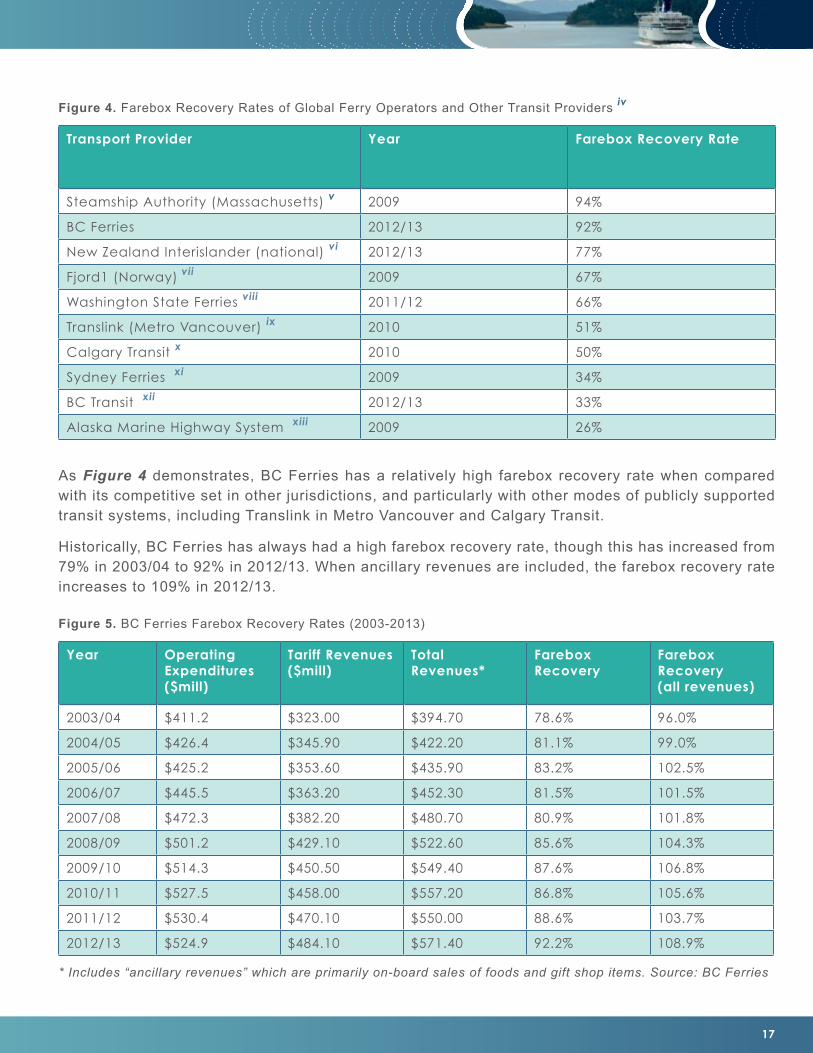
As Figure 4 demonstrates, BC Ferries has a relatively high farebox recovery rate when compared with its competitive set in other jurisdictions, and particularly with other modes of publicly supported transit systems, including Translink in Metro Vancouver and Calgary Transit.
Historically, BC Ferries has always had a high farebox recovery rate, though this has increased from 79% in 2003/04 to 92% in 2012/13. When ancillary revenues are included, the farebox recovery rate increases to 109% in 2012/13.
Transport Provider Year Farebox Recovery Rate
Steamship Authority (Massachusetts) v 2009 94%
BC Ferries 2012/13 92%
New Zealand Interislander (national) vi 2012/13 77%
Fjord1 (Norway) vii 2009 67%
Washington State Ferries viii 2011/12 66%
Translink (Metro Vancouver) ix 2010 51%
Calgary Transit x 2010 50%
Sydney Ferries xi 2009 34%
BC Transit xii 2012/13 33%
Alaska Marine Highway System xiii 2009 26%
Figure 4. Farebox Recovery Rates of Global Ferry Operators and Other Transit Providers iv
Year Operating Expenditures ($mill)
Tariff Revenues ($mill)
Total Revenues*
Farebox Recovery
Farebox Recovery (all revenues)
2003/04 $411.2 $323.00 $394.70 78.6% 96.0%
2004/05 $426.4 $345.90 $422.20 81.1% 99.0%
2005/06 $425.2 $353.60 $435.90 83.2% 102.5%
2006/07 $445.5 $363.20 $452.30 81.5% 101.5%
2007/08 $472.3 $382.20 $480.70 80.9% 101.8%
2008/09 $501.2 $429.10 $522.60 85.6% 104.3%
2009/10 $514.3 $450.50 $549.40 87.6% 106.8%
2010/11 $527.5 $458.00 $557.20 86.8% 105.6%
2011/12 $530.4 $470.10 $550.00 88.6% 103.7%
2012/13 $524.9 $484.10 $571.40 92.2% 108.9%
Figure 5. BC Ferries Farebox Recovery Rates (2003-2013)
* Includes “ancillary revenues” which are primarily on-board sales of foods and gift shop items. Source: BC Ferries
18
SECTION II I BC FERRIES IN CONTEXT
It should be noted that farebox recovery is a complicated performance measure, in that higher farebox recovery may also mean lower levels of public investment, and lost opportunities for stimulating traffic through lower fares. This report will not comment on this matter of public policy but merely presents the data.
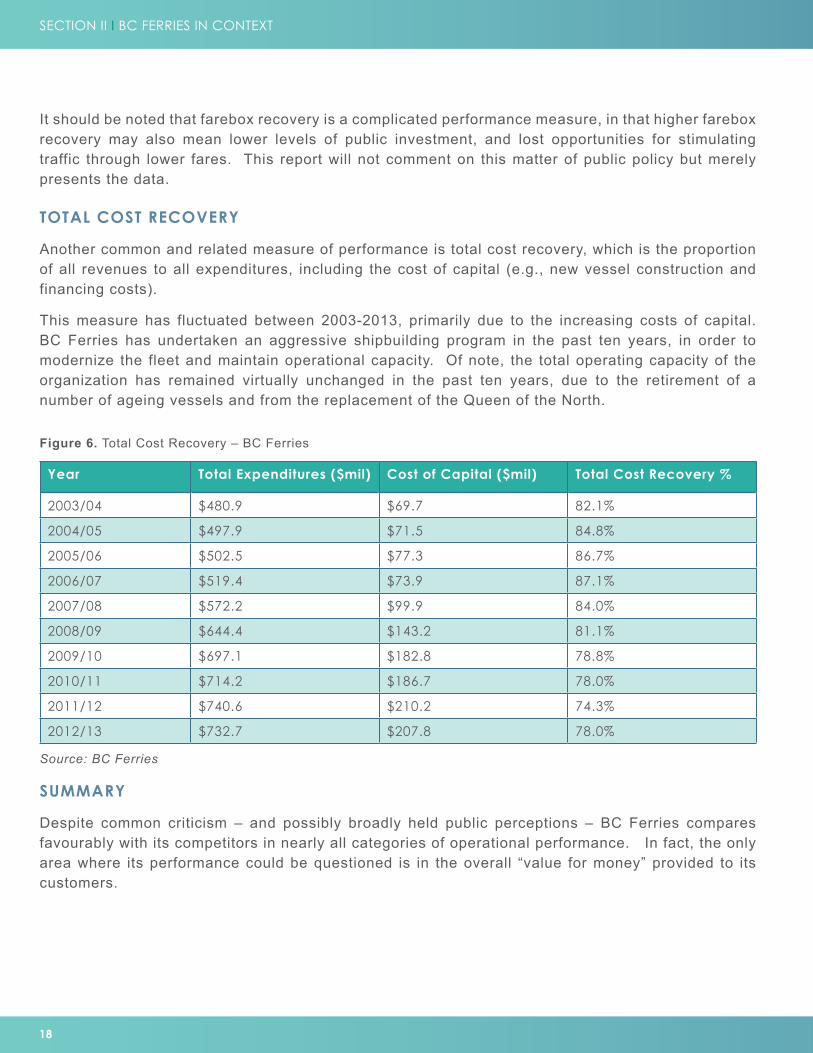
TOTAL COST RECOVERY
Another common and related measure of performance is total cost recovery, which is the proportion of all revenues to all expenditures, including the cost of capital (e.g., new vessel construction and financing costs).
This measure has fluctuated between 2003-2013, primarily due to the increasing costs of capital. BC Ferries has undertaken an aggressive shipbuilding program in the past ten years, in order to modernize the fleet and maintain operational capacity. Of note, the total operating capacity of the organization has remained virtually unchanged in the past ten years, due to the retirement of a number of ageing vessels and from the replacement of the Queen of the North.
Year Total Expenditures ($mil) Cost of Capital ($mil) Total Cost Recovery %
2003/04 $480.9 $69.7 82.1%
2004/05 $497.9 $71.5 84.8%
2005/06 $502.5 $77.3 86.7%
2006/07 $519.4 $73.9 87.1%
2007/08 $572.2 $99.9 84.0%
2008/09 $644.4 $143.2 81.1%
2009/10 $697.1 $182.8 78.8%
2010/11 $714.2 $186.7 78.0%
2011/12 $740.6 $210.2 74.3%
2012/13 $732.7 $207.8 78.0%
Figure 6. Total Cost Recovery – BC Ferries
SUMMARY
Despite common criticism – and possibly broadly held public perceptions – BC Ferries compares favourably with its competitors in nearly all categories of operational performance. In fact, the only area where its performance could be questioned is in the overall “value for money” provided to its customers.
Source: BC Ferries
19
DETAILED COMPARISON – WASHINGTON STATE FERRIES
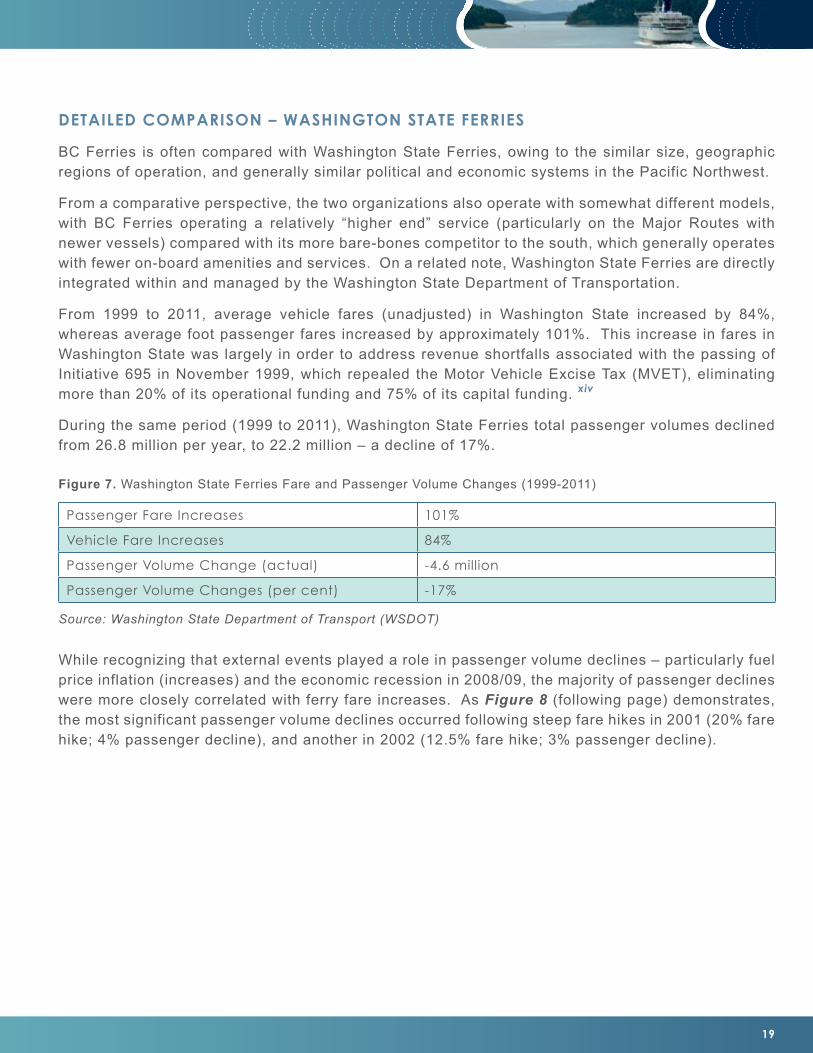
BC Ferries is often compared with Washington State Ferries, owing to the similar size, geographic regions of operation, and generally similar political and economic systems in the Pacific Northwest.
From a comparative perspective, the two organizations also operate with somewhat different models, with BC Ferries operating a relatively “higher end” service (particularly on the Major Routes with newer vessels) compared with its more bare-bones competitor to the south, which generally operates with fewer on-board amenities and services. On a related note, Washington State Ferries are directly integrated within and managed by the Washington State Department of Transportation.
From 1999 to 2011, average vehicle fares (unadjusted) in Washington State increased by 84%, whereas average foot passenger fares increased by approximately 101%. This increase in fares in Washington State was largely in order to address revenue shortfalls associated with the passing of Initiative 695 in November 1999, which repealed the Motor Vehicle Excise Tax (MVET), eliminating more than 20% of its operational funding and 75% of its capital funding. xiv
During the same period (1999 to 2011), Washington State Ferries total passenger volumes declined from 26.8 million per year, to 22.2 million – a decline of 17%.
Passenger Fare Increases 101%
Vehicle Fare Increases 84%
Passenger Volume Change (actual) -4.6 million
Passenger Volume Changes (per cent) -17%
Figure 7. Washington State Ferries Fare and Passenger Volume Changes (1999-2011)
While recognizing that external events played a role in passenger volume declines – particularly fuel price inflation (increases) and the economic recession in 2008/09, the majority of passenger declines were more closely correlated with ferry fare increases. As Figure 8 (following page) demonstrates, the most significant passenger volume declines occurred following steep fare hikes in 2001 (20% fare hike; 4% passenger decline), and another in 2002 (12.5% fare hike; 3% passenger decline).
Source: Washington State Department of Transport (WSDOT)

20
SECTION II I BC FERRIES IN CONTEXT
Figure 8. Washington State Ferries Ridership History (Source: Washington State Ferries) xv
Figure 8 (above) demonstrates a clear relationship between ferry fares and ridership changes in Washington State. During the recession of 2008 onward, ridership remained relatively flat. The 2007 decline in ridership was due primarily to the retirement of the Steel Electric Line.
21
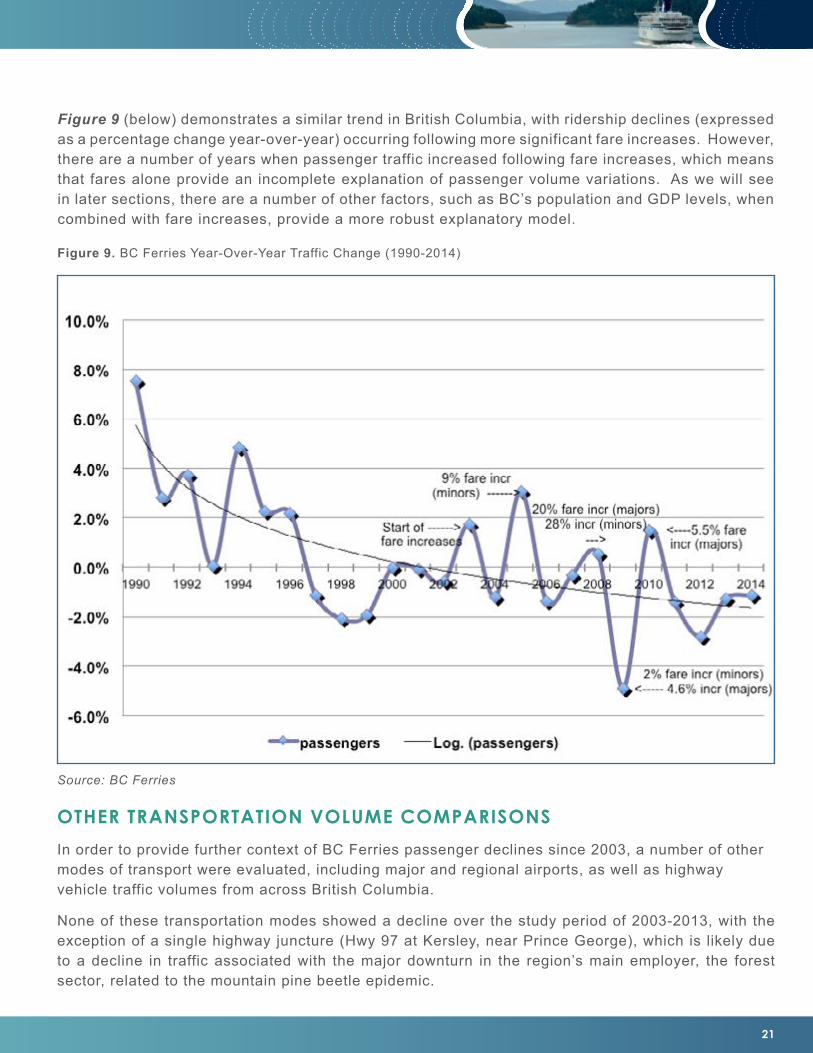
Figure 9 (below) demonstrates a similar trend in British Columbia, with ridership declines (expressed as a percentage change year-over-year) occurring following more significant fare increases. However, there are a number of years when passenger traffic increased following fare increases, which means that fares alone provide an incomplete explanation of passenger volume variations. As we will see in later sections, there are a number of other factors, such as BC’s population and GDP levels, when combined with fare increases, provide a more robust explanatory model.
Figure 9. BC Ferries Year-Over-Year Traffic Change (1990-2014)
OTHER TRANSPORTATION VOLUME COMPARISONS
In order to provide further context of BC Ferries passenger declines since 2003, a number of other modes of transport were evaluated, including major and regional airports, as well as highway vehicle traffic volumes from across British Columbia.
None of these transportation modes showed a decline over the study period of 2003-2013, with the exception of a single highway juncture (Hwy 97 at Kersley, near Prince George), which is likely due to a decline in traffic associated with the major downturn in the region’s main employer, the forest sector, related to the mountain pine beetle epidemic.
Source: BC Ferries

22
SECTION II I BC FERRIES IN CONTEXT
The only transportation system that did experience passenger volume declines in the period was the BC inland ferries, which are operated by the BC Ministry of Transportation and which do not have any passenger nor vehicle fares. From 2004/05 ridership on inland ferries declined from 2.7 million passengers to 2.2 million passengers in 2011/12. xvii
However, there have been notable changes to the inland ferry network during this period, including the decommissioning of the Albion Ferry in July 2009 after construction of the Golden Ears Bridge that year. In addition, a number of alternate highway routes were improved throughout the province, particularly in the Kootenay-Rockies region, which may have altered transportation patterns.
Additionally, from both a common sense perspective and a transportation logistics perspective, it is not logical that inland ferry passengers would be decoupled from highway traffic patterns in the same region(s), unless one wishes to state that there is a widespread “ferry aversion” factor dissuading ferry travel. To some extent this is possible, if prior inland ferry users have had poor experiences (delayed sailings, long waits), and have chosen more reliable and predictable highway travel where possible. But even this speaks more to the impacts of inland ferry capacity constraints as opposed to a prima facie case of ferry use declining unrelated to factors such as user prices and relative convenience.
Route / Transport Mode Change (2003-2013)
YVR (Vancouver Int’l Airport) +23%
YYJ (Victoria Int’l Airport) +32%
YQQ (Comox Valley Airport) +68%
Hwy 1 (Metro Vancouver) +8.7%
Hwy 97N (Williams Lake) +5.0%
Hwy 97N (Kersley) -11.0% (2005-2013)
Hwy 1 (Revelstoke) +14.3%
Hwy 99 (Squamish) +16.0% (2005-2013)
Hwy 3 (Crowsnest Pass) +32.4%
BC population +11.1%
BC Ferries -6.8%
Figure 10. Transport Mode Volume Comparators xvi
23
SUMMARY
In the past 10 years, BC’s coastal ferry system is virtually the only major transportation mode that has witnessed passenger volume declines.
Notably, all these modes of transportation were subject to the same external forces as BC Ferries, including fuel price inflation and the global financial crisis. However, in British Columbia the ferry system was the only one transport mode to experience passenger volume declines over the period.
Washington State Ferries are often held up as an example for BC to emulate, owing to its relatively lower passenger fares and, often, its lower compensation levels for executives. However, both entities have displayed similar trends in passenger volume increases during a more stable fare regime (1985-1999 in Washington State; 1990-2003 for BC) followed by ridership declines that coincided with significant fare increases. And in key measures of competitiveness, including farebox recovery and overall labour cost impacts, BC Ferries compares favourably with Washington State and other global ferry operators.

24
SECTION III I ECONOMIC IMPACT ANALYSIS
SECTION III: ECONOMIC IMPACT ANALYSIS
This section examines the overall value of BC Ferries to the British Columbia economy, using different but complementary methods.
ESTIMATING ECONOMIC IMPACTS OF BC FERRIES
Estimating the economic (and social) impact of BC Ferries is a challenging task due to the sheer magnitude and complexity of the coastal ferry system and its interlinkages with various communities, economic sectors, and user groups. Some goods that are transported by BC Ferries are less price sensitive because they can be substituted for alternate goods; others cannot. Some producers using BC Ferries can absorb fare increases in their costs, while others must pass along these cost increases onto their customers, whether wholesalers or final retail sellers. Consumers of some types of goods are more and less sensitive, depending on whether suitable locally produced goods can be purchased, and based on the very nature of the goods. The system is characterized by widespread heterogeneity in its pricing and consumption patterns, making economic impact analysis difficult.
Adding to this is the complexity of a coastal economy that has various external factors (e.g., global recession) that are not easily separated from the impacts of rising fares on ferry ridership.
Nonetheless, economists and statisticians have devised numerous methods that can be used to develop estimates of the organization’s total value and impact on coastal communities, and to separate these impacts from broader external factors in the economy.
THE VALUE OF BC FERRIES - ECONOMIC IMPACT ANALYSIS
There are a number of ways to describe the “value” of an entity – the total benefits derived from its activity – whether it is an individual business, an economic system, or a region.
The most common is through “economic impact analysis,” which measures or estimates the change in economic activity – typically sales revenue, employment, GDP, or other economic measures – of a change in policy, a project, a specific organization, business, or a region. This study employs two complementary but not mutually exclusive methodologies to estimate the Economic Impact of BC Ferries.
Estimating the Economic Impact of BC Ferries – Two Methods
1. The total economic output of the corporate entity, itself, based on operational revenues, spending by supplier industries, and recirculated BC Ferries staff wages and salaries in the economy.
2. The revenues of businesses “downstream” of BC Ferries and related impacts in the local economy from this stimulated business activity.
METHOD 1: ORGANIZATIONAL ECONOMIC IMPACT ANALYSIS
The economic impact of BC Ferries as a corporation comprises the following components: • Direct economic impact – the total businesses expenditures (the dollar value of all goods and
services produced by BC Ferries)
25
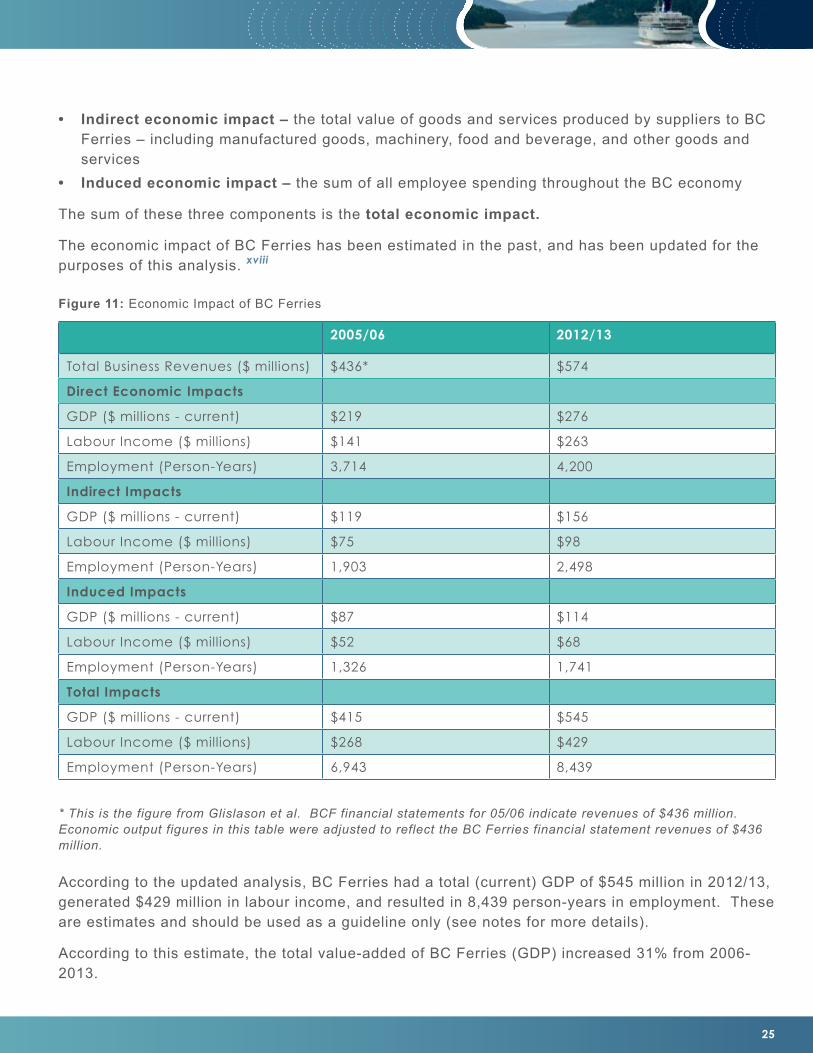
• Indirect economic impact – the total value of goods and services produced by suppliers to BC Ferries – including manufactured goods, machinery, food and beverage, and other goods and services
• Induced economic impact – the sum of all employee spending throughout the BC economy
The sum of these three components is the total economic impact.
The economic impact of BC Ferries has been estimated in the past, and has been updated for the purposes of this analysis. xviii
2005/06 2012/13
Total Business Revenues ($ millions) $436* $574
Direct Economic Impacts
GDP ($ millions - current) $219 $276
Labour Income ($ millions) $141 $263
Employment (Person-Years) 3,714 4,200
Indirect Impacts
GDP ($ millions - current) $119 $156
Labour Income ($ millions) $75 $98
Employment (Person-Years) 1,903 2,498
Induced Impacts
GDP ($ millions - current) $87 $114
Labour Income ($ millions) $52 $68
Employment (Person-Years) 1,326 1,741
Total Impacts
GDP ($ millions - current) $415 $545
Labour Income ($ millions) $268 $429
Employment (Person-Years) 6,943 8,439
Figure 11: Economic Impact of BC Ferries
* This is the figure from Glislason et al. BCF financial statements for 05/06 indicate revenues of $436 million. Economic output figures in this table were adjusted to reflect the BC Ferries financial statement revenues of $436 million.
According to the updated analysis, BC Ferries had a total (current) GDP of $545 million in 2012/13, generated $429 million in labour income, and resulted in 8,439 person-years in employment. These are estimates and should be used as a guideline only (see notes for more details).
According to this estimate, the total value-added of BC Ferries (GDP) increased 31% from 2006-2013.
26
SECTION III I ECONOMIC IMPACT ANALYSIS
METHOD 2: “DOWNSTREAM” BUSINESS STIMULATION
Another method of estimating the impact of BC Ferries is by examining the total business revenues that are dependent on ferry travellers.
Whereas the “indirect” economic impacts identified in Figure 11 (previous page) identifies the economic impacts of businesses that supply products and services to BC Ferries (e.g., engine machinery), the analysis below estimates the economic impacts on businesses that serve the travellers using BC Ferries.
MODELLING PASSENGER TRAFFIC IMPACTS
One method of estimating economic impacts of BC Ferries is by assessing the travel and expenditure patterns of ferry users and estimating the impacts that these expenditures have in communities and regions that serve ferry travellers.
There is a wealth of current and reliable information on travel patterns of both residents and non-residents of British Columbia, through the Travel Survey of Residents of Canada (TSRC) xix and the International Travel Survey (ITS). xx These detail the specific activities that resident and non-resident travellers undertake while travelling in B.C. and specific regions of BC, the average travel party size, visitor origins, demographics, and other useful information for modeling social and economic impacts.
When these individuals and groups travel, they utilize services directly, such as transportation services (including but not limited to BC Ferries), recreation and entertainment services (e.g., skiing, movie theatres, sporting events), as well as accommodation services (hotels, motels, campgrounds, lodges), food and beverage services (restaurants, pubs/bars/lounges), and they purchase retail items.
In turn, these above-named “industry groups” require and purchase items to support their business operations. The most significant beneficiary (supplier) industries to the travel-related industries include those in Finance, Insurance, and Real Estate (the so-called “FIRE” industries), construction, manufacturing, energy/utilities, other transportation and warehousing.
Finally, individuals employed in the travel-related industries (transportation, recreation/entertainment, accommodation, etc.) also earn wages and salaries that are recirculated throughout local and regional economies. These expenditures are classified as “induced” economic impacts. It should be noted here that the expenditures of individuals in the “indirect” industries mentioned above (Finance, Construction, etc.) are NOT included in these economic impact calculations, as this would result in possible double-counting of impacts.
ECONOMIC IMPACTS OF BC FERRIES TRAVELLERS
In order to estimate traveller expenditures on BC Ferries, we must first categorize them as either “tourists” (for the purposes of the analysis) or “non-tourists.”
In the past, BC Ferries has estimated that 22% of its passengers are “tourists” xxi – however, this excludes any coastal community residents, including those of the Lower Mainland. This exclusion
27
fundamentally and significantly under-estimates the number of tourists, as travel by BC residents constitutes approximately 63% of visitors to Vancouver Island and more than half of these are from the Lower Mainland.
COMBINING BC STATS ESTIMATES WITH TRAVEL SURVEY DATA
B.C. Stats estimates that 92% of ferry users are classified as “tourists” because they travel at least 70 km for pleasure, business, or other purposes and outside of their normal sphere of interaction. xxiii The remaining eight per-cent (8%) of ferry travellers are estimated by BC Stats (and verified by BC Ferries) to be commuters.
The combined data from the two main travel surveys (ITS and TSRC) referenced earlier also separate travellers into “overnight” and “same day” categories, with 55% of visitors to Vancouver Island being overnight travellers, and the other 45% being same-day travellers. xxiv This helps with enhancing the accuracy of our estimates.
ECONOMIC IMPACT CALCULATIONS – BC STATS METHODOLOGY
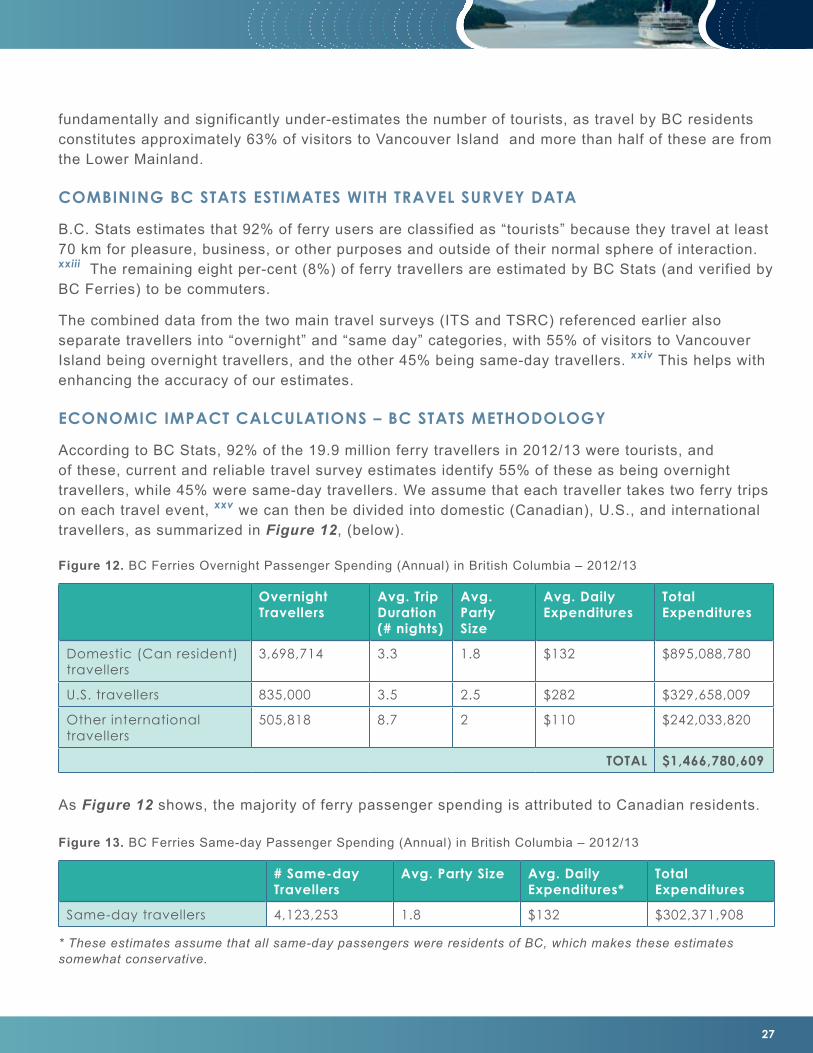
According to BC Stats, 92% of the 19.9 million ferry travellers in 2012/13 were tourists, and of these, current and reliable travel survey estimates identify 55% of these as being overnight travellers, while 45% were same-day travellers. We assume that each traveller takes two ferry trips on each travel event, xxv we can then be divided into domestic (Canadian), U.S., and international travellers, as summarized in Figure 12, (below).
Overnight Travellers
Avg. Trip Duration (# nights)
Avg. Party Size
Avg. Daily Expenditures
Total Expenditures
Domestic (Can resident) travellers
3,698,714 3.3 1.8 $132 $895,088,780
U.S. travellers 835,000 3.5 2.5 $282 $329,658,009
Other international travellers
505,818 8.7 2 $110 $242,033,820
TOTAL $1,466,780,609
Figure 12. BC Ferries Overnight Passenger Spending (Annual) in British Columbia – 2012/13
# Same-day Travellers
Avg. Party Size Avg. Daily Expenditures*
Total Expenditures
Same-day travellers 4,123,253 1.8 $132 $302,371,908
Figure 13. BC Ferries Same-day Passenger Spending (Annual) in British Columbia – 2012/13
* These estimates assume that all same-day passengers were residents of BC, which makes these estimates somewhat conservative.
As Figure 12 shows, the majority of ferry passenger spending is attributed to Canadian residents.
28
SECTION III I ECONOMIC IMPACT ANALYSIS
AN ALTERNATIVE APPROACH
In developing this report, a number of community representatives and specialists in transportation economics suggested that an alternative way to measure the total ferry traveller spending in the economy would be to segment travellers by evaluating usage of the “Experience Card” and considering these travellers to be residents (non-tourists) with the non-Experience Card travellers being “tourists” for whom the travel surveys (ITS and TSRC) can be applied.
Using non-Experience Card users as a proxy for “tourists” we get a similar, but slightly lower estimate of BC Ferry passenger expenditures in the BC economy compared with using the BC Stats traveller proportion estimates and detailed travel survey expenditure data. This method also does not capture the expenditures of the approximately 50% of users who are not Experience Card users. xxvi
However, these estimates are within the same order of magnitude, and this cross-referencing of estimates helps to validate the initial estimate ($1.8 billion) of total direct ferry traveller expenditures in the BC economy.
ESTIMATING OTHER SECTORAL IMPACTS OF BC FERRIES
A number of industries supply products and services directly to those businesses that would directly benefit from traveller spending in the economy. These can be estimated using input-output tables that model ferry traveller spending in the economy. xxvii
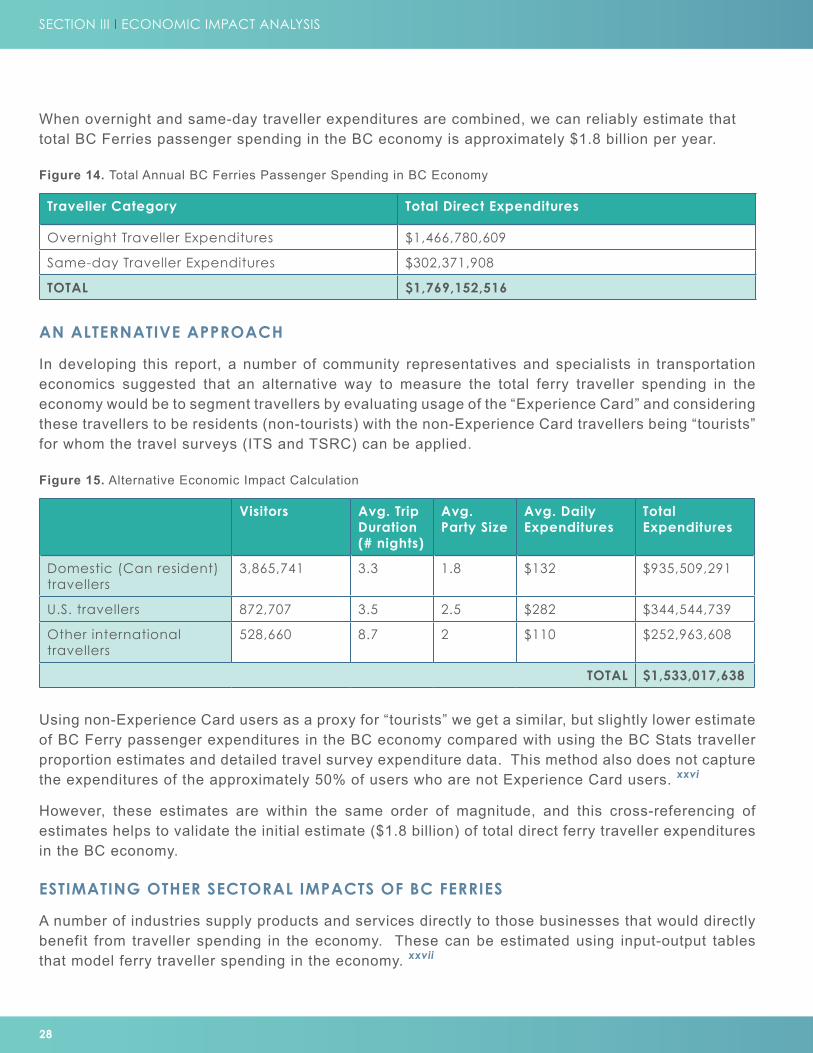
Traveller Category Total Direct Expenditures
Overnight Traveller Expenditures $1,466,780,609
Same-day Traveller Expenditures $302,371,908
TOTAL $1,769,152,516
Figure 14. Total Annual BC Ferries Passenger Spending in BC Economy
Visitors Avg. Trip Duration (# nights)
Avg. Party Size
Avg. Daily Expenditures
Total Expenditures
Domestic (Can resident) travellers
3,865,741 3.3 1.8 $132 $935,509,291
U.S. travellers 872,707 3.5 2.5 $282 $344,544,739
Other international travellers
528,660 8.7 2 $110 $252,963,608
TOTAL $1,533,017,638
Figure 15. Alternative Economic Impact Calculation
When overnight and same-day traveller expenditures are combined, we can reliably estimate that total BC Ferries passenger spending in the BC economy is approximately $1.8 billion per year.
29
The U.S. Transportation Research Board stresses the “importance of community involvement in all steps of the impact assessment process” in order to identify the range of relevant impacts (benefits, costs, and risks) of undertaking a specific project, altering existing cost structures, or changing travel preferences. xxviii
For this reason, the industries that are the focus of this section are those for which communities expressed the greatest concern, through a survey of more than 400 community representatives as part of the initial stages of this initiative.
The main industries for which community representatives expressed the greatest concern were as follows:
• Tourism • Construction• Real estate • Transportation• Manufacturing• Retail
ECONOMIC IMPACTS OF BC FERRIES – INDUSTRY IMPACTS
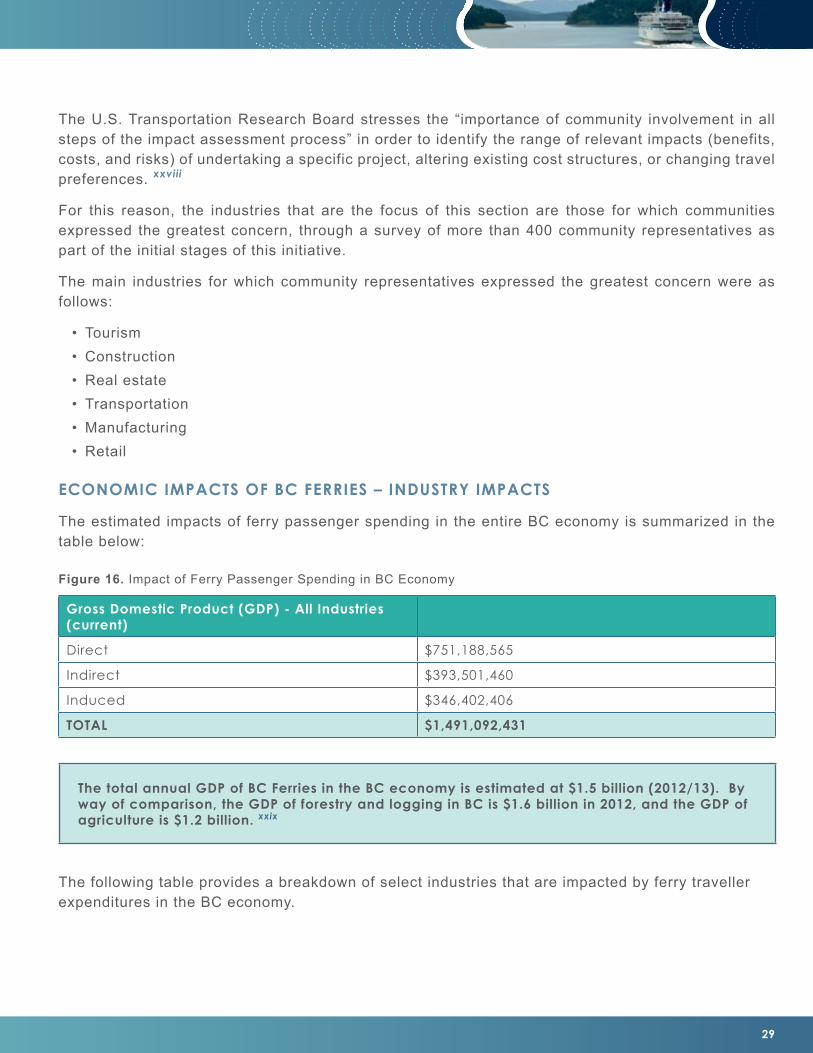
The estimated impacts of ferry passenger spending in the entire BC economy is summarized in the table below:
Gross Domestic Product (GDP) - All Industries (current)
Direct $751,188,565
Indirect $393,501,460
Induced $346,402,406
TOTAL $1,491,092,431
Figure 16. Impact of Ferry Passenger Spending in BC Economy
The total annual GDP of BC Ferries in the BC economy is estimated at $1.5 billion (2012/13). By way of comparison, the GDP of forestry and logging in BC is $1.6 billion in 2012, and the GDP of agriculture is $1.2 billion. xxix
The following table provides a breakdown of select industries that are impacted by ferry traveller expenditures in the BC economy.
30
SECTION III I ECONOMIC IMPACT ANALYSIS
Industry Sub-totals Direct GDP Indirect & Induced GDP
Total GDP
Arts, Entertainment and Recreation $63,735,554 $8,508,849 $72,244,403
Accommodation Services $218,836,129 $3,051,473 $221,887,602
Food & Beverage Services $112,165,678 $12,586,654 $124,752,332
Other Transportation and Warehousing $97,780,842 $37,005,762 $134,786,604
Information and Cultural Industries $4,442,187 $37,703,214 $42,145,401
Other Finance, Insurance, and Real Estate (FIRE) $0 $130,986,188 $130,986,188
Retail Trade $75,500,250 $53,042,077 $128,542,327
Construction $0 $43,882,392 $43,882,392
Manufacturing $0 $99,886,821 $99,886,821
Subtotal (select industries above) $572,460,640 $426,653,430 $999,114,070
TOTAL (all industries) $751,188,565 $739,903,866 $1,491,092,431
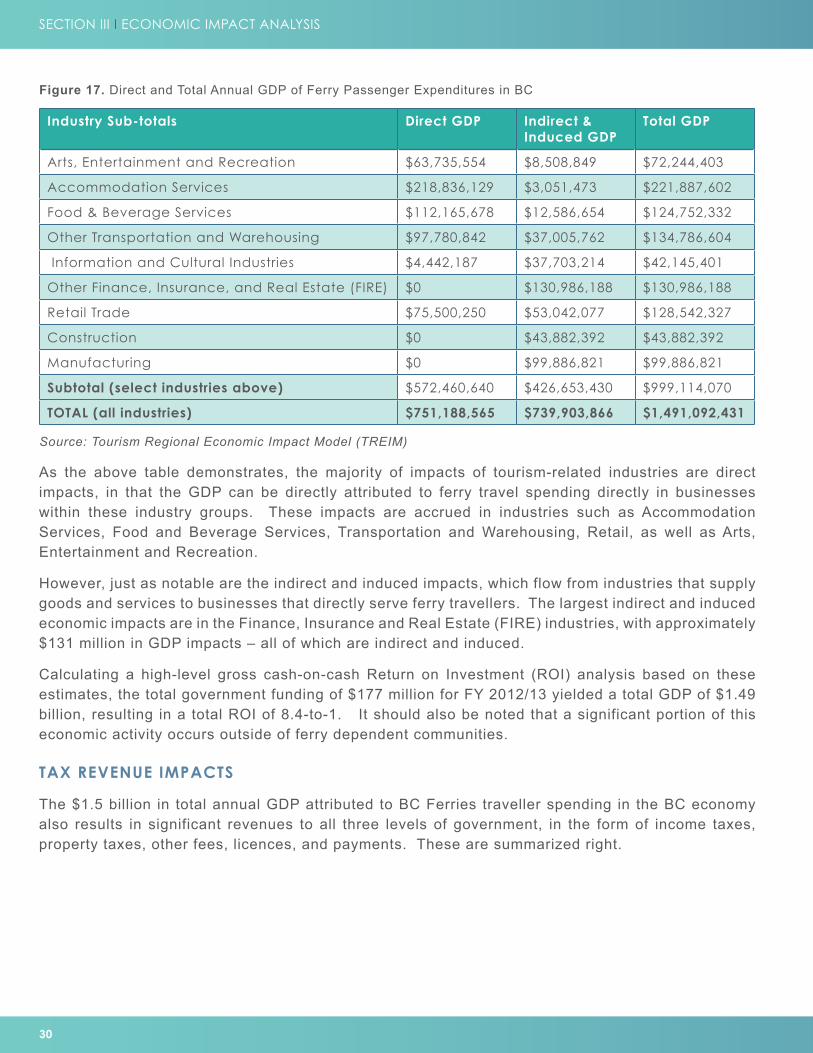
Figure 17. Direct and Total Annual GDP of Ferry Passenger Expenditures in BC
As the above table demonstrates, the majority of impacts of tourism-related industries are direct impacts, in that the GDP can be directly attributed to ferry travel spending directly in businesses within these industry groups. These impacts are accrued in industries such as Accommodation Services, Food and Beverage Services, Transportation and Warehousing, Retail, as well as Arts, Entertainment and Recreation.
However, just as notable are the indirect and induced impacts, which flow from industries that supply goods and services to businesses that directly serve ferry travellers. The largest indirect and induced economic impacts are in the Finance, Insurance and Real Estate (FIRE) industries, with approximately $131 million in GDP impacts – all of which are indirect and induced.
Calculating a high-level gross cash-on-cash Return on Investment (ROI) analysis based on these estimates, the total government funding of $177 million for FY 2012/13 yielded a total GDP of $1.49 billion, resulting in a total ROI of 8.4-to-1. It should also be noted that a significant portion of this economic activity occurs outside of ferry dependent communities.
TAX REVENUE IMPACTS
The $1.5 billion in total annual GDP attributed to BC Ferries traveller spending in the BC economy also results in significant revenues to all three levels of government, in the form of income taxes, property taxes, other fees, licences, and payments. These are summarized right.
Source: Tourism Regional Economic Impact Model (TREIM)
31
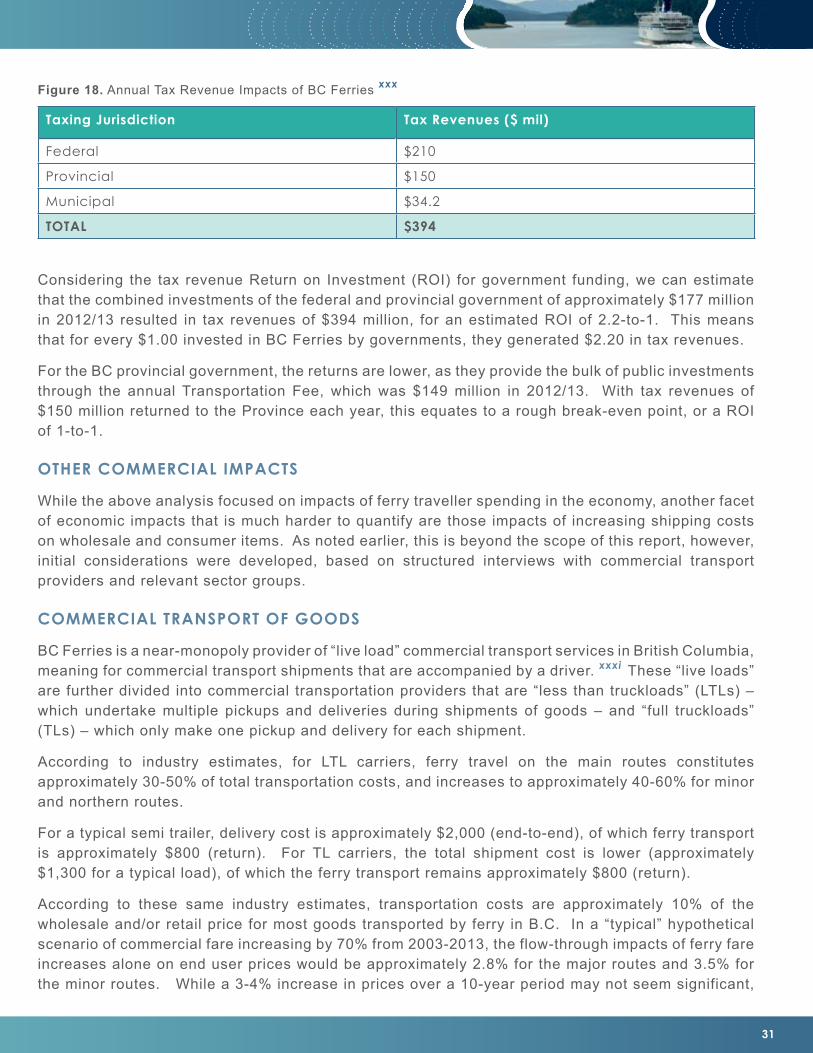
Considering the tax revenue Return on Investment (ROI) for government funding, we can estimate that the combined investments of the federal and provincial government of approximately $177 million in 2012/13 resulted in tax revenues of $394 million, for an estimated ROI of 2.2-to-1. This means that for every $1.00 invested in BC Ferries by governments, they generated $2.20 in tax revenues.
For the BC provincial government, the returns are lower, as they provide the bulk of public investments through the annual Transportation Fee, which was $149 million in 2012/13. With tax revenues of $150 million returned to the Province each year, this equates to a rough break-even point, or a ROI of 1-to-1.
OTHER COMMERCIAL IMPACTS
While the above analysis focused on impacts of ferry traveller spending in the economy, another facet of economic impacts that is much harder to quantify are those impacts of increasing shipping costs on wholesale and consumer items. As noted earlier, this is beyond the scope of this report, however, initial considerations were developed, based on structured interviews with commercial transport providers and relevant sector groups.
COMMERCIAL TRANSPORT OF GOODS
BC Ferries is a near-monopoly provider of “live load” commercial transport services in British Columbia, meaning for commercial transport shipments that are accompanied by a driver. xxxi These “live loads” are further divided into commercial transportation providers that are “less than truckloads” (LTLs) – which undertake multiple pickups and deliveries during shipments of goods – and “full truckloads” (TLs) – which only make one pickup and delivery for each shipment.
According to industry estimates, for LTL carriers, ferry travel on the main routes constitutes approximately 30-50% of total transportation costs, and increases to approximately 40-60% for minor and northern routes.
For a typical semi trailer, delivery cost is approximately $2,000 (end-to-end), of which ferry transport is approximately $800 (return). For TL carriers, the total shipment cost is lower (approximately $1,300 for a typical load), of which the ferry transport remains approximately $800 (return).
According to these same industry estimates, transportation costs are approximately 10% of the wholesale and/or retail price for most goods transported by ferry in B.C. In a “typical” hypothetical scenario of commercial fare increasing by 70% from 2003-2013, the flow-through impacts of ferry fare increases alone on end user prices would be approximately 2.8% for the major routes and 3.5% for the minor routes. While a 3-4% increase in prices over a 10-year period may not seem significant,
Taxing Jurisdiction Tax Revenues ($ mil)
Federal $210
Provincial $150
Municipal $34.2
TOTAL $394
Figure 18. Annual Tax Revenue Impacts of BC Ferries xxx

32
SECTION III I ECONOMIC IMPACT ANALYSIS
this increase would place downward pressure on production and consumption of a similar magnitude (3-4%) just due to ferry fare increases.
CONSUMER PRICES
Economic theory would suggest that as transportation costs increase the prices of consumer goods across a broad spectrum would increase. With an increase in transportation costs associated with ferry travel, this should be reflected in the data.
However, it does not, at least initially, appear to be the case.
BC Stats tracks and reports consumer prices in Vancouver and Victoria, and from 2002 to April 2014, consumer prices in Vancouver increased by 19.4% whereas in Victoria they increased at a slightly slower rate, by16.4%.xxxii
MINOR ROUTES AND MAJOR ROUTES
In consultation with trucking sector representatives, it was noted several times that for commercial goods, ferry fare increases on the major routes doubly impact the cost of goods on minor routes, as in most cases goods must first use a major route prior to being delivered in communities served by minor routes. For commercial entities domiciled in communities served by minor routes, these goods typically will also require shipment over a major route in order to access markets. Therefore it should be noted that fare increases on the major routes also impact the prices of imported goods as well as the costs of exported goods. For the tourism sector, major routes are often a precursor to a Gulf Islands visit, so increasing major route fares to support minor route fares does not assist in reducing overall cost burden of travellers to minor routes.
SUMMARY
BC Ferries has a large impact on the economy not just of ferry dependent communities, but of the entire province and beyond. In fact, B.C. residents outside of coastal communities are significant beneficiaries of both economic activity and tax revenues generated by users of the ferry system.
The economic impact of BC Ferries as an organization has grown to an estimated $545 million in 2012/13, and employing over 8,400 workers (full-year equivalents), which is approximately double the organization’s direct labour complement of 4,200 workers.
However, the organization’s total economic impact as a facilitator of transportation of people (in particular) dwarfs its organizational economic impact. BC Ferries generates over $1.5 billion annually in total (current) GDP – nearly three-times more than is generated just by BC Ferries as an organization. The total taxes generated by this economic activity is over $394 million each year, based an annual public investment of just under $180 million, yielding a system-wide ROI of approximately 2.2-to-1.

33
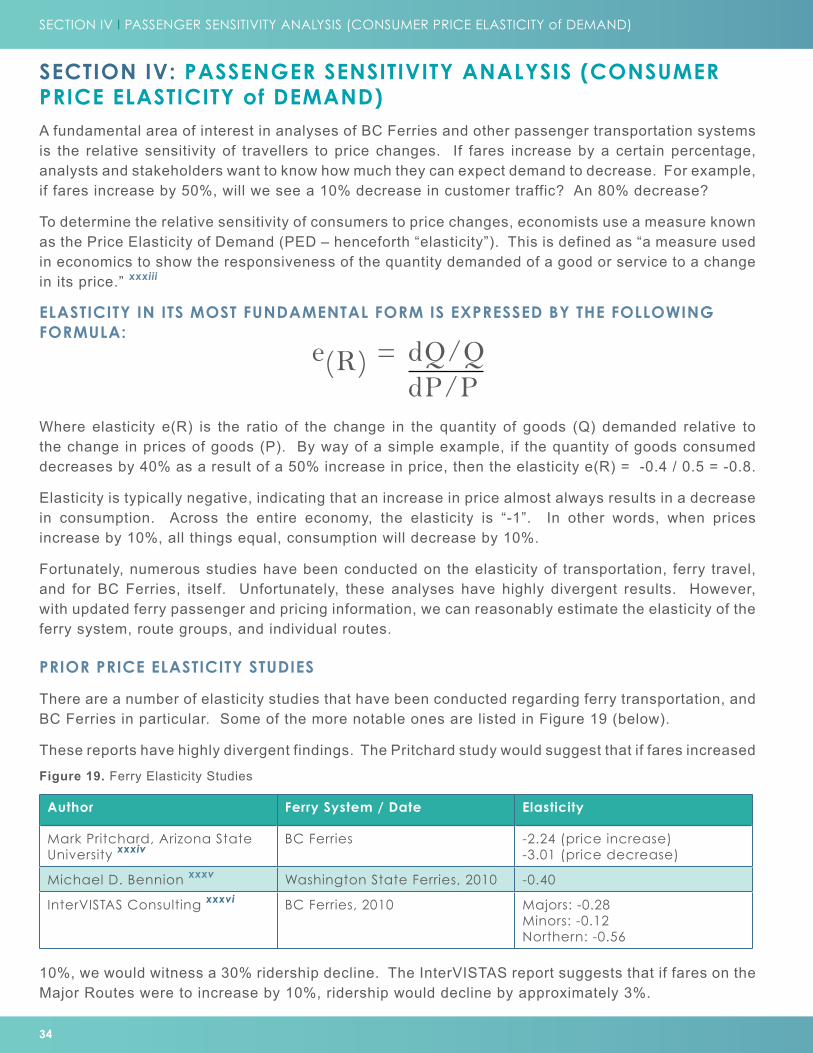
34
SECTION IV I PASSENGER SENSITIVITY ANALYSIS (CONSUMER PRICE ELASTICITY of DEMAND)
10%, we would witness a 30% ridership decline. The InterVISTAS report suggests that if fares on the Major Routes were to increase by 10%, ridership would decline by approximately 3%.
SECTION IV: PASSENGER SENSITIVITY ANALYSIS (CONSUMER PRICE ELASTICITY of DEMAND) A fundamental area of interest in analyses of BC Ferries and other passenger transportation systems is the relative sensitivity of travellers to price changes. If fares increase by a certain percentage, analysts and stakeholders want to know how much they can expect demand to decrease. For example, if fares increase by 50%, will we see a 10% decrease in customer traffic? An 80% decrease?
To determine the relative sensitivity of consumers to price changes, economists use a measure known as the Price Elasticity of Demand (PED – henceforth “elasticity”). This is defined as “a measure used in economics to show the responsiveness of the quantity demanded of a good or service to a change in its price.” xxxiii
ELASTICITY IN ITS MOST FUNDAMENTAL FORM IS EXPRESSED BY THE FOLLOWING FORMULA:
Where elasticity e(R) is the ratio of the change in the quantity of goods (Q) demanded relative to the change in prices of goods (P). By way of a simple example, if the quantity of goods consumed decreases by 40% as a result of a 50% increase in price, then the elasticity e(R) = -0.4 / 0.5 = -0.8.
Elasticity is typically negative, indicating that an increase in price almost always results in a decrease in consumption. Across the entire economy, the elasticity is “-1”. In other words, when prices increase by 10%, all things equal, consumption will decrease by 10%.
Fortunately, numerous studies have been conducted on the elasticity of transportation, ferry travel, and for BC Ferries, itself. Unfortunately, these analyses have highly divergent results. However, with updated ferry passenger and pricing information, we can reasonably estimate the elasticity of the ferry system, route groups, and individual routes.
PRIOR PRICE ELASTICITY STUDIES
There are a number of elasticity studies that have been conducted regarding ferry transportation, and BC Ferries in particular. Some of the more notable ones are listed in Figure 19 (below).
These reports have highly divergent findings. The Pritchard study would suggest that if fares increased
Author Ferry System / Date Elasticity
Mark Pritchard, Arizona State University xxxiv
BC Ferries -2.24 (price increase) -3.01 (price decrease)
Michael D. Bennion xxxv Washington State Ferries, 2010 -0.40
InterVISTAS Consulting xxxvi BC Ferries, 2010 Majors: -0.28 Minors: -0.12 Northern: -0.56
Figure 19. Ferry Elasticity Studies
e(R) = dQ/Q dP/P
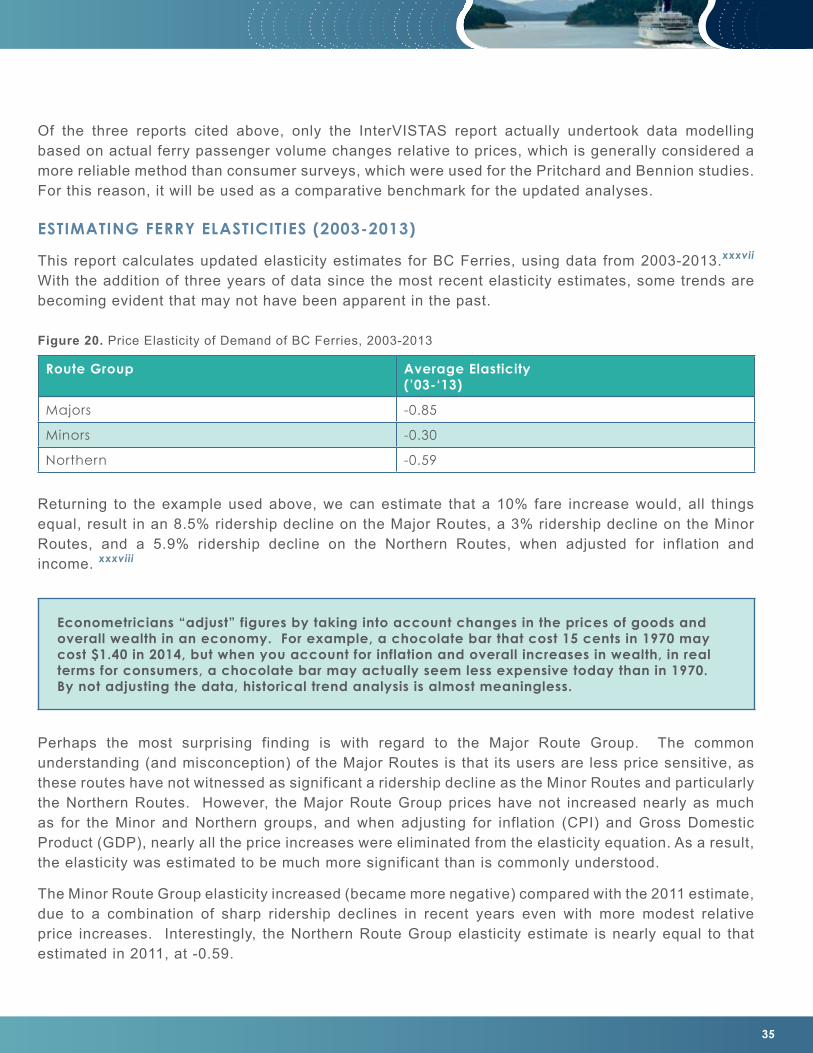
35
Of the three reports cited above, only the InterVISTAS report actually undertook data modelling based on actual ferry passenger volume changes relative to prices, which is generally considered a more reliable method than consumer surveys, which were used for the Pritchard and Bennion studies. For this reason, it will be used as a comparative benchmark for the updated analyses.
ESTIMATING FERRY ELASTICITIES (2003-2013)
This report calculates updated elasticity estimates for BC Ferries, using data from 2003-2013.xxxvii With the addition of three years of data since the most recent elasticity estimates, some trends are becoming evident that may not have been apparent in the past.
Route Group Average Elasticity (’03-‘13)
Majors -0.85
Minors -0.30
Northern -0.59
Figure 20. Price Elasticity of Demand of BC Ferries, 2003-2013
Returning to the example used above, we can estimate that a 10% fare increase would, all things equal, result in an 8.5% ridership decline on the Major Routes, a 3% ridership decline on the Minor Routes, and a 5.9% ridership decline on the Northern Routes, when adjusted for inflation and income. xxxviii
Perhaps the most surprising finding is with regard to the Major Route Group. The common understanding (and misconception) of the Major Routes is that its users are less price sensitive, as these routes have not witnessed as significant a ridership decline as the Minor Routes and particularly the Northern Routes. However, the Major Route Group prices have not increased nearly as much as for the Minor and Northern groups, and when adjusting for inflation (CPI) and Gross Domestic Product (GDP), nearly all the price increases were eliminated from the elasticity equation. As a result, the elasticity was estimated to be much more significant than is commonly understood.
The Minor Route Group elasticity increased (became more negative) compared with the 2011 estimate, due to a combination of sharp ridership declines in recent years even with more modest relative price increases. Interestingly, the Northern Route Group elasticity estimate is nearly equal to that estimated in 2011, at -0.59.
Econometricians “adjust” figures by taking into account changes in the prices of goods and overall wealth in an economy. For example, a chocolate bar that cost 15 cents in 1970 may cost $1.40 in 2014, but when you account for inflation and overall increases in wealth, in real terms for consumers, a chocolate bar may actually seem less expensive today than in 1970. By not adjusting the data, historical trend analysis is almost meaningless.
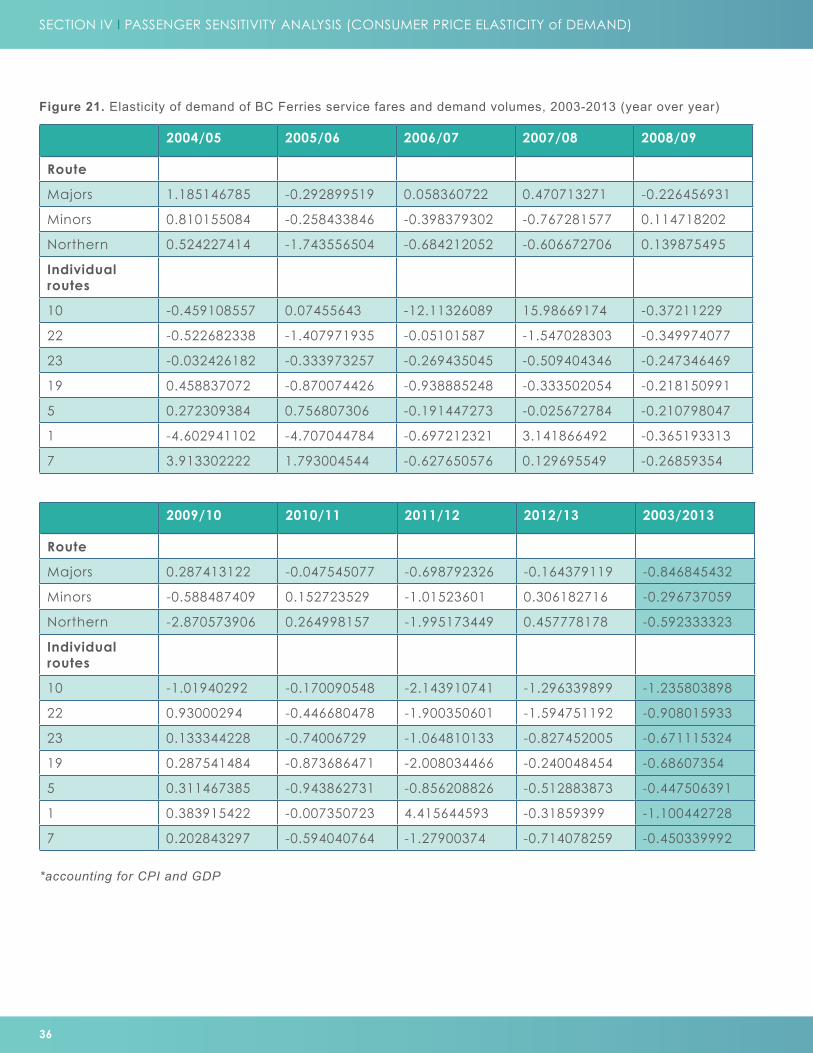
36
SECTION IV I PASSENGER SENSITIVITY ANALYSIS (CONSUMER PRICE ELASTICITY of DEMAND)
2004/05 2005/06 2006/07 2007/08 2008/09
Route
Majors 1.185146785 -0.292899519 0.058360722 0.470713271 -0.226456931
Minors 0.810155084 -0.258433846 -0.398379302 -0.767281577 0.114718202
Northern 0.524227414 -1.743556504 -0.684212052 -0.606672706 0.139875495
Individual routes
10 -0.459108557 0.07455643 -12.11326089 15.98669174 -0.37211229
22 -0.522682338 -1.407971935 -0.05101587 -1.547028303 -0.349974077
23 -0.032426182 -0.333973257 -0.269435045 -0.509404346 -0.247346469
19 0.458837072 -0.870074426 -0.938885248 -0.333502054 -0.218150991
5 0.272309384 0.756807306 -0.191447273 -0.025672784 -0.210798047
1 -4.602941102 -4.707044784 -0.697212321 3.141866492 -0.365193313
7 3.913302222 1.793004544 -0.627650576 0.129695549 -0.26859354
2009/10 2010/11 2011/12 2012/13 2003/2013
Route
Majors 0.287413122 -0.047545077 -0.698792326 -0.164379119 -0.846845432
Minors -0.588487409 0.152723529 -1.01523601 0.306182716 -0.296737059
Northern -2.870573906 0.264998157 -1.995173449 0.457778178 -0.592333323
Individual routes
10 -1.01940292 -0.170090548 -2.143910741 -1.296339899 -1.235803898
22 0.93000294 -0.446680478 -1.900350601 -1.594751192 -0.908015933
23 0.133344228 -0.74006729 -1.064810133 -0.827452005 -0.671115324
19 0.287541484 -0.873686471 -2.008034466 -0.240048454 -0.68607354
5 0.311467385 -0.943862731 -0.856208826 -0.512883873 -0.447506391
1 0.383915422 -0.007350723 4.415644593 -0.31859399 -1.100442728
7 0.202843297 -0.594040764 -1.27900374 -0.714078259 -0.450339992
Figure 21. Elasticity of demand of BC Ferries service fares and demand volumes, 2003-2013 (year over year)
*accounting for CPI and GDP
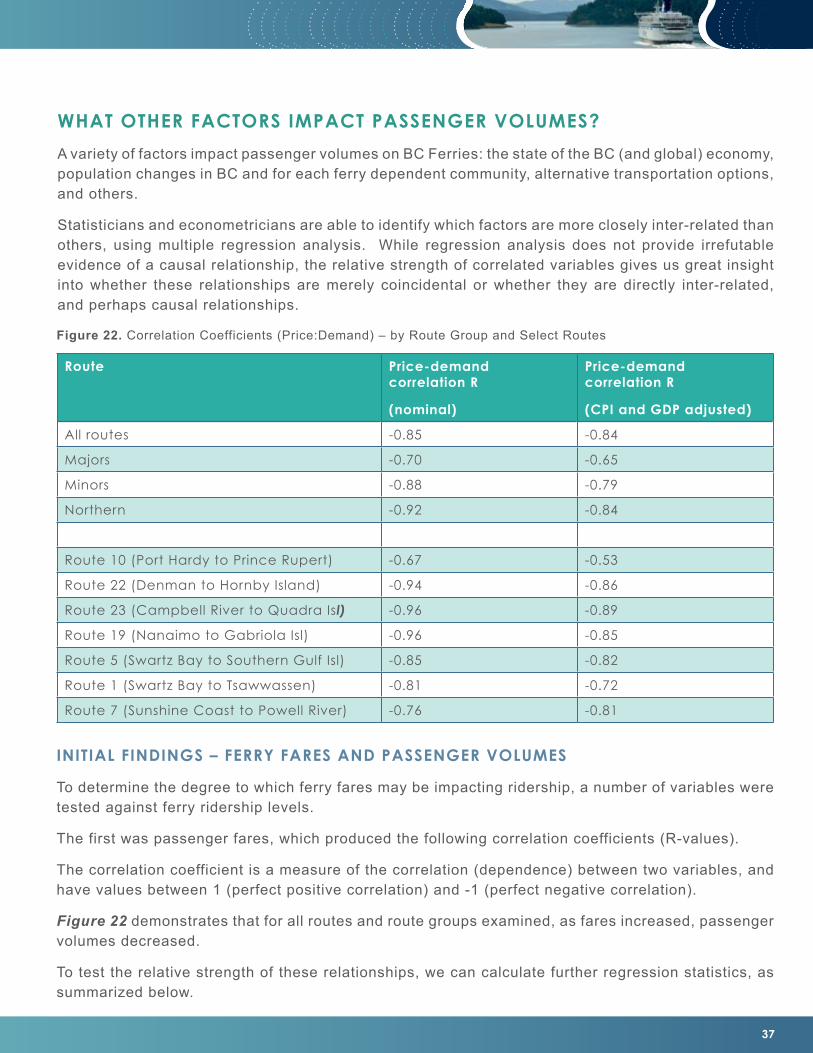
37
WHAT OTHER FACTORS IMPACT PASSENGER VOLUMES?
A variety of factors impact passenger volumes on BC Ferries: the state of the BC (and global) economy, population changes in BC and for each ferry dependent community, alternative transportation options, and others.
Statisticians and econometricians are able to identify which factors are more closely inter-related than others, using multiple regression analysis. While regression analysis does not provide irrefutable evidence of a causal relationship, the relative strength of correlated variables gives us great insight into whether these relationships are merely coincidental or whether they are directly inter-related, and perhaps causal relationships.
Route Price-demand correlation R
(nominal)
Price-demand correlation R
(CPI and GDP adjusted)
All routes -0.85 -0.84
Majors -0.70 -0.65
Minors -0.88 -0.79
Northern -0.92 -0.84
Route 10 (Port Hardy to Prince Rupert) -0.67 -0.53
Route 22 (Denman to Hornby Island) -0.94 -0.86
Route 23 (Campbell River to Quadra Isl) -0.96 -0.89
Route 19 (Nanaimo to Gabriola Isl) -0.96 -0.85
Route 5 (Swartz Bay to Southern Gulf Isl) -0.85 -0.82
Route 1 (Swartz Bay to Tsawwassen) -0.81 -0.72
Route 7 (Sunshine Coast to Powell River) -0.76 -0.81
Figure 22. Correlation Coefficients (Price:Demand) – by Route Group and Select Routes
INITIAL FINDINGS – FERRY FARES AND PASSENGER VOLUMES
To determine the degree to which ferry fares may be impacting ridership, a number of variables were tested against ferry ridership levels.
The first was passenger fares, which produced the following correlation coefficients (R-values).
The correlation coefficient is a measure of the correlation (dependence) between two variables, and have values between 1 (perfect positive correlation) and -1 (perfect negative correlation).
Figure 22 demonstrates that for all routes and route groups examined, as fares increased, passenger volumes decreased.
To test the relative strength of these relationships, we can calculate further regression statistics, as summarized below.
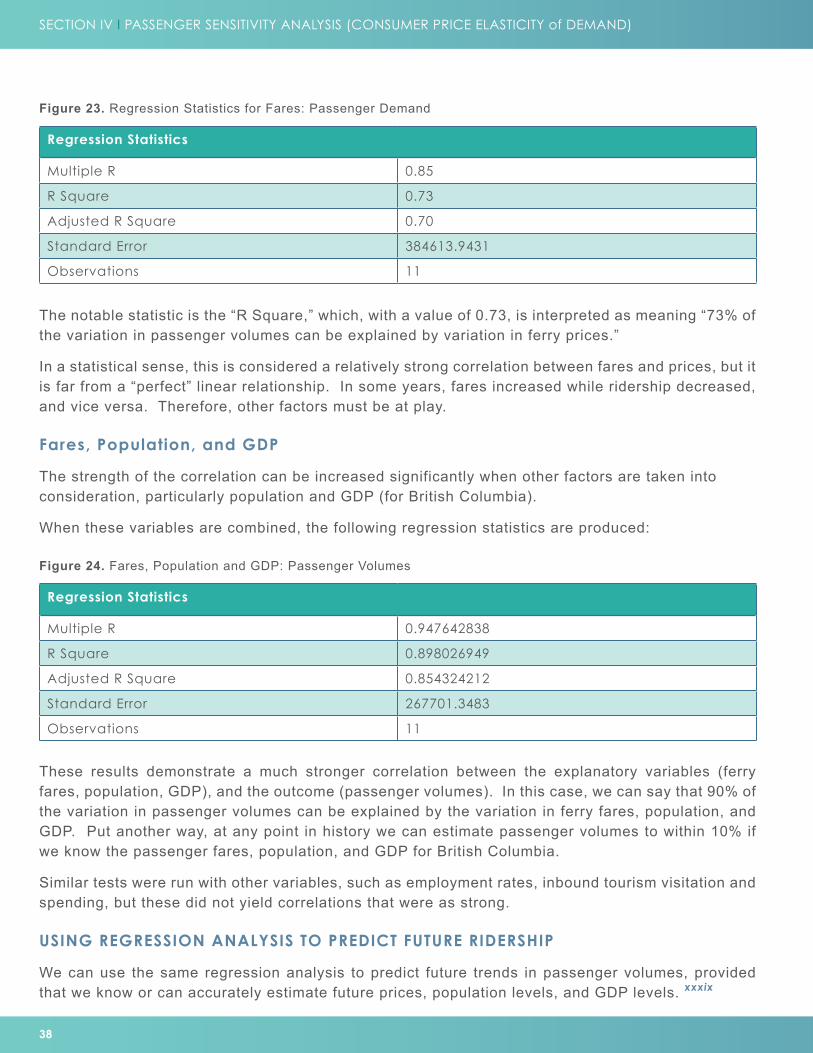
38
SECTION IV I PASSENGER SENSITIVITY ANALYSIS (CONSUMER PRICE ELASTICITY of DEMAND)
Regression Statistics
Multiple R 0.85
R Square 0.73
Adjusted R Square 0.70
Standard Error 384613.9431
Observations 11
Figure 23. Regression Statistics for Fares: Passenger Demand
The notable statistic is the “R Square,” which, with a value of 0.73, is interpreted as meaning “73% of the variation in passenger volumes can be explained by variation in ferry prices.”
In a statistical sense, this is considered a relatively strong correlation between fares and prices, but it is far from a “perfect” linear relationship. In some years, fares increased while ridership decreased, and vice versa. Therefore, other factors must be at play.
Fares, Population, and GDP
The strength of the correlation can be increased significantly when other factors are taken into consideration, particularly population and GDP (for British Columbia).
When these variables are combined, the following regression statistics are produced:
Regression Statistics
Multiple R 0.947642838
R Square 0.898026949
Adjusted R Square 0.854324212
Standard Error 267701.3483
Observations 11
Figure 24. Fares, Population and GDP: Passenger Volumes
These results demonstrate a much stronger correlation between the explanatory variables (ferry fares, population, GDP), and the outcome (passenger volumes). In this case, we can say that 90% of the variation in passenger volumes can be explained by the variation in ferry fares, population, and GDP. Put another way, at any point in history we can estimate passenger volumes to within 10% if we know the passenger fares, population, and GDP for British Columbia.
Similar tests were run with other variables, such as employment rates, inbound tourism visitation and spending, but these did not yield correlations that were as strong.
USING REGRESSION ANALYSIS TO PREDICT FUTURE RIDERSHIP
We can use the same regression analysis to predict future trends in passenger volumes, provided that we know or can accurately estimate future prices, population levels, and GDP levels. xxxix
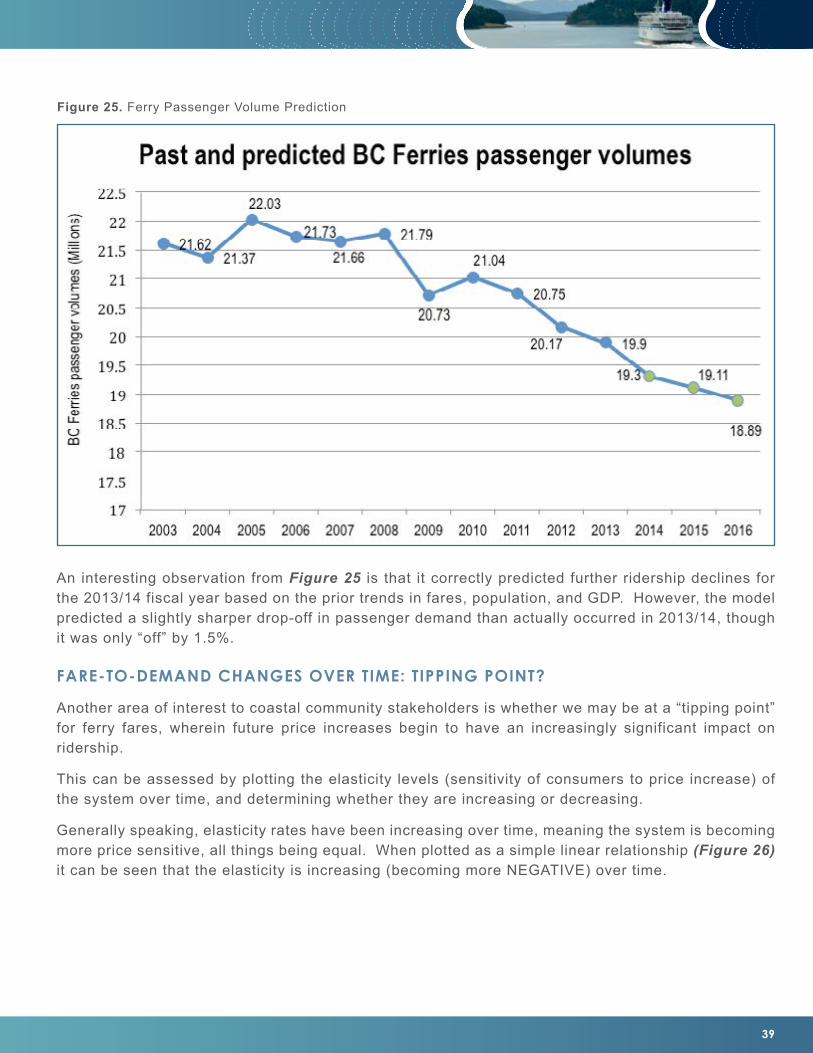
39
Figure 25. Ferry Passenger Volume Prediction
An interesting observation from Figure 25 is that it correctly predicted further ridership declines for the 2013/14 fiscal year based on the prior trends in fares, population, and GDP. However, the model predicted a slightly sharper drop-off in passenger demand than actually occurred in 2013/14, though it was only “off” by 1.5%.
FARE-TO-DEMAND CHANGES OVER TIME: TIPPING POINT?
Another area of interest to coastal community stakeholders is whether we may be at a “tipping point” for ferry fares, wherein future price increases begin to have an increasingly significant impact on ridership.
This can be assessed by plotting the elasticity levels (sensitivity of consumers to price increase) of the system over time, and determining whether they are increasing or decreasing.
Generally speaking, elasticity rates have been increasing over time, meaning the system is becoming more price sensitive, all things being equal. When plotted as a simple linear relationship (Figure 26) it can be seen that the elasticity is increasing (becoming more NEGATIVE) over time.

40
SECTION IV I PASSENGER SENSITIVITY ANALYSIS (CONSUMER PRICE ELASTICITY of DEMAND)
To further assess the changing sensitivity of consumers to price changes over time, econometricians often use logarithmic functions to apply a curvilinear line of best fit over the data points to indicate rates of change in data over time. In this case, using all years from 2003-2013 the rate of change (an upward sloping line) seems to suggest that while demand elasticity is increasing overall, the rate of change suggests that ferry travellers were becoming increasingly price sensitive in earlier years, and more recently have become less price sensitive. However, this trend appears to be due to the
Figure 26. Linear Elasticity Analysis – Fares: Demand
Figure 27. Curvilinear Elasticity (Fares: Demand) 2003/04 - 2012/13
highly inelastic results from 2004/05 fiscal, in which fares increased and yet passenger volumes also increased. Accounting for some lag-time impacts of increasing fares, when the same results are plotted from 2004/05 onward, the curvilinear elasticity trend increases (becomes more negative) over
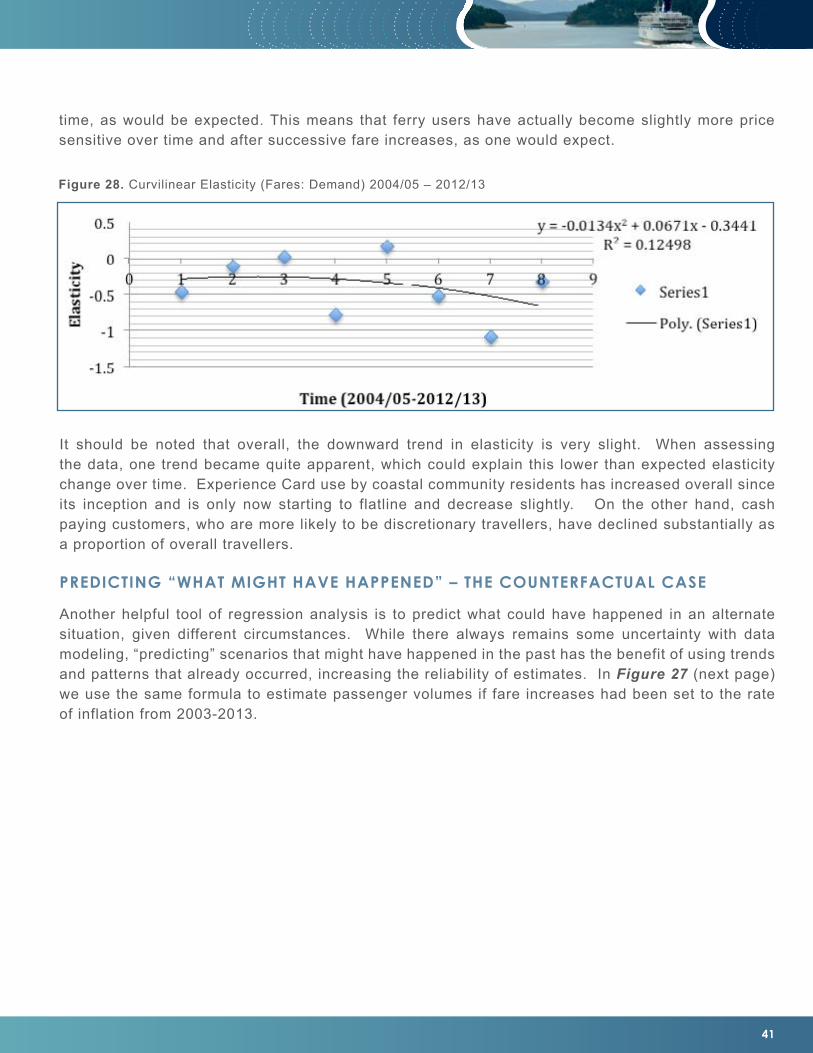
41
time, as would be expected. This means that ferry users have actually become slightly more price sensitive over time and after successive fare increases, as one would expect.
It should be noted that overall, the downward trend in elasticity is very slight. When assessing the data, one trend became quite apparent, which could explain this lower than expected elasticity change over time. Experience Card use by coastal community residents has increased overall since its inception and is only now starting to flatline and decrease slightly. On the other hand, cash paying customers, who are more likely to be discretionary travellers, have declined substantially as a proportion of overall travellers.
PREDICTING “WHAT MIGHT HAVE HAPPENED” – THE COUNTERFACTUAL CASE
Another helpful tool of regression analysis is to predict what could have happened in an alternate situation, given different circumstances. While there always remains some uncertainty with data modeling, “predicting” scenarios that might have happened in the past has the benefit of using trends and patterns that already occurred, increasing the reliability of estimates. In Figure 27 (next page) we use the same formula to estimate passenger volumes if fare increases had been set to the rate of inflation from 2003-2013.
Figure 28. Curvilinear Elasticity (Fares: Demand) 2004/05 – 2012/13
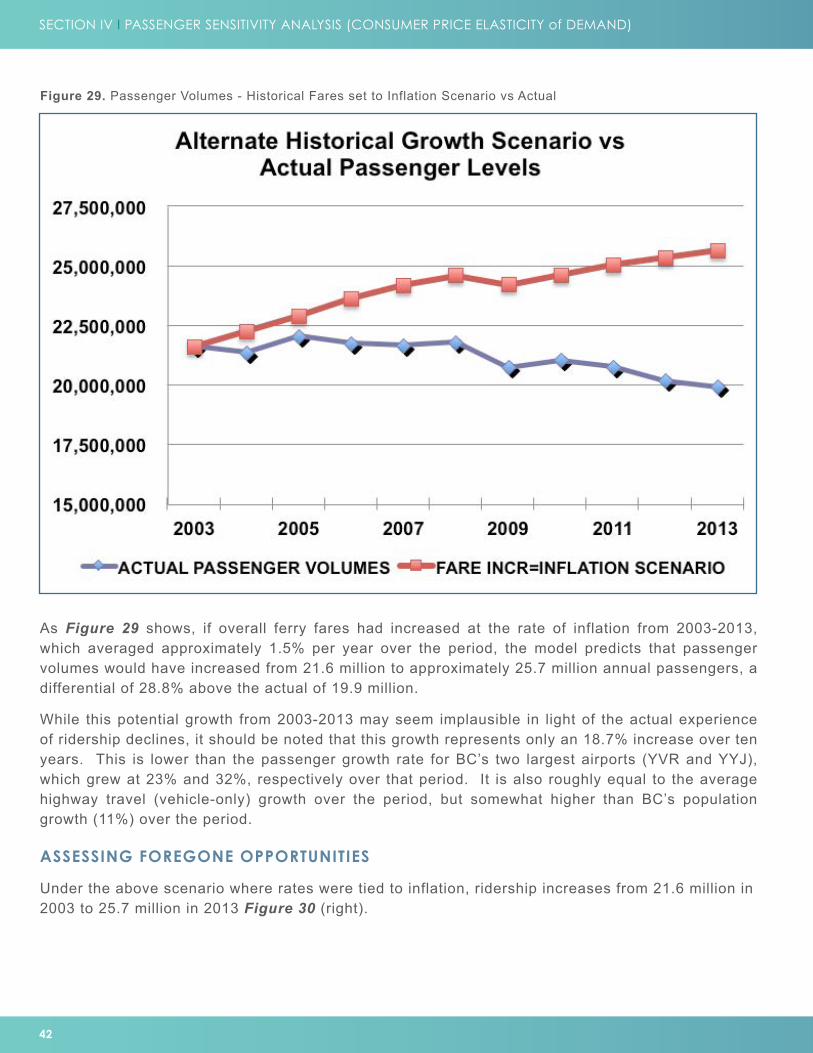
42
SECTION IV I PASSENGER SENSITIVITY ANALYSIS (CONSUMER PRICE ELASTICITY of DEMAND)
Figure 29. Passenger Volumes - Historical Fares set to Inflation Scenario vs Actual
As Figure 29 shows, if overall ferry fares had increased at the rate of inflation from 2003-2013, which averaged approximately 1.5% per year over the period, the model predicts that passenger volumes would have increased from 21.6 million to approximately 25.7 million annual passengers, a differential of 28.8% above the actual of 19.9 million.
While this potential growth from 2003-2013 may seem implausible in light of the actual experience of ridership declines, it should be noted that this growth represents only an 18.7% increase over ten years. This is lower than the passenger growth rate for BC’s two largest airports (YVR and YYJ), which grew at 23% and 32%, respectively over that period. It is also roughly equal to the average highway travel (vehicle-only) growth over the period, but somewhat higher than BC’s population growth (11%) over the period.
ASSESSING FOREGONE OPPORTUNITIES
Under the above scenario where rates were tied to inflation, ridership increases from 21.6 million in 2003 to 25.7 million in 2013 Figure 30 (right).
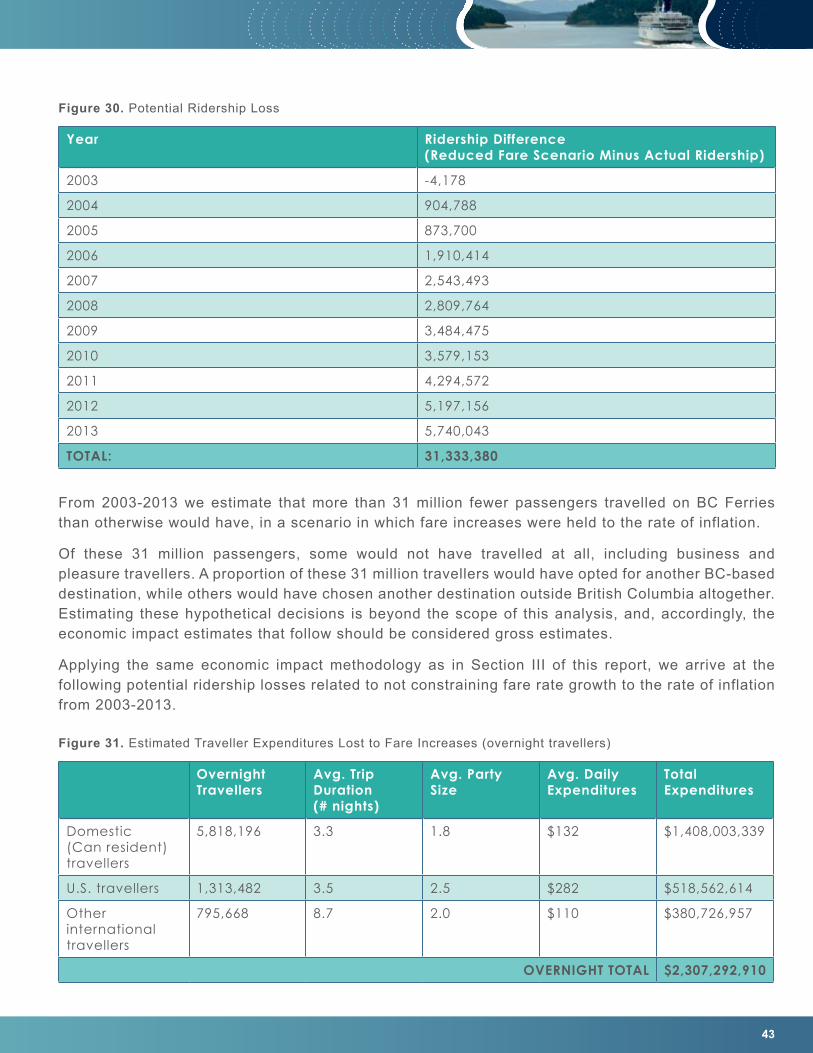
43
Figure 30. Potential Ridership Loss
Figure 31. Estimated Traveller Expenditures Lost to Fare Increases (overnight travellers)
Year Ridership Difference (Reduced Fare Scenario Minus Actual Ridership)
2003 -4,178
2004 904,788
2005 873,700
2006 1,910,414
2007 2,543,493
2008 2,809,764
2009 3,484,475
2010 3,579,153
2011 4,294,572
2012 5,197,156
2013 5,740,043
TOTAL: 31,333,380
From 2003-2013 we estimate that more than 31 million fewer passengers travelled on BC Ferries than otherwise would have, in a scenario in which fare increases were held to the rate of inflation.
Of these 31 million passengers, some would not have travelled at all, including business and pleasure travellers. A proportion of these 31 million travellers would have opted for another BC-based destination, while others would have chosen another destination outside British Columbia altogether. Estimating these hypothetical decisions is beyond the scope of this analysis, and, accordingly, the economic impact estimates that follow should be considered gross estimates.
Applying the same economic impact methodology as in Section III of this report, we arrive at the following potential ridership losses related to not constraining fare rate growth to the rate of inflation from 2003-2013.
Overnight Travellers
Avg. Trip Duration (# nights)
Avg. Party Size
Avg. Daily Expenditures
Total Expenditures
Domestic (Can resident) travellers
5,818,196 3.3 1.8 $132 $1,408,003,339
U.S. travellers 1,313,482 3.5 2.5 $282 $518,562,614
Other international travellers
795,668 8.7 2.0 $110 $380,726,957
OVERNIGHT TOTAL $2,307,292,910

44
Figure 32. Estimated Traveller Expenditures Lost to Fare Increases (same-day travellers)
Same-day Travellers
Avg. Party Size
Avg. Daily Expenditures
Same-Day Traveller Total Expenditures
Total same-day travellers
6,486,010 1.8 $132 $475,640,702
Figure 33. Estimated Traveller Expenditures Lost to Fare Increases (Total)
Overnight Traveller Expenditures $2,307,292,910
Same-day Traveller Expenditures $476,640,702
TOTAL $2,782,933,613
As Figure 33 (above) demonstrates, estimated foregone ferry passenger expenditures were $2.8 billion from 2003-2013. This is the direct revenue that could have accrued to businesses had ferry fare increases been limited to the rate of inflation, using our regression model of passenger trends.
ASSESSING INDIRECT AND INDUCED LOSSES
Once the total direct expenditures are known, the Direct, Indirect, and Induced GDP can be calculated, as well as the total taxation impacts.
SECTION IV I PASSENGER SENSITIVITY ANALYSIS (CONSUMER PRICE ELASTICITY of DEMAND)
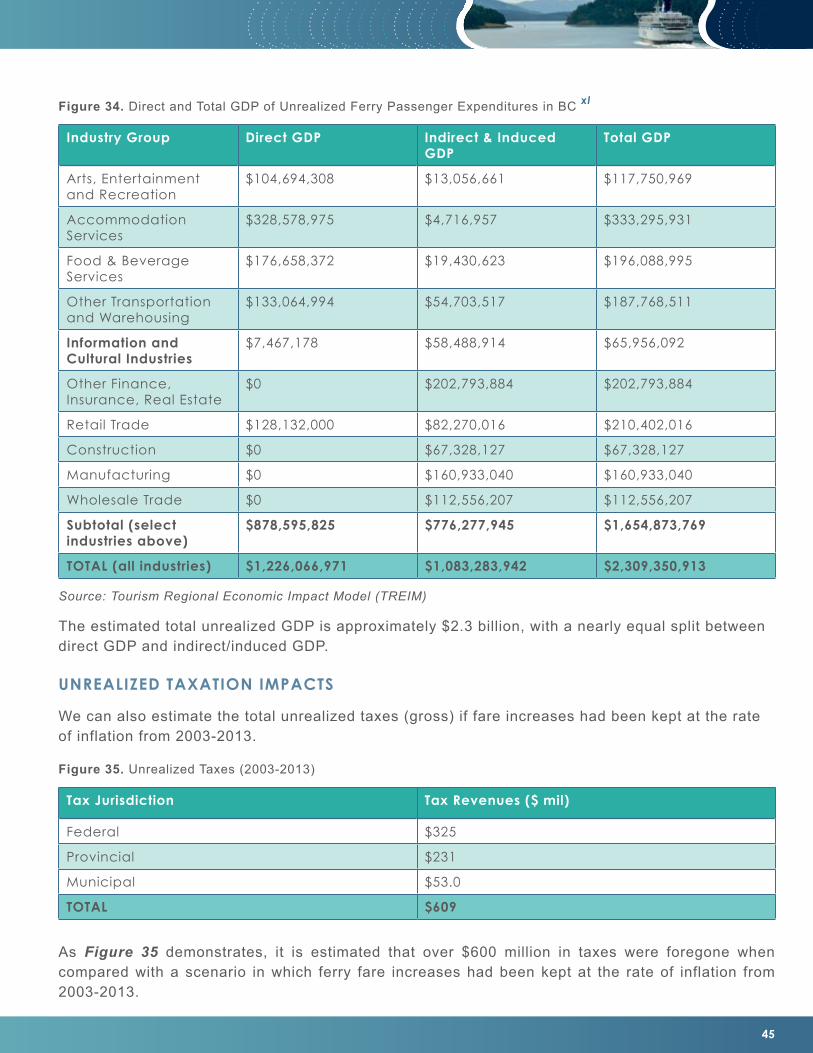
45
The estimated total unrealized GDP is approximately $2.3 billion, with a nearly equal split between direct GDP and indirect/induced GDP.
UNREALIZED TAXATION IMPACTS
We can also estimate the total unrealized taxes (gross) if fare increases had been kept at the rate of inflation from 2003-2013.
Figure 35. Unrealized Taxes (2003-2013)
Tax Jurisdiction Tax Revenues ($ mil)
Federal $325
Provincial $231
Municipal $53.0
TOTAL $609
As Figure 35 demonstrates, it is estimated that over $600 million in taxes were foregone when compared with a scenario in which ferry fare increases had been kept at the rate of inflation from 2003-2013.
Figure 34. Direct and Total GDP of Unrealized Ferry Passenger Expenditures in BC xl
Industry Group Direct GDP Indirect & Induced GDP
Total GDP
Arts, Entertainment and Recreation
$104,694,308 $13,056,661 $117,750,969
Accommodation Services
$328,578,975 $4,716,957 $333,295,931
Food & Beverage Services
$176,658,372 $19,430,623 $196,088,995
Other Transportation and Warehousing
$133,064,994 $54,703,517 $187,768,511
Information and Cultural Industries
$7,467,178 $58,488,914 $65,956,092
Other Finance, Insurance, Real Estate
$0 $202,793,884 $202,793,884
Retail Trade $128,132,000 $82,270,016 $210,402,016
Construction $0 $67,328,127 $67,328,127
Manufacturing $0 $160,933,040 $160,933,040
Wholesale Trade $0 $112,556,207 $112,556,207
Subtotal (select industries above)
$878,595,825 $776,277,945 $1,654,873,769
TOTAL (all industries) $1,226,066,971 $1,083,283,942 $2,309,350,913
Source: Tourism Regional Economic Impact Model (TREIM)
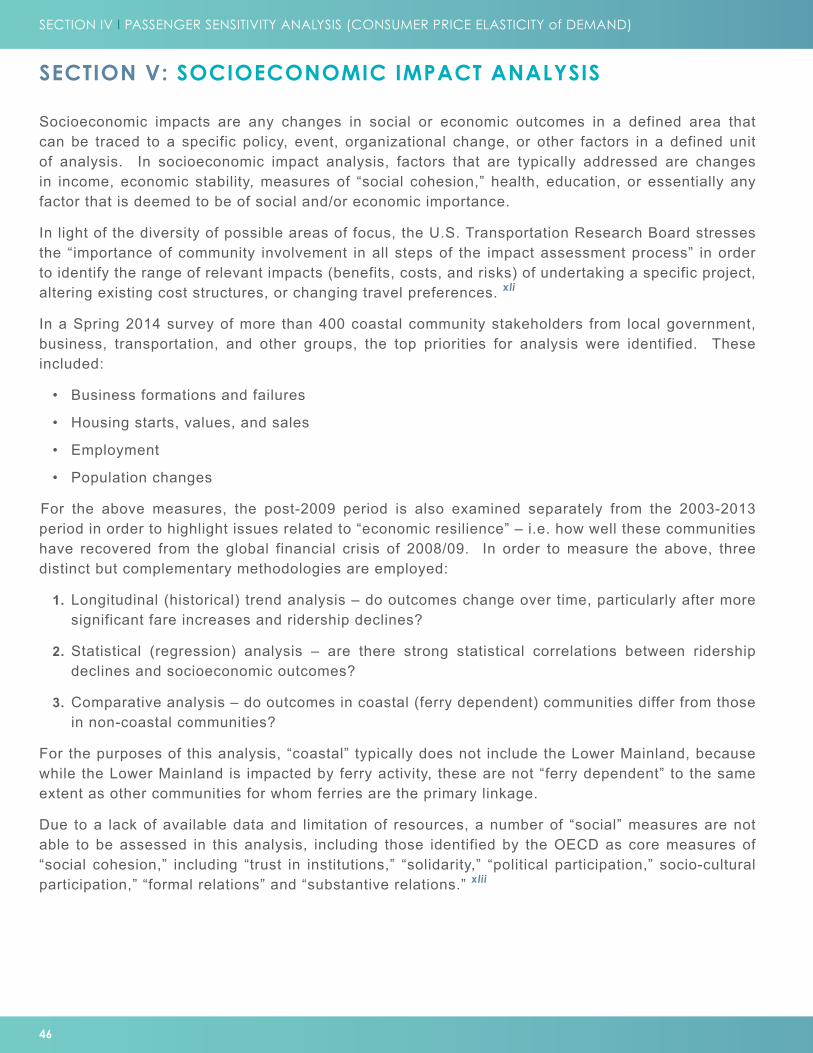
46
SECTION IV I PASSENGER SENSITIVITY ANALYSIS (CONSUMER PRICE ELASTICITY of DEMAND)
SECTION V: SOCIOECONOMIC IMPACT ANALYSIS
Socioeconomic impacts are any changes in social or economic outcomes in a defined area that can be traced to a specific policy, event, organizational change, or other factors in a defined unit of analysis. In socioeconomic impact analysis, factors that are typically addressed are changes in income, economic stability, measures of “social cohesion,” health, education, or essentially any factor that is deemed to be of social and/or economic importance.
In light of the diversity of possible areas of focus, the U.S. Transportation Research Board stresses the “importance of community involvement in all steps of the impact assessment process” in order to identify the range of relevant impacts (benefits, costs, and risks) of undertaking a specific project, altering existing cost structures, or changing travel preferences. xli
In a Spring 2014 survey of more than 400 coastal community stakeholders from local government, business, transportation, and other groups, the top priorities for analysis were identified. These included:
• Business formations and failures
• Housing starts, values, and sales
• Employment
• Population changes
For the above measures, the post-2009 period is also examined separately from the 2003-2013 period in order to highlight issues related to “economic resilience” – i.e. how well these communities have recovered from the global financial crisis of 2008/09. In order to measure the above, three distinct but complementary methodologies are employed:
1. Longitudinal (historical) trend analysis – do outcomes change over time, particularly after more significant fare increases and ridership declines?
2. Statistical (regression) analysis – are there strong statistical correlations between ridership declines and socioeconomic outcomes?
3. Comparative analysis – do outcomes in coastal (ferry dependent) communities differ from those in non-coastal communities?
For the purposes of this analysis, “coastal” typically does not include the Lower Mainland, because while the Lower Mainland is impacted by ferry activity, these are not “ferry dependent” to the same extent as other communities for whom ferries are the primary linkage.
Due to a lack of available data and limitation of resources, a number of “social” measures are not able to be assessed in this analysis, including those identified by the OECD as core measures of “social cohesion,” including “trust in institutions,” “solidarity,” “political participation,” socio-cultural participation,” “formal relations” and “substantive relations.” xlii
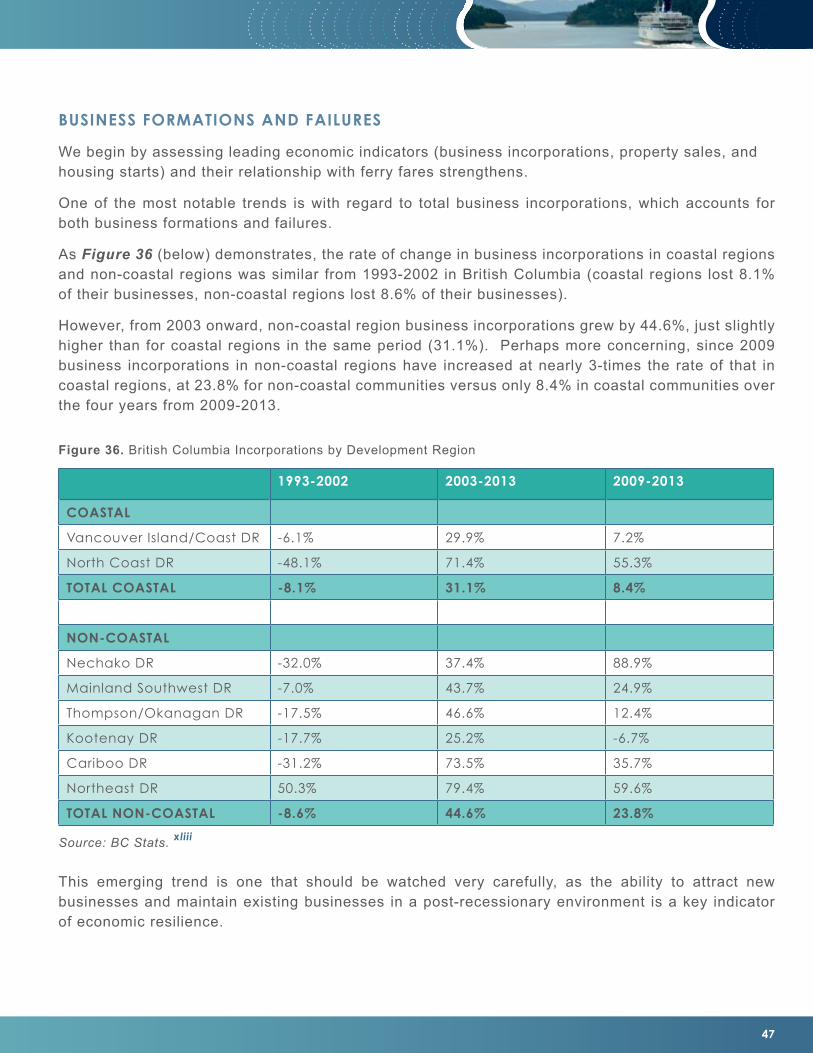
47
BUSINESS FORMATIONS AND FAILURES
We begin by assessing leading economic indicators (business incorporations, property sales, and housing starts) and their relationship with ferry fares strengthens.
One of the most notable trends is with regard to total business incorporations, which accounts for both business formations and failures.
As Figure 36 (below) demonstrates, the rate of change in business incorporations in coastal regions and non-coastal regions was similar from 1993-2002 in British Columbia (coastal regions lost 8.1% of their businesses, non-coastal regions lost 8.6% of their businesses).
However, from 2003 onward, non-coastal region business incorporations grew by 44.6%, just slightly higher than for coastal regions in the same period (31.1%). Perhaps more concerning, since 2009 business incorporations in non-coastal regions have increased at nearly 3-times the rate of that in coastal regions, at 23.8% for non-coastal communities versus only 8.4% in coastal communities over the four years from 2009-2013.
Figure 36. British Columbia Incorporations by Development Region
1993-2002 2003-2013 2009-2013
COASTAL
Vancouver Island/Coast DR -6.1% 29.9% 7.2%
North Coast DR -48.1% 71.4% 55.3%
TOTAL COASTAL -8.1% 31.1% 8.4%
NON-COASTAL
Nechako DR -32.0% 37.4% 88.9%
Mainland Southwest DR -7.0% 43.7% 24.9%
Thompson/Okanagan DR -17.5% 46.6% 12.4%
Kootenay DR -17.7% 25.2% -6.7%
Cariboo DR -31.2% 73.5% 35.7%
Northeast DR 50.3% 79.4% 59.6%
TOTAL NON-COASTAL -8.6% 44.6% 23.8%
Source: BC Stats. xliii
This emerging trend is one that should be watched very carefully, as the ability to attract new businesses and maintain existing businesses in a post-recessionary environment is a key indicator of economic resilience.
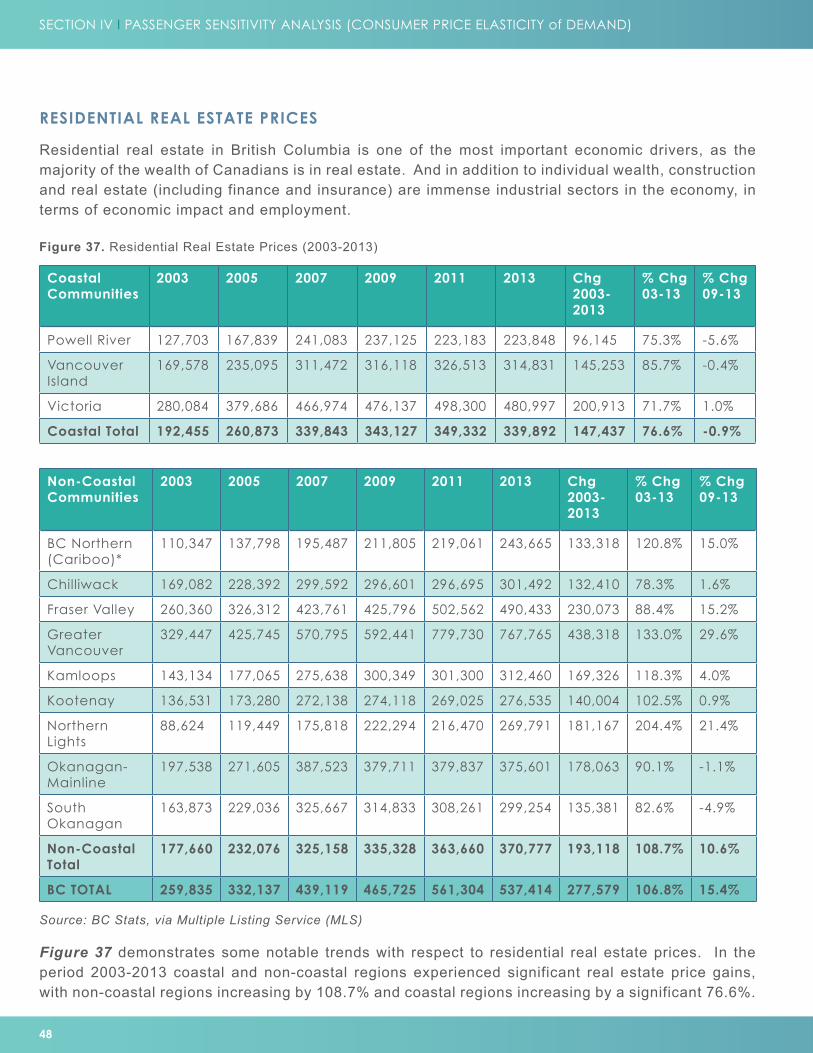
48
SECTION IV I PASSENGER SENSITIVITY ANALYSIS (CONSUMER PRICE ELASTICITY of DEMAND)
RESIDENTIAL REAL ESTATE PRICES
Residential real estate in British Columbia is one of the most important economic drivers, as the majority of the wealth of Canadians is in real estate. And in addition to individual wealth, construction and real estate (including finance and insurance) are immense industrial sectors in the economy, in terms of economic impact and employment.
Coastal Communities
2003 2005 2007 2009 2011 2013 Chg 2003-2013
% Chg 03-13
% Chg 09-13
Powell River 127,703 167,839 241,083 237,125 223,183 223,848 96,145 75.3% -5.6%
Vancouver Island
169,578 235,095 311,472 316,118 326,513 314,831 145,253 85.7% -0.4%
Victoria 280,084 379,686 466,974 476,137 498,300 480,997 200,913 71.7% 1.0%
Coastal Total 192,455 260,873 339,843 343,127 349,332 339,892 147,437 76.6% -0.9%
Figure 37. Residential Real Estate Prices (2003-2013)
Non-Coastal Communities
2003 2005 2007 2009 2011 2013 Chg 2003-2013
% Chg 03-13
% Chg 09-13
BC Northern (Cariboo)*
110,347 137,798 195,487 211,805 219,061 243,665 133,318 120.8% 15.0%
Chilliwack 169,082 228,392 299,592 296,601 296,695 301,492 132,410 78.3% 1.6%
Fraser Valley 260,360 326,312 423,761 425,796 502,562 490,433 230,073 88.4% 15.2%
Greater Vancouver
329,447 425,745 570,795 592,441 779,730 767,765 438,318 133.0% 29.6%
Kamloops 143,134 177,065 275,638 300,349 301,300 312,460 169,326 118.3% 4.0%
Kootenay 136,531 173,280 272,138 274,118 269,025 276,535 140,004 102.5% 0.9%
Northern Lights
88,624 119,449 175,818 222,294 216,470 269,791 181,167 204.4% 21.4%
Okanagan-Mainline
197,538 271,605 387,523 379,711 379,837 375,601 178,063 90.1% -1.1%
South Okanagan
163,873 229,036 325,667 314,833 308,261 299,254 135,381 82.6% -4.9%
Non-Coastal Total
177,660 232,076 325,158 335,328 363,660 370,777 193,118 108.7% 10.6%
BC TOTAL 259,835 332,137 439,119 465,725 561,304 537,414 277,579 106.8% 15.4%
Source: BC Stats, via Multiple Listing Service (MLS)
Figure 37 demonstrates some notable trends with respect to residential real estate prices. In the period 2003-2013 coastal and non-coastal regions experienced significant real estate price gains, with non-coastal regions increasing by 108.7% and coastal regions increasing by a significant 76.6%.

49
However, the growth trend for coastal communities ends in 2009. Post-recession, the average price in all coastal regions combined has declined (in nominal terms) by 0.9% - far from a housing market crash, but notably lower than the 10.6% price increase realized by non-coastal communities in this period.
This is another trend wherein post-recession, coastal regions appear to be detached from the economic circumstances of non-coastal regions.
Property value deflation also serves to reduce the source of funding for local governments, rely on property taxes as a primary though not exclusive funding source. As Figure 38 (below) demonstrates, the total assessed value of all properties in several coastal communities has decreased substantially, particularly from 2011 to 2014.
Jurisdiction Route 2006 2011 2014 Chg ‘06-14 Chg ’11-14
Saltspring 9, 4, 6 $2,591,433,027 $3,198,127,473 $2,925,767,013 12.9% -8.5%
Pender (N&S)
9, 5 $737,151,501 $1,002,507,921 $890,652,304 20.8% -11.2%
Mayne 9, 5 $391,957,700 $626,794,102 $498,377,402 27.2% -20.5%
Galiano 9, 5 $440,964,501 $548,852,302 $467,473,002 6.0% -14.8%
Saturna 9, 5 $172,438,711 $258,911,003 $221,492,103 28.4% -14.5%
Thetis 20 $82,405,900 $134,066,900 $127,462,600 54.7% -4.9%
Gabriola 19 $822,859,750 $1,124,677,000 $1,000,832,600 21.6% -11.0%
Hornby 22 $357,720,500 $505,921,200 $497,280,500 39.0% -1.7%
Denman 21, 22 $282,812,900 $388,276,600 $355,370,300 25.7% -8.5%
Bowen 8 $1,103,306,303 $1,574,434,296 $1,453,052,196 31.7% -7.7%
Quadra 23 $397,380,000 $561,910,100 $509,526,200 28.2% -9.3%
Powell River 17 $893,374,991 $1,383,784,000 $1,235,583,200 38.3% -10.7%
Figure 38. Total Assessed Values - Ferry Dependent Communities
Source: BC Assessment Authority
While the total assessed value of all properties increased substantially from 2006 to 2011 for all coastal communities identified above, there was a notable decline from 2011 onward for all but two communities, with an average decline in total assessed values of 8.4% from 2011 to 2014.
However, it should be noted that while there may be a pattern of declining property values in recent years in coastal communities, this trend has a low correlation with ferry fares (correlation coefficient of -0.39). We would therefore urge caution in using ferry fare increases and/or ridership declines as a primary explanatory factor for housing prices.

50
SECTION IV I PASSENGER SENSITIVITY ANALYSIS (CONSUMER PRICE ELASTICITY of DEMAND)
HOUSING STARTS AND SALES
Two areas with much stronger correlations to ferry fares and ridership levels are housing starts and sales, two important leading economic indicators that can often be used to predict future levels of economic activity in related areas.
From 2003 to 2013 housing starts in coastal communities declined by 22%, compared with a growth of 8% in non-coastal communities. Notably, since 2009 housing starts have nearly doubled from the recessionary lows in non-coastal communities, while they have only increased by approximately 11% in coastal communities since 2009.
Coastal Communities 2003 2005 2007 2009 2011 2013 2013/03
Victoria 2,008 2,058 2,579 1,034 1,642 1,685 -16.09%
Nanaimo 605 905 833 801 720 415 -31.40%
Campbell River 97 339 269 131 155 262 170.10%
Courtenay 452 713 650 245 265 131 -71.02%
Duncan 185 388 281 168 163 163 -11.89%
Parksville-Qualicum Beach
248 289 216 100 149 126 -49.19%
Port Alberni 31 83 104 41 83 40 29.03%
Powell River 17 89 35 42 19 13 -23.53%
Prince Rupert 1 4 6 1 4 2 100.00%
TOTAL COASTAL 3,644 4,868 4,973 2,563 3,200 2,837 -22.21%
Figure 39. Housing Starts
Non -Coastal Communities
2003 2005 2007 2009 2011 2013 2013/03
Abbotsford 1,056 1,012 1,088 365 537 749 -29.07%
Kelowna 2,137 2,755 2,805 657 934 1,013 -52.60%
Vancouver 15,626 18,914 20,736 8,339 17,867 18,696 19.65%
Chilliwack 539 966 1,352 368 354 443 -17.81%
Kamloops 301 589 763 420 510 479 59.14%
Prince George 103 284 328 145 157 195 89.32%
Vernon 318 415 548 265 163 194 -38.99%
Cranbrook 67 187 192 106 75 82 22.39%
Dawson Creek 29 40 138 84 69 193 565.52%
Fort St. John 204 153 382 100 152 385 88.73%
Penticton 219 406 295 137 89 80 -63.47%
Quesnel 21 41 117 36 35 43 104.76%
Salmon Arm 84 154 190 62 45 62 -26.19%
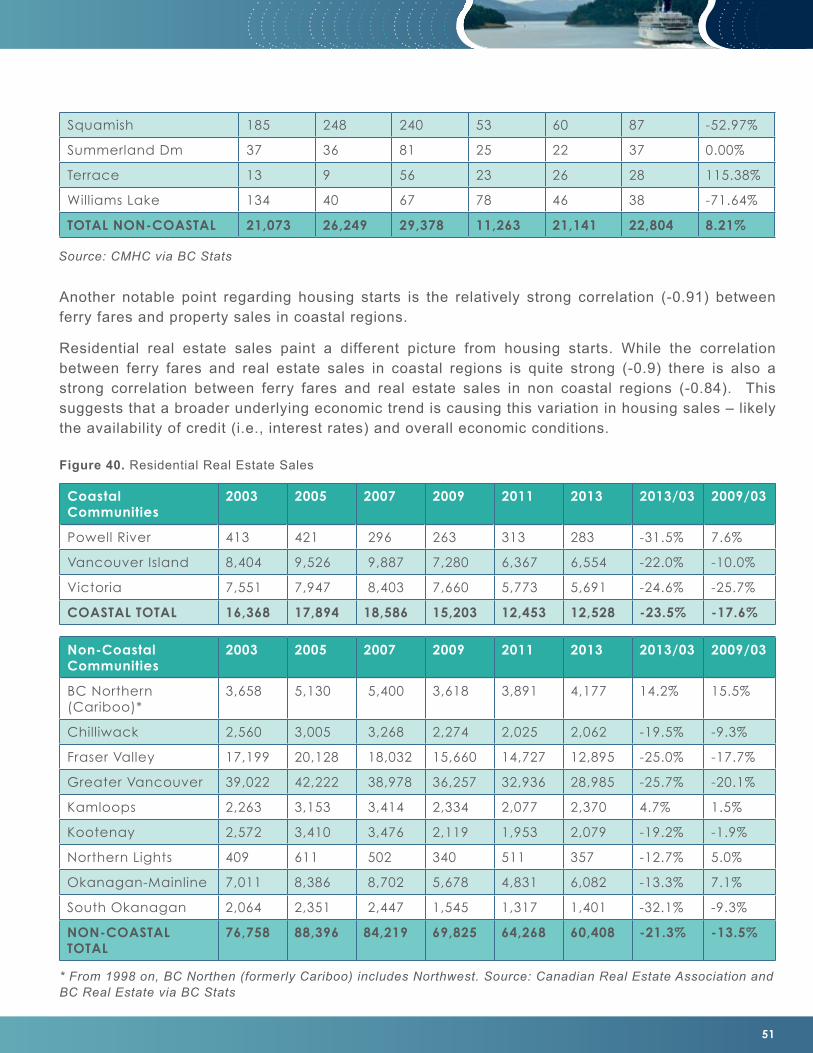
51
Squamish 185 248 240 53 60 87 -52.97%
Summerland Dm 37 36 81 25 22 37 0.00%
Terrace 13 9 56 23 26 28 115.38%
Williams Lake 134 40 67 78 46 38 -71.64%
TOTAL NON-COASTAL 21,073 26,249 29,378 11,263 21,141 22,804 8.21%
Source: CMHC via BC Stats
Another notable point regarding housing starts is the relatively strong correlation (-0.91) between ferry fares and property sales in coastal regions.
Residential real estate sales paint a different picture from housing starts. While the correlation between ferry fares and real estate sales in coastal regions is quite strong (-0.9) there is also a strong correlation between ferry fares and real estate sales in non coastal regions (-0.84). This suggests that a broader underlying economic trend is causing this variation in housing sales – likely the availability of credit (i.e., interest rates) and overall economic conditions.
Coastal Communities
2003 2005 2007 2009 2011 2013 2013/03 2009/03
Powell River 413 421 296 263 313 283 -31.5% 7.6%
Vancouver Island 8,404 9,526 9,887 7,280 6,367 6,554 -22.0% -10.0%
Victoria 7,551 7,947 8,403 7,660 5,773 5,691 -24.6% -25.7%
COASTAL TOTAL 16,368 17,894 18,586 15,203 12,453 12,528 -23.5% -17.6%
Figure 40. Residential Real Estate Sales
Non-Coastal Communities
2003 2005 2007 2009 2011 2013 2013/03 2009/03
BC Northern (Cariboo)*
3,658 5,130 5,400 3,618 3,891 4,177 14.2% 15.5%
Chilliwack 2,560 3,005 3,268 2,274 2,025 2,062 -19.5% -9.3%
Fraser Valley 17,199 20,128 18,032 15,660 14,727 12,895 -25.0% -17.7%
Greater Vancouver 39,022 42,222 38,978 36,257 32,936 28,985 -25.7% -20.1%
Kamloops 2,263 3,153 3,414 2,334 2,077 2,370 4.7% 1.5%
Kootenay 2,572 3,410 3,476 2,119 1,953 2,079 -19.2% -1.9%
Northern Lights 409 611 502 340 511 357 -12.7% 5.0%
Okanagan-Mainline 7,011 8,386 8,702 5,678 4,831 6,082 -13.3% 7.1%
South Okanagan 2,064 2,351 2,447 1,545 1,317 1,401 -32.1% -9.3%
NON-COASTAL TOTAL
76,758 88,396 84,219 69,825 64,268 60,408 -21.3% -13.5%
* From 1998 on, BC Northen (formerly Cariboo) includes Northwest. Source: Canadian Real Estate Association and BC Real Estate via BC Stats
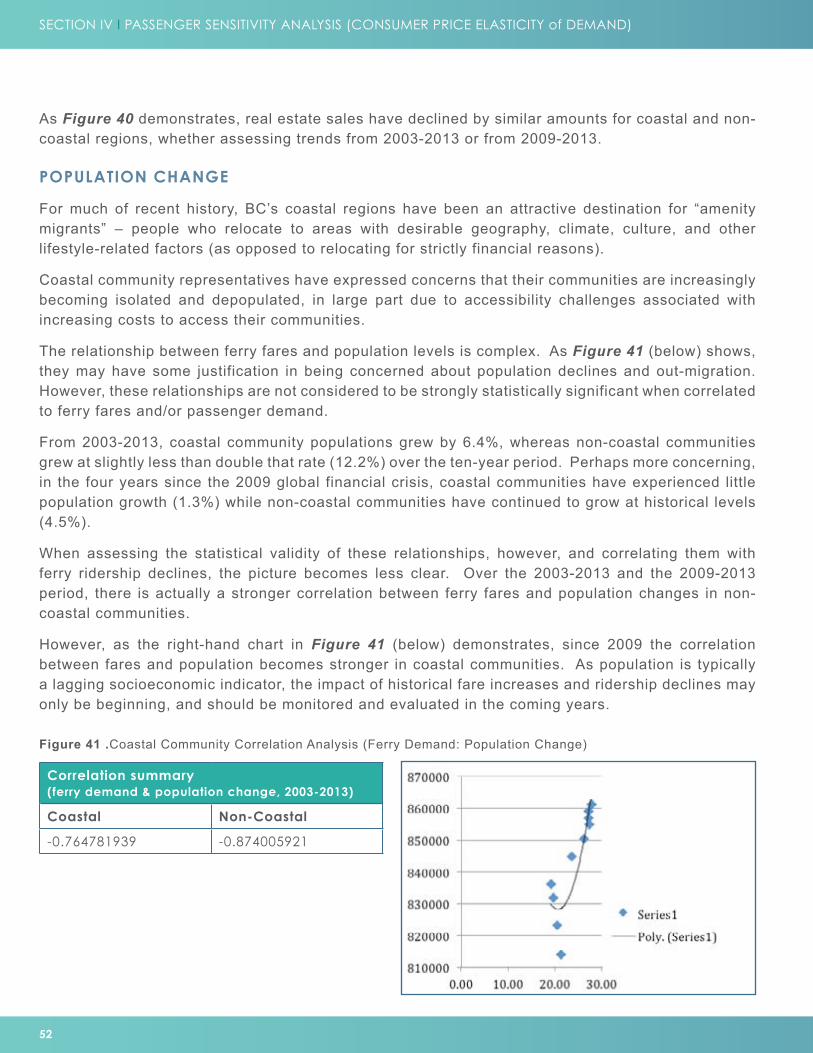
52
SECTION IV I PASSENGER SENSITIVITY ANALYSIS (CONSUMER PRICE ELASTICITY of DEMAND)
As Figure 40 demonstrates, real estate sales have declined by similar amounts for coastal and non-coastal regions, whether assessing trends from 2003-2013 or from 2009-2013.
POPULATION CHANGE
For much of recent history, BC’s coastal regions have been an attractive destination for “amenity migrants” – people who relocate to areas with desirable geography, climate, culture, and other lifestyle-related factors (as opposed to relocating for strictly financial reasons).
Coastal community representatives have expressed concerns that their communities are increasingly becoming isolated and depopulated, in large part due to accessibility challenges associated with increasing costs to access their communities.
The relationship between ferry fares and population levels is complex. As Figure 41 (below) shows, they may have some justification in being concerned about population declines and out-migration. However, these relationships are not considered to be strongly statistically significant when correlated to ferry fares and/or passenger demand.
From 2003-2013, coastal community populations grew by 6.4%, whereas non-coastal communities grew at slightly less than double that rate (12.2%) over the ten-year period. Perhaps more concerning, in the four years since the 2009 global financial crisis, coastal communities have experienced little population growth (1.3%) while non-coastal communities have continued to grow at historical levels (4.5%).
When assessing the statistical validity of these relationships, however, and correlating them with ferry ridership declines, the picture becomes less clear. Over the 2003-2013 and the 2009-2013 period, there is actually a stronger correlation between ferry fares and population changes in non-coastal communities.
However, as the right-hand chart in Figure 41 (below) demonstrates, since 2009 the correlation between fares and population becomes stronger in coastal communities. As population is typically a lagging socioeconomic indicator, the impact of historical fare increases and ridership declines may only be beginning, and should be monitored and evaluated in the coming years.
Figure 41 .Coastal Community Correlation Analysis (Ferry Demand: Population Change)
Correlation summary (ferry demand & population change, 2003-2013)
Coastal Non-Coastal
-0.764781939 -0.874005921
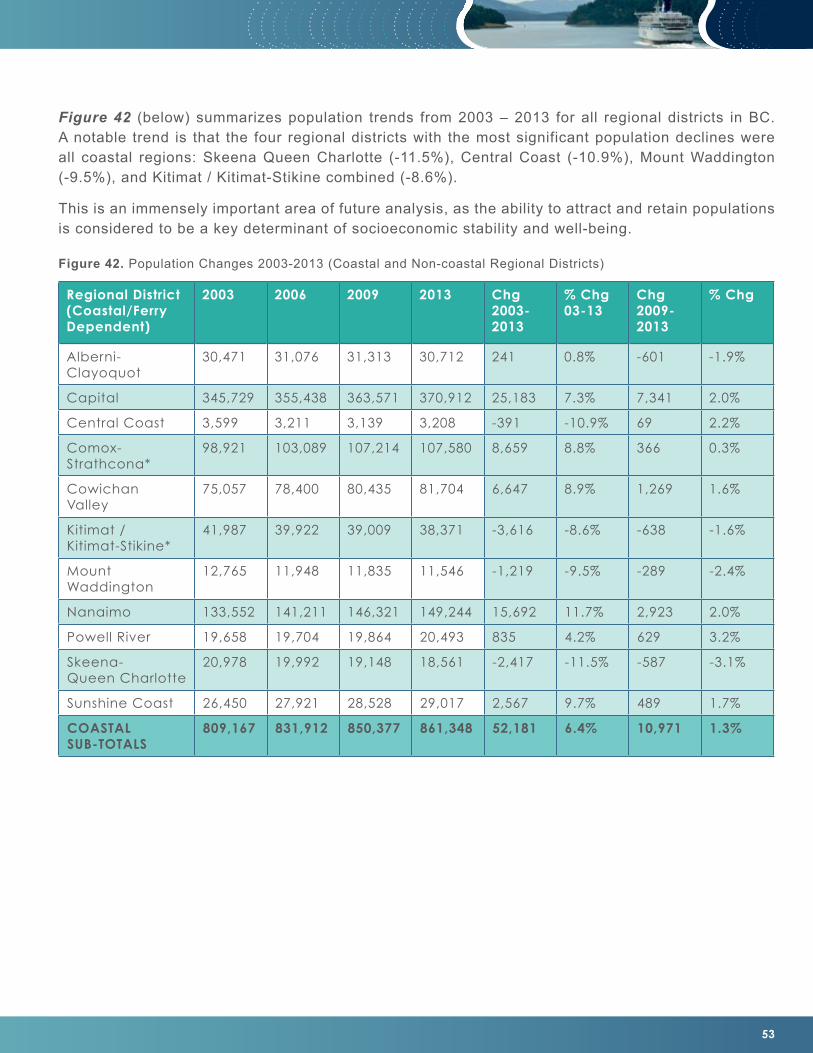
53
Figure 42 (below) summarizes population trends from 2003 – 2013 for all regional districts in BC. A notable trend is that the four regional districts with the most significant population declines were all coastal regions: Skeena Queen Charlotte (-11.5%), Central Coast (-10.9%), Mount Waddington (-9.5%), and Kitimat / Kitimat-Stikine combined (-8.6%).
This is an immensely important area of future analysis, as the ability to attract and retain populations is considered to be a key determinant of socioeconomic stability and well-being.
Figure 42. Population Changes 2003-2013 (Coastal and Non-coastal Regional Districts)
Regional District (Coastal/Ferry Dependent)
2003 2006 2009 2013 Chg 2003-2013
% Chg 03-13
Chg 2009-2013
% Chg
Alberni-Clayoquot
30,471 31,076 31,313 30,712 241 0.8% -601 -1.9%
Capital 345,729 355,438 363,571 370,912 25,183 7.3% 7,341 2.0%
Central Coast 3,599 3,211 3,139 3,208 -391 -10.9% 69 2.2%
Comox- Strathcona*
98,921 103,089 107,214 107,580 8,659 8.8% 366 0.3%
Cowichan Valley
75,057 78,400 80,435 81,704 6,647 8.9% 1,269 1.6%
Kitimat / Kitimat-Stikine*
41,987 39,922 39,009 38,371 -3,616 -8.6% -638 -1.6%
Mount Waddington
12,765 11,948 11,835 11,546 -1,219 -9.5% -289 -2.4%
Nanaimo 133,552 141,211 146,321 149,244 15,692 11.7% 2,923 2.0%
Powell River 19,658 19,704 19,864 20,493 835 4.2% 629 3.2%
Skeena- Queen Charlotte
20,978 19,992 19,148 18,561 -2,417 -11.5% -587 -3.1%
Sunshine Coast 26,450 27,921 28,528 29,017 2,567 9.7% 489 1.7%
COASTAL SUB-TOTALS
809,167 831,912 850,377 861,348 52,181 6.4% 10,971 1.3%
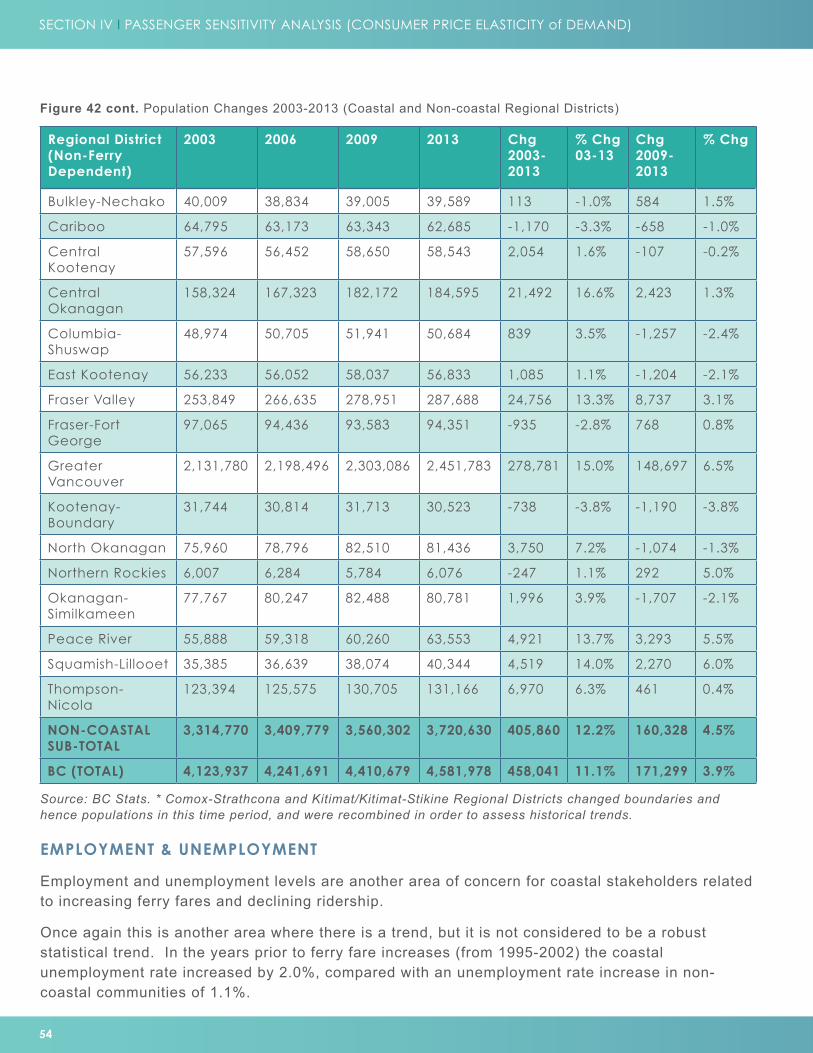
54
SECTION IV I PASSENGER SENSITIVITY ANALYSIS (CONSUMER PRICE ELASTICITY of DEMAND)
Figure 42 cont. Population Changes 2003-2013 (Coastal and Non-coastal Regional Districts)
Regional District (Non-Ferry Dependent)
2003 2006 2009 2013 Chg 2003-2013
% Chg 03-13
Chg 2009-2013
% Chg
Bulkley-Nechako 40,009 38,834 39,005 39,589 113 -1.0% 584 1.5%
Cariboo 64,795 63,173 63,343 62,685 -1,170 -3.3% -658 -1.0%
Central Kootenay
57,596 56,452 58,650 58,543 2,054 1.6% -107 -0.2%
Central Okanagan
158,324 167,323 182,172 184,595 21,492 16.6% 2,423 1.3%
Columbia-Shuswap
48,974 50,705 51,941 50,684 839 3.5% -1,257 -2.4%
East Kootenay 56,233 56,052 58,037 56,833 1,085 1.1% -1,204 -2.1%
Fraser Valley 253,849 266,635 278,951 287,688 24,756 13.3% 8,737 3.1%
Fraser-Fort George
97,065 94,436 93,583 94,351 -935 -2.8% 768 0.8%
Greater Vancouver
2,131,780 2,198,496 2,303,086 2,451,783 278,781 15.0% 148,697 6.5%
Kootenay-Boundary
31,744 30,814 31,713 30,523 -738 -3.8% -1,190 -3.8%
North Okanagan 75,960 78,796 82,510 81,436 3,750 7.2% -1,074 -1.3%
Northern Rockies 6,007 6,284 5,784 6,076 -247 1.1% 292 5.0%
Okanagan-Similkameen
77,767 80,247 82,488 80,781 1,996 3.9% -1,707 -2.1%
Peace River 55,888 59,318 60,260 63,553 4,921 13.7% 3,293 5.5%
Squamish-Lillooet 35,385 36,639 38,074 40,344 4,519 14.0% 2,270 6.0%
Thompson-Nicola
123,394 125,575 130,705 131,166 6,970 6.3% 461 0.4%
NON-COASTAL SUB-TOTAL
3,314,770 3,409,779 3,560,302 3,720,630 405,860 12.2% 160,328 4.5%
BC (TOTAL) 4,123,937 4,241,691 4,410,679 4,581,978 458,041 11.1% 171,299 3.9%
EMPLOYMENT & UNEMPLOYMENT
Employment and unemployment levels are another area of concern for coastal stakeholders related to increasing ferry fares and declining ridership.
Once again this is another area where there is a trend, but it is not considered to be a robust statistical trend. In the years prior to ferry fare increases (from 1995-2002) the coastal unemployment rate increased by 2.0%, compared with an unemployment rate increase in non-coastal communities of 1.1%.
Source: BC Stats. * Comox-Strathcona and Kitimat/Kitimat-Stikine Regional Districts changed boundaries and hence populations in this time period, and were recombined in order to assess historical trends.
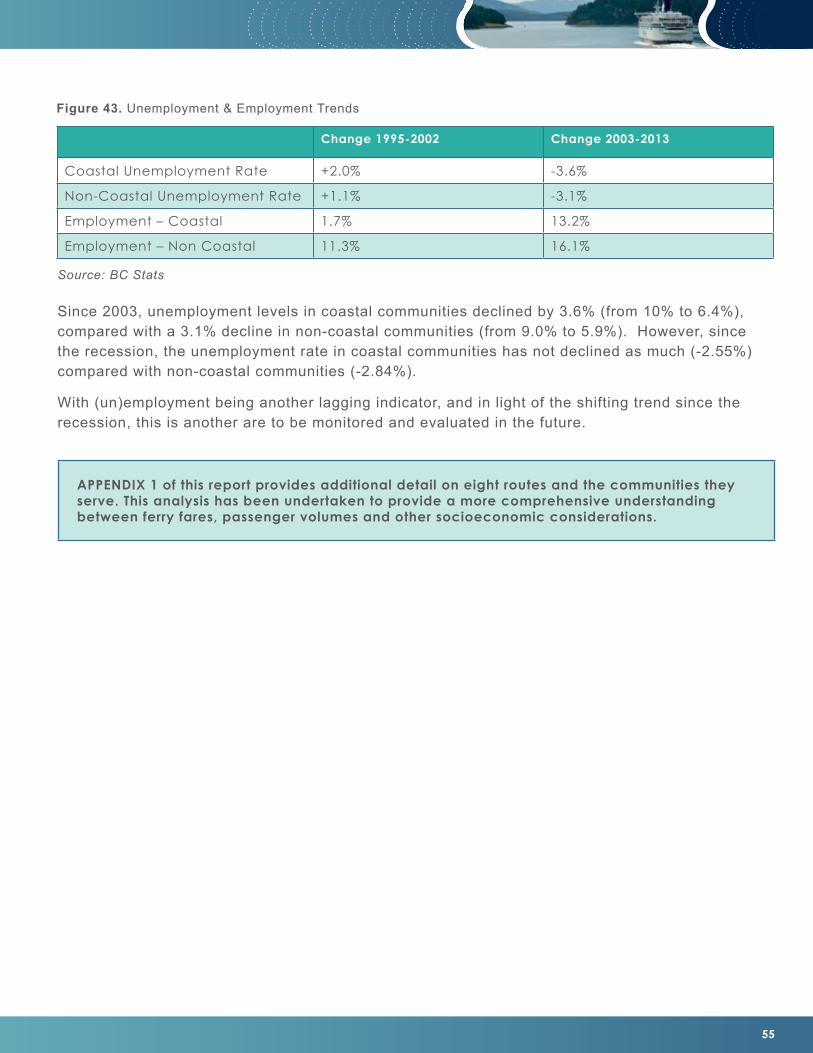
55
Since 2003, unemployment levels in coastal communities declined by 3.6% (from 10% to 6.4%), compared with a 3.1% decline in non-coastal communities (from 9.0% to 5.9%). However, since the recession, the unemployment rate in coastal communities has not declined as much (-2.55%) compared with non-coastal communities (-2.84%).
With (un)employment being another lagging indicator, and in light of the shifting trend since the recession, this is another are to be monitored and evaluated in the future.
Figure 43. Unemployment & Employment Trends
Change 1995-2002 Change 2003-2013
Coastal Unemployment Rate +2.0% -3.6%
Non-Coastal Unemployment Rate +1.1% -3.1%
Employment – Coastal 1.7% 13.2%
Employment – Non Coastal 11.3% 16.1%
Source: BC Stats
APPENDIX 1 of this report provides additional detail on eight routes and the communities they serve. This analysis has been undertaken to provide a more comprehensive understanding between ferry fares, passenger volumes and other socioeconomic considerations.

56
SECTION VI I RISK ANALYSIS
SECTION VI: RISK ANALYSIS
This section provides a summary of the major risks identified in this report, based on the data that was reviewed.
A Cautionary Note:
This is a high-level risk analysis based on the initial assessment of data. As risk analyses have the potential to become self-fulfilling prophecies, caution should be employed with interpreting and communicating these preliminary findings.
The risks evaluated in this report are interrelated, making it difficult to isolate them and establish independent risk rankings in each category. For example, continued reductions in ferry ridership could result in business foreclosures, which in turn could reduce employment, and put downward pressure on housing prices. However, the evaluation methods (historical/trend, statistical, comparative, and economic impact) help us to determine which categories of risks are more or less likely to be related to ferry fares and ridership levels, and their severity.
Risks are typically evaluated based on the “likelihood” of a risk occurring and the “severity” of the risk, if it were to occur. Risks that are both more severe and that have a higher probability of occurring have higher overall risk scores, while the reverse holds true for risks that are lower in severity and probability.
OUTPUT AND OUTCOME RISKS
There are two types of risks: “output” risks and “outcome” risks. Output risks are related to the actual outputs of the system – in this case, ridership levels. Outcome risks, on the other hand, describe the downstream impacts that could result from changes in the ferry system, such as population migration, housing prices, and other outcomes.
These are summarized in Figure 44 (right).
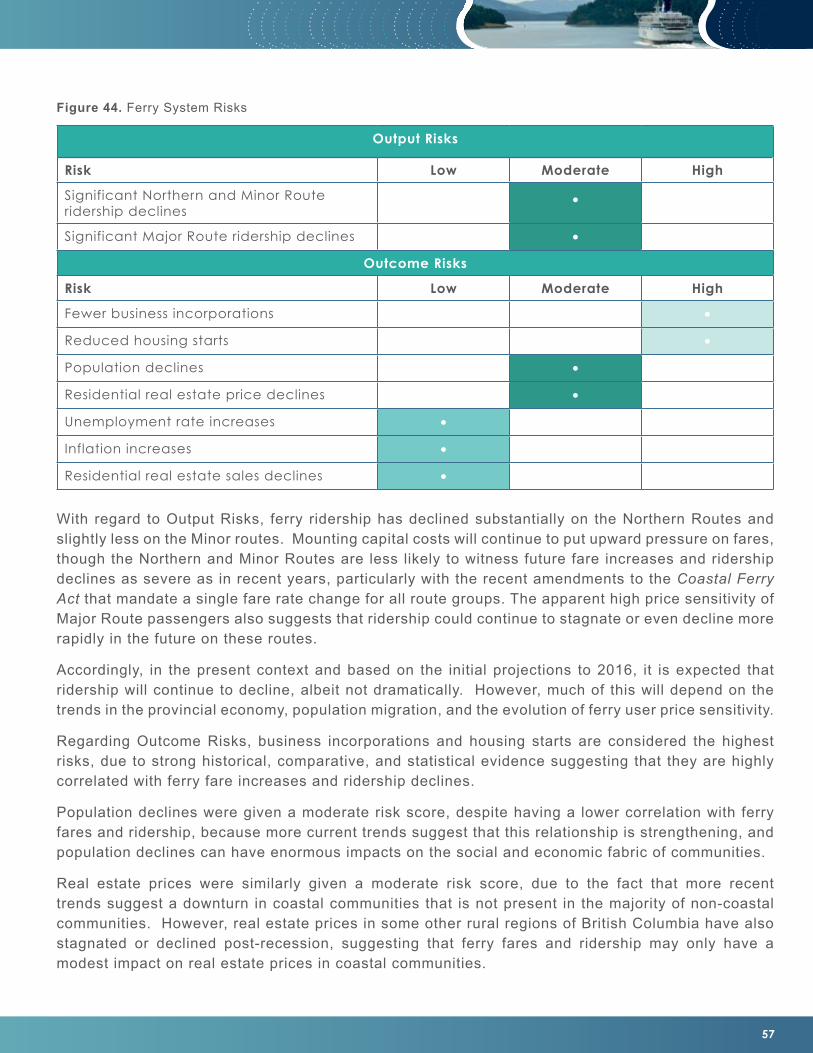
57
Figure 44. Ferry System Risks
Output Risks
Risk Low Moderate High
Significant Northern and Minor Route ridership declines
•
Significant Major Route ridership declines •
Outcome Risks
Risk Low Moderate High
Fewer business incorporations •
Reduced housing starts •
Population declines •
Residential real estate price declines •
Unemployment rate increases •
Inflation increases •
Residential real estate sales declines •
With regard to Output Risks, ferry ridership has declined substantially on the Northern Routes and slightly less on the Minor routes. Mounting capital costs will continue to put upward pressure on fares, though the Northern and Minor Routes are less likely to witness future fare increases and ridership declines as severe as in recent years, particularly with the recent amendments to the Coastal Ferry Act that mandate a single fare rate change for all route groups. The apparent high price sensitivity of Major Route passengers also suggests that ridership could continue to stagnate or even decline more rapidly in the future on these routes.
Accordingly, in the present context and based on the initial projections to 2016, it is expected that ridership will continue to decline, albeit not dramatically. However, much of this will depend on the trends in the provincial economy, population migration, and the evolution of ferry user price sensitivity.
Regarding Outcome Risks, business incorporations and housing starts are considered the highest risks, due to strong historical, comparative, and statistical evidence suggesting that they are highly correlated with ferry fare increases and ridership declines.
Population declines were given a moderate risk score, despite having a lower correlation with ferry fares and ridership, because more current trends suggest that this relationship is strengthening, and population declines can have enormous impacts on the social and economic fabric of communities.
Real estate prices were similarly given a moderate risk score, due to the fact that more recent trends suggest a downturn in coastal communities that is not present in the majority of non-coastal communities. However, real estate prices in some other rural regions of British Columbia have also stagnated or declined post-recession, suggesting that ferry fares and ridership may only have a modest impact on real estate prices in coastal communities.
58
SECTION VI I RISK ANALYSIS
Notably, employment levels do not appear to be related to ferry fares nor ridership levels, despite the fact that business incorporations have already shown signs of weakness. As a lagging indicator, it is possible that employment could begin to turn downward, but to date it has not shown any signs of doing so.
Real estate sales volumes in coastal communities may continue to be lower than the provincial average, but unless this results in price impacts, the overall effects may not be as severe. In addition, to date there is limited evidence regarding the impact of ferry ridership declines and real estate sales volumes. In real estate market cycles, sales typically lead prices, but in the case of coastal communities the reverse seems to hold true, suggesting that other factors (interest rates, availability of credit, population, inventory) may be responsible for these mixed outcomes.
Finally, widespread inflation could be highly damaging to coastal communities, but there is little or no evidence of inflation being correlated with ferry fares nor ridership levels.
59
SECTION VII: CONCLUSION
This initial analysis of the socioeconomic impact of BC Ferries has demonstrated that there are reasonable grounds to conclude that increases in ferry fares have had an impact on ridership throughout the ferry system, including the Major, Minor, and Northern Route Groups. Overall, most routes display moderate consumer price sensitivity (price elasticity of demand), and this appears to be increasing over time, albeit slowly.
The analysis also concludes that the economic impact of BC Ferries on coastal communities and the overall BC economy is enormous. When measured by the amount of economic activity generated by businesses that directly and indirectly benefit from ferry traveller spending in the economy, BC Ferries is shown to be a critical element of BC’s transportation infrastructure that impacts the very fabric of coastal communities and the province overall. Measured this way, the total GDP of BC Ferries is estimated at $1.5 billion per year, and contributing an estimated $394 million annually in taxes to the federal, provincial, and local governments.
The sheer magnitude of the ferry system means that its management has significant implications far beyond just coastal communities. As one of the largest marine passenger transportation systems in the world, BC Ferries has impacts on every community in the province.
While this is an initial scoping analysis, we are confident that the results are accurate beyond an order of magnitude level. Refinement of these initial findings should be undertaken, using primary data where available, and using complementary but alternate methodologies for estimating economic impacts, elasticity, and downstream socioeconomic impacts.
One notable finding in this study was the apparent disjuncture between the typically negative public opinion regarding BC Ferries, and the organization’s strong operational performance relative to its competitors around the world. One way to bridge this divide may be to develop a stakeholder survey to be conducted in concert with the annual customer satisfaction survey, to gauge and better manage stakeholder opinions regarding the organization’s performance.
As the economic impact section of this report has indicated, the true value of BC Ferries extends far beyond its role as a business, as it facilitates economic activity in all facets of the economy. Managing the organization using private sector yield management and cost recovery approaches may maximize the organizational bottom line, but could result in foregone opportunities to stimulate economic activity and enhance government tax revenues.
The recent amendment of the Coastal Ferry Act in 2012 to better clarify and address the interests of ferry users is a positive outcome that may help to moderate fare increases in the future. This analysis may help to further clarify the value and impacts of fares on ridership and the overall health and vitality of coastal communities.
60
APPENDIX 1: CASE STUDIES
This section provides additional detail on a selection of specific routes and the communities they serve, in order to develop a more comprehensive understanding of the relationship between ferry fares, passenger volumes, and other socioeconomic considerations.
A broad cross-section of routes was chosen, including Major Routes, Minor Routes, and Northern Routes. Some routes have experienced significant passenger declines and related socioeconomic challenges, while others have had more positive experiences.
The routes reviewed in this analysis are:
• Route 7 – Sunshine Coast to Powell River (Earls Cove to Saltery Bay)
• Route 1- Swartz Bay to Tsawwassen
• Route 10 - Inside Passage - Port Hardy to Prince Rupert
• Route 22 – Denman Island to Hornby Island
• Route 23 – Campbell River to Quadra Island
• Route 19 – Nanaimo to Gabriola Island
• Route 5 – Swartz Bay to Southern Gulf Islands (Galiano, Mayne, Pender, Saturna)
• Route 3 - Horseshoe Bay to Langdale / Sunshine Coast
The following variables are assessed for each route/community pair:
• Change in ferry fares
• Change in passenger traffic
• Estimated demand elasticity
• Estimated lost business revenues, GDP, and employment
• Property values (if avail)
• Population (if avail)
Unless otherwise stated, all residential real estate values and sales data are from the Canadian Real Estate Association and BC Real Estate Association, via BC Stats. BC Ferries passenger fares are from BC Ferries’ published fares and Annual Reports. GDP, population, and employment data are from BC Stats.
APPENDIX 1 I CASE STUDIES
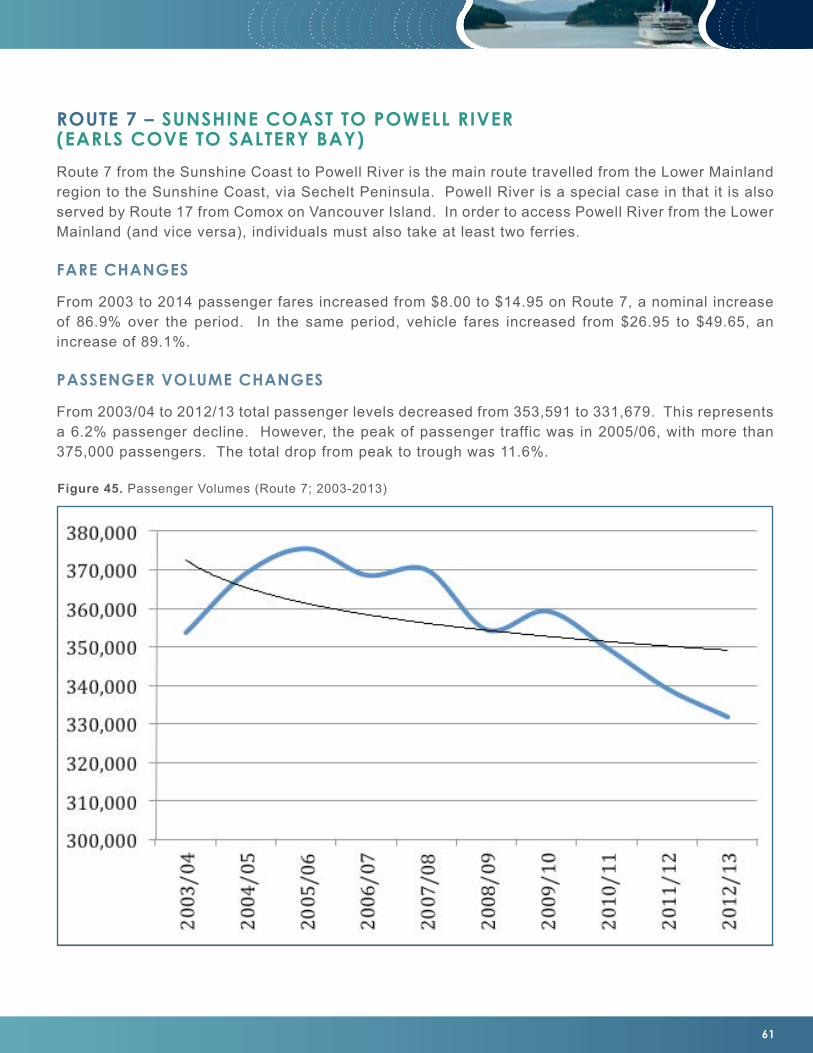
61
ROUTE 7 – SUNSHINE COAST TO POWELL RIVER (EARLS COVE TO SALTERY BAY)
Route 7 from the Sunshine Coast to Powell River is the main route travelled from the Lower Mainland region to the Sunshine Coast, via Sechelt Peninsula. Powell River is a special case in that it is also served by Route 17 from Comox on Vancouver Island. In order to access Powell River from the Lower Mainland (and vice versa), individuals must also take at least two ferries.
FARE CHANGES
From 2003 to 2014 passenger fares increased from $8.00 to $14.95 on Route 7, a nominal increase of 86.9% over the period. In the same period, vehicle fares increased from $26.95 to $49.65, an increase of 89.1%.
PASSENGER VOLUME CHANGES
From 2003/04 to 2012/13 total passenger levels decreased from 353,591 to 331,679. This represents a 6.2% passenger decline. However, the peak of passenger traffic was in 2005/06, with more than 375,000 passengers. The total drop from peak to trough was 11.6%.
Figure 45. Passenger Volumes (Route 7; 2003-2013)
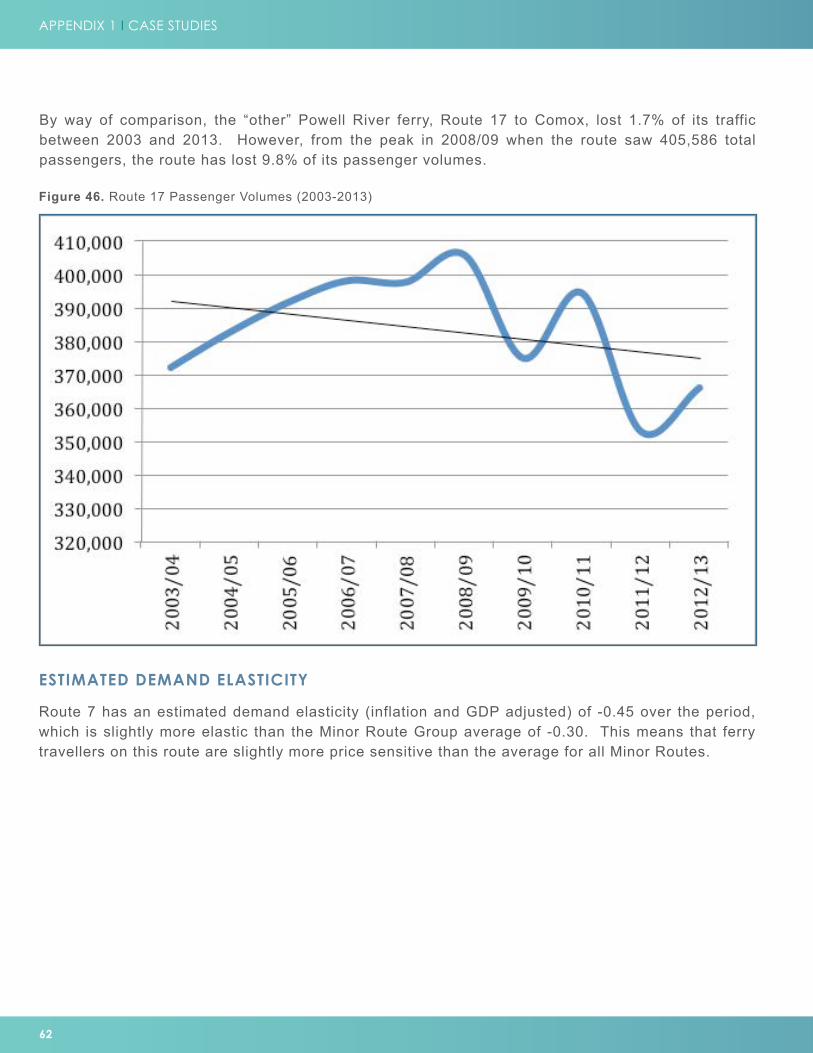
62
ESTIMATED DEMAND ELASTICITY
Route 7 has an estimated demand elasticity (inflation and GDP adjusted) of -0.45 over the period, which is slightly more elastic than the Minor Route Group average of -0.30. This means that ferry travellers on this route are slightly more price sensitive than the average for all Minor Routes.
By way of comparison, the “other” Powell River ferry, Route 17 to Comox, lost 1.7% of its traffic between 2003 and 2013. However, from the peak in 2008/09 when the route saw 405,586 total passengers, the route has lost 9.8% of its passenger volumes.
Figure 46. Route 17 Passenger Volumes (2003-2013)
APPENDIX 1 I CASE STUDIES
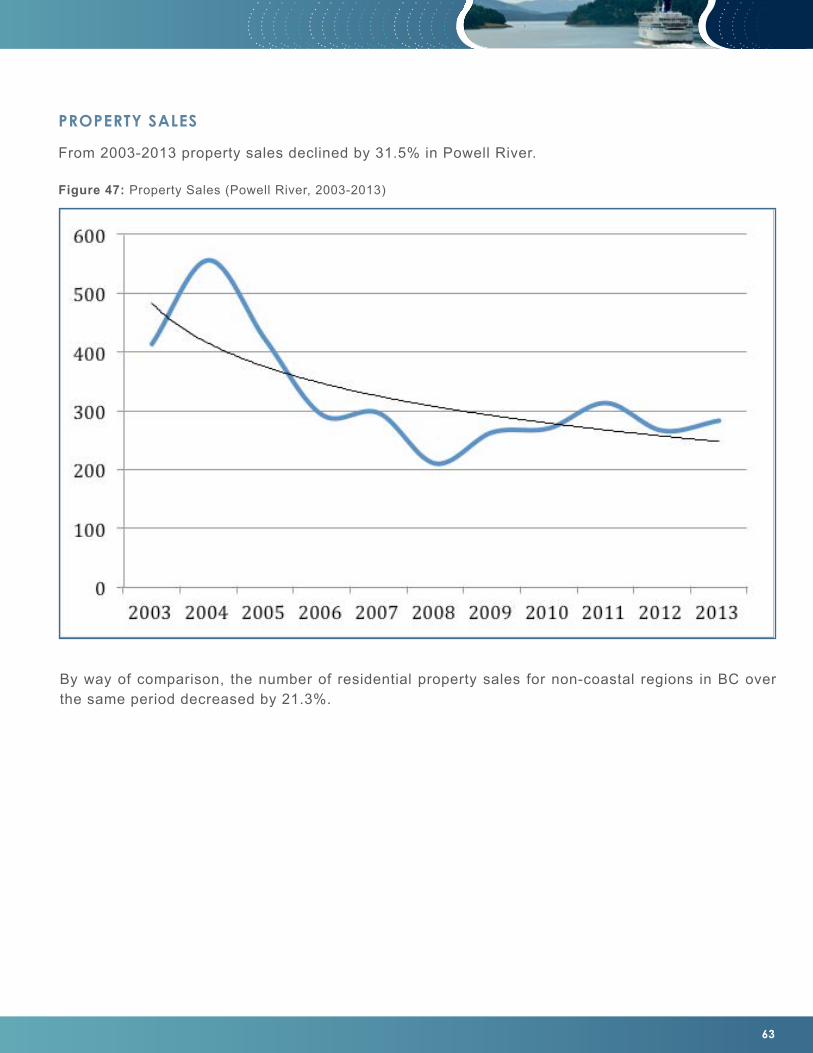
63
By way of comparison, the number of residential property sales for non-coastal regions in BC over the same period decreased by 21.3%.
Figure 47: Property Sales (Powell River, 2003-2013)
PROPERTY SALES
From 2003-2013 property sales declined by 31.5% in Powell River.
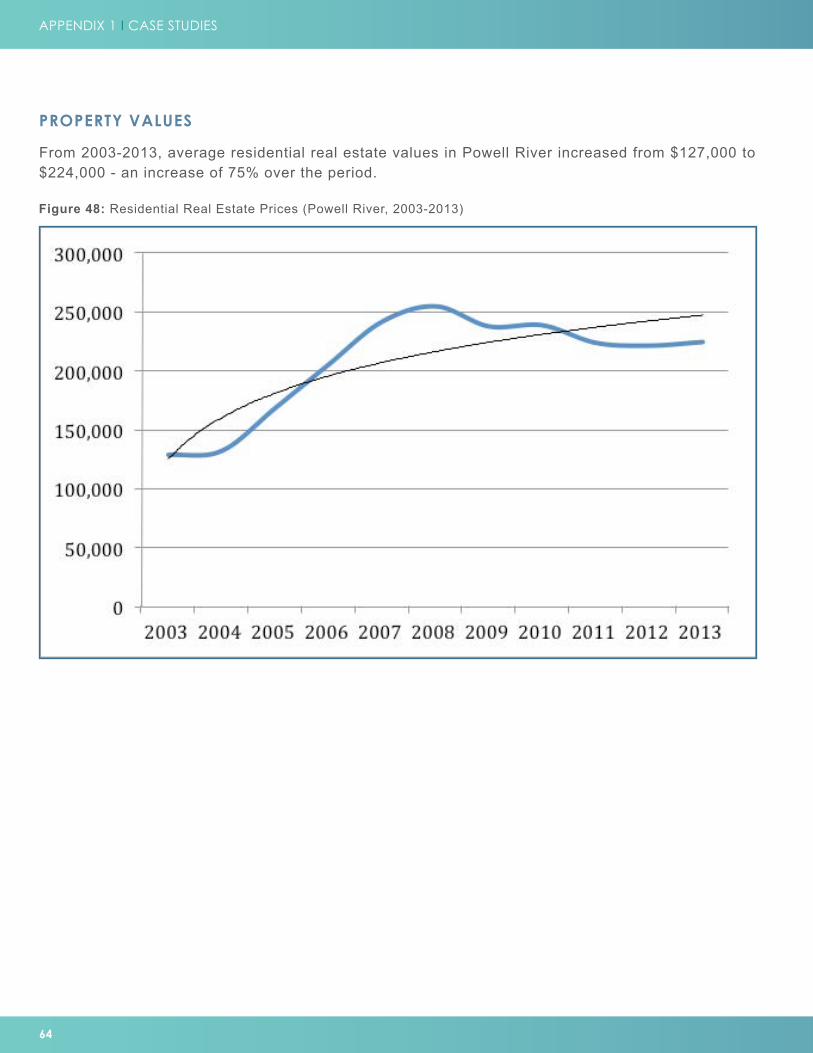
64
PROPERTY VALUES
From 2003-2013, average residential real estate values in Powell River increased from $127,000 to $224,000 - an increase of 75% over the period.
Figure 48: Residential Real Estate Prices (Powell River, 2003-2013)
APPENDIX 1 I CASE STUDIES
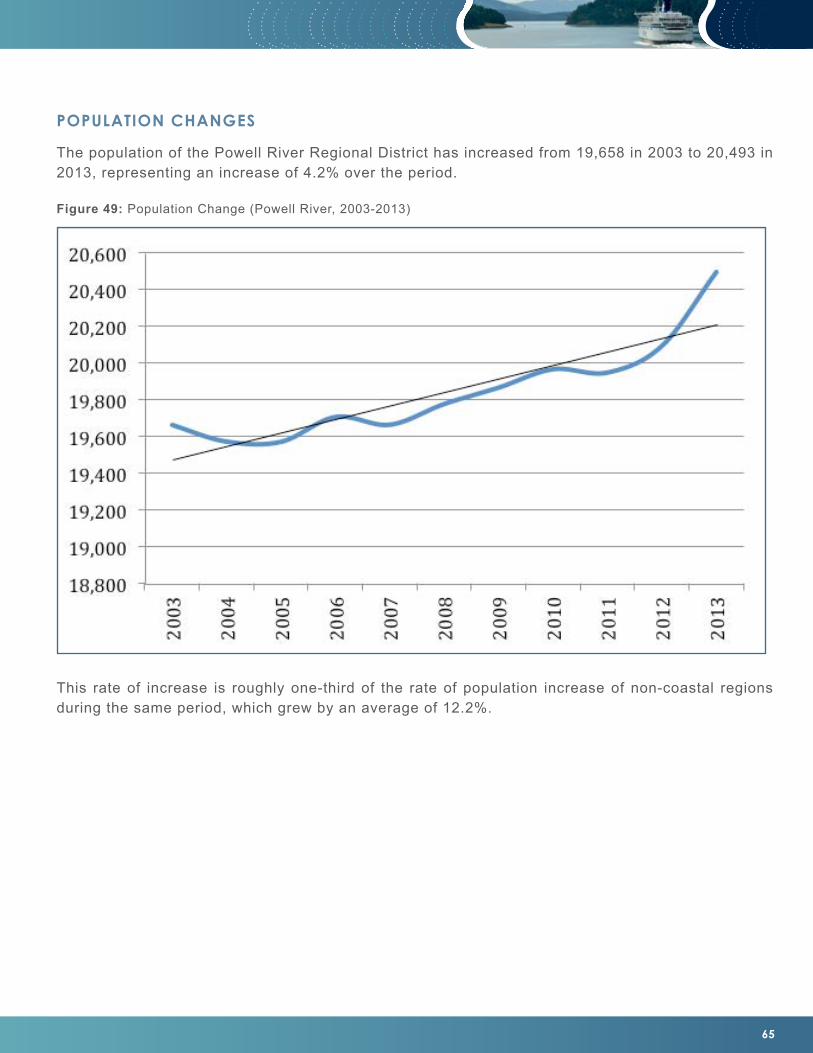
65
POPULATION CHANGES
The population of the Powell River Regional District has increased from 19,658 in 2003 to 20,493 in 2013, representing an increase of 4.2% over the period.
This rate of increase is roughly one-third of the rate of population increase of non-coastal regions during the same period, which grew by an average of 12.2%.
Figure 49: Population Change (Powell River, 2003-2013)
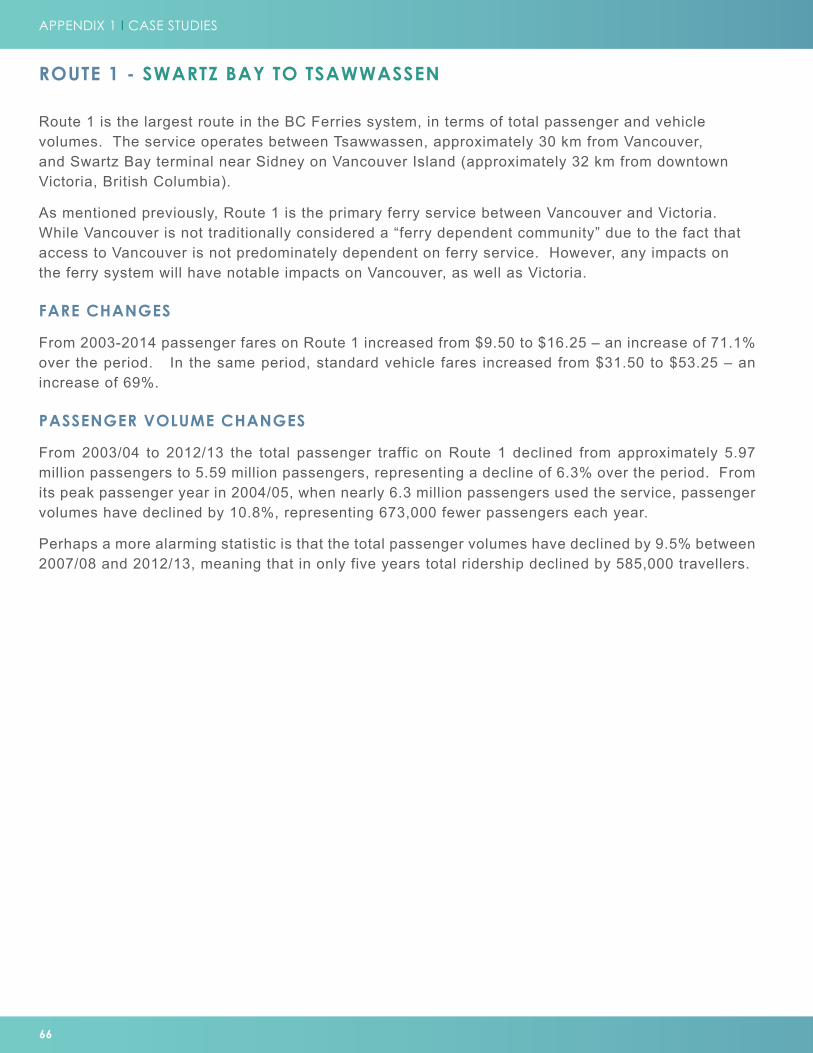
66
ROUTE 1 - SWARTZ BAY TO TSAWWASSEN
Route 1 is the largest route in the BC Ferries system, in terms of total passenger and vehicle volumes. The service operates between Tsawwassen, approximately 30 km from Vancouver, and Swartz Bay terminal near Sidney on Vancouver Island (approximately 32 km from downtown Victoria, British Columbia).
As mentioned previously, Route 1 is the primary ferry service between Vancouver and Victoria. While Vancouver is not traditionally considered a “ferry dependent community” due to the fact that access to Vancouver is not predominately dependent on ferry service. However, any impacts on the ferry system will have notable impacts on Vancouver, as well as Victoria.
FARE CHANGES
From 2003-2014 passenger fares on Route 1 increased from $9.50 to $16.25 – an increase of 71.1% over the period. In the same period, standard vehicle fares increased from $31.50 to $53.25 – an increase of 69%.
PASSENGER VOLUME CHANGES
From 2003/04 to 2012/13 the total passenger traffic on Route 1 declined from approximately 5.97 million passengers to 5.59 million passengers, representing a decline of 6.3% over the period. From its peak passenger year in 2004/05, when nearly 6.3 million passengers used the service, passenger volumes have declined by 10.8%, representing 673,000 fewer passengers each year.
Perhaps a more alarming statistic is that the total passenger volumes have declined by 9.5% between 2007/08 and 2012/13, meaning that in only five years total ridership declined by 585,000 travellers.
APPENDIX 1 I CASE STUDIES
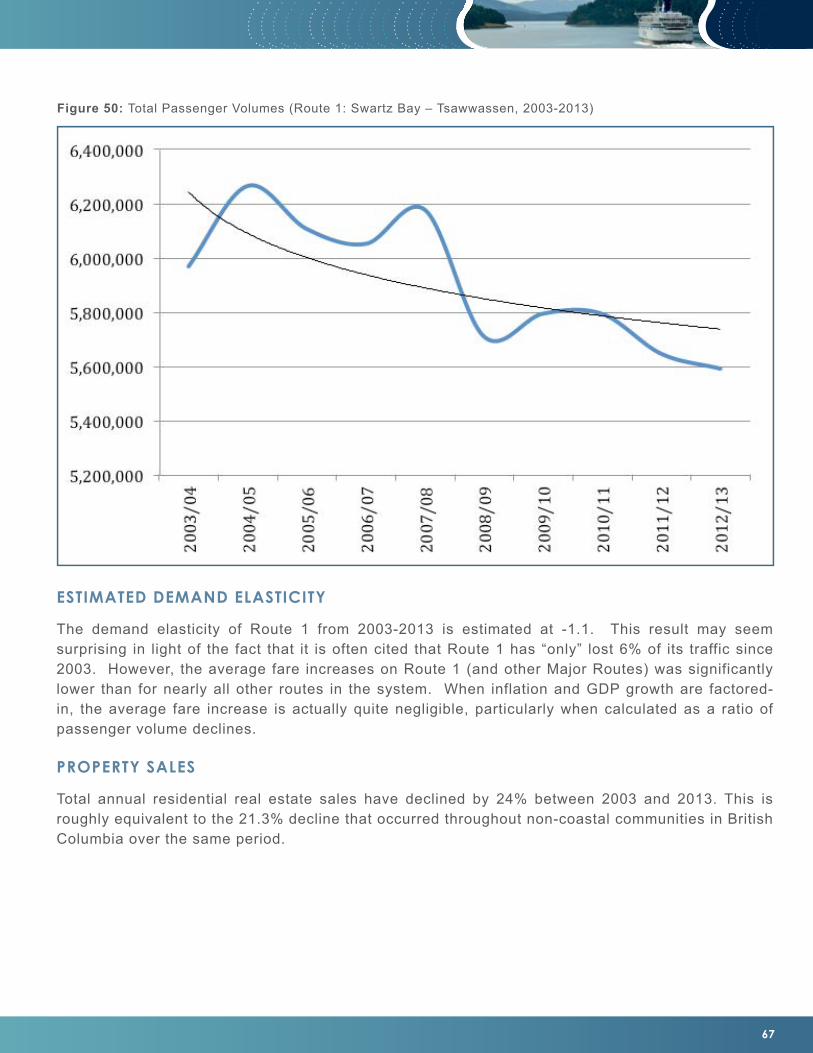
67
Figure 50: Total Passenger Volumes (Route 1: Swartz Bay – Tsawwassen, 2003-2013)
ESTIMATED DEMAND ELASTICITY
The demand elasticity of Route 1 from 2003-2013 is estimated at -1.1. This result may seem surprising in light of the fact that it is often cited that Route 1 has “only” lost 6% of its traffic since 2003. However, the average fare increases on Route 1 (and other Major Routes) was significantly lower than for nearly all other routes in the system. When inflation and GDP growth are factored-in, the average fare increase is actually quite negligible, particularly when calculated as a ratio of passenger volume declines.
PROPERTY SALES
Total annual residential real estate sales have declined by 24% between 2003 and 2013. This is roughly equivalent to the 21.3% decline that occurred throughout non-coastal communities in British Columbia over the same period.
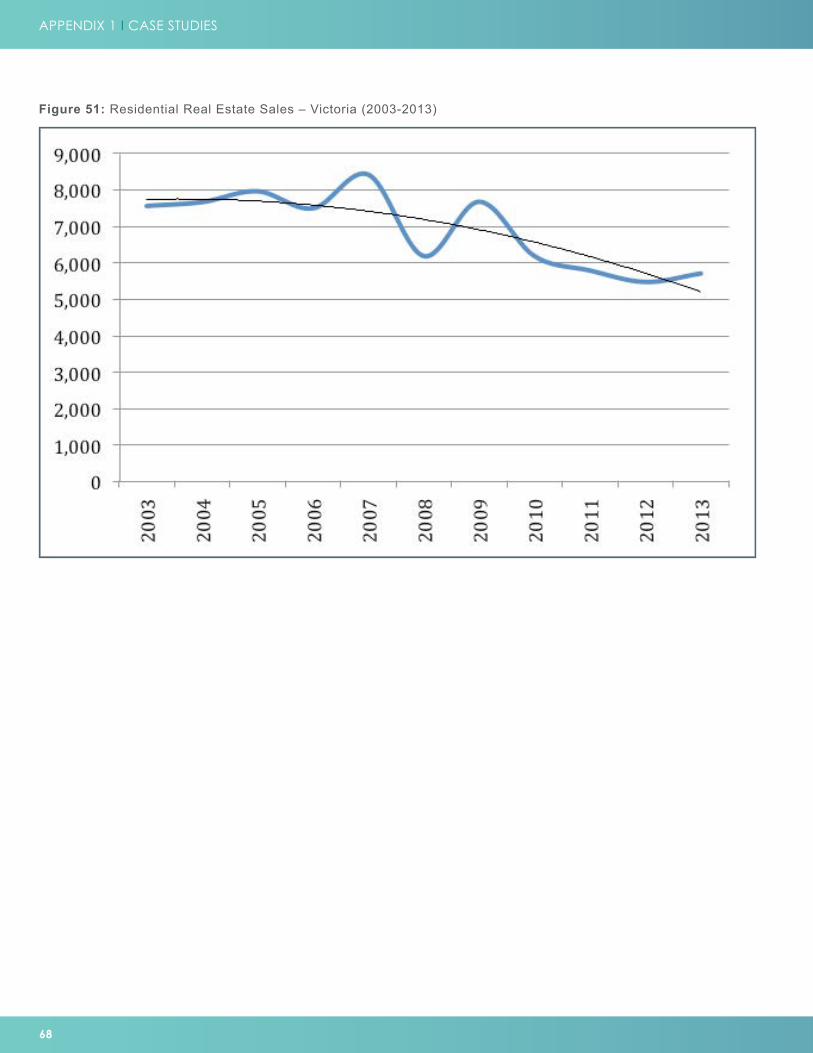
68
Figure 51: Residential Real Estate Sales – Victoria (2003-2013)
APPENDIX 1 I CASE STUDIES
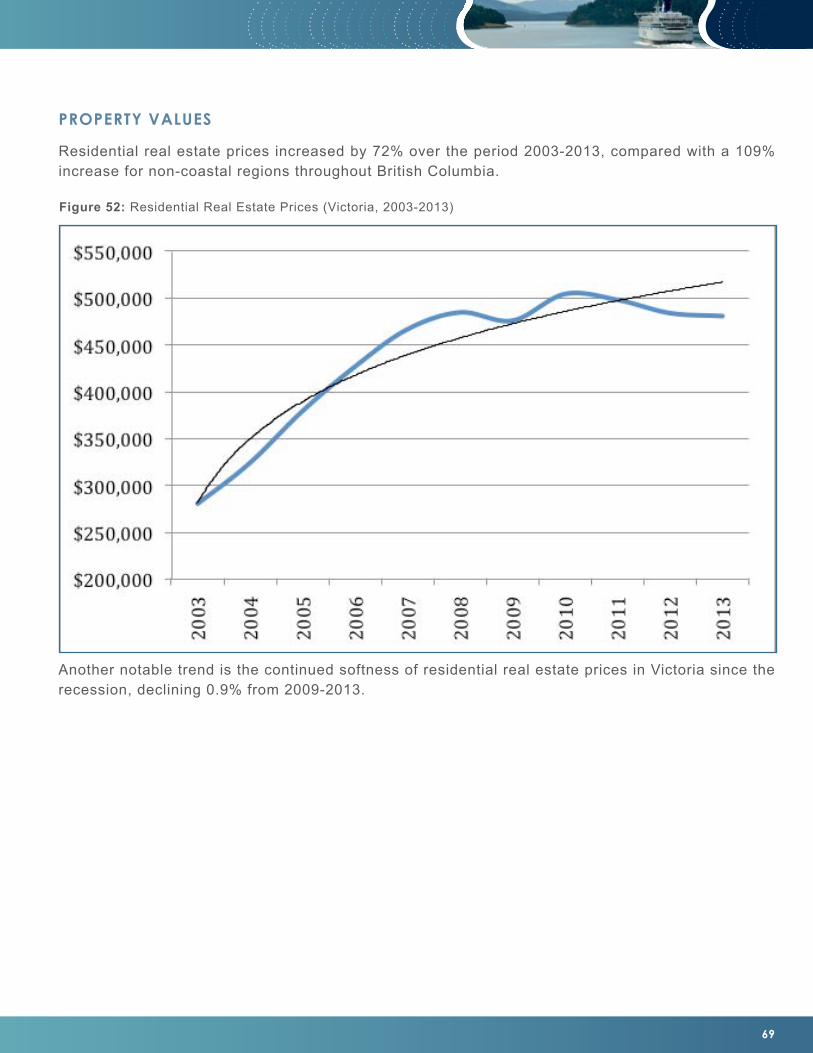
69
PROPERTY VALUES
Residential real estate prices increased by 72% over the period 2003-2013, compared with a 109% increase for non-coastal regions throughout British Columbia.
Another notable trend is the continued softness of residential real estate prices in Victoria since the recession, declining 0.9% from 2009-2013.
Figure 52: Residential Real Estate Prices (Victoria, 2003-2013)
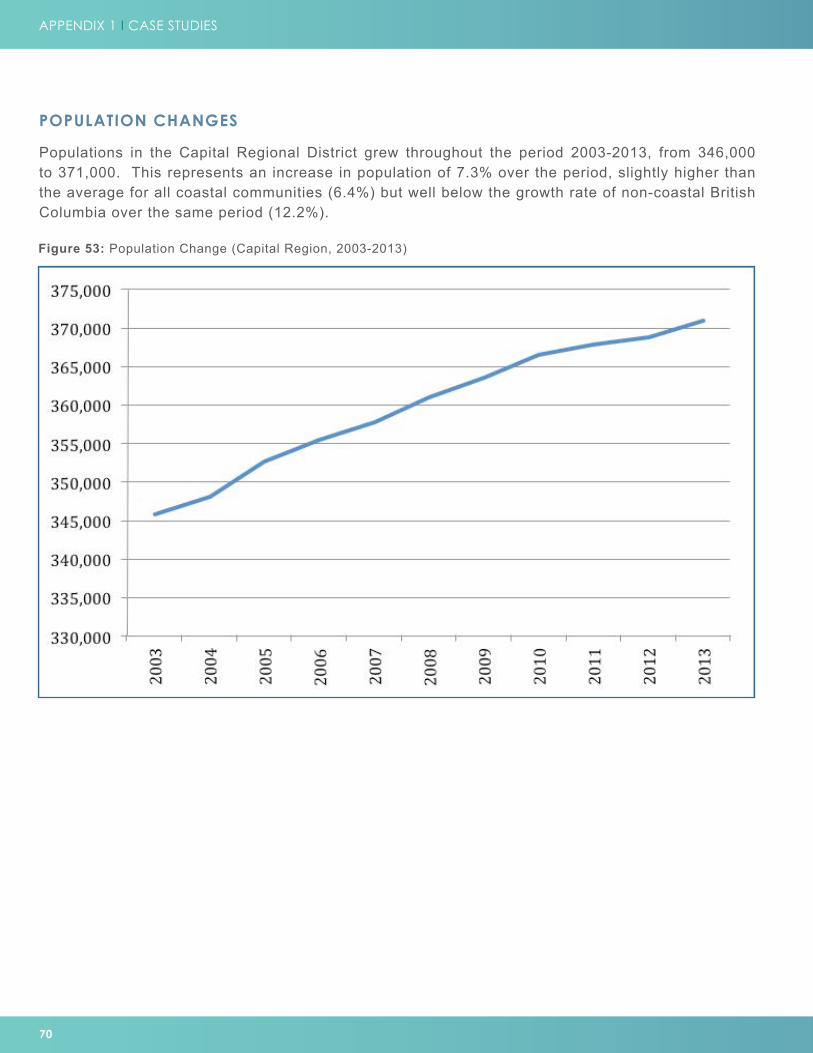
70
POPULATION CHANGES
Populations in the Capital Regional District grew throughout the period 2003-2013, from 346,000 to 371,000. This represents an increase in population of 7.3% over the period, slightly higher than the average for all coastal communities (6.4%) but well below the growth rate of non-coastal British Columbia over the same period (12.2%).
Figure 53: Population Change (Capital Region, 2003-2013)
APPENDIX 1 I CASE STUDIES

71
ROUTE 10 - INSIDE PASSAGE - PORT HARDY TO PRINCE RUPERT
Route 10 is the longest and most expensive route in the BC Ferries system, travelling 274 nautical miles (507 kilometres) between Port Hardy on the northern end of Vancouver Island, and Prince Rupert in Northwestern BC.
Route 10 is a heavily travelled service that is a major tourism “Circle Route” connector for northern Vancouver Island, the Central Coast, and the North Coast, including not only Prince Rupert but also connecting traffic travelling to Haida Gwaii.
FARE CHANGES
Route 10 has had significant fare increases for both passengers and vehicles, due to the fact that the route had a lower relative cost recovery ratio than most other routes in the system, and the provincial government has sought to improve the cost recovery ratio for all Minor Routes and Northern Routes since 2003.
Since 2003, peak season passenger fares have increased from $99.00 (one-way) to $197.50 – an increase of 100% in ten years.
In the same period, peak season vehicle fares increased from $223 (one-way) to $451 representing an increase of 102%.
PASSENGER VOLUME CHANGES
Route 10 has experienced the sharpest drop-off in passenger volume out of all BC Ferries routes since 2003, losing 37.7% of its ridership over the period.

72
It should be noted that in 2006/07 ridership declined significantly due to the loss of the queen of the north and resulting capacity constraints.
ESTIMATED DEMAND ELASTICITY
Route 10 between Prince Rupert and Port Hardy has the highest demand elasticity of all the routes in BC Ferries, estimated at -1.24. This means that for every 1% increase in fares, we can expect a 1.24% reduction in passenger demand.
This conforms with economic theory, which has demonstrated that, all things equal, more expensive items are more elastic, as a similar percentage increase in price will have a relatively higher overall price increase. For example, an 20% increase in the price of a candy bar from $1.00 to $1.20 will not result in as significant a demand reduction as a 20% increase in the price of a television from $1,000 to $1,200.
PROPERTY SALES/VALUES AND POPULATION CHANGES
Due to the context and orientation of Route 10 being primarily a non-primary linkage to major population centres for the North Island, Prince Rupert, and the Central Coast, it is not advisable to assess linkages between fares or passenger volumes with downstream impacts in areas such as real estate and population migration.
Figure 54: Passenger Volumes (Route 10, 2003-2013)
APPENDIX 1 I CASE STUDIES
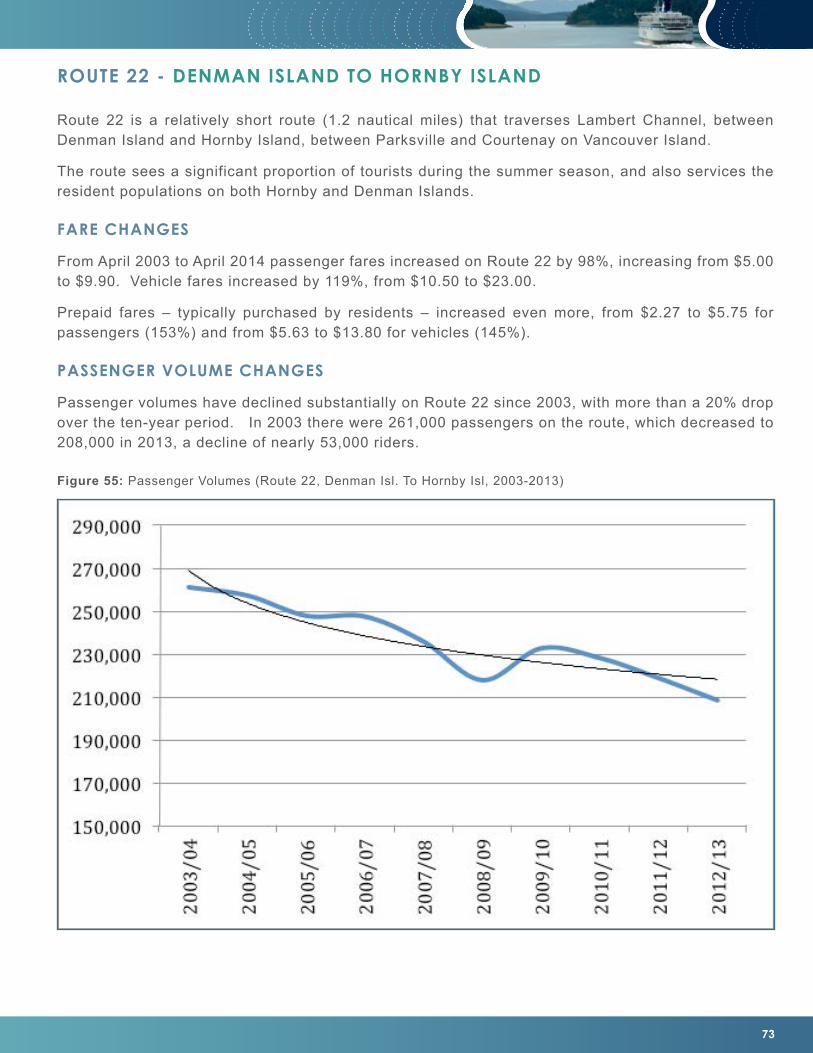
73
ROUTE 22 - DENMAN ISLAND TO HORNBY ISLAND
Route 22 is a relatively short route (1.2 nautical miles) that traverses Lambert Channel, between Denman Island and Hornby Island, between Parksville and Courtenay on Vancouver Island.
The route sees a significant proportion of tourists during the summer season, and also services the resident populations on both Hornby and Denman Islands.
FARE CHANGES
From April 2003 to April 2014 passenger fares increased on Route 22 by 98%, increasing from $5.00 to $9.90. Vehicle fares increased by 119%, from $10.50 to $23.00.
Prepaid fares – typically purchased by residents – increased even more, from $2.27 to $5.75 for passengers (153%) and from $5.63 to $13.80 for vehicles (145%).
PASSENGER VOLUME CHANGES
Passenger volumes have declined substantially on Route 22 since 2003, with more than a 20% drop over the ten-year period. In 2003 there were 261,000 passengers on the route, which decreased to 208,000 in 2013, a decline of nearly 53,000 riders.
Figure 55: Passenger Volumes (Route 22, Denman Isl. To Hornby Isl, 2003-2013)
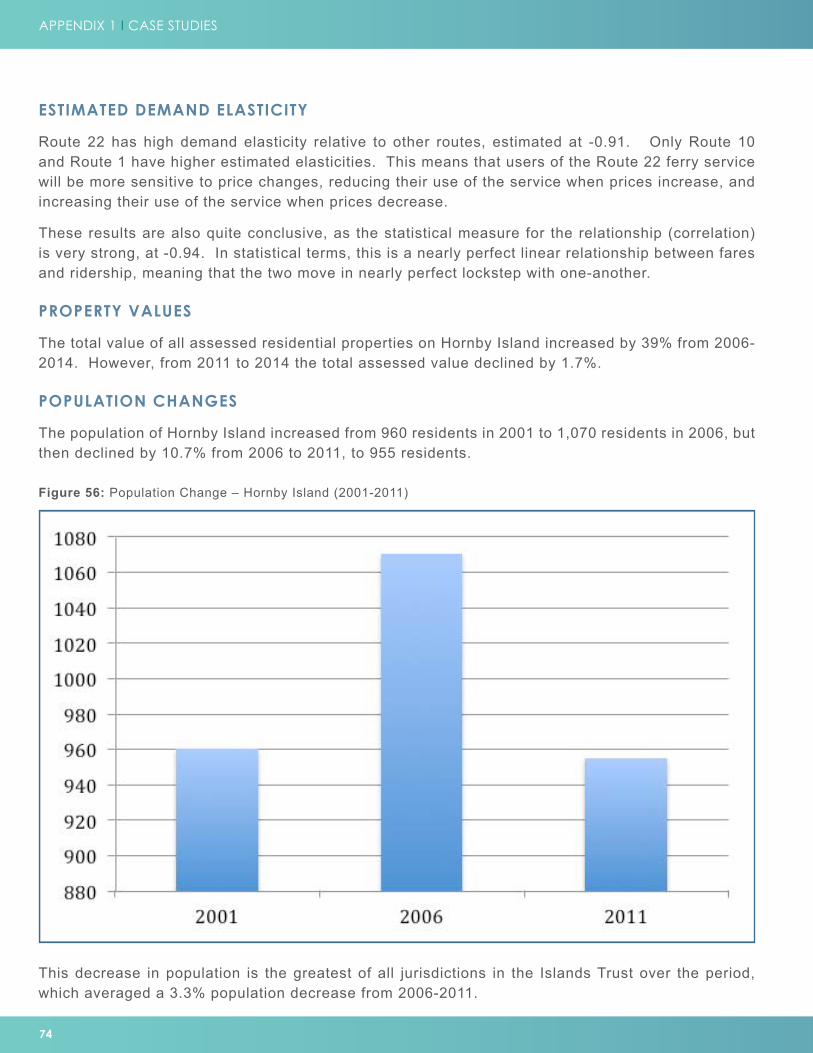
74
ESTIMATED DEMAND ELASTICITY
Route 22 has high demand elasticity relative to other routes, estimated at -0.91. Only Route 10 and Route 1 have higher estimated elasticities. This means that users of the Route 22 ferry service will be more sensitive to price changes, reducing their use of the service when prices increase, and increasing their use of the service when prices decrease.
These results are also quite conclusive, as the statistical measure for the relationship (correlation) is very strong, at -0.94. In statistical terms, this is a nearly perfect linear relationship between fares and ridership, meaning that the two move in nearly perfect lockstep with one-another.
PROPERTY VALUES
The total value of all assessed residential properties on Hornby Island increased by 39% from 2006-2014. However, from 2011 to 2014 the total assessed value declined by 1.7%.
POPULATION CHANGES
The population of Hornby Island increased from 960 residents in 2001 to 1,070 residents in 2006, but then declined by 10.7% from 2006 to 2011, to 955 residents.
This decrease in population is the greatest of all jurisdictions in the Islands Trust over the period, which averaged a 3.3% population decrease from 2006-2011.
Figure 56: Population Change – Hornby Island (2001-2011)
APPENDIX 1 I CASE STUDIES
75
ROUTE 23 - CAMPBELL RIVER TO QUADRA ISLAND
Route 23 is a highly travelled route between Campbell River and Quadra Island. The ferry travels a relatively short distance of approximately two kilometres across the Discovery Passage.
FARE CHANGES
Fares on Route 23 have also increased substantially, percentage-wise. In 2003 the standard off-peak passenger fare was $4.75, while the vehicle fare was $11.00. By April 2014 the passenger fare increased to $9.90 (+108% over 2003) while vehicle fares increased to $23.00 (+109% over 2003).
PASSENGER VOLUME CHANGES
Passenger volumes also declined substantially on Route 23 over the ten-year period of 2003 to 2013, decreasing from 923,000 travellers in 2003 to 785,000 travellers in 2013. This represents a passenger decline of 15.2% over the period, or 140,000 fewer travellers each year.
An interesting finding from the analysis of passenger volume changes relative to fares is that Route 23 had the strongest correlation between fare increases and passenger volume declines. The correlation between fare increases and ridership declines was -0.96, nearly a perfect linear relationship between the two variables.
ESTIMATED DEMAND ELASTICITY
The demand elasticity for Route 23 from 2003-2013 is estimated at -0.67, which is more than double the rate of the Minor Routes overall (-0.30). This means that for every 10% increase in fares (inflation and GDP-adjusted), we can expect to see a 6.7% decrease in overall ridership.
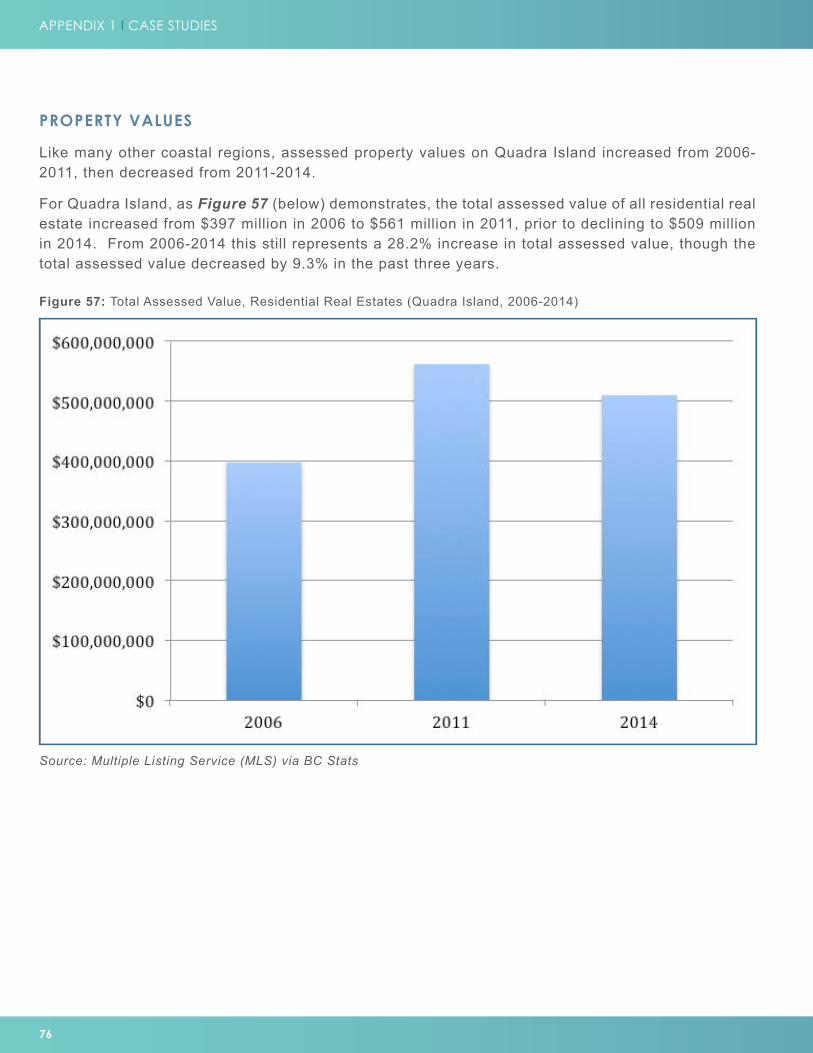
76
PROPERTY VALUES
Like many other coastal regions, assessed property values on Quadra Island increased from 2006-2011, then decreased from 2011-2014.
For Quadra Island, as Figure 57 (below) demonstrates, the total assessed value of all residential real estate increased from $397 million in 2006 to $561 million in 2011, prior to declining to $509 million in 2014. From 2006-2014 this still represents a 28.2% increase in total assessed value, though the total assessed value decreased by 9.3% in the past three years.
Figure 57: Total Assessed Value, Residential Real Estates (Quadra Island, 2006-2014)
Source: Multiple Listing Service (MLS) via BC Stats
APPENDIX 1 I CASE STUDIES

77
POPULATION CHANGES
The population trend of Quadra Island has been somewhat counter to that of other coastal communities, registering a 3% decline from 2,555 residents to 2,470 residents between 2001 and 2011, before increasing to 2,601 residents in 2011. Over the ten year period, the population increased by 5.3%.
Figure 58: Population Changes (Quadra Island, 2001-2011)
Source: BC Stats
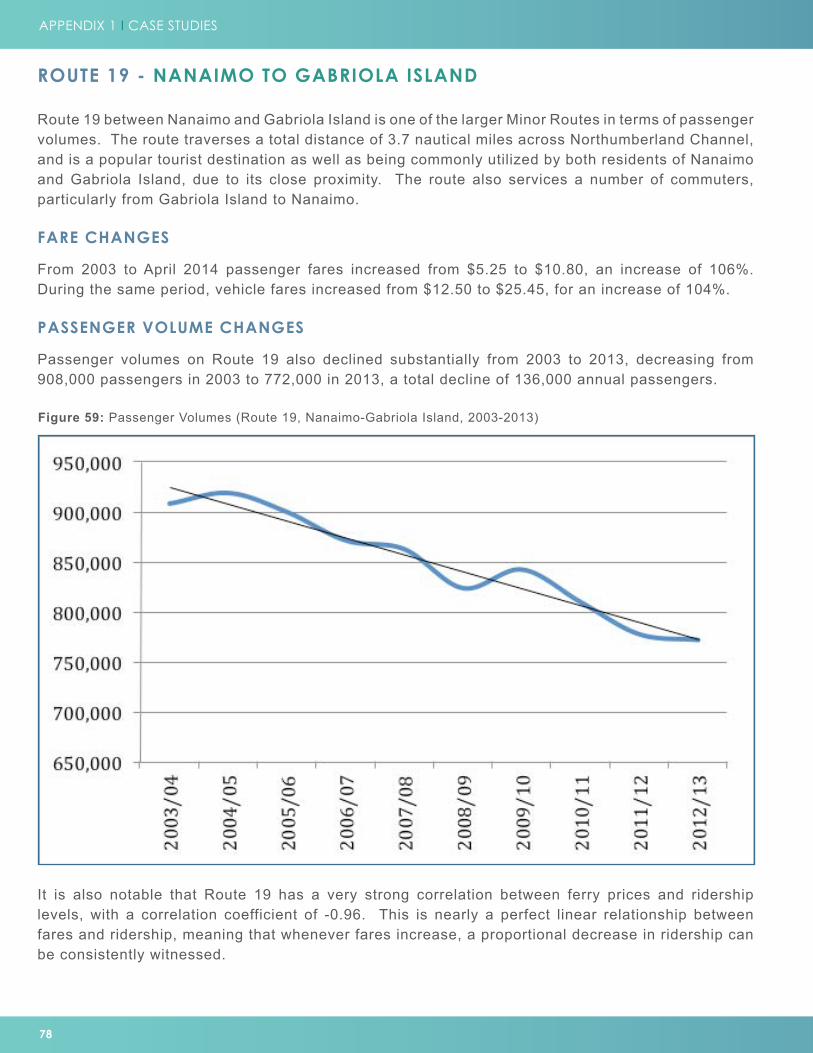
78
ROUTE 19 - NANAIMO TO GABRIOLA ISLAND
Route 19 between Nanaimo and Gabriola Island is one of the larger Minor Routes in terms of passenger volumes. The route traverses a total distance of 3.7 nautical miles across Northumberland Channel, and is a popular tourist destination as well as being commonly utilized by both residents of Nanaimo and Gabriola Island, due to its close proximity. The route also services a number of commuters, particularly from Gabriola Island to Nanaimo.
FARE CHANGES
From 2003 to April 2014 passenger fares increased from $5.25 to $10.80, an increase of 106%. During the same period, vehicle fares increased from $12.50 to $25.45, for an increase of 104%.
PASSENGER VOLUME CHANGES
Passenger volumes on Route 19 also declined substantially from 2003 to 2013, decreasing from 908,000 passengers in 2003 to 772,000 in 2013, a total decline of 136,000 annual passengers.
It is also notable that Route 19 has a very strong correlation between ferry prices and ridership levels, with a correlation coefficient of -0.96. This is nearly a perfect linear relationship between fares and ridership, meaning that whenever fares increase, a proportional decrease in ridership can be consistently witnessed.
Figure 59: Passenger Volumes (Route 19, Nanaimo-Gabriola Island, 2003-2013)
APPENDIX 1 I CASE STUDIES
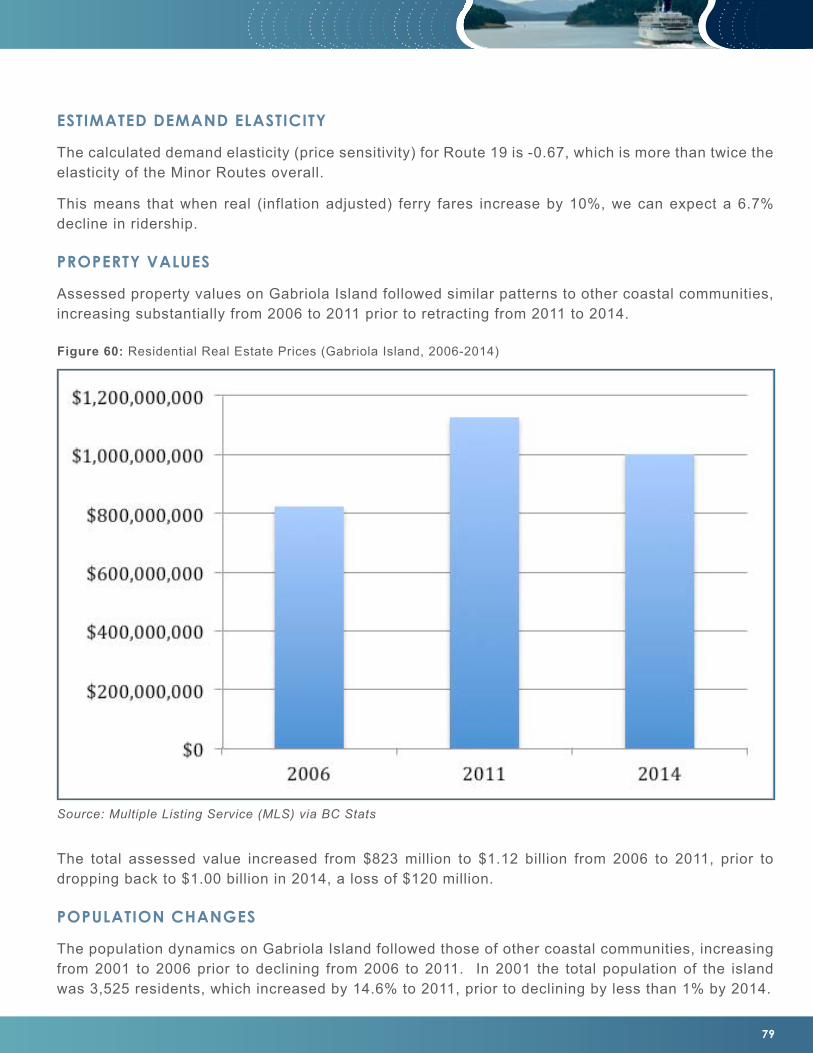
79
ESTIMATED DEMAND ELASTICITY
The calculated demand elasticity (price sensitivity) for Route 19 is -0.67, which is more than twice the elasticity of the Minor Routes overall.
This means that when real (inflation adjusted) ferry fares increase by 10%, we can expect a 6.7% decline in ridership.
PROPERTY VALUES
Assessed property values on Gabriola Island followed similar patterns to other coastal communities, increasing substantially from 2006 to 2011 prior to retracting from 2011 to 2014.
The total assessed value increased from $823 million to $1.12 billion from 2006 to 2011, prior to dropping back to $1.00 billion in 2014, a loss of $120 million.
POPULATION CHANGES
The population dynamics on Gabriola Island followed those of other coastal communities, increasing from 2001 to 2006 prior to declining from 2006 to 2011. In 2001 the total population of the island was 3,525 residents, which increased by 14.6% to 2011, prior to declining by less than 1% by 2014.
Figure 60: Residential Real Estate Prices (Gabriola Island, 2006-2014)
Source: Multiple Listing Service (MLS) via BC Stats

80
ROUTE 5 - SWARTZ BAY TO SOUTHERN GULF ISLANDS (GALIANO, MAYNE, PENDER, SATURNA
The ferry from Swartz Bay (Vancouver Island) to the Southern Gulf Islands is one of two services to the Southern Gulf Islands, alongside Route 9 (from Tsawwassen). The two routes combined carry nearly one million passengers per year, making them among the largest of the Minor Routes.
As Route 5 and Route 9 have similar price histories and passenger volume changes, Route 5 will be used to describe the overall situation for the Southern Gulf Islands.
FARE CHANGES
Passenger fares along Route 5 increased by 102% from 2003 to 2014, from $6.25 to $12.60. Vehicle fares similarly increased by 102% over the same period, increasing from $19.50 to $39.45.
PASSENGER VOLUME CHANGES
Ridership of Route 5 declined by approximately 46,000 passengers between 2003 and 2013, representing a 9.2% drop, which is slightly lower than the average for all minor routes.
There is a relatively strong correlation between fare increases and passenger volumes, with an R-value of -0.85. This means that there is a strong relationship between the changes in fares and the changes in ridership; when fares increase, ridership decreases by a relatively consistent and proportional amount.
Figure 61: Passenger Volumes (Route 5, Swartz Bay to Southern Gulf Islands, 2003-2013)
APPENDIX 1 I CASE STUDIES

81
ESTIMATED DEMAND ELASTICITY
The demand elasticity for Route 5 from 2003 to 2013 was calculated at -0.45, meaning that when fares increase by 10% we can expect a 4.5% decrease in passenger ridership.
This demand elasticity is slightly higher than the average for all minor routes, meaning that users of this route are slightly more sensitive to price increases (and, in theory, price decreases).
PROPERTY VALUES
Total assessed property values on the Southern Gulf Islands all followed similar trends as the majority of coastal communities, increasing substantially from 2006 to 2011, then declining from 2011 to 2014.
For all four islands combined, the total value of residential real estate increased from $1.74 billion to $2.44 billion between 2006 and 2011, prior to declining to $2.08 billion – a drop of 14.7% in only three years.
Figure 62: Total Assessed Real Estate Values – Southern Gulf Islands (2006-2014)
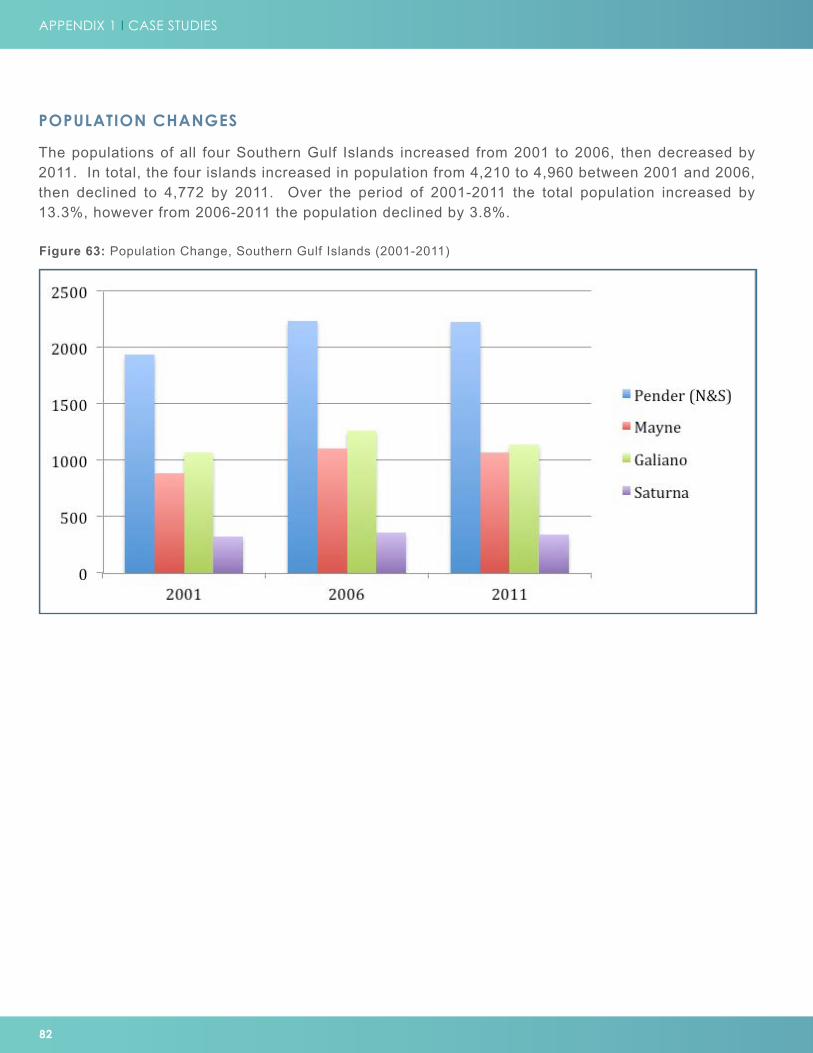
82
POPULATION CHANGES
The populations of all four Southern Gulf Islands increased from 2001 to 2006, then decreased by 2011. In total, the four islands increased in population from 4,210 to 4,960 between 2001 and 2006, then declined to 4,772 by 2011. Over the period of 2001-2011 the total population increased by 13.3%, however from 2006-2011 the population declined by 3.8%.
Figure 63: Population Change, Southern Gulf Islands (2001-2011)
APPENDIX 1 I CASE STUDIES
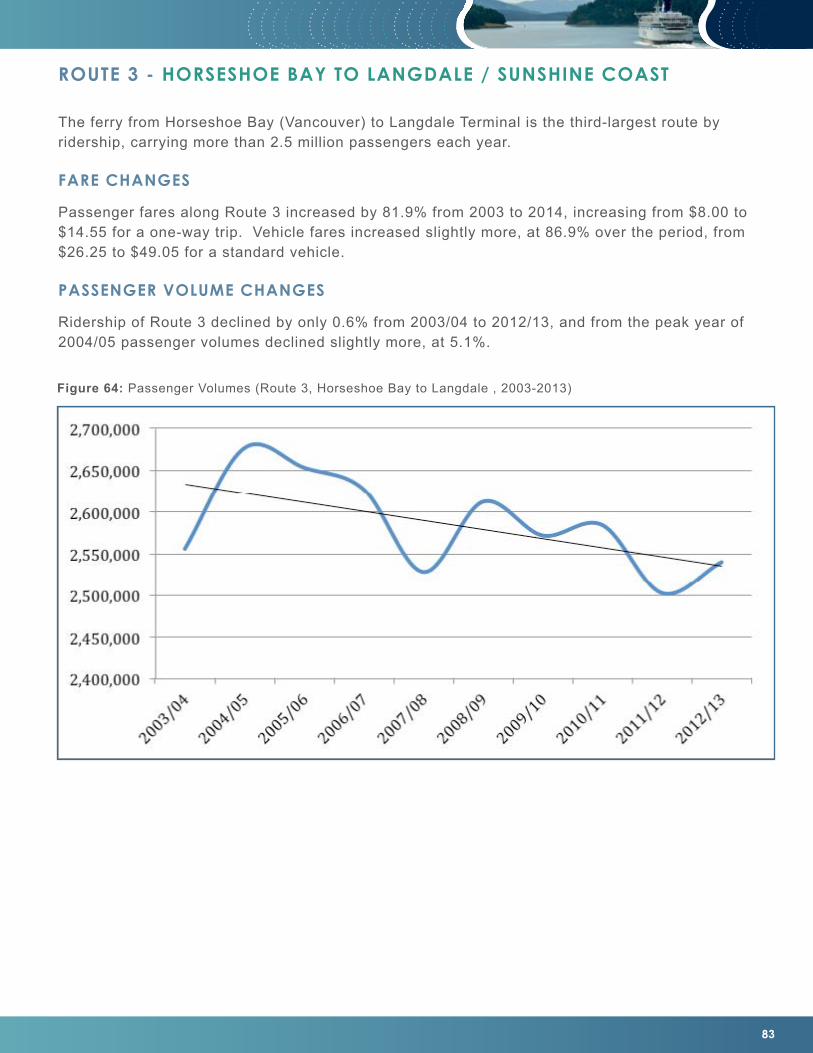
83
ROUTE 3 - HORSESHOE BAY TO LANGDALE / SUNSHINE COAST
The ferry from Horseshoe Bay (Vancouver) to Langdale Terminal is the third-largest route by ridership, carrying more than 2.5 million passengers each year.
FARE CHANGES
Passenger fares along Route 3 increased by 81.9% from 2003 to 2014, increasing from $8.00 to $14.55 for a one-way trip. Vehicle fares increased slightly more, at 86.9% over the period, from $26.25 to $49.05 for a standard vehicle.
PASSENGER VOLUME CHANGES
Ridership of Route 3 declined by only 0.6% from 2003/04 to 2012/13, and from the peak year of 2004/05 passenger volumes declined slightly more, at 5.1%.
Figure 64: Passenger Volumes (Route 3, Horseshoe Bay to Langdale , 2003-2013)

84
PROPERTY VALUES
Property values on the Sunshine Coast followed similar trends as other coastal regions, increasing in the earlier portion of the study period then flatlining and even declining in more recent years.
According to the MLS, property values on the Sunshine Coast increased from its Home Price Index (HPI®) of 1.3.6 in May 2005 to a high of 131.3 in April 2011 – an increase of 27.7%. This was followed by a slight decline of 7.7% from April 2011 to May 2014.
Figure 65: Property Values – Sunshine Coast
APPENDIX 1 I CASE STUDIES
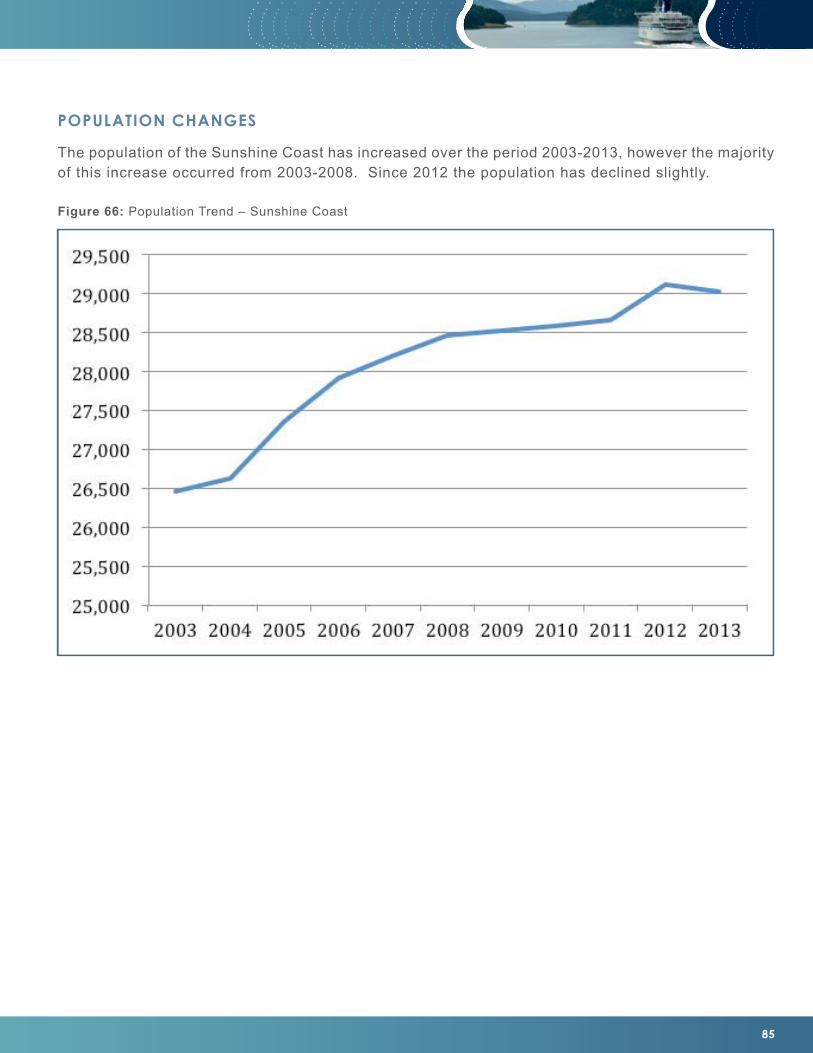
85
POPULATION CHANGES
The population of the Sunshine Coast has increased over the period 2003-2013, however the majority of this increase occurred from 2003-2008. Since 2012 the population has declined slightly.
Figure 66: Population Trend – Sunshine Coast

86
END NOTES
END NOTES
i Michael Bennion, for Washington State Department of Transportation, “A Comparison of Operational Performance: Washington State Ferries to Ferry Operators Worldwide,” June 2010 http://www.wsdot.wa.gov/research/reports/fullreports/750.1.pdf
ii Government of British Columbia, “Coastal Ferries Engagement Plan,” p. 2. Fall 2013. http://www.coastalferriesengagement.ca
iii Hotel News Now, “Comparing Customer Satisfaction Across Sectors,” October 2012, http://www.hotelnewsnow.com/Article/9096/Comparing-customer-satisfaction-across-sectors
iv Different organizations account for farebox recovery with different methods, with some using all revenue sources and others using only tariff revenues (from fares). Capital costs should not be included in farebox recovery calculations. The estimate for BC Ferries in Bennion (Ibid.) for BC Ferries appears to include capital costs, despite the report defining farebox recovery as being only tariff revenue as a percentage of operating expenses. Farebox recovery rates of other operators that were not taken from the Bennion report used tariff revenue as a percentage of operating costs (excluding capital).
v Bennion, op. cit., p. 58.
vi New Zealand Ministry of Transport, “Access to the transport system: Accessibility of public transport – AM023 Farebox Recovery Rates: National Totals,” http://www.transport.govt.nz/ourwork/tmif/accesstothetransportsystem/am023/
vii Bennion, op. cit., p. 58.
viii Washington State Ferries, “FY2012 Route Statements,” http://www.wsdot.wa.gov/NR/rdonlyres/E1B562C1-D1A9-41CD-A9A9-AF5815BF2DD4/0/RouteStatementsAndAnalysis20072012Final.pdf
ix Wikipedia, “Farebox Recovery Ratio,” http://en.wikipedia.org/wiki/Farebox_recovery_ratio
x Wikipedia, Ibid.
xi Bennion, op. cit., p. 58.
xii BC Transit, “Annual Report 2012/13,” http://www.bcbudget.gov.bc.ca/Annual_Reports/2012_2013/pdf/agency/bctransit.pdf, p. 1.
xiii Bennion, op. cit., p. 58.
xiv Washington State Ferries, “FY 2012 Route Statements,” p. 2. http://www.wsdot.wa.gov/NR/rdonlyres/E1B562C1-D1A9-41CD-A9A9-AF5815BF2DD4/0/RouteStatementsAndAnalysis20072012Final.pdf
xv Washington State Ferries, Ibid., p. 3.
xvi Sources: Highway traffic data are taken directly from the BC Ministry of Transportation Traffic Data Program, at http://www.th.gov.bc.ca/trafficData/. Airport volumes are from published
87
Annual Reports of Vancouver International Airport (www.yvr.ca), Victoria International Airport (www.victoriaairport.com), and Comox Valley Airport (www.comoxairport.com).
xvii Source: BC Ministry of Transportation, direct communication (April 2014).
xviii This analysis updates the comprehensive analysis of the “Oceans Sector Economy” in British Columbia. See Glislason et al., “Economic Contribution of the Oceans Sector in British Columbia,” April 2007. The report uses the Statistics Canada Provincial Input-Output Model (2003) which has similar economic multipliers as the current BC Stats multipliers (2004) in use. These multipliers will have changed in the past ten years, though the analysis still provides relatively reliable estimates beyond an order of magnitude level. This analysis should be updated with the release of the BC Stats I/O Model, which will use multipliers from 2010 economic indicators.
xix Statistics Canada, “Travel Survey of Residents of Canada,” June 2014. http://www23.statcan.gc.ca/imdb/p2SV.pl?Function=getSurvey&SDDS=3810
xx Statistics Canada, “International Travel Survey,” June 2014. http://www.statcan.gc.ca/eng/survey/household/3152
xxi Economic Planning Group, “BC Ferries: Economic Impact Analysis,” p. ii, September 2000. (Prepared for BC Ferries Strategic and Corporate Planning Department). http://foi.bcferries.com/2014-063-responsiverecord.pdf
xxii Destination British Columbia, “Regional Tourism Profile – Vancouver Island,” April 2013. http://www.destinationbc.ca/getattachment/Research/Research-by-Region/Vancouver-Island/RegionalProfiles_Vancouver-Island.pdf.aspx
xxiii BC Stats, “Estimating the Size of British Columbia’s Tourism Sector,” p. 14. , 2009. http://www.bcstats.gov.bc.ca/Files/1a9ce086-a0e0-4e48-9e38-70feee3c58a2/MeasuringtheSizeofBritishColumbiasTourismSector.pdf
xxiv Vancouver Island travel patterns and expenditures are used in these economic impact estimates because the majority of ferry travellers are travelling to or from the Vancouver Island region, which includes the Gulf Islands and some regions of the Georgia Strait North.
xxv It is recognized that some travellers will only take one ferry if they use different modes of transport to enter and/or exit a ferry dependent community, (e.g., taking a ferry to Vancouver Island then flying out of Victoria), and some will take more than two ferries for each travel event, particularly those visiting and/or departing from Minor Route communities.
xxvi It should be noted that Experience Cards are not used on the Major Routes. The estimates assume that the proportion of discretionary traffic (non E-card users) is the same on the Majors and the Minors.
xxvii For these estimates, Ontario’s Tourism Regional Economic Impact Model (TREIM) is used. http://www.mtc.gov.on.ca/en/research/treim/treim.shtml. Due to the similarities in the structure of the two province’s tourism sectors, particularly the ratios of industry group revenues to total sector revenues, as well as similar compensation structures, the TREIM
88
END NOTES
was utilized for this analysis. The TREIM also uses more current data sources than British Columbia’s I/O model (TREIM data have been updated with 2009 ITS and TSRC data). To validate these estimates, a subsequent run of these figures should be undertaken with the BC Stats I/O Model, which was being updated at the time of report development.
xxviii United States Transportation Research Board, “Guidebook for Assessing the Social and Economic Effects of Transportation Projects,” 2001, p. 3.
xxix BC Stats, in constant 2007 dollars. Note that forestry and logging GDP excludes wood products manufacturing and pulp & paper manufacturing.
xxx Taxation impacts are estimated using ratios established through the BC Input-Output Model, from Destination BC, “Economic Value of the Commercial Nature-Based Tourism Industry in British Columbia,” September 2004. http://www.destinationbc.ca/getattachment/Research/Research-by-Activity/Land-based/Economic_Impacts_of_Commercial_Nature-Based_Tourism_Report-sflb.pdf.aspx
xxxi See Seaspan Coastal Intermodal Company, “Response to British Columbia Ferry Service Inc’s Submission to the BC Ferry Commissioner Regarding Section 45.1(1) of the Coastal Ferry Act and Drop-Trailer Service,” p. 14, November 26, 2010. http://www.bcferrycommission.com/wp-content/uploads/2011/05/s43-69/s45-SCIC_Submission_to_BCFC_2010-11-26.pdf
xxxii BC Stats, “Consumer Price Index latest monthly periodical, Highlights,” April 2014, http://www.bcstats.gov.bc.ca/Files/498df2fa-75fc-48ce-aa1c-eaf6dfe3dcef/ConsumerPriceIndex-HighlightsApril2014.pdf
xxxiii Wikipedia, “Price elasticity of demand,” http://en.wikipedia.org/wiki/Price_elasticity_of_demand.
xxxiv Mark P. Pritchard, “Tourist price sensitivity and the elasticity of demand: The case of BC ferries,” in e-Review of Tourism Research Vol. 1, No. 4, 2003. http://ertr.tamu.edu/files/2012/09/275_a-1-4-4.pdf
xxxv Bennion, op. cit., p. 32.
xxxvi InterVISTAS Consulting, “Performance Term 3 Forecast and Measurement of Demand Elasticity for British Columbia Ferry Services Inc.,” May 2011. http://www.bcferrycommission.com/wp-content/uploads/2011/07/InterVISTAS-Traffic-forecast-report-for-BCFS.pdf
xxxvii Elasticities are adjusted for inflation and GDP. Price increases are based on the published fare index of the BC Ferry Commissioner, except for individual routes, for which data is from the Ferry Advisory Committee Chairs.
xxxviii This assumes no major change in other factors such as population, incomes, and total GDP. It also adjusts prices based on inflation and income (represented by GDP).
xxxix As noted in the InterVISTAS report (2011, op. cit.) using regression analysis for projections can be made more challenging by “simultaneous equations” issues, wherein changes in one
89
variable (say, price) may alter another variable (demand), which could lead to alteration in the future supply and therefore demand and price. This can be ameliorated using 2-Stage Least Squares (2SLS) regression analysis. Due to time and resource limitations for the development of this report, a 2SLS analysis was not undertaken. It is recommended that such analysis be undertaken in the future.
xl All estimates derived from the Tourism Regional Economic Impact Model (TREIM), op. cit.
xli TRB, op. cit., p. 3.
xlii Sylvain Acket et al, “Measuring and Validating Social Cohesion: a Bottom-up Approach.” Presented at the International Conference on Social Cohesion and Development, organized by the OECD, Development Center, Paris, January 2011. http://www.oecd.org/dev/pgd/46839973.pdf
xliii BC Stats, “Business Formations and Failures – Incorporations,” http://www.bcstats.gov.bc.ca/StatisticsBySubject/Economy/BusinessFormationsandFailures.aspx