TNO 2017 R11171 Adaptive Air Curtains Public Report CFD ...
32
Technical Sciences Leeghwaterstraat 44 2628 CA Delft P.O. Box 6012 2600 JA Delft The Netherlands www.tno.nl T +31 88 866 30 00 TNO report TNO 2017 R11171 Adaptive Air Curtains Public Report CFD simulations and experiments Date 5 October 2017 Author(s) Frans Koene Richard Kemp Aris Twerda Henk Hammink Thomas van Cann Contactperson: Frans Koene Email: [email protected] RVO Reference number TEID215049 Project title Adaptive Air Curtains Coordinator TNO Earth, Life and Social Siences Partners Biddle B.V. Project period 01.01.2016 – 01.07.2017 TNO Project number 060.17590 All rights reserved. No part of this publication may be reproduced and/or published by print, photoprint, microfilm or any other means without the previous written consent of TNO. In case this report was drafted on instructions, the rights and obligations of contracting parties are subject to either the General Terms and Conditions for commissions to TNO, or the relevant agreement concluded between the contracting parties. Submitting the report for inspection to parties who have a direct interest is permitted. © 2017 TNO Het project is uitgevoerd met subsidie van het Ministerie van Economische Zaken, Nationale regelingen EZ-subsidies, Topsector Energie uitgevoerd door Rijksdienst voor Ondernemend Nederland.
Transcript of TNO 2017 R11171 Adaptive Air Curtains Public Report CFD ...

Technical Sciences
Leeghwaterstraat 44
2628 CA Delft
P.O. Box 6012
2600 JA Delft
The Netherlands
www.tno.nl
T +31 88 866 30 00
TNO report
TNO 2017 R11171
Adaptive Air Curtains Public Report
CFD simulations and experiments
Date 5 October 2017
Author(s) Frans Koene
Richard Kemp
Aris Twerda
Henk Hammink
Thomas van Cann
Contactperson: Frans Koene
Email: [email protected]
RVO Reference number TEID215049
Project title Adaptive Air Curtains
Coordinator TNO Earth, Life and Social Siences
Partners Biddle B.V.
Project period 01.01.2016 – 01.07.2017
TNO Project number 060.17590
All rights reserved.
No part of this publication may be reproduced and/or published by print, photoprint,
microfilm or any other means without the previous written consent of TNO.
In case this report was drafted on instructions, the rights and obligations of contracting
parties are subject to either the General Terms and Conditions for commissions to TNO, or
the relevant agreement concluded between the contracting parties. Submitting the report
for inspection to parties who have a direct interest is permitted.
© 2017 TNO
Het project is uitgevoerd met subsidie van het Ministerie van Economische Zaken,
Nationale regelingen EZ-subsidies, Topsector Energie uitgevoerd door Rijksdienst voor
Ondernemend Nederland.

TNO report | TNO 2017 R11171
2 / 32
Management Samenvatting
Voor makkelijke toegang tot winkels of magazijnen wordt vaak een open
deuropening gebruikt. Als het buiten kouder is dan binnen levert dat aanzienlijke
warmteverliezen, die echter door toepassing van een luchtgordijn boven de
deuropening aanzienlijk kunnen worden verminderd.
De prestatie van een luchtgordijn wordt uitgedrukt in de scheidingsefficiëntie
(Climate Separation Efficiency -CSE), de mate waarin een luchtgordijn
warmteverliezen vermindert in vergelijking met een open deuropening (dus als het
luchtgordijn is uitgeschakeld). Dit project, uitgevoerd door TNO en fabrikant van
luchtgordijnen Biddle, had tot doel de prestatie van luchtgordijnen waar mogelijk te
verbeteren.
State-of-the-art van parameters die de prestatie bepalen
Een literatuuronderzoek is uitgevoerd naar parameters die de prestatie van een
luchtgordijn bepalen. Het cruciale effect dat moet worden bereikt is dat de lucht die
door het luchtgordijn naar beneden wordt geblazen, de vloer bereikt. Wanneer de
luchtstroom te lage snelheid heeft (in feite: impuls), zal deze de vloer niet bereiken,
met als gevolg dat koude lucht van buiten over de vloer naar binnen dringt. Ook als
de luchtstroom met te hoge snelheid de vloer raakt, blijken binnen- en buitenklimaat
minder efficiënt te worden gescheiden dan bij de optimale luchtsnelheid.
Het gedrag van de luchtstroom kan worden beschreven met het afbuigingsgetal
(Deflection modulus - Dm), een dimensieloos getal dat de verhouding aangeeft van
de impuls van de luchtstroom uit het luchtgordijnen en de dwarskrachten ten
gevolge van dichtheidsverschillen over de deuropening.
Naast geometrische parameters zoals de breedte en de hoogte van de
deuropening (die in een specifieke toepassing vastliggen), zijn de belangrijkste
parameters die Dm bepalen:
• Temperaturen van binnenlucht, buitenlucht en uitgeblazen lucht uit het
gordijn,
• Snelheid van uitgeblazen lucht,
• Hoek waarmee de lucht wordt uitgeblazen en
• Breedte van de uitstroomopening
Eindgebruikersbehoeften en bijbehorende Key Performance Indicators (KPI's),
In workshops met klanten van Biddle bleek dat het thermische comfort voor
kassières dichtbij de ingang een belangrijk aandachtspunt is. Het comfort wordt
negatief beïnvloed door tocht ten gevolge van de luchtstromingen rond de
deuropening. Parameters die het comfort verlagen, zijn onder meer:
• Temperatuur van de tochtstroom,
• Exfiltratie door hoger gelegen openingen boven de deuropening,
typisch voor een gebouw dat niet helemaal luchtdicht is.
• Menselijk verkeer door de deuropening (dat wil zeggen mensen die
door het luchtgordijn lopen).
Om het comfortverlies door tocht te beperken, wordt de lucht uit het luchtgordijn
vaak voorverwarmd tot maximaal 35°C.
TNO report | TNO 2017 R11171
3 / 32
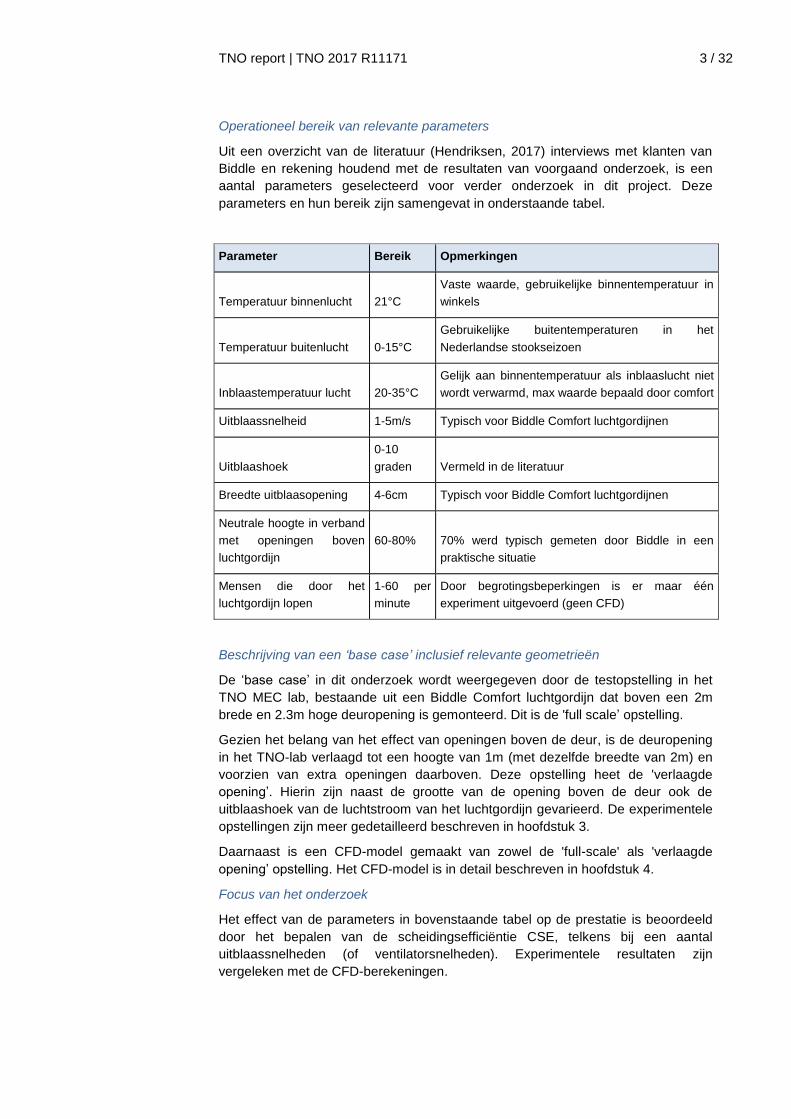
Operationeel bereik van relevante parameters
Uit een overzicht van de literatuur (Hendriksen, 2017) interviews met klanten van
Biddle en rekening houdend met de resultaten van voorgaand onderzoek, is een
aantal parameters geselecteerd voor verder onderzoek in dit project. Deze
parameters en hun bereik zijn samengevat in onderstaande tabel.
Parameter Bereik Opmerkingen
Temperatuur binnenlucht 21°C
Vaste waarde, gebruikelijke binnentemperatuur in
winkels
Temperatuur buitenlucht 0-15°C
Gebruikelijke buitentemperaturen in het
Nederlandse stookseizoen
Inblaastemperatuur lucht 20-35°C
Gelijk aan binnentemperatuur als inblaaslucht niet
wordt verwarmd, max waarde bepaald door comfort
Uitblaassnelheid 1-5m/s Typisch voor Biddle Comfort luchtgordijnen
Uitblaashoek
0-10
graden Vermeld in de literatuur
Breedte uitblaasopening 4-6cm Typisch voor Biddle Comfort luchtgordijnen
Neutrale hoogte in verband
met openingen boven
luchtgordijn
60-80%
70% werd typisch gemeten door Biddle in een
praktische situatie
Mensen die door het
luchtgordijn lopen
1-60 per
minute
Door begrotingsbeperkingen is er maar één
experiment uitgevoerd (geen CFD)
Beschrijving van een ‘base case’ inclusief relevante geometrieën
De ‘base case’ in dit onderzoek wordt weergegeven door de testopstelling in het
TNO MEC lab, bestaande uit een Biddle Comfort luchtgordijn dat boven een 2m
brede en 2.3m hoge deuropening is gemonteerd. Dit is de 'full scale’ opstelling.
Gezien het belang van het effect van openingen boven de deur, is de deuropening
in het TNO-lab verlaagd tot een hoogte van 1m (met dezelfde breedte van 2m) en
voorzien van extra openingen daarboven. Deze opstelling heet de 'verlaagde
opening’. Hierin zijn naast de grootte van de opening boven de deur ook de
uitblaashoek van de luchtstroom van het luchtgordijn gevarieerd. De experimentele
opstellingen zijn meer gedetailleerd beschreven in hoofdstuk 3.
Daarnaast is een CFD-model gemaakt van zowel de 'full-scale' als 'verlaagde
opening’ opstelling. Het CFD-model is in detail beschreven in hoofdstuk 4.
Focus van het onderzoek
Het effect van de parameters in bovenstaande tabel op de prestatie is beoordeeld
door het bepalen van de scheidingsefficiëntie CSE, telkens bij een aantal
uitblaassnelheden (of ventilatorsnelheden). Experimentele resultaten zijn
vergeleken met de CFD-berekeningen.

TNO report | TNO 2017 R11171
4 / 32
Momenteel controleert Biddle een beperkt aantal parameters (zoals de
uitlaatsnelheid) om een optimale prestatie van hun luchtgordijnen te behalen. Het
doel van de huidige studie is inzicht te krijgen in de effecten van bovenstaande
parameters, waardoor een verbeterd besturingsalgoritme kan worden bepaald,
waarbij de prestatie kan worden geoptimaliseerd onder een breder scala van
gebruiksomstandigheden.
Conclusies
De belangrijkste conclusies die uit de resultaten kunnen worden getrokken, zijn de
volgende:
• In onze experimenten en CFD-simulaties zijn grote hoeveelheden gegevens
verzameld, zoals snelheden en temperaturen van luchtstromen onder een
breed scala van gebruiksomstandigheden. De meest bruikbare grootheid om
de resultaten in te condenseren en een vergelijking tussen experiment en
CFD-simulatie mogelijk te maken, bleek de scheidingsefficiëntie CSE te zijn.
• Bij het vergelijken van CSE's is in het algemeen een goede overeenkomst
tussen experimenten en CFD-simulaties gevonden. Dit laat zien dat ons CFD-
model een zeer bruikbaar instrument is om de prestaties van een luchtgordijn
mee te bepalen onder een scala van gebruiksomstandigheden.
• Helaas duurde het uitvoeren van een CFD-scenario veel langer dan verwacht
(meestal 2 dagen) door het vereiste detail van het model en de dynamiek van
de stroomprocessen die plaatsvinden. Bijgevolg is het aantal CFD-simulaties
beperkt gebleven door de beschikbare tijd en budget.
• Bij het veranderen van de temperatuur van de koude ruimte (‘buiten’) bij
gelijkblijvende temperatuur van de warme ruimte (’binnen’), bleek de maximale
CSE in de orde van 70% -80% te zijn en iets hoger naarmate de
buitentemperatuur hoger is. De ventilatorspanning (die de
uitblaasluchtsnelheid bepaalt) waarbij de maximale CSE wordt bereikt, is lager
voor hogere buitentemperaturen. Dit is gerelateerd aan lagere drijvende
krachten voor de luchtstroming van buiten naar binnen bij hogere
buitentemperaturen. Deze resultaten zijn in overeenstemming met eerdere
bevindingen en met resultaten die in de literatuur zijn gerapporteerd.
Perspectief toepassing
Drukverschil over deuropening.
Uit eerder onderzoek is gebleken dat van de onderzochte parameters, het
temperatuurverschil over de deuropening de grootste invloed heeft op de
zogeheten kritische snelheid (dit is de snelheid waarbij de luchtstraal van het
luchtgordijn de grond net raakt) en daarmee op de klimaatscheidingseffectiviteit
CSE. Om het luchtgordijn automatisch te kunnen regelen zijn hiertoe in de huidige
luchtgordijnen temperatuursensoren aangebracht in en rondom het luchtgordijn.
Uit de in deze studie uitgevoerde metingen is gebleken dat het drukverschil over de
deuropening eveneens een grote invloed heeft op de CSE. Om dit effect mee te
kunnen nemen in de regeling, dienen ook drukverschil sensoren te worden
aangebracht in en rondom het luchtgordijn (en de deuropening) om ervoor te
zorgen dat op elk moment van de dag met de kritische snelheid wordt uitgeblazen.
Op dit moment zijn er al potentiële drukverschilsensoren aangeschaft en testen zijn
begonnen om na te gaan of deze in de praktijk (bij winkeldeuren) standaard
geïnstalleerd kunnen worden.

TNO report | TNO 2017 R11171
5 / 32
Invloed van personen die door de deuropening lopen
De factor “aantal personen die door de deur lopen” is niet uitgebreid onderzocht.
Meer experimenten zijn nodig om vast te kunnen stellen of, en zo ja onder welke
omstandigheden, ook bij frequente passages van personen door het luchtgordijn,
de herstelsnelheid van de luchtstroom voldoende groot is. Zo zou de regeling
aangepast kunnen worden aan de frequentie van passages van personen door het
luchtgordijn.
Bijdrage van het project aan de doelstellingen van de regeling
Aangezien op dit moment de luchtgordijnen alleen op basis van
temperatuurschommelingen worden geregeld, kan het voorkomen dat een
luchtgordijn niet in de optimale stand staat ingesteld. Er zijn echter meer factoren
die invloed hebben op de kritische snelheid en daarmee op de
klimaatscheidingseffectiviteit CSE. Factoren als wind, drukverschil, aantal personen
die door de deur lopen, en uitblaastemperatuur hebben allen invloed op de kritische
snelheid en de klimaatscheidingseffectiviteit. De invloed van deze factoren is
onderzocht in dit onderzoek en zullen bijdragen aan energiebesparende
maatregelen (d.m.v. een slimmer regelalgoritme) in winkels en bij toepassingen van
industriële luchtgordijnen.
Naast direct praktisch toepasbare resultaten in de vorm van een verbeterd
regelalgoritme heeft het project kennis opgeleverd in de vorm van een gevalideerd
CFD model van een luchtgordijn waarmee systemen in andere toepassingen
kunnen worden verbeterd, zoals luchtgordijnen van koelvitrines in supermarkten.
Tenslotte hebben de resultaten bijgedragen aan de ontwikkeling van de
meetfaciliteiten bij TNO (zoals variabele openingen boven een luchtgordijn), die als
een van de weinige in Europa in staat zijn om de efficiency van luchtgordijnen te
meten.
Spin-off binnen en buiten de sector
Luchtgordijnen worden toegepast in verschillende soorten gebouwen (winkels,
supermarkten, industriële gebouwen, overheidsgebouwen). Alhoewel de metingen
uit dit onderzoek zich toespitste op comfort luchtgordijnen, kan de verkregen
informatie ook helpen in het begrijpen van luchtstroming door de deur, waardoor
niet alleen regelingen voor comfort luchtgordijnen, maar ook voor bijvoorbeeld
industriële luchtgordijnen geoptimaliseerd of gecreëerd kunnen worden.
Naar beneden gerichte luchtstralen komen in meer toepassingen voor, bijvoorbeeld
in de koelvitrines van supermarkten, of bij het droogblazen van componenten op
een printplaat. Resultaten uit dit onderzoek, of het CFD-model zou gebruikt kunnen
worden als input voor onderzoek naar luchtstroming in dergelijke toepassingen.

TNO report | TNO 2017 R11171
6 / 32
Management Summary
For easy access to shops or warehouses, an open doorway is sometimes used. If
outside is colder than inside, this will result is significant heat losses through the
door opening, which can be significantly reduced using an air curtain above the
door opening.
Air curtain performance is expressed by a parameter called Climate Separation
Efficiency (CSE) which is the degree to which an air curtain can reduce heat losses
compared to the case of an open doorway (i.e. with the air curtain switched off).
This project, jointly carried out by TNO and manufacturer of air curtains Biddle, was
intended to improve the performance of such an air curtain where possible.
State-of-the-art in understanding of the factors that affect performance
A literature survey was carried out on air curtain factors that affect its performance.
The crucial effect to achieve is for the jet of air coming from the air curtain to reach
the floor beneath it. When the jet has too little velocity (in fact: momentum), it will fail
to reach the floor with the effect that cold air will enter across the floor. When the air
speed exceeds a certain optimal value, the indoor and outdoor climates will be less
efficiently separated.
The effect can be described by a dimensionless number called the deflection
modulus (Dm), which is the ratio of the momentum flux of the jet at the curtain outlet
to the transverse forces due to air density difference across the doorway.
Apart from geometrical factors like the width and height of the doorway (which are
mostly fixed in a particular application), the main parameters determining Dm are:
• temperatures of indoor air, outdoor air and outlet temperature,
• jet outlet velocity,
• jet outlet angle and
• outlet width
End-user needs and related Key Performance Indicators (KPI’s),
In workshops with customers, air curtain manufacturer Biddle (partner in the project)
noted that thermal comfort for cashiers sitting near the entrance was an important
issue. Comfort is negatively affected by draughts coming from the door opening.
Factors resulting in a decline in comfort from draughts include:
• temperature of the draughts,
• exfiltration caused by high-level openings above the doorway, typical of
a building that is not fully airtight,
• human traffic through the doorway (i.e. people walking through the air
curtain)
To limit the discomfort from draughts, the air jet from the air curtain is often heated
to a maximum of 35°C.
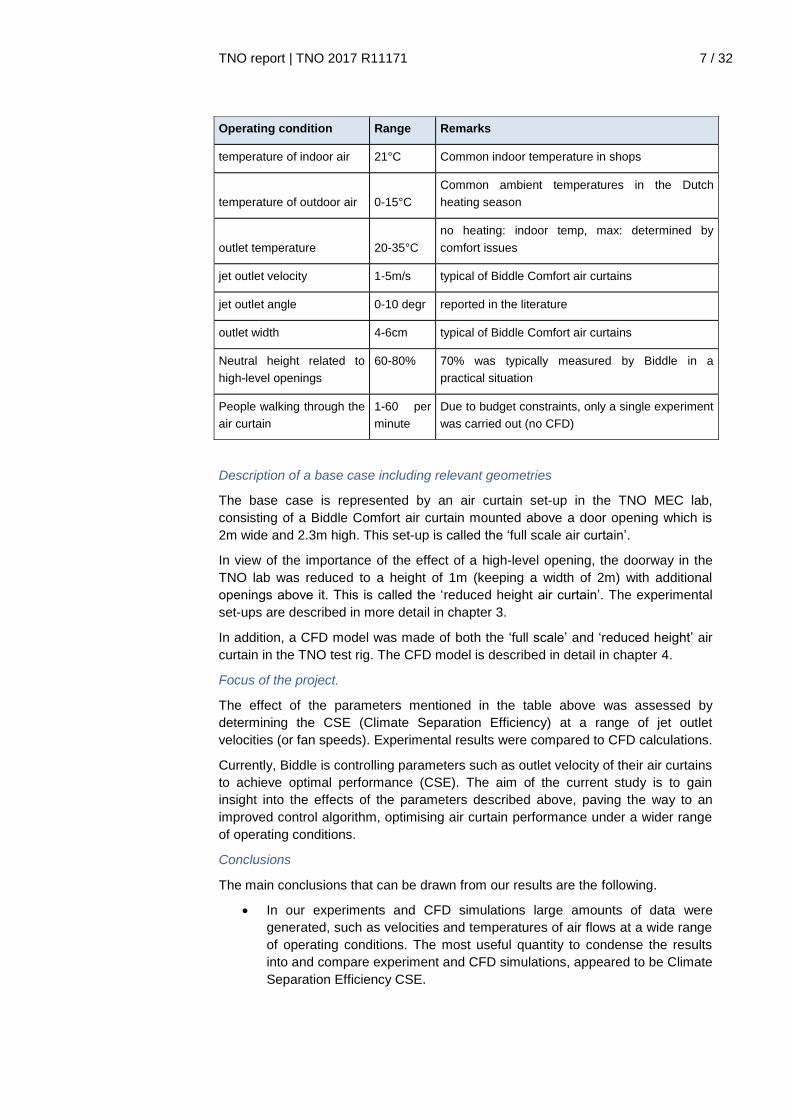
Operational scope of parameters
From a review of the literature (Hendriksen, 2017), interviews with customers by
Biddle and taking account of the results of previous studies, a number of operating
conditions were selected to be investigated in this study. These operating
conditions and their operational range are summarized in the table below.
TNO report | TNO 2017 R11171
7 / 32
Operating condition Range Remarks
temperature of indoor air 21°C Common indoor temperature in shops
temperature of outdoor air 0-15°C
Common ambient temperatures in the Dutch
heating season
outlet temperature 20-35°C
no heating: indoor temp, max: determined by
comfort issues
jet outlet velocity 1-5m/s typical of Biddle Comfort air curtains
jet outlet angle 0-10 degr reported in the literature
outlet width 4-6cm typical of Biddle Comfort air curtains
Neutral height related to
high-level openings
60-80%
70% was typically measured by Biddle in a
practical situation
People walking through the
air curtain
1-60 per
minute
Due to budget constraints, only a single experiment
was carried out (no CFD)
Description of a base case including relevant geometries
The base case is represented by an air curtain set-up in the TNO MEC lab,
consisting of a Biddle Comfort air curtain mounted above a door opening which is
2m wide and 2.3m high. This set-up is called the ‘full scale air curtain’.
In view of the importance of the effect of a high-level opening, the doorway in the
TNO lab was reduced to a height of 1m (keeping a width of 2m) with additional
openings above it. This is called the ‘reduced height air curtain’. The experimental
set-ups are described in more detail in chapter 3.
In addition, a CFD model was made of both the ‘full scale’ and ‘reduced height’ air
curtain in the TNO test rig. The CFD model is described in detail in chapter 4.
Focus of the project.
The effect of the parameters mentioned in the table above was assessed by
determining the CSE (Climate Separation Efficiency) at a range of jet outlet
velocities (or fan speeds). Experimental results were compared to CFD calculations.
Currently, Biddle is controlling parameters such as outlet velocity of their air curtains
to achieve optimal performance (CSE). The aim of the current study is to gain
insight into the effects of the parameters described above, paving the way to an
improved control algorithm, optimising air curtain performance under a wider range
of operating conditions.
Conclusions
The main conclusions that can be drawn from our results are the following.
• In our experiments and CFD simulations large amounts of data were
generated, such as velocities and temperatures of air flows at a wide range
of operating conditions. The most useful quantity to condense the results
into and compare experiment and CFD simulations, appeared to be Climate
Separation Efficiency CSE.
TNO report | TNO 2017 R11171
8 / 32
• When comparing CSE’s, in general, reasonable to good agreement was
found between experiments and CFD simulations. This shows that our CFD
model is a very useful tool to predict the performance of an air curtain under
a range of operating conditions.
• Unfortunately, running a single CFD scenario took much longer than
anticipated (typically 2 days) due to the required detail of the model and
dynamics of the flow processes taking place. Consequently, the number of
CFD simulations were limited by the time and budget available.
• When varying cold room temperature (‘outside’), keeping the warm room
temperature (‘indoor’) constant, maximum CSE appeared to be in the range
of 70%-80%. CSE is somewhat higher at higher outdoor temperatures. The
fan voltage (determining outlet air speed) at which maximal CSE is
achieved, is lower for higher outdoor temperatures. This can be related to
lower air density differences and hence lower driving forces for the air flows
from outside to inside. These results are consistent with earlier findings and
results reported in the literature.

TNO report | TNO 2017 R11171
9 / 32
Contents
1 Introduction ............................................................................................................ 10
2 Theory ..................................................................................................................... 11
2.1 Climate Separation Efficiency of an air curtain ........................................................ 11
2.2 Deflection modulus .................................................................................................. 11
2.3 Theoretical heat losses with no air curtain operating .............................................. 12
2.4 Theoretical heat losses with no air curtain and high-level opening ......................... 12
3 Experimental set-up .............................................................................................. 15
3.1 Full scale air curtain (2.3m high) ............................................................................. 15
3.2 Reduced height air curtain (1m high) ...................................................................... 15
3.3 Determination of Climate Separation Efficiency ...................................................... 16
3.4 Measurement of air velocity and temperature profiles ............................................ 17
4 CFD model .............................................................................................................. 19
4.1 Description ............................................................................................................... 19
4.2 Duration of simulation .............................................................................................. 20
4.3 Determination of Climate Separation Efficiency ...................................................... 21
4.4 Velocity profile ......................................................................................................... 21
5 Variation of operating conditions ........................................................................ 24
5.1 Variation of cold room temperature ......................................................................... 25
5.2 Effect of walking through the air curtain .................................................................. 27
6 Conclusions ........................................................................................................... 29
7 References ............................................................................................................. 30
8 Signature ................................................................................................................ 31
9 Appendix A: Interview end-users ......................................................................... 32

TNO report | TNO 2017 R11171
10 / 32
1 Introduction
In situations where a temperature difference exists between indoor and outdoor
climates, an air curtain mounted above an open doorway can significantly reduce
heat losses through the doorway.
Air curtain performance is expressed by a parameter called Climate Separation
Efficiency (CSE) which is the degree to which an air curtain can reduce heat losses
compared to the case of an open doorway (i.e. with the air curtain switched off).
To be effective the jet of air coming from the air curtain must reach the floor
beneath it. When the jet has too little velocity (in fact: momentum), it will fail to reach
the floor with the effect that cold air will enter the building across the floor. At a
certain critical velocity, climate separation between indoor and outdoor will be
achieved. Increasing the velocity will have the effect of the jet spreading across the
floor, illustrated in Figure 1.
Figure 1: Climate separation efficiency depending on the velocity (momentum) of the air jet from
the air curtain.
If anything, the indoor and outdoor climates will be less efficiently separated when
the air speed exceeds the optimal value. This will be a recurring phenomenon in our
study.
Air curtain manufacturer Biddle is controlling parameters such as outlet velocity of
their air curtains to achieve optimal performance (CSE). The aim of the current
study is to gain insight into effects such as temperature difference between indoor
and outdoor climates, heat input to the air jet, disturbance of the air jet from people
walking through it, presence of openings above the curtain (e.g. due to air leakages
in the building) and air jet outlet angle. The insights pave the way to an improved
control algorithm, optimising air curtain performance under a wider range of
operating conditions.
In this study, a Biddle Comfort air curtain was tested experimentally at the MEC lab
of TNO. In addition, a CFD model was made of the air curtain in the TNO test rig.
Experimental results are compared to CFD calculations under a range of operating
conditions. Analysis of the results has led to suggestions for an improved control
algorithm.

TNO report | TNO 2017 R11171
11 / 32
2 Theory
2.1 Climate Separation Efficiency of an air curtain
An air curtain is assumed to be placed over an opening between a cold room
(‘outdoor’) and a warm room (‘indoor’). Initially, the opening underneath the air
curtain is closed. Then, at t=0 it is opened, and due to buoyancy forces, cold air
from the cold room will enter the warm room at low level while displacing warm air
as flow reversal through the door at high-level.
The jet from the air curtain serves as a barrier to prevent these flows, keeping the
warm air inside and the cold air outside, thus achieving a ‘climate separation’. The
efficiency of the air curtain in achieving this is expressed as the ‘Climate Separation
Efficiency’ (CSE). It is defined as the ratio of heat losses with the air curtain
operating and heat loss without an air curtain:
CSE = 1 – Pair curtain / Pno air curtain [1]
with P denoting heat loss power [W]. Obviously, the better the CSE, the lower the
exchange of heat between both rooms.
The Climate Separation Efficiency is determined both experimentally (chapter 3)
and numerically using a CFD model (chapter 4) In both cases, eq. [1] is used to
determine CSE.
2.2 Deflection modulus
From the literature, it appears that an important parameter determining CSE is the
deflection modulus Dm. It is a dimensionless number giving the ratio of the
momentum flux of the jet at the curtain outlet to the transverse forces due to the
density difference across the doorway (D. Frank, P.F. Linden, Fluid Mech. (2014),
pp. 130-164).
[2]
With:
0 = density air jet
d = density air outside (dense)
l = density air inside (light)
b0 = width outlet
u0 = jet outlet velocity
g = gravity constant (9.81 m/s2)
hb = height doorway
T0 = initial temperature outlet
Td = temperature air outside (dense)
Tl = temperature air inside (light).
TNO report | TNO 2017 R11171
12 / 32
For situations where the outlet temperature T0 equals the indoor temperature Tl, the
equation simplifies to:
Dm = b0 u02/ghb
2 (Tl-Td)/Td [3]
This shows that in order to correctly calculate the deflection modulus, it is crucial to
obtain a reliable measure of the temperature difference between the two rooms
Tl-Td, in particular when it is a small number.
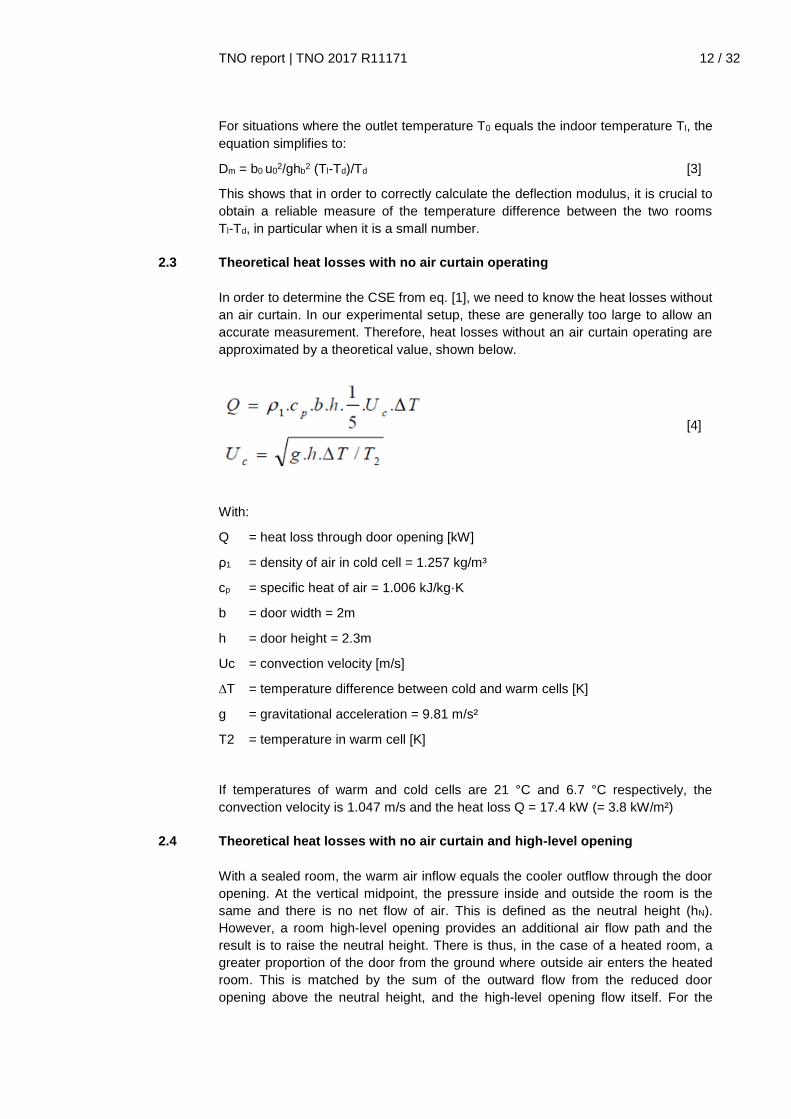
2.3 Theoretical heat losses with no air curtain operating
In order to determine the CSE from eq. [1], we need to know the heat losses without
an air curtain. In our experimental setup, these are generally too large to allow an
accurate measurement. Therefore, heat losses without an air curtain operating are
approximated by a theoretical value, shown below.
[4]
With:
Q = heat loss through door opening [kW]
ρ1 = density of air in cold cell = 1.257 kg/m³
cp = specific heat of air = 1.006 kJ/kg·K
b = door width = 2m
h = door height = 2.3m
Uc = convection velocity [m/s]
∆T = temperature difference between cold and warm cells [K]
g = gravitational acceleration = 9.81 m/s²
T2 = temperature in warm cell [K]
If temperatures of warm and cold cells are 21 °C and 6.7 °C respectively, the
convection velocity is 1.047 m/s and the heat loss Q = 17.4 kW (= 3.8 kW/m²)
2.4 Theoretical heat losses with no air curtain and high-level opening
With a sealed room, the warm air inflow equals the cooler outflow through the door
opening. At the vertical midpoint, the pressure inside and outside the room is the
same and there is no net flow of air. This is defined as the neutral height (hN).
However, a room high-level opening provides an additional air flow path and the
result is to raise the neutral height. There is thus, in the case of a heated room, a
greater proportion of the door from the ground where outside air enters the heated
room. This is matched by the sum of the outward flow from the reduced door
opening above the neutral height, and the high-level opening flow itself. For the

TNO report | TNO 2017 R11171
13 / 32
case where the neutral height is sufficiently high, there is only air inflow through the
door.
Figure 2: Flow variation with change in neutral height. Mid-level neutral height with a sealed room
(left) and raised with a high-level opening.
The equations to calculate neutral height and flows through the door and a high-
level opening are given by 1 (Frank) as a function of door and opening dimensions.
These dimensional references, assuming square / rectangular openings, are given
in Figure 3.
Figure 3 Notations used in the calculation of the neutral height and airflows
The neutral height is given as a function of door area, high-level opening area, the
height to the top of the door and the height to the bottom of the high-level opening:
1 D. Frank en P.F. Linden, Fluid Mech. (2014), vol.756, pp. 130-164
Neutral height,
hN

TNO report | TNO 2017 R11171
14 / 32
From this, depending on the air densities in the two spaces, the flow below the
neutral height through the door can be calculated, along with the opposing outflows
through the remainder of the door and the opening:
The discharge coefficients C for the bottom and top openings are assumed the
same at ~0.6, equivalent to a sharp-edged opening.
𝑔′ is the density difference ratio, defined as 𝑔′ = 𝑔 (1 −𝜌𝑤
𝜌𝑐)
with 𝑔 the gravitational acceleration (9.81m/s2) and 𝜌 the density of the warm or
cold air depending on the subscript.
The sensible heat transfer can then be calculated based on the air mass flow rate
(volume flow rate and density product), specific heat capacity and temperature
difference between the two spaces:
𝑄 = �̇�𝜌𝐶𝑝(𝑇𝑤 − 𝑇𝑐)
Note that the equations above are based on conservation of volume, but since the
densities are slightly different there is not conservation of mass and the resulting
heat transfer is slightly different depending on the use of the warm or cold air
density. Therefore, in subsequent reference cases, for heat loss calculations based
on air volume transfer the cold room air density is used, to maintain consistency
with the calculations in section 2.3.
As previously described, the effectiveness of an air curtain is based on the heat loss
through a door with a curtain compared to the door-only case. With a high-level
opening, for the same door geometry and air temperatures there is a different air
flow rate and hence heat loss. Therefore, for calculating the CSE with a high-level
opening (eq. [1]) the “Pno air curtain” is calculated for the with-opening case as described
above rather than in section 2.3.

TNO report | TNO 2017 R11171
15 / 32
3 Experimental set-up
3.1 Full scale air curtain (2.3m high)
The air curtain is mounted between two rooms of about 4x4x6m (wxhxd). One of
these is the ‘warm’ room, generally held at a temperature of 21°C by a heating unit,
while the other is the ‘cold’ room, held at temperatures between 3 and 10 °C by a
cooling unit. The opening between the rooms, with the air curtain above it, can be
closed by two hinged doors, shown in Figure 4.
Figure 4: The cold room with a view of the wall separating it from the warm room. The 9 vertical
wires are connected to temperature sensors (mounted at three different heights)
3.2 Reduced height air curtain (1m high)
A number of experiments were carried out with the air curtain mounted at a lower
height. This allows for panels above the air curtain to be opened, simulating a
building that is not fully airtight. Figure 5 shows the air curtain at a height of 1m, with
the two hinged doors underneath it opened. The panels within panels above the air
curtain are shown in more detail in Figure 6.

TNO report | TNO 2017 R11171
16 / 32
Figure 5: Installation of the air curtain at 1m height, view from the warm room.
Figure 6: Panels within panels above the air curtain to achieve different sized high-level openings
3.3 Determination of Climate Separation Efficiency
The measurement method for the high and the low air curtain is identical. With the
hinged doors closed and the air curtain operating, the rooms are left for some time
to reach a steady state. Then, the doors are slowly opened 2 and density
differences result in cool air passing through the door at low level, displacing the
warm air into the cold room. The better the CSE from the air curtain, the lower the
exchange of air between both rooms.
2 To minimise mixing of air when opening the doors, sliding doors would be better than hinged
doors.

TNO report | TNO 2017 R11171
17 / 32
The heating unit within the warm room’s air recirculation system attempts to
maintain the warm room at its initial temperature, countering the heat losses to the
cold room. Similarly, the cooling unit will attempt to maintain the cold room at its
initial temperature, countering the heat gains from the warm room. As maintaining
the initial temperatures is generally not possible, the temperature of the air is
measured at 27 locations across each room.
After a period of 8 minutes, the hinged doors are shut and the heating unit and
cooling units will return the rooms to their initial conditions (generally within 1-2
hours). In the end, the heat losses in the 8-minute experiment are calculated from
the amount of heat supplied by the heater from the moment the hinged doors are
opened until the initial conditions are once again reached. This should be identical
to the amount of heat dissipated by the chiller in that period. A correction is made
for heat losses and heat gains from the test rooms to/from the environment using
data obtained from prior calibration tests.
A report was made on the detailed experimental results (Hamming, 2017).
3.4 Measurement of air velocity and temperature profiles
Note that velocities are referred to throughout this report, which strictly speaking are
speeds with no directional component. However, in the region within the jet the
direction of flow can reasonably be assumed as downwards. Measurements were
made of air speed profiles and temperature profiles at different positions and
heights underneath the curtain. The purpose was to compare these to profiles
derived from the CFD simulations in order to validate the latter (see chapter 4.4).
The chamber airflow volumes could not be measured directly as they were very
large and there is no dedicated measuring section in the air handling units or
ducting. An estimate of chamber flow was made by an airspeed traverse over a 16-
point grid in front of the diffuser wall in each chamber. This was repeated for several
fan speeds of the chamber air handling unit. These flows were input to the CFD
model.

TNO report | TNO 2017 R11171
18 / 32
Figure 7: location of sensors in measuring velocity and temperature profiles

TNO report | TNO 2017 R11171
19 / 32
4 CFD model
4.1 Description
The 3D mesh for the CFD computations was made using GRIDGEN version 15. A
CAD file was provided by Biddle and used to generate the mesh. A hexahedral
mesh was built which was refined by a factor of two in each direction near the air
curtain to achieve a higher accuracy in this region. The final model consisted of
approximate 660,000 cells. Because the air speeds were assumed to be
symmetrical from the middle, only half of the test chamber and air curtain is
modelled to reduce computational time.
A plot of the geometry is shown in Figure 8 with the location of the chamber air
inlets and outlets on the left and the location of the air curtain inlet and outlet on the
right. An impression of the mesh is shown in Figure 9.
Figure 8 CFD model geometry of the chamber air inlets and outlets (left) and a detailed view of
the air curtain inlet and outlet (right).
Figure 9 Impression of the mesh of the CFD model with a detailed view of the air curtain in the top
right corner.
TNO report | TNO 2017 R11171
20 / 32
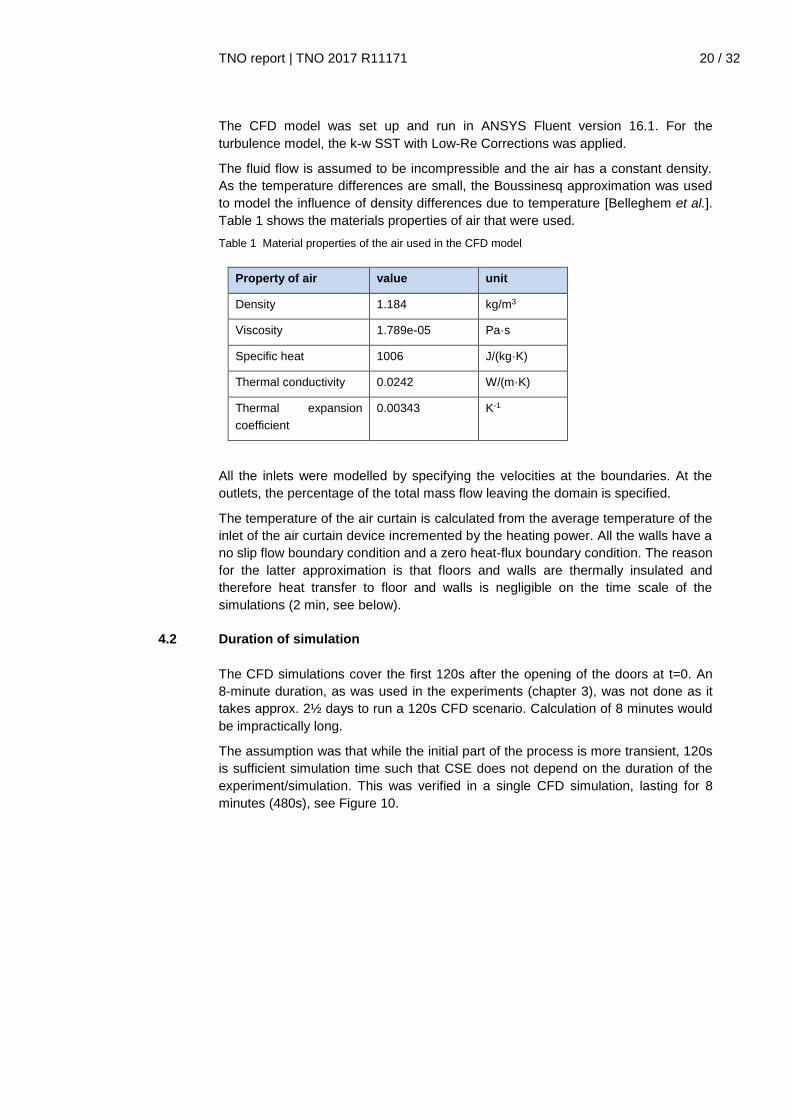
The CFD model was set up and run in ANSYS Fluent version 16.1. For the
turbulence model, the k-w SST with Low-Re Corrections was applied.
The fluid flow is assumed to be incompressible and the air has a constant density.
As the temperature differences are small, the Boussinesq approximation was used
to model the influence of density differences due to temperature [Belleghem et al.].
Table 1 shows the materials properties of air that were used.
Table 1 Material properties of the air used in the CFD model
Property of air value unit
Density 1.184 kg/m3
Viscosity 1.789e-05 Pa·s
Specific heat 1006 J/(kg·K)
Thermal conductivity 0.0242 W/(m·K)
Thermal expansion
coefficient
0.00343 K-1
All the inlets were modelled by specifying the velocities at the boundaries. At the
outlets, the percentage of the total mass flow leaving the domain is specified.
The temperature of the air curtain is calculated from the average temperature of the
inlet of the air curtain device incremented by the heating power. All the walls have a
no slip flow boundary condition and a zero heat-flux boundary condition. The reason
for the latter approximation is that floors and walls are thermally insulated and
therefore heat transfer to floor and walls is negligible on the time scale of the
simulations (2 min, see below).
4.2 Duration of simulation
The CFD simulations cover the first 120s after the opening of the doors at t=0. An
8-minute duration, as was used in the experiments (chapter 3), was not done as it
takes approx. 2½ days to run a 120s CFD scenario. Calculation of 8 minutes would
be impractically long.
The assumption was that while the initial part of the process is more transient, 120s
is sufficient simulation time such that CSE does not depend on the duration of the
experiment/simulation. This was verified in a single CFD simulation, lasting for 8
minutes (480s), see Figure 10.

TNO report | TNO 2017 R11171
21 / 32
Figure 10 CSE vs fan voltage. CFD simulations of 120s compared to experiments of 480s and a
single CFD simulation of 480s.
4.3 Determination of Climate Separation Efficiency
The determination of the heat losses and therefore, CSE is slightly different from
those in the experiments. In the experiments, there are quite large temperature
differences in the various regions of each room at the time the doors are shut,
hence with a limited number of temperature sensors the rooms need to return to
their stable, original conditions for evaluating heat balances.
At the end of the simulation at 120 s, the temperature of each cell in the rooms is
known and these are used to calculate the heat added or removed, required to
bring each room to its initial temperature.
4.4 Velocity profile
The velocity profile measured experimentally at a distance of 2 cm underneath the
curtain serves as the initial profile for the CFD calculations. However, the velocity
profile, when integrated over the outlet area, produced a volume flow rate which
differed by a factor of two from flow rates directly measured by Biddle for this
curtain. This is unsurprising as the width of the outlet is small and large speed
variations occur over small distances. As direct measurements of flow rates are
more reliable and accurate than integrating velocity profiles, we decided to scale the
velocity profiles to fit the flow rates measured.
We had the choice of scaling every point in the profile by the same factor or by
scaling the higher velocities more than the lower ones by using a power of 1.6. The
latter produces the same maximal velocities as the initial ones but reduces lower
velocities more than the first scaling does. The scaling process is illustrated in
Figure 11.
0%
20%
40%
60%
80%
100%
80 100 120 140 160 180
Cli
mat
e S
ep
arat
ion
Eff
icie
ncy
(%)
V_fan (V)
CSE vs V_fan
k=1.6
k=1.6, 480s
exp Oct 16

TNO report | TNO 2017 R11171
22 / 32
Figure 11 Example scaling of outlet velocities to match experimentally determined volume flow
rates along a length covering 1 fan (0.5m). The profile also varies in the width axis.
Using both profiles for initial outlet velocities in our CFD simulations, we compared
velocities calculated further below the curtain to experimentally measured velocities.
Unfortunately, the comparison did not provide conclusive evidence for the best
choice of scaling. The left of Figure 12 illustrates that the k=1.0 scaling (green line)
produces more agreement near the floor, while the k=1.6 scaling (red line)
produced a better agreement near the outlet of the air curtain.
Figure 12 Velocities at a height of 0.11m above the ground (left) and 2.25m (5 cm below the
curtain). The blue symbols denote experimental values, the lines denote the CFD
simulations (red line k=1.6, green line, k=1.0).
Since it is uncertain at which height above the floor a good match between
experiment and CFD simulation is most crucial, we decided to use the best match
with experimentally determined CSE as the criterion for the selection of the scaling
procedure. Figure 13 and Figure 14 show the experimentally determined CSEs

TNO report | TNO 2017 R11171
23 / 32
(blue symbols), both from our latest experiments in October 2016 and from previous
experiments in March 2016. They are compared to the CSEs calculated with the
k=1.0 and the k=1.6 profile (red and blue line respectively). While Figure 13 shows
CSE versus fan voltage (and therefore jet air speed), Figure 14 shows CSE versus
the deflection modulus Dm.
Figure 13 CSE vs. fan Voltage for the k=1.0 and k=1.6 velocity profile.
Figure 14 CSE vs. dimensionless number Dm for the k=1.0 and k=1.6 velocity profile.
Figure 13 and Figure 14 show that the k=1.6 profile gives a better match between
experimental and calculated CSEs, so we used this scaling procedure in the
remainder of our study.
-100%
-80%
-60%
-40%
-20%
0%
20%
40%
60%
80%
100%
50 100 150 200
Cli
mat
e S
ep
arat
ion
Eff
icie
ncy
(%)
V_fan (V)
CSE vs V_fan
k=1.6
k=1.0
exp Mar16
exp Oct 16
-100%
-80%
-60%
-40%
-20%
0%
20%
40%
60%
80%
100%
0.00 0.20 0.40 0.60
Cli
mat
e S
ep
arat
ion
Eff
icie
ncy
(%)
Dm (-)
CSE vs Dm
k=1.6
k=1.0
exp Mar16
exp Oct 16

TNO report | TNO 2017 R11171
24 / 32
5 Variation of operating conditions
From a review of the literature (Hendriksen, 2017) and user interviews with
customers by Biddle, a number of operating conditions were selected to be
investigated in this study. These operating conditions and their operational range
are summarized in Table 2 below.
Table 2: Operating conditions to be investigated in this study and their operational range.
In each of these experiments, the results of the CFD simulations are compared to
the results of the experiments, except the scenario with people walking through the
air curtain, where only an experiment was carried out.
In the following chapters, the results are displayed as graphs of the Climate
Separation Efficiency (CSE) vs. the fan voltages as well as vs. the deflection
modulus Dm. The first are shown because fan voltage is a main control parameter
for Biddle to achieve maximal CSE.
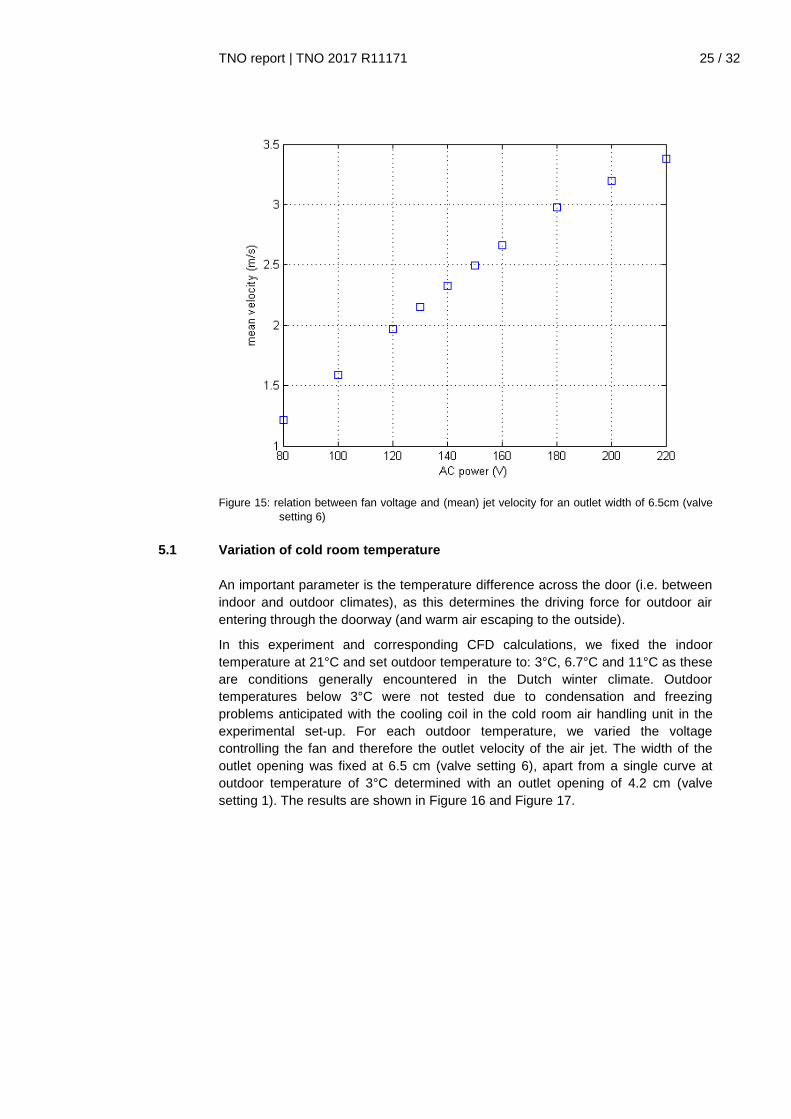
The relation between fan voltage and (mean) jet velocity for an outlet width of 6.5cm
(valve setting 6) is shown in Figure 15 below.
Operating condition Range Remarks
temperature of indoor air 21°C Common indoor temperature in shops
temperature of outdoor air 0-15°C
Common ambient temperatures in the Dutch
heating season
outlet temperature 20-35°C
no heating: indoor temp, max: determined by
comfort issues
jet outlet velocity 1-5m/s typical of Biddle Comfort air curtains
jet outlet angle 0-10 degr reported in the literature
outlet width 4-6cm typical of Biddle Comfort air curtains
Neutral height related to
high-level openings
60-80%
70% was typically measured by Biddle in a
practical situation
People walking through the
air curtain
1-60 per
minute
Due to budget constraints, only a single
experiment was carried out (no CFD)
TNO report | TNO 2017 R11171
25 / 32
Figure 15: relation between fan voltage and (mean) jet velocity for an outlet width of 6.5cm (valve
setting 6)
5.1 Variation of cold room temperature
An important parameter is the temperature difference across the door (i.e. between
indoor and outdoor climates), as this determines the driving force for outdoor air
entering through the doorway (and warm air escaping to the outside).
In this experiment and corresponding CFD calculations, we fixed the indoor
temperature at 21°C and set outdoor temperature to: 3°C, 6.7°C and 11°C as these
are conditions generally encountered in the Dutch winter climate. Outdoor
temperatures below 3°C were not tested due to condensation and freezing
problems anticipated with the cooling coil in the cold room air handling unit in the
experimental set-up. For each outdoor temperature, we varied the voltage
controlling the fan and therefore the outlet velocity of the air jet. The width of the
outlet opening was fixed at 6.5 cm (valve setting 6), apart from a single curve at
outdoor temperature of 3°C determined with an outlet opening of 4.2 cm (valve
setting 1). The results are shown in Figure 16 and Figure 17.

TNO report | TNO 2017 R11171
26 / 32
Figure 16 CSE vs. fan voltage for different cold room temperatures with indoor temperature fixed
at 21°C. CFD simulations (lines) compared to experimental values (symbols).
Figure 16 seems to suggest that the optimal fan voltage is lower for smaller
temperature differences between indoor and outdoor (i.e. at higher outdoor
temperature when keeping the indoor temperature at 21°C). This is due to the
buoyancy and therefore driving forces being lower at higher outdoor temperatures.
Figure 17 CSE vs. dimensionless number Dm for different cold room temperatures. Indoor
temperature fixed at 21°C. CFD simulations (lines) compared to experimental values
(symbols).
Figure 17 shows a good agreement between the CFD simulations (lines) and
experimental values (symbols). Maximum CSE is between 70% and 80% and
appears to be slightly higher for higher cold room temperatures. Maximal CSE is
achieved at values of Dm between 0.25 and 0.3. Below 0.2, the air jet does not have
enough momentum to reach the floor underneath the air curtain. In this region, with
TNO report | TNO 2017 R11171
27 / 32
the CSE dropping off, the match is not so good but here the CSE sensitivity to fan
voltage is significant. In any case, the curtain should not be operated too close to
this point in practice.
At of Dm values higher than the optimal, CSE slightly decreases. However, CSE is
still high enough to allow – in practical applications - a selection of a fan voltage
somewhat higher than the optimal value to keep away from the region of rapidly
dropping performance.
Some additional experiments were carried out at valve setting 1 which entails a
smaller width of the curtain (4.2 cm instead of 6.5 cm). As Figure 16 and Figure 17
show, there is slight difference in CSE between both valve settings.
In these and subsequent plots, the blue symbols and blue lines denote our base
case: Tindoor 21°C, Toutdoor 6.7°C, with no heat input to the air curtain. For the
experimental values, the results from the experiments carried out in October 2016
were used.
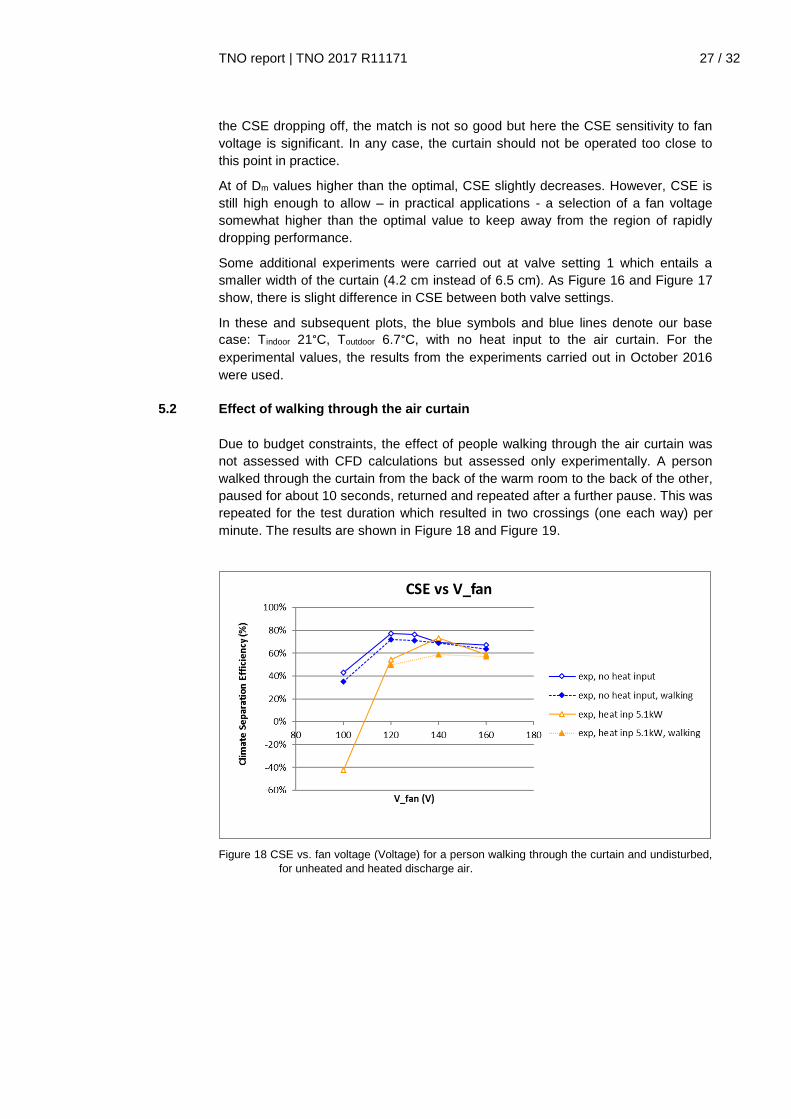
5.2 Effect of walking through the air curtain
Due to budget constraints, the effect of people walking through the air curtain was
not assessed with CFD calculations but assessed only experimentally. A person
walked through the curtain from the back of the warm room to the back of the other,
paused for about 10 seconds, returned and repeated after a further pause. This was
repeated for the test duration which resulted in two crossings (one each way) per
minute. The results are shown in Figure 18 and Figure 19.
Figure 18 CSE vs. fan voltage (Voltage) for a person walking through the curtain and undisturbed,
for unheated and heated discharge air.

TNO report | TNO 2017 R11171
28 / 32
Figure 19 CSE vs. Dm for a person walking through the curtain and undisturbed, for unheated and
heated discharge air.
Figure 18 and Figure 19 show that both for the unheated and heated discharge air,
there is some but no dramatic decrease in CSE with someone walking through the
air curtain under the conditions (approx. two single crossings per minute). The main
purpose is to identify any evidence that suggests the fan speed should be set
differently to take these passages into account. The CSE-maximising speed and Dm
did not change much, including the scenario where the curtain jet was heated.
Pedestrians will disturb the jet and a hypothesis was that a higher fan speed would
re-establish the barrier more rapidly with a performance improvement. Apparently,
the jet re-establishes itself rather quickly after its disturbance by a person crossing
the doorway. From limited data, the flow seems rather robust to the disturbances
applied. In order to better quantify the effect of pedestrians, a more thorough series
of experiments would be needed to vary the frequency of traversing to see if heavy
traffic would make a difference to optimum fan speeds.
TNO report | TNO 2017 R11171
29 / 32
6 Conclusions
The main conclusions that can be drawn from our results are the following.
• In our experiments and CFD simulations large amounts of data were
generated, such as velocities and temperatures of air flows at a wide range
of operating conditions. The most useful quantity to condense the results
into and compare experiment and CFD simulations, appeared to be Climate
Separation Efficiency CSE.
• When comparing CSE’s, in general, reasonable to good agreement was
found between experiments and CFD simulations. This shows that our CFD
model is a very useful tool to predict the performance of an air curtain under
a range of operating conditions.
• Unfortunately, running a single CFD scenario took much longer than
anticipated (typically 2 days) due to the required detail of the model and
dynamics of the flow processes taking place. Consequently, the number of
CFD simulations were limited by the time and budget available.
• When varying cold room temperature (‘outside’), keeping the warm room
temperature (‘indoor’) constant, maximum CSE appeared to be in the range
of 70%-80%. CSE is somewhat higher at higher outdoor temperatures. The
fan voltage (determining outlet air speed) at which maximal CSE is
achieved, is lower for higher outdoor temperatures. This can be related to
lower air density differences and hence lower driving forces for the air flows
from outside to inside. These results are consistent with earlier findings and
results reported in the literature.

TNO report | TNO 2017 R11171
30 / 32
7 References
Hendriksen, L, literatuur studie luchtgordijn, internal TNO report, June 2017
Hammink, H, Resultaten Experimenten Biddle luchtgordijn, internal TNO report,
June 2017
Belleghem, M.V, Verhaeghe, G, T‘Joen, C, Huisseune, H, De Jaeger, P, De Paepe,
M, Heat transfer through vertically downward-blowing single-jet air curtains for cold
rooms, Heat Transfer Engineering, 33 (14) (2012), pp. 1196-1206

TNO report | TNO 2017 R11171
31 / 32
8 Signature
Delft, October 2017 TNO E.D. Nennie, MSc F. Koene Research Manager R. Kemp Heat Transfer and Fluid Dynamics A. Twerda H. Hammink T. Van Cann Authors

TNO report | TNO 2017 R11171
32 / 32
9 Appendix A: Interview end-users
Reviewing the contacts between the Biddle sales department and customers, it
appears that ever more question arise whether an air curtain can ‘block’ ventilation
air (or infiltration air). Owners of large shops or warehouses are particularly
interested in subjects like this, especially if the cashier area is located close to the
opening. The cold draught from infiltration is likely to be experienced as
uncomfortable, especially when an air curtain is not sufficiently heating the air jet.
Several workshops were held at Biddle to discuss these problems, as well as other
common problems facing customers (in terms of climate separation / climate
control). Visiting shops and warehouses are done on a weekly basis and many
cashier employees were interviewed in due course.
Noise from the air curtain was not identified as an important issue related to the
comfort of employees.