TITRE DE LA PRESENTATION POWER POINT - natixis.com · 2 Disclaimer This media release may contain...
77
Q3-2011 results November 9, 2011
Transcript of TITRE DE LA PRESENTATION POWER POINT - natixis.com · 2 Disclaimer This media release may contain...

Q3-2011 results
November 9, 2011

2
Disclaimer
This media release may contain objectives and comments relating to the objectives and strategy of Natixis. Any such objectives inherently depend on assumptions, project considerations, objectives and expectations linked to future and uncertain events, transactions, products and services as well as suppositions regarding future performances and synergies. No assurance can be given that such objectives will be realized. They are subject to inherent risks and uncertainties and are based on assumptions relating to Natixis, its subsidiaries and associates, and the business development thereof; trends in the sector; future acquisitions and investments; macroeconomic conditions and conditions in Natixis' principal local markets; competition and regulation. Occurrence of such events is not certain, and outcomes may prove different from current expectations, significantly affecting expected results. Actual results may differ significantly from those implied by such objectives. Information in this media release relating to parties other than Natixis or taken from external sources has not been subject to independent verification, and Natixis makes no warranty as to the accuracy, fairness or completeness of the information or opinions herein. Neither Natixis nor its representatives shall be liable for any errors or omissions or for any harm resulting from the use of this media release, its contents or any document or information referred to herein.
Note on methodology
Following the reclassification of the deeply subordinated notes as equity instruments, interest expense on these instruments ceased to be recognized in the income statement as of January 1st, 2010.
Payments business line is disclosed pro-forma of the consolidation of GCE Paiements in 2010. As a reminder, GCE Paiements had been first integrated in the Payments business line as of September 1st, 2010.
Leasing business line is disclosed pro-forma of the consolidation of Cicobail and Oceor Lease in 2010.
November 9, 2011

• Achievements in line with ambitions defined in 2009 in the strategic plan “New Deal”: − Refocus on 3 core activities (CIB, IS, SFS) − Significant achievements already captured, decrease in RWA and funding needs
while increasing profitability • To integrate new market constraints, strategy “New Deal” will be pushed further to
continue optimization while continuing to enhance profitability
Key messages
3 November 9, 2011
9M11 & 3Q11 results: solid performance in a difficult environment
• Solvency strengthened and compliant with Basel 3 by 2013: − Core Tier 1 ratio above 10% at end-2011 including CRD3 and optimisation of Natixis
financial structure through P3CI operation(1) with negligible impact on EPS
− Basel 3 Core Tier 1 ratio above 9% by 2013
• Reduction of funding needs in order to address liquidity constraints
Strong track record even in current economic context
• 9 months 2011 net profit of 1,260 m€, slightly decreasing vs. 2010 (-2%), in a very difficult environment
• Good commercial momentum with core businesses revenues increasing 2% in 9 months 2011 vs. 2010
• 3Q11 net profit of 344 m€ (+13% vs. 3Q10)
• 56% average impairment on Greek sovereign debt exposure (40 m€ pre-tax impact(2))
• Increase in equity method consolidated retail banking result: robust commercial momentum
(1) Pro forma P3CI operation to be implemented beginning of 2012 (2) Net of policyholders participation on life insurance exposure

4
Agenda
1. Natixis Strategy
2. Financial structure and funding
3. Natixis 3Q11 & 9M11 results
4. Business divisions results
5. Conclusion
November 9, 2011

New Deal achievements since mid 2009 set proper ground to address current challenges
5 November 9, 2011
Client focus
• Focus on three business lines (CIB, IS, SFS) and retail banking through CCI
• Priority on our core clients with drastic downsizing of proprietary activities (e.g., private equity, prop trading)
• Implementation of a client centric approach, resulting in increase of net revenues share of Client Contribution
Integrated bank
• Business development with BPCE retail networks especially for SFS and IS
• Focus on cross-selling between businesses within CIB
• Build on distinctive Natixis franchise in Structured Finance and Capital Markets, and focus on Natixis value added product expertise
De-risking
• 37% decrease in RWA from Jan. 09 to Sept. 11 (166 bn€ to 104 bn€(1))
• 50 bn€ decrease in liquidity needs of CIB and GAPC from beginning 2009 to September 2011
• Improved risk management and low sovereign exposure
(1) Excluding CCI, net of GAPC guarantee i.e. 14 bn€ RWA at the time of the implementation

Client
focus
De-r
iskin
g
Inte
gra
ted
bank
Natixis position has been constantly solidified since 2009 through a coherent set of actions
6 November 9, 2011
2009
• Strategic review of our business portfolio to focus on core franchises
• RWA reduction program carried out in CIB
• Liquidity optimization measures and mutualization of long term funding with BPCE
2010
• Product neutral coverage
• Sale of own account Private Equity
• GAPC assets disposal (e.g., correlation book)
2011
• Creation of BPCE/ Natixis common liquidity platform
• GAPC dedicated governance
• Coverage reorganization with a client centric approach
• Synergies plan carried out at Group level (revenue synergies with BPCE networks, costs savings program)
• Reorganization of shared/central functions aiming at more mutualization and efficiency
• Cross-selling program at Bank level
• Continuous strong VaR monitoring

New Deal plan enabled to deleverage Natixis while improving profitability
• Strong reduction of capital allocated to CIB • Improved Core Tier 1 ratio • Overall improvement of profitability while deleveraging the bank
CIB ROE in %(3) and capital allocated, in bn€(4) Natixis RWA(1) and half-year net revenues, in bn€
Sep. 11
15.9%
Dec. 10
13.7%
Dec. 09
0.9%
6.6 6.0 4.8 Capital allocated
Core Tier 1 ratio(5)
(1) Excluding CCI, beginning of period (2) Assets to be refinanced (short and long term) (3) 9M11: annualized ROE
7 November 9, 2011
Sep. 11
8.8%
Dec. 10
7.9%
Dec. 09
6.6%
RWA
2.6 3.3 3.4 3.2 3.3
Net Revenues (excl. GAPC)
104110
139131149
166
(4) 7% RWA beginning of period (5) Including new CCI prudential treatment as RWA
CIB and GAPC liquidity needs(2), in bn€
97.9 108.1 116.0 147.9
Sep. 11 Dec. 10 Dec. 09 Jan. 09
Jan. 1st, 09 Jul. 1st, 09 Jan. 1st, 10 Jul.1st, 10 Jan.1st, 11 Jul. 1st, 11

• Further reduction of 15/20 bn€ liquidity needs(1) by end-2013
• 10 bn€ RWA further reduction by end-2013(2), i.e. a total reduction of 43% since 2009 (excl. CCI)
Current context requires additional actions to adapt New Deal
8 November 9, 2011
• Strategic optimization of businesses
• Solvency optimization (P3CI)
• Further increase duration of funding
• Development of asset-based financing
• Improvement of operational efficiency
Changing environment implies integration of new constraints within New Deal plan:
(1) Assets to be refinanced (short and long term) (2) Excluding Basel 2.5 and Basel 3 impacts at constant foreign exchange rates
• Increase capital market access for clients
• Enhance core activities and divest non-core ones
• Focus on businesses with high value creation on use of liquidity
• Develop asset-based funding
• Further reduce liquidity gap
• Anticipate new regulatory Basel 3 constraints on RWA
• Optimize liquidity management at BPCE level
• Accelerate rotation of balance sheet
• Optimize allocation of capital (net revenues/RWA)
• Improve operational efficiency
Client
focus
De-r
iskin
g
Inte
gra
ted
bank
Liquidity Capital
Our convictions in the current context

Reduce Reinforce
Natixis CIB strategic orientations
• Provide distinctive expertise to Energy and Commodities clients (new geographies/ clients)
• Develop Project Finance with core clients
• Further optimize of Aircraft Finance
• Strengthen core client franchise: large corporates on core European markets and mid markets in France
• Provide capital management solution to core Corporate and FIG client
• Accelerate dedicated market funding to support development of asset finance activities
• Develop GSCS(1) (through JV with capital markets)
• Develop credit platform to further promote the “originate to distribute” model in Euro and USD
• Develop FI origination, Asian and US FI platforms
• Further reduce arbitrage activities
• Refocus US equity business
• Refocus on commodities business
• Reduce activities in non-core geographies (e.g., outside Europe)
• Reduce businesses with insufficient scale
• Dispose non-core assets
• Increase sales force, further improve productivity
• Enhance liquidity through capital markets solutions
• Reinforce strategic equity derivatives solutions
November 9, 2011
Develop
Commercial Banking
Capital Markets
Structured Finance
9
(1) Global Structured Credit Solution

10
Agenda
1. Natixis Strategy
2. Financial structure and funding
3. Natixis 3Q11 & 9M11 results
4. Business divisions results
5. Conclusion
November 9, 2011

Improvement of financial structure in preparation of Basel 3 rules implementation
November 9, 2011 11
• Further improvement of Core Tier 1 ratio: 8.8% at end-september 2011, increasing 140 bps vs. 3Q10
• As part of capital base reinforcement in preparation of Basel 3, issuance of P3CI bonds for 6.9 bn€ and repayment of 2.3 bn€ of Deeply Subordinated Notes to BPCE with negligible impact on EPS
• Update of Basel 3 targets: above 9% Core Tier 1 ratio(1) on January 1st, 2013
(1) “Fully loaded” except for DTA

110.9 109.6
103.9 104.4
38.3 39.1
-1.2
+1.6
39.0
Sept. 30, 2010 Dec. 31, 2010(1) June 30, 2011(1) Activity & others Currency effect Sept. 30, 2011(1)
12
Risk weighted assets in bn€
Stable RWA in 3Q11 vs. 2Q11
(1) After application of new prudential treatment of the CCIs as risk weighted assets (370% of their equity method value) since December 31, 2010
RWA of CCIs
143.4 143.0 147.9
November 9, 2011

11.7% 11.4% 11.0%
11.6% 11.8%
7.4% 7.9% 8.1%
8.6% 8.8%
Sep. 30, 2010
Dec. 31, 2010
Mar. 31, 2011
Jun. 30, 2011
Sep. 30, 2011
Tier 1 Core Tier 1
13
(1) For periods before December 31, 2010, pro forma the prudential treatment of the CCIs as risk-weighted assets (370% of equity method value) (2) Net of interest on Deeply Subordinated Notes (3) Calculated on the number of shares after payment of the dividend: 3,077,142,553 shares excluding own control (total number of shares: 3,082,345,888 at Sept. 30, 2011)
Change in Tier 1 capital in bn€
Ratios (1)
Improvement of Core Tier 1 ratio to 8.8% in 3Q11, +140 bps vs. 3Q10
13
+140 bps
16.8 16.5 17 17 16.9
+0.3 +0.1
Dec. 31, 2010
New method
June 30, 2011 Net income
3Q11(2)
FX effect and
others
Sept. 30, 2011
Book value per share (3)
in € Sept. 30, 2011
Book value per share 5.37
November 9, 2011

P3CI operation: +200 bps of Core Tier 1 ratio(1) with negligible cost on EPS
November 9, 2011 14
• Natixis is optimizing its financial structure through issuance of P3CI bonds and simultaneous repayment of Tier 1 hybrid notes
• +200 bps Core Tier 1 ratio(1) at end-September 2011
• Negligible impact on EPS
(1) Based on the Core Tier 1 capital at end-september 2011

Natixis’ solvency optimization: P3CI operation
15
6.9 bn€
6.9 bn€
• Bond issuance by Natixis subscribed by BPCE for 6.9 bn€ (P3CI)
• Quarterly adjustement of P3CI nominal value to reflect the change of regulatory capital requirement for CCI
• 25.6 bn€ reduction of RWA (pro forma P3CI operation to be implemented beginning of 2012)
3.6 bn€
Natixis Balance-sheet (9/30/11)
Assets Liabilities
CC
I e
qu
ity m
eth
od
valu
e
P3
CI’ valu
e
Regulatory treatment
Guarantee mechanism
370% weighting
6.9 bn€
25.6 bn€
CCI guaranted by P3CI CCI’s RWA reduction
~ +200 bps(1)
CT1 impact
P3CI mechanism
(1) Based on the Core Tier 1 capital at end-September 2011
November 9, 2011

P3CI: negligible impact on EPS
16
• Natixis pays to BPCE a fixed annual interest rate on P3CI nominal value
• Simultaneous repayment of 2.3 bn€ Deeply Subordinated Notes (DSN) to BPCE
• Negligible impact of P3CI operation on the EPS
BPCE SA NATIXIS
Principals flows
Interest flows
• Net income attributable to shareholders impact ~ -11 m€ • RWA impact ~ -25.6 bn€
P3CI subcription: 6.9 bn€ Interests on P3CI(1) (P&L impact): ~ -324 m€ net
DSN repayment: 2.3 bn€ Reduction on interest expenses(1)(2) (Shareholders’ equity impact): ~ +167 m€ net
Senior loan repayment: 4.6 bn€ Reduction on interest expenses(2) (P&L impact): ~ +145 m€ net
November 9, 2011
(1) Definitive pricing conditions will be fixed at the time of the implementation of P3CI operation. The impact on EPS will be negligible (2) Following the reclassification of the Deeply Subordinated Notes as equity instruments, interest expenses on these instruments ceased to be recognized in the income statement
as of January 1st, 2010
x
x

17
End-Sept. 2011 Core Tier 1 ratio above 10% pro forma CRD3 and P3CI impacts
17
End-Sept. 2011 Core Tier 1 ratio above 10% pro forma CRD3 and P3CI impacts
(1) Pro forma P3CI operation to be implemented beginning of 2012 (2) CRD3 implemented on December 31, 2011
November 9, 2011
8.8%
~ +200 bps
~ - 60 bps
>10%
CT1 09/30/11 P3CI impact(1) CRD3 impact(2) CT1 09/30/11(1)

8.8%
8,8
10,2
10,2
> 10%
8,6
8,6
> 9%
~ +200 bps
~ -60 bps
~ +10 bps
~ -170 bps
~ +80 bps
9/30/2011 CT1
P3CI(1)
Basel 2.5 impact
Results(2) and activities
12/31/2011 CT1(1)
Basel 3 impact
Results(2) and activities
01/01/2013 CT1
18
New Basel 3 Core Tier 1 ratio target > 9% under Basel 3 on January 1st, 2013
18
Final impact subject to final Basel 3 rules
Core Tier 1 ratio above 9% on January 1st, 2013
(fully loaded except for DTA and without any mitigation and deleveraging effects)
(1) Pro forma P3CI operation to be implemented beginning of 2012 (2) Bloomberg consensus dated November 2, 2011. This consensus is neither validated nor verified, but is used purely as an illustration for indicative purposes
Basel 3 impact: ~ 24 bn€ increase in RWA Potential additional impact of deleveraging: not included
November 9, 2011

19
Groupe BPCE MLT Refinancing program & liquidity reserves
Refinancing structure of BPCE in 2011
36%
26%
21%
11%
6% Senior unsecured bond issues
"Obligations foncières"
Contractual covered bonds and housing bond
Bond issues placed in the BP and CE networks
Other MLT resources
11%
57%
32%
Public issuance to network customers
Public issuance to institutional customers
Private issuance & assimilated to institutional customers
November 9, 2011
• MLT refinancing in 2011 at 29.8 bn€ (o/w 27.3 bn€ market refinancing)
• 31.4 bn€ already raised at October 31, 2011 representing 105% of the annual program
• Average maturity of 5.2 years
• Access to diversified resources
47% of covered bond and 47% of senior unsecured
bond
3.5 bn€ distributed to retail customers through BP & CE
Networks
12% of the institutional public issuance made in the US market, representing 7% of the funds raised
• 2012 refinancing MLT program estimated at 21 bn€ (-23% vs. 2011) achievable with private and covered bond issuance
• Liquidity reserves of Groupe BPCE
• 97 bn€ available assets eligible to Central Banks refinancing program or possibly eligible to short term refinancing (as of September 30, 2011)
• 19 bn€ additionnal amout thanks to a securitization operation at the end of October 2011

20
Agenda
1. Natixis Strategy
2. Financial structure and funding
3. Natixis 3Q11 & 9M11 results
4. Business divisions results
5. Conclusion
November 9, 2011

9M11 9M10
9M11 vs.
9M10
4,989 4,775 4%
4,372 4,282 2%
(3,488) (3,184) 10%
1,500 1,591 (6)%
(211) (263) (20)%
450 338 33%
1,735 1,653 5%
1,294 1,439 (10)%
(34) (149) (77)%
1,260 1,290 (2)%
69.9% 66.7%
32.7% 11.0%
8.3% 8.4%
21
3Q11 & 9M11 results (reported)
(1) Intermediate aggregates down to pre tax-profit are calculated excluding GAPC, discontinued operations and restructuring costs (2) Corporate and Investment Banking, Investment Solutions and Specialized Financial Services (3) Including non operating items, o/w own senior debt fair-value adjustment included in net revenues: +191 m€ in 3Q11 and -40 m€ in 3Q10 – details in appendix
in m€ (1) 3Q11 3Q10
3Q11 vs.
3Q10
Net revenues 1,586 1,427 11%
Of which: core businesses (2) 1,224 1,336 (8)%
Expenses (1,112) (1,053) 6%
Gross operating income 473 375 26%
Provision for credit losses (91) (51) 78%
Associates (incl. CCI) 120 91 32%
Pre-tax profit 503 416 21%
Net income (group share)
excl. GAPC, discontinued operations and restructuring costs
366 340 8%
GAPC, discontinued operations and restructuring costs (after tax)
(22) (36) (39)%
Net income (group share) 344 305 13%
Cost/Income ratio 70.2% 73.8%
Effective tax rate 34.3% 19.0%
ROE 6.5% 5.3%
Quarterly results(3) 9 months results(3)
November 9, 2011

November 9, 2011 22
3Q11 non-operating items
• Greek sovereign debt impairment:
Natixis Assurances(1) (Investment Solutions) -27 m€
CEGC (SFS) -9 m€
Coface -4 m€
• Other non-operating items:
Impairment on Eiffage’ financial stake -39 m€
Fair-value adjustment on own senior debt +191 m€
Pre-tax impact
(1) Net of policyholders participation, 8% normative provision

23
3Q11 & 9M11 results excluding non-operating items(1)
9M11 9M10
Quarterly results(3)
3Q11 3Q10
(1) Detail in appendix – For net income, normative tax rate of 34.43% on non-operating items (2) Corporate and Investment Banking, Investment Solutions and Specialized Financial Services (3) Intermediate aggregates down to pre-tax profit are calculated excluding GAPC, discontinued operations and restructuring costs
• Net revenues 1,449 1,498
• Net revenues of core businesses(2) 1,239 1,362
• Retail network (equity method) 115 113
• Pre-tax profit 391 489
• Net Income (group share) 270 362
(3)%
(9)%
(20)%
(25)%
+2%
Pro forma of the integrations of GCE Paiement, Cicobail and Oceor Lease in 2010
in m€
9 months results(3)
• Net revenues 4,975 4,882
• Net revenues of core businesses(2) 4,387 4,382
• Retail network (equity method) 435 350
• Pre-tax profit 1,746 1,691
• Net income (group share) 1,267 1,325
+2%
stable
+3%
+24%
(4)%
November 9, 2011

24
Greek sovereign debt impairment
• Low banking exposure(1) at the end of September 2011: 8 m€ based on the EBA format used for the 2011 stress tests, valued on a mark-to-market basis
• Exposure of insurance companies, net of policyholders’ participation, amounts to 100 m€ (nominal value)
• Impairment of 40 m€ in 3Q11 (15 m€ in 2Q11), representing a total average write-down of 56% on the nominal value of Natixis net exposure:
27 m€ in 3Q11 for Natixis Assurances(2) (8 m€ in 2Q11 - Investment Solutions division - impact in cost of risk)
4 m€ in 3Q11 for Coface (1 m€ in 2Q11 - impact in cost of risk)
9 m€ in 3Q11 for CEGC (6 m€ in 2Q11(3) - Specialized Financial Services division – 3Q11 impact in revenues)
(1) Direct exposure on the banking book (2) Net of policyholders participation, 8% normative provision (3) Accounted as cost of risk in 2Q11, reclassified in net revenues in 3Q11
November 9, 2011

25
European sovereign exposures as of September 30, 2011, based on the EBA methodology used for European stress tests in July 2011 (banking and trading book – excluding Insurance activities)(1)
Net direct positions, in m€
(1) Full EBA template for European countries available in appendix (2) Including AFS banking book and FVO
November 9, 2011
9/30/2011 6/30/2011
Total of which:
banking book(2) of which:
trading book Total
of which: banking book(2)
of which: trading book
Greece 79 8 71 80 10 70
Ireland 0 0 0 0 0 0
Italy 378 0 376 1,421 11 1,407
Portugal 189 22 167 105 18 87
Spain 356 2 353 980 2 976
Total 1,002 32 967 2,586 41 2,540
• -38 m€ impact on net revenues in FICT activity (CIB) on European sovereign exposures in 3Q11

26
Normalizing cost of risk in 3Q11
(1) Annualized quaterly cost of risk on total amount of loans outstanding (excluding credit institutions), beginning of period (2) Core businesses: CIB, Investment Solutions, SFS / (3) Excluding Greek sovereign debt impairment (4) CEGC: 2Q11 impact of 6 m€ accounted in cost of risk, reclassified in net revenues in 3Q11
104
78
52 44
20
45
63
1Q10 2Q10 3Q10 4Q10 1Q11 2Q11 3Q11
14
Greek sovereign debt impairment(4)
52
39
26 23
10
22 33
1Q10 2Q10 3Q10 4Q10 1Q11 2Q11(3) 3Q11(3)
Cost of risk(1) of core businesses(2)(3) expressed in bps of loans outstanding
Provisions for credit losses of core businesses(3), in m€
21
November 9, 2011

27
Agenda
1. Natixis Strategy
2. Financial structure and funding
3. Natixis 3Q11 & 9M11 results
4. Business divisions results
5. Conclusion
November 9, 2011

28 28
CIB
(1) Annualized cost of risk on total amount of customer loans outstanding (excluding credit institutions), beginning of period (2) Source: The Cover / Euroweek-Covered Bond Awards 2011, based on the number of transactions
Slight decrease in ytd revenues (-5%)
675 731 821 810
542
38
3Q10 4Q10 1Q11 2Q11 3Q11
CIB quarterly revenues
• Slight decrease in ytd revenues (-5%)
• Revenues declined 20% in 3Q11 vs. 3Q10, reflecting exceptionally tough capital markets conditions. Excluding negative impact in FIC-T on sovereign exposures, revenues down 14% in 3Q11 vs. 3Q10
• Normalising cost of risk(1) at 29 bps in 3Q11 vs. 19 bps in 2Q11
• Natixis named Best Overall Bank for Covered Bonds in 2011(2)
Very challenging market conditions in 3Q11
21 15
0
19
29
3Q10 4Q10 1Q11 2Q11 3Q11
Cost of risk(1), in bps of customer loans outstanding
CIB ytd revenues, excluding CPM and others in m€
1,290 1,230
1,070 972
9M10 9M11
2,360 2,203
Capital Markets
Financing
November 9, 2011
Net revenues Negative impact on sovereign exposure

29
Quarterly and 9-months net revenues, in m€
CIB
• Ytd revenues of financing activities decreased 6% vs. last year
• 3Q11 Structured Financing’ revenues up 3% vs. 3Q10. Ytd revenues increase 4% vs. same period of 2010, fuelled by all business lines
• Good performance from Acquisition Finance and Real Estate activities
• New production at 3 bn€ in 3Q11 vs. 3.4 bn€ in 3Q10 and 5.8 bn€ in 2Q11
• Commercial Banking revenues impacted by deleveraging policy applied since mid-2009
Capital Markets
Good performance of Financing activities
• Revenues down 9% in 9M11 vs. 9M10, with a much reduced performance in 3Q11
• FICT: significant decline in 3Q11 revenues due to spreads widening and strong volatility. Low primary activity. -38 m€ impact on net revenues from European sovereign exposures
• Equity: sharp contraction of revenues in 3Q11 in a very difficult environment.
301 328 310
134 105 98
3Q10 2Q11 3Q11
Commercial Banking Structured Financing
435
Interest Rate, Foreign Exchange, Commodities & Treasury
-38
199 231
105
114
157
70
313
408
136
9M10 9M11
1,290 1,230
885 918
670 643
1,070 972
Financing
404 312
400 367
Equities & Corporate Solutions
389
432
November 9, 2011
-38
3Q10 2Q11 3Q11 9M10 9M11
Negative impact on sovereign exposure

30
Corporate and Investment Bank CIB
(1) See appendix for normative capital allocation methodology
in m€ 3Q11 3Q10 3Q11 vs.
3Q10 9M11 9M10 9M11 vs.
9m10
Net revenues 542 675 (20)% 2,173 2,296 (5)%
Capital Markets 136 313 (56)% 972 1,070 (9)%
Financing 408 435 (6)% 1,230 1,290 (5)%
CPM 23 (54) 19 (24)
Other (25) (19) (49) (40)
Expenses (391) (387) 1% (1,269) (1,209) 5%
Gross operating income 150 288 (48)% 904 1,087 (17)%
Provision for credit losses (41) (26) (75) (182)
Pre-tax profit 108 262 (59)% 828 905 (9)%
Cost/Income ratio 72.3% 57.4% 58.4% 52.7%
ROE(1) 6.7% 11.3% 15.9% 13.4%
November 9, 2011

Investment Solutions
Assets under management, in bn€
31
AM : strong negative market effect (-28 bn€) but +3.1 bn€ net inflows
533 533 536 525
+3
+17
(28)
AuM at June
30, 2011
Net inflows Currency
effect
Market
effect
AuM at Sept.
30, 2011
• 3Q11: +3.1 bn€ of net inflows
• In US and Asia, notably in Fixed income and Equity products, net inflows of 3.2 bn$ fuelled by Loomis and Harris Associates. Distribution still strong through NGAM centralized platform
• European market remains tough (notably due to significant decline of equity markets indexes) but positive net inflows in money market (+1.1 bn€)
• Europe
AuM of 309 bn€ at the end of 3Q11 (-3% ytd)
• US
AuM of 289 bn$ at the end of 3Q11 (-0.9% ytd)
Asset management activity in 3Q11
Quarterly net inflows, in bn€ Breakdown of AuM by asset type, end-Sept. 2011
27%
5%
3%
15% 6%
12%
30%
2% Fixed income
Real Estate
Alternative
Equities
Balanced
Money markets
Life insurance
Structured
525
-2.0 -1.7
0.1
2.5
3.1
3Q10 4Q10 1Q11 2Q11 3Q11
November 9, 2011

32
Focus on Insurance activity
Quarterly and 9M net revenues, in m€
Investment Solutions
51
69
31
3Q10 2Q11 3Q11
31
(1) Based on the nominal value of exposure through life insurance portfolios (2) Net of policyholders participation
November 9, 2011
9M10 9M11
145
171
+18%
Asset under management, in bn€
Sept. 30, 2010 Sept. 30, 2011
36.0 37.7
• Life Insurance : Increasing AuM in 3Q11 vs. 3Q10 to 37.7 bn€ (+4.7%) Positive net inflows in life insurance (123 m€
in 3Q11), outperforming the French market
• Personal protection turnover: 102 m€ up 9% vs. 3Q10 due to dynamic activity with BPCE networks
• Impact of Greek sovereign debt: additional impairment in 3Q11 led to 59% discount(1) on all maturities (21% at the end of 2Q11 on maturities before 2020):
27 m€ impact(2) on cost of risk in 3Q11 8 m€ impact(2) on cost of risk in 2Q11
• Limited exposure to GIIPS sovereign bonds (3.8% of general account total AuM end-October 2011)
• Negative equity market effect on financial revenues for life insurance

33
Investment Solutions Investment Solutions
in m€ 3Q11 3Q10 3Q11 vs.
3Q10 9M11 9M10 9M11 vs.
9M10
Net revenues 410 429 (4)% 1,355 1,290 5%
Asset Management 341 350 (3)% 1,062 1,019 4%
Insurance 31 51 (40)% 171 145 18%
Private Banking 24 23 7% 75 70 7%
Private Equity 14 5 47 56 (16)%
Expenses (336) (316) 6% (1,004) (928) 8%
Gross operating income 74 112 (34)% 351 362 (3)%
Provision for credit losses (32) (4) (44) (18)
Pre-tax profit 44 115 (62)% 314 354 (11)%
Cost/Income ratio 82.0% 73.8% 74.1% 71.9%
ROE(1) 8.9% 29.1% 24.8% 30.5%
(1) See appendix for normative capital allocation methodology
November 9, 2011

34
SFS
• Specialized Financial Services revenues up 5% to 272 m€ in 3Q11 vs. 3Q10, and up 6% to 844 m€ in 9M11 vs. 9M10, fuelled by business with BPCE networks
• Cost of risk of 6 m€ in 3Q11
• Cost-income ratio of 70.5% (vs. 74.9% in 3Q10)
• Pre-tax profit up 45% to 75 m€ in 3Q11 vs. 3Q10, including 9 m€ Greek sovereign debt impact
12%
9%
15%
16% 9%
27%
12% Factoring
Sureties and financial guarantees
Leasing
Consumer financing
Employee savings scheme
Payments
Securities Services
Breakdown of revenues by business in 3Q11
Fin
an
cia
l S
ervic
es
48
%
Sp
ecia
lized
Fin
an
cin
g
52
%
Specialized Financial Services: Strong pre-tax profit growth vs. 3Q10 Business aggregates
(1) Pro forma of the integrations of GCE Paiements, Cicobail and Oceor Lease in 2010
November 9, 2011
402 407
394 437
9M10 9M11
Specialized Financing
Financial Services
125 129
133 143
3Q10 3Q11
SFS revenues(1), in m€
+5%
+6%
51
74
56
77 75
3Q10 4Q10 1Q11 2Q11 3Q11
+45%
SFS pre-tax profit(1), in m€
796 844
258 272

35
SFS
Specialized Financing(1) Activity indicators
Consumer Finance 11 9.7
Loans Outstanding in bn€ (period-end)
Leasing 11.6 11
Loans Outstanding in bn€ (period-end)
Factoring 3.2 2.9 Loans Outstanding in bn€ in France
(period-end)
Sureties and Financial Guarantees 60.2 44.4
Gross premiums issued in m€
*Pro forma of the integrations of Cicobail and Oceor Lease and including impact of GCE Car Lease
Payments 805 742
Transactions in millions
Securities Services 2.8 2.8
Transactions in millions
Employee Savings Scheme 17.6 17.6 Assets under management in bn€ (period-
end)
3Q11 3Q10
+13%
+6%*
+12%
+36%
+8%**
-3%
stable
**Pro forma of the integration of GCE Paiements
Good commercial momentum in 3Q11
Financial Services(1)
November 9, 2011
(1) Pro forma of the integrations of GCE Paiements, Cicobail and Oceor Lease in 2010
Revenues up 7% to 143 m€ in 3Q11 vs. 3Q10, primarily fuelled by consumer finance
Consumer finance: revenues up 16% in 3Q11 vs. 3Q10, steady growth in revolving loans in the Banque Populaire and Caisse d’Epargne networks
Leasing: Non-real estate new business: 395 m€ (+27% vs. 3Q10); Real estate new business: 221 m€ (+22% vs. 3Q10)
Factoring: revenues 11% up in 3Q11 vs. 3Q10; increased in 51% of factored turnover on Corporate, notably thanks to cross-selling with CIB
Sureties & Financial Guarantees: strong growth in gross written premiums in 3Q11 (+36% qtq, to 60 m€)
Slight increase of revenues : +3% in 3Q11 vs. 3Q10 at 129.2 m€
Payments: revenues up by 5% to 73.4 m€ in 3Q11 vs. 3Q10, and a pre-tax profit up to 56 % to 13 m€ in the same period, driven by robust transaction cards and payment tools business
Employee Savings Scheme: revenues up by 9% in 3Q11 vs. 3Q10 at 23.2 m€ notably thanks to growth in Special Payment vouchers

36
Specialized Financial Services(1) SFS
(1) Pro forma of the integrations of GCE Paiements, Cicobail and Oceor Lease in 2010 (2) See appendix for normative capital allocation methodology
in m€ 3Q11 3Q10 3Q11 vs.
3Q10 9M11 9M10 9M11 vs.
9M10
Net revenues 272 258 5% 844 796 6%
Specialized Financing 143 133 7% 437 394 11%
Financial Services 129 125 3% 407 402 1%
Expenses (192) (193) (1)% (589) (581) 1%
Gross operating income 80 65 24% 255 215 19%
Provision for credit losses (6) (14) (48) (36)
Pre-tax profit 75 51 45% 208 180 15%
Cost/Income ratio 70.5% 74.9% 69.8% 73.0%
ROE(2) 17.6% 11.5% 16.7% 15.2%
November 9, 2011

515 519 535
Sept. 30,
2010
Dec. 31,
2010
Sept. 30,
2011
Savings and deposits
292 301 319
Sept. 30,
2010
Dec. 31,
2010
Sept. 30,
2011
Loans outstanding
37
Business indicators, in bn€
Contribution to Natixis’ net income
• Increase in equity method contribution of the retail banking networks by 35% vs. 3Q10 to 115 m€
• Excluding non-operating items (-28 m€ at Natixis level via CCI in 3Q10), the contribution is slightly higher vs. 3Q10 (+2%)
Good performances of BPCE networks Retail
Operating performance(1)
• Combined revenues increased 2% in 3Q11 vs. 3Q10, fuelled by higher commissions in both networks on the back of robust commercial activity
• Stable operating expenses in 3Q11 vs. 3Q10 leading to an improvement in cost-income ratio: 64.8% vs. 65.8%
• Cost of risk under control at 28 bps(2) of gross client loans outstanding vs. 30 bps(2) in 2Q11
• Total combined net profit of BPCE networks up 21% to 537 m€ vs. 3Q10, a comparison base adversely impacted by one-off items (90 m€ fine from French anti-trust authority and 50 m€ impact from harmonization of BP’ portfolio-based provision methodology with CE)
(1) Combined accounts for CE and BP (2) Expressed in annualized basis point relative to gross amount of customer loans outstanding beginning of period – excluding Greek sovereign debt impairment and
excluding non-recurring impairment
November 9, 2011

Total loans outstanding, in bn€
Total loans outstanding, in bn€ Annual growth rate of savings, in %
38
Banques Populaires
• Growth in number of clients vs. 3Q10 • Active Retail customers: +2.1%
• Active Professionals : +3.1%
• Active Corporates: +3.3%
• On-balance sheet savings: + 9.4% (excluding centralized savings)
• Livret: +10.2%
• Term deposit of Professionals and Corporates: +13.9%
• Loans outstanding: +5.8% to 153 bn€ • Mortgage: +8.2% • Equipment loans: +4.0%
Caisses d'Epargne
• Growth in number of clients vs. 3Q10
• Active Retail customers: +2.8%
• Active Professionals : +7.8%
• Active Corporates: +9.8%
• On-balance sheet savings: + 8.9%
(excluding centralized savings)
• Livret: +4.9%
• Placement of BPCE bonds in the network: +10.7%
• Loans outstanding:+12.5% to 166 bn€ • Mortgage: +13.3%
• Equipment loans: +15.1%
Retail banking networks – Business indicators
Annual growth rate of savings, in %
(1) Excluding centralized saving
Retail
90 93 100
58 62 66
Sept. 30, 2010
Dec. 31, 2010
Sept. 30, 2011
79 81 84
65 65 68
Sept. 30, 2010
Dec. 31, 2010
Sept. 30, 2011
Retail
Professional, Corporate and Institutional
Retail
Professional, Corporate and Institutional
144 146 153
148 155 166
5.8%
8.7%
10.4% 9.4%
0.1% 0.2% 2.1%
-2.2%
4Q10/4Q09 1Q11/1Q10 2Q11/2Q10 3Q11/3Q10
On-balance sheet savings(1)
Financial savings
6.1% 6.7%
8.2% 8.9%
2.5% 1.9% 1.3% 1.5%
4Q10/4Q09 1Q11/1Q10 2Q11/2Q10 3Q11/3Q10
On-balance sheet savings(1)
Financial savings
November 9, 2011

39
Retail
in m€ 3Q11 3Q10 3Q11 vs.
3Q10 9M11 9M10 9M11 vs.
9M10
Net revenues 3,144 3,088 2% 9,845 9,725 1%
Banques Populaires 1,531 1,496 2% 4,760 4,603 3%
Caisses d'Epargne 1,613 1,592 1% 5,085 5,122 (1)%
Expenses (2,038) (2,031) 0% (6,289) (6,249) 1%
Gross operating income 1,106 1,057 5% 3,556 3,476 2%
Provision for credit losses (318) (304) 5% (760) (816) (7)%
Pre-tax profit 795 730 9% 2,819 2,441 15%
Net Income, group share 537 442 21% 1,875 1,550 21%
Equity method contribution 115 85 35% 435 322 35%
Economic contribution to Natixis' equity method result
81 50 61% 331 216 53%
Retail banking networks
November 9, 2011

334 330 342 349 347
77 84 79 82 67
3Q10 4Q10 1Q11 2Q11 3Q11
40
Coface: improvement in profitability Financial
Investments
57%
36%
56%
49% 47%
3Q10 4Q10 1Q11 2Q11 3Q11
Coface - Loss ratio(1)
• Improvement in loss ratio to 47% in 3Q11 vs. 57% in 3Q10(1)
• Net revenues up 25% to 227 m€ in 3Q11 vs. 3Q10
• Pre-tax profit up 22% to 52m€ in 3Q11 vs. 2Q11, and up 94% vs. 3Q10
Coface – Turnover, in m€
• Credit Insurance turnover up 4% in 3Q11 vs. 3Q10
• Total turnover up 1% to 414 m€ in 3Q11 vs. 3Q10
-10 pps
(1) A new methodology for loss ratio calculation is used since 3Q11. The management costs of sinister included in the new ratio
410 413 421 431 414
Factoring & services Credit insurance
November 9, 2011

41
Financial Investments (incl. Coface)
in m€ 3Q11 3Q10 3Q11 vs.
3Q10 9M11 9M10 9M11 vs.
9M10
Net revenues 223 189 18% 661 602 10%
Coface 227 181 25% 640 565 13%
Proprietary private equity (16) (3) (14) 4
Natixis Algérie 12 11 6% 35 34 4%
Expenses (180) (168) 7% (541) (528) 2%
Gross operating income 43 22 x2 121 74 62%
Provision for credit losses (8) (5) (38) (20)
Pre-tax profit 38 12 x3 82 56 47%
Cost/Income ratio 80.5% 88.6% 81.8% 87.7%
Financial Investments
November 9, 2011

42
GAPC: low impact on net income in 3Q11
• Portfolio managed proactively in difficult conditions, with 0.2 bn€ assets disposals in 3Q11
• RWA after the BPCE guarantee declined by 39% to 6.0 bn€ vs. 3Q10
• Low impact on the net income in 3Q11 (-22 m€)
(1) o/w call option value adjustment, premium accrual, financial guarantee and TRS impacts
in m€ 3Q10 4Q10 1Q11 2Q11 3Q11
Impact excluding the guarantee 96 105 39 16 (18)
Impact of the guarantee (1) (87) (103) (29) 16 17
Operating expenses (39) (55) (35) (38) (31)
Pre-tax profit (31) (53) (25) (6) (31)
Net income (21) (37) (18) (4) (22)
9.9
7.4 6.6 6.5 6.0
3Q10 4Q10 1Q11 2Q11 3Q11
-39%
RWA after the BPCE guarantee, in bn€
November 9, 2011

43
Agenda
1. Natixis Strategy
2. Financial structure and funding
3. Natixis 3Q11 & 9M11 results
4. Business divisions results
5. Conclusion
November 9, 2011

44
Conclusion
• New Deal strategy enabled to significantly deleverage Natixis while improving profitability since 2009
• Adaptation to the changing environment will lead to additional reduction in RWA and liquidity needs at end-2013
• Financial structure is substantially strenghtened with P3CI operation, in preparation of Basel 3 rules implementation with non-dilutive impact on EPS
• Natixis has delivered resilient 3 months 2011 results and robust 9 months 2011 results in a very challenging environment, illustrating the strength of the business model based on three core businesses and retail banking contribution
November 9, 2011
45
Appendix – Detailed Results (3Q11) A
November 9, 2011

European sovereign exposures as of September 30, 2011, based on the EBA methodology used for European stress tests in July 2011 (banking and trading book – excluding Insurance activities)
46 November 9, 2011
European Economic Area GROSS EXPOSURE NET EXPOSURE
DIRECT EXPOSURE
TO DERIVATIVES
INDIRECT
EXPOSURE
in m€
Of which
loans and
advances
Of which
AFS banking
book
Of which
banking book
Of which
trading book
Trading book
Austria 53 0 20 0 0 20 0 (2)
Belgium 162 0 137 0 5 132 40 (2)
Bulgaria 0 0 0 0 0 0 0 0
Cyprus 0 0 0 0 0 0 1 0
Czech Republic 0 0 0 0 0 0 0 0
Denmark 0 0 0 0 0 0 (31) (1)
Estonia 0 0 0 0 0 0 0 0
Finland 78 0 78 0 0 78 (11) (2)
France 10,702 945 5,661 1,321 39 3,357 (817) 2
Germany 2,743 0 538 0 0 538 0 11
Greece 79 0 79 0 8 71 0 67
Hungary 0 0 0 0 0 0 0 0
Iceland 0 0 0 0 0 0 0 0
Ireland 0 0 0 0 0 0 0 23
Italy 1,976 2 378 0 0 376 0 (7)
Latvia 0 0 0 0 0 0 0 0
Liechtenstein 0 0 0 0 0 0 0 0
Lithuania 63 0 63 0 0 63 (36) (40)
Luxembourg 1 0 1 0 0 1 0 0
Malta 0 0 0 0 0 0 0 0
Netherlands 1,416 0 616 0 0 616 (243) (2)
Norway 0 0 0 0 0 0 0 (2)
Poland 15 0 5 0 2 3 0 (1)
Portugal 192 0 189 0 22 167 0 19
Romania 0 0 0 0 0 0 0 0
Slovakia 0 0 0 0 0 0 0 0
Slovenia 0 0 0 0 0 0 0 0
Spain 1,730 1 356 0 2 353 0 (3)
Sweden 0 0 0 0 0 0 0 2
United Kingdom 3 1 3 0 2 0 0 (2)
TOTAL EEA 30 19,212 949 8,125 1,321 79 5,777 (1,097) 60

9M11 9M10
9M11 vs.
9M10
4,975 4,882 2%
4,387 4,382 0%
(3,488) (3,283) 6%
1,486 1,599 (7)%
(186) (259) (28)%
450 366 23%
1,746 1,691 3%
1,301 1,474 (12)%
(34) (149)
1,267 1,325 (4)%
70.1% 67.2%
47
3Q11 & 9M11 results excluding non- operating items
(1) Intermediate aggregates down to pre -tax profit are calculated excluding GAPC, discontinued operations and restructuring costs (2) Corporate and Investment Bank, Investment Solutions and Specialized Financial Services / (3) Pro forma the integrations of GCE Paiements, Cicobail and Oceor Lease in 2010 and
excluding non operationg items
in m€ (1) 3Q11 3Q10
3Q11 vs.
3Q10
Net revenues 1,449 1,498 (3)%
Of which : core businesses (2) 1,239 1,362 (9)%
Expenses (1,112) (1,079) 3%
Gross operating income 336 419 (20)%
Provision for credit losses (66) (50) 31%
Associates (incl. CCI) 120 119 1%
Pre-tax profit 391 489 (20)%
Net income (group share)
excl. GAPC, discontinued operations and restructuring costs
292 398 (27)%
GAPC, discontinued operations and restructuring costs (after tax)
(22) (36)
Net income (group share) 270 362 (25)%
Cost/Income ratio 76.8% 72.0%
Quarterly results(3) 9 months results(3)
Pro forma the integrations of GCE Paiement, Cicobail and Oceor Lease in 2010
November 9, 2011

48
Net revenues(1)(2) in m€
(2)
189 223
3Q10 3Q11
+18%
Core businesses(2)
Financial Investments
Corporate Center(3)
(1) Excluding GAPC and discontinued operations (2) Pro forma of,the integrations of GCE Paiements, Cicobail and Oceor Lease in 2010 (3) Impact of own debt fair-value adjustment of +191 m€ in 3Q11, +68m€ in 9M11, -40m€ in 3Q10 and +8m€ in 9M10
Quarterly and 9-month revenues
1,362 1,224
3Q10 3Q11
(10)%
(2)
602 661
9M10 9M11
+10%
-96 -44
9M10 9M11
4,382 4,372
9M10 9M11
stable
-93
139
3Q10 3Q11
November 9, 2011

49
Pre-tax profit(1)(2) in m€
478 307
3Q10 3Q11
(36)%
38 12
3Q10 3Q11
x3%
-69
158
3Q10 3Q11
Core businesses(2)
and Retail (via CCI)
Financial Investments
Corporate Center(3)
Quarterly and 9-month pre-tax profit
1,656 1,680
9M10 9M11
+1%
82 56
9M10 9M11
+47%
-42 -28
9M10 9M11
(1) Excluding GAPC and discontinued operations (2) Pro forma of,the integrations of GCE Paiements, Cicobail and Oceor Lease in 2010 (3) Impact of own debt fair-value adjustment of +191m€ in 3Q11, +68m€ in 9M11, -40m€ in 3Q10 and +8m€ in 9M10
November 9, 2011

50
(1) Intermediate aggregates down to underlying net income (Group share) are calculated before taking into account net income of discontinued operations and net restructuring
costs . Pro forma the integrations of GCE Paiements, Cicobail and Oceor Lease in 2010
Natixis – Consolidated
November 9, 2011
in m€ (1) 1Q10 2Q10 3Q10 4Q10 1Q11 2Q11 3Q11
Net revenues 1 681 1 686 1 382 1 747 1 621 1 831 1 560
Expenses (1 163) (1 129) (1 117) (1 280) (1 219) (1 230) (1 143)
Gross Operating Income 517 556 265 467 403 601 417
Provision for credit losses ( 105) ( 50) 34 ( 51) ( 20) ( 107) ( 66)
Associates (including CCIs) 143 104 91 161 153 177 120
Gain or loss on other assets ( 15) ( 1) 2 ( 10) ( 4) ( 1) 1
Change in value of goodwill 0 ( 0) 0 ( 0) 0 0 ( 0)
Pre-tax profit 541 609 391 568 532 670 471
Tax ( 50) ( 46) ( 55) ( 97) ( 126) ( 161) ( 121)
Minority interest ( 8) ( 8) ( 13) ( 7) ( 4) ( 4) ( 7)
Net income (group share) excl.
discontinued operations and
restructuring costs
483 555 323 465 402 505 344
Net income from discontinued
activities 0 ( 9) 0 0 22 0 0
Net restructuring costs ( 17) ( 17) ( 15) ( 22) ( 12) 0 0
Net income (group share) 466 528 308 443 412 505 344

Natixis excluding GAPC, discontinued operations and restructuring costs(1)
51 November 9, 2011
(1) Pro forma the integrations of GCE Paiements, Cicobail and Oceor Lease in 2010
in m€ (1) 1Q10 2Q10 3Q10 4Q10 1Q11 2Q11 3Q11
Net revenues 1 668 1 763 1 458 1 753 1 635 1 768 1 586
Expenses (1 122) (1 082) (1 079) (1 225) (1 184) (1 192) (1 112)
Gross Operating Income 546 680 379 528 452 576 473
Provision for credit losses ( 118) ( 91) ( 50) ( 59) ( 44) ( 76) ( 91)
Associates (including CCIs) 143 104 91 161 153 177 120
Gain or loss on other assets ( 15) ( 1) 2 ( 10) ( 4) ( 1) 1
Change in value of goodwill 0 ( 0) 0 ( 0) 0 0 ( 0)
Pre-tax profit 556 693 421 621 557 675 503
Tax ( 54) ( 71) ( 64) ( 113) ( 133) ( 162) ( 130)
Minority interest ( 8) ( 8) ( 13) ( 7) ( 4) ( 4) ( 7)
Net income (group share) excl.
GAPC, discontinued operations
and restructuring costs
493 613 344 502 420 509 366
Net income from GAPC ( 10) ( 59) ( 21) ( 37) ( 18) ( 4) ( 22)
Net income from discontinued
activities 0 ( 9) 0 0 22 0 0
Net restructuring costs ( 17) ( 17) ( 15) ( 22) ( 12) 0 0
Net income (group share) 466 528 308 443 412 505 344
52
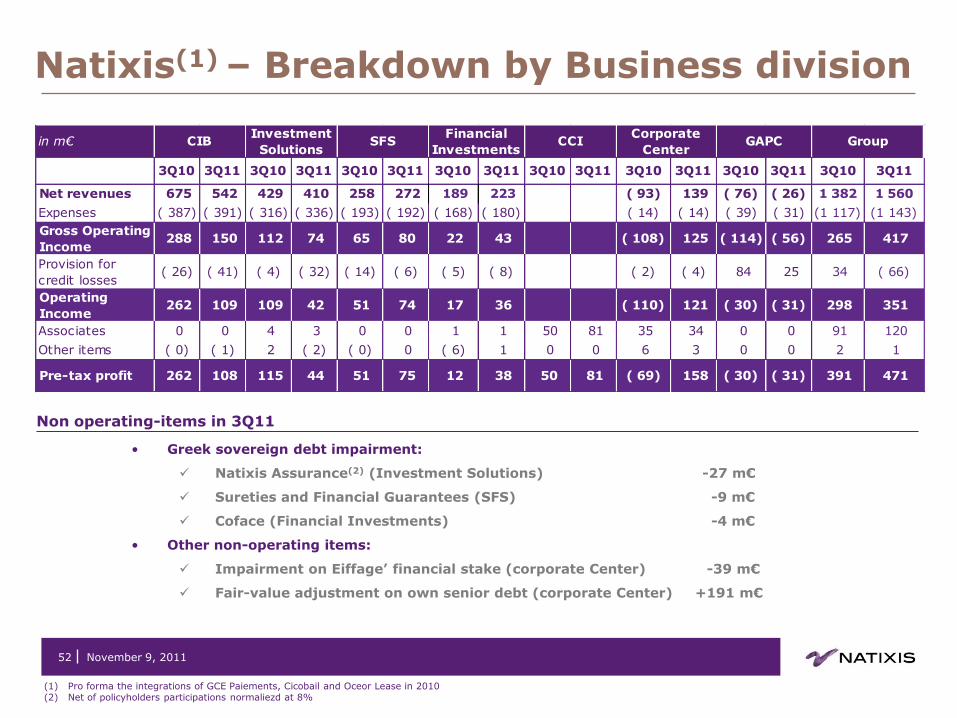
Natixis(1) – Breakdown by Business division
November 9, 2011
(1) Pro forma the integrations of GCE Paiements, Cicobail and Oceor Lease in 2010 (2) Net of policyholders participations normaliezd at 8%
in m€
3Q10 3Q11 3Q10 3Q11 3Q10 3Q11 3Q10 3Q11 3Q10 3Q11 3Q10 3Q11 3Q10 3Q11 3Q10 3Q11
Net revenues 675 542 429 410 258 272 189 223 ( 93) 139 ( 76) ( 26) 1 382 1 560
Expenses ( 387) ( 391) ( 316) ( 336) ( 193) ( 192) ( 168) ( 180) ( 14) ( 14) ( 39) ( 31) (1 117) (1 143)
Gross Operating
Income 288 150 112 74 65 80 22 43 ( 108) 125 ( 114) ( 56) 265 417
Provision for
credit losses( 26) ( 41) ( 4) ( 32) ( 14) ( 6) ( 5) ( 8) ( 2) ( 4) 84 25 34 ( 66)
Operating
Income 262 109 109 42 51 74 17 36 ( 110) 121 ( 30) ( 31) 298 351
Associates 0 0 4 3 0 0 1 1 50 81 35 34 0 0 91 120
Other items ( 0) ( 1) 2 ( 2) ( 0) 0 ( 6) 1 0 0 6 3 0 0 2 1
Pre-tax profit 262 108 115 44 51 75 12 38 50 81 ( 69) 158 ( 30) ( 31) 391 471
GAPC GroupCIBInvestment
SolutionsSFS
Financial
InvestmentsCCI
Corporate
Center
• Greek sovereign debt impairment:
Natixis Assurance(2) (Investment Solutions) -27 m€
Sureties and Financial Guarantees (SFS) -9 m€
Coface (Financial Investments) -4 m€
• Other non-operating items:
Impairment on Eiffage’ financial stake (corporate Center) -39 m€
Fair-value adjustment on own senior debt (corporate Center) +191 m€
Non operating-items in 3Q11

53
Earning per share(1)
(1) Calculated on the average number of outstanding shares in 9M11 (2) Incl. coupon on Deeply Subordinated Notes, net of taxes
Equity allocation
in € 9M11
Natixis 0.36
• For the Core Businesses, the Retail Networks via CCIs and the Financial Investments, capital allocated represents 7% of the RWA beginning of the period
• Natixis Assurances (Investment Solutions) and CEGC (SFS) have specific capital allocation based on 65% of their regulatory capital requirement
3Q11 normative equity allocation and RWA
in bn€ RWA (end of
period in 3Q11)
Capital Allocated (based on RWA beginning
of period)
CIB 66.6 4.5
SFS 12.5 1.1
Investment Solutions 7.8 1.3
Retail Network via CCIs 39.0 2.7
Financial Investments
7.4 1.4
November 9, 2011
Cost of Hybrid notes net of tax(2)
in m€ 3Q11
Natixis 63

54
Natixis – Non-operating items(1)
(1) Excl. discontinued activities, net restructuring costs and GAPC (2) Pro forma of the integrations of GCE Paiements, Cicobail and Oceor Lease in 2010
in m€ 3Q09 4Q09 1Q10 2Q10 3Q10 4Q10 1Q11 2Q11 3Q11
Natixis pre-tax profit (2) 374 628 556 692 421 621 557 675 503
FV gain / (losses) on own debt (senior debt) Corporate Center
Net revenues ( 319) 18 ( 2) 49 ( 40) 38 ( 108) ( 15) 191
Greek sovereign debt impairment on Insurance Investments Solutions
Cost of risk (27)
Greek sovereign debt impairment on Sureties and Financial Guarantees
SFS
Net revenues
(15)
Greek sovereign debt impairment on Sureties and Financial Guarantees
SFS Cost of risk 6
Greek sovereign debt impairment on Coface Financial Investments
Cost of risk
(4)
Impairment on Eiffage financial stake (4.5% of capital holding)
Corporate Center
Net revenues (39)
Capital gain recognized as a consequence of BPCE tender offers on Natixis’ hybrid instruments and closing positions on related hedging positions
Corporate Center
Net revenues 460
Requalification of the deeply subordinated notes as equity instruments
Corporate Center
Net revenues 398
Impairments (Private Banking et NPE)
Investment Solutions
Provision for credit losses
( 21)
Corporate Center
Non operating items
( 35)
CCI impairments Retail Associates ( 77)
CCI: Fine from French Competition Authority and change in provisioning methodology at Banques Populaires
Retail Associates ( 28)
Capital gain from VR Factorem sale SFS Non operating items
13
Coface impairments
Financial Investments
Net revenues ( 10)
Financial Investments
Expenses ( 10)
Financial Investments
Provision for credit losses
( 14)
Financial Investments
Non operating items
( 12)
Non-operating items pre-tax impact 141 283 ( 2) 49 ( 68) 6 ( 108) ( 15) 112
Natixis pre-tax profit excluding non operating items(2) 233 345 558 644 489 615 665 691 391
November 9, 2011

55
Corporate and Investment Bank
November 9, 2011
in m€ 1Q10 2Q10 3Q10 4Q10 1Q11 2Q11 3Q11
Net revenues 793 828 675 731 821 810 542
Commercial banking 136 135 134 119 110 105 98
Structured financing 270 313 301 334 281 328 310
Capital Markets 399 358 313 372 447 389 136
CPM ( 16) 46 ( 54) ( 36) 0 ( 4) 23
Other 3 ( 24) ( 19) ( 58) ( 16) ( 7) ( 25)
Expenses ( 416) ( 406) ( 387) ( 440) ( 436) ( 441) ( 391)
Gross Operating Income 377 422 288 290 385 369 150
Provision for credit losses ( 97) ( 60) ( 26) ( 21) ( 2) ( 32) ( 41)
Operating Income 281 362 262 270 383 337 109
Associates 0 0 0 0 0 0 0
Other items 1 ( 0) ( 0) ( 0) ( 0) ( 0) ( 1)
Pre-tax profit 282 362 262 269 383 337 108

• Optimize scarce resource allocation on profitable businesses
• Reduce principal trading / arbitrage
56 November 9, 2011
Confirmation of Natixis CIB business model priorities
• Carefully monitor credit risk through dedicated risk policy
Issuers Investors
• Provide distinctive sector-driven expertise
• Expand strategic debt platform (originate to distribute and develop primary bonds)
• Preserve core client franchise, large corporates and mid markets
• Develop cross selling opportunities
• Support clients with CM products1 through capital structure advisory and, Equity Finance and ALCM solutions
Large corp. and mid markets core European FIG, Sovereign, Supras worldwide energy, commodities WorldWide
FIG clients (European, US and Asian)
Client
focus
De-r
iskin
g
Inte
gra
ted
bank
(1)E.g., ECM, DCM, rates, credit
• Optimize Group funding through client deposits and new liquidity sources (e.g. Credit Funds)
• Develop cooperation between capital markets and structured finance (e.g., GSCS)
November 9, 2011

57
Investment Solutions
November 9, 2011
in m€ 1Q10 2Q10 3Q10 4Q10 1Q11 2Q11 3Q11
Net revenues 425 436 429 499 472 473 410
Asset Management 324 345 350 394 365 356 341
Insurance 66 28 51 68 71 69 31
Private Banking 22 26 23 24 25 26 24
Private Equity 14 38 5 13 11 22 14
Expenses ( 305) ( 307) ( 316) ( 352) ( 328) ( 339) ( 336)
Gross Operating Income 120 129 112 147 144 133 74
Asset Management 74 93 90 101 94 85 76
Insurance 40 0 24 43 44 38 ( 6)
Private Banking ( 2) 3 ( 1) ( 0) 1 ( 3) ( 4)
Private Equity 9 32 ( 1) 3 5 14 8
Provision for credit losses 1 ( 15) ( 4) ( 8) ( 0) ( 12) ( 32)
Operating Income 121 114 109 140 144 121 42
Associates 4 4 4 7 3 5 3
Other items ( 1) ( 2) 2 ( 3) ( 2) ( 1) ( 2)
Pre-tax profit 123 116 115 144 146 125 44

Investment Solutions business mix
58
40
39 39
40 40
39 39 42 42
30 27
24 23 20
1,445 1,252
1,621 1,406
1,631
5%
Investment Solutions
November 9, 2011
Asset Management: geographical breakdown, on September 30, 2011
40
39 39
40 40
39 39 42 42
30 27
24 23 20
+5% 1,290
1,355
1,0191,062
145
17170
7556
47
9M10 9M11
Asset management
Insurance
Private Banking
Private Equity
Net revenues by division, in m€
June 30, 2011 Sept. 30, 2011
533 525
Asset management Insurance Private banking
Assets under Management, in bn€
37.8 37.7
June 30, 2011 Sept. 30, 2011
20.1 18.6
June 30, 2011 Sept. 30, 2011
59%
41%
Europe
US et autres
58

59
Specialized Financial Services(1) (SFS)
(1) Pro forma the integrations of GCE Paiements, Cicobail and Oceor Lease in 2010
November 9, 2011
in m€ 1Q10 2Q10 3Q10 4Q10 1Q11 2Q11 3Q11
Net revenues 257 280 258 278 271 301 272
Specialized Financing 129 132 133 138 141 153 143
Factoring 28 30 30 31 30 35 33
Sureties & Financial guarantees 24 19 27 27 26 26 24
Leasing 38 43 37 38 40 49 41
Consumer Financing 35 35 36 38 42 41 42
Film Industry Financing 4 4 3 3 3 3 4
Financial Services 129 148 125 140 130 148 129
Employee Savings Scheme 23 29 21 27 25 32 23
Payments 69 71 70 74 71 73 73
Securities Services 36 49 34 39 33 43 33
Expenses ( 192) ( 195) ( 193) ( 204) ( 196) ( 202) ( 192)
Gross Operating Income 65 85 65 75 75 99 80
Provision for credit losses ( 13) ( 9) ( 14) ( 13) ( 20) ( 22) ( 6)
Operating Income 52 76 51 61 55 77 74
Associates 0 0 0 0 0 0 0
Other items 0 ( 0) ( 0) 12 0 ( 0) 0
Pre-tax profit 52 76 51 74 56 77 75
Specialized Financing 43 48 43 53 45 49 57
Financial Services 9 28 8 21 11 28 18

60
Financial Investments
November 9, 2011
in m€ 1Q10 2Q10 3Q10 4Q10 1Q11 2Q11 3Q11
Net revenues 210 203 189 267 212 226 223
Coface 187 196 181 235 200 212 227
Proprietary private equity 13 ( 6) ( 3) 19 1 1 ( 16)
Others 10 13 11 13 10 13 12
Expenses ( 176) ( 185) ( 168) ( 220) ( 183) ( 179) ( 180)
Gross Operating Income 34 19 22 47 29 48 43
Provision for credit losses ( 7) ( 9) ( 5) ( 15) ( 15) ( 15) ( 8)
Operating Income 27 10 17 33 14 32 36
Associates 2 2 1 2 1 2 1
Other items 4 ( 0) ( 6) ( 18) ( 5) 0 1
Pre-tax profit 33 11 12 16 11 34 38

61
CCI Contribution
November 9, 2011
in m€ 1Q10 2Q10 3Q10 4Q10 1Q11 2Q11 3Q11
Equity method accounting
(20%)
124 97 87 132 130 138 107
Accretion profit 23 11 8 29 22 35 10
Revaluation difference ( 10) ( 10) ( 10) ( 9) ( 2) ( 3) ( 2)
Equity method contribution 138 99 85 152 149 170 115
o/w Banques Populaires 59 34 27 59 67 81 47
o/w Caisses d'Epargne 78 65 59 93 82 89 68
Restatement ( 35) ( 35) ( 35) ( 35) ( 34) ( 35) ( 34)
Economic contribution
to Natixis' equity method result 103 64 50 117 116 135 81

62
Corporate center
November 9, 2011
in m€ 1Q10 2Q10 3Q10 4Q10 1Q11 2Q11 3Q11
Net revenues ( 18) 15 ( 93) ( 22) ( 141) ( 42) 139
Expenses ( 33) 11 ( 14) ( 10) ( 41) ( 32) ( 14)
Gross Operating Income ( 51) 26 ( 108) ( 32) ( 182) ( 74) 125
Provision for credit losses ( 2) 2 ( 2) ( 2) ( 7) 6 ( 4)
Operating Income ( 53) 28 ( 110) ( 34) ( 188) ( 68) 121
Associates 35 36 35 35 33 35 34
Other items ( 19) 1 6 ( 1) 1 1 3
Pre-tax profit ( 37) 64 ( 69) 0 ( 154) ( 32) 158

63
GAPC
November 9, 2011
in m€ 1Q10 2Q10 3Q10 4Q10 1Q11 2Q11 3Q11
Net revenues 13 ( 77) ( 76) ( 6) ( 14) 63 ( 26)
Expenses ( 42) ( 47) ( 39) ( 55) ( 35) ( 38) ( 31)
Gross Operating Income ( 29) ( 124) ( 114) ( 60) ( 49) 25 ( 56)
Provision for credit losses 14 40 84 8 24 ( 31) 25
Pre-tax profit ( 15) ( 84) ( 30) ( 53) ( 25) ( 6) ( 31)
Net income ( 10) ( 59) ( 21) ( 37) ( 18) ( 4) ( 22)

64
Guaranteed portfolios (Financial Guarantee & TRS)
Others portfolios
GAPC – Detailed exposure as of 9/30/2011
Type of assets RWA in bn€
VaR 3Q11
(nature of portfolios) 09/30/11 in m€
Complex derivatives (credit) 0.2 0.5
Complex derivatives (interest rate) 1.1 3.8
Complex derivatives (equity) 0.1 0.1
Fund-linked structured products 0.6 0.3
Type of assets Notional Net value Discount
rate
RWA
(nature of portfolios) in bn€ in bn€ before guarantee in bn€
ABS CDOs 1.4 0.5 67%
12.5
Other CDO 6.5 4.8 27%
RMBS 3.9 3.2 19%
Covered bonds 0.0 0.0
CMBS 0.4 0.3 31%
Other ABS 0.5 0.5 7%
Hedged assets 9.6 8.9 7%
Corporate credit portfolio 3.9 3.9
Total 26.4 22.0
o/w non-guaranteed RMBS agencies 1.3 1.3
Total guaranteed (85%) 25.0 20.8
November 9, 2011

65
Doubtful loans
in bn€ 3Q10 4Q10 1Q11 2Q11 3Q11
Doubtful loans(1) 3.9 3.9 3.6 3.5 3.9
Collateral relating to loans written-down(1) (0.5) (0.6) (0.6) (0.6) (0.9)
Provisionable commitments(1) 3.4 3.3 3.0 2.8 2.9
Specific provisions(1) (2.0) (2.0) (1.8) (1.8) (1.9)
Portfolio-based provisions 1) (0.8) (0.8) (0.8) (0.7) (0.6)
Provisionable commitments(1)/ Gross debt 3.3% 3.1% 2.8% 2.7% 2.5%
Specific provisions/Provisionable commitments(1) 57% 60% 61% 64% 65%
Overall provisions/ Provisionable commitments(1) 80% 85% 87% 87% 87%
(1) Excluding GAPC
November 9, 2011

20.8 20,8
17,6 17,5 16,9
12,6 12.6 12,6
16.9 16,9
23,2 22.4 +0.5
(3.6) (0.1) (0.6)
(4.3) +4.3
+6.3
(0.7)
Sh
areh
old
er's
eq
uit
y
gro
up
sh
are
To
tal C
ap
ital
Min
orit
y in
terest
(exclu
din
g h
yb
rid
s)
Co
re T
ier 1
C
ap
ital Tie
r 1
Cap
ital
Go
od
wil
l &
in
tan
gib
les
Div
iden
d f
or t
he p
erio
d
Oth
er d
ed
ucti
on
s (
o/
w
Fin
an
cia
l in
vestm
en
ts)
Hyb
rid
s r
ecla
ssif
i-
cati
on
in
Tie
r 1
(1
)
Tie
r 2
Cap
ital
Oth
er d
ed
ucti
on
s
Rein
teg
rati
on
of
hyb
rid
s in
Tie
r 1
C
ap
ital
66
Regulatory capital in 3Q11 & financial structure
(1) Including capital gain following reclassification of hybrids as equity instruments (2) Before application of new prudential treatment of the CCIs as risk weighted assets (370% of their equity method value) at December 31, 2010
November 9, 2011
in bn€ 3Q10 4Q10 1Q11 2Q11 3Q11
Tier 1 Ratio 11.2% 11.4% 11.0% 11.6% 11.8%
Solvency Ratio 12.8% 15.7% 15.0% 15.6% 15.6%
Tier 1 capital 12.4 16.8 15.9 16.5 16.9
Equity group share 21.4 20.9 20.3 20.6 20.8
RWA 110.9(2) 147.9 144.9 143.0 143.4
Total assets 527 458 458 453 507
Regulatory capital in

55 55
67
• Assets in USD represent around 8% of total balance sheet at September 30, 2011 • Lengthening of ressources maturity • Replacement of US money market funding (USCP) by EUR money market funding (CDs, ECP)
• Use of EUR / USD swaps • Development of alternative sources for USD funding (Asia, Middle East)
Natixis Balance-sheet in USD
9
17
22
Commercial Banking
Capital Markets
GAPC
Structured Financing
Long term
November 9, 2011
Balance-sheet at 09/30/2011, in bn$
25
16
33
Liabilities Assets
5
Short term

68
• VaR at September 30, 2011: 10.4 m€, +2% vs. September 30, 2010
VaR(1)
(1) incl. BPCE guarantee
November 9, 2011
0
5
10
15
20
in m
€

69
Regional breakdown(1) Sector breakdown(2)
3% 3%
5%
25%
15% 3%
46%
France
US
EU
Asia/ Oceania
Other European countries
Africa/ME
Latin America
1%
2%
2%
2%
2%
3%
3%
3%
3%
3%
4%
4%
4%
5%
5%
5%
6%
6%
7%
9%
11%
12%
Telecom
Technologies
Automotive industry
Pharma / healthcare
Community services
Medias
Mechanical constr.
Public works
Consumer goods
Food & agric.
Other
Base industries
International Trade
Holdings
Electricity
Distribution
Transport
Oil / Gas
Services
Administrations
Real Estate
Securitization
(1) Outstanding loans : 240 bn€ / (2) Outstanding loans excl. financial sector : 135 bn€
EAD (Exposure at Default) at 30 September, 2011
November 9, 2011

70
Appendix – Specific information on exposures (FSB Recommendation) B
November 9, 2011

71
Non-diversified structure
Diversified structure
Discount rate: 85%
Discount rate: 51%
Non-hedged ABS CDOs (exposed to US housing market)
in m€ #1 #2 #7 #12 #13 #15 #16 #18 #4 #17
3Q11 Value adjustment 0.6 0.0 9.7 1.6 -1.6 1.1 -3.3 0.3 -6.4 -4.1
Net exposure (09/30/2011)
0.6 0.3 29.8 21.0 0.6 44.0 22.9 3.3 178.7 122.0
Discount rate 98.6% 99.2% 79.1% 49.5% 99.6% 40.6% 88.4% 97.9% 41.1% 60.1%
Nominal exposure 39 33 143 42 155 74 197 161 304 306
Change in value - total -38.5 -32.5 -112.9 -20.6 -154.3 -30.0 -174.3 -157.5 -124.9 -183.5
Bracket S.
Senior Mezz.
S. Senior
S. Senior
S. Senior
Mezz. Mezz. Senior S.
Senior Senior
Underlying Mezz. Mezz. Mezz. Mezz. Mezz. Mezz. Mezz. Mezz. H.
Grade Mezz.
Attachment point 0.0% 0.0% 13.7% 32.5% 0.0% 0% /
61.1% 0% /
99.5% 0.0% 0.0% 0.0%
Prime 2.0% 17.0% 8.1% 4.6% 2% 14.5% 13.8% 18.2% 4.2% 25.2%
Alt-A 0.0% 9.4% 1% 0.8% 0.0% 39.8% 25.8% 9.4% 0.8% 14.4%
Subprime (2005 and before) 65.3% 20.7% 51.3% 44.9% 86.3% 38.6% 0.0% 0.0% 17.3% 0.0%
Subprime (2006 & 2007) 16.4% 26.0% 7.4% 3% 1.4% 1.7% 20.5% 31.7% 3.0% 0.0%
November 9, 2011

25%
36%
21%
72
Residual exposure to counterparty risk
Protection purchased from Monoline
CIFG
MBIA
Assured Guaranty
FSA
Radian
Protection purchased from CDPC
• Exposure before value adjustment: 1,106 m€ as 09/30/2011 (Gross notional amount: 8.2 bn€)
• Value adjustment: 183 m€
Protection
November 9, 2011
in m€ Gross notional amount of purchased instrument
Exposure before 3Q11
Exposure before 2Q11
value adjustment and hedging
value adjustment and hedging
Protection for CDOs (housing market) 402 175 161
Protection for CLO 4,630 179 169
Protection for RMBS 463 103 102
Protection for CMBS 493 8 9
Other risks 7,877 1,838 1,646
TOTAL 13,866 2,303 2,087
Value adjustment -1,595 -1,478
Residual exposure to counterparty risk 708 609
Discount rate 69% 71%
7%
11%

9%
48% 15%
28%
73
Residual exposure CDO not exposed to US housing market
AA
AAA
< A
o/w CRE CDO
• Value adjustment 3Q11: 10 m€
• Residual exposure: 3,140 m€
A
Other non-hedged CDOs (not exposed to US housing market)
in m€ Net exposure 06/30/11
Gain/Loss in value 3Q11
Other changes 3Q11
Net exposure 09/30/11
Gross exposure
09/30/11
FV through P&L 86 -5 1 82 159
FV through equity 1 0 -1 0 6
Loans & receivables 29 -1 3 31 45
TOTAL 116 -6 3 114 210
November 9, 2011

68
%
19
%
13
%
52%
32%
6%
52
%
38
% 51
%
11
%
17
%
16
%
5%
37
%
27
%
9%
27
%
9%
20
%
47
%
24
%
74
AAA
A
< A
AA
US
UK
Europe (excl. UK)
AAA AA
A
<A
AAA
AAA
AA
AA (9%)
A
A (1%)
<A
< A Subprime
US Agencies
Alt-A
Prime
Autre
Non-hedged Mortgage Backed Securities CMBS Net
exposure 06/30/11
Gain/Loss in value
3Q11
Other changes
3Q11
Net exposure
09/30/11
Gross exposure
09/30/11 in m€
FV through P&L 66 -1 -2 63 121
FV through equity 154 0 -4 150 216
Loans & receivables 66 0 -9 57 58
TOTAL 286 -1 -14 270 394
RMBS UK Net exposure
06/30/11
Gain/Loss in value
3Q11
Other changes
3Q11
Net exposure
09/30/11
Gross exposure
09/30/11 in m€
FV through P&L 108 (10) (2) 96 173
FV through equity 113 (5) (1) 107 149
Loans & receivables 218 0 (14) 204 204
TOTAL 439 (15) (16) 407 526
RMBS Spain Net exposure
06/30/11
Gain/Loss in value
3Q11
Other changes
3Q11
Net exposure
09/30/11
Gross exposure
09/30/11 in m€
FV through P&L 51 0 (3) 49 62
FV through equity 12 (1) 0 11 27
Loans & receivables 414 0 (10) 404 404
TOTAL 477 (1) (12) 464 494
RMBS US Net exposure
06/30/11
Gain/Loss in value
3Q11
Other changes
3Q11
Net exposure
09/30/11
Gross exposure
09/30/11 in m€
FV through P&L 10 0 0 10 54
Agencies 1,337 (1) (43) 1,293 1,331
Wrapped RMBS 287 0 (5) 283 306
Loans & receivables 898 (4) 43 937 1,225
TOTAL 2,532 (5) (5) 2,523 2,915
November 9, 2011
10%

A
43%
32%
25%
99%
1% 0 0
24%
76%
Others
75
France
AA
A
US
AAA
Not rated
UK (1%)
Sponsored Conduits MAGENTA – conduits sponsored by Natixis, in m€
Country of issuance France Automobile loans 12%
Amount of asset financed 865 Business loans 88%
Liquidity line extended 1,245 Equipment loans
Age of assets: Consumer credit
0 – 6 months Non US RMBS
6 – 12 months 23% CDO / CLO
> à 12 months 77% Other
VERSAILLES – conduits sponsored by Natixis, in m€
Country of issuance US Automobile loans 8%
Amount of asset financed 2,283 Business loans 1%
Liquidity line extended 3,355 Equipment loans 3%
Age of assets: Consumer credit 27%
0 – 6 months 1% Non US RMBS
6 – 12 months 4% CDO / CLO 17%
> à 12 months 95% Other 44%
DIRECT FUNDING– conduits sponsored by Natixis, in m€
Country of issuance France Automobile loans
Amount of asset financed 146 Business loans
Liquidity line extended - Equipment loans
Age of assets: Consumer credit
0 – 6 months Non US RMBS 100%
6 – 12 months CDO / CLO
> à 12 months 100% Other
Assets breakdown • by rating: 100% on AAA
• by localization: 100% in Italy
November 9, 2011
76%
7% 17%
AAA

76
Monoline Non-hedged ABS CDOs
Methodology
• Loss rates for subprime assets stand at:
• Cash flow based valuation of RMBS, CLOs underlying in ABS
• Allocation of a 97% loss to transactions integrated in collaterals when rated CCC+ or below, except for underlying assets initially rated AAA for which discount has been set at 70% (for first rank securitization only)
• Valuation of other non-subprime underlying assets based upon write-down grid including the type, rating and vintage of the transactions
Fair value of protection before value adjustments
• Economic exposure of ABS CDOs including subprime determined using the same method
• Economic exposure of other types of assets was determined based on Mark-to-Market or Mark-to-Model
Value adjustment
• Four groups of monoline are identified based on their creditworthiness. They are allocated a probability of default (PD) as follows
*Excluding positions covered by reintermediation operation
• In all cases, Recovery in case of default (R) is set at 10%
• The specific provision is defined as the amount of Mark-to-Market (or Mark-to-Model) multiplied by the expected loss (Expected loss = PD x (1-R)) for each monoline
PD Monoline
Group 1 15% Assured guaranty, FSA
Group 2 50% Radian*
Group 3 95% MBIA
Group 4 100% Ambac, CIFG, FGIC
Non-hedged ABS CDOs & Monoline Assumptions for valuation
< 2005 2005 2006 2007
06/30/2011 7.10% 16.70% 30.60% 54.60%
09/30/2011 7.20% 17.00% 31.20% 56.10%
November 9, 2011

November 9, 2011 77