Title: Tidal Resource Characterisation and Feasible ...
149
Title: Disclaimer: Tidal Resource Characterisation and Feasible Schemes Report This document was prepared for the ETI by third parties under contract to the ETI. The ETI is making these documents and data available to the public to inform the debate on low carbon energy innovation and deployment. Programme Area: Marine Project: Tidal Modelling Abstract: This deliverable is number 1 of 10 in the Tidal Modelling project and characterises the available tidal energy resource around the UK in order to determine likely sites for development in a horizon out to 2050, and for inclusion in the Continental Shelf Models developed elsewhere in the project. The report draws on previously published material in order to identify potential sites and then to consider those sites with different technology assumptions and design constraints. The report is organized in two parts; part A assess the potential Tidal Range sites and identifies 10 barrage and 11 lagoon sites; part B assess the potential Tidal Current sites and identifies 18 sites. The approach and constraints, as well as a summary of the site choices can be found in the Executive summary. Context: Launched in October 2011 this project involved Black & Veatch, in collaboration with HR Wallingford and the University of Edinburgh to develop a model of the UK Continental Shelf and North European Waters, 100 times more accurate than existing marine data. This has been used to assess the tidal energy potential around the UK (tidal range and tidal streams), to inform the design of energy harnessing schemes, to assess their interactions, and to evaluate their impact on European coasts. It can also be used to renew and inform flood defences, coastal erosion and aggregate extraction. Now completed, the project has been launched to market under the brand of SMARTtide. This is available to the marine industry under licence from HR Wallingford. The Energy Technologies Institute is making this document available to use under the Energy Technologies Institute Open Licence for Materials. Please refer to the Energy Technologies Institute website for the terms and conditions of this licence. The Information is licensed ‘as is’ and the Energy Technologies Institute excludes all representations, warranties, obligations and liabilities in relation to the Information to the maximum extent permitted by law. The Energy Technologies Institute is not liable for any errors or omissions in the Information and shall not be liable for any loss, injury or damage of any kind caused by its use. This exclusion of liability includes, but is not limited to, any direct, indirect, special, incidental, consequential, punitive, or exemplary damages in each case such as loss of revenue, data, anticipated profits, and lost business. The Energy Technologies Institute does not guarantee the continued supply of the Information. Notwithstanding any statement to the contrary contained on the face of this document, the Energy Technologies Institute confirms that the authors of the document have consented to its publication by the Energy Technologies Institute.
Transcript of Title: Tidal Resource Characterisation and Feasible ...

Title:
Disclaimer:
Tidal Resource Characterisation and Feasible Schemes Report
This document was prepared for the ETI by third parties under contract to the ETI. The ETI is making these
documents and data available to the public to inform the debate on low carbon energy innovation and deployment.
Programme Area: Marine
Project: Tidal Modelling
Abstract:This deliverable is number 1 of 10 in the Tidal Modelling project and characterises the available tidal energy
resource around the UK in order to determine likely sites for development in a horizon out to 2050, and for inclusion
in the Continental Shelf Models developed elsewhere in the project. The report draws on previously published
material in order to identify potential sites and then to consider those sites with different technology assumptions
and design constraints. The report is organized in two parts; part A assess the potential Tidal Range sites and
identifies 10 barrage and 11 lagoon sites; part B assess the potential Tidal Current sites and identifies 18 sites. The
approach and constraints, as well as a summary of the site choices can be found in the Executive summary.
Context:Launched in October 2011 this project involved Black & Veatch, in collaboration with HR Wallingford and the
University of Edinburgh to develop a model of the UK Continental Shelf and North European Waters, 100 times
more accurate than existing marine data. This has been used to assess the tidal energy potential around the UK
(tidal range and tidal streams), to inform the design of energy harnessing schemes, to assess their interactions,
and to evaluate their impact on European coasts. It can also be used to renew and inform flood defences, coastal
erosion and aggregate extraction. Now completed, the project has been launched to market under the brand of
SMARTtide. This is available to the marine industry under licence from HR Wallingford.
The Energy Technologies Institute is making this document available to use under the Energy Technologies Institute Open Licence for
Materials. Please refer to the Energy Technologies Institute website for the terms and conditions of this licence. The Information is licensed ‘as
is’ and the Energy Technologies Institute excludes all representations, warranties, obligations and liabilities in relation to the Information to the
maximum extent permitted by law. The Energy Technologies Institute is not liable for any errors or omissions in the Information and shall not
be liable for any loss, injury or damage of any kind caused by its use. This exclusion of liability includes, but is not limited to, any direct,
indirect, special, incidental, consequential, punitive, or exemplary damages in each case such as loss of revenue, data, anticipated profits, and
lost business. The Energy Technologies Institute does not guarantee the continued supply of the Information. Notwithstanding any statement
to the contrary contained on the face of this document, the Energy Technologies Institute confirms that the authors of the document have
consented to its publication by the Energy Technologies Institute.

Energy Technologies Institute
MA1009
Tidal Modelling (Modelling Tidal Resource Interactions around the UK)
PM01.01
Tidal Resource Characterisation
13th December 2011
Version 2.0
Participant Lead – Black & Veatch
Other Participants – The University of Edinburgh

Tidal Modelling – D01 Tidal Resource Characterisation
Black & Veatch Ltd ii
Document issue details: B&V project no. Client’s reference no.
Version no. Issue date Issue status Distribution
1.0 09.11.11 1st Issue to the ETI ETI
2.0 13.12.11 2nd Issue to the ETI ETI
Notice:
This report was prepared by Black & Veatch Limited (BVL) solely for use by the Energy Technologies Institute. This report is not addressed to and may not be relied upon by any person or entity other than the Energy Technologies Institute for any purpose without the prior written permission of BVL. BVL, its directors, employees and affiliated companies accept no responsibility or liability for reliance upon or use of this report (whether or not permitted) other than by the Energy Technologies Institute for the purposes for which it was originally commissioned and prepared.
In producing this report, BVL has relied upon information provided by others. The completeness or accuracy of this information is not guaranteed by BVL.
Tidal Modelling – D01 Tidal Resource Characterisation
B&V Team Page 3 of 148
CONTENTS
1 EXECUTIVE SUMMARY 8
2 GENERAL INTRODUCTION 20
PART A: TIDAL RANGE CHARACTERISATION 21
3 TIDAL RANGE INTRODUCTION 21
4 TIDAL RANGE PROJECT DESIGN/METHOD 21 4.1 Technically feasible modes of operation ..................................................................... 21 4.2 Maintaining at least 80% of natural tidal range ........................................................... 25 4.3 Potential locations for barrage and lagoon schemes ................................................... 27 4.4 Technology options ...................................................................................................... 37 4.5 Turbine selection .......................................................................................................... 39
5 TIDAL RANGE RESULTS 47 5.1 General .......................................................................................................................... 47 5.2 Solway Firth ................................................................................................................. 47 5.3 Duddon ......................................................................................................................... 50 5.4 Morecambe Bay ........................................................................................................... 52 5.5 Mersey .......................................................................................................................... 54 5.6 Dee ................................................................................................................................ 57 5.7 Severn ........................................................................................................................... 61 5.8 Thames .......................................................................................................................... 67 5.9 The Wash ...................................................................................................................... 70 5.10 Humber ......................................................................................................................... 72 5.11 Lagoon locations .......................................................................................................... 74 5.12 Wigtown Bay ................................................................................................................ 75 5.13 Kirkcudbright Bay ........................................................................................................ 76 5.14 Cumbria lagoon ............................................................................................................ 77 5.15 Oxwich Bay .................................................................................................................. 77 5.16 West Aberthaw and Rhoose lagoons ........................................................................... 79 5.17 Morte Bay ..................................................................................................................... 81 5.18 Rye Bay and Dymchurch lagoons ............................................................................... 82 5.19 Summary ....................................................................................................................... 83 5.20 Indicative cost of energy and other indices to compare schemes ............................... 87 5.21 Results analysis ............................................................................................................ 90 5.22 Comparison of ebb-only energy estimates with previous studies ............................... 92 5.23 Likely differences in predicted energy output between the 0-d model and the CSM 93 5.24 Effect of outages ........................................................................................................... 98 5.25 Challenges for build and operation .............................................................................. 99 5.26 Combinations of options within the same estuary ....................................................... 99 5.27 Prediction of installed capacity and energy output for other lagoon locations ........ 100
6 TIDAL RANGE KEY FINDINGS 102
7 TIDAL RANGE CONCLUSIONS AND RECOMMENDATIONS 104
PART B: TIDAL CURRENT CHARACTERISATION 106
8 TIDAL CURRENT INTRODUCTION 106

Tidal Modelling – D01 Tidal Resource Characterisation
B&V Team Page 4 of 148
8.1 Work package objective and deliverables ................................................................ 106 8.2 Carbon Trust’s 2011 ‘UK Tidal Current Resource & Economics’ report ............... 106
9 TIDAL CURRENT PROJECT DESIGN/METHOD 107 9.1 Tidal Current Modelling Methodology Overview ................................................... 107 9.2 Tidal Current Characterisation of the tidal resource ................................................ 107
10 TIDAL CURRENT RESULTS 115 10.1 Tidal Current farm sites, scenario results & comparison ......................................... 115
11 TIDAL CURRENT KEY FINDINGS 117
12 TIDAL CURRENT CONCLUSIONS AND RECOMMENDATIONS 119
GLOSSARY 120
REFERENCES 124
APPENDIX A – INPUT DATA FOR 0-D MODELLING (BATHYMETRY AND TIDAL HARMONICS) 128
APPENDIX B – TIDAL CURRENT RESOURCE ASSESSMENT METHODOLOGY LITERATURE REVIEW 135
APPENDIX C – CARBON TRUST 2011 UK RESOURCE REPORT – TIDAL CURRENT MAPS 148
TABLE OF FIGURES
Figure 1 Example of ebb-only operation .............................................................................................. 22 Figure 2 Example of dual (ebb-flood) operation (1) ............................................................................. 24 Figure 3 Example of dual (ebb-flood) operation (2) ............................................................................. 24 Figure 4 Mean tidal range ..................................................................................................................... 33 Figure 5 Depth below mean sea level ................................................................................................... 34 Figure 6 Possible tidal lagoon locations ............................................................................................... 35 Figure 7 Selected barrage and lagoon schemes .................................................................................... 36 Figure 8 Example of Rolls-Royce turbine operation ............................................................................ 38 Figure 9 Examples of route taken through hill chart ............................................................................ 41 Figure 10 Sensitivity of energy output to turbine start delay for Morecambe Bay in Joule study ....... 43 Figure 11 Example of effect of increasing turbine capacity on energy output ..................................... 45 Figure 12 Solway Firth alignments ....................................................................................................... 48 Figure 13 Duddon alignments .............................................................................................................. 51 Figure 14 Morecambe Bay alignments ................................................................................................. 52 Figure 15 Mersey alignments ............................................................................................................... 55 Figure 16 Dee alignments ..................................................................................................................... 58 Figure 17 Severn alignments ................................................................................................................ 62 Figure 18 Thames alignments ............................................................................................................... 68 Figure 19 The Wash alignments ........................................................................................................... 70 Figure 20 Humber alignments .............................................................................................................. 72 Figure 21 Wigtown Bay, Kirkcudbright Bay and Cumbria lagoon alignments .................................... 75 Figure 22 Oxwich Bay alignment ......................................................................................................... 78 Figure 23 Severn lagoon alignments .................................................................................................... 79

Tidal Modelling – D01 Tidal Resource Characterisation
B&V Team Page 5 of 148
Figure 24 Morte Bay alignment ............................................................................................................ 81 Figure 25 Rye Bay and Dymchurch lagoon alignments ....................................................................... 82 Figure 26 Relationship between energy output and tidal range ............................................................ 92 Figure 27 Example of embedded barrage within an outer barrage ..................................................... 100 Figure 28 Predicting installed capacity and energy output for lagoons (with conventional turbines) 101 Figure 29 Hub height Vmsp data by site (MEA data) courtesy of the CT 2011 Report ..................... 112
TABLE OF TABLES
Table 1 Tests to achieve 80% of natural tidal range for Severn Cardiff-Weston barrage .................... 27 Table 2 Summary of UK tidal barrage schemes ................................................................................... 29 Table 3 Summary of lagoon selections ................................................................................................. 31 Table 4 Dual mode turbine selections ................................................................................................... 41 Table 5 Source of bathymetric data ...................................................................................................... 44 Table 6 Solway Firth alignments .......................................................................................................... 48 Table 7 Solway Firth (barrage B1) available depth for turbines .......................................................... 48 Table 8 Solway Firth results of previous studies .................................................................................. 49 Table 9 Solway Firth result for ebb-only mode with conventional turbines (alignment B1) ............... 49 Table 10 Solway Firth results for dual mode with conventional turbines (alignment B1) ................... 49 Table 11 Solway Firth results for dual mode with Rolls-Royce turbines (alignment B1) .................... 50 Table 12 Solway Firth B1 scheme selection ......................................................................................... 50 Table 13 Duddon alignments ................................................................................................................ 51 Table 14 Duddon available depth for turbines ...................................................................................... 51 Table 15 Duddon results of previous studies ........................................................................................ 52 Table 16 Morecambe Bay alignments .................................................................................................. 52 Table 17 Morecambe Bay (Outer) available depth for turbines ........................................................... 53 Table 18 Morecambe Bay results of previous studies .......................................................................... 53 Table 19 Morecambe Bay result for ebb-only mode with conventional turbines (Outer alignment) ... 53 Table 20 Morecambe Bay results for dual mode with conventional turbines (Outer alignment) ......... 53 Table 21 Morecambe Bay results for dual mode with Rolls-Royce turbines (Outer alignment) ......... 54 Table 22 Morecambe Bay scheme selection ......................................................................................... 54 Table 23 Mersey alignments ................................................................................................................. 55 Table 24 Mersey available depth for turbines (Band A) ....................................................................... 55 Table 25 Mersey results of previous studies ......................................................................................... 56 Table 26 Mersey result for ebb-only mode with conventional turbines (alignment A) ........................ 56 Table 27 Mersey results for dual mode with conventional turbines (alignment A) ............................. 56 Table 28 Mersey results for dual mode with Rolls-Royce turbines (alignment A) .............................. 56 Table 29 Mersey scheme selection ....................................................................................................... 57 Table 30 Dee alignment ........................................................................................................................ 58 Table 31 Dee estuary available depth for turbines ................................................................................ 58 Table 32 Dee-Wirral lagoon available depth for turbines .................................................................... 59 Table 33 Dee results of previous studies .............................................................................................. 59 Table 34 Dee result for ebb-only mode with conventional turbines ..................................................... 59 Table 35 Dee estuary results for dual mode with conventional turbines .............................................. 59 Table 36 Dee estuary results for dual mode with Rolls-Royce turbines ............................................... 60 Table 37 Dee estuary scheme selection ................................................................................................ 60 Table 38 Dee-Wirral lagoon results for dual mode with conventional turbines ................................... 60 Table 39 Dee-Wirral lagoon results for dual mode with Rolls-Royce turbines .................................... 60 Table 40 Dee-Wirral lagoon scheme selection ..................................................................................... 61 Table 41 Severn alignments .................................................................................................................. 62 Table 42 Severn Outer available depth for turbines ............................................................................. 63 Table 43 Severn Cardiff-Weston available depth for turbines ............................................................. 63 Table 44 Bridgwater Bay available depth for turbines ......................................................................... 63
Tidal Modelling – D01 Tidal Resource Characterisation
B&V Team Page 6 of 148
Table 45 Severn results of previous studies .......................................................................................... 63 Table 46 Severn Outer result for ebb-only mode with conventional turbines ...................................... 65 Table 47 Severn Outer results for dual mode with conventional turbines ............................................ 65 Table 48 Severn Outer results for dual mode with Rolls-Royce turbines ............................................ 65 Table 49 Severn Outer scheme selection .............................................................................................. 65 Table 50 Severn Cardiff-Weston result for ebb-only mode with conventional turbines ...................... 65 Table 51 Severn Cardiff-Weston results for dual mode with conventional turbines ............................ 66 Table 52 Severn Cardiff-Weston (SETS) results for dual mode with Rolls-Royce turbines ................ 66 Table 53 Severn Cardiff-Weston scheme selection .............................................................................. 66 Table 54 Bridgwater Bay results for dual mode with conventional turbines ........................................ 66 Table 55 Bridgwater Bay results for dual mode with Rolls-Royce turbines ........................................ 67 Table 56 Bridgwater Bay scheme selection .......................................................................................... 67 Table 57 Thames alignments ................................................................................................................ 67 Table 58 Thames available depth for turbines ...................................................................................... 68 Table 59 Thames results of previous studies ........................................................................................ 68 Table 60 Thames result for ebb-only mode with conventional turbines (Thames Hub alignment) ..... 69 Table 61 Thames results for dual mode with conventional turbines (Thames Hub alignment) ........... 69 Table 62 Thames results for dual mode with Rolls-Royce turbines (Thames Hub alignment) ............ 69 Table 63 Thames scheme selection ...................................................................................................... 69 Table 64 The Wash alignments ............................................................................................................ 70 Table 65 The Wash available depth for turbines .................................................................................. 70 Table 66 The Wash results of previous studies .................................................................................... 71 Table 67 The Wash result for ebb-only mode with conventional turbines (Outer alignment) ............. 71 Table 68 The Wash results for dual mode with conventional turbines (Outer alignment) ................... 71 Table 69 The Wash results for dual mode with Rolls-Royce turbines (Outer alignment) .................... 71 Table 70 The Wash scheme selection ................................................................................................... 72 Table 71 Humber alignments ................................................................................................................ 72 Table 72 Humber available depth for turbines ..................................................................................... 73 Table 73 Humber results of previous studies ........................................................................................ 73 Table 74 Humber result for ebb-only mode with conventional turbines (Outer alignment) ................ 73 Table 75 Humber results for dual mode with conventional turbines (Outer alignment) ...................... 73 Table 76 Humber results for dual mode with Rolls-Royce turbines (Outer alignment) ....................... 74 Table 77 Humber scheme selection ...................................................................................................... 74 Table 78 Lagoon locations .................................................................................................................... 74 Table 79 Wigtown Bay results for dual mode with conventional turbines ........................................... 75 Table 80 Wigtown Bay results for dual mode with Rolls-Royce turbines ........................................... 75 Table 81 Wigtown Bay scheme selection ............................................................................................. 76 Table 82 Kirkcudbright Bay results for dual mode with conventional turbines ................................... 76 Table 83 Kirkcudbright Bay results for dual mode with Rolls-Royce turbines .................................... 76 Table 84 Kirkcudbright Bay scheme selection ..................................................................................... 76 Table 85 Cumbria lagoon results for dual mode with conventional turbines ....................................... 77 Table 86 Cumbria lagoon results for dual mode with Rolls-Royce turbines ........................................ 77 Table 87 Cumbria lagoon scheme selection ......................................................................................... 77 Table 88 Oxwich Bay results for dual mode with conventional turbines ............................................. 78 Table 89 Oxwich Bay results for dual mode with Rolls-Royce turbines.............................................. 78 Table 90 Oxwich Bay scheme selection ............................................................................................... 79 Table 91 Rhoose results for dual mode with conventional turbines ..................................................... 79 Table 92 Rhoose results for dual mode with Rolls-Royce turbines ...................................................... 80 Table 93 Rhoose scheme selection ....................................................................................................... 80 Table 94 West Aberthaw results for dual mode with conventional turbines ........................................ 80 Table 95 West Aberthaw results for dual mode with Rolls-Royce turbines ......................................... 80 Table 96 West Aberthaw scheme selection .......................................................................................... 80 Table 97 Morte Bay results for dual mode with conventional turbines ................................................ 81

Tidal Modelling – D01 Tidal Resource Characterisation
B&V Team Page 7 of 148
Table 98 Morte Bay results for dual mode with Rolls-Royce turbines ................................................ 81 Table 99 Morte Bay scheme selection .................................................................................................. 82 Table 100 Rye Bay / Dymchurch results for dual mode with conventional turbines ........................... 82 Table 101 Rye Bay / Dymchurch results for dual mode with Rolls-Royce turbines ............................ 83 Table 102 Rye Bay / Dymchurch scheme selection ............................................................................. 83 Table 103 Summary of ebb-only conventional turbines scheme selection ........................................... 84 Table 104 Summary of dual mode, conventional turbines scheme selection ....................................... 85 Table 105 Summary of dual mode, Rolls-Royce turbines scheme selection ........................................ 86 Table 106 Comparison of selected schemes ......................................................................................... 89 Table 107 Comparison of energy outputs for selected ebb-only schemes ............................................ 93 Table 108 Summary of energy outputs from the Severn Tidal Power ................................................. 95 Table 109 Summary of energy outputs from the Joule study ............................................................... 96 Table 110 Effect of fixed delay and 2-d modelling on energy output in Joule study ........................... 97 Table 111 Sensitivity of energy output to starting head (0-d model) ................................................... 98 Table 112 Theoretical and Technical Resource equations courtesy of the CT 2011 report ............... 107 Table 113 UK Tidal Current sites as identified in CT 2011 report .................................................... 109 Table 114 Overview of practical constraints review .......................................................................... 114 Table 115 Summary of the scenario results from the CT 2011 report ................................................ 116 Table 116 Assumptions overview ...................................................................................................... 117

Tidal Modelling – D01 Tidal Resource Characterisation
B&V Team Page 8 of 148
1 EXECUTIVE SUMMARY
The ETI has proposed to develop a Continental Shelf Model (CSM) of the UK waters to assess the tidal energy potential around the UK, to inform the design of energy harnessing schemes and to evaluate their impact on European coasts. Black & Veatch (B&V), in collaboration with HR Wallingford (HRW) and the University of Edinburgh (UoE), is providing support with regard to the development of this model and subsequent use by the tidal power industry. This report has been led by B&V and is part of the Tidal Resource Modelling (TRM) scope of work delivered by B&V as prime contractor. B&V has been consulting on tidal energy since 1975 (B&V was previously Binnie & Partners in the UK until 1995). We have a very broad and in depth experience of both tidal range and current projects including resource assessment and project development, technology development, due diligence, cost of energy and policy development. Through working on these projects, we have gained a deep technical and commercial understanding of tidal energy projects in addition to simply resource assessment. HRW has vast experience of numerical modelling of free surface waters using TELEMAC and has been instrumental in its continued development. The TELEMAC system is a state-of-the-art free surface flow suite of solvers developed by a kernel of European organisations including HR Wallingford and other partners such as Electricité de France and the Federal Waterways Engineering and Research Institute of Germany. HRW’s expertise is acknowledged within the UK tidal modelling community as the only entity with an in depth experience of TELEMAC and its modification. The University of Edinburgh (UoE) is one of the largest and most successful universities in the UK with an international reputation as a centre of academic and research excellence. The Institute for Energy Systems (IES) is one of five multi-disciplinary research groupings within the School of Engineering at the University. In the most recent UK wide Research Assessment Exercise (RAE2008), the School was ranked third in the UK for combined research quality and quantity. The aim of the TRM scope of work is to answer the following fundamental questions:
1. How will the interactions between tidal range and tidal current systems positioned around the UK’s waters combine to form an overall effect?
2. Will the extraction of tidal energy resource in one area impact the tidal energy resource at distant sites around the UK and Europe?
3. What constraints might these interactions place on the design, development and location of future systems?
This will be achieved through a series of workpackages and, ultimately, 10 deliverables of which this report forms D01 – Tidal resource characterisation. The tidal resource has been characterised in two parts: Tidal Range and Tidal Current. This report is therefore split into Part A and Part B, respectively. It is noted that it was agreed with the ETI that Tidal Fences would be considered as a variation of the Tidal Current technology instead of as Tidal Range. There are four main acceptance criteria for this Deliverable: Tidal Range characterisation (Part A); Tidal Stream characterisation (Part B); Characterisation Conclusions which defines the relative impact on the boundary of the CSM (Part A and Part B, respectively); and 0-d models used in the initial resource estimations (see Tidal Range 0-d model). It is confirmed here that all the acceptance criteria have been met.

Tidal Modelling – D01 Tidal Resource Characterisation
B&V Team Page 9 of 148
Part A: Tidal Range Resource Characterisation The objective of the Tidal Range Resource Characterisation part of this report is to characterise the UK tidal range resource and identify potentially feasible schemes. The report contains sections describing technically feasible modes of operation for traditional barrage and lagoon options (Section 4.1) and recent technology development options (Section 4.4). In particular, the constraint caused by the ETI’s stated requirement to maintain at least 80% of natural tidal range is discussed (Section 4.2). Finally, the results in Section 5, followed by Key Findings in Section 6, are presented. Traditional tidal range schemes can be split into three types of impoundment:
Barrages; Coastal (land-connected) lagoons; and Offshore lagoons.
Offshore lagoons are not connected to the coastline so must be completely enclosed by artificial embankments. Consequently the embankment length will be longer to enclose the same sea area as the coastline cannot be used to complete the impoundment. In addition, locating a lagoon offshore will normally involve construction in deeper water compared to a coastal lagoon that encloses a similar area and would generate similar power. For this reason, offshore lagoons have not been selected for scenario testing in this study. Three possible modes of operation have been considered for a tidal barrage or lagoon:
Ebb-only generation; Flood-only generation; and Dual (ebb-flood) generation.
Pumping has not been included in the tidal range scenarios developed for this study. It adds considerable complexity to the operation of a scheme, whilst potentially delivering only a relatively small energy increase. It is a refinement that should be considered in detailed studies of individual schemes but it is not necessary for this UK-wide study focussed on interactions between schemes. An ETI requirement of this study is that schemes should maintain at least 80% of the natural tidal range. This means that the turbines and sluices in the barrage/lagoon impoundment must have sufficient capacity to pass at least 80% of the natural tidal prism and so maintain 80% of the natural tidal range within the impounded area. The effect on tidal range outside the barrage will be smaller, although previous studies have shown considerable differences to water levels downstream of the Outer and Cardiff-Weston barrages in the Severn estuary. The requirement of maintaining 80% of natural tidal range has not been considered in previous studies of tidal power around the UK. With normal ebb-only operation (which has been the basis of the vast majority of previous studies), schemes have generally been optimised for energy output as opposed to their impact on the local environment. This usually causes a reduction in the tidal range within the impoundment of about 50% - with almost no change to high water levels but low water levels raised to approximately the natural mean sea level. The ETI has agreed that we could incorporate previous ebb only studies outside the 80% range criteria. There are several non-standard operating modes which can increase the tidal range within the impoundment, but an alternative way to achieve 80% of natural tidal range it is to add more turbines to the barrage. This is not possible at all locations due to the constraint of estuary width and available deep water in the alignment.

Tidal Modelling – D01 Tidal Resource Characterisation
B&V Team Page 10 of 148
There have been several previous tidal power studies for estuaries around the UK. Consequently, the potential estuary locations for large (greater than 100MW) schemes are well known and can be assessed from these previous studies. In the past, there has been less focus on tidal lagoons due to the additional length (and therefore cost) of their embankments relative to the energy output. The potential locations of tidal lagoons are less well documented, except perhaps in the Severn. The Atlas of UK Marine Renewable Energy Resources (BERR, 2008) has been used to identify potential sites for tidal lagoons. Areas were identified with both:
1. Mean tidal range greater than 4m (assessed by taking the average of mean spring and mean neap tidal range).
2. Water depth below mean sea level of 25m or less. Building a barrage/lagoon embankment in deeper water than this would be very expensive, except for very short distances.
The technology options reviewed in the report include conventional turbines (Bulb and Straflo), the Rolls-Royce turbine, the Spectral Marine Energy Converter from VerdErg and Tidal Reef. The latter two have not been included in the study because there is a lack of performance data with which to represent the technology. To design an appropriate turbine selection (size, speed, capacity, and number) for each location has required information from literature reviews and specific B&V knowledge and expertise on Tidal Range modelling. At each location (except where constraints do not allow) there are three options for technology: conventional turbines in ebb-only mode, conventional turbines in dual (ebb-flood) mode, or Rolls-Royce turbines in dual operation. Scheme selections (number of turbines, size and capacity of turbines, number and size of sluices) are based on an appropriate previous study for barrages and simple 0-d modelling for lagoons. The 0-d modelling shows good correlation with previous literature. Potentially feasible locations for tidal range schemes that could give peak power output greater than 100MW have been identified giving:
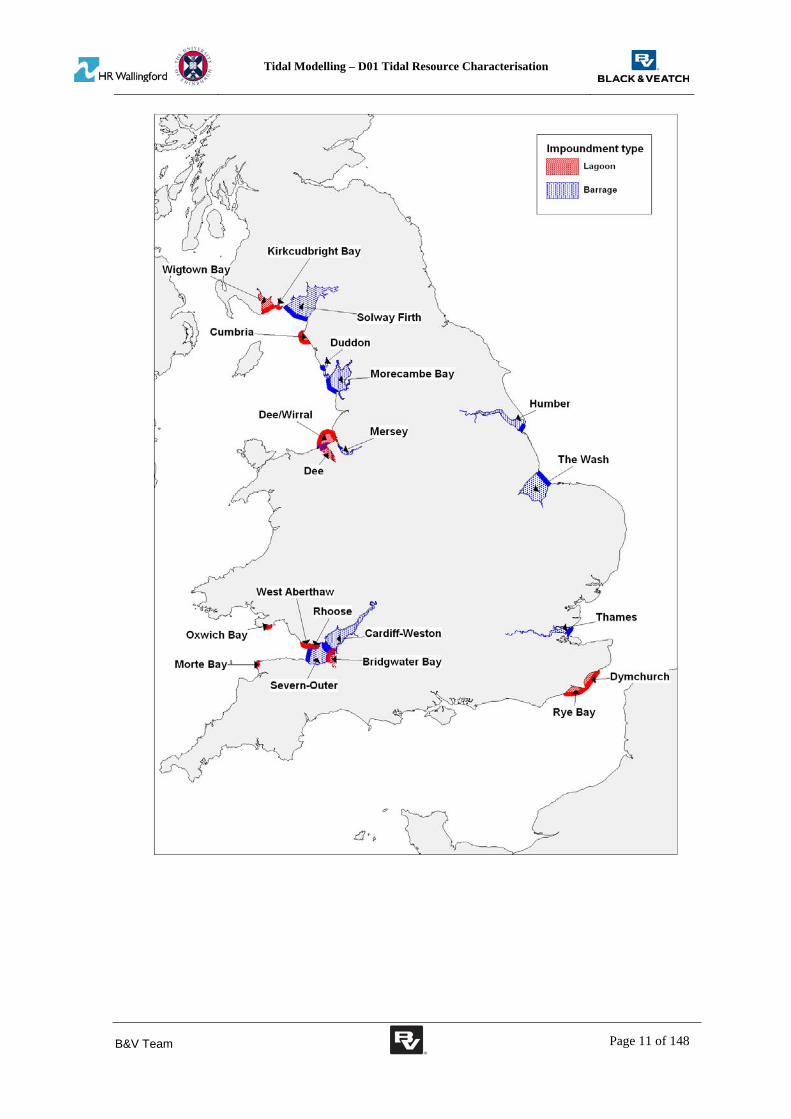
10 barrage alignments – selected based on a literature review of previous studies; and 11 lagoon alignments – selected based on the tidal range, water depth and coastline shape.
The general locations are shown in the map below and the tables summarise the three scheme selections for each location. Note that:
The ebb-only schemes generally achieve a tidal range of only around 50% of the natural range inside the impoundment. An indicative minimum tidal range is shown based on 0-d model testing of the selected scheme.
Ebb-only selections have not been made for lagoons as dual mode generation should give (usually significantly) greater energy output if 80% of natural tidal range is achieved.
At some locations there is insufficient deep water or estuary width to accommodate sufficient conventional turbines to achieve 80% of natural tidal range. For this reason, dual mode schemes have not been selected for several of the barrages, although some could be worth dredging to achieve this approach (e.g. Severn Cardiff-Weston).
Schemes have not been selected for the Duddon estuary in any of the operating modes because there is no deep water to install turbines, so the energy output would be very low if tested in the CSM with existing estuary bathymetry.
These schemes should be considered for the scenario modelling (D3).
Tidal Modelling – D01 Tidal Resource Characterisation
B&V Team Page 11 of 148

Tidal Modelling – D01 Tidal Resource Characterisation
B&V Team
Page 12 of 148
Summary of ebb-only conventional turbines scheme selection
Note: there is no selection for the Duddon (due to lack of deep water for turbines) or tidal lagoons (as dual mode gives greater energy output and achieves 80% tidal range)
Turbine dia. (m)
Turbine unit
capacity (MW)
No. of turbines
Total installed capacity (MW)
Indicative energy output
(TWh/yr) No. Size1 Solway Firth 814 28 5.6 9.0 29 200 5,800 12.1 226 12m x 12m 44% 61 4262 Duddon 32 6 5.8 - - - - - - - -3 Morecambe Bay 455 18 6.2 9.0 16 120 1,920 6.2 140 12m x 12m 39% 52 3364 Mersey 56 2 6.5 8.0 25 28 700 1.3 18 12m x 12m 68% 45 7005 Dee 103 8 5.9 8.0 21 40 840 1.6 40 8m x 12m 68% 39 1896 Severn - outer 1060 20 7.0 9.0 40 370 14,800 28.9 320 12m x 12m 50% 78 14467 Severn - Cardiff-Weston 504 16 7.9 9.0 40 216 8,640 18.8 166 12m x 12m 49% 87 11778 Thames 160 8 4.2 9.0 20 32 640 1.1 32 12m x 12m 53% 35 1389 Wash 650 19 4.8 9.0 23 120 2,760 5.1 140 12m x 12m 48% 42 264
10 Humber 292 7 4.3 9.0 20 60 1,200 2.2 80 12m x 12m 51% 37 30711 Wigtown Bay lagoon 163 15 4.812 Kirkcudbright Bay lagoon 16 4 5.113 Cumbria lagoon 62 20 5.514 Dee-Wirral lagoon 268 37 5.915 Oxwich Bay lagoon 14 6 6.116 West Aberthaw lagoon 30 13 7.517 Rhoose lagoon 25 12 7.518 Bridgwater Bay lagoon 90 16 8.319 Morte Bay lagoon 12 5 5.520 Rye Bay lagoon 103 25 5.221 Dymchurch lagoon 103 23 5.2
Location
Basin area
(km2)
Mean tidal
range (m)
Impound ment length (km)
GWh/yr per
turbine
GWh/yr per km
impound ment
Suggested installed capacity Min. tidal
range inside basin
Turbine selection Sluices

Tidal Modelling – D01 Tidal Resource Characterisation
B&V Team
Page 13 of 148
Summary of dual mode, conventional turbines scheme selection
Note: there is no selection for the Duddon, Morecambe Bay, Severn Cardiff-Weston, Thames or Humber due to insufficient deep water to accommodate required turbine numbers
Turbine dia. (m)
Turbine unit
capacity (MW)
No. of turbines
Total installed capacity (MW)
Indicative energy output
(TWh/yr)1 Solway Firth 814 28 5.6 9.0 18 1100 19,800 31.0 83% 28 10922 Duddon 32 6 5.8 - - - - - -3 Morecambe Bay 455 18 6.2 - - - - - -4 Mersey 56 2 6.5 9.0 18 25 450 0.9 80% 34 4785 Dee 103 8 5.9 9.0 18 60 1,080 2.2 80% 36 2596 Severn - outer 1060 20 7.0 9.0 18 875 15,750 45.0 80% 51 22507 Severn - Cardiff-Weston 504 16 7.9 - - - - - -8 Thames 160 8 4.2 - - - - - -9 Wash 650 19 4.8 9.0 14 350 4,900 8.5 80% 24 440
10 Humber 292 7 4.3 - - - - - -11 Wigtown Bay lagoon 163 15 4.8 9.0 14 160 2,240 3.8 80% 24 26112 Kirkcudbright Bay lagoon 16 4 5.1 9.0 18 14 252 0.4 80% 27 9513 Cumbria lagoon 62 20 5.5 9.0 18 70 1,260 2.2 82% 31 10814 Dee-Wirral lagoon 268 37 5.9 9.0 18 250 4,500 9.0 80% 36 24415 Oxwich Bay lagoon 14 6 6.1 9.0 22 16 352 0.6 80% 39 10216 West Aberthaw lagoon 30 13 7.5 9.0 27 45 1,215 2.3 82% 52 17417 Rhoose lagoon 25 12 7.5 9.0 27 40 1,080 2.0 82% 49 15818 Bridgwater Bay lagoon 90 16 8.3 9.0 30 120 3,600 6.9 81% 58 43519 Morte Bay lagoon 12 5 5.5 9.0 18 14 252 0.4 83% 31 8820 Rye Bay lagoon 103 25 5.2 9.0 18 110 1,980 3.2 80% 29 12621 Dymchurch lagoon 103 23 5.2 9.0 18 110 1,980 3.2 80% 29 137
Basin area
(km2)
Mean tidal
range (m)Location
Min. tidal
range inside basin
Turbine selectionImpound
ment length (km)
Suggested installed capacity
GWh/yr per
turbine
GWh/yr per km
impound ment

Tidal Modelling – D01 Tidal Resource Characterisation
B&V Team
Page 14 of 148
Summary of dual mode, Rolls-Royce turbines scheme selection
Note: there is no selection for the Duddon (due to lack of deep water for turbines)
1 Solway Firth 814 28 5.6 750 0 6,790 20.8 80% 28 7322 Duddon 32 6 5.8 - - - - -3 Morecambe Bay 455 18 6.2 320 0 3,670 10.5 80% 33 5684 Mersey 56 2 6.5 40 0 570 1.4 80% 35 7675 Dee 103 8 5.9 55 0 740 1.7 81% 31 2066 Severn - outer 1060 20 7.0 800 352 7,540 24.1 75% 21 12077 Severn - Cardiff-Weston 504 19 7.9 165 900 5,130 17.0 80% 16 9128 Thames 160 8 4.2 90 20 530 1.8 80% 16 2169 Wash 650 19 4.8 400 0 3,150 8.3 80% 21 431
10 Humber 292 7 4.3 200 0 1,340 3.7 80% 18 50711 Wigtown Bay lagoon 163 15 4.8 140 0 1,160 3.2 80% 23 22112 Kirkcudbright Bay lagoon 16 4 5.1 12 0 110 0.3 80% 25 7513 Cumbria lagoon 62 20 5.5 60 0 450 1.6 80% 27 8014 Dee-Wirral lagoon 268 37 5.9 220 0 2,360 6.9 80% 32 18715 Oxwich Bay lagoon 14 6 6.1 16 0 190 0.5 82% 33 8416 West Aberthaw lagoon 30 13 7.5 40 0 580 1.7 82% 42 12417 Rhoose lagoon 25 12 7.5 30 0 410 1.3 80% 42 10118 Bridgwater Bay lagoon 90 16 8.3 110 0 1,500 4.1 90% 37 25719 Morte Bay lagoon 12 5 5.5 14 0 140 0.4 84% 27 7620 Rye Bay lagoon 103 25 5.2 100 0 780 2.5 80% 25 10221 Dymchurch lagoon 103 23 5.2 100 0 780 2.5 80% 25 110
Location
Basin area
(km2)
Mean tidal
range (m)
No. of 14m dia. turbines
No. of 9m dia. turbines
Indicative max. output (MW)
Suggested installed capacity
GWh/yr per
turbine
GWh/yr per km
impound ment
Indicative energy output
(TWh/yr)
Min. tidal
range inside basin
Impound ment length (km)

Tidal Modelling – D01 Tidal Resource Characterisation
B&V Team Page 15 of 148
Key Findings from the Tidal Range Characterisation are: Previous studies of UK tidal power have focussed on ebb-only generation, as this was
generally believed to be likely to be the most economic in terms of CoE and importantly minimises the absolute quantum of the capital costs (which have been an important constraint on large-scale barrage development). With this mode of operation, the tidal range within the impounded basin is generally around 50% of the natural range, which has in turn caused environmental issues to be a constraint on development. To increase the range inside the basin requires additional turbines and sluices. Often there is insufficient deep water in estuaries to achieve this using conventional bulb turbines (as these require a relatively deep submergence to avoid cavitation), at least along the previously specified alignments. However, in some cases, it may be possible and worthwhile to dredge alignments to achieve such an approach. Rolls-Royce turbines do not require as much submergence as conventional turbines and so a lack of deep water (in the natural condition) is less of a constraint.
The assumptions built into the 0-d model used in this study predict around 10% extra energy compared with previous studies of the same scheme that have generally also been obtained with a 0-d model. This increase is explained by the different treatment of machine outages in this study and partly because turbine efficiency has been enhanced since the 1970s.
If there is sufficient deep water to install enough turbines to achieve 80% of natural tidal range, the energy output from dual mode (ebb-flood) operation is likely to be significantly greater than for ebb-only operation. The optimisation of dual mode generation to achieve a particular tidal range constraint, particularly when using optimised starting heads, appears to be novel, and has not been considered for most existing schemes.
Although dual mode operation can meet the ETI’s specified tidal range constraints, and generally has a much greater energy output, the number of turbines required may mean that the economics are less attractive compared to the previously well-studied ebb-only schemes (although this does not appear to be the case for all schemes and it appears that the economics of some schemes may be improved when optimisation is fully implemented). However, the required number of turbines may be a constraint, although given enough incentives (and potentially a long-term roll out of the different sites) such manufacturing requirements should not be insurmountable. Perhaps more of an issue may be that the maximum power generated by such dual mode schemes using traditional bulb turbines is much greater, and therefore the grid reinforcement for such schemes may be prohibitive, although the Rolls-Royce turbines mitigate this to some extent by operating for longer at lower maximum output.
A relatively sophisticated energy/cost proxy has been developed to assess the relative CoE between schemes to inform the scenario modelling. However, this is no substitute for using the CoE model developed under D4.
In terms of energy output (relative to the cost of turbines, embankment and locks), the best location for a scheme is a large barrage on the Severn (either at the Cardiff-Weston or Outer alignment) followed by Bridgwater Bay lagoon, Solway Firth barrage, Morecambe Bay barrage and Dee barrage. The Severn schemes appear significantly more economic than others, which matches previous literature.
Some schemes are only possible with Rolls-Royce turbines, assuming that significant dredging is not undertaken and that the 80% tidal range constraint is fully imposed. These include Morecambe Bay, Severn Cardiff-Weston, Thames and the Humber. However, it could be that these alignments could be possible and similarly economic using conventional turbines and extensive dredging outside of the turbine caissons. The Rolls-Royce turbines appear to be most competitive (comparatively) at the Mersey.
Lagoons are inevitably more costly than barrages in the same location because they need a longer embankment. Larger lagoons are more efficient than smaller ones, as expected.
Effective turbine operation in dual mode with conventional turbines is sensitive to the starting heads that are used. The starting heads selected based on 0-d model results potentially may not operate as desired when implemented in the CSM because of two-dimensional

Tidal Modelling – D01 Tidal Resource Characterisation
B&V Team Page 16 of 148
hydrodynamic effects. This could cause the predicted energy output to fall significantly, without further optimisation within the CSM (which is beyond the scope of this entire project).
Two-dimensional effects not represented in the 0-d model testing in this report may reduce the annual energy output for the selected schemes. These 2-d effects will be greatest where the flow of water away from the turbines is hampered by a shallow sea bed (such as the Dee estuary), a narrow deep water channel (such as the Mersey estuary or at Morecambe Bay), or in an estuary that has strong longitudinal gradients in tidal range (such as the Severn). The CSM will also represent the effect of schemes on downstream sea levels and interactions between schemes, which are not represented in the 0-d model.
Key Recommendations are:
The schemes outlined in this report should be used as the basis for the development of the scenario modelling (D3).
The CSM’s proposed extensive coverage around the UK and surrounding waters, and its proposed open boundary location in deep water beyond the continental shelf, is (based on previous modelling experience of large scale barrages) sufficient to ensure that all significant impacts of these schemes are included in the model. One method for validating this at a later date (once the CSM is built) is to review the impacts of the schemes on the open boundaries.
Given the relatively novel approach of imposing a tidal range constraint and the importance of the optimisation of dual mode schemes, further work (which is beyond the scope of this entire project) using a combination of the CoE model from D4 and the CSM outputs is recommended to inform a relatively accurate assessment of the UK’s optimal tidal range deployments in terms of locations, technology and capacity characteristics, and cost - and hence derivation of an overall resource-cost curve for the potential of large-scale and widespread tidal range implementation in the UK.
An initial high level estimation of energy output for barrages (assuming no turbine constraints) and lagoons may be obtained by applying simple (derived) equations based on the tidal range and impounded area at a site, avoiding the need to undertake 0-d modelling at very early development stages. Further work could potentially incorporate a simplified costing approach to derive an initial high level CoE estimation for any site to allow automated searching (using a GIS system without any hydrodynamic modelling) of potential development sites based on minimising CoE. Alternatively, costing routines could be added to the CSM in a similar manner although this would probably require the use of the coarse resolution CSM as otherwise model run costs would escalate rapidly in use.
The 0-d model used to develop some of these schemes is presented as part of this report, and should be readily usable by any suitably experienced modeller. This 0-d model does not take account of hydrodynamic effects and therefore should always be confirmed in an appropriate hydrodynamic model. Part B: Tidal Current Resource Characterisation The objective of the Tidal Current Resource Characterisation part of this report is to review locations for tidal current farms based on the literature available, primarily the Carbon Trust’s June 2011 ‘UK Tidal Current Resource & Economics’, referred to hereafter as the CT 2011 report, and list potential areas, water depth, extent, and estimated power and energy output for tidal farms that are considered viable (see Section 9.2.1). The specific scope was to identify farms over 100MWp; however, after discussions with the ETI this criteria was relaxed (to 60MWp) to account for most potentially economic locations in UK waters.

Tidal Modelling – D01 Tidal Resource Characterisation
B&V Team Page 17 of 148
This report will be used as an input to the scenario modelling workpackage (Deliverable 03 – Scenarios modelling) and includes:
Key assumptions and criteria used to develop the results (Section 9.2.3);
Base case scenario and anticipated error bands to mitigate uncertainties and limitations (Section 9.2.3);
Various scenarios to provide a summary of the possible range of results (Section 10.1).
The underlying hydrodynamic modelling used in the CT 2011 report is essentially based on the far-field response of the tidal system with regard to the economic and environmental implications of widespread, large-scale TEC (tidal [current] energy converter) deployment. The approach adopted is to consider ideal representations of each of the (three) relevant hydrodynamic mechanisms which give rise to the tidal current conditions necessary for TEC deployment. The hydrodynamic mechanisms are: Hydraulic Current; Resonant Basin; and, Tidal Streaming. In all three tidal regimes, an upper theoretical limit was identified beyond which attempts to extract more energy from the system actually reduces the overall energy that is harvested. This indicates the existence of a theoretical extraction limit in a particular location using the TEC technology approach. The methodologies and assessment approach presented in the CT 2011 report is still viewed by B&V and UoE as the most advanced existing assessment of a national scale tidal current energy resource; however, to ensure this remains the case the most recent relevant literature has been reviewed to identify complementary or alternative approaches which may be considered to update the CT 2011 study’s methodology. UoE completed a literature review (Appendix B) which focused on the most recent literature (since the CT 2011 report) relevant to the tidal current energy resource. The literature review concluded that, apart from the publications by Salter and MacKay discussed in the CT 2011 report, there does not seem to be any significantly different approach being disseminated in the literature. The approach used within the CT 2011 report, and therefore that proposed within this document, represents the main approach being adopted by other investigators in terms of how to incorporate energy harvesting into a numerical model and how to characterise tidal energy resource availability using simple analytical expressions. The main findings are presented in Section 9.2.3.2. All the sites identified in the CT 2011 report were summarised and reviewed in the context of the Tidal Resource Modelling workpackage and acceptance criteria. The constraints applied to each of the locations in the CT 2011 report have been summarised in the report. These include the technical constraint assumptions: resource intensity, rotor diameter, rated velocity, turbine clearance and spacing, tidal range, structural drag, wake effects, water depth, and also the practical constraints. For the practical constraints, the CT 2011 report identified fishing, shipping and designated conservation sites and applies a probability of that the site will be developed (or part developed). These results are summarised in this report in Section 9.2.4. The practical constraints discussion does not include a number of potentially important constraints:
a. Grid connection/accessibility: This is considered an important constraint but, although an option for this was proposed, it is not included in the scope of work. Therefore, it should not be considered in any scenario modelling.
b. Wave constraints: Some sites have relatively intense wave climates, which will make near-term deployment less likely. This should be considered in the scenario modelling timescales.
c. Tidal range project interaction constraints: There may be interactions between tidal range and current project developments. This is not accounted for at this stage, as it is an output of the (later) work scope.
d. Tidal range constraints: Some sites have relatively high tidal ranges, which may make near-term deployment less likely. This should be considered in the scenario modelling timescales.

Tidal Modelling – D01 Tidal Resource Characterisation
B&V Team Page 18 of 148
It has been recognised that the CSM should ideally have the ability to highlight new sites if applicable; however, it is important to define the known large-scale and viable sites in order to enhance the accuracy of the model for these sites, especially as these are likely to drive the interaction effects on other sites. This should be considered in the scenario modelling approach. The sites that have been selected from the CT 2011 report short-list are characterised by these generic criteria:
Mean sea level (MSL) of greater than 15m;
Mean annualised power density in excess of 1.5kW/m2;
Installed capacity: Farm rated power greater than 60MWp.
The key sites were subsequently identified (using these generic criteria above) and agreed as: 1. Pentland Firth Deep 2. North East Jersey 3. Mull of Kintyre 4. Carmel Head 5. Islay / Mull of OA 6. Isle of Wight 7. Race of Alderney 8. Westray Firth 9. Mull of Galloway 10. South Jersey 11. Bristol Channel -
Minehead 12. South Minquiers (Jersey)
13. Pentland Firth Shallow 14. North of N. Ronaldsay Firth
15. N. Ronaldsay Firth
16. East Casquets 17. West Casquets 18. Rathlin Island 19. West Islay 20. Ramsey Island These key sites are shown overleaf. Maps of these areas can be found in Appendix C which incorporates the sites for all the CT 2011 report which have been reduced to the above short-list for this piece of work as described throughout this report. The CSM’s proposed extensive coverage around the UK and surrounding waters, and its proposed open boundary location in deep water beyond the continental shelf, is (based on previous modelling experience of tidal current farms) sufficient to ensure that all significant impacts of these schemes are included in the model. One method for validating this at a later date (once the CSM is built) is to review the impacts of the schemes on the open boundaries.

Tidal Modelling – D01 Tidal Resource Characterisation
B&V Team Page 19 of 148

Tidal Modelling – D01 Tidal Resource Characterisation
B&V Team Page 20 of 148
2 GENERAL INTRODUCTION
The ETI has proposed to develop a Continental Shelf Model (CSM) of the UK waters to assess the tidal energy potential around the UK, to inform the design of energy harnessing schemes and to evaluate their impact on European coasts. Black & Veatch (B&V), in collaboration with HR Wallingford (HRW) and the University of Edinburgh (UoE), is providing support with regard to the development of this model and subsequent use by the tidal power industry. This report has been led by B&V and is part of the Tidal Resource Modelling (TRM) scope of work delivered by B&V as prime contractor. B&V has been consulting on tidal energy since 1975 (B&V was previously Binnie & Partners in the UK until 1995). We have a very broad and in depth experience of both tidal range and current projects including resource assessment and project development, technology development, due diligence, cost of energy and policy development. Through working on these projects, we have gained a deep technical and commercial understanding of tidal energy projects in addition to simply resource assessment. HRW has vast experience of numerical modelling of free surface waters using TELEMAC and has been instrumental in its continued development. The TELEMAC system is a state-of-the-art free surface flow suite of solvers developed by a kernel of European organisations including HR Wallingford and other partners such as Electricité de France and the Federal Waterways Engineering and Research Institute of Germany. HRW’s expertise is acknowledged within the UK tidal modelling community as the only entity with an in depth experience of TELEMAC and its modification. The University of Edinburgh (UoE) is one of the largest and most successful universities in the UK with an international reputation as a centre of academic and research excellence. The Institute for Energy Systems (IES) is one of five multi-disciplinary research groupings within the School of Engineering at the University. In the most recent UK wide Research Assessment Exercise (RAE2008), the School was ranked third in the UK for combined research quality and quantity. The aim of the TRM scope of work is to answer the following fundamental questions:
1. How will the interactions between tidal range and tidal current systems positioned around the UK’s waters combine to form an overall effect?
2. Will the extraction of tidal energy resource in one area impact the tidal energy resource at distant sites around the UK and Europe?
3. What constraints might these interactions place on the design, development and location of future systems?
This will be achieved through a series of workpackages and, ultimately, 10 deliverables of which this report forms Deliverable 01 (D01) - which B&V and UoE have contributed to. The deliverables are outlined below. D01 – Tidal resource characterisation D02 – Continental Shelf Model (CSM) definition and requirements document D03 – Scenarios modelling D04 – Cost of Energy Model and supporting documentation D05 – Interface specification for detailed tidal current modelling (via PerAWaT project) with CSM D06 – CSM (coarse and detailed versions) with supporting documentation D07 – Interactions (analysis and conclusions report) D08 – Interface specification for detailed tidal range model and the CSM D09 – Tidal Range model and supporting documentation D10 – Project dissemination
Tidal Modelling – D01 Tidal Resource Characterisation
B&V Team Page 21 of 148
PART A: TIDAL RANGE CHARACTERISATION
3 TIDAL RANGE INTRODUCTION
This report characterises the UK tidal range resource and identifies potentially feasible schemes, which addresses deliverable D1 of this study. The report contains sections describing technically feasible modes of operation for traditional barrage and lagoon options and recent technology development options. In particular, the constraint caused by the ETI’s stated requirement to maintain at least 80% of natural tidal range is discussed. Potential locations for tidal barrages and lagoons with peak power output greater than 100MW are identified. For barrages, site selection is based on a literature review of previous studies. Potentially feasible locations for tidal lagoons are identified from mapping of tidal range and water depth. In total, 21 barrage and lagoon sites have been selected to be taken forward for scenario testing. 4 TIDAL RANGE PROJECT DESIGN/METHOD
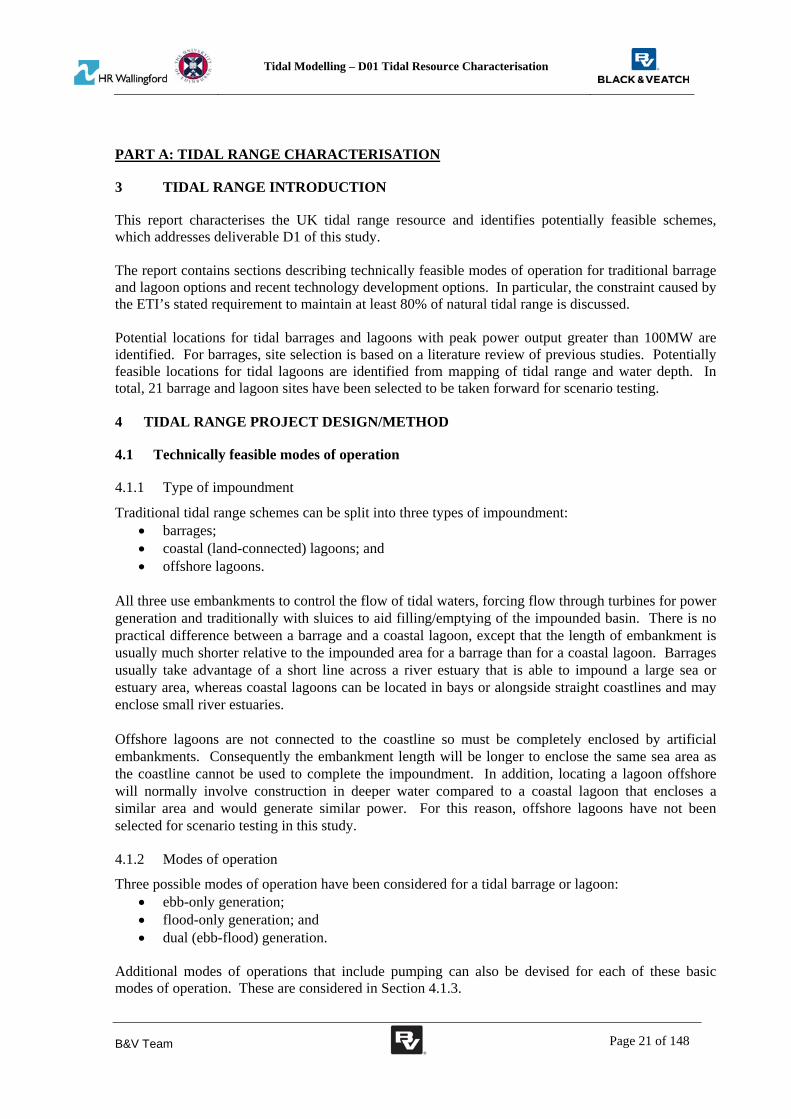
4.1 Technically feasible modes of operation
4.1.1 Type of impoundment
Traditional tidal range schemes can be split into three types of impoundment: barrages; coastal (land-connected) lagoons; and offshore lagoons.
All three use embankments to control the flow of tidal waters, forcing flow through turbines for power generation and traditionally with sluices to aid filling/emptying of the impounded basin. There is no practical difference between a barrage and a coastal lagoon, except that the length of embankment is usually much shorter relative to the impounded area for a barrage than for a coastal lagoon. Barrages usually take advantage of a short line across a river estuary that is able to impound a large sea or estuary area, whereas coastal lagoons can be located in bays or alongside straight coastlines and may enclose small river estuaries. Offshore lagoons are not connected to the coastline so must be completely enclosed by artificial embankments. Consequently the embankment length will be longer to enclose the same sea area as the coastline cannot be used to complete the impoundment. In addition, locating a lagoon offshore will normally involve construction in deeper water compared to a coastal lagoon that encloses a similar area and would generate similar power. For this reason, offshore lagoons have not been selected for scenario testing in this study. 4.1.2 Modes of operation
Three possible modes of operation have been considered for a tidal barrage or lagoon: ebb-only generation; flood-only generation; and dual (ebb-flood) generation.
Additional modes of operations that include pumping can also be devised for each of these basic modes of operation. These are considered in Section 4.1.3.

Tidal Modelling – D01 Tidal Resource Characterisation
B&V Team Page 22 of 148
An example of ebb-only generation is shown in Figure 1. There are usually four distinct phases of operation:
1. Hold – water is held in the basin by closing the turbines and sluices once sea levels fall below the basin level after high tide.
2. Generation – when the water level difference across the embankment is sufficient the turbines can be opened and power is generated by water flowing through the turbines back out to sea during the ebb tide.
3. Hold – when the water level difference across the turbines falls to the minimum for generation, the turbines are closed.
4. Refill – On the flood tide, once the downstream sea level rises above the basin level, the sluices are opened to refill the basin. The turbines are also opened, not to generate but free-wheeling, so as much water as possible flows back into the basin.
Water levels within the basin generally remain above the natural mean sea level throughout the tidal cycle. Energy is generated for roughly 50% of the time in the example shown, although the length of generation will vary depending on the installed turbine capacity and over the spring-neap cycle.
Figure 1 Example of ebb-only operation
Flood-only generation reverses this approach so that power is generated on the flood tide as water fills the basin. Flood-only generation is usually less effective than ebb-only generation. If there are intertidal areas in the basin, the storage volume held in the upper (vertical) half of the basin between mid tide and high water (which is primarily utilised for ebb generation) is greater than in the lower (vertical) half of the basin between low water and mid tide (which is primarily used for flood generation). Since the storage volume available for flood generation is lower, water levels in the basin rise more quickly than the corresponding rate of fall for ebb generation. This means that the duration
Time
Basin level
Sea level
Power
hold refillrefill holdgenerate hold
mean sea level

Tidal Modelling – D01 Tidal Resource Characterisation
B&V Team Page 23 of 148
of power generation on each tide is shorter for flood generation, so the overall energy output is lower. For this reason, studies of tidal range schemes have focussed on ebb rather than flood generation. As water levels within the basin are held well below natural high tide levels, flood generation has obvious advantages in terms of flood defence and land drainage. These lower water levels are also a major disadvantage, however, for shipping to any ports within the barrage/lagoon since water depths are greatly reduced. Examples of dual (ebb-flood) generation are shown in Figure 2 and Figure 3. The phases of operation are:
1. Hold – water is held in the basin by closing the turbines and sluices once sea levels fall below the basin level after high tide.
2. Generation – when the water level difference across the embankment is sufficient the turbines can be opened and power is generated by water flowing through the turbines back out to sea during the ebb tide.
3. Drain – when the water level difference across the turbines falls to the minimum for generation, the turbines are allowed to free-wheel and sluices (if present) are opened so that the basin continues to drain. There is less benefit in including sluices in an ebb-flood scheme than for an ebb-only scheme as the time they are operational is much shorter.
4. Hold – the turbines (and sluices) are closed once sea levels rise above basin level. 5. Generation – when the water level difference across the embankment is sufficient the turbines
can be opened and power is generated by water flowing through the turbines into the basin during the flood tide.
6. Refill – when the water level difference across the turbines falls to the minimum for generation, the turbines are allowed to free-wheel and sluices (if present) are opened so that the basin continues to fill.
The example of dual generation in Figure 2 could represent conditions at a tidal barrage where the estuary width and depth constrains the number of turbines that can be installed. The turbine capacity is insufficient to maintain the natural tidal range within the basin so the generating head is less than for the equivalent ebb-only scheme and consequently the maximum power output is lower. Generation takes place for a greater proportion of the time, however, than for ebb-only operation. As with flood-only operation, the lower water levels in the basin may be beneficial for flood defence and possibly land drainage (although low water levels are also raised above natural conditions with dual generation). The reduction in high water levels remains a problem for shipping. Figure 3 also shows dual generation but with increased turbine capacity, as may be possible for a tidal lagoon, where the length of the impoundment located in water that is deep enough to locate turbines is often less of a constraint. The increased capacity allows the basin to drain and fill to much closer to the natural high/low tide levels on each ebb and flood tide. The optimum energy output is achieved by delaying the start of generation until there is a large head difference. This gives a short period of high power output, twice each tide.

Tidal Modelling – D01 Tidal Resource Characterisation
B&V Team Page 24 of 148
Figure 2 Example of dual (ebb-flood) operation (1)
Figure 3 Example of dual (ebb-flood) operation (2)
Time
Basin level
Sea level
Power
refill generategenerate refillgenerate drain
hold hold
mean sea level
Time
Basin level
Sea level
Power
refill generategenerate refillgenerate drainhold hold
mean sea level

Tidal Modelling – D01 Tidal Resource Characterisation
B&V Team Page 25 of 148
The examples shown above give an indication of why previous studies have generally selected ebb-only schemes for tidal barrages. Barrage locations are chosen to minimise embankment length and hence construction costs. These shorter alignments usually only contain a short section that is deep enough to allow turbines to be submerged at all tidal states by enough water to avoid cavitation. This constraint has usually prevented the optimum energy output being reached for dual schemes. As tidal lagoons have longer embankments it is usually possible to install proportionally more turbines and dual mode becomes more attractive, as was the case for the Bridgwater Bay lagoon in the Severn Estuary Tidal Power Feasibility Study (DECC, 2010a). 4.1.3 Use of pumping
A possible modification to any ebb, flood or dual generation scheme is to use pumping to increase generating heads. In this mode of operation, the turbines are powered in reverse to act as pumps during the high and/or low tide ‘hold’ phases described above – to raise levels in the basin at high water or drain levels further at low water. Although the turbines are less efficient for pumping than for generating, pumping takes place at relatively low heads but delivers high generating heads so is usually shown to increase the overall scheme energy yield. In addition, as pumping increases tidal range in the basin it will help to deliver the 80% of natural tidal range target. Often energy outputs are assessed using simple flat-estuary models that do not represent the complex one- and two-dimensional hydrodynamics, which are likely to diminish the overall effectiveness of pumping in most cases. Modelling of flood pumping with ebb-only generation for the Severn Cardiff-Weston scheme (B&P, 1989a) showed an increase in energy of only 3% using a 1-d model compared to 10% using a 0-d model. Later 2-d modelling gave similar results to the 1-d model. The physical reasons for the differences are:
The tide shape on the seaward side of the barrage. Downstream tide levels fall more rapidly in the 1-d or 2-d models during flood pumping than in the sinusoidal shape assumed in the 0-d model. This is because the 1-d or 2-d models are capturing the effect of the barrage/lagoon on downstream sea levels. Consequently, the 0-d model underestimates the head under which the pumps operate and, therefore, the energy required for pumping.
The hydrodynamics within the basin. Due to the flood pumping, water levels are raised locally within the basin in the vicinity of the turbines. In addition, water attempts to drain out of the basin but collects against the impoundment line again causing locally raised water levels. These hydrodynamic effects are not represented in the 0-d model. As both these effects increase the pumping head, they reduce the energy benefit of pumping.
The one- and two-dimensional effects that reduce the effectiveness of pumping compared to 0-d model predictions are likely to be greatest in large estuaries such as the Severn. The benefit of pumping may be greater for smaller estuaries or lagoons. Pumping has not been included in the tidal range scenarios developed for this study. It adds considerable complexity to the operation of a scheme, whilst potentially delivering only a relatively small energy increase. It is a refinement that should be considered in detailed studies of individual schemes but it is not necessary for this UK-wide study. 4.2 Maintaining at least 80% of natural tidal range
An ETI requirement of this study is that schemes should maintain at least 80% of the natural tidal range. This means that the turbines and sluices in the barrage/lagoon embankment must have sufficient capacity to pass at least 80% of the natural tidal prism and so maintain 80% of the natural tidal range within the impounded area. The effect on tidal range outside the barrage will be smaller,

Tidal Modelling – D01 Tidal Resource Characterisation
B&V Team Page 26 of 148
although previous studies have shown considerable differences to water levels downstream of the Outer and Cardiff-Weston barrages in the Severn estuary. The environmental impact of a tidal barrage/lagoon will be minimised by following the natural tidal regime as closely as possible. It follows that if a scheme can maintain at least 80% of the natural tidal range it may be more likely to be granted approval than if the tidal range is reduced further (say by 50%). The overall environmental impact is very complex however, and influenced by many other factors in addition to the tidal range. The requirement of maintaining 80% of natural tidal range has not been considered in previous studies of tidal power around the UK. With normal ebb-only operation, schemes have generally been optimised for energy output. This usually causes a reduction in the tidal range within the impoundment of about 50% - with almost no change to high water levels but low water levels raised to approximately the natural mean sea level (as shown in Figure 1). Operating a scheme in this way maintains a generating head of about half the tidal range, whilst allowing the basin to refill efficiently. There are several ways to increase the tidal range within the impoundment for an ebb only scheme, such as:
Opening sluices after power generation on the ebb tide; Free-wheeling the turbines after power generation on the ebb tide; Starting power generation sooner after high water; or Keeping sluices open whilst the turbines are generating.
Each of these strategies allows more flow to pass into and out of the impounded basin by keeping turbines and sluices open for longer. An alternative way to achieve 80% of natural tidal range it is to add more turbines to the barrage. This is not possible at all locations due to the constraint of estuary width and available deep water in the alignment. Table 1 gives an example from tests (using the simple 0-d model described in Section 4.5.4.2), starting from the ebb-only Severn Cardiff-Weston scheme selected in the Severn Tidal Power study (DECC, 2010b). The bold text indicates options that reach 80% of natural tidal range. These results indicate that:
With the baseline conditions with 216 turbines and 166 sluices, both the energy output and tidal range is greater with ebb-only operation than for dual mode.
Opening the sluices and free-wheeling the turbines after power generation has only a marginal effect on the ebb-only energy output and tidal range. There is a 10% increase in the energy output for dual mode.
Starting power generation as soon as possible reduces the energy output considerably for ebb-only operation (by 25%) but the minimum tidal range is only increased to 65%. For dual mode the energy reduction is smaller but the minimum tidal range is only marginally increased to 48%.
To achieve 80% of natural tidal range with the same number of turbines and sluices in ebb-only mode, it is necessary to have 70 sluices open through the generating phase. This reduces the annual energy output by 60% to only 7.4TWh.
To achieve 80% of natural tidal range with the same number of turbines and sluices in dual mode, it is necessary to have 120 sluices open through the generating phase. This reduces the annual energy output to 8.9TWh.
Increasing the number of turbines to either 400 (retaining 166 sluices) or 450 (with no sluices) achieves 80% of tidal range for both ebb-only and dual modes. In both cases, the energy

Tidal Modelling – D01 Tidal Resource Characterisation
B&V Team Page 27 of 148
output is greater for dual mode. Note that there is insufficient deep water along the Cardiff-Weston alignment to install 400 turbines.
Table 1 Tests to achieve 80% of natural tidal range for Severn Cardiff-Weston barrage
No.
of
turb
ines
No.
of
slui
ces
Slu
ices
ope
n af
ter
gene
rati
on
Fre
e-w
heel
ing
turb
ines
Min
. sta
rtin
g he
ads
No.
of
slui
ces
open
dur
ing
gene
rati
on
Ebb-only Dual
Ene
rgy
outp
ut
(TW
h/yr
)
Min
. tid
al
rang
e
Ene
rgy
outp
ut
(TW
h/yr
)
Min
. tid
al
rang
e
216 166 - - - - 18.9 49% 17.4 38% 216 166 Yes - - - 18.8 51% 18.8 41% 216 166 Yes Yes - - 18.8 52% 19.5 43% 216 166 Yes Yes Yes - 14.1 65% 17.7 48% 216 166 Yes Yes Yes 70 7.4 80% 12.4 69% 216 166 Yes Yes Yes 120 4.7 86% 8.9 80% 400 166 Yes Yes - - 22.0 80% 24.7 80% 450 0 - Yes - - 22.5 80% 27.9 80%
The last two lines in Table 1 show that greater energy output is possible with increased turbine numbers, particularly with dual mode. This was evident for the lagoons tested in the Severn Tidal Power study. For the Bridgwater Bay lagoon, the energy modelling results showed that the unit cost of energy (£/MWh) fell as more turbines were added and the tidal range in the basin increased. As the tidal range in the basin approached the natural range, the generating head for both ebb and flood tides increased, resulting in greater power output. The shape of the tidal curve within the basin, as shown on Figure 3, departs considerably from the natural sinusoidal shape and become more angular with periods of constant level separated by a near constant rate of rise or fall in tide level. The very low head turbines developed by Rolls-Royce (Rolls-Royce and Atkins, 2010) as part of the Severn Embryonic Technologies Scheme (SETS) are also intended to maintain a tide range that is close to the natural tidal range within the impounded basin. As only a low head is required for generation, the hold time at high and low water is lower and generation lasts longer. These turbines are operated in dual mode. A relatively large number of turbines are required to pass enough water to maintain a high tidal range and low operating heads. In the SETS study, Rolls Royce only achieved 80% of natural range by using pumping at high and low water. Pumping potentially does offer some benefit in maintaining tidal range within the impoundment. The effectiveness of pumping is likely to be overestimated by a simple 0-d model that does not account for the longitudinal hydrodynamics of the estuary, particularly in large dynamic estuaries such as the Severn. 4.3 Potential locations for barrage and lagoon schemes
4.3.1 Background
There have been several previous tidal power studies for estuaries around the UK. Consequently, the potential estuary locations for large (greater than 100MW) schemes are well known and can be

Tidal Modelling – D01 Tidal Resource Characterisation
B&V Team Page 28 of 148
assessed from these previous studies. In the past, there has been less focus on tidal lagoons due to the additional length (and therefore cost) of their embankments relative to the energy output. The potential locations of tidal lagoons are less well documented, except perhaps in the Severn. A coastal lagoon might, however, be chosen in preference to one of the previously identified barrage sites for other reasons. For example, so that the impounded basin is not within an area of particular environmental importance or so the embankment does not obstruct a major shipping route. The following section identifies potential barrage and lagoon schemes. 4.3.2 Known barrage and lagoon options
4.3.2.1 Previous studies
Previous studies of tidal power at locations in the UK include: Preliminary Survey of Tidal Energy of UK Estuaries (Binnie & Partners, 1980) Tidal Power from the Severn Estuary, Energy Paper No. 46 (Severn Barrage Committee,
1981) Preliminary Survey of Small Scale Tidal Energy (Binnie & Partners, 1984) The Severn Barrage Project; General Report, Energy Paper No. 57 (Department of Energy,
1989) The UK Potential of Tidal Energy from Small Estuaries (Binnie & Partners, 1989b) Tidal Power (Baker, 1991) Turning the Tide: Tidal Power in the UK (Sustainable Development Commission, 2007) Tapping the Tidal Power of the Eastern Irish Sea (Joule Centre, 2009) Solway Energy Gateway Feasibility Study (Halcrow et al, 2009) Duddon Estuary Tidal Energy (Parsons Brinckerhoff, 2010) Severn Tidal Power Feasibility Study (DECC, 2010b) Mersey Tidal Power Feasibility Study (Peel Energy, 2011a)
A summary of the locations identified in these studies are given in Table 2, taken primarily from Baker (1991). The schemes are listed in descending order of installed capacity. This gives nine estuaries (shown in bold text) that have both installed capacity greater than 100MW and mean tidal range greater than 4m (also an ETI requirement). Strangford Lough has an installed capacity greater than 100MW but the mean tidal range is only 3.1m so has not been selected. The remaining schemes have not been selected because their installed capacities are below 100MW. Alternative alignments and installed capacities for the selected estuaries have been considered in other studies and these are listed and discussed in Section 5. The preferred installed capacities and energy outputs from the recent Severn, Solway Firth, Mersey and Joule studies are different from those listed by Baker and given in Table 2 but this does not affect the selection of which locations to take forward for further consideration. In each of the cases listed in Table 2, the barrages use ebb-only operation. Many of the alternative alignments that are included in Section 5 will be included within the CSM being developed as part of this project (as described in deliverable D02).

Tidal Modelling – D01 Tidal Resource Characterisation
B&V Team Page 29 of 148
Table 2 Summary of UK tidal barrage schemes
Location
Mean tidal range (m)
Basin area
(km2)
Installed capacity (MW)
Annual energy output (GWh) Source
Severn Outer Severn Cardiff-Weston
7.2 7.8
1000 450
12,000 7,200
19,700 12,900
Baker (1991) Baker (1991)
Solway Firth 5.6 860 5,580 10,050 Baker (1991)
Morecambe Bay 6.3 350 3,040 5,400 Baker (1991)
Wash 4.7 590 2,760 4,690 Baker (1991)
Humber 4.1 270 1,200 2,010 Baker (1991)
Thames 4.2 190 1,120 1,370 Baker (1991)
Dee 6.0 90 800 1,250 Baker (1991)
Mersey 6.5 70 620 1,320 Baker (1991)
Duddon 5.8 38 220 336 PB (2010)
Stangford Lough 3.1 144 210 528 Baker (1991)
Milford Haven 4.5 20 96 180 Baker (1991)
Ribble 6.1 11 72 76 Joule Centre (2009)
Wyre 6.6 64 133 SDC (2007)
Cromarty Firth 2.8 36 47 100 Baker (1991)
Conwy 5.2 33 60 SDC (2007)
Loch Broom 3.2 7 29 42 Baker (1991)
Padstow 4.8 6 28 55 Baker (1991)
Loch Etive 2.0 29 28 55 Baker (1991)
Langstone Harbour 3.1 19 24 53 Baker (1991)
Hamford Water 3.0 11 20 38 Baker (1991)
Dovey 2.9 13 20 45 Baker (1991)
Loughor 3.9 41 5 15 SDC (2007) 4.3.3 Other potential locations for lagoons
The Atlas of UK Marine Renewable Energy Resources (BERR, 2008) has been used to identify potential sites for tidal lagoons. Areas were identified with both:
Mean tidal range greater than 4m (assessed by taking the average of mean spring and mean neap tidal range). Contours of mean tidal range above 3.5m are shown in Figure 4.
Water depth below mean sea level of 25m or less. Contours of depths below 30m are shown in Figure 5. A depth of 25m was chosen as this is approximately the submergence depth below mean sea level required for conventional turbines. There is some advantage in choosing a site with depths of 25m as turbines could be installed with minimal dredging. Building a barrage/lagoon embankment in deeper water than this would be very expensive, except for very short distances. Embankment costs are roughly proportional to the square of their depth, so lagoons become much less economically feasible as depth increases.
Note that the resolution of the grid in the Marine Atlas is relatively coarse. As a result narrow deeper channels into estuaries are not picked up. In addition, the tidal range in the Thames estuary had to be

Tidal Modelling – D01 Tidal Resource Characterisation
B&V Team Page 30 of 148
manually adjusted based on Admiralty tide tables to reflect the increasing tidal range in the outer Thames estuary. The areas where both criteria are met are shown in Figure 6. An additional constraint for a tidal barrage or lagoon design is the minimum depth of water at the turbines themselves. For example, the base level of a 9m diameter bulb turbine needs to be submerged to about 20m below spring low tide level to avoid cavitation problems. For a 9m diameter Rolls-Royce turbine, the equivalent submergence is 10m as these machines do not include an expanding draft tube and cavitation is less of an issue because of their slower rotation speed. The required submergence for either bulb or Rolls-Royce turbines can be achieved by dredging (cost and bed materials permitting). A second constraint on turbine siting imposed in this study is the depth of water into which the turbines will discharge. If the turbines discharge into shallow water there will be a large energy penalty due to additional head losses downstream of the turbines. This is because of the high velocities that will be forced to occur in these shallow waters as water flows away from the turbines. Section 4.5.4.3 describes how this constraint has been applied. For illustration, the area where the depth is greater than 15m below mean sea level is shaded blue in Figure 6, with the shallower area shaded red. Figure 6 indicates where lagoons operating at 80% tidal range, that we perceive as most likely to be economic, are potentially feasible:
Along the eastern Irish Sea coast from Luce Bay in south-west Scotland as far as the east coast of Anglesey in north Wales. This includes the Solway Firth, Duddon, Morecambe Bay, Mersey and Dee estuaries identified previously. Lagoons are also possible on the eastern coast of the Isle of Man. Shallow water depths prevent effective turbine operation within the Solway Firth and close to the Liverpool Bay / north Wales coast.
On the south Wales coast, the Severn estuary and along the north Devon and Cornwall coast. Large or small lagoons are possible in the Severn or south Wales coast but only relatively small areas are possible in Devon or Cornwall (except at Bideford Bay) due to deep water off the coast.
On the south-east England coast, between Brighton and Deal. In the Thames estuary, upstream of Southend and the Isle of Sheppey. Along the north of Norfolk and the Lincolnshire coast from east of The Wash to north of the
Humber. Around the Channel Islands.
There are an infinite number of possible lagoon alignments within this area, depending on the size and shape of the lagoon. The ideal barrage/lagoon location will have a high tidal range with a shape that maximises the impounded area whilst keeping the length of embankment to a minimum. The shape of embankment/coastline that maximises the impounded area to embankment length ratio can be broadly ranked as a:
1. Straight embankment across an estuary; 2. Straight embankment across a bay; 3. Semi-circular shaped embankment extending from a concave coastline; 4. Semi-circular shaped embankment extending from a straight coastline; 5. Rectangular shaped embankment extending from a straight coastline (the optimum shape
for rectangular lagoon is for it to extend into the sea half the distance of the landside boundary, assuming that bed levels are uniform).
For any lagoon, economies of scale apply. For a straight coastline, a semi-circular lagoon has an impounded area equal to D/4 times the embankment length, where D is the landward boundary length. Hence as lagoon size increases, the basin area becomes proportionally larger compared to the

Tidal Modelling – D01 Tidal Resource Characterisation
B&V Team Page 31 of 148
embankment length. So, with the same coastline shape and bed levels, larger lagoons will be more cost effective than smaller ones. The same logic applies to other lagoon shapes. As mentioned above, the lagoon embankment needs to have sufficient deep water to fit the optimum number of turbines for energy generation. Ideally the remaining embankment will be shallow to minimise construction costs. The lagoon shape will be largely determined by the shape of the coastline and bed depths so usually departs from a theoretical semi-circular shape. Eleven possible lagoons have been selected covering a range of geographic locations, sizes and tidal range. These are at:
Wigtown Bay; Kirkcudbright Bay; Cumbria; Dee/Wirral – alignment identified in Joule (2009); Oxwich Bay; West Aberthaw; Rhoose; Bridgwater Bay – alignment identified in DECC (2010b); Morte Bay; Rye Bay; and Dymchurch.
Figure 7 shows the location of the selected schemes, with barrages shaded blue and lagoons shaded red. The basin area and impoundment length of these lagoons is listed in Table 3. To enclose the same area with a circular offshore lagoon as for a semi-circular lagoon attached to a linear coastline requires a 40% longer impoundment length. Most of the selected coastal lagoons take advantage of bays to reduce their impoundment length, making the additional embankment required for an offshore lagoon even greater (as shown in Table 3). In addition, the water depths are likely to be deeper for an offshore lagoon and construction more difficult than for a coastal land-connected lagoon. So an offshore lagoon would have considerably higher construction cost, whilst the energy output would remain the same. For this reason, no offshore lagoons have been selected for scenario development.
Table 3 Summary of lagoon selections
Location Basin area
(km2) Impoundment length (km)
Impoundment length for equivalent size offshore
lagoon (km)
Wigtown Bay 163 15 45
Kirkcudbright Bay 16 4 14
Cumbria 62 20 28
Dee-Wirral 268 37 58
Oxwich Bay 14 6 13
West Aberthaw 30 13 19
Rhoose 25 12 18
Bridgwater Bay 90 16 34
Morte Bay 12 5 12
Rye Bay 103 25 36
Dymchurch 103 23 36

Tidal Modelling – D01 Tidal Resource Characterisation
B&V Team Page 32 of 148
4.3.4 Other considerations for detailed lagoon selection
Note that a detailed site selection of tidal lagoon locations for actual project development purposes would consider many factors. Examples of important considerations include:
Shipping routes and ports; Environmental designations; Geology along the embankment line; Longshore drift; and Wave exposure.
4.3.5 Summary of scheme selection
The following barrage and lagoon locations have been selected for scenario development in deliverable D03:
Solway Firth barrage; Duddon barrage; Morecambe Bay barrage; Mersey barrage; Dee barrage; Severn barrage; Thames barrage; The Wash barrage; Humber barrage; Wigtown Bay lagoon; Kirkcudbright Bay lagoon; Cumbria lagoon; Dee/Wirral lagoon; Oxwich Bay lagoon; West Aberthaw lagoon; Rhoose lagoon; Bridgwater Bay lagoon; Morte Bay lagoon; Rye Bay lagoon; Dymchurch lagoon.

Tidal Modelling – D01 Tidal Resource Characterisation
B&V Team Page 33 of 148
Figure 4 Mean tidal range

Tidal Modelling – D01 Tidal Resource Characterisation
B&V Team Page 34 of 148
Figure 5 Depth below mean sea level

Tidal Modelling – D01 Tidal Resource Characterisation
B&V Team Page 35 of 148
Figure 6 Possible tidal lagoon locations
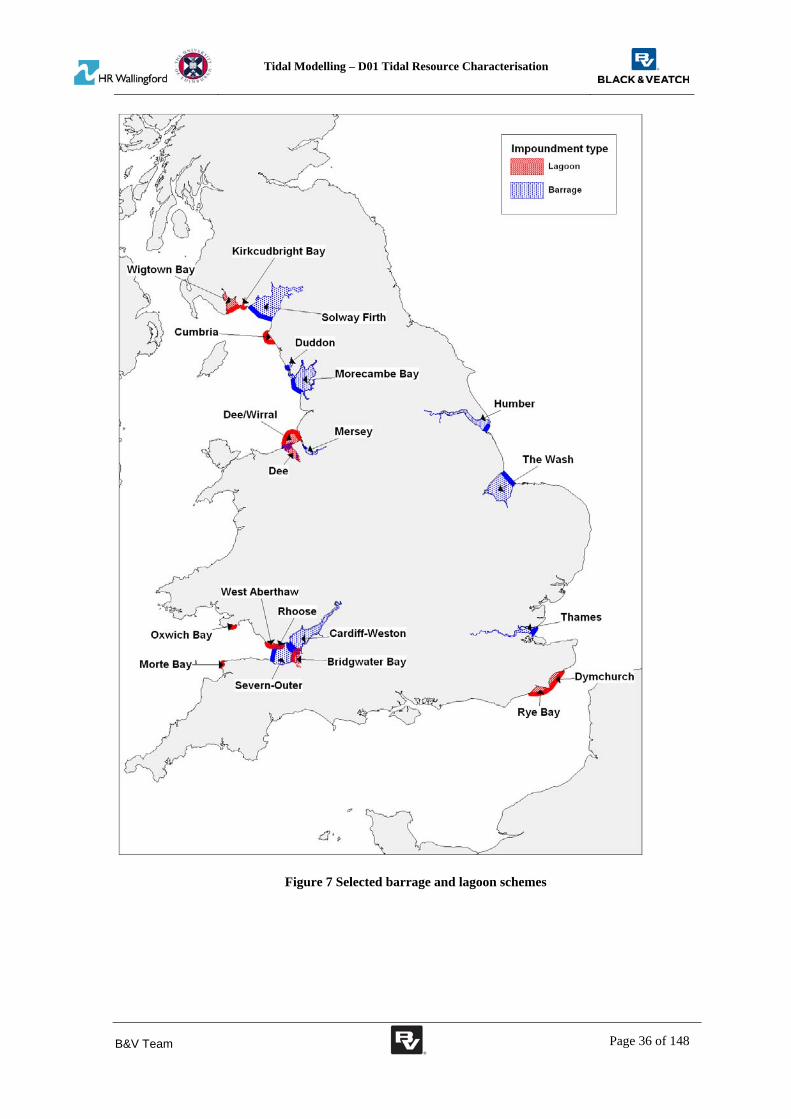
Tidal Modelling – D01 Tidal Resource Characterisation
B&V Team Page 36 of 148
Figure 7 Selected barrage and lagoon schemes

Tidal Modelling – D01 Tidal Resource Characterisation
B&V Team Page 37 of 148
4.4 Technology options
4.4.1 Conventional turbines
Previous studies of tidal power have generally focussed on the use of conventional turbines. These turbines are either of a ‘bulb’ design where the generator is located within the water passage on the turbine axis or of ‘Straflo’ design where the generator is mounted on the circumference of the water passage with the moving part on the blade tips and the static part on the surrounding casing. Turbines of these types are frequently used in low head river hydropower schemes. Bulb turbines are used in the operational tidal power scheme at La Rance in France and one Straflo turbine is installed at Annapolis Royal in Canada. Bulb turbines are also being used for the flood generation tidal scheme at Sihwa in South Korea. The performance of bulb and Straflo turbines is generally similar though the operation of Straflo turbines is less flexible as the blades are fixed, but the length of the machine is shorter as the water passage does not need to accommodate the generator. The performance of both types of turbines are characterised by non-dimensional ‘hill’ charts relating head, flow and efficiency. This is converted to a dimensional characteristic by defining:
Runner diameter; Rotational speed; Rated head / generator capacity; and The route through a performance ‘hill’ chart relating discharge, head and efficiency.
To prevent cavitation damage, the turbines have to be submerged some depth below low water. The submergence depth depends on the turbine diameter, head and maximum discharge. The Tidal Range Cost of Energy Model report, deliverable D04, also contains information about conventional turbines and other technology types. 4.4.2 Rolls-Royce turbines
An alternative turbine design has been developed by Rolls-Royce. These very low head turbines are described in the Volume 1: Summary Report for the Severn Embryonic Technologies Scheme (SETS) (Rolls-Royce and Atkins, 2010), where the scheme is referred to as a Tidal Bar. The Rolls-Royce turbines are designed to:
Operate at very low heads of between 1 and 3m; Generate in dual (ebb-flood) mode; and Rotate at low speeds.
The intended operating head is significantly lower than for conventional turbines, where the optimum could be as much as 6m or more for an ebb-only scheme in the Severn. To operate at low heads throughout the tidal cycle it is necessary to have a large number of turbines, capable of passing large volumes of water and maintaining a high tidal range inside the basin. The benefit of ebb-only operation with conventional turbines is that this allows high heads to be maintained during power generation. This does not apply for Rolls-Royce turbines so there is no benefit in ebb-only operation – dual generation is much more beneficial. Figure 8 shows an example of how a scheme with Rolls-Royce turbines might operate. The tidal profile inside the basin broadly echoes the natural profile, with a time delay and some reduction in the tidal range. In contrast, for dual operation with conventional turbines the basin water level profile becomes close to a square wave, with longer hold periods at high and low tide (as shown in Figure 3). Power generation lasts longer and the maximum power output is lower for a scheme with Rolls-Royce

Tidal Modelling – D01 Tidal Resource Characterisation
B&V Team Page 38 of 148
turbines, compared to an equivalent scheme with conventional turbines. This means that it should be easier for power from a Rolls-Royce scheme to be absorbed into the grid. Another potential benefit of Rolls-Royce turbines over conventional turbines is that, since the Rolls-Royce turbines rotate at lower speeds, they may be less harmful to fish. The slow rotation speed of the Rolls-Royce turbines has the disadvantage that a gearbox is required between the turbine and the generator to give suitable generator rotation speeds. This gearbox consumes part of the mechanical energy generated by the turbines, and adds capital and operating costs. Rolls-Royce turbines were tested for the Severn Cardiff-Weston and Outer barrages as part of SETS. The energy modelling showed significant benefits in terms of energy output and maintaining tidal range when using pumping at high and low tide.
Figure 8 Example of Rolls-Royce turbine operation 4.4.3 Other tidal range technology
4.4.3.1 Spectral Marine Energy Converter
VerdErg’s Spectral Marine Energy Convertor (SMEC) was considered within the Severn Embryonic Technologies Scheme (VerdErg, 2010). It is described as an “innovative fence arrangement comprising a series of vertical columns”. The principle of operation is as follows:
Most of the flow reaching the SMEC passes between the vertical columns (venturi tubes);
Time
Basin level
Sea level
Power
refill generategenerate refillgenerate drainhold hold
mean sea level
hold
Tidal Modelling – D01 Tidal Resource Characterisation
B&V Team Page 39 of 148
The columns are hollow and perforated down their central line, so that when water flows between them it creates a suction effect;
This draws water out of the columns from an enclosed secondary flow route along the sea bed, beginning upstream of the fence;
Turbines installed in this secondary flow route are driven by the fast flowing water; and The turbines in turn drive generators above the water surface.
The head drop across the structure should remain low throughout operation and it is intended to generate on both ebb and flood tides. The SMEC technology has not been included for resource characterisation in this study. There is a lack of available performance data with which to represent the technology. 4.4.3.2 Tidal Reef
Options described as a ‘tidal reef’ were tested as part of the Solway Energy Gateway Feasibility Study (Halcrow et al, 2009). A tidal reef uses low head bulb turbines, maintaining an operating head of about 2m. Energy is generated on both ebb and flood tides. For the Solway Firth Feasibility Study, the options were tested using Andritz’s ECOBulb turbines. The ECOBulb turbine is designed for river hydropower schemes with ‘low’ head generation (2m to 15m head). The turbine specifications were adjusted in the Solway Firth study to provide sufficient power and discharge for use in tidal generation. Linear extrapolation was used to convert discharge and power output from a 3.35m diameter machine to larger diameters (4.5, 7.3 and 9m), which appears questionable since discharge is more likely to be proportional to the turbine area than diameter. The tidal reef concept is essentially very similar to using the Rolls-Royce turbines described in Section 4.5.2. For this reason, tidal reefs have not been considered separately. 4.5 Turbine selection
4.5.1 Conventional turbines
For ebb-only operation, the selection of diameter, speed and capacity have been taken from those used in previous studies. For dual mode, the selection is as follows:
In all cases a runner diameter of 9m has been used. In general, for dual operation it is beneficial to pass as much water through the turbines as possible as this will aid the next phase of generation by maximising the tidal range within the impoundment and hence the generating head available. The largest turbine diameter used in the Severn Tidal Power study (DECC, 2010a) was 9m and this is believed to be at the upper limit for which confidence can currently be placed in the technology (Baker, 1991).
A turbine speed of 50rpm has been adopted, as for the 9m diameter turbines proposed for the Severn Cardiff-Weston scheme (DECC, 2010a).
The turbine submergence requirement has been calculated using the method described by Baker (1991). This indicates that the base of the turbines should be approximately 20m below low tide level to prevent cavitation.
The rated head, and hence generator capacity, has been set at approximately 65% of the mean tidal range at the site. Provided there are a sufficient number of turbines, this means that the rated output should be reached on most tides. If the rated capacity is reduced, the total energy output may decrease but power generation can last for longer. Increasing the rated capacity

Tidal Modelling – D01 Tidal Resource Characterisation
B&V Team Page 40 of 148
and optimising the energy output generally causes power generation to be delayed for longer, which causes shorter and larger ‘spikes’ in energy output.
These selections are based on previous tidal modelling experience and give a basis for comparison of schemes. In a detailed analysis of individual schemes for actual project development purposes, the turbine selection would be refined. For both ebb-only and dual mode operation the turbine performance hill chart given in Baker (1991) has been used with the following assumptions:
For ebb-only operation, taking the maximum output line through the hill chart up to rated head.
For dual operation, taking 95% of the maximum output line through the hill chart up to rated head. This is a simplification used in the Severn Estuary Tidal Power Feasibility Study (DECC, 2009) that approximates taking:
o 100% of maximum output for ebb generation; o 90% of maximum output for flood generation (to account for less effective
performance during flood generation); and o assuming that half the turbines face into the impoundment and half face out of the
impoundment. The maximum turbine efficiency has been defined based on knowledge of turbine
characteristics from previous studies including the Severn Estuary Tidal Power Feasibility Study (DECC, 2009). It includes an allowance for:
o the maximum turbine efficiency for hill charts of the type shown by Baker; o a step-up increase for majoration based on the turbine diameter; and o improvements in turbine design since the 1970s (on which the Baker characteristic is
based). To generate power in both directions requires some modification to the turbine design, which
reduces the efficiency of generation. For dual operation, maximum turbine efficiency has been reduced by 2.5%. This is equivalent to a 4% efficiency reduction for flood generation and 1% efficiency reduction for ebb generation, taken as an average in both directions.
The minimum turbine efficiency for generation is 45%. This defines a cutoff head below which no power generation will take place. Operating the turbines at lower efficiency will provide relatively little power but would damage the turbine and the greater turbulence would cause greater damage to fish.
The generator efficiency is assumed to be 97.5%. No adjustment for machine outages/availability has been made at this stage. Outages are
represented in the Cost of Energy model (deliverable D04). Two example of this methodology are shown in Figure 9, with the selected route overlain on the hill chart given in Baker (1991).

Tidal Modelling – D01 Tidal Resource Characterisation
B&V Team Page 41 of 148
a) ebb-only generation b) dual (ebb-flood) generation
Figure 9 Examples of route taken through hill chart From these assumptions, a suite of turbine designs has been developed that can be applied to dual mode schemes, as listed in Table 4. In actual project development, the turbine hill chart would be designed for the tidal range at a particular scheme rather than using the same hill chart for all locations. No other turbine hill charts are freely available to refine these turbine selections, and the effects of optimising turbines by location is unlikely to significantly affect the overall results of the resource characterisation or the later interactions between sites.
Table 4 Dual mode turbine selections
Diameter (m)
Speed (rpm)
Minimum generating head (m)
Rated head (m)
Generator capacity (MW)
9 50 1.17 5.25 30 9 50 1.17 4.84 27 9 50 1.17 4.56 25 9 50 1.17 4.15 22 9 50 1.17 3.65 18 9 50 1.17 3.13 14 9 50 1.17 2.71 11
4.5.2 Rolls-Royce turbines
Based on information provided by Rolls-Royce, the following assumptions about turbine operation have been made:
The relationship between water level difference across the barrage/lagoon impoundment line, turbine discharge and turbine power is taken from the 9m diameter turbines tested in the SETS study (based on a table of values provided by Rolls-Royce). This is converted for 14m diameter turbines by scaling by the area of the turbine opening. Both turbine sizes use a fixed rotor tip speed of 9m/s.
Gearbox efficiency of 96% and electrical efficiency of 98% is applied to the turbine power to account for mechanical and electrical losses.
No rated capacity (maximum power output) is applied to the turbine power output, although the turbines are operated to prevent generating heads greater than 4m. The capacity of Rolls-Royce installations quoted in this report is the maximum energy generated during a standard spring neap tidal cycle.

Tidal Modelling – D01 Tidal Resource Characterisation
B&V Team Page 42 of 148
Turbines are allowed to free-wheel to help fill the basin at high water and drain the basin at low water.
Turbines must be submerged at least 1m below low water level. 4.5.3 Turbine operation
Turbine operation is defined by the conditions necessary for the turbines to open and generation to start. There are two main ways of defining the starting conditions:
1. Using a starting head – as either a uniform head difference for all tides or variable difference depending on the preceding high/low tide level. This approach was used in the recent Severn (DECC, 2009) and Mersey (Peel Energy, 2011a) tidal power studies.
2. Using a starting time delay – from high/low water or from when generation is first possible. This approach was used in the Joule (2009) study of tidal power in the eastern Irish Sea.
Turbine operation is usually optimised to give maximum energy output. Alternative operation may be considered to deliver environmental benefits such as increased tidal range in the basin, higher high water levels or lower low water levels. Energy output is much more sensitive to turbine starting conditions for dual mode than ebb-only, particularly when there are a large number of turbines. Start too soon and generation takes place at low head through the whole tide, start too late and generation of the next tide is compromised because the basin is not fully drained or filled. The detailed 0-d energy modelling results from the Joule study show how starting time was varied to find the optimum delay. There is considerable reduction in energy output for the non-optimum time delays tested. In the 2-d modelling undertaken by Joule a uniform time delay (2 hours for ebb-only and 1 hour for dual mode) was applied to all the schemes tested. This appears to offer at least part of the explanation for the significantly lower energy outputs predicted by their 2-d model in comparison to their 0-d modelling for dual mode schemes with large numbers of turbines. On average for the schemes tested, Joule’s 2-d model gives 30% lower energy output than their 0-d model (further comparison is given in Section 5.23). It appears that on average approximately half of this energy loss (a 15% loss) may be attributed to the fixed turbine starting delay imposed on the 2-d model. Using a fixed start delay has only a small (3%) effect on the schemes with turbine numbers taken from earlier studies (‘1xDoEn’). For the schemes tested with much larger numbers of turbines (‘3xDoEn’), the reduction in energy caused by using a fixed start delay is much greater and is over 50% in some cases. As an example, the Joule 0-d model results for Morecambe Bay are shown in Figure 10. This illustrates that the start delay used in the 2-d model is close to the optimum from the 0-d model for the ‘1xDoEn’ scenarios. When turbine numbers are increased to ‘3xDoEn’ the optimum delay is significantly longer, with the energy reduction by using a delay of 1 hour greatest for dual mode.

Tidal Modelling – D01 Tidal Resource Characterisation
B&V Team Page 43 of 148
a) ebb-only generation b) dual (ebb-flood) generation
Figure 10 Sensitivity of energy output to turbine start delay for Morecambe Bay in Joule study 4.5.4 Selection of installed capacity
4.5.4.1 Ebb-only selection
For ebb-only operation by conventional turbines, the installed turbine and sluice capacity from the most recent previous study of the estuary has been adopted for scenario development in deliverable D03. Although the Joule (2009) study of the Eastern Irish Sea gives results for The Wash and Humber estuaries, these selections were taken from earlier studies without refinement as they were not the primary focus of the study. As such the selections from Baker (1991) were adopted for The Wash and Humber. The 0-d model described in Section 4.5.4.2 has been used to provide an estimate of annual energy output for each selected ebb-only scheme so that it is directly comparable with the energy estimate for the dual mode selection. The effect on tidal range within the basin has also been assessed using the 0-d model. 4.5.4.2 Dual mode selection
The installed capacity to be used in scenario development (deliverable D03) for dual mode schemes for both conventional and Rolls-Royce turbines has been determined by comparing options using a flat estuary 0-d model. This model uses:
A tidal profile for three identical spring-neap cycles based on the M2 and S2 tidal constituents. Although using only two constituents is a simplification, the results show that the energy output per tide is almost linearly proportional to tidal range so the effect of including more constituents is likely to average out overall. The tidal constituents have been taken from those used in previous studies where available and otherwise from Admiralty tide tables. Based on the UKAEA study (Binnie & Partners, 1980), the M2 and S2 constituents for the Wash were reduced by 5% and the Solway Firth by 3% and 2% respectively to account for the effect of the scheme. No other adjustments were made.
A scaling factor (equivalent to 8.295) to calculate the annual energy output (for 365 days) from that simulated over three spring-neap cycles (44 days).
An elevation-area table for the impounded area, where possible taken from previous studies. This provides a fair basis for comparison of results with previous studies. If no details of the elevation-area relationship were available, it has been either assumed to be of uniform area or, where there are considerable intertidal areas, estimated from Admiralty charts. The source of

Tidal Modelling – D01 Tidal Resource Characterisation
B&V Team Page 44 of 148
bathymetric data is listed in Table 5. The LiDAR data from the Joule study for the Mersey, Dee and Dee-Wirral is the most detailed data, given at one metre intervals. The data from Admiralty chart contours is relatively coarse, whilst the uniform area assumption ignores any intertidal areas. These simplifications are reasonable for providing the indicative energy estimates calculated in this deliverable. The CSM will use much more detailed bathymetric data, as described in deliverable D02.
Impoundment length and typical bed level. Number and type of turbines. Operating logic for starting power generation using head difference across the turbines and
time since high or low water outside the impoundment. The tidal constituents and elevation-area tables are listed in Appendix A.
Table 5 Source of bathymetric data Locations Bathymetric data based on: Source Solway Firth Morecambe Bay Thames
The Wash Humber
Admiralty chart contours B&P (1980)
Bridgwater Bay Admiralty chart contours DECC (2009) Duddon Wigtown Bay
Kirkcudbright Bay Oxwich Bay
Admiralty chart contours This study
Mersey Dee
Dee-Wirral LiDAR Joule (2009)
Severn Outer Severn Cardiff-Weston Uniform area assumed DECC (2008) Cumbria West Aberthaw Rhoose
Morte Bay Rye Bay Dymchurch
Uniform area assumed This study
As this approach does not make any adjustment for the effect on water levels outside the barrage/lagoon (except for the Wash and Solway Firth), it may overestimate energy output and tidal range achieved within the impoundment to some extent. The CSM will establish these effects. The 0-d model has been used to define the installed capacity in two stages:
1. Testing to find the minimum number of turbines required to achieve 80% of natural tidal range within the impoundment. In this scenario, turbines are opened for power generation as soon as possible on each tide to maximise the flow entering and leaving the impoundment. For conventional turbines, the largest turbine generator capacity (30MW) is used to minimise the limit on flow through the turbines.
2. Optimising the turbine starting heads to maximise energy output whilst maintaining at least 80% of natural tidal range. The number of turbines has been increased until the energy output increase for each additional turbine decreases or the physical limit on turbine numbers in the embankment width is reached (see Section 4.5.4.3).
For Rolls-Royce turbines, 14m diameter turbines have been used irrespective of dredging requirements, except for the Severn (where the schemes previously studied in SETS have been adopted) and the Thames (where shallow depths in some parts of the alignment could cause large headlosses with 14m diameter turbines, see Section 4.5.4.3). This is based on the principle it is cheaper to have a relatively small number of large turbines compared to the equivalent capacity with smaller turbines. An alternative in some locations would be to have fewer 14m diameter turbines and additional 9m diameter turbines to reduce the amount of dredging required. The equivalent number can easily be calculated from the ratio of swept areas (approximately 24no. 9m diameter turbines are

Tidal Modelling – D01 Tidal Resource Characterisation
B&V Team Page 45 of 148
required for every 10no. 14m diameter turbines). There would be little practical difference in the way either scenario is represented in the CSM so the 14m diameter turbines have been used for simplicity. Figure 11 shows a typical example (taken from results for the Solway Firth) of how energy output increases with greater numbers of (a) conventional turbines and (b) Rolls-Royce turbines. This shows the logic for how the installed capacity has been selected for dual generation schemes. In all the results plotted, at least 80% of the natural tidal range is achieved inside the basin. The blue points and lines are results from the 0-d model, the red square is the selected scheme and the dashed black line is the energy output per turbine extrapolated upwards from the minimum number of turbines. This example shows that:
With conventional turbines, the energy output per turbine is greater than with the minimum number of turbines until the number of turbines has more than doubled (from 520 to 1200). The selected scheme has 1100 turbines and was chosen to be where the results cross the extrapolated energy per turbine line.
With Rolls-Royce turbines, increasing the number of turbines by 20% (from 750 to 900) only increases the energy output by 16%. After this there is almost no further rise in total energy output with more turbines. Whilst a modest increase in turbine numbers (say to 800) may give slightly more energy per turbine, the energy increase is much smaller than the equivalent rise for conventional turbines.
The reason for the different response is that with greater numbers of conventional turbines, power generation can be delayed later in the tide. This means generation takes place with greater operating heads and hence the overall energy output increases. With Rolls-Royce turbines, the maximum operating head and turbine starting heads are constrained so there is less benefit in having greater turbine capacity.
a) Conventional turbines b) Rolls-Royce turbines
Figure 11 Example of effect of increasing turbine capacity on energy output
With conventional turbines, the energy output is often sensitive to the turbine starting heads used. As mentioned in Section 4.5.3, small changes to starting heads can cause quite large changes to energy output. There is, therefore, a risk that the turbine starting heads selected using the 0-d model will not be optimal when implemented in the CSM.
0
5
10
15
20
25
30
35
400 600 800 1000 1200
Annual energy output (TWh/yr)
Number of turbines
0
5
10
15
20
25
30
35
400 600 800 1000 1200
Annual energy output (TWh/yr)
Number of turbines

Tidal Modelling – D01 Tidal Resource Characterisation
B&V Team Page 46 of 148
4.5.4.3 Maximum number of turbines
The maximum number of turbines that can be installed in a barrage or lagoon is determined by the length and depth of the impoundment. Dredging can potentially be used to ensure that turbines are adequately submerged, except if the bed material is hard rock. The bed levels immediately upstream and downstream of the impoundment line can also be important for determining the energy output. Previous studies have noted excessive headlosses downstream of the turbines if they discharge into shallow water (DECC, 2010c) with consequent large reductions in energy output. Based on this, to prevent large headlosses arising in the CSM testing, a minimum water depth requirement along the impoundment line for turbine placement has been defined as follows:
A water depth of at least 10m is necessary for conventional turbines; This is equivalent to a maximum velocity of 3.5m/s immediately downstream of the turbines; With the lower maximum turbine discharges and different turbine caisson widths for Rolls-
Royce turbines, this equates to approximately: o 7.5m minimum depth for 14m diameter Rolls-Royce turbines; and o 5m minimum depth for 9m diameter Rolls-Royce turbines.
Admiralty charts were used to estimate approximate widths at different depths along the selected alignments. The maximum number of turbines that can be installed was then calculated, assuming that each turbine caisson is:
20m wide for 9m diameter conventional bulb turbines; 10m wide for 9m diameter Rolls-Royce turbines; and 15m wide for 14m diameter Rolls-Royce turbines.
Note that this calculation makes no allowance for ship locks in the impoundment line. In previous studies some alignments, such as the Dee estuary and Humber Outer, were kinked to maximise access to deep water for turbine installation. Only simple, virtually linear barrage alignments have been considered in this study. We consider that significant additional headlosses could occur if these kinked alignments were adopted given the relatively high numbers of turbines (and the consequent peak discharges) required for dual generation.

Tidal Modelling – D01 Tidal Resource Characterisation
B&V Team Page 47 of 148
5 TIDAL RANGE RESULTS
5.1 General
The following sections provide results for each of the barrage and lagoon locations, as outlined in Section 4.3.5. For each location there is a:
Table giving details of the alignments previously considered (where applicable). Map showing the location of the alignments. Table showing the available depth and maximum number of turbines that can be installed in
the selected alignment (for barrages only), as calculated using the method described in Section 4.5.4.3.
Table summarising the results from previous energy modelling studies. The selected scheme is shown in bold font. Note that the annual energy outputs reported have not necessarily been calculated using the same allowances for generator efficiency and machine outages.
Table showing the comparable results obtained with the 0-d model used for this study, which utilises the assumptions from Section 4.5.1 and assumes no reduction in energy output due to outages. Reasons for differences in the predicted energy output from previous studies are discussed in Section 5.22.
Table containing results from additional 0-d modelling for dual mode with conventional turbines (with selected scheme shown in bold font).
Table containing results from additional 0-d modelling for dual mode with Rolls-Royce turbines (with selected scheme shown in bold font).
Table summarising the schemes recommended for testing in the CSM. 5.2 Solway Firth
The most recent study of tidal power in the Solway Firth was a Feasibility Study by Halcrow, Mott MacDonald and RSK (2009). This identified four possible barrage locations and two lagoons, listed in Table 6 and shown in Figure 12. Previous studies by Binnie & Partners (1980) and Joule (2009) only looked at the largest scheme (barrage B1). Unfortunately bed levels in the inner Solway Firth are not shown on Admiralty charts. It was noted in the 2009 Feasibility Study, however, that the shallow water depths in the inner Solway Firth make it difficult in install turbines to sufficient depth for any of the schemes except B1. Dredging would be necessary to lower bed levels at the turbine caissons. However, if schemes at alignments B2, B3, B4, L1 or L2 were tested in the CSM with the existing estuary bathymetry, the additional head loss downstream of the turbines caused by shallow water depths would result in a large reduction from the energy outputs predicted by 0-d modelling. It is likely that over time, the high velocities would scour the bed, removing sediment and lowering bed levels but the extent and timescale of this is far from certain. For this reason, only the Outer (B1) barrage has been considered further. Note that for the schemes selected and reported in the 2009 Feasibility Study (as listed in Table 8), the total installed turbine capacity is not equal to the number of turbines multiplied by the unit size. The reason for this discrepancy is not known. The ebb-only selection for this study (using the B1 alignment) takes the number of turbines and unit capacity from the Feasibility Study, giving an installed capacity of 5,800MW (rather than 5,891MW).

Tidal Modelling – D01 Tidal Resource Characterisation
B&V Team Page 48 of 148
Table 6 Solway Firth alignments
Name Location Mean tidal range (m)
Basin area (km2)
Impoundment length (km)
Outer / B1 Workington to Abbey Head 5.6 814 28.4 Inner / B2 Southerness Point to Beckfoot 6.2 288 11.5 B3 Bowness to Annan 5.9 40 1.9 B4 Moricambe Bay 6.2 12 2.6 L1 Rascarrel to Southerness 5.8 94 20.5 L2 Maryport to Beckfoot 6.0 56 19.3
Figure 12 Solway Firth alignments
Table 7 Solway Firth (barrage B1) available depth for turbines
Depth below chart datum >20m >15m >10m >7.5m >5m
Width (m) 12,000 25,000 28,000 29,000 30,000 Max. no. of 9m dia. bulb turbines 600 1,250 1,400 - - (with dredging of up to) (-) (5m) (10m) Max. no. of 14m dia. RR turbines 800 1,667 1,867 1,933 - (with dredging of up to) (-) (-) (5m) (7.5m) Max. no. of 9m dia. RR turbines 1,200 2,500 2,800 2,900 3,000 (with dredging of up to) (-) (-) (-) (2.5m) (5m)

Tidal Modelling – D01 Tidal Resource Characterisation
B&V Team Page 49 of 148
Table 8 Solway Firth results of previous studies
Loc
atio
n
Mod
e
Turbines Sluices
Inst
alle
d ca
paci
ty (
MW
)
Ann
ual e
nerg
y ou
tput
(T
Wh)
Sou
rce
Cal
cula
tion
m
etho
d
No.
Dia
. (m
)
Uni
t siz
e (M
W)
No.
Siz
e
Outer / B1
E 140 9.0 40 160 12m x 12m 5,600 8.73 B&P (1980) 0-d E 180 9.0 16 200 12m x 12m 2,880 8.19 Joule (2009) 0-d E 180 9.0 31 200 12m x 12m 5,580 10.05 Wishart (1981) 0-d E 180 9.0 31 200 12m x 12m 5,580 10.05 Baker (1991) 0-d E 180 9.0 40 200 12m x 12m 7,200 10.25 B&P (1980) 0-d E 180 9.0 40 200 12m x 12m 7,200 8.44 Joule (2009) 0-d E 180 9.0 40 200 12m x 12m 7,200 9.66 Joule (2009) 2-d E 200 9.0 29 226 12m x 12m 5,891 11.50 SF (2009) 0-d D 180 9.0 16 200 12m x 12m 2,880 7.78 Joule (2009) 0-d D 180 9.0 40 200 12m x 12m 7,200 6.82 Joule (2009) 2-d D 540 9.0 16 200 12m x 12m 8,640 17.84 Joule (2009) 0-d D 540 9.0 40 0 - 21,600 9.78 Joule (2009) 2-d
B2 E 99 7.6 27 80 12m x 12m 2,703 3.80 SF (2009) 0-d B3 E 50 4.0 6 11 12m x 12m 316 0.32 SF (2009) 0-d B4 E 15 4.0 6 3 12m x 12m 113 0.12 SF (2009) 0-d L1 E 32 7.6 27 26 12m x 12m 692 0.90 SF (2009) 0-d L2 E 19 7.6 27 15 12m x 12m 435 0.60 SF (2009) 0-d
Note: E is ebb-only generation and D is dual generation SF (2009) is the Solway Firth Feasibility Study by Halcrow, Mott MacDonald and RSK
Table 9 Solway Firth result for ebb-only mode with conventional turbines (alignment B1)
No. of turbines
Unit generator capacity (MW)
No. of sluices
Size of sluices
Indicative energy output (TWh/yr)
Starting head
Min. tidal range
200 29 226 12m x 12m 12.1 Optimised 44%
Table 10 Solway Firth results for dual mode with conventional turbines (alignment B1)
No. of turbines
Unit generator capacity (MW)
Indicative energy output (TWh/yr)
Starting head
Min. tidal range
200 30 8.9 Minimum 36% 500 30 12.3 Minimum 79% 520 30 12.1 Minimum 81% 520 18 14.7 Optimised 80% 700 18 23.2 Optimised 80% 800 18 26.3 Optimised 80% 900 18 28.3 Optimised 80%
1000 18 29.6 Optimised 80% 1100 18 31.0 Optimised 83% 1200 18 32.0 Optimised 83%

Tidal Modelling – D01 Tidal Resource Characterisation
B&V Team Page 50 of 148
Table 11 Solway Firth results for dual mode with Rolls-Royce turbines (alignment B1)
No. of 9m dia. turbines
No. of 14m dia. turbines
Indicative energy output (TWh/yr)
Starting head
Min. tidal range
0 600 16.1 1m 70% 0 650 16.2 1m 74% 0 700 16.0 1m 78% 0 750 15.6 1m 82% 0 750 20.8 Optimised 80% 0 900 24.1 Optimised 85% 0 1050 24.2 Optimised 92%
Table 12 Solway Firth B1 scheme selection
Mode Turbine type
Turbines Indicative energy output
(TWh/yr)
Sluices
No. Dia. (m)
Unit capacity (MW) No. Size
Ebb Conventional 200 9.0 29 12.1 226 12m x 12m Dual Conventional 1100 9.0 18 31.0 0 - Dual Rolls-Royce 750 14.0 9 20.8 0 -
5.3 Duddon
Three potential barrage alignments were identified in the Duddon Estuary Tidal Power study (PB, 2010). These are listed in Table 13 and shown in Figure 13. The B1 barrage corresponds to that previously investigated in a Feasibility Study by Binnie & Partners (1993). An added complication for the B3 barrage is that it joins Walney Island so a secondary embankment would be necessary to prevent flow bypassing the barrage to the south. Only a short presentation was readily available describing the findings of the 2010 study so few of the scheme details have been completed in Table 15. As with the inner Solway Firth, there is a lack of deep water in the Duddon estuary. Admiralty charts show only a narrow low water channel with maximum depths of only about 2m below chart datum. Considerable dredging would be required along the barrage line to achieve adequate submergence for the turbines. Even then, the lack of deep water would compromise the energy output possible due to head losses in the shallow water downstream of the turbines. This was noted in the 1-d modelling for the 1993 Feasibility Study. As shown in Table 14, we believe there is insufficient depth for even the 9m Rolls-Royce turbines to work effectively. Unless the bathymetry is substantially artificially modified, the energy outputs from the schemes would be very low if tested in the 2-d model. Given this, and the fact that the site is only c. 100MW and will have minimal impact on the interactions between the remainder of the UK sites (apart from possibly Morecambe Bay, see Figure 7), no scheme has been selected for the Duddon estuary for scenario development in deliverable D03.

Tidal Modelling – D01 Tidal Resource Characterisation
B&V Team Page 51 of 148
Table 13 Duddon alignments
Name Location Mean tidal range (m)
Basin area (km2)
Impoundment length (km)
B1 Haverigg to Sandscale Haws 5.8 28 4.8 B2 Haverigg to Sandscale Haws 5.8 32 6.0 B3 Haverigg to Walney Island 5.8 38 6.8
Figure 13 Duddon alignments
Table 14 Duddon available depth for turbines
Depth below chart datum >20m >15m >10m >7.5m >5m
Width (m) 0 0 0 0 0 Max. no. of 9m dia. bulb turbines 0 0 0 - - (with dredging of up to) (-) (5m) (10m) Max. no. of 14m dia. RR turbines 0 0 0 0 - (with dredging of up to) (-) (-) (5m) (7.5m) Max. no. of 9m dia. RR turbines 0 0 0 0 0 (with dredging of up to) (-) (-) (-) (2.5m) (5m)

Tidal Modelling – D01 Tidal Resource Characterisation
B&V Team Page 52 of 148
Table 15 Duddon results of previous studies
Loc
atio
n
Mod
e
Turbines Sluices
Inst
alle
d ca
paci
ty (
MW
)
Ann
ual e
nerg
y ou
tput
(T
Wh)
Sou
rce
Cal
cula
tion
m
etho
d
No.
Dia
. (m
)
Uni
t siz
e (M
W)
No.
Siz
e
B1 E 10 5.5 10 4 25m wide 100 0.19 B&P (1993) 1-d B1 E * * 100 0.21 SDC (2007) B1 E * * 100 0.19 Duddon (2010) B1 D * * 100 0.15 Duddon (2010) B2 E * * 160 0.28 Duddon (2010) B2 D * * 160 0.24 Duddon (2010) B3 E * * 220 0.34 Duddon (2010) B3 D * * 220 0.33 Duddon (2010)
Note * No information obtained on turbine and sluice selection 5.4 Morecambe Bay
Two alignments have previously been considered at Morecambe Bay, as listed in Table 16 and shown in Figure 14. The Outer barrage impounds a 15% larger area with only a slightly longer embankment so has been adopted for this study.
Table 16 Morecambe Bay alignments
Name Location Mean tidal range (m)
Basin area (km2)
Impoundment length (km)
Outer Fleetwood to Walney Island 6.2 455 18.4 Inner Fleetwood to Walney Island 6.2 392 17.5
Figure 14 Morecambe Bay alignments

Tidal Modelling – D01 Tidal Resource Characterisation
B&V Team Page 53 of 148
Table 17 Morecambe Bay (Outer) available depth for turbines
Depth below chart datum
>20m >15m >10m >7.5m >5m Width (m) 2,000 2,100 2,200 7,000 8,500 Max. no. of 9m dia. bulb turbines 100 105 110 - - (with dredging of up to) (-) (5m) (10m) Max. no. of 14m dia. RR turbines 133 140 147 467 - (with dredging of up to) (-) (-) (5m) (7.5m) Max. no. of 9m dia. RR turbines 200 210 220 700 850 (with dredging of up to) (-) (-) (-) (2.5m) (5m)
Table 18 Morecambe Bay results of previous studies
Loc
atio
n
Mod
e
Turbines Sluices
Inst
alle
d ca
paci
ty (
MW
)
Ann
ual e
nerg
y ou
tput
(T
Wh)
Sou
rce
Cal
cula
tion
m
etho
d
No.
Dia
. (m
)
Uni
t siz
e (M
W)
No.
Siz
e
Outer E 80 9.0 50 100 12m x 12m 4,000 5.66 B&P (1980) 0-d Outer E 80 9.0 50 140 12m x 12m 4,000 5.98 Joule (2009) 2-d Outer E 120 9.0 16 140 12m x 12m 1,920 5.51 Joule (2009) 0-d Outer E 120 9.0 50 140 12m x 12m 6,000 6.96 B&P (1980) 0-d Outer E 120 9.0 50 140 12m x 12m 6,000 5.83 Joule (2009) 0-d Outer D 80 9.0 50 140 12m x 12m 4,000 3.99 Joule (2009) 2-d Outer D 120 9.0 16 140 12m x 12m 1,920 5.75 Joule (2009) 0-d Outer D 240 9.0 50 0 - 12,000 7.02 Joule (2009) 2-d Outer D 360 9.0 16 140 12m x 12m 5,760 11.45 Joule (2009) 0-d Inner E 40 9.0 50 60 12m x 12m 2,000 3.47 B&P (1980) 0-d Inner E 60 9.0 50 80 12m x 12m 3,000 4.63 B&P (1980) 0-d Inner E 80 9.0 38 100 12m x 12m 3,040 5.40 Wishart (1981) 0-d Inner E 80 9.0 38 100 12m x 12m 3,040 5.40 Baker (1991) 0-d Inner E 80 9.0 50 100 12m x 12m 4,000 5.50 B&P (1980) 0-d Inner E 120 9.0 50 140 12m x 12m 6,000 6.50 B&P (1980) 0-d
Table 19 Morecambe Bay result for ebb-only mode with conventional turbines (Outer alignment)
No. of turbines
Unit generator capacity (MW)
No. of sluices
Size of sluices
Indicative energy output (TWh/yr)
Starting head
Min. tidal range
120 16 140 12m x 12m 6.2 Optimised 39%
Table 20 Morecambe Bay results for dual mode with conventional turbines (Outer alignment)
No. of turbines
Unit generator capacity (MW)
Indicative energy output (TWh/yr)
Starting head
Min. tidal range
120 30 5.8 Minimum 52%

Tidal Modelling – D01 Tidal Resource Characterisation
B&V Team Page 54 of 148
No. of turbines
Unit generator capacity (MW)
Indicative energy output (TWh/yr)
Starting head
Min. tidal range
200 30 6.3 Minimum 77% 220 30 6.0 Minimum 82% 220 18 8.1 Optimised 80% 360 18 14.1 Optimised 82%
Table 21 Morecambe Bay results for dual mode with Rolls-Royce turbines (Outer alignment)
No. of 9m dia. turbines
No. of 14m dia. turbines
Indicative energy output (TWh/yr)
Starting head
Min. tidal range
0 140 5.8 1m 40% 0 200 7.4 1m 58% 0 250 7.9 1m 69% 0 300 7.8 1m 79% 0 320 7.3 1m 83% 0 320 10.5 Optimised 80%
Table 22 Morecambe Bay scheme selection
Mode Turbine type
Turbines Indicative energy output
(TWh/yr)
Sluices
No. Dia. (m)
Unit capacity (MW) No. Size
Ebb Conventional 120 9.0 16 6.2 140 12m x 12m Dual Conventional - - - - - - Dual Rolls-Royce 320 14.0 11 10.5 0 -
The ebb-only turbine selection of 16MW generator capacity is based on the Joule (2009) study. Joule showed only a 5% energy reduction compared to using 50MW capacity turbines so the selection appears to have merit. In comparison with turbines selected for other ebb-only schemes with similar tidal range, 16MW appears low (and 50MW high). An alternative would be to use the 38MW capacity turbines used by Wishart (1981) for the Inner barrage. The selection does not appear to be critical for the energy output so the results from the more recent study have been used. No selection was made for conventional turbines with dual mode operation as there is insufficient deep water for the 220 turbines required to achieve 80% of natural tidal range. 5.5 Mersey
The recent Mersey Tidal Power Feasibility Study (Peel Energy, 2011a) considered three bands of possible locations, rather than specific barrage alignments. Figure 15 shows possible alignments within each of these bands. The outer and middle locations broadly correspond to those identified in Haws (1986) as Line 1 and Line 3. The recommended location for a barrage in the 2011 Feasibility Study was at Band A. Navigation and planning constraints were considered to make a barrage at Band C unfeasible since it is at the mouth of the estuary and all commercial shipping must pass this location. There are several reasons why a barrage at Band B is less attractive than at Band A including that: the estuary is wider requiring a longer embankment; the impounded volume is reduced by about 40%, considerably reducing the potential energy output; the estuary bed level is much shallower which means that considerable dredging is required for turbine installation; and the mobile

Tidal Modelling – D01 Tidal Resource Characterisation
B&V Team Page 55 of 148
bed materials increase the construction and operational risks. The Band A alignment has been adopted for this study.
Table 23 Mersey alignments
Name Location Mean tidal range (m)
Basin area (km2)
Impoundment length (km)
Band C / Line 1 Wallasea to Bootle 6.5 70 1.8 Band A / Line 3 Bromborough to Dingle 6.5 56 1.8 Band B Eastham to Garston 6.5 37 4.1
Figure 15 Mersey alignments
Table 24 Mersey available depth for turbines (Band A)
Depth below chart datum >20m >15m >10m >7.5m >5m
Width (m) 0 0 300 1000 1050 Max. no. of 9m dia. bulb turbines 0 0 15 - - (with dredging of up to) (-) (5m) (10m) Max. no. of 14m dia. RR turbines 0 0 20 67 - (with dredging of up to) (-) (-) (5m) (7.5m) Max. no. of 9m dia. RR turbines 0 0 30 100 105 (with dredging of up to) (-) (-) (-) (2.5m) (5m)

Tidal Modelling – D01 Tidal Resource Characterisation
B&V Team Page 56 of 148
Table 25 Mersey results of previous studies
Loc
atio
n
Mod
e
Turbines Sluices
Inst
alle
d ca
paci
ty (
MW
)
Ann
ual e
nerg
y ou
tput
(T
Wh)
Sou
rce
Cal
cula
tion
m
etho
d
No.
Dia
. (m
)
Uni
t siz
e (M
W)
No.
Siz
e
C E 27 7.6 23 620 1.32 B&P (1984) C E 27 7.6 23 18 12m x 12m 621 1.20 Haws (1986) C E 27 7.6 23 620 1.32 Baker (1991) C E 700 1.45 SDC (2007) A E 21 7.6 23 15 12m x 12m 483 0.97 Haws (1986) A E 27 7.6 23 18 12m x 12m 621 1.07 Joule (2009) 0-d A E 27 7.6 24 18 12m x 12m 648 0.57 Joule (2009) 2-d A E 28 8.0 25 18 12m x 12m 700 1.05 Peel (2011b) 0-d A D 27 7.6 23 18 12m x 12m 621 0.98 Joule (2009) 0-d A D 27 7.6 23 18 12m x 12m 621 0.74 Joule (2009) 2-d A D 28 8.0 25 18 12m x 12m 700 0.80 Peel (2011b) 0-d A D 56 7.6 24 0 - 1,344 0.72 Joule (2009) 2-d A D 81 7.6 23 0 - 1,863 1.72 Joule (2009) 0-d
Table 26 Mersey result for ebb-only mode with conventional turbines (alignment A)
No. of turbines
Unit generator capacity (MW)
No. of sluices
Size of sluices
Indicative energy output (TWh/yr)
Starting head
Min. tidal range
28 25 18 12m x 12m 1.3 Optimised 68%
Table 27 Mersey results for dual mode with conventional turbines (alignment A)
No. of turbines
Unit generator capacity (MW)
Indicative energy output (TWh/yr)
Starting head
Min. tidal range
20 30 0.9 Minimum 67% 25 30 0.8 Minimum 80% 25 18 0.9 Optimised 80% 28 18 1.2 Optimised 80%
Table 28 Mersey results for dual mode with Rolls-Royce turbines (alignment A)
No. of 9m dia. turbines
No. of 14m dia. turbines
Indicative energy output (TWh/yr)
Starting head
Min. tidal range
0 20 0.9 1m 44% 0 25 1.0 1m 57% 0 30 1.1 1m 67% 0 35 0.9 1m 75% 0 40 0.9 1m 86% 0 40 1.4 Optimised 80%
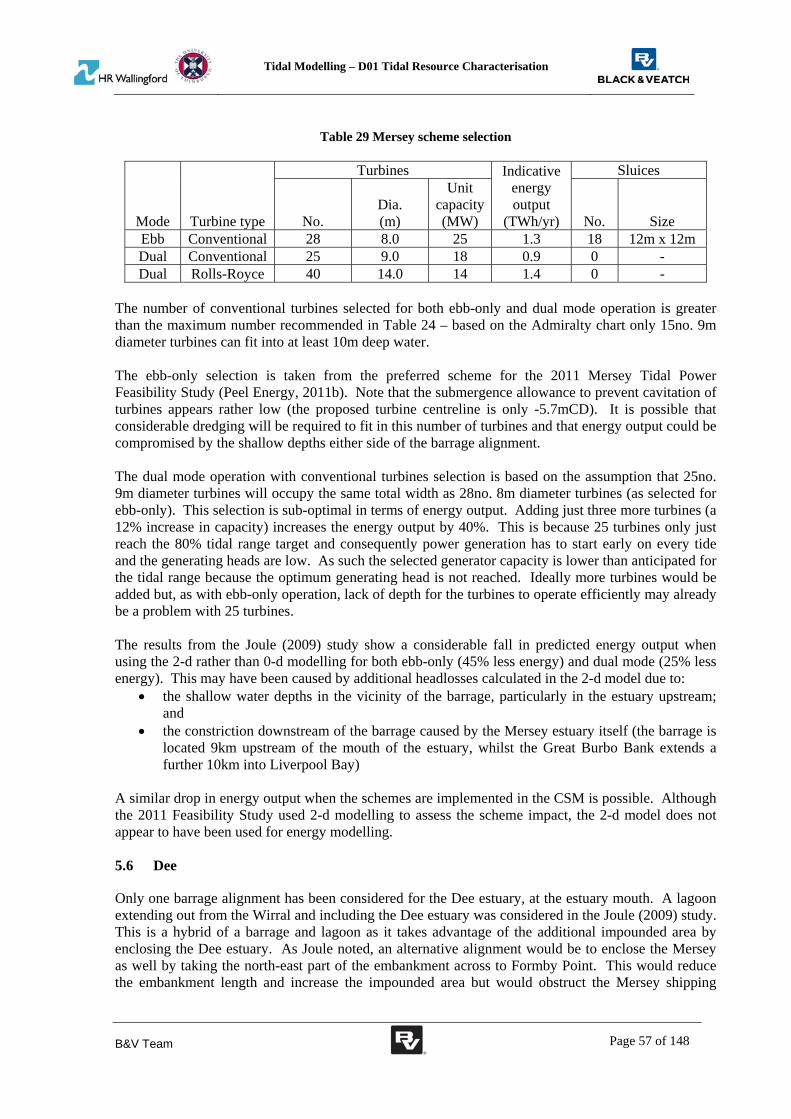
Tidal Modelling – D01 Tidal Resource Characterisation
B&V Team Page 57 of 148
Table 29 Mersey scheme selection
Mode Turbine type
Turbines Indicative energy output
(TWh/yr)
Sluices
No. Dia. (m)
Unit capacity (MW) No. Size
Ebb Conventional 28 8.0 25 1.3 18 12m x 12m Dual Conventional 25 9.0 18 0.9 0 - Dual Rolls-Royce 40 14.0 14 1.4 0 -
The number of conventional turbines selected for both ebb-only and dual mode operation is greater than the maximum number recommended in Table 24 – based on the Admiralty chart only 15no. 9m diameter turbines can fit into at least 10m deep water. The ebb-only selection is taken from the preferred scheme for the 2011 Mersey Tidal Power Feasibility Study (Peel Energy, 2011b). Note that the submergence allowance to prevent cavitation of turbines appears rather low (the proposed turbine centreline is only -5.7mCD). It is possible that considerable dredging will be required to fit in this number of turbines and that energy output could be compromised by the shallow depths either side of the barrage alignment. The dual mode operation with conventional turbines selection is based on the assumption that 25no. 9m diameter turbines will occupy the same total width as 28no. 8m diameter turbines (as selected for ebb-only). This selection is sub-optimal in terms of energy output. Adding just three more turbines (a 12% increase in capacity) increases the energy output by 40%. This is because 25 turbines only just reach the 80% tidal range target and consequently power generation has to start early on every tide and the generating heads are low. As such the selected generator capacity is lower than anticipated for the tidal range because the optimum generating head is not reached. Ideally more turbines would be added but, as with ebb-only operation, lack of depth for the turbines to operate efficiently may already be a problem with 25 turbines. The results from the Joule (2009) study show a considerable fall in predicted energy output when using the 2-d rather than 0-d modelling for both ebb-only (45% less energy) and dual mode (25% less energy). This may have been caused by additional headlosses calculated in the 2-d model due to:
the shallow water depths in the vicinity of the barrage, particularly in the estuary upstream; and
the constriction downstream of the barrage caused by the Mersey estuary itself (the barrage is located 9km upstream of the mouth of the estuary, whilst the Great Burbo Bank extends a further 10km into Liverpool Bay)
A similar drop in energy output when the schemes are implemented in the CSM is possible. Although the 2011 Feasibility Study used 2-d modelling to assess the scheme impact, the 2-d model does not appear to have been used for energy modelling. 5.6 Dee
Only one barrage alignment has been considered for the Dee estuary, at the estuary mouth. A lagoon extending out from the Wirral and including the Dee estuary was considered in the Joule (2009) study. This is a hybrid of a barrage and lagoon as it takes advantage of the additional impounded area by enclosing the Dee estuary. As Joule noted, an alternative alignment would be to enclose the Mersey as well by taking the north-east part of the embankment across to Formby Point. This would reduce the embankment length and increase the impounded area but would obstruct the Mersey shipping

Tidal Modelling – D01 Tidal Resource Characterisation
B&V Team Page 58 of 148
channel so has been discounted from this study. The two adopted alignments are listed in Table 30 and shown in Figure 16.
Table 30 Dee alignment
Name Location Mean tidal range (m)
Basin area (km2)
Impoundment length (km)
Estuary (B1) Hoylake to Point of Ayr 5.9 103 8.3 Dee-Wirral lagoon (L1) Wallasey to Point of Ayr 5.9 268 37.0
Figure 16 Dee alignments
Table 31 Dee estuary available depth for turbines
Depth below chart datum >20m >15m >10m >7.5m >5m
Width (m) 0 0 1,300 1,550 1,800 Max. no. of 9m dia. bulb turbines 0 0 65 - - (with dredging of up to) (-) (5m) (10m) Max. no. of 14m dia. RR turbines 0 0 87 103 - (with dredging of up to) (-) (-) (5m) (7.5m) Max. no. of 9m dia. RR turbines 0 0 130 155 180 (with dredging of up to) (-) (-) (-) (2.5m) (5m)
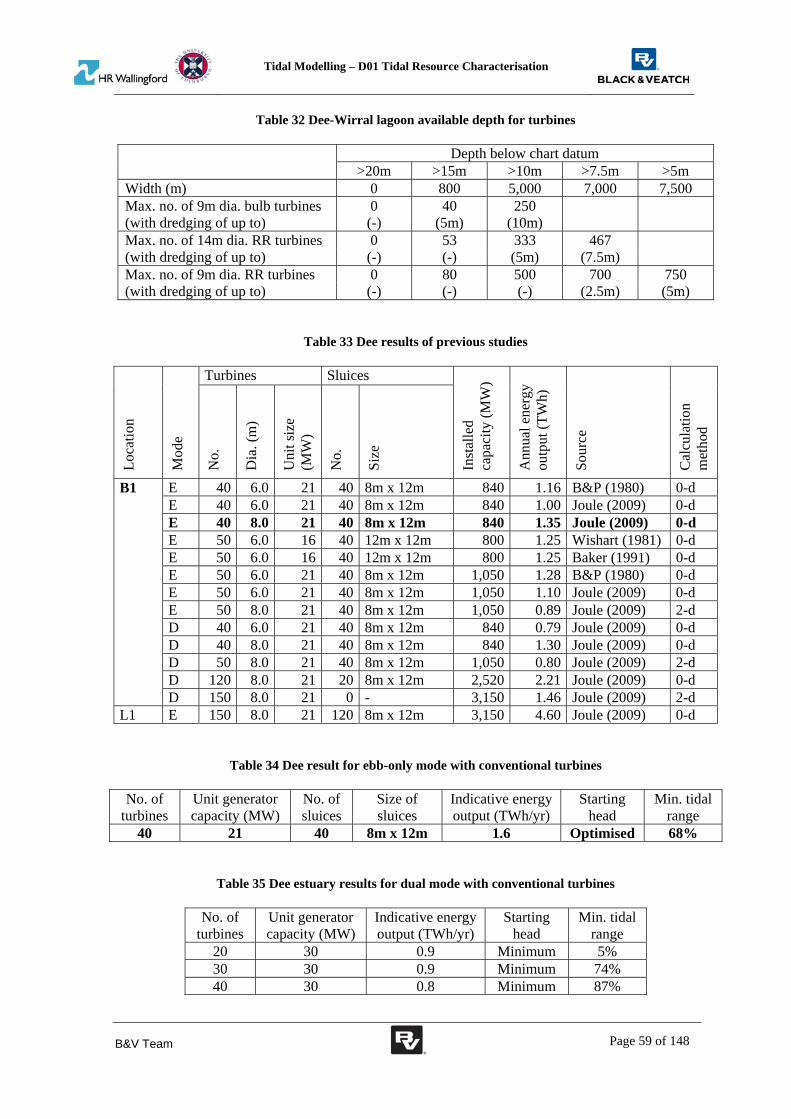
Tidal Modelling – D01 Tidal Resource Characterisation
B&V Team Page 59 of 148
Table 32 Dee-Wirral lagoon available depth for turbines
Depth below chart datum >20m >15m >10m >7.5m >5m
Width (m) 0 800 5,000 7,000 7,500 Max. no. of 9m dia. bulb turbines 0 40 250 (with dredging of up to) (-) (5m) (10m) Max. no. of 14m dia. RR turbines 0 53 333 467 (with dredging of up to) (-) (-) (5m) (7.5m) Max. no. of 9m dia. RR turbines 0 80 500 700 750 (with dredging of up to) (-) (-) (-) (2.5m) (5m)
Table 33 Dee results of previous studies
Loc
atio
n
Mod
e
Turbines Sluices
Inst
alle
d ca
paci
ty (
MW
)
Ann
ual e
nerg
y ou
tput
(T
Wh)
Sou
rce
Cal
cula
tion
m
etho
d
No.
Dia
. (m
)
Uni
t siz
e (M
W)
No.
Siz
e
B1 E 40 6.0 21 40 8m x 12m 840 1.16 B&P (1980) 0-d E 40 6.0 21 40 8m x 12m 840 1.00 Joule (2009) 0-d E 40 8.0 21 40 8m x 12m 840 1.35 Joule (2009) 0-d E 50 6.0 16 40 12m x 12m 800 1.25 Wishart (1981) 0-d E 50 6.0 16 40 12m x 12m 800 1.25 Baker (1991) 0-d E 50 6.0 21 40 8m x 12m 1,050 1.28 B&P (1980) 0-d E 50 6.0 21 40 8m x 12m 1,050 1.10 Joule (2009) 0-d E 50 8.0 21 40 8m x 12m 1,050 0.89 Joule (2009) 2-d D 40 6.0 21 40 8m x 12m 840 0.79 Joule (2009) 0-d D 40 8.0 21 40 8m x 12m 840 1.30 Joule (2009) 0-d D 50 8.0 21 40 8m x 12m 1,050 0.80 Joule (2009) 2-d D 120 8.0 21 20 8m x 12m 2,520 2.21 Joule (2009) 0-d D 150 8.0 21 0 - 3,150 1.46 Joule (2009) 2-d
L1 E 150 8.0 21 120 8m x 12m 3,150 4.60 Joule (2009) 0-d
Table 34 Dee result for ebb-only mode with conventional turbines
No. of turbines
Unit generator capacity (MW)
No. of sluices
Size of sluices
Indicative energy output (TWh/yr)
Starting head
Min. tidal range
40 21 40 8m x 12m 1.6 Optimised 68%
Table 35 Dee estuary results for dual mode with conventional turbines
No. of turbines
Unit generator capacity (MW)
Indicative energy output (TWh/yr)
Starting head
Min. tidal range
20 30 0.9 Minimum 5% 30 30 0.9 Minimum 74% 40 30 0.8 Minimum 87%

Tidal Modelling – D01 Tidal Resource Characterisation
B&V Team Page 60 of 148
No. of turbines
Unit generator capacity (MW)
Indicative energy output (TWh/yr)
Starting head
Min. tidal range
40 18 1.5 Optimised 80% 50 18 1.9 Optimised 80% 60 18 2.2 Optimised 80% 65 18 2.3 Optimised 80%
Table 36 Dee estuary results for dual mode with Rolls-Royce turbines
No. of 9m dia. turbines
No. of 14m dia. turbines
Indicative energy output (TWh/yr)
Starting head
Min. tidal range
0 40 1.2 Min 69% 0 45 1.1 Min 72% 0 50 1.1 Min 77% 0 55 1.0 Min 92% 0 55 1.7 Optimised 81%
Table 37 Dee estuary scheme selection
Mode Turbine type
Turbines Indicative energy output
(TWh/yr)
Sluices
No. Dia. (m)
Unit capacity (MW) No. Size
Ebb Conventional 40 8.0 21 1.6 40 8m x 12m Dual Conventional 60 9.0 18 2.2 0 - Dual Rolls-Royce 55 14.0 13 1.7 0 -
Whilst there are sections of the barrage alignment itself that are deep enough for conventional turbines to be installed, sea bed levels then become much shallower both upstream and downstream of the barrage. This is likely to lead to high velocities and possible headlosses which could compromise the energy output when the schemes are tested in the CSM. It is not possible to directly compare the 0-d and 2-d modelling energy outputs from Joule (2009) as slightly different scenarios were tested in the models but there does appears to be a noticeable drop in energy output for the 2-d model.
Table 38 Dee-Wirral lagoon results for dual mode with conventional turbines
No. of turbines
Unit generator capacity (MW)
Indicative energy output (TWh/yr)
Starting head
Min. tidal range
150 30 3.9 Minimum 82% 150 18 5.3 Optimised 80% 200 18 7.8 Optimised 80% 250 18 9.0 Optimised 80%
Table 39 Dee-Wirral lagoon results for dual mode with Rolls-Royce turbines
No. of 9m dia. turbines
No. of 14m dia. turbines
Indicative energy output (TWh/yr)
Starting head
Min. tidal range
0 180 5.2 1m 72%

Tidal Modelling – D01 Tidal Resource Characterisation
B&V Team Page 61 of 148
No. of 9m dia. turbines
No. of 14m dia. turbines
Indicative energy output (TWh/yr)
Starting head
Min. tidal range
0 200 5.1 1m 78% 0 220 4.9 1m 83% 0 220 6.9 Optimised 80%
Table 40 Dee-Wirral lagoon scheme selection
Mode Turbine type
Turbines Indicative energy output
(TWh/yr)
Sluices
No. Dia. (m)
Unit capacity (MW) No. Size
Ebb Conventional - - - - - - Dual Conventional 250 9.0 18 9.0 0 - Dual Rolls-Royce 220 14.0 11 6.9 0 -
The results in Table 33 and Table 38 indicate that with 150 turbines the energy output for the Dee-Wirral lagoon is greater with dual operation than for ebb-only. Based on this and since dual operation is able to achieve a tidal range of at least 80% of the natural range, an ebb-only selection has not been made. 5.7 Severn
The Severn estuary has the largest tidal range in the UK. Barrage alignments have in the past been chosen to minimise impoundment length as this is the primary driver of the capital cost (which has generally been perceived as ‘too high’ from a financing point of view, even for these alignments). This results in a constraint on the number of turbines that can be installed in deep water. The locations of tidal barrages and lagoons studied in the Severn Tidal Power study (DECC, 2010b) are listed in Table 41 and are shown in Figure 23. Results from previous studies are listed in Table 45. Two energy estimates are given in some cases for the Severn Tidal Power study. This is because two separate 2-d models were used to represent the schemes and they gave different energy outputs. This highlights the uncertainty in the energy output from any tidal power scheme. All the energy estimates listed in Table 45 from DECC (2010c) are the output from the 1-d and 2-d energy modelling and do not include a reduction for outages. The final energy outputs for the two selected schemes, as given in the Severn Tidal Power Feasibility Study Conclusions and Summary Report (DECC, 2010b), are 15.6TWh/yr for B3 ebb-only and 6.2TWh/yr for L3 dual mode. The reason for the differences is that the final energy output takes the average of the two 2-d models and includes allowances for:
Using a modern turbine design; 5% outages; The following measures to prevent and reduce adverse environmental effects:
o sluicing on ebb tide; o use of pumping; o optimal management of turbines to increase efficiency; and o altering sluice arrangements to increase permeability.
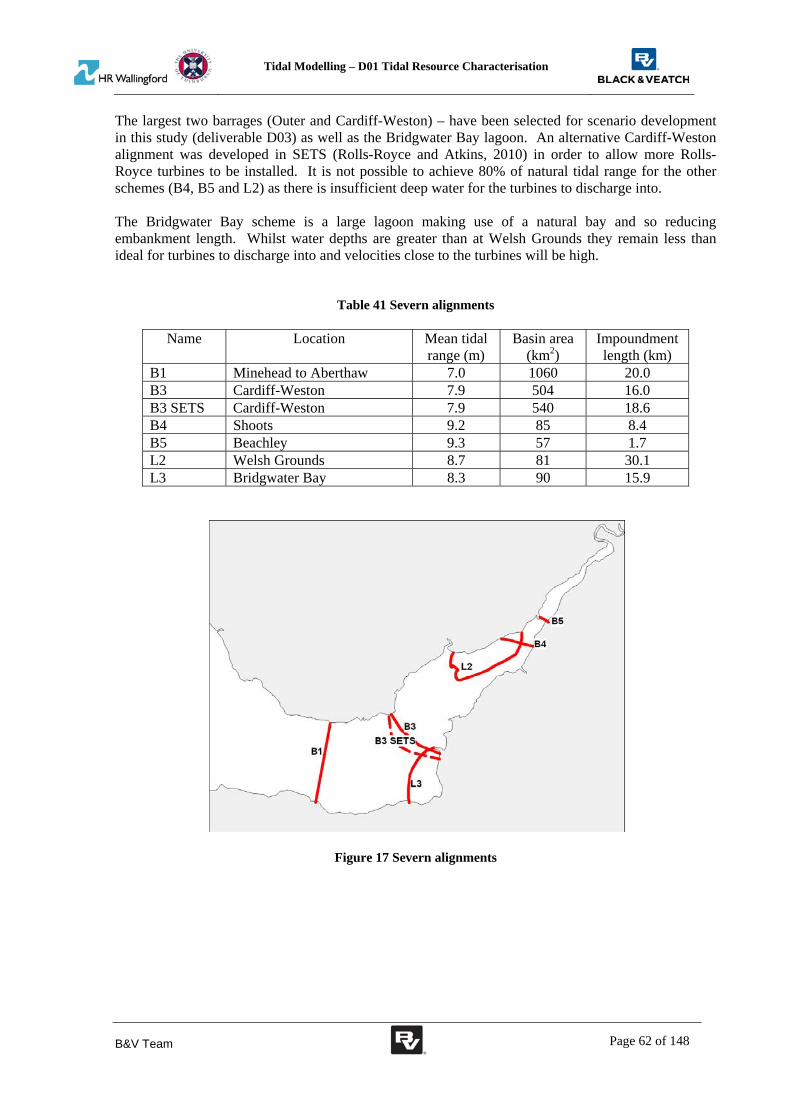
Tidal Modelling – D01 Tidal Resource Characterisation
B&V Team Page 62 of 148
The largest two barrages (Outer and Cardiff-Weston) – have been selected for scenario development in this study (deliverable D03) as well as the Bridgwater Bay lagoon. An alternative Cardiff-Weston alignment was developed in SETS (Rolls-Royce and Atkins, 2010) in order to allow more Rolls-Royce turbines to be installed. It is not possible to achieve 80% of natural tidal range for the other schemes (B4, B5 and L2) as there is insufficient deep water for the turbines to discharge into. The Bridgwater Bay scheme is a large lagoon making use of a natural bay and so reducing embankment length. Whilst water depths are greater than at Welsh Grounds they remain less than ideal for turbines to discharge into and velocities close to the turbines will be high.
Table 41 Severn alignments
Name Location Mean tidal range (m)
Basin area (km2)
Impoundment length (km)
B1 Minehead to Aberthaw 7.0 1060 20.0 B3 Cardiff-Weston 7.9 504 16.0 B3 SETS Cardiff-Weston 7.9 540 18.6 B4 Shoots 9.2 85 8.4 B5 Beachley 9.3 57 1.7 L2 Welsh Grounds 8.7 81 30.1 L3 Bridgwater Bay 8.3 90 15.9
Figure 17 Severn alignments

Tidal Modelling – D01 Tidal Resource Characterisation
B&V Team Page 63 of 148
Table 42 Severn Outer available depth for turbines
Depth below chart datum >20m >15m >10m >7.5m >5m
Width (m) 8,000 12,000 17,500 17,800 18,100 Max. no. of 9m dia. bulb turbines 400 600 875 - - (with dredging of up to) (-) (5m) (10m) Max. no. of 14m dia. RR turbines 533 800 1,167 1,187 - (with dredging of up to) (-) (-) (5m) (7.5m) Max. no. of 9m dia. RR turbines 800 1,200 1,750 1,780 1,810 (with dredging of up to) (-) (-) (-) (2.5m) (5m)
Table 43 Severn Cardiff-Weston available depth for turbines
Depth below chart datum >20m >15m >10m >7.5m >5m
Width (m) 800 4,200 6,500 9,750 13,000 Max. no. of 9m dia. bulb turbines 40 210 325 - - (with dredging of up to) (-) (5m) (10m) SETS Width (m) 0 1,300 9,200 12,100 15,000 Max. no. of 14m dia. RR turbines 0 87 613 807 - (with dredging of up to) (-) (-) (5m) (7.5m) Max. no. of 9m dia. RR turbines 0 130 920 1,210 1,500 (with dredging of up to) (-) (-) (-) (2.5m) (5m)
Table 44 Bridgwater Bay available depth for turbines
Depth below chart datum >20m >15m >10m >7.5m >5m
Width (m) 0 400 2,200 7,100 12,000 Max. no. of 9m dia. bulb turbines 0 20 110 - - (with dredging of up to) (-) (5m) (10m) Max. no. of 14m dia. RR turbines 0 27 147 473 - (with dredging of up to) (-) (-) (5m) (7.5m) Max. no. of 9m dia. RR turbines 0 40 220 710 1,200 (with dredging of up to) (-) (-) (-) (2.5m) (5m)
Table 45 Severn results of previous studies
Loc
atio
n
Mod
e
Turbines Sluices
Inst
alle
d ca
paci
ty (
MW
)
Ann
ual e
nerg
y ou
tput
(T
Wh)
Sou
rce
Cal
cula
tion
m
etho
d
No.
Dia
. (m
)
Uni
t siz
e (M
W)
No.
Siz
e
B1 E 300 9.0 40 320 12m x 12m 12,000 19.70 SBC (1981) 2-d B1 E 300 9.0 40 320 12m x 12m 12,000 19.70 Baker (1991) 2-d B1 E 370 9.0 40 320 12m x 12m 13,500 25.30 DECC (2008) *
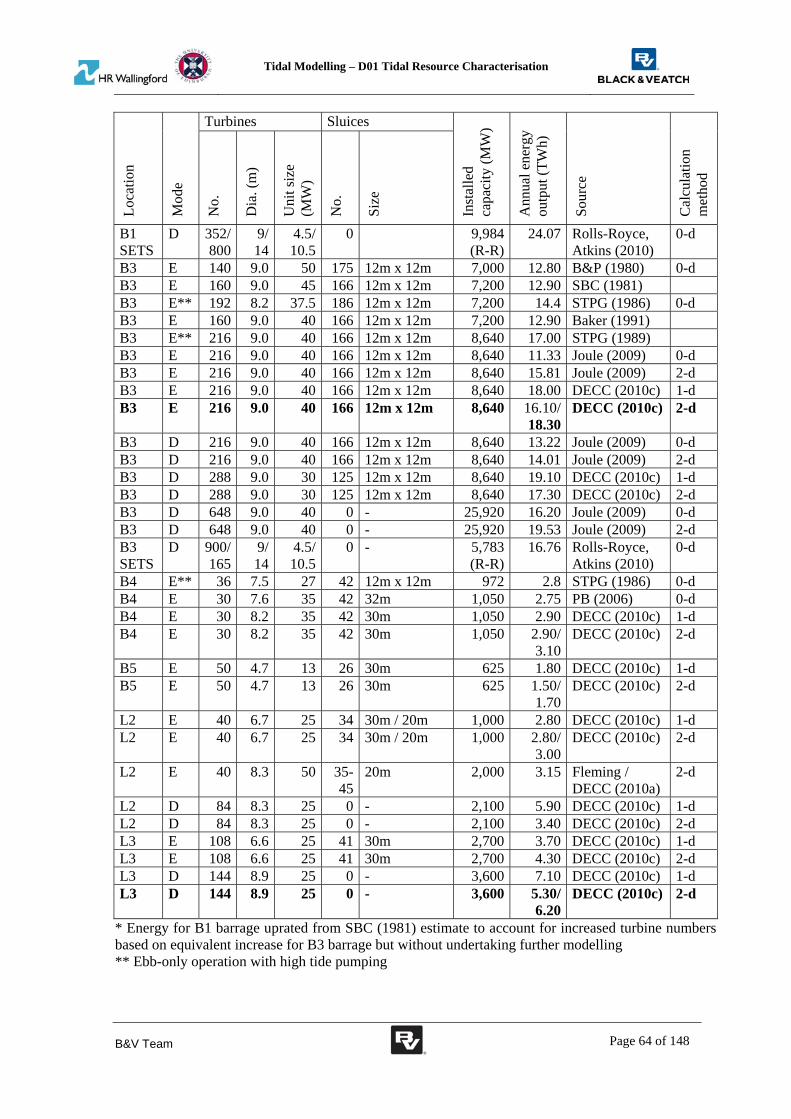
Tidal Modelling – D01 Tidal Resource Characterisation
B&V Team Page 64 of 148
Loc
atio
n
Mod
e
Turbines Sluices
Inst
alle
d ca
paci
ty (
MW
)
Ann
ual e
nerg
y ou
tput
(T
Wh)
Sou
rce
Cal
cula
tion
m
etho
d
No.
Dia
. (m
)
Uni
t siz
e (M
W)
No.
Siz
e
B1 SETS
D 352/ 800
9/ 14
4.5/ 10.5
0 9,984 (R-R)
24.07 Rolls-Royce, Atkins (2010)
0-d
B3 E 140 9.0 50 175 12m x 12m 7,000 12.80 B&P (1980) 0-d B3 E 160 9.0 45 166 12m x 12m 7,200 12.90 SBC (1981) B3 E** 192 8.2 37.5 186 12m x 12m 7,200 14.4 STPG (1986) 0-d B3 E 160 9.0 40 166 12m x 12m 7,200 12.90 Baker (1991) B3 E** 216 9.0 40 166 12m x 12m 8,640 17.00 STPG (1989) B3 E 216 9.0 40 166 12m x 12m 8,640 11.33 Joule (2009) 0-d B3 E 216 9.0 40 166 12m x 12m 8,640 15.81 Joule (2009) 2-d B3 E 216 9.0 40 166 12m x 12m 8,640 18.00 DECC (2010c) 1-d B3 E 216 9.0 40 166 12m x 12m 8,640 16.10/
18.30 DECC (2010c) 2-d
B3 D 216 9.0 40 166 12m x 12m 8,640 13.22 Joule (2009) 0-d B3 D 216 9.0 40 166 12m x 12m 8,640 14.01 Joule (2009) 2-d B3 D 288 9.0 30 125 12m x 12m 8,640 19.10 DECC (2010c) 1-d B3 D 288 9.0 30 125 12m x 12m 8,640 17.30 DECC (2010c) 2-d B3 D 648 9.0 40 0 - 25,920 16.20 Joule (2009) 0-d B3 D 648 9.0 40 0 - 25,920 19.53 Joule (2009) 2-d B3 SETS
D 900/ 165
9/ 14
4.5/ 10.5
0 - 5,783 (R-R)
16.76 Rolls-Royce, Atkins (2010)
0-d
B4 E** 36 7.5 27 42 12m x 12m 972 2.8 STPG (1986) 0-d B4 E 30 7.6 35 42 32m 1,050 2.75 PB (2006) 0-d B4 E 30 8.2 35 42 30m 1,050 2.90 DECC (2010c) 1-d B4 E 30 8.2 35 42 30m 1,050 2.90/
3.10 DECC (2010c) 2-d
B5 E 50 4.7 13 26 30m 625 1.80 DECC (2010c) 1-d B5 E 50 4.7 13 26 30m 625 1.50/
1.70 DECC (2010c) 2-d
L2 E 40 6.7 25 34 30m / 20m 1,000 2.80 DECC (2010c) 1-d L2 E 40 6.7 25 34 30m / 20m 1,000 2.80/
3.00 DECC (2010c) 2-d
L2 E 40 8.3 50 35-45
20m 2,000 3.15 Fleming / DECC (2010a)
2-d
L2 D 84 8.3 25 0 - 2,100 5.90 DECC (2010c) 1-d L2 D 84 8.3 25 0 - 2,100 3.40 DECC (2010c) 2-d L3 E 108 6.6 25 41 30m 2,700 3.70 DECC (2010c) 1-d L3 E 108 6.6 25 41 30m 2,700 4.30 DECC (2010c) 2-d L3 D 144 8.9 25 0 - 3,600 7.10 DECC (2010c) 1-d L3 D 144 8.9 25 0 - 3,600 5.30/
6.20 DECC (2010c) 2-d
* Energy for B1 barrage uprated from SBC (1981) estimate to account for increased turbine numbers based on equivalent increase for B3 barrage but without undertaking further modelling ** Ebb-only operation with high tide pumping

Tidal Modelling – D01 Tidal Resource Characterisation
B&V Team Page 65 of 148
Table 46 Severn Outer result for ebb-only mode with conventional turbines
No. of turbines
Unit generator capacity (MW)
No. of sluices
Size of sluices
Indicative energy output (TWh/yr)
Starting head
Min. tidal range
370 40 320 12m x 12m 28.9 Optimised 50%
Table 47 Severn Outer results for dual mode with conventional turbines
No. of turbines
Unit generator capacity (MW)
Indicative energy output (TWh/yr)
Starting head
Min. tidal range
370 30 24.8 Minimum 41% 800 30 30.5 Minimum 79% 850 30 29.6 Minimum 82% 850 18 42.2 Optimised 80% 875 18 45.0 Optimised 80%
Table 48 Severn Outer results for dual mode with Rolls-Royce turbines
No. of 9m dia. turbines
No. of 14m dia. turbines
Indicative energy output (TWh/yr)
Starting head
Min. tidal range
352 800 19.0 1m 78% 352 800 24.1 Optimised 75%
Table 49 Severn Outer scheme selection
Mode Turbine type
Turbines Indicative energy output
(TWh/yr)
Sluices
No. Dia. (m)
Unit capacity (MW) No. Size
Ebb Conventional 370 9.0 40 28.9 320 12m x 12m Dual Conventional 875 9.0 18 45.0 0 - Dual Rolls-Royce 352 / 800 9.0 / 14.0 3 / 8 24.1 0 -
The conventional turbine dual mode selection for the Outer barrage is the maximum number of turbines that will fit into the barrage alignment. The turbines have to open early in the tide to achieve 80% of natural tidal range so the selected generator capacity is lower than anticipated for the tidal range. The SETS selection has been adopted for Rolls-Royce turbines, although this does not quite reach 80% of tidal range on all the tides tested. Note that the Rolls-Royce turbines were tested using the tidal constituents used in SETS.
Table 50 Severn Cardiff-Weston result for ebb-only mode with conventional turbines
No. of turbines
Unit generator capacity (MW)
No. of sluices
Size of sluices
Indicative energy output (TWh/yr)
Starting head
Min. tidal range
216 40 166 12m x 12m 18.8 Optimised 52%

Tidal Modelling – D01 Tidal Resource Characterisation
B&V Team Page 66 of 148
Table 51 Severn Cardiff-Weston results for dual mode with conventional turbines
No. of
turbines Unit generator capacity (MW)
Indicative energy output (TWh/yr)
Starting head
Min. tidal range
216 30 16.9 Minimum 46% 400 30 18.8 Minimum 78% 450 30 17.7 Minimum 84% 450 30 27.9 Optimised 80%
Table 52 Severn Cardiff-Weston (SETS) results for dual mode with Rolls-Royce turbines
No. of 9m dia. turbines
No. of 14m dia. turbines
Indicative energy output (TWh/yr)
Starting head
Min. tidal range
900 165 13.5 1m 80% 900 165 17.0 Optimised 80%
Table 53 Severn Cardiff-Weston scheme selection
Mode Turbine type
Turbines Indicative energy output
(TWh/yr)
Sluices
No. Dia. (m)
Unit capacity (MW) No. Size
Ebb Conventional 216 9.0 40 18.8 166 12m x 12m Dual Conventional - - - - 0 - Dual Rolls-Royce 900 / 165 9.0 / 14.0 4 / 10 17.0 0 -
A conventional turbine dual mode scheme has not been selected because there is insufficient deep water to install enough turbines to achieve 80% of natural tidal range. The SETS selection has been adopted for Rolls-Royce turbines. Note that the Rolls-Royce turbines were tested using the tidal constituents used in SETS.
Table 54 Bridgwater Bay results for dual mode with conventional turbines
No. of turbines
Unit generator capacity (MW)
Indicative energy output (TWh/yr)
Starting head
Min. tidal range
20 30 1.9 Minimum 29% 30 30 2.5 Minimum 43% 40 30 2.9 Minimum 57% 50 30 3.0 Minimum 70% 60 30 2.9 Minimum 80% 60 30 3.5 Optimised 80%
120 30 6.9 Optimised 81%

Tidal Modelling – D01 Tidal Resource Characterisation
B&V Team Page 67 of 148
Table 55 Bridgwater Bay results for dual mode with Rolls-Royce turbines
No. of 9m dia. turbines
No. of 14m dia. turbines
Indicative energy output (TWh/yr)
Starting head
Min. tidal range
Max. generating head
0 80 3.5 1m 74% 4.62 0 90 3.4 1m 81% 4.36 0 100 3.0 1m 86% 4.08 0 110 2.4 1m 91% 3.92 0 110 4.1 Optimised 90% 3.99
Table 56 Bridgwater Bay scheme selection
Mode Turbine type
Turbines Indicative energy output
(TWh/yr)
Sluices
No. Dia. (m)
Unit capacity (MW) No. Size
Ebb Conventional - - - - - - Dual Conventional 120 9.0 30 6.9 0 - Dual Rolls-Royce 110 14.0 14 4.1 0 -
An ebb-only selection has not been made for the Bridgwater Bay lagoon because the energy output and tidal range is greater with dual mode. The total installed capacity for dual mode with conventional turbines is the same as selected for the Severn Tidal Power study, although the turbine details are different (120no. 30MW turbines instead of 144no. 25MW turbines). With Rolls-Royce turbines, 80% of natural tidal range can be achieved with 90 turbines but this leads to generating heads in excess of 4m. To prevent this, an additional 20 turbines are required. 5.8 Thames
Two barrage alignments have been considered previously in the Thames estuary (Inner and Outer). A new alignment was recently proposed by Halcrow (2011) as part of the Thames Hub proposals. This alignment has the advantage over the Outer alignment of not enclosing the port of Sheerness and avoiding the complication of a secondary embankment to the south of the Isle of Sheppey, although the impounded area is reduced by about 20% because of the loss of the Medway estuary. The Thames Hub alignment has been adopted for this study.
Table 57 Thames alignments
Name Location Mean tidal range (m)
Basin area (km2)
Impoundment length (km)
Outer Southend to Sheerness 4.2 200 9.2 Thames Hub Southend to Isle of Grain 4.2 160 8.3 Inner Canvey Island to St Mary’s
Marshes 4.2 64 2.9

Tidal Modelling – D01 Tidal Resource Characterisation
B&V Team Page 68 of 148
Figure 18 Thames alignments
Table 58 Thames available depth for turbines
Depth below chart datum >20m >15m >10m >7.5m >5m
Width (m) 0 350 1,200 1,300 3,500 Max. no. of 9m dia. bulb turbines 0 18 60 - - (with dredging of up to) (-) (5m) (10m) Max. no. of 14m dia. RR turbines 0 23 80 87 - (with dredging of up to) (-) (-) (5m) (7.5m) Max. no. of 9m dia. RR turbines 0 35 120 130 350 (with dredging of up to) (-) (-) (-) (2.5m) (5m)
Table 59 Thames results of previous studies
Loc
atio
n
Mod
e
Turbines Sluices
Inst
alle
d ca
paci
ty (
MW
)
Ann
ual e
nerg
y ou
tput
(T
Wh)
Sou
rce
Cal
cula
tion
m
etho
d
No.
Dia
. (m
)
Uni
t siz
e (M
W)
No.
Siz
e
Outer E 30 9.0 28 30 12m x 12m 840 1.16 B&P (1980) 0-d Outer E 40 9.0 28 40 12m x 12m 1,120 1.37 B&P (1980) 0-d Outer E 40 9.0 28 40 12m x 12m 1,120 1.37 Baker (1991) 0-d Outer E 40 9.0 28 40 12m x 12m 1,120 1.30 Joule (2009) 0-d Inner E 16 7.5 20 12 12m x 12m 320 0.48 B&P (1980) 0-d Inner E 24 7.5 20 14 12m x 12m 480 0.59 B&P (1980) 0-d

Tidal Modelling – D01 Tidal Resource Characterisation
B&V Team Page 69 of 148
Table 60 Thames result for ebb-only mode with conventional turbines (Thames Hub alignment)
No. of turbines
Unit generator capacity (MW)
No. of sluices
Size of sluices
Indicative energy output (TWh/yr)
Starting head
Min. tidal range
32 20 32 12m x 12m 1.1 Optimised 53%
Table 61 Thames results for dual mode with conventional turbines (Thames Hub alignment)
No. of turbines
Unit generator capacity (MW)
Indicative energy output (TWh/yr)
Starting head
Min. tidal range
32 30 0.8 Minimum 39% 60 30 1.1 Minimum 70% 70 30 1.1 Minimum 78% 80 30 0.9 Minimum 85% 80 11 1.6 Optimised 80%
Table 62 Thames results for dual mode with Rolls-Royce turbines (Thames Hub alignment)
No. of 9m dia. turbines
No. of 14m dia. turbines
Indicative energy output (TWh/yr)
Starting head
Min. tidal range
0 60 1.3 1m 51% 0 70 1.4 1m 60% 0 80 1.5 1m 68% 0 90 1.5 1m 75%
10 90 1.5 1m 78% 20 90 1.5 1m 81% 20 90 1.8 Optimised 80%
Table 63 Thames scheme selection
Mode Turbine type
Turbines Indicative energy output
(TWh/yr)
Sluices
No. Dia. (m)
Unit capacity (MW) No. Size
Ebb Conventional 32 9.0 20 1.1 32 12m x 12m Dual Conventional - - - - 0 - Dual Rolls-Royce 20 / 90 9.0 / 14.0 2 / 5 1.8 0 -
The ebb-only selection is based on that given in Baker (1991) for the Outer alignment but with turbine numbers and sluice numbers reduced by 20% to account for the different alignment and the turbine generator capacity from the Inner alignment. With conventional turbines there is not enough deep enough water along the alignment to allow installation of sufficient turbines to achieve 80% of natural tidal range. For the same reason, a combination of 9m and 14m diameter Rolls-Royce turbines are required as there is insufficient depth for more than 90no. 14m diameter turbines.

Tidal Modelling – D01 Tidal Resource Characterisation
B&V Team Page 70 of 148
5.9 The Wash
Two alignments have been considered for the Wash. The outer alignment has 30% greater area but a slightly shorter embankment so has been selected for this study.
Table 64 The Wash alignments
Name Location Mean tidal range (m)
Basin area (km2)
Impoundment length (km)
Outer Hunstanton to Gibraltar Point 4.8 650 19.3 Inner Hunstanton to Gibraltar Point 4.8 500 20.0
Figure 19 The Wash alignments
Table 65 The Wash available depth for turbines
Depth below chart datum >20m >15m >10m >7.5m >5m
Width (m) 3,000 4,100 7,000 7,850 8,700 Max. no. of 9m dia. bulb turbines 150 205 350 - - (with dredging of up to) (-) (5m) (10m) Max. no. of 14m dia. RR turbines 200 273 467 523 - (with dredging of up to) (-) (-) (5m) (7.5m) Max. no. of 9m dia. RR turbines 300 410 700 785 870 (with dredging of up to) (-) (-) (-) (2.5m) (5m)

Tidal Modelling – D01 Tidal Resource Characterisation
B&V Team Page 71 of 148
Table 66 The Wash results of previous studies
Loc
atio
n
Mod
e
Turbines Sluices
Inst
alle
d ca
paci
ty (
MW
)
Ann
ual e
nerg
y ou
tput
(T
Wh)
Sou
rce
Cal
cula
tion
m
etho
d
No.
Dia
. (m
)
Uni
t siz
e (M
W)
No.
Siz
e
Inner E 60 9.0 30 80 12m x 12m 1,800 2.85 B&P (1980) 0-d Inner E 80 9.0 30 100 12m x 12m 2,400 3.40 B&P (1980) 0-d Inner E 80 9.0 30 100 12m x 12m 2,400 3.24 Joule (2009) 0-d Outer E 60 9.0 30 80 12m x 12m 1,800 3.06 B&P (1980) 0-d Outer E 80 9.0 30 100 12m x 12m 2,400 3.75 B&P (1980) 0-d Outer E 100 9.0 30 120 12m x 12m 3,000 4.33 B&P (1980) 0-d Outer E 120 9.0 30 140 12m x 12m 3,600 4.79 B&P (1980) 0-d Outer E 120 9.0 23 140 12m x 12m 2,760 4.69 Wishart (1981) 0-d Outer E 120 9.0 23 140 12m x 12m 2,760 4.69 Baker (1991) 0-d
Table 67 The Wash result for ebb-only mode with conventional turbines (Outer alignment)
No. of
turbines Unit generator capacity (MW)
No. of sluices
Size of sluices
Indicative energy output (TWh/yr)
Starting head
Min. tidal range
120 23 140 12m x 12m 5.1 Optimised 48%
Table 68 The Wash results for dual mode with conventional turbines (Outer alignment)
No. of turbines
Unit generator capacity (MW)
Indicative energy output (TWh/yr)
Starting head
Min. tidal range
120 30 3.6 Minimum 40% 260 30 4.6 Minimum 78% 280 30 4.3 Minimum 81% 280 14 6.0 Optimised 80% 350 14 8.5 Optimised 80%
Table 69 The Wash results for dual mode with Rolls-Royce turbines (Outer alignment)
No. of 9m dia. turbines
No. of 14m dia. turbines
Indicative energy output (TWh/yr)
Starting head
Min. tidal range
0 200 5.1 1m 44% 0 300 6.3 1m 67% 0 350 6.3 1m 76% 0 400 5.8 1m 83% 0 400 8.3 Optimised 80%
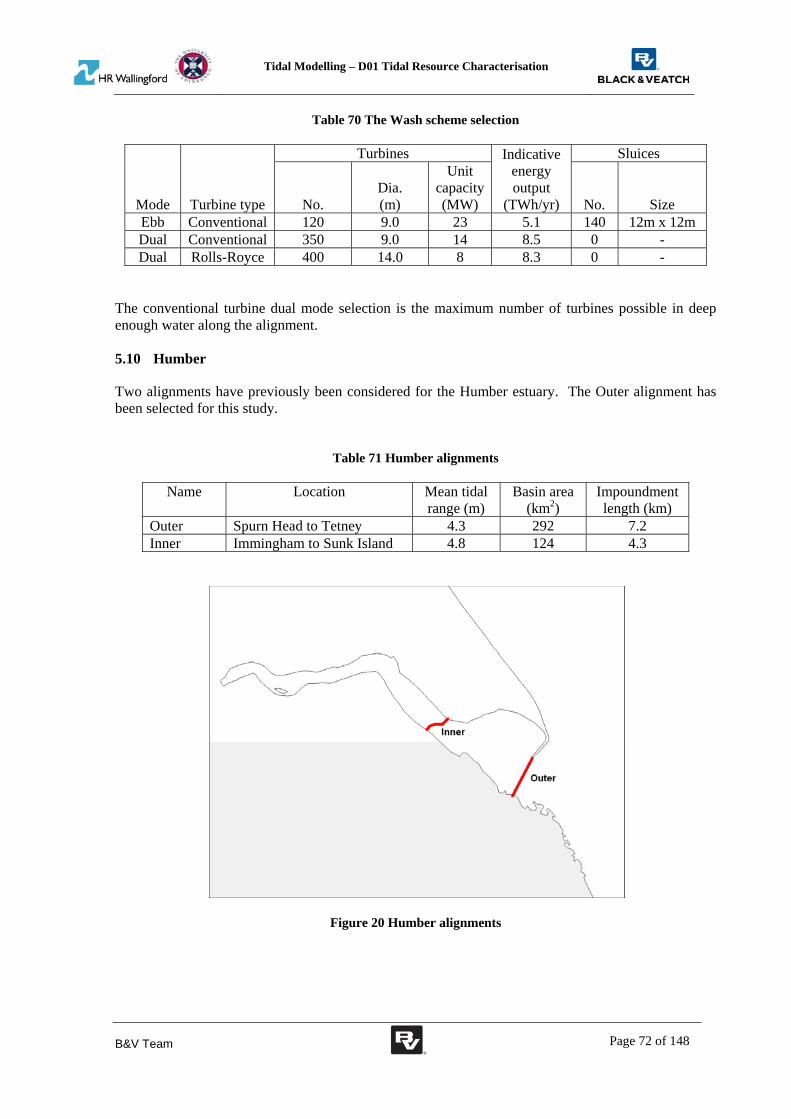
Tidal Modelling – D01 Tidal Resource Characterisation
B&V Team Page 72 of 148
Table 70 The Wash scheme selection
Mode Turbine type
Turbines Indicative energy output
(TWh/yr)
Sluices
No. Dia. (m)
Unit capacity (MW) No. Size
Ebb Conventional 120 9.0 23 5.1 140 12m x 12m Dual Conventional 350 9.0 14 8.5 0 - Dual Rolls-Royce 400 14.0 8 8.3 0 -
The conventional turbine dual mode selection is the maximum number of turbines possible in deep enough water along the alignment. 5.10 Humber
Two alignments have previously been considered for the Humber estuary. The Outer alignment has been selected for this study.
Table 71 Humber alignments
Name Location Mean tidal range (m)
Basin area (km2)
Impoundment length (km)
Outer Spurn Head to Tetney 4.3 292 7.2 Inner Immingham to Sunk Island 4.8 124 4.3
Figure 20 Humber alignments

Tidal Modelling – D01 Tidal Resource Characterisation
B&V Team Page 73 of 148
Table 72 Humber available depth for turbines
Depth below chart datum >20m >15m >10m >7.5m >5m
Width (m) 100 1,000 2,200 4,000 4,600 Max. no. of 9m dia. bulb turbines 5 50 110 - - (with dredging of up to) (-) (5m) (10m) Max. no. of 14m dia. RR turbines 7 67 147 267 - (with dredging of up to) (-) (-) (5m) (7.5m) Max. no. of 9m dia. RR turbines 10 100 220 400 460 (with dredging of up to) (-) (-) (-) (2.5m) (5m)
Table 73 Humber results of previous studies
Loc
atio
n
Mod
e
Turbines Sluices
Inst
alle
d ca
paci
ty (
MW
)
Ann
ual e
nerg
y ou
tput
(T
Wh)
Sou
rce
Cal
cula
tion
m
etho
d
No.
Dia
. (m
)
Uni
t siz
e (M
W)
No.
Siz
e
Outer E 40 9.0 27 60 12m x 12m 1,080 1.65 B&P (1980) 0-d Outer E 40 9.0 27 60 12m x 12m 1,080 1.55 Joule (2009) 0-d Outer E 60 9.0 20 80 12m x 12m 1,200 2.01 Wishart (1981) 0-d Outer E 60 9.0 20 80 12m x 12m 1,200 2.01 Baker (1991) 0-d Outer E 60 9.0 27 80 12m x 12m 1,620 2.05 B&P (1980) 0-d Inner E 30 7.5 19 30 12m x 12m 555 0.98 B&P (1980) 0-d Inner E 40 7.5 19 40 12m x 12m 740 1.14 B&P (1980) 0-d
Table 74 Humber result for ebb-only mode with conventional turbines (Outer alignment)
No. of turbines
Unit generator capacity (MW)
No. of sluices
Size of sluices
Indicative energy output (TWh/yr)
Starting head
Min. tidal range
60 20 80 12m x 12m 2.2 Optimised 51%
Table 75 Humber results for dual mode with conventional turbines (Outer alignment)
No. of turbines
Unit generator capacity (MW)
Indicative energy output (TWh/yr)
Starting head
Min. tidal range
60 30 1.5 Minimum 40% 120 30 2.0 Minimum 73% 140 30 1.9 Minimum 81% 140 11 2.3 Optimised 80%

Tidal Modelling – D01 Tidal Resource Characterisation
B&V Team Page 74 of 148
Table 76 Humber results for dual mode with Rolls-Royce turbines (Outer alignment)
No. of 9m dia. turbines
No. of 14m dia. turbines
Indicative energy output (TWh/yr)
Starting head
Min. tidal range
0 60 1.4 1m 23% 0 100 2.2 1m 45% 0 140 2.7 1m 63% 0 180 2.8 1m 77% 0 200 2.6 1m 83% 0 200 3.7 Optimised 80%
Table 77 Humber scheme selection
Mode Turbine type
Turbines Indicative energy output
(TWh/yr)
Sluices
No. Dia. (m)
Unit capacity (MW) No. Size
Ebb Conventional 60 9.0 20 2.2 80 12m x 12m Dual Conventional - - - - 0 - Dual Rolls-Royce 200 14.0 7 3.7 0 -
A conventional turbine dual mode scheme has not been selected because there is insufficient deep water to accommodate the number of turbines required to achieve 80% of natural tidal range. 5.11 Lagoon locations
The tidal range, impounded area and impoundment length at the selected tidal lagoons (except Dee-Wirral and Bridgwater Bay, which have already been covered) are listed in Table 78. The following sections contain results for each of these lagoons. Since there is not the same constraint on turbine numbers as for barrages, it is possible to achieve 80% of natural tidal range with dual mode generation. The energy output for dual mode will be higher than for ebb-only generation, as shown for the Dee-Wirral lagoon and Bridgwater Bay lagoon, so ebb-only schemes have not been defined. In all cases there is sufficient deep water to use 14m diameter Rolls-Royce turbines without dredging.
Table 78 Lagoon locations
Location Mean tidal range (m)
Basin area (km2)
Impoundment length (km)
Wigtown Bay lagoon 4.8 163 14.5 Kirkcudbright Bay lagoon 5.1 16 4.0 Cumbria lagoon 5.5 62 20.0 Oxwich Bay lagoon 6.1 14 6.2 West Aberthaw lagoon 7.5 30 13.4 Rhoose lagoon 7.5 25 12.4 Morte Bay lagoon 5.5 12 5.0 Rye Bay lagoon 5.2 103 25.0 Dymchurch lagoon 5.2 103 23.0

Tidal Modelling – D01 Tidal Resource Characterisation
B&V Team Page 75 of 148
5.12 Wigtown Bay
The Wigtown Bay lagoon makes use of a large bay and estuary in southern Scotland, as shown in Figure 21. There is deep water at the mouth of the bay and a large impounded area. The mean tidal range is only 4.8m, which is the lowest for the lagoon options selected.
Figure 21 Wigtown Bay, Kirkcudbright Bay and Cumbria lagoon alignments
Table 79 Wigtown Bay results for dual mode with conventional turbines
No. of turbines
Unit generator capacity (MW)
Indicative energy output (TWh/yr)
Starting head
Min. tidal range
80 30 1.7 Minimum 73% 100 30 1.5 Minimum 85% 100 14 2.5 Optimised 80% 120 14 3.1 Optimised 82% 140 14 3.5 Optimised 80% 160 14 3.8 Optimised 80%
Table 80 Wigtown Bay results for dual mode with Rolls-Royce turbines
No. of 9m dia. turbines
No. of 14m dia. turbines
Indicative energy output (TWh/yr)
Starting head
Min. tidal range
0 100 2.3 1m 67% 0 120 2.3 1m 78% 0 140 2.1 1m 86% 0 140 3.2 Optimised 80%

Tidal Modelling – D01 Tidal Resource Characterisation
B&V Team Page 76 of 148
Table 81 Wigtown Bay scheme selection
Mode Turbine type
Turbines Indicative energy output
(TWh/yr)
Sluices
No. Dia. (m)
Unit capacity (MW) No. Size
Dual Conventional 160 9.0 14 3.8 0 - Dual Rolls-Royce 140 14.0 8 3.2 0 -
5.13 Kirkcudbright Bay
The Kirkcudbright Bay lagoon, as shown in Figure 21, makes use of a small bay and estuary on the south coast of Scotland. The embankment is curved outwards to reach deep water near the entrance to the bay, which provides ideal conditions for the turbines to discharge into. There are intertidal areas within the bay that reduce the storage volume available for power generation. As it is a relatively small scheme, the cost of energy is likely to be high.
Table 82 Kirkcudbright Bay results for dual mode with conventional turbines
No. of turbines
Unit generator capacity (MW)
Indicative energy output (TWh/yr)
Starting head
Min. tidal range
6 30 0.17 Minimum 65% 8 30 0.16 Minimum 80% 8 18 0.18 Optimised 80%
10 18 0.29 Optimised 81% 12 18 0.35 Optimised 80% 14 18 0.38 Optimised 80% 16 18 0.40 Optimised 80%
Table 83 Kirkcudbright Bay results for dual mode with Rolls-Royce turbines
No. of 9m dia. turbines
No. of 14m dia. turbines
Indicative energy output (TWh/yr)
Starting head
Min. tidal range
0 10 0.23 1m 74% 0 12 0.21 1m 84% 0 12 0.30 Optimised 80%
Table 84 Kirkcudbright Bay scheme selection
Mode Turbine type
Turbines Indicative energy output
(TWh/yr)
Sluices
No. Dia. (m)
Unit capacity (MW) No. Size
Dual Conventional 14 9.0 18 0.38 0 - Dual Rolls-Royce 12 14.0 9 0.30 0 -
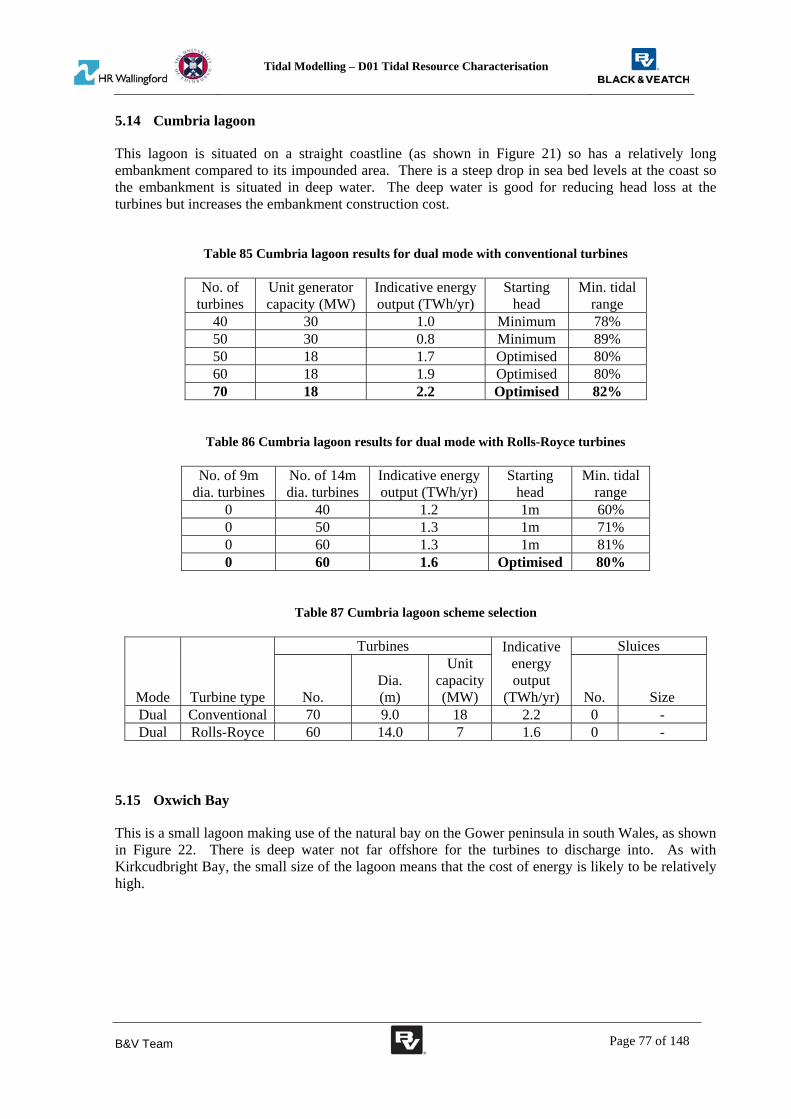
Tidal Modelling – D01 Tidal Resource Characterisation
B&V Team Page 77 of 148
5.14 Cumbria lagoon
This lagoon is situated on a straight coastline (as shown in Figure 21) so has a relatively long embankment compared to its impounded area. There is a steep drop in sea bed levels at the coast so the embankment is situated in deep water. The deep water is good for reducing head loss at the turbines but increases the embankment construction cost.
Table 85 Cumbria lagoon results for dual mode with conventional turbines
No. of turbines
Unit generator capacity (MW)
Indicative energy output (TWh/yr)
Starting head
Min. tidal range
40 30 1.0 Minimum 78% 50 30 0.8 Minimum 89% 50 18 1.7 Optimised 80% 60 18 1.9 Optimised 80% 70 18 2.2 Optimised 82%
Table 86 Cumbria lagoon results for dual mode with Rolls-Royce turbines
No. of 9m dia. turbines
No. of 14m dia. turbines
Indicative energy output (TWh/yr)
Starting head
Min. tidal range
0 40 1.2 1m 60% 0 50 1.3 1m 71% 0 60 1.3 1m 81% 0 60 1.6 Optimised 80%
Table 87 Cumbria lagoon scheme selection
Mode Turbine type
Turbines Indicative energy output
(TWh/yr)
Sluices
No. Dia. (m)
Unit capacity (MW) No. Size
Dual Conventional 70 9.0 18 2.2 0 - Dual Rolls-Royce 60 14.0 7 1.6 0 -
5.15 Oxwich Bay
This is a small lagoon making use of the natural bay on the Gower peninsula in south Wales, as shown in Figure 22. There is deep water not far offshore for the turbines to discharge into. As with Kirkcudbright Bay, the small size of the lagoon means that the cost of energy is likely to be relatively high.

Tidal Modelling – D01 Tidal Resource Characterisation
B&V Team Page 78 of 148
Figure 22 Oxwich Bay alignment
Table 88 Oxwich Bay results for dual mode with conventional turbines
No. of turbines
Unit generator capacity (MW)
Indicative energy output (TWh/yr)
Starting head
Min. tidal range
8 30 0.29 Minimum 70% 10 30 0.27 Minimum 80% 10 22 0.34 Optimised 81% 12 22 0.48 Optimised 81% 14 22 0.57 Optimised 80% 16 22 0.63 Optimised 80% 18 22 0.66 Optimised 81%
Table 89 Oxwich Bay results for dual mode with Rolls-Royce turbines
No. of 9m dia. turbines
No. of 14m dia. turbines
Indicative energy output (TWh/yr)
Starting head
Min. tidal range
0 10 0.35 1m 62% 0 12 0.36 1m 72% 0 14 0.35 1m 80% 0 14 0.43 Optimised 80% 0 16 0.52 Optimised 82%

Tidal Modelling – D01 Tidal Resource Characterisation
B&V Team Page 79 of 148
Table 90 Oxwich Bay scheme selection
Mode Turbine type
Turbines Indicative energy output
(TWh/yr)
Sluices
No. Dia. (m)
Unit capacity (MW) No. Size
Dual Conventional 16 9.0 22 0.63 0 - Dual Rolls-Royce 16 14.0 12 0.52 0 -
5.16 West Aberthaw and Rhoose lagoons
These two relatively small lagoons are located alongside each other on the south Wales coast, either side of the Outer Severn barrage alignment. They discharge into deep water and benefit from high tidal range. The embankments are long relative to their impounded area because the coastline is almost straight (unless the lagoons were combined with the Severn Outer barrage). Alternatively they could be combined into one elongated lagoon, reducing the total embankment length slightly. The deep water channel in the Severn prevents extending the lagoon further from the coastline.
Figure 23 Severn lagoon alignments
Table 91 Rhoose results for dual mode with conventional turbines
No. of turbines
Unit generator capacity (MW)
Indicative energy output (TWh/yr)
Starting head
Min. tidal range
15 30 0.9 Minimum 65% 20 30 0.8 Minimum 80% 20 27 1.0 Optimised 80% 25 27 1.4 Optimised 80% 30 27 1.7 Optimised 81% 35 27 1.9 Optimised 80% 40 27 2.0 Optimised 82%

Tidal Modelling – D01 Tidal Resource Characterisation
B&V Team Page 80 of 148
Table 92 Rhoose results for dual mode with Rolls-Royce turbines
No. of 9m
dia. turbines No. of 14m dia. turbines
Indicative energy output (TWh/yr)
Starting head
Min. tidal range
0 25 1.0 1m 72% 0 30 1.0 1m 81% 0 30 1.3 Optimised 80%
Table 93 Rhoose scheme selection
Mode Turbine type
Turbines Indicative energy output
(TWh/yr)
Sluices
No. Dia. (m)
Unit capacity (MW) No. Size
Dual Conventional 40 9.0 27 2.0 0 - Dual Rolls-Royce 30 14.0 14 1.3 0 -
Table 94 West Aberthaw results for dual mode with conventional turbines
No. of turbines
Unit generator capacity (MW)
Indicative energy output (TWh/yr)
Starting head
Min. tidal range
20 30 1.0 Minimum 70% 25 30 1.0 Minimum 81% 25 27 1.3 Optimised 80% 35 27 2.0 Optimised 81% 40 27 2.2 Optimised 81% 45 27 2.3 Optimised 82%
Table 95 West Aberthaw results for dual mode with Rolls-Royce turbines
No. of 9m dia. turbines
No. of 14m dia. turbines
Indicative energy output (TWh/yr)
Starting head
Min. tidal range
0 30 1.2 1m 70% 0 35 1.2 1m 79% 0 40 1.1 1m 86% 0 40 1.7 Optimised 82%
Table 96 West Aberthaw scheme selection
Mode Turbine type
Turbines Indicative energy output
(TWh/yr)
Sluices
No. Dia. (m)
Unit capacity (MW) No. Size
Dual Conventional 45 9.0 27 2.3 0 - Dual Rolls-Royce 40 14.0 14 1.7 0 -
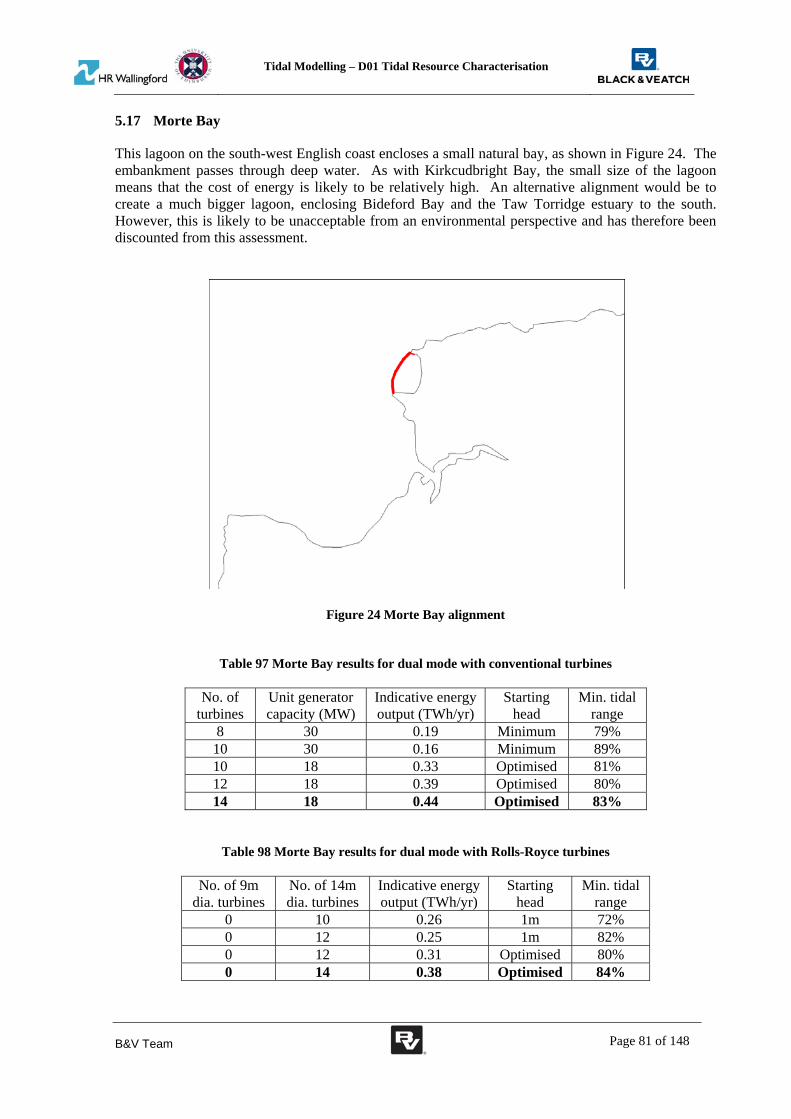
Tidal Modelling – D01 Tidal Resource Characterisation
B&V Team Page 81 of 148
5.17 Morte Bay
This lagoon on the south-west English coast encloses a small natural bay, as shown in Figure 24. The embankment passes through deep water. As with Kirkcudbright Bay, the small size of the lagoon means that the cost of energy is likely to be relatively high. An alternative alignment would be to create a much bigger lagoon, enclosing Bideford Bay and the Taw Torridge estuary to the south. However, this is likely to be unacceptable from an environmental perspective and has therefore been discounted from this assessment.
Figure 24 Morte Bay alignment
Table 97 Morte Bay results for dual mode with conventional turbines
No. of turbines
Unit generator capacity (MW)
Indicative energy output (TWh/yr)
Starting head
Min. tidal range
8 30 0.19 Minimum 79% 10 30 0.16 Minimum 89% 10 18 0.33 Optimised 81% 12 18 0.39 Optimised 80% 14 18 0.44 Optimised 83%
Table 98 Morte Bay results for dual mode with Rolls-Royce turbines
No. of 9m dia. turbines
No. of 14m dia. turbines
Indicative energy output (TWh/yr)
Starting head
Min. tidal range
0 10 0.26 1m 72% 0 12 0.25 1m 82% 0 12 0.31 Optimised 80% 0 14 0.38 Optimised 84%
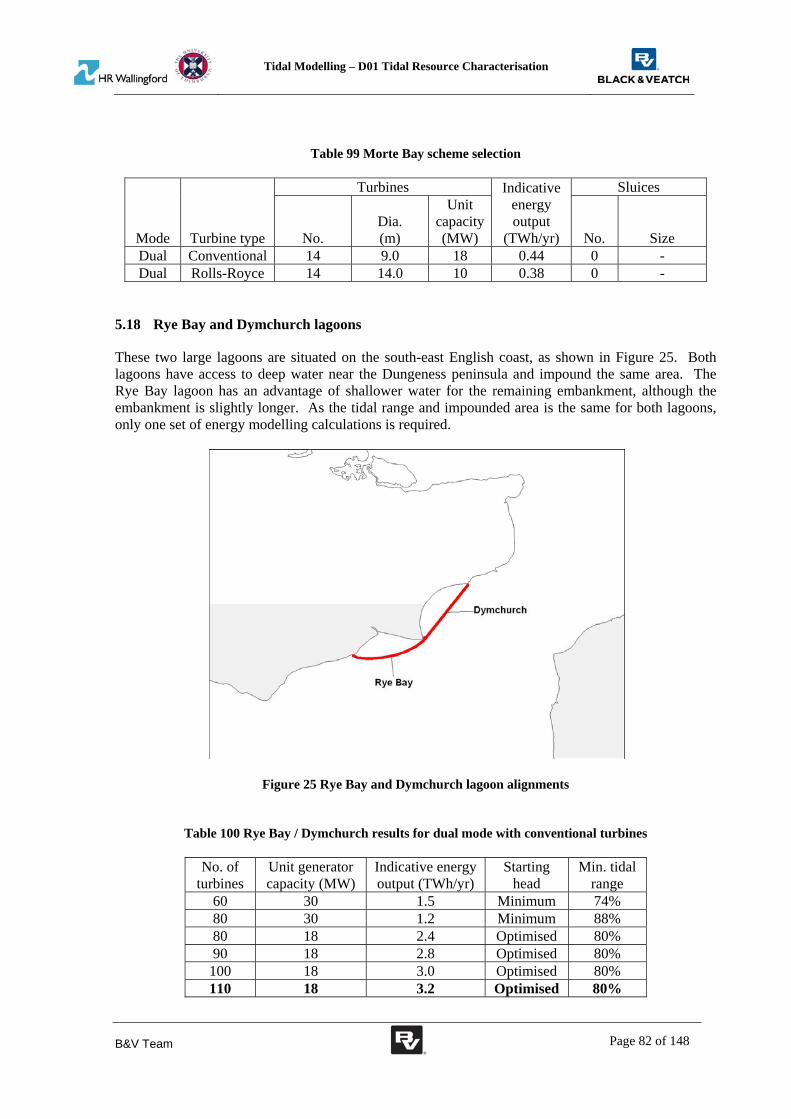
Tidal Modelling – D01 Tidal Resource Characterisation
B&V Team Page 82 of 148
Table 99 Morte Bay scheme selection
Mode Turbine type
Turbines Indicative energy output
(TWh/yr)
Sluices
No. Dia. (m)
Unit capacity (MW) No. Size
Dual Conventional 14 9.0 18 0.44 0 - Dual Rolls-Royce 14 14.0 10 0.38 0 -
5.18 Rye Bay and Dymchurch lagoons
These two large lagoons are situated on the south-east English coast, as shown in Figure 25. Both lagoons have access to deep water near the Dungeness peninsula and impound the same area. The Rye Bay lagoon has an advantage of shallower water for the remaining embankment, although the embankment is slightly longer. As the tidal range and impounded area is the same for both lagoons, only one set of energy modelling calculations is required.
Figure 25 Rye Bay and Dymchurch lagoon alignments
Table 100 Rye Bay / Dymchurch results for dual mode with conventional turbines
No. of turbines
Unit generator capacity (MW)
Indicative energy output (TWh/yr)
Starting head
Min. tidal range
60 30 1.5 Minimum 74% 80 30 1.2 Minimum 88% 80 18 2.4 Optimised 80% 90 18 2.8 Optimised 80%
100 18 3.0 Optimised 80% 110 18 3.2 Optimised 80%

Tidal Modelling – D01 Tidal Resource Characterisation
B&V Team Page 83 of 148
Table 101 Rye Bay / Dymchurch results for dual mode with Rolls-Royce turbines
No. of 9m dia. turbines
No. of 14m dia. turbines
Indicative energy output (TWh/yr)
Starting head
Min. tidal range
0 80 1.9 1m 70% 0 90 1.9 1m 77% 0 100 1.9 1m 83% 0 100 2.5 Optimised 80%
Table 102 Rye Bay / Dymchurch scheme selection
Mode Turbine type
Turbines Indicative energy output
(TWh/yr)
Sluices
No. Dia. (m)
Unit capacity (MW) No. Size
Dual Conventional 110 9.0 18 3.2 0 - Dual Rolls-Royce 100 14.0 8 2.5 0 -
5.19 Summary
Table 103 to Table 105 summarise the three scheme selections for each location. Note that: The ebb-only schemes generally achieve a tidal range of only around 50% of the natural range
inside the impoundment. An indicative minimum tidal range is shown based on 0-d model testing of the selected scheme.
Ebb-only selections have not been made for lagoons as dual mode generation should give (usually significantly) greater energy output if 80% of natural tidal range is achieved.
At some locations there is insufficient deep water or estuary width to accommodate sufficient conventional turbines to achieve 80% of natural tidal range. For this reason, dual mode schemes have not been selected for several of the barrages, although some could be worth dredging to achieve this approach (e.g. Severn Cardiff-Weston).
Schemes have not been selected for the Duddon estuary in any of the operating modes because there is no deep water to install turbines, so the energy output would be very low if tested in the CSM with existing estuary bathymetry.

Tidal Modelling – D01 Tidal Resource Characterisation
B&V Team Page 84 of 148
Table 103 Summary of ebb-only conventional turbines scheme selection
Turbine dia. (m)
Turbine unit
capacity (MW)
No. of turbines
Total installed capacity (MW)
Indicative energy output
(TWh/yr) No. Size1 Solway Firth 814 28 5.6 9.0 29 200 5,800 12.1 226 12m x 12m 44% 61 4262 Duddon 32 6 5.8 - - - - - - - -3 Morecambe Bay 455 18 6.2 9.0 16 120 1,920 6.2 140 12m x 12m 39% 52 3364 Mersey 56 2 6.5 8.0 25 28 700 1.3 18 12m x 12m 68% 45 7005 Dee 103 8 5.9 8.0 21 40 840 1.6 40 8m x 12m 68% 39 1896 Severn - outer 1060 20 7.0 9.0 40 370 14,800 28.9 320 12m x 12m 50% 78 14467 Severn - Cardiff-Weston 504 16 7.9 9.0 40 216 8,640 18.8 166 12m x 12m 49% 87 11778 Thames 160 8 4.2 9.0 20 32 640 1.1 32 12m x 12m 53% 35 1389 Wash 650 19 4.8 9.0 23 120 2,760 5.1 140 12m x 12m 48% 42 264
10 Humber 292 7 4.3 9.0 20 60 1,200 2.2 80 12m x 12m 51% 37 30711 Wigtown Bay lagoon 163 15 4.812 Kirkcudbright Bay lagoon 16 4 5.113 Cumbria lagoon 62 20 5.514 Dee-Wirral lagoon 268 37 5.915 Oxwich Bay lagoon 14 6 6.116 West Aberthaw lagoon 30 13 7.517 Rhoose lagoon 25 12 7.518 Bridgwater Bay lagoon 90 16 8.319 Morte Bay lagoon 12 5 5.520 Rye Bay lagoon 103 25 5.221 Dymchurch lagoon 103 23 5.2
Location
Basin area
(km2)
Mean tidal
range (m)
Impound ment length (km)
GWh/yr per
turbine
GWh/yr per km
impound ment
Suggested installed capacity Min. tidal
range inside basin
Turbine selection Sluices

Tidal Modelling – D01 Tidal Resource Characterisation
B&V Team Page 85 of 148
Table 104 Summary of dual mode, conventional turbines scheme selection
Turbine dia. (m)
Turbine unit
capacity (MW)
No. of turbines
Total installed capacity (MW)
Indicative energy output
(TWh/yr)1 Solway Firth 814 28 5.6 9.0 18 1100 19,800 31.0 83% 28 10922 Duddon 32 6 5.8 - - - - - -3 Morecambe Bay 455 18 6.2 - - - - - -4 Mersey 56 2 6.5 9.0 18 25 450 0.9 80% 34 4785 Dee 103 8 5.9 9.0 18 60 1,080 2.2 80% 36 2596 Severn - outer 1060 20 7.0 9.0 18 875 15,750 45.0 80% 51 22507 Severn - Cardiff-Weston 504 16 7.9 - - - - - -8 Thames 160 8 4.2 - - - - - -9 Wash 650 19 4.8 9.0 14 350 4,900 8.5 80% 24 440
10 Humber 292 7 4.3 - - - - - -11 Wigtown Bay lagoon 163 15 4.8 9.0 14 160 2,240 3.8 80% 24 26112 Kirkcudbright Bay lagoon 16 4 5.1 9.0 18 14 252 0.4 80% 27 9513 Cumbria lagoon 62 20 5.5 9.0 18 70 1,260 2.2 82% 31 10814 Dee-Wirral lagoon 268 37 5.9 9.0 18 250 4,500 9.0 80% 36 24415 Oxwich Bay lagoon 14 6 6.1 9.0 22 16 352 0.6 80% 39 10216 West Aberthaw lagoon 30 13 7.5 9.0 27 45 1,215 2.3 82% 52 17417 Rhoose lagoon 25 12 7.5 9.0 27 40 1,080 2.0 82% 49 15818 Bridgwater Bay lagoon 90 16 8.3 9.0 30 120 3,600 6.9 81% 58 43519 Morte Bay lagoon 12 5 5.5 9.0 18 14 252 0.4 83% 31 8820 Rye Bay lagoon 103 25 5.2 9.0 18 110 1,980 3.2 80% 29 12621 Dymchurch lagoon 103 23 5.2 9.0 18 110 1,980 3.2 80% 29 137
Basin area
(km2)
Mean tidal
range (m)Location
Min. tidal
range inside basin
Turbine selectionImpound
ment length (km)
Suggested installed capacity
GWh/yr per
turbine
GWh/yr per km
impound ment

Tidal Modelling – D01 Tidal Resource Characterisation
B&V Team Page 86 of 148
Table 105 Summary of dual mode, Rolls-Royce turbines scheme selection
1 Solway Firth 814 28 5.6 750 0 6,790 20.8 80% 28 7322 Duddon 32 6 5.8 - - - - -3 Morecambe Bay 455 18 6.2 320 0 3,670 10.5 80% 33 5684 Mersey 56 2 6.5 40 0 570 1.4 80% 35 7675 Dee 103 8 5.9 55 0 740 1.7 81% 31 2066 Severn - outer 1060 20 7.0 800 352 7,540 24.1 75% 21 12077 Severn - Cardiff-Weston 504 19 7.9 165 900 5,130 17.0 80% 16 9128 Thames 160 8 4.2 90 20 530 1.8 80% 16 2169 Wash 650 19 4.8 400 0 3,150 8.3 80% 21 431
10 Humber 292 7 4.3 200 0 1,340 3.7 80% 18 50711 Wigtown Bay lagoon 163 15 4.8 140 0 1,160 3.2 80% 23 22112 Kirkcudbright Bay lagoon 16 4 5.1 12 0 110 0.3 80% 25 7513 Cumbria lagoon 62 20 5.5 60 0 450 1.6 80% 27 8014 Dee-Wirral lagoon 268 37 5.9 220 0 2,360 6.9 80% 32 18715 Oxwich Bay lagoon 14 6 6.1 16 0 190 0.5 82% 33 8416 West Aberthaw lagoon 30 13 7.5 40 0 580 1.7 82% 42 12417 Rhoose lagoon 25 12 7.5 30 0 410 1.3 80% 42 10118 Bridgwater Bay lagoon 90 16 8.3 110 0 1,500 4.1 90% 37 25719 Morte Bay lagoon 12 5 5.5 14 0 140 0.4 84% 27 7620 Rye Bay lagoon 103 25 5.2 100 0 780 2.5 80% 25 10221 Dymchurch lagoon 103 23 5.2 100 0 780 2.5 80% 25 110
Location
Basin area
(km2)
Mean tidal
range (m)
No. of 14m dia. turbines
No. of 9m dia. turbines
Indicative max. output (MW)
Suggested installed capacity
GWh/yr per
turbine
GWh/yr per km
impound ment
Indicative energy output
(TWh/yr)
Min. tidal
range inside basin
Impound ment length (km)

Tidal Modelling – D01 Tidal Resource Characterisation
B&V Team Page 87 of 148
5.20 Indicative cost of energy and other indices to compare schemes
Table 103 to Table 105 also include columns showing the indicative energy output per turbine and per kilometre of impoundment. This gives a crude indication of which schemes are likely to have the lowest cost of energy. An alternative measure of energy relative to cost has been developed to compare schemes and assist in scenario development in deliverable D03. This is based on the costing of schemes (primarily Cardiff-Weston and Bridgwater Bay) used in the Severn Tidal Power Feasibility Study (DECC, 2010c). Based on this, the construction costs (excluding preliminaries, locks, design and profit) can be split up as approximately:
35% on civil costs – embankments and caissons (excluding turbine caissons); 20% on turbine caissons; and 45% on mechanical and electrical (M&E) – gates, turbine generators and grid connections.
We have assumed that:
Embankment costs are proportional to the embankment length (excluding turbines) multiplied by average embankment depth squared; and
The turbine caissons and M&E costs are proportional to the number of turbines. The cost of the major ship lock in the Severn Cardiff-Weston scheme design makes up about 15% of the construction costs. Treating lock costs as a separate item alters the percentages for the Cardiff-Weston scheme to approximately:
30% on civil costs – embankments and caissons (excluding turbine caissons) 15% on turbine caissons 40% on mechanical and electrical (M&E) – gates, turbine generators and grid connections 15% on the lock
A normal/small lock, as included for the other Severn schemes, is equivalent to only 0.7% of the total construction costs of the Cardiff-Weston scheme. Based on the costs used in the Mersey Tidal Power study (Peel Energy, 2011c), the cost of a large shipping lock (but smaller than used for Cardiff-Weston) is equivalent to 5% of the total Severn Cardiff-Weston construction cost. Normalising the costs by the Severn Cardiff-Weston (SCW) ebb-only scheme yields the following equation for relative cost:
0.30 0.15 0.40
where E = annual energy output (in TWh/yr), L = embankment length (excluding length of turbine caissons), d = average bed level depth from top of embankment, N = number of turbines and Lock = relative cost of locks (0.15 for major lock, 0.05 for large lock and 0.007 for minor lock). To calculate the average bed level depth, the embankment crest level is assumed to be mean high water spring (MHWS) tide level plus 7m to allow for surge, waves and freeboard (as was used for the Severn Cardiff-Weston scheme). The indicative measure of energy/cost is given in Table 106. The higher the energy/cost, the more affordable the scheme is likely to be. This equation has been applied to schemes using conventional and Rolls-Royce turbines. Note that value of energy/cost is not directly comparable between different turbine types because the cost of
Tidal Modelling – D01 Tidal Resource Characterisation
B&V Team Page 88 of 148
turbine caissons and M&E plant may not be comparable for conventional and Rolls-Royce machines. The results in Table 106 should not be used to assess whether conventional or Rolls-Royce turbines perform better at a particular site. The relative values do, though, provide an indication of which sites are most suited to using Rolls-Royce turbines. Note that for the Rolls-Royce schemes using some 9m diameter turbines (Severn Outer, Cardiff-Weston and Thames), the equivalent total number of 14m diameter turbines has been used in the equation. Locks have been allowed for in the calculations for Table 106 as follows:
A major lock in the Severn Outer and Cardiff-Weston, Thames and Humber. It is possible that multiple locks or larger locks may be required in the Thames and Humber, given the greater freight traffic in these estuaries than the Severn.
A large lock in Morecambe Bay and the Mersey. Two small locks in the Wash. A small lock in every other barrage and small lagoon.
The energy/cost value provides an indicator of the relative performance of schemes but, due to the assumptions and simplifications used, it is not a genuine cost of energy model. The intention is that this approach should help to derive future scenarios in deliverable D03 but should not be considered definitive in assessing the best sites, technology or operating mode. Further work, using the CoE model in deliverable D04, could be undertaken to develop this analysis further and could show interesting results from a UK energy mix perspective given the far greater energy output of some of the optimised dual generation schemes compared to the traditional ebb-only schemes. However, the first bullet point of Section 5.21 should be borne in mind when assessing this potential future work. This potential further work is further discussed in Section 6. Table 106 also contains other indices with which to compare to selected schemes:
Environmentally designated areas within the impounded basin – Special Areas of Conservation (SACs), Special Protection Areas (SPAs) and Ramsar sites
Freight traffic at ports between 2001 and 2010, taken from information on the Department for Transport website (DfT, 2011)
Annual mean significant wave height, assessed from the Atlas of UK Marine Renewable Energy Resources (BERR, 2008), using a classification of:
o High = greater than 1.5m o Moderate = 1 to 1.5m o Low = less than 1m
Number of designated bathing waters within the impounded basin, taken from information on the European Environment Agency website (EEA, 2011).

Tidal Modelling – D01 Tidal Resource Characterisation
B&V Team Page 89 of 148
Table 106 Comparison of selected schemes
Note: Energy/cost measure for schemes that achieve 80% of natural tidal range are shown in bold.
Ebb-only (conven-
tional turbines)
Dual (conven-
tional turbines)
Dual, (Rolls-Royce
turbines)
Special Areas of
Conservation (SACs)
Special Protection
Areas (SPAs) Ramsar sites
Total freight traffic (2001-
2010) in million tonnes
% of total UK freight
Solway Firth 9.0 10.3 8.3 381 381 381 4 0% Low 7Duddon 32 32 32 0 - Low 3Morecambe Bay 10.4 9.8 455 319 319 55 1% Low 7Mersey 9.0 6.4 8.1 0 39 39 76 1% Low -Dee 8.9 9.6 8.0 103 103 103 4 0% Low 1Severn Outer 18.9 18.3 8.9 708 209 209 172 3% Low 12Severn Cardiff-Weston 18.8 10.0 504 157 157 167 3% Low 4Thames 3.9 3.9 0 41 41 511 8% Low 7The Wash 9.0 7.9 6.8 599 591 591 23 0% Low 3Humber 5.8 5.1 283 283 284 841 14% Low 1Wigtown Bay 4.7 4.1 0 0 0 0 - Low 2Kirkcudbright Bay 2.3 1.8 0 0 0 0 - Low 1Cumbria 2.5 1.9 0 0 0 0 - Low 1Dee-Wirral 8.5 6.9 138 268 120 4 0% Low 4Oxwich Bay 3.0 2.4 0 0 0 0 - Moderate 1West Aberthaw 3.6 2.6 0 0 0 0 - Low -Rhoose 3.6 2.4 0 0 0 0 - Low 1Bridgwater Bay 11.4 6.9 90 51 51 1 0% Low 3Morte Bay 2.3 1.9 0 0 0 0 - High 3Rye Bay 3.7 3.0 2 1 0 1 0% Moderate 2Dymchurch 3.1 2.5 4 0 0 0 - Moderate 5
Location
No. of EU designated
bathing water locations
within basin
Annual mean
significant wave height
Indicative measure of energy/cost Area of environmental designation (km2) Ports
Tidal Resource Modelling – D01 Tidal Resource Characterisation
B&V Team Page 90 of 148
5.21 Results analysis
The energy output per square kilometre is plotted against tidal range in Figure 26. The sites are labelled using the site numbers in Table 103 to Table 105. The best fit lines for dual operation in Figure 26 (both conventional and Rolls-Royce turbines) are fitted to only the lagoon results, as the energy output at many of the barrages is constrained by turbine numbers. The results in Table 103 to Table 106 and Figure 26 indicate that purely in terms of energy output:
The greatest returns are for the two barrages on the Severn (Cardiff-Weston and Outer). With conventional turbines for the Outer barrage, there is a slightly greater energy/cost value with ebb-only generation but the total energy output is much greater for dual mode. The total energy output with Rolls-Royce turbines (and dual generation) is comparable with ebb-only generation, although far more turbines are required so the energy cost may be higher (depending on the relative cost of the conventional and Rolls-Royce turbines).
The next best locations appear to be Bridgwater Bay, Solway Firth, Morecambe Bay and the Dee.
Bridgwater Bay has the highest energy/cost value for a lagoon site as it has high tidal range, is large, takes advantage of a natural bay (reducing the necessary embankment length) and has access to relatively deep water. We have been unable to find other locations in the UK which share all four of these characteristics to the same extent.
For locations where both ebb-only and dual mode schemes are selected with conventional turbines, the Mersey and the Wash appear more suited to ebb-only operation (sites where lack of deep water constrains turbine numbers) whereas the Solway Firth and Dee may be more suited to dual mode operation.
The only location where the dual mode annual energy output with conventional turbines is lower than for ebb-only operation is the Mersey. The Mersey estuary width and depth constrains the number of turbines that can be installed, which prevents the dual mode energy output being fully optimised (whilst achieving 80% tidal range). The energy output is greatest here with Rolls-Royce turbines; since they require less submergence, more turbines can be installed. Although the Mersey benefits from a high tidal range and relatively short embankment length, the energy/cost value is hindered by the significant cost of a large lock that is required to maintain shipping upstream of the barrage.
The barrage locations with the lowest energy/cost value are the Thames and Humber, although they still perform better than most lagoons. The Thames and Humber have a relatively small tidal range and as they also contain large ports they would require major locks, which bring a significant additional cost.
Other than Bridgwater Bay, the best lagoon from an energy/cost view is the Dee-Wirral. This lagoon takes advantage of the Dee estuary to increase the impounded area. The next best lagoons are the largest lagoons (Wigtown Bay and Rye Bay) or sites with highest tidal range (Rhoose and West Aberthaw).
The three smallest lagoons (Kirkcudbright Bay, Oxwich Bay and Morte Bay) and the Cumbria lagoon (which has a relatively long embankment in deep water) have the lowest energy/cost value.
The best sites based on the energy/cost value with Rolls-Royce turbines are Severn Cardiff-Weston and Morecambe Bay.
The Rolls-Royce turbines appear to perform best, relative to conventional turbines, at locations with low tidal range such as the Thames, the Wash and Wigtown Bay. This is perhaps unsurprising as these schemes represent true low head generation. Rolls-Royce turbines also perform well compared to conventional turbines for the Mersey. The relatively shallow depth along the Mersey impoundment line constrains the number of conventional turbines possible but does allow enough Rolls-Royce turbines for optimum energy output, since Rolls-Royce turbines can discharge into shallower water. In addition, using Rolls-

Tidal Resource Modelling – D01 Tidal Resource Characterisation
B&V Team Page 91 of 148
Royce turbines is the only way to achieve 80% of natural tidal range for the Morecambe Bay, Severn Cardiff-Western, Thames and Humber barrages assuming no significant dredging is undertaken (apart from at the turbine caissons). There is insufficient deep water to install enough conventional turbines at these locations to maintain 80% range.
The Rolls-Royce turbines do not perform as well in comparison to conventional turbines for the high tidal range sites in the Severn, particularly Bridgwater Bay. For the Bridgwater Bay lagoon, additional Rolls-Royce turbines had to be added (with no energy benefit) to prevent generating heads exceeding 4m, due to the high tidal range.
The maximum power output for the largest schemes (Severn barrages and Solway Firth) is smaller with Rolls-Royce turbines than with conventional turbines (dual mode) and power generation lasts longer. This means that the power should be easier to absorb into the grid.
The energy output relative to impounded area and mean tidal range (as shown in Figure 26) for dual mode generation is lowest for the Mersey, Dee, Wash and Severn Outer barrages. In each case the estuary width and depth constrains the number of turbines that can be installed. The lagoons that lie below the best-fit line for dual generation (Dee-Wirral, Kirkcudbright Bay, Oxwich Bay and Bridgwater Bay) are those with significant intertidal areas, reducing the storage volume.
Unfortunately the locations with large environmentally designated areas are those with the greatest energy/cost values. In these areas it will be important to maximise the tidal range within the basin to minimise the amount of compensatory habitat that would be required. This need is particularly likely to affect development of ebb-only operation as this causes larger reductions in tidal range. The effect of a Cardiff-Weston barrage on shipping was found to be a major impact in the Severn Tidal Power study (DECC, 2010b). The volume of shipping is much greater in the Thames (three times as much as the Severn) and Humber (five times as much as the Severn). Significant wave heights at the barrage and lagoon locations are generally low, except at Morte Bay and to a lesser extent Rye Bay, Dymchurch and Oxwich Bay. All the sites except the Mersey and West Aberthaw contain some beaches designated as bathing waters, with the number of beaches roughly proportional to the impounded basin. A dual mode scheme with conventional turbines can lead to sudden, fast rises and falls in tide levels within the impounded basin. This could potentially affect the public’s utility of the beaches within the basin.

Tidal Resource Modelling – D01 Tidal Resource Characterisation
B&V Team Page 92 of 148
Figure 26 Relationship between energy output and tidal range 5.22 Comparison of ebb-only energy estimates with previous studies
An indicative annual energy output has been calculated for the selected schemes using 0-d modelling. The energy output includes an allowance for generator efficiency of 97.5% but no adjustment for outages at this stage (see Section 5.23). Table 107 shows a comparison of this energy output with that calculated in the study from which the scheme (number and type of turbines and sluices) was taken. In all cases the annual energy output is higher in the current study than previous estimates. Possible reasons for this are:
For Morecambe Bay, Dee, Thames, Wash and Humber this difference can largely be explained by the reduction in energy output to allow for outages used in the previous studies. The current study allows for increased generator efficiency and increased maximum turbine efficiency, which reflects turbine technology advances since these earlier studies.
The degree of optimisation of turbine starting conditions carried out varies. For example, we have used variable starting conditions for different tide heights within a simulation, whereas Joule optimised the start delay with a constant start delay for all the tides in each simulation.
The Severn Cardiff-Weston energy estimates are based on 2-d modelling so that the effect of the barrage on the downstream sea level (tidal range and profile) is captured. This is not possible in a 0-d model.
Unfortunately no details are provided in the Mersey Tidal Power report on the representation of the turbines and allowances for generator efficiency and availability. This scheme has the biggest difference in energy outputs between the current and previous study.
13
4
5
6
7
89
10
1
4
5
6
9
1112
1314
15
16
1718
19
2021
13
4
56
7
8 910
11 12
13
14
15
16
1718
19
20
21
0
10
20
30
40
50
60
70
80
90
4.0 4.5 5.0 5.5 6.0 6.5 7.0 7.5 8.0 8.5
Energy output (GWh/yr per km
2)
Mean tidal range (m)
Ebb‐only conventional
Dual mode conventional
Dual mode Rolls‐Royce

Tidal Resource Modelling – D01 Tidal Resource Characterisation
B&V Team Page 93 of 148
The previous energy outputs for the Severn Outer and Thames were scaled based on adjusted turbine numbers so it is unsurprising that there are some differences in the modelled energy output.
There is a mean difference of +10% between the energy outputs in this study and those from previous studies. However, if the previous study energy outputs are adjusted so that 100% availability is assumed, the mean difference becomes:
+3% if no adjustment is made to the Mersey energy output (as the availability assumption used is not known); or
0% if the Mersey is excluded from the comparison. This suggests that, if the same assumptions about generator and turbine efficiency were used, the 0-d model for this study would give very similar energy output predictions to previous studies. Overall, once adjustments made for availability have been considered, the energy outputs derived by the 0-d model for this study correlate very well in comparison to previous studies.
Table 107 Comparison of energy outputs for selected ebb-only schemes Scheme This study Previous study
Ene
rgy
outp
ut
(TW
h/yr
)
Dif
fere
nce
from
pr
evio
us s
tudy
Ene
rgy
outp
ut
(TW
h/yr
)
Gen
erat
or
effi
cien
cy
Ava
ilab
ilit
y
Mod
el
Sou
rce
Solway Firth 12.10 +5% 11.50 97.5% 97.5% 0-d SF (2009) a Morecambe Bay 6.19 +12% 5.51 95.0%b 90.0% 0-d Joule (2009) Mersey 1.26 +20% 1.05 -c - 0-d Peel (2011) Dee 1.57 +16% 1.35 95.0% 90.0% 0-d Joule (2009) Severn Outer 28.91 +14% 25.30d - - - DECC (2008) Severn Cardiff-Weston 18.83 +3% 18.30 97.5% 100.0% 2-d DECC (2010c) Thames 1.13 +3% 1.10e 95.0% 90.0% 0-d Baker (1991) Wash 5.09 +9% 4.69 95.0% 90.0% 0-d Baker (1991) Humber 2.21 +10% 2.01 95.0% 90.0% 0-d Baker (1991) Notes:
a) SF (2009) refers to the study by Halcrow, Mott MacDonald and RSK b) Joule (2009) used 80% maximum turbine efficiency to approximate effect of 95% generator
efficiency and 90% availability c) No details of assumed generator efficiency and availability given in Mersey Tidal Power
study reports d) Energy estimate for Severn Outer was scaled from earlier estimates without using modelling e) Energy output for Thames taken by reducing value in Baker (1991) by 20% to account for
new alignment with fewer turbines 5.23 Likely differences in predicted energy output between the 0-d model and the CSM
The energy outputs predicted by the 0-d model (as described in this report) and the CSM will not be the same. To some extent this could be due to interactions between schemes around the UK and

Tidal Resource Modelling – D01 Tidal Resource Characterisation
B&V Team Page 94 of 148
establishing this is part of the purpose of this study. There are other reasons for the likely differences in energy outputs, as described below. In the 0-d model, the effect of the barrage/lagoon on downstream sea levels is either disregarded or crudely represented by reducing the amplitude of the tidal constituents but retaining a sinusoidal profile. As a 2-d model, the CSM will represent:
The effect of flow through the turbines/sluices on downstream sea levels, both on the tidal range and profile. The effect of a scheme is likely to be proportional to its size (in impounded area and turbine numbers). The largest schemes are for dual mode on the Solway Firth, Severn Outer and Cardiff-Weston.
The constriction on flows entering/exiting the turbines caused by shallow sea bed levels or a narrow estuary. The barrage locations with areas of shallow sea beds close to the alignment are the Dee, Mersey and Morecambe Bay. The lagoon sites were chosen to avoid turbines discharging into shallow water.
Variable water levels within large impounded basins rather than assuming a flat water level, as the 0-d model does. Water level variation will be greatest for barrages across relatively long estuaries (the Mersey, Severn, Thames and Humber) but should be relatively small for wider estuaries or lagoons.
We believe the greatest two-dimensional hydrodynamic effect, and therefore possible reduction in energy output when tested in the CSM, is likely to be for the following locations:
Dee – the estuary is shallow with sand banks and intertidal areas both upstream and downstream of the barrage; these are likely to constrict flows from the turbines on both phases of the tide. There is no deep water channel linking the estuary to the open sea.
Mersey – the barrage alignment is not at the estuary mouth so the relatively narrow channel width constrains flows leaving the barrage on the ebb tide. There are intertidal areas a short distance upstream of the barrage that will obstruct flows entering the basin on the flood tide.
Morecambe Bay – there is a relatively narrow deep water channel (the Lune Deep) but there are shallow, intertidal areas just inside the remaining part of the alignment, which may constrict flows entering the basin on the flood tide.
Results from previous studies that have used 2-d modelling for energy yield analysis help to inform the likely magnitude of changes in energy output. Although only two such studies are available, Severn Tidal Power (DECC, 2010c) and Joule (2009), these studies cover the locations where 2-d effects are likely to be largest. In the Severn Tidal Power study, 1-d and 2-d models were used to assess energy output. The results are presented in Table 108. The 1-d model was based on the same formulations as the 0-d model used in this study but does represent to some extent the effect of barrages/lagoons on downstream tide levels. In the 1-d model, flow from the turbines and sluices is distributed across the whole estuary width, rather than constrained to the turbine/sluice caissons as in a 2-d model. This means that a 1-d model can underestimate losses caused by shallow sea bed levels near the turbine caissons. The results in Table 108 show that:
For most of the ebb-only cases the energy output is greater in the 2-d model (by 2 to 15%). The exception is the Beachley barrage where the 2-d model energy output is 17% lower because there is greater resistance to water draining away from the basin than in the 1-d model.
The 2-d model gives lower energy outputs in all three dual mode cases. For Cardiff-Weston and Bridgwater Bay the difference is only about 10% but for Welsh Grounds the difference is much larger at 42%. Again this is due to very high velocities in the turbine discharge zone,

Tidal Resource Modelling – D01 Tidal Resource Characterisation
B&V Team Page 95 of 148
caused by shallow water depths. The dual mode schemes tested all had significantly more turbines than the equivalent ebb-only scheme.
Table 108 Summary of energy outputs from the Severn Tidal Power
Location Mode
Turbines Sluices Energy output
(TWh/yr) Change in
energy output No. Size
(MW) No. 1-d 2-d
Cardiff-Weston Ebb 216 40 166 18.0 18.3 2%Cardiff-Weston Dual 288 30 125 19.1 17.3 -9%Shoots Ebb 30 35 42 2.9 3.1 5%Beachley Ebb 50 12.5 26 1.8 1.5 -17%Welsh Grounds Ebb 40 25 34 2.8 3.0 8%Welsh Grounds Dual 84 25 0 5.9 3.4 -42%Bridgwater Bay Ebb 108 25 41 3.7 4.3 15%Bridgwater Bay Dual 144 25 0 7.1 6.2 -12%
It is not straightforward to directly compare the published 0-d and 2-d energy outputs from the Joule study as often results were not reported for identical scenarios in both models (due to differences in number of turbines, turbine unit capacity and number of sluices). The schemes were tested simultaneously so some of the differences may also be due to interactions between schemes in the 2-d model. Table 109 compiles results from the 2-d model with the closest equivalent from the 0-d model. Two 0-d model energy outputs are shown where results are available: the maximum output achieved by optimising the turbine generating start delay, and the output using the same start delay as used in the 2-d model. This allows the difference due to using a 2-d model to be separated from the effect of different delay times. The delay times used and percentage change in energy output are also listed in Table 109. The percentage change in energy is shown in italics when either the energy output has been interpolated/extrapolated from other results; or the number of sluices used is not the same in both cases. Note that although Joule referred to turbine numbers as 1xDoEn and 3xDoEn (in reference to the tidal power schemes studied for the Department of Energy in the 1980s) there is some variability in turbine numbers used within these categories. The change in energy outputs in Table 109 have been summarised in Table 110. In terms of turbine start delay, Table 109 and Table 110 show that:
Using a fixed turbine start delay had a relatively small effect on the predicted energy output for ebb-only and dual mode schemes with 1xDoEn turbines (0 to 12% reduction in energy output).
A fixed turbine start delay had a much greater effect for the 3xDoEn schemes (ebb or dual mode). For example, the energy output in dual mode reduces by 51% for Morecambe Bay and 58% for the Mersey.
Further optimisation of turbine start delay is possible than that undertaken by Joule. If the start delay is varied based on high and low water level (as in this current ETI study), the energy output could potentially be increased further. The differences in predicted energy output between the 0-d and 2-d models remains large for many of the schemes, even when the same start time delay is used. The change in energy output when moving

Tidal Resource Modelling – D01 Tidal Resource Characterisation
B&V Team Page 96 of 148
from 0-d to 2-d (both with fixed start delay) is in the range -49% to +32%, with an overall average decrease in energy output of 20%. The loss of energy when moving to 2-d modelling is greater for the schemes with large numbers of turbines (3xDoEn), although this is partly because sluices were not included in these 2-d model runs. There is a large reduction in energy output in the 2-d model for the Solway Firth with 3xDoEn turbines, even though this estuary has deeper water than the other three.
Table 109 Summary of energy outputs from the Joule study
* For Mersey 23MW turbines used for 0-d model and 24MW turbines used in 2-d model (according to report)
2d
No.
Unit capacity (MW) No.
Delay - opt.
Delay - fixed
Delay - fixed
Delay - opt.
Delay - fixed
0d fixed - 0d opt.
2d fixed - 0d fixed
1xDoEn 180 40 200 8.44 8.44 9.66 2.00 2 0% 14%540 40 0 7.88 2 -30%540 40 200 12.90 11.24 3.24 2 -13%180 40 200 6.97 6.88 6.82 0.64 1 -1% -1%180 16 200 7.78 7.53 0.48 1 -3%540 16 200 17.84 15.69 1.80 1 -12%540 40 0 9.78 1 -30%540 40 200 16.17 13.89 1.90 1 -14%80 50 140 5.98 2 20%90 50 140 5.18 5.17 2.22 2 0%
120 50 140 5.83 5.70 2.60 2 -2%120 16 140 5.51 5.46 1.62 2 -1%180 50 140 6.64 6.05 3.10 2 -9%240 50 0 3.34 2 -43%360 50 140 7.55 5.35 3.78 2 -29%80 50 140 3.99 1
120 50 140 5.24 5.20 1.28 1 -1%120 16 140 5.75 5.72 0.82 1 -1%240 50 0 7.02 1 32%360 50 140 10.00 4.89 2.76 1 -51%360 16 140 11.45 6.40 2.26 1 -44%
1xDoEn 27 23* 18 1.07 1.05 0.57 2.34 2 -2% -46%54 23 18 1.33 1.07 3.32 2 -20%56 23* 0 0.55 2 -49%
1xDoEn 27 23 18 0.98 0.94 0.74 1.56 1 -4% -21%54 23 18 1.46 0.94 2.44 1 -36%56 23* 0 0.72 1 -23%81 23 0 1.72 0.73 2.90 1 -58%40 21 40 1.35 1.31 2.56 2 -3%50 21 40 1.45 1.32 0.89 2.94 2 -9% -33%
140 21 40 1.72 3.86 2150 21 0 1.17 240 21 40 1.30 1.14 1.86 1 -12%50 21 40 0.80 1 -35%
100 21 20 2.07 1.67 2.87 1 -19%120 21 20 2.21 3.03 1140 21 20 2.31 3.20 1150 21 0 1.46 1
3xDoEn
1xDoEn
3xDoEn
Location Mode Name
1xDoEn
3xDoEn
3xDoEn
3xDoEn
1xDoEn
3xDoEn
1xDoEn
3xDoEn
1xDoEn
3xDoEn
0dEnergy output (TWh/yr) Turbine start
delay (hours)Change in energy
outputTurbines Sluices
Solway Firth
E
D
E
D
E
D
Dee
Mersey
Morecambe Bay
E
D

Tidal Resource Modelling – D01 Tidal Resource Characterisation
B&V Team Page 97 of 148
Table 110 Effect of fixed delay and 2-d modelling on energy output in Joule study
Change in energy output Using fixed delay Using 2-d model
Number of turbines Lower Mean Upper Lower Mean Upper
1xDoEn -12% -3% 0% -46% -14% 20%3xDoEn -58% -28% -9% -49% -24% 32%
In summary, the results from the Severn Tidal Power and Joule studies indicate that there can be considerable variability between energy outputs from 0-d, 1-d and 2-d models. In extreme cases, with large numbers of turbines discharging into shallow water, the energy output can be up to 50% lower in the 2-d model. Overall, it appears likely that the schemes operating in dual mode with conventional turbines are likely to have lower energy output in the CSM than predicted by the 0-d model. The impact of a shallow sea bed in the turbine discharge zone on energy output was noted in Section 4.5.4.3. As an attempt to mitigate this, maximum turbine numbers were limited for each alignment based on bed depths and potential maximum velocities. This meant that for dual mode with conventional turbines:
No scheme was selected for the Morecambe Bay, Severn Cardiff-Weston, Thames and Humber barrages.
Only 25 turbines were selected for the Mersey (compared to a maximum of 56 in the Joule 2-d model).
Only 60 turbines were selected for the Dee (compared to a maximum of 150 in the Joule 2-d model).
Turbine numbers were limited for the Severn Outer, Wash and Dee-Wirral. As mentioned in Section 5.2, it is possible that high velocities from the turbines would lead to scouring, removing material and lowering the bed. This would then increase the energy output for the scheme. This gives two options when representing the schemes in the CSM:
1. Use the existing bathymetry in the CSM, which may underestimate the energy output in the long-term, if scouring occurs.
2. Artificially modify the bathymetry in the CSM to represent possible effects of scouring and/or dredging, which may overestimate the energy output in the short-term.
The extent and timescale of scouring is highly uncertain. In addition, the areas affected most (Morecambe Bay, Mersey and Dee) all have environmental designations making removal of intertidal areas highly undesirable, whether deliberately through dredging or over time through turbine operations. As such, the CSM will be based on existing bathymetry except where dredging is required along the impoundment line itself. Comparing the 0-d and CSM energy outputs will identify whether shallow beds are constraining the energy outputs, which could be investigated further with additional scenario testing. Maximum discharges are much lower for Rolls-Royce turbines than with conventional turbines. This means that the performance of Rolls-Royce turbines should not be as sensitive to shallow bed levels. Rolls-Royce turbines have not been tested in a 2-d model previously, and the selected schemes involve very high numbers of turbines, so it is possible that energy outputs may fall significantly from those predicted by 0-d modelling (as for conventional turbines).
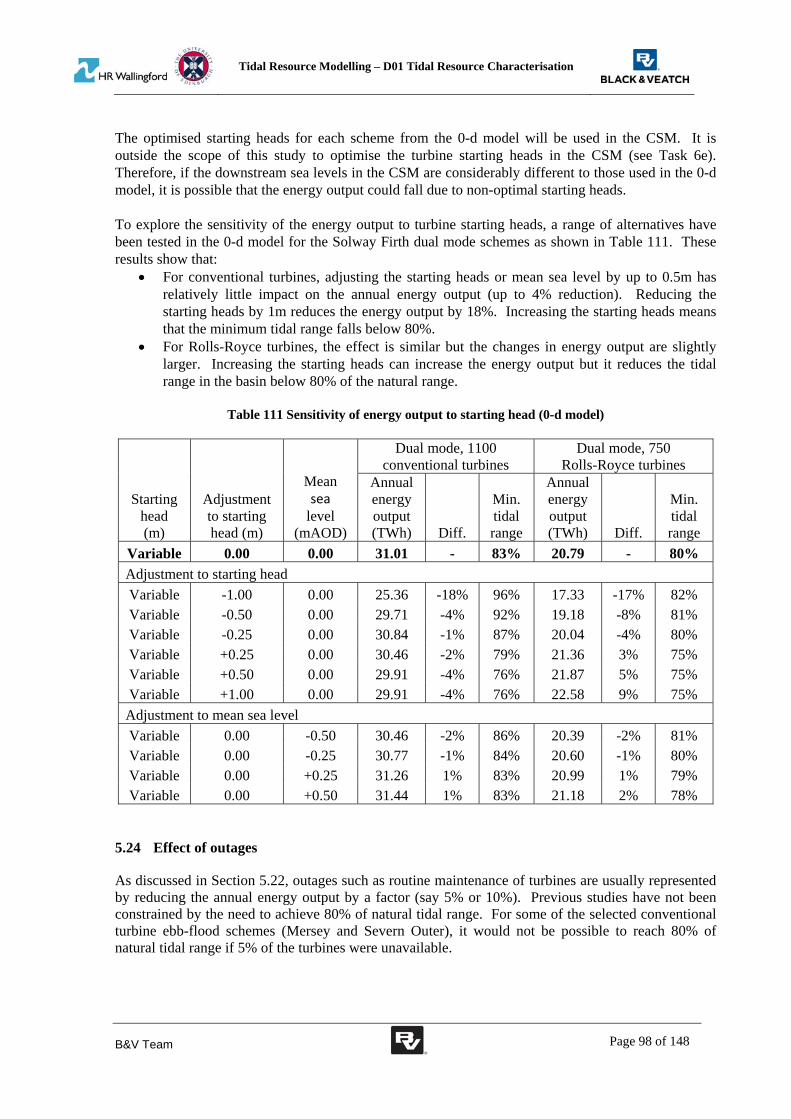
Tidal Resource Modelling – D01 Tidal Resource Characterisation
B&V Team Page 98 of 148
The optimised starting heads for each scheme from the 0-d model will be used in the CSM. It is outside the scope of this study to optimise the turbine starting heads in the CSM (see Task 6e). Therefore, if the downstream sea levels in the CSM are considerably different to those used in the 0-d model, it is possible that the energy output could fall due to non-optimal starting heads. To explore the sensitivity of the energy output to turbine starting heads, a range of alternatives have been tested in the 0-d model for the Solway Firth dual mode schemes as shown in Table 111. These results show that:
For conventional turbines, adjusting the starting heads or mean sea level by up to 0.5m has relatively little impact on the annual energy output (up to 4% reduction). Reducing the starting heads by 1m reduces the energy output by 18%. Increasing the starting heads means that the minimum tidal range falls below 80%.
For Rolls-Royce turbines, the effect is similar but the changes in energy output are slightly larger. Increasing the starting heads can increase the energy output but it reduces the tidal range in the basin below 80% of the natural range.
Table 111 Sensitivity of energy output to starting head (0-d model)
Starting head (m)
Adjustment to starting head (m)
Mean sea
level (mAOD)
Dual mode, 1100 conventional turbines
Dual mode, 750 Rolls-Royce turbines
Annual energy output (TWh) Diff.
Min. tidal range
Annual energy output (TWh) Diff.
Min. tidal range
Variable 0.00 0.00 31.01 - 83% 20.79 - 80%
Adjustment to starting head
Variable -1.00 0.00 25.36 -18% 96% 17.33 -17% 82% Variable -0.50 0.00 29.71 -4% 92% 19.18 -8% 81% Variable -0.25 0.00 30.84 -1% 87% 20.04 -4% 80% Variable +0.25 0.00 30.46 -2% 79% 21.36 3% 75% Variable +0.50 0.00 29.91 -4% 76% 21.87 5% 75% Variable +1.00 0.00 29.91 -4% 76% 22.58 9% 75%
Adjustment to mean sea level
Variable 0.00 -0.50 30.46 -2% 86% 20.39 -2% 81% Variable 0.00 -0.25 30.77 -1% 84% 20.60 -1% 80% Variable 0.00 +0.25 31.26 1% 83% 20.99 1% 79% Variable 0.00 +0.50 31.44 1% 83% 21.18 2% 78%
5.24 Effect of outages
As discussed in Section 5.22, outages such as routine maintenance of turbines are usually represented by reducing the annual energy output by a factor (say 5% or 10%). Previous studies have not been constrained by the need to achieve 80% of natural tidal range. For some of the selected conventional turbine ebb-flood schemes (Mersey and Severn Outer), it would not be possible to reach 80% of natural tidal range if 5% of the turbines were unavailable.
Tidal Resource Modelling – D01 Tidal Resource Characterisation
B&V Team Page 99 of 148
It perhaps makes more sense to allow for outages by increasing the number of turbines that are installed by a factor where this is practical, though the number tested in the CSM should not be increased to ensure representative operating conditions are considered in the CSM and in the cost of energy model (deliverable D04). 5.25 Challenges for build and operation
The number of turbines necessary for some of the dual generation schemes is very high. For example, the number of turbines for the Severn Cardiff-Weston ebb-only scheme (216) was considered to be at the upper limit for global manufacture in previous studies. In comparison, the dual generation conventional turbine selections for the Severn Outer (875 turbines) and Solway Firth (1100 turbines) are much larger. This calls into question the feasibility of the largest dual generation schemes, although given enough incentives (and potentially a long-term roll out of the different sites) such manufacturing requirements should not be insurmountable. Much of the challenge for manufacturers is (according to Rolls-Royce) in the supply chain, particularly if composite turbine blades are required. A related issue is that the large number of turbines for these schemes means that the maximum power output is extremely high – 15.75GW for the Severn Outer and 19.8GW for the Solway Firth (again as a comparison the Cardiff-Weston ebb-only scheme has a maximum output of 8.64GW). These massive spikes in power during generation from no power output during hold periods pose considerable challenges to integrating the power output into the UK distribution network. One benefit of using Rolls-Royce turbines is that they give a longer period of generation and lower maximum power output. The number of turbines required for the largest schemes remains very high. 5.26 Combinations of options within the same estuary
The only selected schemes that enclose other possible schemes are the Severn Outer barrage and the Dee-Wirral lagoon. With an ebb-only Severn Outer barrage the Rhoose lagoon, Cardiff-Weston barrage and Bridgwater Bay lagoon would not work effectively. This is because the Severn Outer barrage would reduce the impounded tidal range and hence the tidal range at the enclosed schemes by about 50%. The reduction in energy output would be even larger than 50% for these schemes. With dual mode operation and conventional or Rolls-Royce turbines for the Severn Outer barrage, the tidal range within the basin should be at least 80% of natural tidal range. As the impounded tidal range remains comparatively large, the Cardiff-Weston barrage and Bridgwater Bay lagoon could still produce a significant energy output. However, the energy output for all three schemes together would be compromised and the total output may be less than or comparable to the output from the Severn Outer barrage alone. In addition, the tidal range within the inner basins is likely to fall below 80% of the natural range. The operation of the barrages/lagoons would be very complex but could potentially allow generation to last for longer in the tidal cycle, especially if combined with pumping. Embedded combinations of options may be more feasible using Rolls-Royce turbines since the tidal regime within the basin is closer to the natural tidal cycle. Note that the West Aberthaw and Rhoose lagoons are not possible in combination with the Severn Outer barrage because the full width of the Outer alignment is needed for turbines and the lagoons would prevent this. The opposite is also true – constructing the West Aberthaw or Rhoose lagoons first would prevent subsequent installation of a dual mode operation Severn Outer barrage along the Minehead to Aberthaw alignment.

Tidal Resource Modelling – D01 Tidal Resource Characterisation
B&V Team Page 100 of 148
The situation is similar for the Dee-Wirral lagoon and Dee estuary barrage. An embedded dual mode barrage may work to some extent but there is likely to be a large energy penalty and reduced tidal range within the Dee estuary. For the reasons described above, we recommend that embedded schemes involving the Severn Outer barrage and Dee-Wirral lagoon are not considered for scenario testing in deliverable D03. An example of how a barrage/lagoon within an outer barrage might operate is shown in Figure 27. This shows how generating head and hence power output from the outer barrage is compromised by water being drawn into the inner basin on the flood tide and released on the ebb tide. This in turn reduces the tidal range in the inner basin. A large inner basin (such as the Cardiff-Weston barrage) will have the greatest effect on the operation of an outer barrage.
Figure 27 Example of embedded barrage within an outer barrage 5.27 Prediction of installed capacity and energy output for other lagoon locations
The results for dual mode generation with conventional turbines at tidal barrages /lagoons presented in Section 5.19 and Figure 26 provide a way of initially estimating the installed capacity and annual energy output for any barrage /lagoon site, given the mean tidal range and impounded area. Trendlines have been fitted to the results as shown in Figure 28. For capacity, only the results for lagoons have been used to derive the trendline because the capacities used for barrages are often constrained by alignment length/depth. For energy output, all the results have been used to derive the trendline. This yields the following equations, with the third equation (c) derived by combining equations (a) and (b):
Time
Sea level
Outer basin level
Inner basin level
Outer basin power
Inner basin power
mean sea level

Tidal Resource Modelling – D01 Tidal Resource Characterisation
B&V Team Page 101 of 148
(a)
9 29 (r-squared = 0.89)
(b) 1850 450 (r-squared = 0.94)
(c) 16650 54100
where C is the installed capacity (in MW), A is the impounded basin area (in km2), R is the tidal range (in m) and E is the annual energy output (in MWh/yr). These equations could be used to provide an initial indication of turbine capacity and annual energy output for a potential site without extensive testing using a 0-d energy model. The equations were derived assuming there is no physical constraint on the installed capacity that is possible. If the alignment width/depth constrains the installed capacity, the maximum installed capacity possible could be used in equation (b) to derive an estimate of the annual energy output. Lagoons follow the trend lines closely. Barrages, especially those with limited length (Mersey, Dee, Severn Outer and Wash) have less than the predicted capacity. By contrast the Solway which has ample deep water length follows the trend line closely.
Figure 28 Predicting installed capacity and energy output for lagoons (with conventional turbines)
0
5
10
15
20
25
30
35
40
45
50
4.0 5.0 6.0 7.0 8.0 9.0
Installed capacity/area (M
W per km
2)
Mean tidal range (m)
Lagoons
Barrages
Trendline
C/A = 9R ‐ 29
0
10,000
20,000
30,000
40,000
50,000
60,000
70,000
80,000
90,000
0 10 20 30 40 50
Energy output/area (M
Wh/yr per km
2)
Installed capacity/area (MW per km2)
All sites
Trendline
E/A = 1850C/A ‐ 450

Tidal Resource Modelling – D01 Tidal Resource Characterisation
B&V Team Page 102 of 148
6 TIDAL RANGE KEY FINDINGS
Previous studies of UK tidal power have focussed on ebb-only generation, as this was generally believed to be likely to be the most economic in terms of CoE and importantly minimises the absolute quantum of the capital costs (which have been an important constraint on large-scale barrage development). With this mode of operation, the tidal range within the impounded basin is generally around 50% of the natural range, which has in turn caused environmental issues to be a constraint on development. To increase the range inside the basin requires additional turbines and sluices. Often there is insufficient deep water in estuaries to achieve this using conventional bulb turbines (as these require a relatively deep submergence to avoid cavitation), at least along the previously specified alignments. However, in some cases, it may be possible and worthwhile to dredge alignments to achieve such an approach. Rolls-Royce turbines do not require as much submergence as conventional turbines and so a lack of deep water (in the natural condition) is less of a constraint.
The assumptions built into the 0-d model used in this study predict around 10% extra energy compared with previous studies of the same scheme that have generally also been obtained with a 0-d model. This increase is explained by the different treatment of machine outages in this study and partly because turbine efficiency has been enhanced since the 1970s.
If there is sufficient deep water to install enough turbines to achieve 80% of natural tidal range, the energy output from dual mode (ebb-flood) operation is likely to be significantly greater than for ebb-only operation. The optimisation of dual mode generation to achieve a particular tidal range constraint, particularly when using optimised starting heads, appears to be novel, and has not been considered for most existing schemes.
Although dual mode operation can meet the ETI’s specified tidal range constraints, and generally has a much greater energy output, the number of turbines required may mean that the economics are less attractive compared to the previously well-studied ebb-only schemes (although this does not appear to be the case for all schemes and it appears that the economics of some schemes may be improved when optimisation is fully implemented). However, the required number of turbines may be a constraint, although given enough incentives (and potentially a long-term roll out of the different sites) such manufacturing requirements should not be insurmountable. Perhaps more of an issue may be that the maximum power generated by such dual mode schemes using traditional bulb turbines is much greater, and therefore the grid reinforcement for such schemes may be prohibitive, although the Rolls-Royce turbines mitigate this to some extent by operating for longer at lower maximum output.
A relatively sophisticated energy/cost proxy has been developed to assess the relative CoE between schemes to inform the scenario modelling. However, this is no substitute for using the CoE model developed under D04. Given the relatively novel approach of imposing a tidal range constraint and the importance of the optimisation of dual mode schemes, further work (which is beyond the scope of this entire project) using a combination of the CoE model from D04 and the CSM outputs could inform a relatively accurate assessment of the UK’s optimal tidal range deployments in terms of locations, technology and capacity characteristics, and cost, and hence derive an overall resource-cost curve for UK tidal range implementation.
In terms of energy output (relative to the cost of turbines, embankment and locks), the best location for a scheme is a large barrage on the Severn (either at the Cardiff-Weston or Outer alignment) followed by Bridgwater Bay lagoon, Solway Firth barrage, Morecambe Bay barrage and Dee barrage. The Severn schemes appear significantly more economic than others, which matches previous literature.
Some schemes are only possible with Rolls-Royce turbines, assuming that significant dredging is not undertaken and that the 80% tidal range constraint is fully imposed. These include Morecambe Bay, Severn Cardiff-Weston, Thames and the Humber. However, it could be that these alignments could be possible and similarly economic using conventional

Tidal Resource Modelling – D01 Tidal Resource Characterisation
B&V Team Page 103 of 148
turbines and extensive dredging outside of the turbine caissons. The Rolls-Royce turbines appear to be most competitive (comparatively) at the Mersey.
Lagoons are inevitably more costly than barrages in the same location because they need a longer embankment. Larger lagoons are more efficient than smaller ones, as expected.
Effective turbine operation in dual mode with conventional turbines is sensitive to the starting heads that are used. The starting heads selected based on 0-d model results potentially may not operate as desired when implemented in the CSM because of two-dimensional hydrodynamic effects. This could cause the predicted energy output to fall significantly, without further optimisation within the CSM (which is beyond the scope of this entire project).
Two-dimensional effects not represented in the 0-d model testing in this report may reduce the annual energy output for the selected schemes. These 2-d effects will be greatest where the flow of water away from the turbines is hampered by a shallow sea bed (such as the Dee estuary), a narrow deep water channel (such as the Mersey estuary or at Morecambe Bay), or in an estuary that has strong longitudinal gradients in tidal range (such as the Severn). The CSM will also represent the effect of schemes on downstream sea levels and interactions between schemes, which are not represented in the 0-d model.
An initial high level estimation of energy output for barrages (assuming no turbine constraints) and lagoons may be obtained by applying simple (derived) equations based on the tidal range and impounded area at a site, avoiding the need to undertake 0-d modelling at very early development stages. Further work could potentially incorporate a simplified costing approach to derive an initial high level CoE estimation for any site to allow automated searching (using a GIS system) of potential development sites based on minimising CoE.

Tidal Resource Modelling – D01 Tidal Resource Characterisation
B&V Team Page 104 of 148
7 TIDAL RANGE CONCLUSIONS AND RECOMMENDATIONS
This report characterises the UK tidal range resource. A total of 46 possible schemes have been selected for potential scenario development. Three combinations of operational mode and technology are selected:
Ebb-only generation with conventional bulb turbines; Dual (ebb-flood) generation with conventional bulb turbines; and Dual generation with Rolls-Royce very low head turbines.
Previous studies of tidal range schemes have generally focussed on ebb-only generation. These ebb-only schemes have insufficient installed turbine and sluice capacity to maintain 80% of natural tidal range within the impounded basin. Despite this, ebb-only operation has been included for barrage schemes (but not lagoons) to enable direct comparison with previous tidal power studies. If the installed capacity is sufficient to maintain 80% of natural tidal range, dual generation with conventional turbines is likely to give significantly greater annual energy yield. Rolls-Royce turbines are designed for operation in dual generation mode only and do not require as much submergence as conventional turbines and so a lack of deep water (in the natural condition) is less of a constraint. The optimisation of dual mode generation to achieve a particular tidal range constraint, particularly when using optimised starting heads, appears to be novel, and has not been considered for most existing schemes. Using the turbines for pumping to help fill and/or drain the basin could potentially increase the total energy yield and will increase the impounded tidal range to some extent. Pumping has not been included in the tidal range scenario development for this study. It adds considerable complexity to the operation of a scheme, whilst potentially delivering only a relatively small energy increase. It is a refinement that should be considered in detailed studies of individual schemes but it is not necessary for this UK-wide study. Potentially feasible locations for tidal range schemes that could give peak power output greater than 100MW have been identified giving:
10 barrage alignments – selected based on a literature review of previous studies; and 11 lagoon alignments – selected based on the tidal range, water depth and coastline shape.
The lagoon alignments chosen are a selection of the potential alignments that could be selected on each suitable length of coastline. The scheme selections (number of turbines, size and capacity of turbines, number and size of sluices) are based on an appropriate previous study for barrages and simple 0-d modelling for lagoons. The 0-d modelling shows good correlation with previous literature. A relatively sophisticated energy/cost proxy has been developed to assess the relative CoE between schemes to inform the scenario modelling. However, this is no substitute for using the CoE model developed under D04. The optimum location for a scheme (in terms of CoE) is likely to be a large barrage on the Severn (either at the Cardiff-Weston or Outer alignment) followed by Bridgwater Bay lagoon, Solway Firth barrage, Morecambe Bay barrage and Dee barrage. The Severn schemes appear significantly more economic than others, which matches previous literature. There is insufficient deep water along five of the barrage alignments to install enough turbines for a dual generation mode with conventional bulb turbines to achieve 80% of natural tidal range without extensive dredging. In these cases, dual mode selection with conventional turbines has not been made. These sites include Morecambe Bay, Severn Cardiff-Weston, Thames and the Humber. However, it could be that these alignments could be possible and similarly economic using conventional turbines and dredging. The Rolls-Royce turbines appear to be most competitive

Tidal Resource Modelling – D01 Tidal Resource Characterisation
B&V Team Page 105 of 148
(comparatively) at the Mersey. For the Duddon estuary, there is no deep water channel so no selection has been made. The schemes outlined in this report should be used as the basis for the development of the scenario modelling (D03). The CSM’s proposed extensive coverage around the UK and surrounding waters, and its proposed open boundary location in deep water beyond the continental shelf, is (based on previous modelling experience of large scale barrages) sufficient to ensure that all significant impacts of these schemes are included in the model. One method for validating this at a later date (once the CSM is built) is to review the impacts of the schemes on the open boundaries. Given the relatively novel approach of imposing a tidal range constraint and the importance of the optimisation of dual mode schemes, further work (which is beyond the scope of this entire project) using a combination of the CoE model from D04 and the CSM outputs is recommended to inform a relatively accurate assessment of the UK’s optimal tidal range deployments in terms of locations, technology and capacity characteristics, and cost - and hence derivation of an overall resource-cost curve for the potential of large-scale and widespread tidal range implementation in the UK. An initial high level estimation of energy output for barrages (assuming no turbine constraints) and lagoons may be obtained by applying simple (derived) equations based on the tidal range and impounded area at a site, avoiding the need to undertake 0-d modelling at very early development stages. Further work could potentially incorporate a simplified costing approach to derive an initial high level CoE estimation for any site to allow automated searching (using a GIS system without any hydrodynamic modelling) of potential development sites based on minimising CoE. Alternatively, costing routines could be added to the CSM in a similar manner although this would probably require the use of the coarse resolution CSM as otherwise model run costs would escalate rapidly in use. The 0-d model used to develop some of these schemes is presented as part of this report, and should be readily usable by any suitably experienced modeller.

Tidal Resource Modelling – D01 Tidal Resource Characterisation
B&V Team Page 106 of 148
PART B: TIDAL CURRENT CHARACTERISATION
8 TIDAL CURRENT INTRODUCTION
8.1 Work package objective and deliverables
The objective of this work package is to review locations for tidal current farms based on previous studies (notably the Carbon Trust 2011 report referred to below) and list potential areas, water depth, extent, and estimated power and energy output for tidal farms that are considered viable. This information will provide the basis for the scenario modelling and will include:
Key assumptions and criteria used to develop the results;
Base case scenario and anticipated error bands to mitigate uncertainties and limitations;
Various scenarios to provide a summary of the possible range of results (sensitivity analysis).
8.2 Carbon Trust’s 2011 ‘UK Tidal Current Resource & Economics’ report
It should be noted that this report, as agreed in our scope of works, is substantially based on the Carbon Trust’s June 2011 ‘UK Tidal Current Resource & Economics’ report, prepared by Black & Veatch; hereafter referred to as the Carbon Trust (CT) 2011 report. This report is generally accepted as the most up to date report on the UK’s tidal current resource and is therefore used in this workpackage as the most reliable source of information for tidal current resource characterisation. Section 9.2.3.2 discusses the potential for variations to the technical methodology used, and the literature review (Appendix B) confirms the CT 2011 report is appropriate for this work. For further details on the results and discussion within the CT 2011 report please refer directly to it.

Tidal Resource Modelling – D01 Tidal Resource Characterisation
B&V Team Page 107 of 148
9 TIDAL CURRENT PROJECT DESIGN/METHOD
9.1 Tidal Current Modelling Methodology Overview
The underlying hydrodynamic modelling used in the CT 2011 report and for this work package is essentially based on the far-field response of the tidal system with regard to the economic and environmental implications of widespread, large-scale TEC (tidal [current] energy converter) deployment. The approach adopted is to consider ideal representations of each of the (three) relevant hydrodynamic mechanisms which give rise to the tidal current conditions necessary for TEC deployment. These are: Hydraulic Current; Resonant Basin; and, Tidal Streaming. In all three tidal regimes, an upper theoretical limit was identified beyond which attempts to extract more energy from the system actually reduces the overall energy that is harvested. This indicates the existence of a theoretical extraction limit in a particular location using the TEC technology approach. Generic expressions were derived (Table 112), as part of the CT 2011 report, to allow the previous (2005) CT parametric national scale resource study to be updated, and arbitrarily prescribed limits for mid-range velocity and tidal range changes were then applied to allow the derivation of an update to the UK’s technical resource. The theoretical and technical resource equations are shown in Table 112. Table 112 Theoretical and Technical Resource equations courtesy of the CT 2011 report
Expression of theoretical limit of tidal current energy harvesting.
Expression of technical limit of tidal current energy harvesting.
Hydrodynamic response limiting energy harvesting.
Hydraulic current (HC)
olTheoretica agQP max2.0 oTechnical agQP max086.0
Velocity reduction
Resonant basin
(RES)
olTheoretica agQP max2.0 oTechnical agQP max033.0
Downstream tidal range
Tidal streaming
(TS) olTheoretica agQP max16.0 oTechnical agQP max020.0
Downstream tidal range
9.2 Tidal Current Characterisation of the tidal resource
9.2.1 Farm locations
The potential tidal current farm locations that should form the initial basis of the scenario modelling, and therefore the later CSM development requirements from the CT 2011 report are summarised in Table 113. The CSM should ideally have the ability to highlight new sites if applicable; however, it is important to define the known large-scale and viable sites in order to enhance the accuracy of the model for these sites, especially as these are likely to drive the interaction effects on other sites. The sites that have been selected are characterised by these generic criteria:
Mean sea level (MSL) of greater than 15m;
Mean annualised power density in excess of 1.5kW/m2;
Installed capacity: Farm rated power greater than 60MWp(1).
1 The scope of work states 100MWp. B&V suggested using 60MWp as this accounts for some potential error in the resource assessment. This approach was accepted by ETI prior to the detailed work commencing.

Tidal Resource Modelling – D01 Tidal Resource Characterisation
B&V Team Page 108 of 148
The UK tidal current sites derived from the CT 2011 report that were considered are summarised in Table 113; the sites shown in grey are the sites which do not meet the above installed capacity criteria (60MWp). The selection criteria and the results were sense checked by B&V and the UoE, and subsequently agreed as acceptable with the ETI and Rolls Royce (ETI Member). The CSM should ideally identify any new sites within the model domain based on these same criteria; although it will not be optimised in terms of grid resolution for any sites not identified prior to its creation. Maps of the sites in Table 113 can be found in Appendix C, these maps are courtesy of the CT 2011 report - Appendix C. Table 113 therefore provides an initial characterisation of the sites that should be considered for the scenario modelling work package and as the initial potential farm locations in the CSM. The sites selected account for c. 97.5% or c.7.8GWp of the total c. 8GWp of resource defined in the CT 2011 report. 9.2.1.1 Potential additional sites
B&V note that Rolls Royce highlighted Orkney Papa Westray as a potential site, which was also initially identified by Marine Scotland’s resource assessment (Marine Scotland & The Scottish Government, 2010); however, sufficiently robust data to characterise this site is not considered to be available at this stage (see the CT 2011 report for further details of this and other sites identified in previous studies (e.g. Dorus Mor, Eday Sound and Yell Sound East) which have not been considered at this stage). The sites for which the Crown Estate (CE) has issued Agreements for Lease (particularly in and around the Pentland Firth) should be considered by the scenario modelling work package in terms of 2020 deployment, and the CSM should be created such that its high resolution areas fundamentally cover all of these sites and those in and around the Pentland Firth. It may therefore be prudent for the scenario modelling work package to further split the Pentland Firth (and surrounding area) sites into these specified CE sites so that they can be appropriately modelled in the various CSM scenario runs.

Tidal Resource Modelling – D01 Tidal Resource Characterisation
B&V Team Page 109 of 148
Table 113 UK Tidal Current sites as identified in CT 2011 report Sites Type
of site
Area Mean Sea Level (MSL)
Farm rated power (BASE CASE)
AEP Total Technical Resource (BASE CASE)
AEP Total Practical Resource (BASE CASE)
CoE based on technical resource, no learning
km2 m MW GWh/y GWh/y p/kWh, dr15%
Pentland Firth Deep HC 66.0 62 2,525 10,067 6,431 17 Race of Alderney TS 15.3 31 626 2,253 1,595 26 Carmel Head TS 38.3 38 590 1,948 1,504 29 South Jersey TS 42.7 20 529 1,904 1,348 75 East Casquets TS 37.7 22 526 1,891 1,339 62 Pentland Firth Shallow HC 20.1 30 483 1,230 1,230 24 West Islay TS 25.4 31 411 1,164 1,046 36 North East Jersey TS 24.9 21 324 1,165 825 72 Islay / Mull of OA TS 17.0 37 318 869 811 25 Westray Firth TS 5.7 27 277 750 706 35 Bristol Channel - Minehead RES 11.9 30 170 633 433 34 North of N. Ronaldsay Firth TS 10.2 39 153 409 389 38 West Casquets TS 11.1 23 145 522 370 61 Ramsey Island TS 7.9 42 139 807 355 25 Mull of Kintyre TS 6.8 116 128 444 326 23 Isle of Wight TS 8.5 29 117 490 297 57 Mull of Galloway TS 7.6 29 104 306 264 59 South Minquiers (Jersey) TS 7.7 16 82 294 208 90 N. Ronaldsay Firth TS 5.7 17 75 399 191 74 Rathlin Island TS 3.6 102 65 172 166 25 Barry Bristol Channel RES 4.5 26 58 306 147 60 Strangford Lough HC 1.1 35 55 281 140 25 East Rathlin Sound TS 2.1 45 37 95 94 27 Bristol Channel - Mackenzie shoal
RES 1.1 22 32 273 82 40
Blue Mull Sound TS 0.7 35 23 60 58 21 Yell Sound - West Channel TS 1.4 30 25 66 64 32 Kyle Rhea TS 0.4 34 20 102 51 21 Big Russel TS 0.7 36 11 41 29 36 Portland Bill TS 0.6 29 7 44 19 61 Uwchmynydd TS 0.5 29 7 34 17 57
9.2.2 Cost of Energy (CoE)
Table 113 shows the CoE based on the technical resource assuming no learning rate. This information provides a direct comparison of the potential economics of the various sites under consideration; this has been provided for information only and does not affect or influence any other work package or the CSM model in any way. It is noted that the costs for shallow sites may be overstated as the device selected for shallow sites was a standard Horizontal Axis Axial (HAA) turbine solution – other devices more suited to very shallow water depths such as Pulse Tidal’s2 or Ocean Renewable Power Company’s3 concepts may be more applicable. The CT 2011 report incorporated an error band of -25% + 115% on the CoE, primarily driven by the uncertainty in the resource intensity..
2 http://www.pulsetidal.co.uk/ 3 www.oceanrenewablepower.com/

Tidal Resource Modelling – D01 Tidal Resource Characterisation
B&V Team Page 110 of 148
9.2.3 Technical Assumptions
The resource assessment completed as part of the CT 2011 report, the results of which are summarised in Table 113, is based on a number of assumptions; these assumptions have an inherent uncertainty built in to them which is captured in an error band analysis. B&V has reviewed these assumptions, and expanded on them where new information is available to provide the assumptions for this Tidal Resource Modelling project. 9.2.3.1 Resource data
The Marine Energy Atlas (MEA) provided the primary source of data for the 2011 CT 2011 report; B&V considered that this underlying data could be subject to an error band of -45% +20%. It should be noted that modelling of this error band is not required or used within this project because one of the main outcomes from this ETI project will be an updated and more highly resolved resource assessment model (the CSM). The CSM will improve the accuracy of the data and reduce this error band. 9.2.3.2 Theoretical and technical resource equations
The methodologies and assessment approach presented in the CT 2011 report is still viewed by B&V and UoE as the most advanced existing assessment of a national scale tidal current energy resource; however, to ensure this remains the case the most recent relevant literature has been reviewed to identify complementary or alternative approaches which may be considered to update the CT 2011 studies’ methodology. Therefore, UoE has completed a literature review (Appendix B) which focused on the most recent literature (since the CT 2011 report) relevant to the tidal current energy resource. The literature review concluded that, apart from the publications by Salter and MacKay discussed in the CT 2011 report, there does not seem to be any significantly different approach being disseminated in the literature. The approach used within the CT 2011 report, and therefore that proposed within this document, represents the main approach being adopted by other investigators in terms of how to incorporate energy harvesting into a numerical model and how to characterise tidal energy resource availability using simple analytical expressions. The main findings from the literature review that introduce uncertainty regarding the accuracy of the CT 2011 studies’ resource characterisation include:
Spatially diffuse source data and summary values from coarse numerical model outputs are not reliable for tidal current energy resource characterisation (this is well understood already and specifically mentioned in the CT 2011 report, hence the initiation of the current programme of high resolution work with the intent to increase confidence in predictions).
Open sea cases will be more sensitive to energy harvesting than ‘closed’ or bounded flow regions (the Tidal Streaming parameterisation in the CT 2011 report already captures some of this effect as it is the most conservative parameterisation value; however, as has been noted within the CT 2011 report, it represents an upper limit).
For large scale industry development, the potential for interaction between projects or farms exists. Even a seemingly minor alteration to the underlying tidal dynamics may have a significant impact on the economics of a particular development project/scenario (again, as discussed in the CT reports in 2005 and 2011).
In summary, no evidence was identified which would suggest that the CT 2011 approach, and thus the proposed approach for this work, should be changed.

Tidal Resource Modelling – D01 Tidal Resource Characterisation
B&V Team Page 111 of 148
It should be noted that the far higher resolution modelling (later) in this project will give a far greater insight into the extent of and the current velocities associated with the various tidal current sites highlighted as the key UK tidal current resource within this report; this may highlight significant differences from current knowledge (based on current resource modelling techniques such as those used for the CT 2011 Report). 9.2.3.3 Clearance of turbines
The clearance of turbines in the CT 2011 work was based on the EMEC standard; with a top clearance of 5m LAT and a bottom clearance of 25% of the depth applied. It is noted that the minimum rotor size considered was 10m and hence the top and bottom clearance for a 15m site does not meet this criteria; however, B&V would not expect that standard HAA technology would be used in these sites and this was intended to reflect a different approach (see the CT 2011 report for further details). The clearance will not be varied in this study (and the present IEC Tidal Resource Technical Specification remains based on the EMEC standard in this respect). 9.2.3.4 Spacing and number of turbines
The farm spacing in the CT 2011 report was also based on EMEC standards with a staggered spacing of 2.5d by 10d; this is directly equivalent to 1.25d by 20d, as suggested by the University of Southampton (Bahaj et al. 2007). This assumption remains the same in the present IEC Tidal Resource Technical Specification and was fixed as part of the CT 2011 report; however, B&V recommends that two sensitivities should be run for the scenario modelling aspect of the present work to provide better understanding of potentially significant site interaction effects:
Base case: 2.5d by 10d;
Optimistic case 1.25d by 10d;
Extreme case 1.25d by 5d.
B&V notes that the optimistic and extreme case are probably economically unrealistic for most actual farm deployments when wake effects and site restrictions due to bathymetry etc. are taken into account – they are intended to highlight the interactions between sites in an extreme (but technically possible) scenario. 9.2.3.5 Rated velocity and rotor diameter of turbines
It was assumed in the CT 2011 report that TEC developers would develop ‘classes’ of device as per other renewable energy sectors. Only two rated velocities and 5 diameters (10, 15, 20, 25, 30m) were used within the CT 2011 work, i.e. there are ten rated powers available. The rationale behind the two rated velocities is shown in Figure 29: one can clearly see two groups of sites emerging from the UK’s main potential sites: most sites feature a hub height Vmsp between 2.25m/s and 2.50m/s whereas other sites’ hub height Vmsp varies between 2.9m/s and 3.1m/s. The two sites that differ substantially from this are not considered within this analysis. It is considered that these assumptions are reasonable to carry forward for this assessment and therefore they are recommended for use in the scenario development work package and as a method to define the deployment of turbines within the CSM; however, it is noted that the HAA concept is not economic in very shallow water. The team notes that the hub height Vmsp may (later in this project) vary significantly across sites due to the improved resolution of the (later) modelling, which may affect the rated velocity for turbines; however, the team feels that the assumption (of 2 rated velocities) will remain valid based on the need for the industry to consolidate designs, and (in any case) this will not significantly impact the results.

Tidal Resource Modelling – D01 Tidal Resource Characterisation
B&V Team Page 112 of 148
Figure 29 Hub height Vmsp data by site (MEA data) courtesy of the CT 2011 Report
9.2.3.6 Economic constraints
A fundamental assumption of the CT 2011 report was the acceptable increase in CoE at each site due to velocity reductions caused by large-scale deployments, and feedback of this site specific economic constraint to the technical resource. In the CT 2011 report the base case CoE increase was selected at 20% with the pessimistic case 10% and optimistic 50%. This work does not explicitly need to account for economics; however, the CT 2011 report concluded that the economic constraint only affected Hydraulic Current sites, in this analysis only the Pentland Firth sites are bound by this constraint. The Pentland Firth sites account for approximately 26% of the UK resource (base case according to CT 2011 report), and optimising the annual energy production (AEP) at these sites by optimising the farm size increases the energy extracted to 13.1% of the total tidal energy in the system. The theoretical resource (maximum energy extractable) for these sites is 20% of the total tidal energy in the system. This analysis increases the UK total resource AEP to 39TWh/y (a 35% increase) and increases the Pentland Firth contribution to 50% (see section 9.2.3.7 for further detail). 9.2.3.7 Environmental acceptable velocity reduction constraints
The CT 2011 report considered that a 10% reduction in mid-range flow velocity is considered as the notional limit for environmental sensitivity as these systems are inherently accustomed to high variability in local tidal current velocity and should thus be relatively unaffected by small changes in mid-range velocities of the order of 10%. In the CT 2011 analysis, few sites are directly affected by this constraint (primarily the Pentland Firth). The CT 2011 report showed that increasing the allowable velocity reduction at the Pentland Firth to c. 18% effectively simulates the Pentland Firth unconstrained economic scenario as discussed in section 9.2.3.6. The following have therefore been considered for velocity reduction:
Base case 10%;
Pentland Firth Scenario: 18% (Pentland Firth only).
Hub height Vmsp (m/s) - from MEA data
2.0
2.5
3.0
3.5
4.0
Kyl
e R
hea
Str
angf
ord
Loug
h
Wes
tray
Firt
h
Pen
tland
Firt
h S
hallo
w
Blu
e M
ull S
ound
Pen
tland
Firt
h D
eep
Rac
e of
Ald
erne
y
Bris
tol C
hann
el -
Mac
kenz
ie s
hoal
Yel
l Sou
nd -
Wes
t C
hann
el
Isla
y /
Mul
l of
OA
Mul
l of
Kin
tyre
Wes
t Is
lay
Nor
th E
ast
Jers
ey
Ram
sey
Isla
nd
Sou
th J
erse
y
N.
Ron
alds
ay F
irth
Car
mel
Hea
d
Mul
l of
Gal
low
ay
Isle
of
Wig
ht
Bar
ry B
risto
l Cha
nnel
Rat
hlin
Isl
and
Nor
th o
f N
. R
onal
dsay
Firt
h
Uw
chm
ynyd
d
Bris
tol C
hann
el -
Min
ehea
d
Sou
th M
inqu
iers
(Je
rsey
)
Wes
t C
asqu
ets
Por
tland
Bill
Big
Rus
sel
Eas
t R
athl
in S
ound
Eas
t C
asqu
ets
Hu
b h
eig
ht
Vm
sp
(m
/s)

Tidal Resource Modelling – D01 Tidal Resource Characterisation
B&V Team Page 113 of 148
9.2.3.8 Environmental acceptable tidal range reduction constraints
The CT 2011 report considered that a 0.2m reduction in tidal range is considered a notional limit for environmental sensitivity. The maximum allowable tidal range alteration was then considered to be 0.1m in the pessimistic scenario and 0.5m in the optimistic scenario. The CT 2011 report also considered that it was possible that energy extraction might have a lesser impact on the tidal range for open sea sites than for narrowing channel sites. An unconstrained tidal range sensitivity should be considered to give an upper error band for energy extraction and therefore potential site interaction. On the other hand, energy extraction from open sea sites is likely to change local tidal flow patters more significantly, and reduce the tidal velocities through the farm more than would be expected for a narrowing channel, which could mean the economics are affected to a greater degree by energy extraction than that calculated in the CT 2011 generic methodology. The following have therefore been considered for tidal range:
Pessimistic: 0.1m tidal range;
Base case: 0.2m tidal range;
Optimistic case: 0.5m tidal range;
Extreme case: unconstrained;
9.2.3.9 Design constraints
The useful energy generation (from the total energy removed from the system) is obviously affected by the coefficients of performance for the turbines, which is a reasonably well understood area - at least for HAA turbines. However, there will also be losses from the presence of the structure in the form of drag; this could be reduced (and thus increase the overall useful energy generation from the same energy removal from the system) through the development of streamlined structures. A further area for consideration is how much energy is lost due to wake mixing. B&V recommends the following error bands/sensitivity for the scenario modelling, as used in the CT 2011 report: Structural drag:
Pessimistic: 25%;
Base case: 15%;
Optimistic: 5%.
Wake mixing loss: Pessimistic: 20%;
Base case: 10%;
Optimistic: 5%.
9.2.3.10 Deployment scenarios
UoE will use the information from this report as an input to their scenario modelling workpackage.

Tidal Resource Modelling – D01 Tidal Resource Characterisation
B&V Team Page 114 of 148
9.2.4 Practical constraints
The CT 2011 report identified a number of additional key constraints; over 100 potential constraints were considered and it was found that there were three main constraints that potentially impede development of commercial tidal current arrays: fishing, shipping and designated conservation sites. The overall probability of a site being developed (or partly developed) is the product of the above three probabilities for each site (fishing x Shipping x designated conservation sites). The results are presented in Table 114.
Table 114 Overview of practical constraints review Practical Constraints
Sites Site probability low Site probability base Site probability high
Pentland Firth Deep 100% 64% 41% Carmel Head 89% 77% 67% Race of Alderney 90% 71% 54% South Jersey 90% 71% 54% Pentland Firth Shallow 100% 100% 100% East Casquets 90% 71% 54% West Islay 96% 90% 84% North East Jersey 90% 71% 54% Islay / Mull of OA 98% 93% 88% Westray Firth 100% 94% 89% Bristol Channel - Minehead 79% 68% 58% North of N. Ronaldsay Firth 100% 95% 90% West Casquets 90% 71% 54% Ramsey Island 84% 44% 8% Mull of Kintyre 90% 73% 57% Isle of Wight 82% 61% 43% Mull of Galloway 92% 86% 80% South Minquiers (Jersey) 90% 71% 54% N. Ronaldsay Firth 90% 48% 9% Rathlin Island 100% 96% 92%
The sites highlighted in green in Table 114 had no data available for the CT 2011 report and subsequently have been accounted for as an average of the other sites. 9.2.5 Constraints not previously considered
The practical constraints discussion in section 9.2.4 does not include a number of potentially important constraints:
a. Grid connection/accessibility: This is considered an important constraint but, although an option for this was proposed, it is not included in the scope of work. Therefore, it should not be considered in any scenario modelling.
b. Wave constraints: Some sites have relatively intense wave climates, which will make near-term deployment less likely. This should be considered in the scenario modelling timescales.
c. Tidal range project interaction constraints: There may be interactions between tidal range and current project developments. This is not accounted for at this stage, as it is an output of the (later) work scope.
d. Tidal range constraints: Some sites have relatively high tidal ranges, which may make near-term deployment less likely. This should be considered in the scenario modelling timescales.

Tidal Resource Modelling – D01 Tidal Resource Characterisation
B&V Team Page 115 of 148
10 TIDAL CURRENT RESULTS
10.1 Tidal Current farm sites, scenario results & comparison
The team will investigate the sites highlighted in Table 115 in greater resolution, to improve the accuracy of the data from these main sites, as part of the the wider Tidal Resource Modelling project; however, other sites will also be identified if applicable by the model. The CT 2011 report provides a benchmark to compare scenarios from the updated modelling in this project. A number of scenarios which illustrates the potential resource variability are shown in Table 115.

Tidal Resource Modelling – D1 Tidal Resource Characterisation
B&V Team
Page 116 of 148
Table 115 Summary of the scenario results from the CT 2011 report
Sites
Type of
site Area
Mean Sea
Level (MSL)
Farm rated power (BASE CASE)
AEP Total Technical Resource (BASE CASE)
Site probability base
Site probability low
Site probabilit
y high
AEP Total
Practical Resource (BASE CASE)
AEP Total
Practical Resource
(Low)
AEP Total
Practical Resource
(High)
CoE based on technical resource,
no learning dr15%
Technical AEP
without economic & environmen
tal constraint.
Technical AEP with Pentland
Firth Optimisat
ion
Technical AEP
without Environmental
constraint
Technical AEP
without Tidal range
constraint
km2 m MW GWh/y % % % GWh/y GWh/y GWh/y p/kWh, GWh/y GWh/y GWh/y GWh/y
Pentland Firth Deep HC 66.01 62.03 2,525 10,067 64% 100% 41% 6,431 10,067 4,175 17 16,558 17,188 10,067 10,067
Carmel Head TS 38.31 37.64 590 1,948 77% 89% 67% 1,504 1,727 1,310 29 2,136 1,948 1,948 1,948
Race of Alderney TS 15.31 30.70 626 2,253 71% 90% 54% 1,595 2,024 1,210 26 7,011 2,253 7,063 7,063
South Jersey TS 42.65 20.32 529 1,904 71% 90% 54% 1,348 1,710 1,023 75 2,199 1,904 1,904 1,904
Pentland Firth Shallow HC 20.15 30.00 483 1,230 100% 100% 100% 1,230 1,230 1,230 24 1,271 1,228 1,230 1,230
East Casquets TS 37.70 21.81 526 1,891 71% 90% 54% 1,339 1,699 1,016 62 2,494 1,891 2,168 2,168
West Islay TS 25.44 30.56 411 1,164 90% 96% 84% 1,046 1,116 974 36 3,628 1,164 2,974 2,974
North East Jersey TS 24.95 21.31 324 1,165 71% 90% 54% 825 1,046 626 72 1,375 1,165 1,165 1,165
Islay / Mull of OA TS 17.04 36.60 318 869 93% 98% 88% 811 851 767 25 4,309 869 2,220 2,220
Westray Firth TS 5.70 26.89 277 750 94% 100% 89% 706 750 666 35 2,516 750 1,916 1,916 Bristol Channel - Minehead RES 11.87 30.43 170 633 68% 79% 58% 433 501 365 34 764 633 633 633 North of N. Ronaldsay Firth TS 10.20 38.72 153 409 95% 100% 90% 389 409 369 38 254 409 409 409
West Casquets TS 11.08 23.37 145 522 71% 90% 54% 370 469 280 61 652 522 522 522
Ramsey Island TS 7.87 41.99 139 807 44% 84% 8% 355 679 66 25 555 807 807 807
Mull of Kintyre TS 6.77 115.85 128 444 73% 90% 57% 326 401 255 23 475 444 444 444
Isle of Wight TS 8.45 29.13 117 490 61% 82% 43% 297 400 211 57 802 490 754 754
Mull of Galloway TS 7.64 29.07 104 306 86% 92% 80% 264 281 246 59 378 306 306 306
South Minquiers (Jersey) TS 7.70 15.74 82 294 71% 90% 54% 208 264 158 90 385 294 294 294
N. Ronaldsay Firth TS 5.66 16.84 75 399 48% 90% 9% 191 359 36 74 700 399 577 577
Rathlin Island TS 3.62 101.93 65 172 96% 100% 92% 166 172 159 25 206 172 172 172
Total 8,061 29,019 20,535 27,207 15,522 50,397 36,139 39,004 39,004

Tidal Resource Modelling – D01 Tidal Resource Characterisation
B&V Team Page 117 of 148
11 TIDAL CURRENT KEY FINDINGS
The farm locations have been identified and agreed between B&V, UoE, the ETI, and RR (ETI Member) as identified in Table 115.
The main assumptions have been documented throughout this report and are based predominantly on the CT 2011 report; these are summarised in Table 116.
Table 116 Assumptions overview Sensitivity Name Description Methodology Based on the following methodologies:
Tidal Flux;
Tidal Farm. Tidal resource intensity Base case: Only sites with a mean power density greater than 1.5kW/m2
will be considered. Turbine clearance Based on the following assumptions:
Surface clearance: 5m;
Bottom clearance: 25% of depth;
Minimum turbine diameter: 10m. Turbine spacing Based on the following assumptions:
Base case: 2.5d by 10d;
Optimistic case 1.25d by 10d;
Extreme case 1.25d by 5d. Rotor diameter Optimised for site based on depth as specified above using:
10m, 15m, 20m, 25m & 30m. Rated velocity Optimised for site based on grouping farms by Vmsp:
Vmsp = 2.9-3.1m/s;
Vmsp = 2.25-2.5m/s. Velocity reduction Based on the following assumptions:
Base Case 10% acceptable maximum velocity reduction;
Pentland Firth Scenario: 18% (Pentland Firth only) Tidal range Based on the following assumptions:
Pessimistic: 0.1m tidal range;
Base case: 0.2m tidal range;
Optimistic case: 0.5m tidal range;
Extreme case: unconstrained; Structural Drag Based on the following assumptions:
Pessimistic: 25%;
Base case: 15%;
Optimistic: 5%. Wake effects Based on the following assumptions:
Pessimistic: 20%;
Base case: 10%;
Optimistic: 5%.
Practical constraints As per Table 114. Water depth Based on the following assumption:
Base case: 15m constrained water depth.
The base case UK technical resource is c. 29TWh/y. The other cases (pessimistic, optimistic, and [where appropriate] extreme) show that this can range up to c.50TWh/y based on the removal of the economic and tidal range constraints (economic constraints relate to the acceptable change in cost of energy, and tidal range constraints relate to the environmentally acceptable change in tidal range). This resource can be increased further by increasing the packing density of the turbines (extreme case), although this will provide diminishing returns in the real world.

Tidal Resource Modelling – D01 Tidal Resource Characterisation
B&V Team Page 118 of 148
The practical constraints discussion does not include a number of potentially important constraints:
a. Grid connection/accessibility: This is considered an important constraint but, although an option for this was proposed, it is not included in the scope of work. Therefore, it should not be considered in any scenario modelling.
b. Wave constraints: Some sites have relatively intense wave climates, which will make near-term deployment less likely. This should be considered in the scenario modelling timescales.
c. Tidal range project interaction constraints: There may be interactions between tidal range and current project developments. This is not accounted for at this stage, as it is an output of the (later) work scope.
d. Tidal range constraints: Some sites have relatively high tidal ranges, which may make near-term deployment less likely. This should be considered in the scenario modelling timescales.

Tidal Resource Modelling – D01 Tidal Resource Characterisation
B&V Team Page 119 of 148
12 TIDAL CURRENT CONCLUSIONS AND RECOMMENDATIONS
The objective of the Tidal Current Resource Characterisation part of this report was to review locations for tidal current farms based on the literature, primarily the CT 2011 report, and list potential areas, water depth, extent, and estimated power and energy output for tidal farms that are considered viable. No evidence was identified in the literature review which would suggest that the CT 2011 approach, and thus the proposed approach for this work, should be changed. The short list of tidal current farm locations to be considered was agreed between B&V, UoE, the ETI, and Rolls Royce (ETI Member) to have these key generic criteria:
Mean sea level (MSL) of greater than 15m;
Mean annualised power density in excess of 1.5kW/m2;
Farm rated power greater than 60MWp.
On this basis, 20 known tidal current farm locations to be actively considered within future workpackages were identified (Section 9.2.1). This report should be used as an input to the scenario modelling workpackage and includes:
Key assumptions and criteria used to develop the results (Section 9.2.3);
Base case scenario and anticipated error bands to mitigate uncertainties and limitations (Section 9.2.3);
Various scenarios to provide a summary of the possible range of results (Section 10.1).

Tidal Resource Modelling – D01 Tidal Resource Characterisation
B&V Team
Page 120 of 148
GLOSSARY
0-d model – zero-dimensional / flat estuary model. A 0-d model uses only two water levels (sea level and basin level). Sea level is a user defined input and, as such, the effect of barrage operations on sea levels is not represented. The basin level is calculated assuming that the water level upstream of the impoundment line is uniform. 1-d model – one-dimensional model. A 1-d model represents water levels in an estuary using a series of cross-sections. Hence water levels can vary moving upstream or downstream from the impoundment line but levels are uniform across the estuary. This means that the effect of a barrage/lagoon on downstream sea levels is represented to some extent. 2-d model – two-dimensional model. A 2-d model uses a mesh or grid to represent the sea and coastline. Water levels can vary both parallel and perpendicular to the coastline. As such, a 2-d model represents the constriction and expansion as water flows into and out of the basin, through the turbine and sluice caissons. ADP – Acoustic Doppler Profiler. AEP – Annual Energy Production. Barrage – an impoundment line across an estuary comprising embankment, turbines and usually sluices. Electricity is generated by creating a water level differential across the barrage between the impounded basin and the open sea. Barrages and (coastal) lagoons are similar. Basin – the impounded area, usually landside, within the barrage/lagoon alignment. Cavitation – the formation and immediate implosion of cavities in water as it passes through turbines. Cavitation can cause significant damage to turbines and is prevented by providing adequate submergence (installing the turbines deep enough below low tide level). CD - Chart Datum. This is the datum used to show levels on Admiralty charts and usually corresponds to lowest astronomical tide level. CoE – Cost of Energy. Cp – Device coefficient of performance, i.e. mechanical efficiency at which the device extracts energy from the incoming flow. Dual mode generation – power generation on both the ebb and flood tides. Ebb tide – the seaward flow of water as the tide level falls. Embankment – an artificial bank used to intercept and prevent the passage of water, forcing it through the turbine and sluice caissons whilst they are open. Energy yield – the amount of energy generated by a scheme, usually quoted as an annual total in watt hours. Flood tide – the landward flow of water as the tide level rises. Free-wheeling – when tidal range turbines are not generating power but the turbine passage is kept open, which aids filling and emptying of the basin.

Tidal Resource Modelling – D01 Tidal Resource Characterisation
B&V Team
Page 121 of 148
Generator capacity – maximum power output from each turbine unit, which usually includes an allowance for generator losses applied to the raw turbine power output. GW – gigawatt, unit of power equal to one billion (109) watts. GWh – gigawatt hours, unit of energy equal to one billion (109) watt hours. For constant power, energy in watt hours is the product of power (in watts) and time (in hours). HAA – Horizontal Axis Axial flow turbine. HAC – Horizontal Axis Cross flow turbine. HC – Hydraulic current system. Head – the hydraulic head, which is equal to the elevation plus velocity head (v^2/2g), where v is velocity and g is gravitational acceleration. Head is often used to indicate the total head difference across the barrage/lagoon structure. Headloss – loss of energy experienced by the water flow as it moves through a constriction. Headlosses will occur as water passes through turbines and sluice gates channels or where bed levels are shallow. Hill chart – turbine performance chart relating head, flow and efficiency, usually shown in non-dimensional form. Impoundment length – the total length of the barrage/lagoon alignment including embankments, turbine and sluice caissons. Installed capacity – the total peak power output of the turbine generators (equal to number of turbines multiplied by unit generator capacity). Intertidal area – seabed of estuary or coastline exposed at low tide but submerged at high tide. Lagoon (coastal) – similar to a barrage except that the impoundment line can be connected to any coastline rather than specifically across an estuary. A lagoon, therefore, will usually require a longer embankment than a barrage to give the same impounded area. Lagoon (offshore) – an impoundment that is not connected to the coastline. An offshore lagoon must, therefore, be enclosed on all sides by an artificial embankment. Majoration – increased efficiency for tidal range turbine due to larger turbine size (compared to the scale model on which the turbine hill chart is based). The increasing efficiency with increasing turbine size is due to larger gaps between the blades and fixed parts within the turbine. MSL – Mean Sea Level. MW – megawatt, equal to one million (106) watts. MWh – megawatt hours, unit of energy equal to one million (106) watt hours. Outages – times when turbines are unavailable for power generation. This may be due to routine maintenance or malfunction of some or all of the turbines.

Tidal Resource Modelling – D01 Tidal Resource Characterisation
B&V Team
Page 122 of 148
PD – Power Density. Pmax – The maximum total mean power harvested across the tidal cycle considered for a specified tidal system. Practical Resource – The energy (which is a proportion of the technical resource) that can be harvested after consideration of external constraints (e.g. grid accessibility, competing uses such as MOD, shipping lanes, etc.). This level of assessment fundamentally requires detailed project design and investigation on a case-by-case basis. The practical resource is hence a proportion of the technical resource. Qmax – The mean of the local maximum volume fluxes (m³/s) for a particular tidal system over the tidal cycle considered. Rated head – the lowest head difference across tidal range turbines for which the power output is equal to the generator capacity. RES – resonant (basin) system. Runner – the rotating part of a turbine. Energy is transferred from the water flowing through the turbine by the force on the turbine blades spinning the runner and driving the turbine generator. TEC – Tidal Energy Converter, a device which captures energy from tidal currents. Technical Resource – The energy that can be harvested from tidal currents using envisaged technology options and restrictions (including project economics) without undue impact on the underlying tidal hydrodynamic environment. The technical resource is hence a proportion of the theoretical resource. Theoretical Resource – Maximum energy that can be harvested from tidal currents in the region of interest without consideration of technical, economic or environmental constraints. Tidal Current – where Tidal Stream is referred to in the Scope of Works it is replaced with Tidal Current within the Tidal Resource Modelling reporting. This is due to a general acceptance that there are three hydraulic mechanisms which, combined, accurately define the hydraulics. Tidal Stream is one of the three hydraulic mechanisms, therefore to complete the Tidal Resource Modelling credibly and accurately, Tidal Current will be used and referred to. Tidal Prism – the volume of water within an area (such as an estuary) between low and high tide level. Total Resource – Total energy that exists within a defined tidal system. TS – Tidal streaming. TW - terawatt, equal to one trillion (1012) watts. TWh – terawatt hours, unit of energy equal to one trillion (1012) watt hours. Vmnp (m/s) – Mean neap peak velocity as defined by the Admiralty charts for a particular site, 5 m below the surface. Vmsp (m/s) – Mean spring peak velocity as defined by the Admiralty charts for a particular site, 5 m below surface.

Tidal Resource Modelling – D01 Tidal Resource Characterisation
B&V Team
Page 123 of 148
Vrated (m/s) – Rated velocity of tidal stream device. Rated velocity is the velocity at which the device reaches maximum (rated) output.

Tidal Resource Modelling – D01 Tidal Resource Characterisation
B&V Team
Page 124 of 148
REFERENCES
Bahaj.A.S, Myers. L.E, Thomson.M.D. and Jorge.N, 2007. Characterising the wake of horizontal axis marine current turbines Proceedings from Seventh European Wave and Tidal Energy Conference, Porto, Portugal. Baker, A.C., 1991. Tidal Power Institution of Electrical Engineers Energy Series 5, Peter Peregrinus Ltd, 1991 Binnie & Partners (B&P), 1980. Preliminary Survey of Tidal Energy of UK Estuaries Report by Binnie & Partners for United Kingdom Atomic Energy Authority, May 1980 Binnie & Partners (B&P), 1984. Preliminary Survey of Small Scale Tidal Energy Report by Binnie & Partners for Department of Energy, May 1984 Binnie & Partners (B&P), 1989a. Optimising Tidal Energy from the Severn Estuary Report by Binnie & Partners for the Severn Tidal Power Group, 1989 Binnie & Partners (B&P), 1989b. The UK Potential of Tidal Energy from Small Estuaries Report by Binnie & Partners for Department of Energy, 1989 Binnie & Partners (B&P), 1993. Duddon Barrage Study: Task 3 Estuary Hydrodynamics and Energy Computations Report by Binnie & Partners for Balfour Beatty, August 1993 Carbon Trust, 2011. UK Tidal Current Resource & Economics http://www.carbontrust.co.uk/Publications/pages/publicationdetail.aspx?id=CTC799 Department of Energy and Climate Change (DECC), 2008. Analysis of Options for Tidal Power Development in the Severn Estuary – Interim Options Analysis Report Report by Parsons Brinckerhoff in association with Black & Veatch Ltd for Department of Energy and Climate Change, December 2008 Department of Energy and Climate Change (DECC), 2009. Severn Tidal Power – SEA: 1D Mathematical Modelling – Phases 1 & 2 Report by Parsons Brinckerhoff in association with Black & Veatch Ltd for Department of Energy and Climate Change, July 2009 Department of Energy and Climate Change (DECC), 2010a. Strategic Environmental Assessment of Proposals for Tidal Power Development in the Severn Estuary: Options Definition Report Report by Parsons Brinckerhoff in association with Black & Veatch Ltd for Department of Energy and Climate Change, April 2010 Department of Energy and Climate Change (DECC), 2010b. Severn Tidal Power: Feasibility Study Conclusions and Summary Report Report by Department of Energy and Climate Change, October 2010 Department of Energy and Climate Change (DECC), 2010c. Severn Tidal Power – SEA: Comparison of Results from 1D and 2D Mathematical Modelling Report by Parsons Brinckerhoff in association with Black & Veatch Ltd for Department of Energy and Climate Change, February 2010

Tidal Resource Modelling – D01 Tidal Resource Characterisation
B&V Team
Page 125 of 148
Department of Business, Enterprise and Regulatory Reform (BERR), 2008. Atlas of UK Marine Renewable Energy Resources Atlas produced by ABPmer, the Met Office and Proudman Oceanographic Laboratory for BERR, March 2008 Halcrow, Mott MacDonald and RSK, 2009. Solway Energy Gateway Feasibility Study Report by Halcrow, Mott MacDonald and RSK, December 2009 Halcrow, 2011. Thames Hub Vision <http://www.halcrow.com/News/latest-news/FosterPartners-and-Halcrow-to-publish-Thames-Hub-vision/> Haws, E.T., Carr, G.R. and Jones, B.I., 1986. The Mersey Barrage Paper 10 from Tidal Power: Proceedings of the symposium organized by the Institution of Civil Engineers and held in London, 30-31 October 1986 Joule, 2009. Tapping the Tidal Power of the Eastern Irish Sea Report by Joule Centre, March 2009 Marine Scotland & The Scottish Government, 2010, Pentland Firth and Orkney Waters Marine Spatial Plan Framework & Regional Locational Guidance for Marine Energy. AECOM, METOC Ocearn Renewable Power, 2011. www.oceanrenewable power.com Accessed September 2011. Pulse Tidal, 2011. www.pulsetidal.co.uk Accessed September 2011. Parsons Brinckerhoff (PB), 2006. The Severn Estuary; Shoots Tidal Barrage – updated financial assessment Report by Parsons Brinckerhoff, November 2006 Parsons Brinckerhoff (PB), 2010. Duddon Estuary Tidal Energy Presentation by Parsons Brinckerhoff, July 2010. <http://www.duddon-estuary.org.uk/Duddon%20Tidal%20Energy%20Presentation%20July%202010.pdf> Peel Energy, 2011a. Mersey Tidal Power Feasibility Study: Stage 3: Study Report Report by URS Scott Wilson for Peel Energy, June 2011 Peel Energy, 2011b. Mersey Tidal Power Feasibility Study: Stage 3: Civil Engineering (Power) Report Report by URS Scott Wilson for Peel Energy, June 2011 Rolls-Royce and Atkins, 2010. Severn Embryonic Technologies Scheme: Concept Design of a Very-Low Head Dual Generation Tidal Scheme for the Severn Estuary: Volume 1: Summary Report Report by Rolls-Royce and Atkins, February 2010 Severn Barrage Committee (SBC), 1981. Tidal Power from the Severn Estuary Energy Paper No. 46, HMSO, 1981 Severn Tidal Power Group (STPG), 1986. An introduction to the work of the Severn Tidal Power Group 1983-1985 Paper 1 by R. Clare from Tidal Power: Proceedings of the symposium organized by the Institution of Civil Engineers and held in London, 30-31 October 1986

Tidal Resource Modelling – D01 Tidal Resource Characterisation
B&V Team
Page 126 of 148
Severn Tidal Power Group (STPG), 1989. The Severn Barrage Project: General Report Energy Paper No. 57, HMSO, 1989 Sustainable Development Commission, 2007. Turning the Tide: Tidal Power in the UK, Reports 1-5 Reports by Sustainable Development Commission, 2007 VerdErg, 2010. SETS Development Road Map for Severn Embryonic Technology Scheme (SETS) Report by VerdErg, March 2010 Wishart, S.J. (1981), A Preliminary Survey of Tidal Energy from Five UK Estuaries Paper B1 Second International Symposium on Wave and Tidal Energy, BHRA Fluid Enginering, 23-25 September 1981

Tidal Resource Modelling – D01 Tidal Resource Characterisation
B&V Team
Page 127 of 148
GUIDE TO APPENDICES Appendix A – Input data for 0-d modelling (bathymetry and tidal harmonics) Appendix B – Tidal Current Resource Assessment Methodology Literature Review Appendix C – Carbon Trust 2011 UK Resource Report – Tidal Current Maps

Tidal Resource Modelling – D01 Tidal Resource Characterisation
B&V Team
Page 128 of 148
APPENDIX A – INPUT DATA FOR 0-D MODELLING (BATHYMETRY AND TIDAL HARMONICS)
Solway Firth
Bathymetry: Elevation (m OD) Surface area (km2)
-3.7 573 0.0 777 3.7 887 From B&P (1980)
Tidal harmonics: M2 S2
2.74 0.86 From B&P (1980)
Duddon
Bathymetry: Elevation (m OD) Surface area (km2)
-4.7 1.6 4.5 32 Estimated from Admiralty charts
Tidal harmonics: M2 S2
2.9 0.9 From Admiralty tide tables
Morecambe Bay
Bathymetry: Elevation (m OD) Surface area (km2)
-4.9 157 0.0 297 2.0 370 4.5 455 From B&P (1980)
Tidal harmonics: M2 S2
3.07 0.93 From B&P (1980)

Tidal Resource Modelling – D01 Tidal Resource Characterisation
B&V Team
Page 129 of 148
Mersey
Bathymetry: Elevation (m OD) Surface area (km2)
-5.0 5.97 -4.0 8.87 -3.0 13.71 -2.0 20.86 -1.0 28.95 0.0 38.48 1.0 47.10 2.0 53.37 3.0 59.75 4.0 63.13 5.0 66.37 From Joule (2009)
Tidal harmonics: M2 S2
3.23 0.98 From Joule (2009)
Dee
Bathymetry: Elevation (m OD) Surface area (km2)
-5.0 12.55 -4.0 16.48 -3.0 21.02 -2.0 28.85 -1.0 36.84 0.0 50.44 1.0 61.42 2.0 78.04 3.0 94.23 4.0 103.98 5.0 129.05 From Joule (2009)
Tidal harmonics: M2 S2
2.975 0.875 From Joule (2009)

Tidal Resource Modelling – D01 Tidal Resource Characterisation
B&V Team
Page 130 of 148
Severn - Outer
Bathymetry: Elevation (m OD) Surface area (km2)
-5.0 1060 5.0 1060 From DECC (2008)
Tidal harmonics: M2 S2
3.475 1.325 From Admiralty tide tables
Tidal harmonics: M2 S2
(used in SETS) 2.51 0.87 From Rolls-Royce and Atkins (2010)
Severn - Cardiff-Weston
Bathymetry: Elevation (m OD) Surface area (km2)
-6.0 504 6.0 504 From DECC (2008)
Tidal harmonics: M2 S2
3.95 1.45 From Admiralty tide tables
Tidal harmonics: M2 S2
(used in SETS) 3.1 1.1 From Rolls-Royce and Atkins (2010)
Thames
Bathymetry: Elevation (m OD) Surface area (km2)
-2.6 80 0.0 132 2.6 160 From B&P (1980)
Tidal harmonics: M2 S2
2.1 0.45 From B&P (1980)

Tidal Resource Modelling – D01 Tidal Resource Characterisation
B&V Team
Page 131 of 148
Wash
Bathymetry: Elevation (m OD) Surface area (km2)
-5.0 100 -2.0 325 0.0 450 1.0 500 2.0 570 3.0 650 From B&P (1980)
Tidal harmonics: M2 S2
2.23 0.76 From B&P (1980)
Humber
Bathymetry: Elevation (m OD) Surface area (km2)
-3.9 171 0.0 228 3.0 292 From B&P (1980)
Tidal harmonics: M2 S2
2.05 0.75 From B&P (1980)
Wigtown Bay
Bathymetry: Elevation (m OD) Surface area (km2)
-3.8 126 4.0 163 Estimated from Admiralty charts
Tidal harmonics: M2 S2
2.375 0.725 From Admiralty tide tables
Kirkcudbright Bay
Bathymetry: Elevation (m OD) Surface area (km2)
-3.7 8.3 3.7 16.3 Estimated from Admiralty charts
Tidal harmonics: M2 S2
2.55 0.8 From Admiralty tide tables

Tidal Resource Modelling – D01 Tidal Resource Characterisation
B&V Team
Page 132 of 148
Cumbria lagoon
Bathymetry: Elevation (m OD) Surface area (km2)
-4.0 62 4.0 62 Uniform impounded area assumed
Tidal harmonics: M2 S2
2.725 0.775 From Admiralty tide tables
Dee/Wirral
Bathymetry: Elevation (m OD) Surface area (km2)
-5.0 103.51 -4.0 132.11 -3.0 159.03 -2.0 179.52 -1.0 193.80 0.0 210.65 1.0 223.15 2.0 241.04 3.0 258.72 4.0 269.85 5.0 295.20 From Joule (2009)
Tidal harmonics: M2 S2
2.975 0.875 From Joule (2009)
Oxwich Bay
Bathymetry: Elevation (m OD) Surface area (km2)
-5.0 11.9 4.2 14.4 Estimated from Admiralty charts
Tidal harmonics: M2 S2
3.05 1.15 From Admiralty tide tables

Tidal Resource Modelling – D01 Tidal Resource Characterisation
B&V Team
Page 133 of 148
West Aberthaw lagoon
Bathymetry: Elevation (m OD) Surface area (km2)
-6.0 30 6.0 30 Uniform impounded area assumed
Tidal harmonics: M2 S2
3.725 1.475 From Admiralty tide tables
Rhoose lagoon
Bathymetry: Elevation (m OD) Surface area (km2)
-6.0 24.5 6.0 24.5 Uniform impounded area assumed
Tidal harmonics: M2 S2
3.725 1.475 From Admiralty tide tables
Bridgwater Bay
Bathymetry: Elevation (m OD) Surface area (km2)
-10.0 15.81 -8.0 23.86 -6.0 38.24 -4.0 51.65 -2.0 63.61 0.0 73.86 2.0 83.69 4.0 87.65 6.0 89.11 8.0 89.72 10.0 90.28 From DECC (2009)
Tidal harmonics: M2 S2
4.125 1.375 From Admiralty tide tables

Tidal Resource Modelling – D01 Tidal Resource Characterisation
B&V Team
Page 134 of 148
Morte Bay lagoon
Bathymetry: Elevation (m OD) Surface area (km2)
-4.0 12 4.0 12 Uniform impounded area assumed
Tidal harmonics: M2 S2
2.725 0.925 From Admiralty tide tables
Rye Bay lagoon
Bathymetry: Elevation (m OD) Surface area (km2)
-4.0 102.5 4.0 102.5 Uniform impounded area assumed
Tidal harmonics: M2 S2
2.575 0.825 From Admiralty tide tables
Dymchurch lagoon
Bathymetry: Elevation (m OD) Surface area (km2)
-4.0 102.5 4.0 102.5 Uniform impounded area assumed
Tidal harmonics: M2 S2
2.575 0.825 From Admiralty tide tables
Tidal Resource Modelling – D01 Tidal Resource Characterisation
B&V Team
Page 135 of 148
APPENDIX B – TIDAL CURRENT RESOURCE ASSESSMENT METHODOLOGY LITERATURE REVIEW
INTRODUCTION This document is prepared by the University of Edinburgh for Black & Veatch to assist in preparation of Deliverables 1A and 1B in the ETI Tidal Modelling project. The report focuses on tidal current literature as the most recent literature pertaining to tidal range exploitation in the Severn and Mersey estuaries is timely enough to capture the vast majority of existing literature. The document provides a short summary of literature relevant to addressing the available tidal current energy entering the public domain resource since the initiation of the previous work undertaken for Carbon Trust (CT) in 2011. The methodologies and assessment approach presented in the CT work is viewed as the most advanced existing assessment of a national scale tidal current energy resource. By reviewing the most recent relevant literature, complementary or alternative approaches can be identified for consideration in updating the CT assessment as an input to the ETI project. LITERATURE SUMMARY The summary below does not include the key literature discussed in the CT report relating to the work of Garrett et al. (various) and Polagye et al. (various) in particular that form key contributions to the existing body of knowledge. The summaries in the CT report highlight these contributions. Bae, Y.H., Kim K.O., Choi, B.H. (2010): “Lake Sihwa tidal power plant project”. Ocean Engineering, 37(5-6), pp. 453-463. doi:10.1016/j.oceaneng.2010.01.015.
Tidal Range
Summarises the Lake Sihwa barrage project to date: Includes tidal hydrodynamic numerical
model. Details parameterisation of barrage
operation within hydrodynamic model. Description of build (includes good
schematic/pictorial representation). Bai, L., Spence, R.R.G. & Dudziak, G. (2009): “Investigation of the Influence of Array Arrangement and Spacing on Tidal Energy Converter (TEC) Performance using a 3-Dimensional CFD Model”. Proceedings of the 8th European Wave and Tidal Energy Conference (EWTEC 09), Uppsala (Sweden), September 2009.
Tidal Current CFD study of modelled device wake properties (gross) and potential wake interactions/array layouts: Actuator disk model of energy harvesting
impacts. Reinforces the impact that energy
extraction has on underlying flow dynamics. From this it can be inferred that ‘farm’ method of resource assessment that ignores interaction effects (i) with the resource, and (ii) between devices is flawed.
Blunden, L.S. (2009): “New approach to tidal stream energy analysis at sites in the English Channel”. University of Southampton, School of Civil Engineering and the Environment, PhD thesis. 276 p.
Tidal Current PhD thesis produced a detailed model of Portland Bill region and presents justified methodology for incorporating energy extraction: Demonstrates that ‘desk-based’ study
data often not representative of the resource available at key tidal energy locations.
Tidal Resource Modelling – D01 Tidal Resource Characterisation
B&V Team
Page 136 of 148
Demonstrates that coarse models (e.g. MEA) do not capture high velocity sites with any accuracy due to lack of resolution.(e.g. detailed model of Portland Bill indicates that more than double the area available at the location in comparison with ETSU93 and EC96 assessments). “This is due to the use in the ETSU 93 and EC 96 reports of sparse data points from one location in or near the site, without consideration of the spatial variation in mean cube speed across the site area.”
Proposes new resource identification
metric - 3U > 5.5 (m/s)3, depth > 25
metres. Uses an enhanced bed friction model for
simulating arrays (momentum extraction) – friction enhancement related to local flow speed and device characteristics.
“It was found that there was a significant effect on the tidal ellipse major axis length in the area of energy extraction, the largest (M2) reduced by 10–15%. There was a corresponding decrease in mean cube speed in the area of energy extraction, altering the time distribution of cubed speeds from higher-value bins to lower. The time spent in the cubed speed bin at the simulated rated speed was reduced by a third.”
“... there is a region downstream of the array extending approximately 5–10 km around the simulated tidal stream turbine array in which the tidal stream ellipse major axis is reduced by at least 5%.”
Carballo, R., Iglesias, G. & Castro, A. (2009): “Numerical model evaluation of tidal stream energy resources in the Ria de Muros (NW Spain)”. Renewable Energy, 34, pp. 1517-1524. doi:10.1016/j.renene.2008.10.028.
Tidal Current Use a tidal hydrodynamic model to assess tidal energy resource in a region of NW Spain: No simulation of energy extraction
impacts/responses. Although peak velocities > 2 m/s (2.3
m/s), average energy density still very low (max. 0.61 kW/m2) even though model resolution is high in the region of interest.
The above reasoning from my analysis of the presented results is two-fold (i) flood/ebb asymmetry is strong (2.3 m/s vs. 1.5 m/s), and (ii) very weak neap tides (Neap/Spring ratio approx. 0.25).
Chen, C. Gao, G., Qi, J., Proshutinsky, A., Beardsley, B.,
Tidal Dynamics
Large-scale assessment of tidal energy fluxes (oceanographic):

Tidal Resource Modelling – D01 Tidal Resource Characterisation
B&V Team
Page 137 of 148
Kowalik, Z., Lin, H. & Cowles, G. (2009): “A new high-resolution unstructured grid finite volume Arctic Ocean model (AO-FVCOM): An application for tidal studies”. Journal of Geophysical Research, 114, C08017, doi:10.1029/2008JC004941.
(non-energy specific)
“The tidal energy flux is estimated using the following definition:
2
2
Supporting evidence that areas of interest for tidal energy harvesting are well mixed (vertically) see figure 13 and supporting text (not-reproduced here).
Averaged tidal energy flux around the northern hemisphere associated with key tidal harmonics (including regions on the UK continental shelf) are presented (see figure 1 and table 1 below reproduced from the reference material). o See A2, A3, A5 and A6 in particular
Defne, Z., Haas, K.A. & Fritz, H.M. (2011): “GIS based multi-criteria assessment of tidal stream power potential: A case study for Georgia, USA”. Renewable and Sustainable Energy Reviews, 15, pp. 2310-2321.
Tidal Current Use a tidal hydrodynamic model to assess tidal energy resource in a region of East coast USA: No simulation of energy extraction
impacts/responses in modelling. Resource strength generally low in
comparison to what would be considered viable in the UK.
Interesting hierarchical approach to site selection/ranking.
Some good use of GIS type outputs to present data.
Draper, S., Houlsby, G., Oldfield, M.L.G. & Borthwick, A.G.L. (2010): “Modelling tidal energy extraction in a depth-averaged coastal domain”. IET Renewable Power Generation. 4(6), pp. 545-554. doi: 10.1049/iet-rpg.2009.0196.
Tidal Current Presents analytical and 2-d numerical modelling analysis of the large-scale impact of tidal current energy operation: Actuator disk model (described as what is
reported as a ‘line discontinuity’ in other literature) incorporated in shallow water equations.
Demonstrates the impact of increasing blockage ratio is to increase efficiency (although this assumes not able to impact on u/s boundary condition), and that hence one row of turbines perpendicular to flow direction is optimal (in a uniform depth environment).
Blockage ratio of 0.4 used as a ‘standard’ case -> very high in terms of engineering reality that can be expected in reality.
Compares numerical model output successfully with Garrett formulation (as was the starting point of CT analysis),
Iyer, A.S., Couch, S.J., Harrison, G.P. & Wallace, A.R. (2009): “Analysis and Comparison of Tidal Datasets”. Proceedings of
Tidal Current Analysis and comparison of tidal datasets: Demonstrates the difficulty of applying
existing oceanographic datasets for accurate tidal energy resource

Tidal Resource Modelling – D01 Tidal Resource Characterisation
B&V Team
Page 138 of 148
the 8th European Wave and Tidal Energy Conference, Uppsala, Sweden, 2009.
characterisation purposes “The spatial variability of tides is governed
by complex non-linear physics, topography, the bathymetry and the fluid interaction at the site. For this reason, interpolating spatially diffuse tidal data records is always going to lead to inaccuracies. These complex phenomena cannot be well represented by simple interpolation.”
Myers, L.E. & Bahaj, A.S. (2010): “Experimental analysis of the flow field around horizontal axis tidal turbines by use of scale mesh disk rotor simulations”. Ocean Engineering, 37, pp. 218-227. doi:10.1016/j.oceaneng.2009.11.004.
Tidal Current Reports experimental experience of flow field response to tidal energy extraction (small mesh disks): Demonstrates that ‘farm’ method not
appropriate as wakes persist => devices will interact.
Demonstrates increased turbulence in the wake generated by energy extraction element.
Will be useful ground-truthing of device spacing/packing discussions during scenario development.
Neill, S.P., Litt, E.J., Couch, S.J. & Davies, A.G. (2009): “The impact of tidal stream turbines on large-scale sediment dynamics”. Renewable Energy, 34(12), pp. 2803-2812. doi:10.1016/j.renene.2009.06.015.
Tidal Current One-dimensional morphological model used to assess the impact of tidal energy harvesting on sediment dynamics. : Model applied to the Bristol Channel
(where large spatial variations in tidal asymmetry occur along the length of the channel)
Impact of energy harvesting modelled by introduction of an additional term in the momentum equation relating the instantaneous performance of an idealised tidal device power curve to an additional drag term in the momentum equation.
Demonstrates potential for energy harvesting to induce measurable far-field impacts.
Neill, S.P., Jordan, J.R. & Couch, S.J. (2012): “Impact of tidal energy converter (TEC) arrays on the dynamics of headland sand banks”. Renewable Energy, 37(1), pp. 387-397. doi:10.1016/j.renene.2011.07.003.
Tidal Current Multi-dimensional morphological model used to assess the impact of tidal energy harvesting on sediment dynamics: Model applied to idealised headland case
study. Model then implemented for Alderney
Race region. Impact of energy harvesting simulated
using same methodology as Neill et al. (2009).
Non-linear response of the system observed.
Far-field impacts are observed. O’Rourke, F., Boyle, F. & Reynolds, A. (2010): “Tidal
Tidal Current Irish resource assessment study: Assesses national ‘viable’ resource as
Tidal Resource Modelling – D01 Tidal Resource Characterisation
B&V Team
Page 139 of 148
current energy resource assessment in Ireland: Current status and future updates”. Renewable and Sustainable Energy Reviews, 14, pp. 3206-3212. doi:10.1016/j.rser.2010.07.039.
0.915 TWh/y (most in N.I.!). No consideration of interaction between
extraction and resource, therefore no ‘environmental’ limitation (i.e. an assumption of the ‘farm’ approach), but resolution of background model is higher than MEA.
Uses a ‘theoretical, technical practical’ scale approach, but uses different definitions from CT 05/11 – can be seen as an Irish CT – ‘lite’.
Shapiro, G.I. (2011): “Effect of tidal stream power generation on the region-wide circulation in a shallow sea”. Ocean Sci., 7, pp. 165-174. doi:10.5194/osd-7-165-2011.
Tidal Current Three-dimensional tidal hydrodynamic model of tidal energy harvesting impact: Applied to test case region in SW England
(Celtic Sea). NOTE: Development scenario is not very realistic due to the relative size of development proposed in comparison with the available resource.
Energy harvesting simulated using an additional friction term in the momentum equation related to the instantaneous local flow velocity.
Modelling results indicate that the extracted power does not grow linearly with the increase in the rated capacity of the farm.
Tidal dynamics response in open sea case much more severe than observed in analytical 1D models.
“... in the open sea the currents can avoid flowing through a localised energy farm. In a channel, the slow-down of the flow in front of the turbine causes an increase in the sea level forming a pressure gradient that partially mitigates the loss of flow. The recovery of kinetic energy due to increases in the potential energy has a much weaker effect in the open sea. Hence, the effect of reduction of maximum extractable power is stronger in the 3-D case considered here as compared to assessments done for 1-D geometry (Carballo et al., 2009; Walkington and Burrows, 2009). Walkington and Burrows (2009) also carried out 2-D modelling and noted a similar effect of current going around the farm to avoid the ‘blockage’ so that power extraction is reduced.”
“Due to the extraction of energy from the ocean currents, the flow of water slows down. This effect causes the maximum extractable power to be significantly less than the estimates of the resource

Tidal Resource Modelling – D01 Tidal Resource Characterisation
B&V Team
Page 140 of 148
calculated using undisturbed, naturally flowing currents. In the case study (H) presented here, the maximum extractable energy is at least 14 times lower than if the currents had not been disturbed by the farm. The effect of the reduction of extractable power in the open shelf sea is much stronger than it is in a channel.”
Turnock, S.R., Phillips, A.B., Banks, J. & Nicholls-Lee, R. (2011): “Modelling tidal current turbine wakes using a coupled RANS-BEMT approach as a tool for analysing power capture of arrays of turbines”. Ocean Engineering, 38, pp. 1300-1307. doi:10.1016/j.oceaneng.2011.05.018.
Tidal Current CFD-BEM model where BEM acts to generate values to be operated in the outer CFD domains as “additional momentum terms” (note, steady input boundary conditions and other boundary parameterisations may be influencing the flow development): Relevant array spacing outcomes –
supports the case for staggering of devices to increase overall farm efficiency.
10 diameters downstream required for wake to return to 0.9 of free stream flow velocity (which is equivalent to approx. 75-80% power),
Long-term persistence of d/s wake is identified.
Cumulative impact of devices acting in the wake is to successively reduce flow velocity in the wake.
Considers the impact of lateral spacing (can be seen as pseudo device packing).
Vennell, R. (2010): “Tuning turbines in a tidal channel”. J. Fluid Mech., 663, pp.253-267. doi:10.1017/S0022112010003502.
Tidal Current 1-D analytical study of the impact of turbines on flow dynamics, and how the performance of the devices can be maximised (overall is very theory focussed without bringing this back to the engineering achievability): Builds from where Garrett et al.(various)
analysis stopped. Velocity impacts of device operation
modelled through an additional term in the momentum equation simulating the ‘drag’ of a farm of devices.
Analysis indicates optimal layout (channel cross-section, uniform bathymetry) is maximum number of devices in a row (maximises blockage), minimise the number of rows (optimal is one).
Non-dimensionally demonstrates the impact of combined (i) alteration of fraction of cross-section occupied, and (ii) velocity deficit across turbines. Conclusion: “The optimal through-flow tuning fraction varies from near 1/3 for small farms occupying a small fraction of

Tidal Resource Modelling – D01 Tidal Resource Characterisation
B&V Team
Page 141 of 148
the cross-section, to near 1 for large farms occupying most of the cross-section. Consequently, tunings are higher than the optimal through-flow tuning of 1/3 for an isolated turbine from the classic turbine theory. Large optimally tuned farms can realise most of a channel’s potential.” o The obvious conclusion from this is
that it is possible to extract more than the ‘maximum theoretical’ energy identified by Garrett et al. and as identified in CT work. However in order to achieve this it is necessary to take up a substantial fraction of the overall cross-section of the channel (anything below 20% of cross-section area, no change from normal theory). Qualifying this further, this
creates such a large amount of blockage, that it is not really credible to consider the boundary conditions imposed are still valid.
All the analysis is considering the ‘available’ energy after parameterising effects of energy harvesting and wake mixing, does not consider support structure drag or electro-mechanical efficiency of turbine.
Vennell, R. (2011): “Estimating the power potential of tidal currents and the impact of power extraction on flow speeds”. Renewable Energy, 36, pp. 3558-3565. doi:10.1016/j.renene.2011.05.011.
Tidal current Updates Garrett approach (the fundamental ‘flux’ equation) by removing the requirement to have the driving pressure gradient prescribed in the solution. So method is still fundamentally 1-d
analytical with prescription of an additional momentum equation term (drag coefficient).
Uses Garrett type formulation as comparator (‘gold standard’).
“With this the average power lost by flow to the turbines is:
43
where the 4/3 factor results from averaging over a tidal cycle.”
Vennell, R. (2011): “Tuning tidal turbines in-concert to maximise farm efficiency”. J. Fluid Mech., 671, pp. 587-604. doi:10.1017/S0022112010006191.
Tidal current Follows similar approach to Vennell (2010): Tends to use overall blockage ratio per
turbine row of 0.1 and 0.4 as test cases (0.4 is obviously more efficient overall). In engineering practice, very difficult to see levels of 0.4 (even 0.1 is borderline) being achievable due to bathymetry, environmental acceptability and

Tidal Resource Modelling – D01 Tidal Resource Characterisation
B&V Team
Page 142 of 148
practicality (e.g. shipping lanes). A lot of focus on combined tuning of rows
in an array. From an engineering perspective, how achievable this would be in a real location is hard to see (requires all devices to be aligned, equally spaced, equal power generation (1-d therefore assumption that all devices see the same input flow condition).
“The difference between and is the energy dissipated by downstream mixing of (enhanced) free stream and slow flow through turbine”. (Equations for both terms presented).
Walkington, I. & Burrows, R. (2010): “Modelling tidal stream power potential”. Applied Ocean Research, 31(4), pp. 239-245. doi:10.1016/j.apor.2009.10.007.
Tidal Current 2-d tidal hydrodynamic modelling of (i) idealised domain, and (ii) West UK continental Shelf, (focused on the Irish Sea region). Not resource assessment per se. Examines
a specified scenario of 4 small arrays in available identified locations.
“The rated power for each farm is a 'best guess' and is representative only of possible values, ...”. Matching of device characteristics with available resource is sub-optimal, hence ‘utilisation’ (appears to be load factor) is unrealistic for a number of the locations examined.
Impact simulated through increased bottom drag parameterisation (relates to farm power generation):
∑ 13 | |
Non-linear (spatial) response of each region to extraction is well presented.
(Minor) far-field response is measurable even at significant distance (see figure 9 in publication).
Williams, A.J., Croft, T.N., Masters, I., Willis, R. & Cross, M. (2010): “Combined BEM-CFD Modelling of Tidal Stream Turbines Using Site Data”. Proeedings, of the International Conference on Renewable Energies and Power Quality (ICREPQ’ 10), Granada (Spain) March 2010.
Tidal Current Combined CFD-BEM modelling (near-field) tidal stream turbines: BEM generates details for an extra term in
the CFD that acts as a momentum sink. Comparison of using a flat bed model
compared with real bathymetry (although reasonably flat real domain, and idealised case uses a similar representative depth).
Useful classification of wake persistence (looks like reasonable agreement with previously modelled (numerical and experimental) presented in the literature ).
Willis, M., Masters, I., Thomas, S., Gallie, R., Loman, J., Cook, A., Ahmadian, R., Falconer, R.,
Tidal current Turbine deployment case study of location in the Bristol Channel: Details site identification, physical survey,

Tidal Resource Modelling – D01 Tidal Resource Characterisation
B&V Team
Page 143 of 148
Lin, B., Gao, G., Cross, M., Croft, N., Williams, A., Muhasilovic, M., Horsfall, I., Fidler, R., Wooldridge, C., Fryett, I., Evans, P., O’Doherty, T., O;Doherty, D. & Mason-Jones, A. (2010): “Tidal turbine deployment in the Bristol Channel: a case study”. Proc. ICE Energy, 163(EN3), pp. 93-105. doi: 10.1680/ener0.210.163.3.93
local scale modelling (CFD) and estuary scale modelling (2-d tidal hydrodynamics).
Potential inter-array effects generally noted, modelled similarly to Williams et al. above (very likely that Williams paper above is directly related to this study).
Estuary scale tidal hydrodynamic model applies a ‘momentum sink’ to simulate energy extraction parameterisation (derived from CFD model): “Introducing the turbines as a momentum sink enabled dynamic coupling of the hydrodynamic, sediment transport and water quality processes to be included in the same model.”
Xia, J., Falconer, R.A. & Lin, B. (2010): “Numerical model assessment of tidal stream energy resources in the Severn Estuary, UK” Proc. IMechE Part A: Journal of Power and Energy, 224(7), pp. 969-983. doi: 10.1243/09576509JPE938.
Tidal Current Resource analysis of Severn Estuary: Use model to assess mean power densities
to identify areas of interest. o Significant areas > 2 m/s peak identified o However mean power densities less
than 1.0 kW/m2 (see– within the CT report the data presented leads to a significant tidal current development (181 MW installed) scenario. The power densities reported herein would fail to met the CT criteria for any development in the region.
o No consideration of impact of turbine operation.

Tidal Resource Modelling – D01 Tidal Resource Characterisation
B&V Team
Page 144 of 148
Figure B1 The schematic pattern of the model M2 energy flux in the Artic Ocean and adjacent coastal regions. Based on the M2 energy flux vector field predicted by the high resolution AO-FVCOM. Note that the scale of the line thickness is not proportional to real values (Source [Chen, et al. 2009]).

Tidal Resource Modelling – D01 Tidal Resource Characterisation
B&V Team
Page 145 of 148
Table B1 Tidal Energy Flux on Selected Section for M2 and K1 tidal constituents
Terminology note
Actuator disc model: “... represents rotor blades with momentum sources allowing a pressure differential to exist across the disk. However the actuator disk approximation cannot account for the transfer of rotational momentum.” (Bai, et al., 2009). Hence, is a similar approach to the tidal hydrodynamic modelling for CT, and will be replicated by HRW in this project.
Alternative Approaches Other than the publications by Salter and MacKay discussed in the CT reporting, there does not seem to be any significantly different approach being disseminated in the literature. The approach we have adopted this far with respect to how to incorporate energy harvesting into a numerical model and how to characterise tidal energy resource availability using simple analytical expressions is the same approach being adopted by other investigators. The main points that I would highlight that introduce uncertainty regarding the accuracy of the CT resource characterisation details published are: Spatially diffuse source data and summary values from coarse numerical model outputs are
not reliable for tidal current energy resource characterisation (this is well understood already and specifically mentioned in the CT report, hence the initiation of the current programme of high resolution work with the intent to increase confidence in predictions).

Tidal Resource Modelling – D01 Tidal Resource Characterisation
B&V Team
Page 146 of 148
Open sea cases will be more sensitive to energy harvesting than ‘closed’ or bounded flow regions (the Tidal Streaming parameterisation in the CT report already captures some of this kind of effect as it is the most conservative parameterisation value – however as has been noted elsewhere within the CT report, it represents an upper limit).
For large scale industry development, the potential for interaction between projects or farms exists. Even a very minor alteration to the underlying tidal dynamics will have a significant impact on the economics of a particular development project/scenario (again, as discussed in the CT reports in 2005 and 2011).
REFERENCES
Bae, Y.H., Kim K.O., Choi, B.H. (2010): “Lake Sihwa tidal power plant project”. Ocean Engineering, 37(5-6), pp. 453-463. doi:10.1016/j.oceaneng.2010.01.015.
Bai, L., Spence, R.R.G. & Dudziak, G. (2009): “Investigation of the Influence of Array Arrangement and Spacing on Tidal Energy Converter (TEC) Performance using a 3-Dimensional CFD Model”. Proceedings of the 8th European Wave and Tidal Energy Conference (EWTEC 09), Uppsala (Sweden), September 2009.
Blunden, L.S. (2009): “New approach to tidal stream energy analysis at sites in the English Channel”. University of Southampton, School of Civil Engineering and the Environment, PhD thesis. 276 p.
Carballo, R., Iglesias, G. & Castro, A. (2009): “Numerical model evaluation of tidal stream energy resources in the Ria de Muros (NW Spain)”. Renewable Energy, 34, pp. 1517-1524. doi:10.1016/j.renene.2008.10.028.
Chen, C. Gao, G., Qi, J., Proshutinsky, A., Beardsley, B., Kowalik, Z., Lin, H. & Cowles, G. (2009): “A new high-resolution unstructured grid finite volume Artic Ocean model (AO-FVCOM): An application for tidal studies”. Journal of Geophysical Research, 114, C08017, doi:10.1029/2008JC004941.
Defne, Z., Haas, K.A. & Fritz, H.M. (2011): “GIS based multi-criteria assessment of tidal stream power potential: A case study for Georgia, USA”. Renewable and Sustainable Energy Reviews, 15, pp. 2310-2321.
Draper, S., Houlsby, G., Oldfield, M.L.G. & Borthwick, A.G.L. (2010): “Modelling tidal energy extraction in a depth-averaged coastal domain”. IET Renewable Power Generation. 4(6), pp. 545-554. doi: 10.1049/iet-rpg.2009.0196.
Iyer, A.S., Couch, S.J., Harrison, G.P. & Wallace, A.R. (2009): “Analysis and Comparison of Tidal Datasets”. Proceedings of the 8th European Wave and Tidal Energy Conference, Uppsala, Sweden, 2009.
Myers, L.E. & Bahaj, A.S. (2010): “Experimental analysis of the flow field around horizontal axis tidal turbines by use of scale mesh disk rotor simulations”. Ocean Engineering, 37, pp. 218-227. doi:10.1016/j.oceaneng.2009.11.004.
Neill, S.P., Litt, E.J., Couch, S.J. & Davies, A.G. (2009): “The impact of tidal stream turbines on large-scale sediment dynamics”. Renewable Energy, 34(12), pp. 2803-2812. doi:10.1016/j.renene.2009.06.015.
Tidal Resource Modelling – D01 Tidal Resource Characterisation
B&V Team
Page 147 of 148
Neill, S.P., Jordan, J.R. & Couch, S.J. (2012): “Impact of tidal energy converter (TEC) arrays on the dynamics of headland sand banks”. Renewable Energy, 37(1), pp. 387-397. doi:10.1016/j.renene.2011.07.003.
O’Rourke, F., Boyle, F. & Reynolds, A. (2010): “Tidal current energy resource assessment in Ireland: Current status and future updates”. Renewable and Sustainable Energy Reviews, 14, pp. 3206-3212. doi:10.1016/j.rser.2010.07.039.
Shapiro, G.I. (2011): “Effect of tidal stream power generation on the region-wide circulation in a shallow sea”. Ocean Sci., 7, pp. 165-174. doi:10.5194/osd-7-165-2011.
Turnock, S.R., Phillips, A.B., Banks, J. & Nicholls-Lee, R. (2011): “Modelling tidal current turbine wakes using a coupled RANS-BEMT approach as a tool for analysing power capture of arrays of turbines”. Ocean Engineering, 38, pp. 1300-1307. doi:10.1016/j.oceaneng.2011.05.018.
Vennell, R. (2010): “Tuning turbines in a tidal channel”. J. Fluid Mech., 663, pp.253-267. doi:10.1017/S0022112010003502.
Vennell, R. (2011): “Estimating the power potential of tidal currents and the impact of power extraction on flow speeds”. Renewable Energy, 36, pp. 3558-3565. doi:10.1016/j.renene.2011.05.011.
Vennell, R. (2011): “Tuning tidal turbines in-concert to maximise farm efficiency”. J. Fluid Mech., 671, pp. 587-604. doi:10.1017/S0022112010006191.
Walkington, I. & Burrows, R. (2010): “Modelling tidal stream power potential”. Applied Ocean Research, 31(4), pp. 239-245. doi:10.1016/j.apor.2009.10.007.
Williams, A.J., Croft, T.N., Masters, I., Willis, R. & Cross, M. (2010): “Combined BEM-CFD Modelling of Tidal Stream Turbines Using Site Data”. Proeedings, of the International Conference on Renewable Energies and Power Quality (ICREPQ’ 10), Granada (Spain) March 2010.
Willis, M., Masters, I., Thomas, S., Gallie, R., Loman, J., Cook, A., Ahmadian, R., Falconer, R., Lin, B., Gao, G., Cross, M., Croft, N., Williams, A., Muhasilovic, M., Horsfall, I., Fidler, R., Wooldridge, C., Fryett, I., Evans, P., O’Doherty, T., O;Doherty, D. & Mason-Jones, A. (2010): “Tidal turbine deployment in the Bristol Channel: a case study”. Proc. ICE Energy, 163(EN3), pp. 93-105. doi: 10.1680/ener.2010.163.3.93.
Xia, J., Falconer, R.A. & Lin, B. (2010): “Numerical model assessment of tidal stream energy resources in the Severn Estuary, UK” Proc. IMechE Part A: Journal of Power and Energy, 224(7), pp. 969-983. doi: 10.1243/09576509JPE938.

Tidal Resource Modelling – D01 Tidal Resource Characterisation
B&V Team
Page 148 of 148
APPENDIX C – CARBON TRUST 2011 UK RESOURCE REPORT – TIDAL CURRENT MAPS