Title Relative location oriented social network Sub Title ...
93
Title Relative location oriented social network Sub Title Author 萧, 若薇(Xiao, Ruowei) 杉浦, 一徳(Sugiura, Kazunori) Publisher 慶應義塾大学大学院メディアデザイン研究科 Publication year 2014 Jtitle JaLC DOI Abstract Notes 修士学位論文. 2014年度メディアデザイン学 第351号 Genre Thesis or Dissertation URL https://koara.lib.keio.ac.jp/xoonips/modules/xoonips/detail.php?koara_id=KO40001001-0000201 4-0351 慶應義塾大学学術情報リポジトリ(KOARA)に掲載されているコンテンツの著作権は、それぞれの著作者、学会または出版社/発行者に帰属し、その権利は著作権法によって 保護されています。引用にあたっては、著作権法を遵守してご利用ください。 The copyrights of content available on the KeiO Associated Repository of Academic resources (KOARA) belong to the respective authors, academic societies, or publishers/issuers, and these rights are protected by the Japanese Copyright Act. When quoting the content, please follow the Japanese copyright act. Powered by TCPDF (www.tcpdf.org)
Transcript of Title Relative location oriented social network Sub Title ...

Title Relative location oriented social networkSub TitleAuthor 萧, 若薇(Xiao, Ruowei)
杉浦, 一徳(Sugiura, Kazunori)Publisher 慶應義塾大学大学院メディアデザイン研究科
Publication year 2014Jtitle
JaLC DOIAbstract
Notes 修士学位論文. 2014年度メディアデザイン学 第351号Genre Thesis or DissertationURL https://koara.lib.keio.ac.jp/xoonips/modules/xoonips/detail.php?koara_id=KO40001001-0000201
4-0351
慶應義塾大学学術情報リポジトリ(KOARA)に掲載されているコンテンツの著作権は、それぞれの著作者、学会または出版社/発行者に帰属し、その権利は著作権法によって保護されています。引用にあたっては、著作権法を遵守してご利用ください。
The copyrights of content available on the KeiO Associated Repository of Academic resources (KOARA) belong to the respective authors, academic societies, orpublishers/issuers, and these rights are protected by the Japanese Copyright Act. When quoting the content, please follow the Japanese copyright act.
Powered by TCPDF (www.tcpdf.org)
Master’s Thesis
Academic Year 2014
Relative Location Oriented Social Network
Graduate School of Media Design,Keio University
Ruowei Xiao

A Master’s Thesis
submitted to Graduate School of Media Design, Keio University
in partial fulfillment of the requirements for the degree of
MASTER of Media Design
Ruowei Xiao
Thesis Committee:
Associate Professor Kazunori Sugiura (Supervisor)
Professor Akira Kato (Co-supervisor)
Professor Sam Furugawa (Member)

Abstract of Master’s Thesis of Academic Year 2014
Relative Location Oriented Social Network
Category: Science / Engineering
Summary
Location based social network(LBSN), generally refers to networks that consist
of both location information and social connections. Many LBSNs define locations
as absolute coordinates, which only partially reflect locations’ attributes and are
far away from human cognition: Computers consider locations as sparse isolated
spots, while we human beings connect them. Thus, the absolute location definition
has led to many existing problems in current LBSN framework and can not better
leverage the value of relative locatioins inside peoples’s minds.
Therefore, this thesis proposed a complementary LBSN framework: Relative
Location Oriented Social Network(RLOSN). The core concpet, “Relative Loca-
tion”, present a relatively comprehensive two-layer location model that consist of
spatial attributes, conceptual attributes and the mapping between them. Based
on this concept, we separated the relations into mainly four typical catogories, in-
cluding: location-location relation, user-location relation, user-user location and
temporal relation. We further established corresponding framework,data collect-
ing and mining mechanisms.
To notice that the RLOSN was not directly targetting any end users. Rather
than any concrete top-layer applications or services, our focuses were more on
the network structure itself, as the middle layer infrastructure. However, in order
to fully evaluate our proposal, we deviced an online hybrid application adopting
RLOSN framework, ROSA, the Relative-location Schedule Assistant. Its main
function was to assist general users to schedule all kinds of visit activities in their
daily life.
i

The results showed that ROSA possessed a higher usability over alike tradi-
tional applications in both system and interface aspects. Moreover, it could better
support users’ spatial decision making seamlessly and lower down the operation
overhead when compared to using ad hoc services. However, to further stretch
the application senario of RLOSN, there is still much work left to be done in the
nearby future.
Keywords:
LBSN, Relative Location, RLOSN
Graduate School of Media Design, Keio University
Ruowei Xiao
ii
Table of Contents
1. Location Based Social Networks 1
1.1. What are Location Based Social Networks? . . . . . . . . . . . . . 1
1.2. LBSN Related Research and its History . . . . . . . . . . . . . . . 4
1.3. Current Issues and Contributions . . . . . . . . . . . . . . . . . . 8
1.4. Summary . . . . . . . . . . . . . . . . . . . . . . . . . . . . . . . 10
2. Relative Location: A Relation-Oriented LBSN Framework 11
2.1. What are Relative Locations? . . . . . . . . . . . . . . . . . . . . 11
2.2. How to Define Relations? . . . . . . . . . . . . . . . . . . . . . . . 15
2.3. A Socio-Spatial Location Model . . . . . . . . . . . . . . . . . . . 18
2.4. A Relation-Oriented Framework . . . . . . . . . . . . . . . . . . . 19
2.5. Data Collecting and Mining Mechanisms . . . . . . . . . . . . . . 25
2.6. Summary . . . . . . . . . . . . . . . . . . . . . . . . . . . . . . . 29
3. ROSA: A Paradigm Implementation of RLOSN 31
3.1. Relative-location Oriented Schedule Assistant . . . . . . . . . . . 31
3.2. System Design . . . . . . . . . . . . . . . . . . . . . . . . . . . . . 33
3.3. Server-Client Architecture . . . . . . . . . . . . . . . . . . . . . . 36
3.4. Web Service Interface . . . . . . . . . . . . . . . . . . . . . . . . . 38
3.5. Interactive Design . . . . . . . . . . . . . . . . . . . . . . . . . . . 40
3.6. Summary . . . . . . . . . . . . . . . . . . . . . . . . . . . . . . . 43
4. Evalutaion 47
4.1. Concept Usability . . . . . . . . . . . . . . . . . . . . . . . . . . . 47
4.2. System Usability Test . . . . . . . . . . . . . . . . . . . . . . . . . 50
iii

4.3. Interface Usability Test . . . . . . . . . . . . . . . . . . . . . . . . 53
4.4. Summary . . . . . . . . . . . . . . . . . . . . . . . . . . . . . . . 56
5. Conclusions 57
5.1. Contributions . . . . . . . . . . . . . . . . . . . . . . . . . . . . . 57
5.2. Limitations . . . . . . . . . . . . . . . . . . . . . . . . . . . . . . 58
5.3. Future Work . . . . . . . . . . . . . . . . . . . . . . . . . . . . . . 58
5.4. Summary . . . . . . . . . . . . . . . . . . . . . . . . . . . . . . . 62
Acknowledgements 63
References 64
Appendix 67
A. Application Manual for ROSA: PC . . . . . . . . . . . . . . . . . 67
Interface Overview . . . . . . . . . . . . . . . . . . . . . . 67
Functionality and Operations . . . . . . . . . . . . . . . . 69
B. Application Manual for ROSA: Mobile . . . . . . . . . . . . . . . 73
C. PhP Code Sample . . . . . . . . . . . . . . . . . . . . . . . . . . . 75
D. JavaScript Code Sample . . . . . . . . . . . . . . . . . . . . . . . 76
iv
List of Figures
1.1 Foursquare Interface . . . . . . . . . . . . . . . . . . . . . . . . . 1
1.2 Brightkite Interface . . . . . . . . . . . . . . . . . . . . . . . . . . 2
1.3 Gowalla Interface . . . . . . . . . . . . . . . . . . . . . . . . . . . 3
1.4 Facebook Nearby Feature . . . . . . . . . . . . . . . . . . . . . . 4
2.1 A User’s Description about Her Mental Map . . . . . . . . . . . . 12
2.2 The Mapping between Absolute and Relative Locations . . . . . . 15
2.3 Two-Layer Location Model . . . . . . . . . . . . . . . . . . . . . . 18
2.4 Database Schema . . . . . . . . . . . . . . . . . . . . . . . . . . . 20
2.5 MVC Framework of RLOSN API Library . . . . . . . . . . . . . . 21
2.6 Class Overview of RLOSN API Library . . . . . . . . . . . . . . . 22
2.7 Overview of Class LocInfo and Class Line . . . . . . . . . . . . . 23
2.8 Distributed Data Retrieval Process . . . . . . . . . . . . . . . . . 24
2.9 a sample data set retrieved from Foursquare . . . . . . . . . . . . 26
2.10 display location information according to relation strength . . . . 26
2.11 passively collected data . . . . . . . . . . . . . . . . . . . . . . . . 27
2.12 actively collected data . . . . . . . . . . . . . . . . . . . . . . . . 28
3.1 User Case Graph . . . . . . . . . . . . . . . . . . . . . . . . . . . 32
3.2 System Components . . . . . . . . . . . . . . . . . . . . . . . . . 33
3.3 UML Model Graph . . . . . . . . . . . . . . . . . . . . . . . . . . 34
3.4 Level 1 Dataflow Diagram . . . . . . . . . . . . . . . . . . . . . . 35
3.5 Level 2 Dataflow Diagram . . . . . . . . . . . . . . . . . . . . . . 36
3.6 UML State Machine Diagram . . . . . . . . . . . . . . . . . . . . 37
v

3.7 Server Side Programme Language . . . . . . . . . . . . . . . . . . 37
3.8 Interaction Flow Diagram . . . . . . . . . . . . . . . . . . . . . . 41
3.9 Mental Map Like Interface . . . . . . . . . . . . . . . . . . . . . . 42
3.10 Information Density Contrast between ROSA(upper) and Google
Map(lower) . . . . . . . . . . . . . . . . . . . . . . . . . . . . . . 45
3.11 A Typical User Travel Plan . . . . . . . . . . . . . . . . . . . . . 46
4.1 Absolute location oriented interface shows every location equally . 47
4.2 Relative location oriented interface shows locations differently based
on relations . . . . . . . . . . . . . . . . . . . . . . . . . . . . . . 48
4.3 Web Traffic Result . . . . . . . . . . . . . . . . . . . . . . . . . . 51
4.4 Load Test Results . . . . . . . . . . . . . . . . . . . . . . . . . . . 52
4.5 Scalability Test . . . . . . . . . . . . . . . . . . . . . . . . . . . . 53
4.6 RESTful Test Results . . . . . . . . . . . . . . . . . . . . . . . . . 54
4.7 Interface Usability Test . . . . . . . . . . . . . . . . . . . . . . . . 55
5.1 Graph Database . . . . . . . . . . . . . . . . . . . . . . . . . . . . 59
5.2 The Initial Interface of ROSA . . . . . . . . . . . . . . . . . . . . 67
5.3 Toolbar Area . . . . . . . . . . . . . . . . . . . . . . . . . . . . . 68
5.4 The Location Card . . . . . . . . . . . . . . . . . . . . . . . . . . 69
5.5 User Login . . . . . . . . . . . . . . . . . . . . . . . . . . . . . . . 69
5.6 User Defined Location . . . . . . . . . . . . . . . . . . . . . . . . 70
5.7 Show Defined Location Information . . . . . . . . . . . . . . . . . 70
5.8 Add General Relation . . . . . . . . . . . . . . . . . . . . . . . . 71
5.9 Switch To Route Relation . . . . . . . . . . . . . . . . . . . . . . 71
5.10 Load Schedule . . . . . . . . . . . . . . . . . . . . . . . . . . . . . 72
5.11 Create URL for Sharing . . . . . . . . . . . . . . . . . . . . . . . 72
5.12 Share Schedules on Facebook . . . . . . . . . . . . . . . . . . . . 73
5.13 Recommendation Interface . . . . . . . . . . . . . . . . . . . . . . 74
5.14 Handle Recommendation . . . . . . . . . . . . . . . . . . . . . . . 74
vi

5.15 Mobile Interface . . . . . . . . . . . . . . . . . . . . . . . . . . . . 75
vii

List of Tables
3.1 User RESTful API . . . . . . . . . . . . . . . . . . . . . . . . . . 40
4.1 Interface Usability Results . . . . . . . . . . . . . . . . . . . . . . 56
viii

1.
Location Based Social Networks
1.1. What are Location Based Social Networks?
Traditional location based social networks(LBSN), generally refer to online
social networks with location information included[13]. The pervasion of
GPS built-in smart devices, location based services and the soaring application of
online social networks have paved the way towards the birth of LBSN. As a result,
we witnessed a booming of LBSN at the beginning of this century: Brightkite,
Foursquare, Gowalla, and etc. Online social networks such as Twitter(founded in
2006), Factebook(founded in 2004) also have developed their own location related
features.
Figure 1.1: Foursquare Interface
1

• Foursquare. Founded in 2009 and claimed to have 45 million members by
the end of 2013. On one hand, it allowed members to share their locations,
tips, and likes with friends allowing the service to recommend places and
ideas for activity to its members. On the other hand, it allowed businesses
to benefit through information about potential customers, offer promotions,
and snag and maintain customer interest in a product or venue.
• Brightkite. Founded in 2007 and already stopped their services. Brightkite
was based on the idea of making check-ins at places, where users can see who
is nearby and who has been there before. It primarily oriented for location
sharing.
Figure 1.2: Brightkite Interface
• Gowalla. Founded in 2007, acquired by Facebook in 2011, and subsequently
shut down. It was very popular LBSN that morphed into a service that
supported curated city and location guides using information provided by
its members. The primary objective of Gowalla was for the members to
2

explore interesting locations called “spots” and check-in at such locations,
using categories such as nature walks, pubs, and landmarks. It was able to
provide place recommendations for its members and anyone accessing the
service with information, tips, photos, and other information about places,
locales, and venues in a city.
Figure 1.3: Gowalla Interface
With LBSN, personal users can be kept abreast of relevant information, ar-
range real-world meeting, explore one’s current environment, participate in social
gaming, and share locations and keep personal location history[18]. Besides, com-
panies and enterprises also leverage the power of LBSN to “infer the habits and
interests of particular demographics.” and “project businesses into public con-
scious without the need for expensive advertising campaigns”[18]
As the objective of this thesis, however, we will expand the concept of traditional
location based social networks to a broader scope: networks that consist of
both location information and social features, and any applications and
services constructed on the basis of this kind of networks. We don’t
actually care about any concrete top-layer applications though. Instead, our focus
3
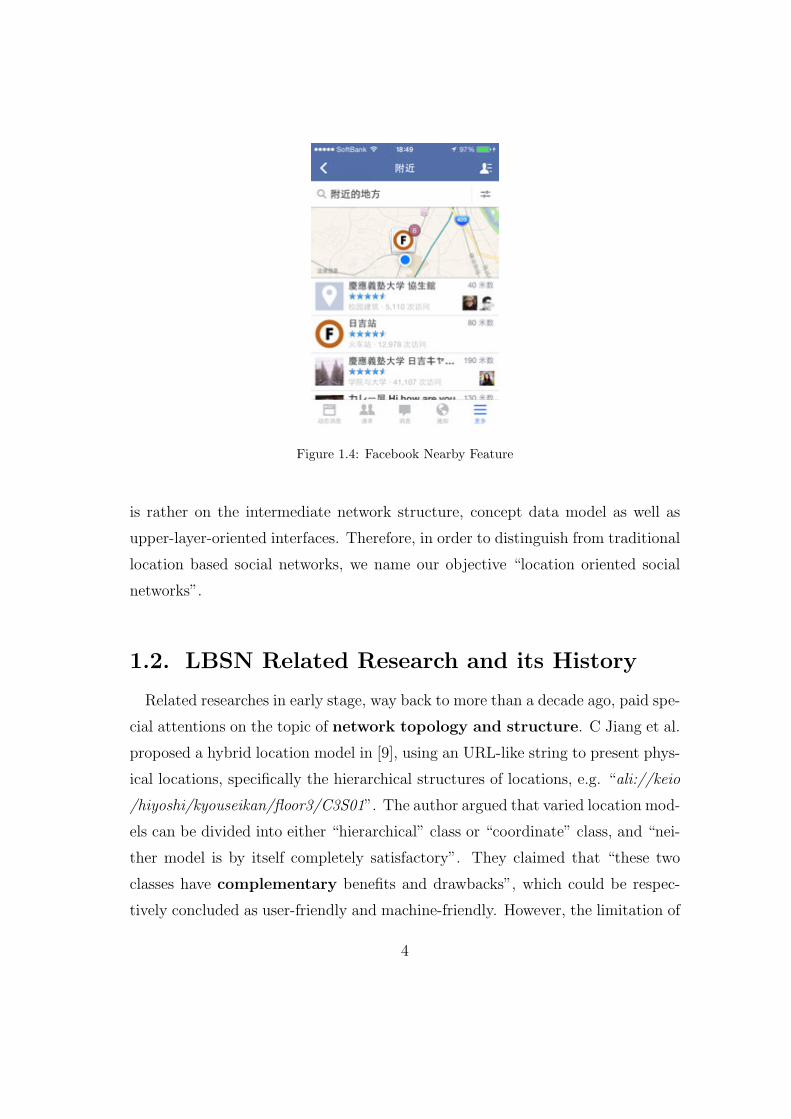
Figure 1.4: Facebook Nearby Feature
is rather on the intermediate network structure, concept data model as well as
upper-layer-oriented interfaces. Therefore, in order to distinguish from traditional
location based social networks, we name our objective “location oriented social
networks”.
1.2. LBSN Related Research and its History
Related researches in early stage, way back to more than a decade ago, paid spe-
cial attentions on the topic of network topology and structure. C Jiang et al.
proposed a hybrid location model in [9], using an URL-like string to present phys-
ical locations, specifically the hierarchical structures of locations, e.g. “ali://keio
/hiyoshi/kyouseikan/floor3/C3S01”. The author argued that varied location mod-
els can be divided into either “hierarchical” class or “coordinate” class, and “nei-
ther model is by itself completely satisfactory”. They claimed that “these two
classes have complementary benefits and drawbacks”, which could be respec-
tively concluded as user-friendly and machine-friendly. However, the limitation of
4

this plot was apparent though, since these kinds of top-down methods could not
capture other semantic properties, such as a place’s functions, and were difficult
to scale up. Actually, rather than hierarchical models, as we may find out later
in this paper, correlated location models is more likely to be complementary to
the absolute coordinate models, since hierarchy, functionality and other spatial
relations can be all concluded as correlation between locations.
Almost at the same time, researchers became curious about users’ motivation
to share their locations and started to explore the area of user behavior anal-
ysis. S. Consolvo et al. conducted a series of user study by mainly questionnaire
methodology and stated in [5] that what kind of location information and in which
way it is shared depended primarily on the relationship between the sharer and
recipient and the purpose of sharing. Users were likely to disclose the most useful
information instead of the most detailed one about their locations. This conclu-
sion was then further strengthened by the research of J. Lin et al.[11], in which
they suggested that the relationship between familiarity and the choice of place
names is not linear. A simple but interesting example from our daily life can
illustrate this: when asked by an unfamiliar friend about our current location, we
may simply replied with “at home”; the same goes with the occasion when asked
by a close family member. Detailed geographic names, such as postal address,
were most likely to be used when people of medium familiarity required our ad-
dress. This phenomenon, in its deepest nature, reflected an innate asymmetry
between the sharer’s and the recipient’s knowledge about locations. As a result,
the same information became “no use to know” for some recipients, while “no
need to know” for the other. While this kind of researches relied highly on users’
subjective responding to certain hypothetical situations without actually sharing
their locations, the result might be highly limited to the examinees’ personal iden-
tities, experiences, moods and so on, while examinees’ behaviors may differ when
they were unware of the test purpose or their locations being actually shared.
Therefore, another branch of user behavior researchers began to collect and
5
study user data via commercial LBSN services, mainly the “check-in”s of a user.
N. Li et al. took Brightkite as their data pool, from which they extracted and
studied user features like social graphs, update pattern, mobility and etc.[10]
S. Scellato collected check-ins from Gowalla and studied how location factor af-
fected the accuracy of predicting a potential social friend[17]. They claimed that
they were able to narrow the prediction space down to 15 times smaller while
still maintain 66% of future social links discovery, since “30% of the new social
links were among ‘place-friends’ ”, in another word, people who shared similar
location visiting patterns were more likely to become friends. Further in an-
other research[16], S. Scellato made a transversal comparison among Gowalla,
Brightkite, and Foursquare users properties and came to a general conclusion
that LBSN’s “social-spatial structure can not be explained by taking into account
only geographic factors or social mechanisms.” However, “check-in”s, or say data
collected from LBSNs, not only identified the utilitarian aspect, but also the self-
presentation aspect of users[12],[6]. By selecting to share which places they had
been, most LBSN users were shaping their own social images either consciously or
unconsciously. And to most people, checking in LBSN was something they would
do only when they were not in a hurry or they felt themselves in their comfort
zone. That could be an explanation that why we are more often to see check-ins at
a restaurant during lunch time, than someone checks in at hospital while he or she
was sick. Moreover, many LBSNs don’t verify users’ real geographical positions
and allow users to modify the final location they uploaded. Therefore, check-ins
may not necessarily reveal the whole, actual scenario of user activities, and by
this kind of fractional, unauthentic data hardly can we infer a complete, correct
model of user activity.
Based on the outcome of user behavior analysis, researchers further appliedma-
chine learning methodology to this topic. The main idea was to extract features
of user behavior patterns, select the most prominent ones to feed machine learning
models, such as support vector machine, decision tree and etc., and train these
6
algorithms to give pragmatic feedbacks in order to support users’ decision making
process. M. Ye et al. developed friend-based collaborative filtering approaches
for location recommendations, based on the premise that social friends could pro-
vide more valuable location recommendations than non-friends[22]. Since the
non-friends were ruled out, the computational overhead of the algorithms were
lowered down in the price of accuracy. Later in another research, they applied
support vector machine classifier to automatically attach semantic annotation to
different places[21]. By observing users’ check-ins patterns, they tried to extract
features of places from both so-called “explicit patterns” and “implicit related-
ness”. Take restaurants as an example, normally we could infer a place to be a
restaurant because it might have a bunch of visitors at around noon, which re-
ferred to the explicit patterns. Moreover, we could further suggest that different
places that visited by the same person also at noon may be restaurants as well,
which, respectively, referred to the implicit relatedness. As previously discussed,
check-ins has its own limitations, since it cannot actually redraw users’ activity
trajectories. In places that people rarely check in, it will be a difficult challenge
to distinguish what kind of place it is and give correct location tags. However, in
Ye’s paper we can see that there is a possibility that we can actually imply the
similarities, or say, the relations between different locations that is hidden behind
users’ visiting patterns.
Among all the LBSN-centered researches, the project “Geolife” by Y. Zheng et
al. from Microsoft Research Asia that worth specific attentions[23]. Based on the
correlations between location-location, user-location and user-user, this project
aimed at realizing a series of application scenarios. Main functions were con-
cluded as: 1) To share and query trajectories, e.g travel routes and itinerary; 2)
To recommend locations in either generic (calculating place popularity) or person-
alized (calculating social friends similarity) way; 3) To recommend friends based
on similar location histories; 4) To query and recommend activities related to
locations. This large-scale study touched all the three tracks of network topology,
7

user analysis as well as machine learning, and shared similar interests upon some
topics with our studies. Up until now, this is the most related research to this
thesis from the view of philosophy, goal and methodology. Despite that we don’t
actually involve the machine learning algorithms at current stage, this paper by
Y. Zheng et al. gave us a good vision at this aspect.
1.3. Current Issues and Contributions
From last century to now, a lot of brand-new concepts have emerged, from
“ubiquitous computing”, “cyber physical environment”, “web of things” to “con-
textual awareness”. Most of these researches are conducted in order to involve
cyber networks and physical reality together as a continuum so that the space en-
vironment around us can understand our needs more “smartly”, support our de-
cision making seamlessly, without actually interrupting our workflow. Locations,
as the container of human activities and various devices and sensors, are always
considered to be an important mesosphere interacting between users, physical
and virtual resources, thus are given specific emphasis in aforementioned studies.
However, after reviewing the history of LBSN research, we can see that current
problems lies mainly in the following three issues:
• The concept of “location”. In order to simplify geographical models and
lower the computational overhead, “location” has been regarded equal to
a pair of physical coordinates in traditional LBSN, consequently leading to
an unclear and vague understanding about this concept for a long period
in the past. This simplification may be beneficial to machine processing,
however, seems to be meaningless to human beings, since it is usually the
specific social meaning associated with the physical coordinates that people
care about, for instances, someone’s home, workplace, shopping place...and
etc. While this kind of social meaning may not stay static, if not changing
8

all the time, hence once changed, it would be difficult to retrieve by only
physical coordinates.
• The presentation of “location”. Now that the drawbacks of traditional
coordinate model has evoked studies on substitutive models, researchers
started to realize that spatial coordinates are definitely not the only pre-
sentation of a location. A previous discussed example was the research by
C Jiang et al.[9], which was constructed on the basis of location hierarchy.
This kind of presentation partially revealed the social attributes of locations,
while somehow incomplete. How to give an accurate presentation about lo-
cation and its related attributes, has became the second dilemma that we
have to face.
• The methodology of exploiting “location”. In order to discover the social
value that people attach to locations, recent LBSN study has shown a trend
to mine users’ activity data in depth, either by extracting check-ins from
existing LBSN service like M. Ye et al.[22], [21], or by automatically col-
lecting users’ trajectories by built-in GPS like in the research by Y. Zheng
et al.[23]. Whether and to which extent can this kind of backhanded data
manifests the map in users’ minds are still in need for further evaluation.
Then how about directly asking our users to expose their thoughts directly?
The incentives encouraging people to do so also remain a issue.
While the weak points of absolute coordinates model have long been criticized
and make-up proposals have been made in academia, traditional map cartogra-
phy and web search are still dominating most of today’s LBSN user interfaces.
In one of our previous papers, we concluded the loopholes of applications and
services adopting absolute coordinates framework as: 1) Inadequate usability 2)
Privacy concerns caused by disclosure of users’ absolute position 3) Lacks of con-
textual understanding 4) Unable to support users in activity level[15]. All these
problems above, strongly hampering the growth of LBSNs today, we believe in
9

their deepest nature are due to the discrepancy lying between the different
understanding of computers and human beings about the concept of
“location”.
1.4. Summary
Chapter 1 breifly introduced the concept of location based social network: On-
line social networks with location information included. In a chronological way,
the history of LBSN researches was discussed, mainly in three different tracks:
network topology and structure, user behavior analysis and machine learning.
This chapter also defined the objective the whole thesis as: networks that con-
sisit of both location information and social features, and any applications and
services constructed on the basis of this kind networks. To notice that, the scope
of this thesis does not include any concrete top-layer applications or services, in-
stead, it focused on the network model itself, which was a big difference from
traditional LBSN definition.
At the end of Chapter 1, current issues in LBSN researches were summarized
respectively in the concept, presentation and methodology. As a conclusion, we
argued that all the existing issues in their nature, were due to the discrepancy
between the computers’ and human beings’ understanding about locations.
10

2.
Relative Location: A
Relation-Oriented LBSN
Framework
2.1. What are Relative Locations?
As stated in Chapter 1, the research objective of this thesis will not be any spe-
cific applications or products. Instead, we would like to look at location oriented
social network as a whole, the paradigm of which can serve as an intermediate
layer to build up different sorts of top-layer services. To notice that unlike tradi-
tional LBSN and any other previous studies in this field, as important as its social
feature, location information itself is considered rather a parallel main body in
the network in this thesis, than just an inclusion attached to end users.
The reason to emphasize the independent status of locations lies in mainly three
aspects: 1) Locations are carriers of human activities, specifically mass activities.
2) Locations are also physical space containing various sensors, infrastructures and
devices. 3) Locations work as the hub communicating both the users, physical as
well as cyber resources.
At the initial stage of this study, we conducted a series of preliminary user
experiments applying “Think Aloud” strategy [19]. All 6 participators were sep-
arated into 3 groups, each group consisting of 1 females and 1 males, age ranging
from 19 to 43. Each group was assigned a target location, at the order of measur-
ing scale, from Hokkaido(50 km), Tokyo(3 km) to Akihabara(150 m). The task
11
was to ask single participator to create respectively a 7-day, 2-day and 3-hour visit
plan in 1.5 hours and participators could use all the available resources including
the Google map, online search engines, tour guidebooks or pamphlets, and etc.
During the procedure, participators were required to speak out what was going
on in their mind when doing the task. We arranged this experiment in this way in
order to rule out the effects that distance, age, genders and personal experiences
had on the subject itself to the least level, given the limited participator number
and diversity.
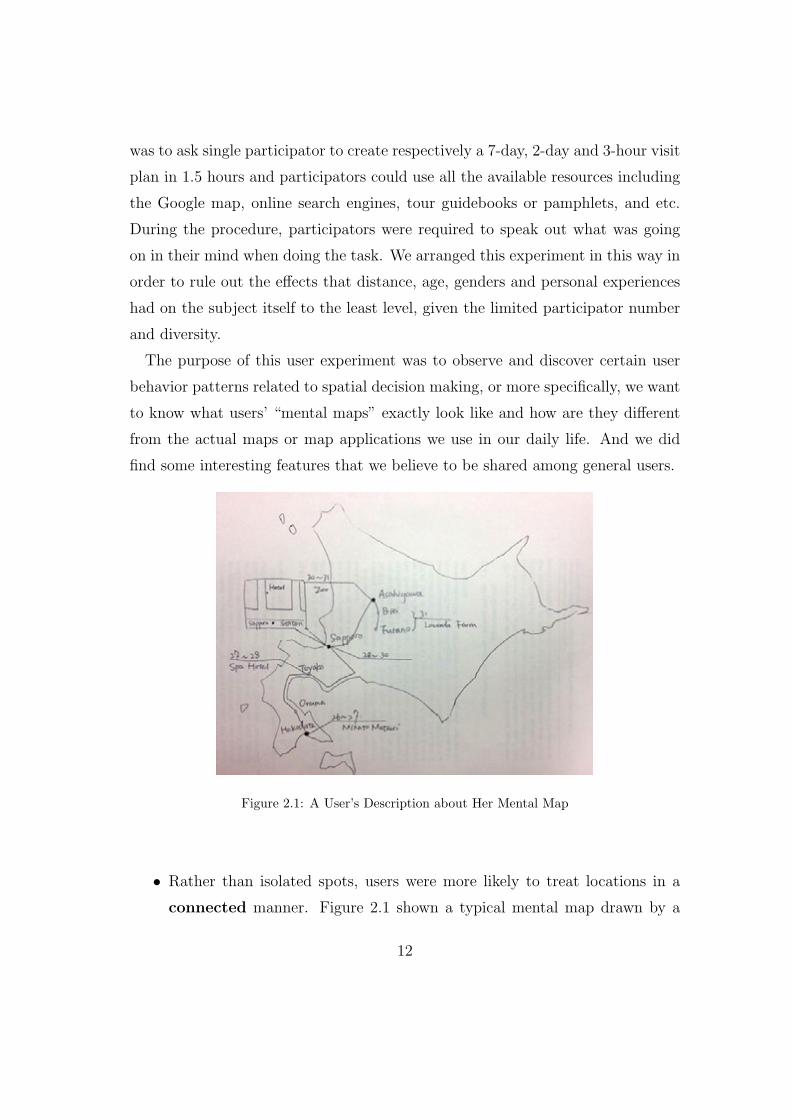
The purpose of this user experiment was to observe and discover certain user
behavior patterns related to spatial decision making, or more specifically, we want
to know what users’ “mental maps” exactly look like and how are they different
from the actual maps or map applications we use in our daily life. And we did
find some interesting features that we believe to be shared among general users.
Figure 2.1: A User’s Description about Her Mental Map
• Rather than isolated spots, users were more likely to treat locations in a
connected manner. Figure 2.1 shown a typical mental map drawn by a
12

user. This could also be saw in users’ oral descriptions about a location, e.g.
“Hiyoshi campus is on the opposite side of Hiyoshi station.”, in which the
station was regarded as a spatial reference to the university campus. On
the contrary, neither absolute coordinates nor postal addresses seemed to
be understandable enough to be used in daily communication.
• In most of the occasions, users arranged the visiting sequence according to
the importance of locations, instead of physical distances. We observed a
common phenomenon in our experiment that when provided a list of view
spots, users tended to first select a few major view points that were most
attractive to users, organize the itinerary, then add some less attractive
spots into the itinerary according to how much time was left and how far it
was to the selected major view points.
• Users sometimes schedule their visit according to special events. Despite
importance of locations, users would also shape their schedule according to
special events taking places in those places. Take the Hokkaido group as an
instance, during a one-week holiday from 20th to 26th, users could either
plan a visit like as Hakotate-Sapporo-Asahigawa, or at a reverse sequence
like Asahigawa-Sapporo-Hakotate. However, because there would be a spe-
cial Matsuri in Hakotate on 20th, both of the Hokkaido group participators
chose the former sequence.
• Naturally users were expecting a relatively higher “information density”
around the places that users considered to be important. While on the other
hand, users tended to erase irrelevant information or less important places
from the map. Users often sought for extra information like nearby restau-
rants, transportation, etc. around places users planned to visit, however,
ordinary map application, e.g. Google map, only provided a flat informa-
tion interface and hence users had to frequently zoom in, zoom out or refer
to other resources in order to get information they needed.
13

• Users’ queries sometimes were rather vague without explicit keywords, such
as a place name. It was not rare that we might know what kind of places to
go without knowing exactly which place to go. For example, Akihabara was
quite famous for its maid cafes. But a newcomer might become extremely
confused and did not know how to choose from among varied maid cafes.
That was something beyond the ability of current navigation applications,
from where we could see a clear difference between users’ mental maps and
the actual maps. Therefore we were in need of others’ opinions to help
make our own decisions. That’s one reason why public comments collecting
services such as Taberogu became popular. “Wisdom of crowd”, in the other
words, also plays an important role in assisting spatial decision making.
• Ad hoc applications and sparse information sources lower users’ efficiency
and increase the total overhead. In total, users had spent much more time
on seeking for location related infromation and switching from one tool
to another(average time:51 min 23 sec), than on planning visit itinerary
itself(average time: 22 min 41 sec). Just like the other human beings’ activ-
ities, people’s spatial decision making procedure involves multiple tasks as
well as multiple processes. However, concurrent ad hoc applications and ser-
vices support only specific single task, which, inevitably increases the total
overhead, since users have to manually aggregate the outputs from different
applications and services together[8],[3],[2].
We have reviewed many existing issues in current LBSN researches in Chapter
1 and strongly argued that they were caused by different understanding from the
machine side and human side about locations: Computers consider locations as
sparse isolated spots, while we human beings connect them.
In reality, varied relations widely exist among locations and locations, locations
and users, users and users...we believe that if make good use of those relations,
we could simulate a more natural, ideal model of the actual world, and further
narrow down the gap between human beings and computers. Thus, we come up
14

with our main concept: Relative locations.
2.2. How to Define Relations?
Let’s further elaborate the relations in LBSN from three different aspects.
Figure 2.2: The Mapping between Absolute and Relative Locations
Location-Location Relations
Today’s LBSNs regard location more as a certain physical space defined by
Cartesian coordinate system. However, in people’s minds as well as in our daily
conversations, a location is rather a concept space that defined by all kinds of
“social coordinates”, which refer to various relations, including but not limited
to: 1) Spatial adjacency, e.g. “Hiyoshi campus is on the opposite side of Hiyoshi
station.” 2) Hierarchical affiliation, e.g. “Mita campus and Hiyoshi campus all be-
long to Keio University.” 3) Function Similarity, e.g. “All the Ramen restaurants
around Hiyoshi.” 4) User customized relations, e.g. “home”, “work”, “places ap-
peared in xxx anime/TV drama”. Although current absolute coordinates based
mapping and navigation have already become mature and acquired high precision
15

and efficiency by leveraging GPS and Wifi positioning, we believe that naviga-
tion based on social concepts as well as corresponding location recommendation
system, still remain to be further exploited.
Location-User Relations
When we say exploiting users’ “mental maps”, we may notice that different
users’cognition towards same locations are actually diverse, so are users’ needs. If
we keep tracing a user’s daily trajectories during a long enough period, we may
find some special locations emerge. Generally it may be a place that the user
stays for a long time or frequently visits, e.g “home”, “work”, “school”; Or it
may be somewhere that the user wants to visit, e.g a destination; Or it may be a
place with special meaning to this very user. In the other words, some locations
possess stronger social correlations to a user thus stand out among the other
locations in the user’s mental map. It is an intuitive implications that users will
expect a relatively higher information density around these “important”, e.g “A
person cares more about the PM2.5 index around the places he lives and works
than other irrelevant places.” When single user’s trajectories accumulate to group
trajectories, we are able to obtain mass activities data that reflects public opinion
relations between locations and users in a larger scope, which may provide a more
interesting and valuable social mining perspective.
User-User Relations
Current social networks give us a mature paradigm of user-user relation model.
Explicitly in our RLOSN, user-user relations are mainly represented by the query
and share operation of users’ trajectories, and the introduction of “wisdom of
crowd” mechanism, which we will discuss in more details in the coming chapter.
Temporal Relations
The three kinds of relations mentioned above actually belong to horizonal rela-
tions, while there is also another kind of relations that we cannot ignore. Temporal
relations, or event-event relations, particularly stress on the vertical correlations
among locations, users and events. A typical example is the timeline feature of
16
locations in our RLOSN, which consists of a series of sequential events. The time-
lines of locations’ and users’ will intersect, and consequently form users’ activity
flow.
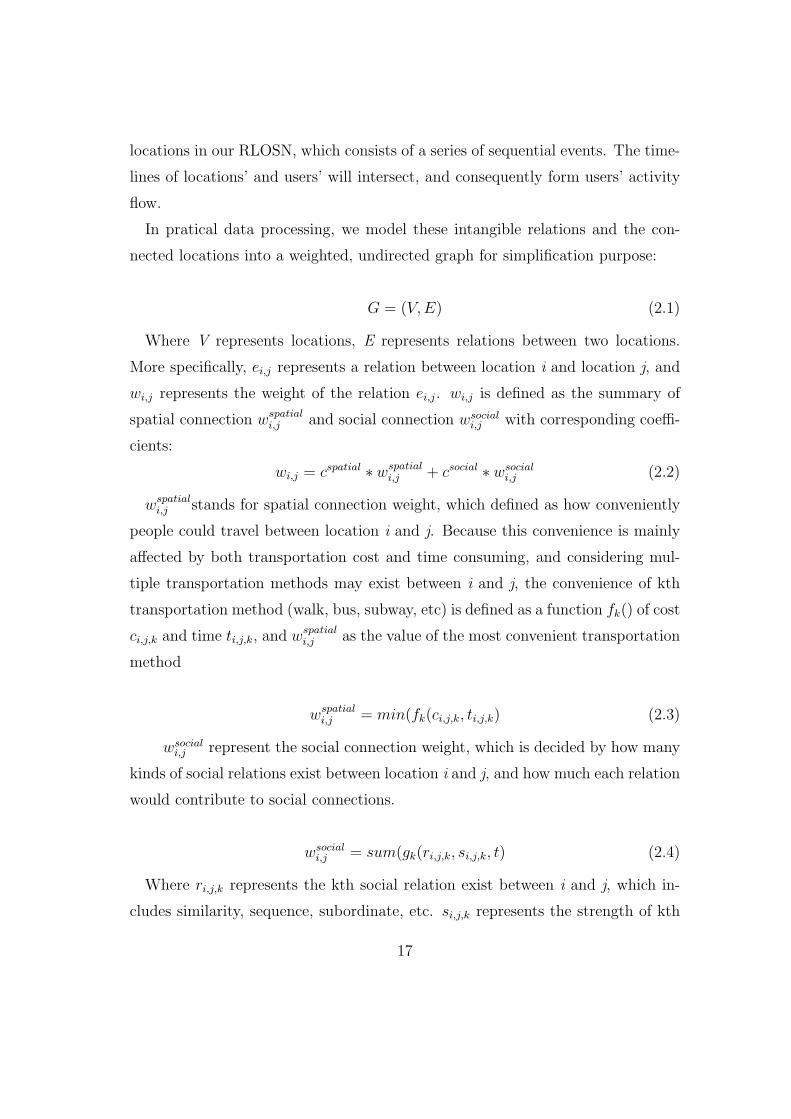
In pratical data processing, we model these intangible relations and the con-
nected locations into a weighted, undirected graph for simplification purpose:
G = (V,E) (2.1)
Where V represents locations, E represents relations between two locations.
More specifically, ei,j represents a relation between location i and location j, and
wi,j represents the weight of the relation ei,j. wi,j is defined as the summary of
spatial connection wspatiali,j and social connection wsocial
i,j with corresponding coeffi-
cients:
wi,j = cspatial ∗ wspatiali,j + csocial ∗ wsocial
i,j (2.2)
wspatiali,j stands for spatial connection weight, which defined as how conveniently
people could travel between location i and j. Because this convenience is mainly
affected by both transportation cost and time consuming, and considering mul-
tiple transportation methods may exist between i and j, the convenience of kth
transportation method (walk, bus, subway, etc) is defined as a function fk() of cost
ci,j,k and time ti,j,k, and wspatiali,j as the value of the most convenient transportation
method
wspatiali,j = min(fk(ci,j,k, ti,j,k) (2.3)
wsociali,j represent the social connection weight, which is decided by how many
kinds of social relations exist between location i and j, and how much each relation
would contribute to social connections.
wsociali,j = sum(gk(ri,j,k, si,j,k, t) (2.4)
Where ri,j,k represents the kth social relation exist between i and j, which in-
cludes similarity, sequence, subordinate, etc. si,j,k represents the strength of kth
17

relation. And gk() indicates in what manner the kth relation will affect social con-
nections between i and j. Since these social relations are usually time triggered
or event driven in a certain point of time, the time variable t is included.
2.3. A Socio-Spatial Location Model
The modeling of location should well balance the machine utilization and human
understanding, as well as the physical space and conceptual space. So we define
elements as follows:
Identifier: machines could use this ID to find location accurately and quickly.
ID may have no actual meaning to human, for example: Facebook use a string of
numbers (id=557055802), www use 4 strings of numbers (divided by dot). How-
ever, most applications also use human understandable id for user’s convenience,
e.g. “www.facebook.com/kierdarby” refers to the same user as “www.facebook.com
/profile.php?id=557055802”, “www.keio.co.jp” refers to the same website as “68.23
2.45.253”.
Figure 2.3: Two-Layer Location Model
Coordinates: physical space is defined by coordinates, they are identical, like
most LBS do.
18
Address: Address is designed to be compatible to post address, they are also
identical.
Location relation: In every user’s thoughts, locations doesn’t exist separately.
On the contrary, they are related with each other and exist like a complex network.
Relation is the core mechanism when users address location related problems in
their opinion space.
Event: Event refers to human activity related to a certain location.
Opinion: Opinion refers to a certain user’s thoughts when he or she take part
in location related activities.
User: User mean a certain person who uses a certain LBSN application or
service.
By using location as a bridge, we could easily weave space, users, activities
and opinions together, which will better organize spatial knowledge to support
decision making. However, this goal will not be achieved automatically, unless we
use a complete model of both absolute location and relative location to connect
physical space with opinion space. Hence, here we propose a two-layer location
model, as shown in Figure 2.3.
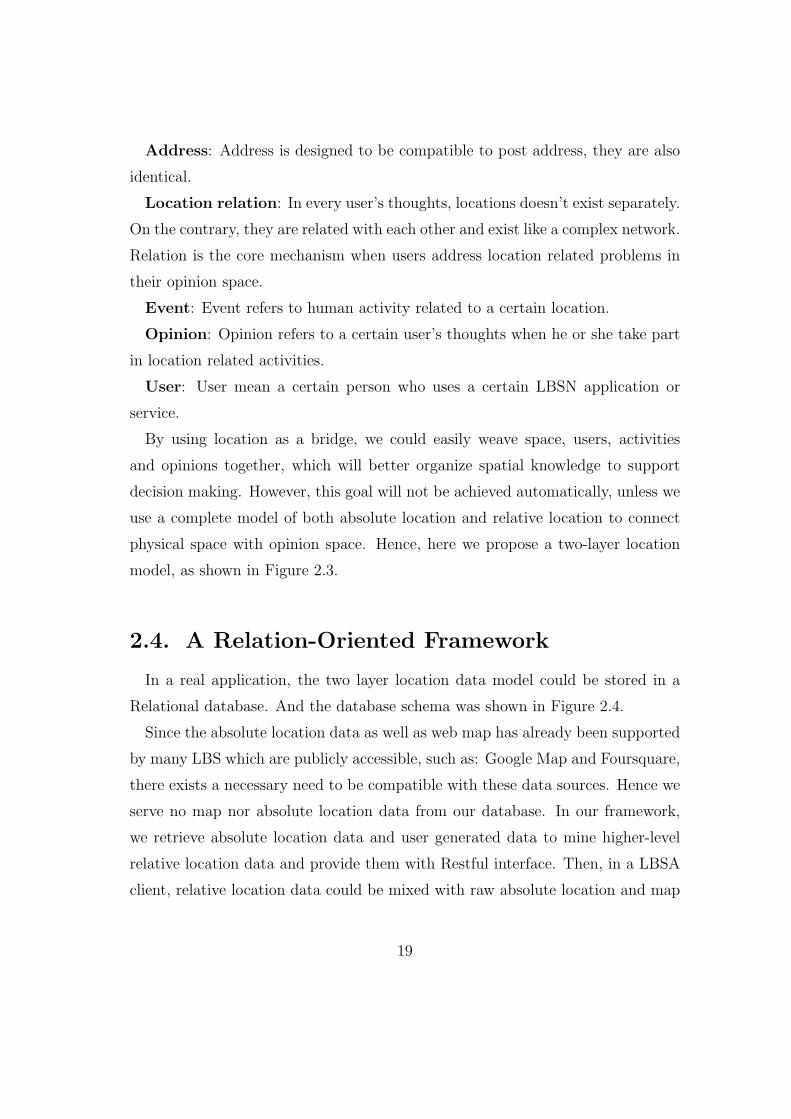
2.4. A Relation-Oriented Framework
In a real application, the two layer location data model could be stored in a
Relational database. And the database schema was shown in Figure 2.4.
Since the absolute location data as well as web map has already been supported
by many LBS which are publicly accessible, such as: Google Map and Foursquare,
there exists a necessary need to be compatible with these data sources. Hence we
serve no map nor absolute location data from our database. In our framework,
we retrieve absolute location data and user generated data to mine higher-level
relative location data and provide them with Restful interface. Then, in a LBSA
client, relative location data could be mixed with raw absolute location and map
19
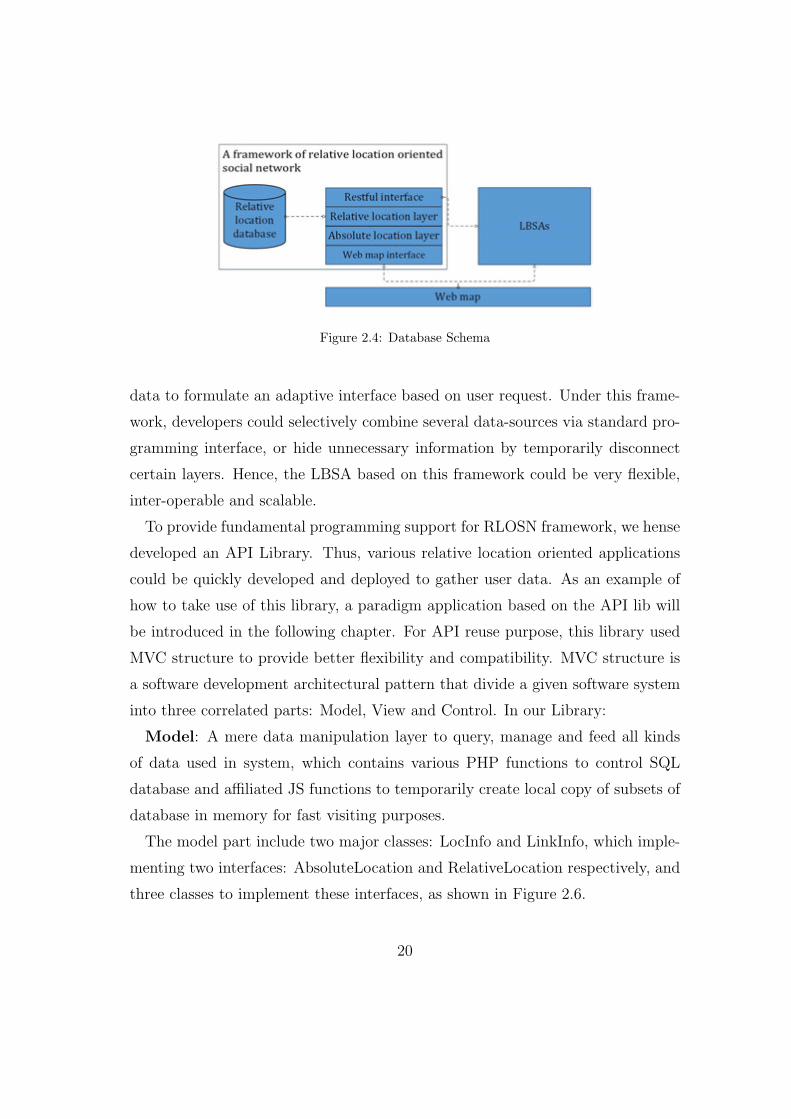
Figure 2.4: Database Schema
data to formulate an adaptive interface based on user request. Under this frame-
work, developers could selectively combine several data-sources via standard pro-
gramming interface, or hide unnecessary information by temporarily disconnect
certain layers. Hence, the LBSA based on this framework could be very flexible,
inter-operable and scalable.
To provide fundamental programming support for RLOSN framework, we hense
developed an API Library. Thus, various relative location oriented applications
could be quickly developed and deployed to gather user data. As an example of
how to take use of this library, a paradigm application based on the API lib will
be introduced in the following chapter. For API reuse purpose, this library used
MVC structure to provide better flexibility and compatibility. MVC structure is
a software development architectural pattern that divide a given software system
into three correlated parts: Model, View and Control. In our Library:
Model: A mere data manipulation layer to query, manage and feed all kinds
of data used in system, which contains various PHP functions to control SQL
database and affiliated JS functions to temporarily create local copy of subsets of
database in memory for fast visiting purposes.
The model part include two major classes: LocInfo and LinkInfo, which imple-
menting two interfaces: AbsoluteLocation and RelativeLocation respectively, and
three classes to implement these interfaces, as shown in Figure 2.6.
20

Figure 2.5: MVC Framework of RLOSN API Library
Each class have multiple related functions to handle attributes or communicate
with other objects, for example, marker object in view part. To better manage
an array of locations, we also provided easy-to-use functions to add, find, move
or delete LocInfo in array. For fast-prototype purposes, we have not added those
functions as member functions yet. However, this work could be easily done while
we think everything is ready and a stable beta version will be released. Due
to limited space, we could not give all the details of every classes and related
functions. The class of LocInfo and part of related functions are given below as
an example, anyone who have interest could contact authors for more details.
View: A mere presentation layer to render location data (both absolute and rel-
ative) on a map interface, which contains various HTML elements and JS functions
to deal with data visualization. Users will not worry about transform between
data and visual components. Just feed the data to desired service I/O interface,
and everything will be there.
21

Figure 2.6: Class Overview of RLOSN API Library
The view part include four major classes: map, marker, infoBox, and line, which
are used to create and update various view components. For example, a line object
as an instance of line class handles a single line on the map view. Draw a line on
the map is a simple task, however use lines to visualize various kinds of relation
is a whole different story. To achieve this task, we wrapped various kinds of line
implementations in the line class: straight or curve, continuous or dot, along the
road or railway. Other features like: how to create, modify and delete lines, how
to manage a line array, and how to visualize lines according to strength are also
taken good care of. All kinds of features could be controlled by simple commands.
Event handlers to update view components according to certain event dis-
patched from control part are also well designed, such as: click, drag and drop.
Considering the potential use in mobile devices, the tangible interaction events
22

Figure 2.7: Overview of Class LocInfo and Class Line
are also supported.
Due to limited space, details of other classes are not provided in this paper.
They are also implemented in the same way and provide carefully designed func-
tionality which suits our framework’s requirements. For example, the infoBox are
designed to be capable of displaying a whole other webpage in it, include: texts,
pictures, videos, links, buttons, or even runtime variable elements. Thus one could
better retrieve and represent location information in user’s thoughts.
Control: A mere action layer to add listeners, such as user input or system
events, and communicate with the other two layer, for example, tell view layer to
update some visual elements.
The control part include three major classes: FB, FS, which are used to com-
municate with external api, such as Facebook and Foursquare; and DB, which are
23
used to communicate with internal database api provided by our own. All the
data retrieval procedural could be called with the same process, either external or
internal, which include four steps, while the last three may be executed as a loop
for several times:
Figure 2.8: Distributed Data Retrieval Process
First, initialize(). In this step, parameters are set for next steps, such as: user
name, password, remote call address.
Second, ajax(). In this step, a remote procedural is called asynchronously to re-
trieve data, which is implemented as an Ajax function. Ajax means Asynchronous
JavaScript and XML, which is a set of standard web technologies to send data
to, and retrieve data from, a server asynchronously in the background without
interfering with the view part and control part. This feature makes it very suited
for our distributed-services framework.
Third, interpreter(). In this step, retrieved raw data, most frequently wrapped
in a JSON format, are interpreted into our own data model, which is defined in
Model part.
Finally, eventDispatcher(). In this step, events are dispatched to corresponding
handler to trigger data processing or view update.
24
2.5. Data Collecting and Mining Mechanisms
If all kinds relations weave together and hence construct the grand networks of
relative locations, the core of them, in fact is user activity data. Therefore, it is
the crucial challenge that in what way we collect and mine the data, and how we
refine different relations out of this massive complicated data.
Data Collecting
There were actually three data sources for our research:
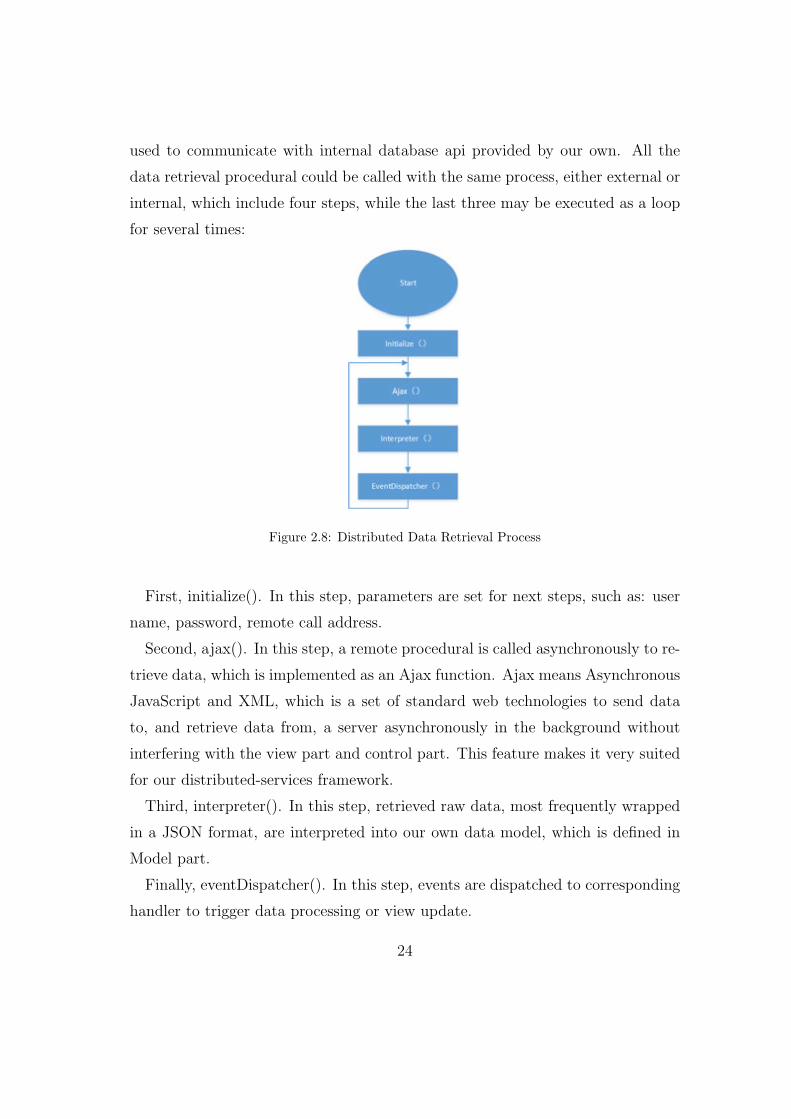
1) Crawling from existing LBSNs. Commercial LBSNs, e.g Foursquare,
Instagram etc. Have already successfully gathered a large amount of user groups
and by taking advantages of their open APIs we were able to obtain necessary
data to build up our initial location relations.
The construction of initial relations highly relies on existing LBSNs, e.g. Foursquare,
to obtain necessary absolute location data and compute desired relative loca-
tion data. Although technically we could use a web spider to continuously crawl
foursquare data and eventually make a local copy, this kind of large scale crawl-
ing will violate Foursquare’s term of use. Hence, in our system, we didn’t save
any foursquare data (or other third-party data) in our database, instead we use
a RESTful interface to retrieve foursquare data at runtime. Thanks to today’s
high speed internet and web service technology, this method could also provide
acceptable performance. In practice, while the user send a query, the application
will initialize a remote call procedure using Ajax to retrieve Facebook data on the
background. The user will not notice the whole process, until the data is ready,
the application will update the interface accordingly. For example, while the user
query “keio university, yokohama, kanagawa prefecture”, the application will au-
tomatically use “next venue” api to retrieve data from Foursquare. Retrieved data
will be return in JSON format, and could be interpreted as an object array, like
what we printed in the console of browser:
Here, an array contains 30 objects was returned (the array length is defined by
algorithm, and may be tweaked to achieve better performance), each object con-
25

Figure 2.9: a sample data set retrieved from Foursquare
tains various location attributes retrieved from Foursquare data. Some important
attributes, such as: referralId, which could be used to trace more related loca-
tion; stats, which contains user statistics and used in our application to compute
strength of relation. After computing, these data will influence the appearance of
each location in main interface according to strength of relation, as shown below.
Figure 2.10: display location information according to relation strength
2) Recording massive users’ activity data by our web applications, also called the
26
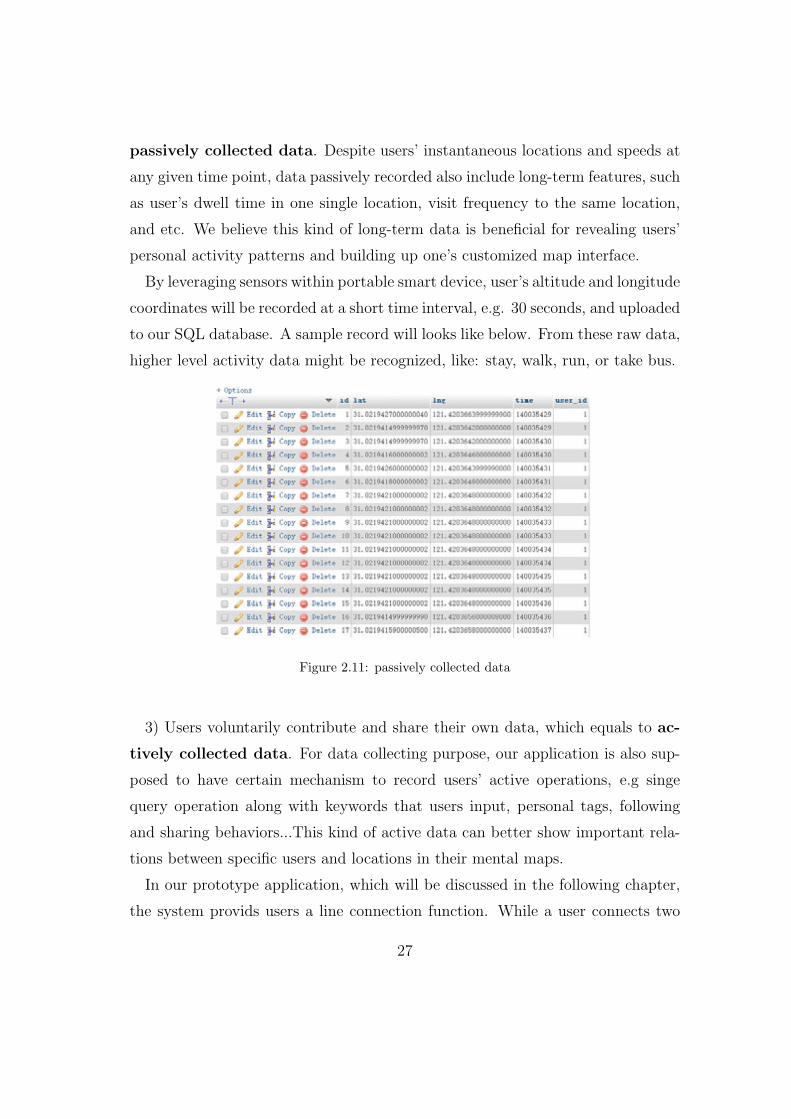
passively collected data. Despite users’ instantaneous locations and speeds at
any given time point, data passively recorded also include long-term features, such
as user’s dwell time in one single location, visit frequency to the same location,
and etc. We believe this kind of long-term data is beneficial for revealing users’
personal activity patterns and building up one’s customized map interface.
By leveraging sensors within portable smart device, user’s altitude and longitude
coordinates will be recorded at a short time interval, e.g. 30 seconds, and uploaded
to our SQL database. A sample record will looks like below. From these raw data,
higher level activity data might be recognized, like: stay, walk, run, or take bus.
Figure 2.11: passively collected data
3) Users voluntarily contribute and share their own data, which equals to ac-
tively collected data. For data collecting purpose, our application is also sup-
posed to have certain mechanism to record users’ active operations, e.g singe
query operation along with keywords that users input, personal tags, following
and sharing behaviors...This kind of active data can better show important rela-
tions between specific users and locations in their mental maps.
In our prototype application, which will be discussed in the following chapter,
the system provids users a line connection function. While a user connects two
27
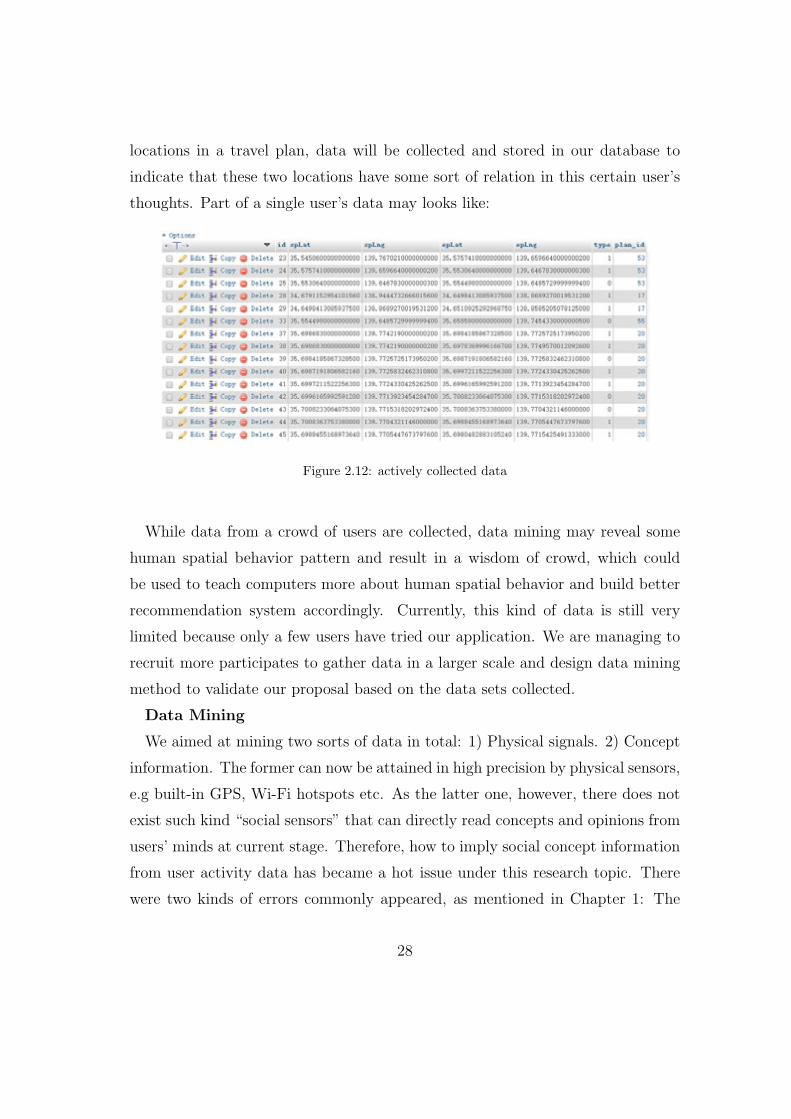
locations in a travel plan, data will be collected and stored in our database to
indicate that these two locations have some sort of relation in this certain user’s
thoughts. Part of a single user’s data may looks like:
Figure 2.12: actively collected data
While data from a crowd of users are collected, data mining may reveal some
human spatial behavior pattern and result in a wisdom of crowd, which could
be used to teach computers more about human spatial behavior and build better
recommendation system accordingly. Currently, this kind of data is still very
limited because only a few users have tried our application. We are managing to
recruit more participates to gather data in a larger scale and design data mining
method to validate our proposal based on the data sets collected.
Data Mining
We aimed at mining two sorts of data in total: 1) Physical signals. 2) Concept
information. The former can now be attained in high precision by physical sensors,
e.g built-in GPS, Wi-Fi hotspots etc. As the latter one, however, there does not
exist such kind “social sensors” that can directly read concepts and opinions from
users’ minds at current stage. Therefore, how to imply social concept information
from user activity data has became a hot issue under this research topic. There
were two kinds of errors commonly appeared, as mentioned in Chapter 1: The
28

source data, as the primary prerequisite, was incomplete or not accurate at the first
place, consequently the inference resulted in fallacy, e.g mining “check-ins” data to
attach sematic tags to locations. Or even the source data was correct, errors were
inevitable when mapping the physical signals into concept space. Therefore, it
might be a more efficient and precise solution, or at least a valuable compensation,
to introduce user control into machine computing, allowing our users to describe
their own thoughts. The issue was how to provide an encouraging mechanism to
give users incentives. We argue that to motivate ours users, by providing concept
information users can: 1) increase the system usability, as a result extra operations
can be saved and the total overhead lowered; 2) provide others, e.g users’ family
or friends, conveniences so that users’ emotional as well as social demands can be
satisfied; 3) obtain economic repay.
Moreover, current location-based data mining are mostly targeting a single lo-
cation. While under the framework of RLOSN, different locations are connected
to form a hive-structured network, thus existing network analysis methods can
also be applied to study the location features in network level, and researches in
larger scale can be carried out. One possible proposal is to apply “Pageranking”
algorithms to study location significance.
2.6. Summary
The main idea of this chaper was to describe the basic concepts of “relative
location” and RLOSN. A few interesting findings from the preliminary user ex-
periment of this study led to discrepency between users’ and machines’ under-
staning about locations. Then, four different sorts of relations were discussed,
namely the location-location relations, location-user relations, user-user relations
and temporal relations.
Based on the four kinds of relations, a double-layer location model that consisted
of social as well as spatial space was constructed and corresponding relation-
29

oriented framework was brought out.
Finally, we talked about the data collecting and mining mechanisms of RLOSN.
In conclusion, This chapter provided a theoretical blueprint for implementing
RLOSN.
30

3.
ROSA: A Paradigm
Implementation of RLOSN
3.1. Relative-location Oriented Schedule Assistant
As readers might already know, the proposed RLOSN is not directly end-user-
oriented in this thesis. It exists only as a mesosphere beyond the physical and
the network layers, while beneath the application layer. However, in real imple-
mentation, we have to create an original application on the basis of RLOSN. As
we stated in Chapter 2, data processing is one of the crucial part in RLOSN, so
a pragmatic application acting as a “data collector” is indispensable if we want
get actual user activity data as much as possible. Of course, as a holistic network
proposal, many of RLOSN’s functions and interfaces can be tailored to be adap-
tive to user-customized services or demands. However, in order to evaluate our
proposal comprehensively, we had been always seeking for an explicit application
or service that able to carry full features and functions of RLOSN. Moreover, one
of our core values, “relations”, we believe widely exist among locations, users and
themselves. In order to better practice this philosophy, we carefully devised our
prototype in a bottom-up method accordingly. User interface, as the top layer
directly interacting between users and RLOSN, is also an important carrier to
convey our value about “relations”. As a result, we came up with ROSA.
ROSA, short for Relative-location Oriented Schedule Assistant, is an online
hybrid application adopting RLOSN framework, whose main function is to assist
31
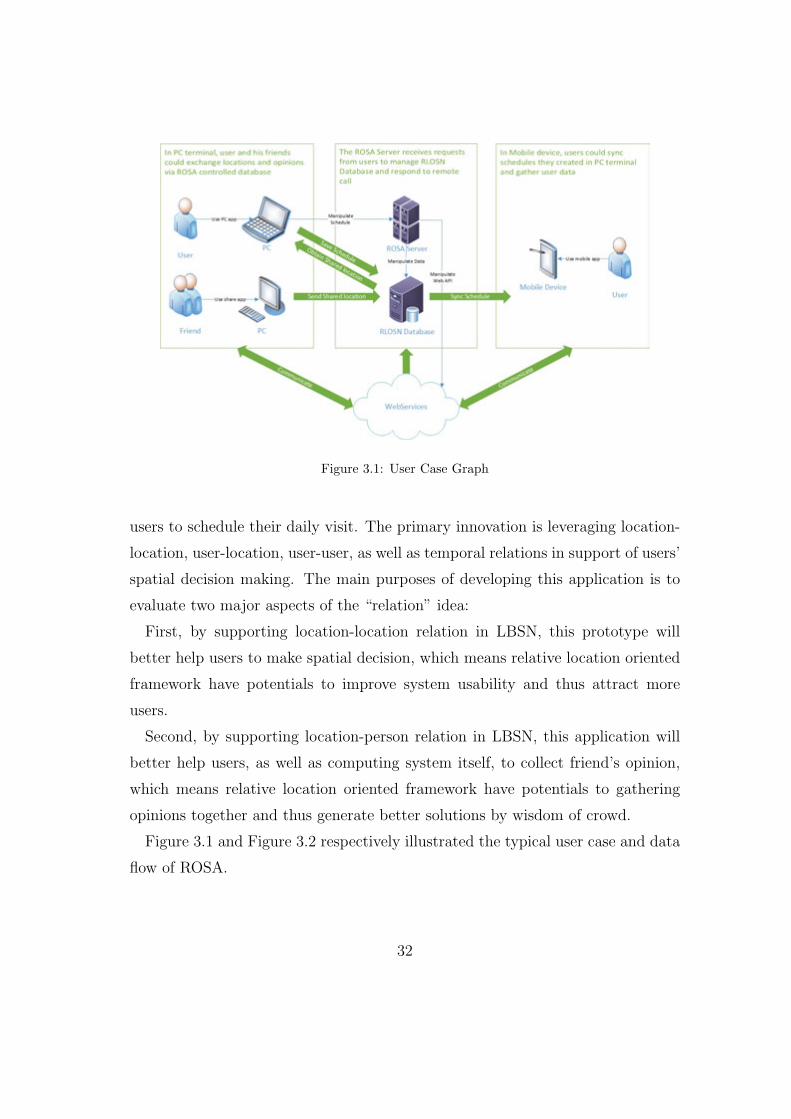
Figure 3.1: User Case Graph
users to schedule their daily visit. The primary innovation is leveraging location-
location, user-location, user-user, as well as temporal relations in support of users’
spatial decision making. The main purposes of developing this application is to
evaluate two major aspects of the “relation” idea:
First, by supporting location-location relation in LBSN, this prototype will
better help users to make spatial decision, which means relative location oriented
framework have potentials to improve system usability and thus attract more
users.
Second, by supporting location-person relation in LBSN, this application will
better help users, as well as computing system itself, to collect friend’s opinion,
which means relative location oriented framework have potentials to gathering
opinions together and thus generate better solutions by wisdom of crowd.
Figure 3.1 and Figure 3.2 respectively illustrated the typical user case and data
flow of ROSA.
32

Figure 3.2: System Components
3.2. System Design
Since the ROSA is developed based on RLOSN-API lib, to better summarize
the system structure and illustrate the interior mechanism under the interface,
database model, work flow, data flow as well as state machine diagrams are pre-
sented here to give a better overview.
In this prototype, we used a relational database to handle raw data, include:
absolute location data from web services and relative location data from our users.
The database could be defined by UML model as Figure 3.3:
More specifically, two major tables: relative location and absolute location is
given as below:
Relative Location
{
33

Figure 3.3: UML Model Graph
Integer Location ID as primary key, foreign key; //idendifier of location
String Location Name; //one absolute location may have multi names
Integer Address ID; //a reference to accurate address
Integer Absolute Location ID; // a reference to location coordinates
Integer Timeline ID; //a reference to timeline of activities
Integer User ID; //a reference to users
}Relation
{Integer relation ID as primary key; //the relation of two locations
Integer location1 ID; //one location
Integer location2 ID; //another location
Float relation strength; //strength of relation
34

Integer relation type; //reserved, type of relation
}
The level 1 data flow diagram using Gane-Sarson methodology is provided below
to show the major sub-system blocks (procedures, interfaces, and databases), and
how they are connected with each by various kinds of data flow.
Figure 3.4: Level 1 Dataflow Diagram
According to Gane-Sarson methodology, the whole ROSA system could be di-
vided into three kinds of sub-system (level 2): procedure (process data), interface
(input/output data), and database (store data). Each sub-system consists of mul-
tiple components, both API and system specific. For example, “create schedule”
sub-system contains five components: search absolute location, search relative
location, add marker, add route, save schedule. A level 2 data flow diagram of
“create schedule” sub-system is provided in Figure.
Each component may use several API functions in RLOSN lib which related to
model, view or control separately. Functions are executed according to certain
35
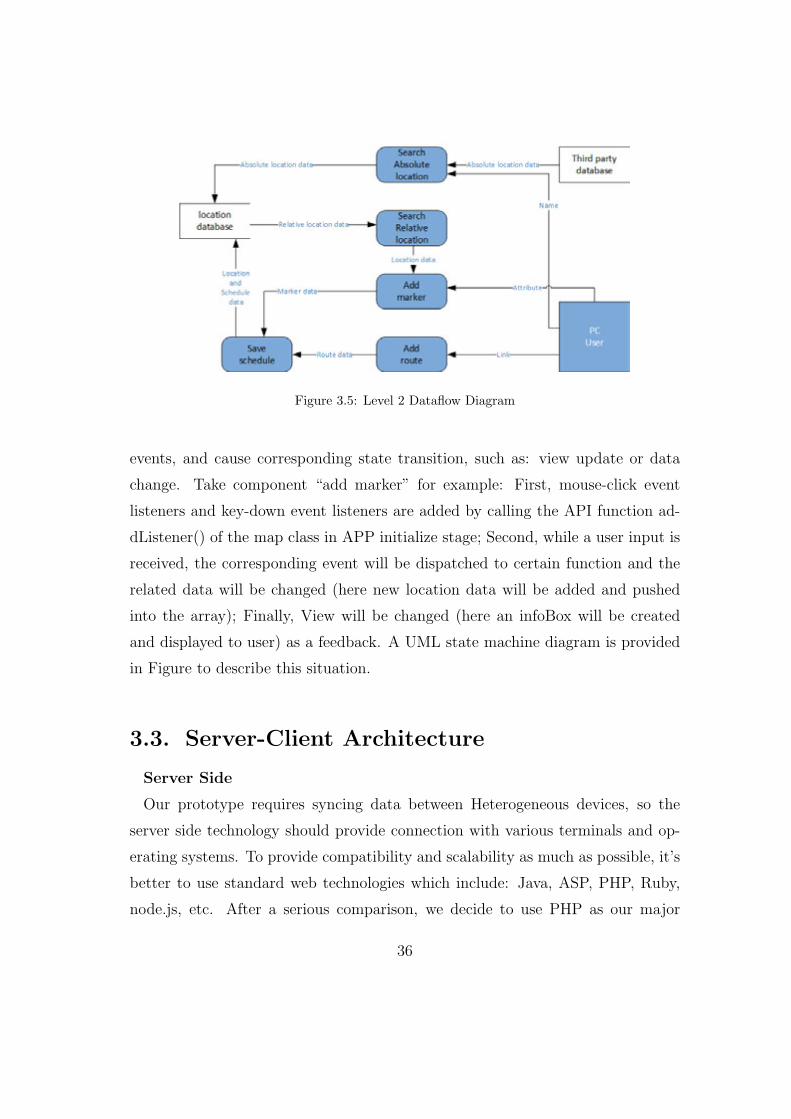
Figure 3.5: Level 2 Dataflow Diagram
events, and cause corresponding state transition, such as: view update or data
change. Take component “add marker” for example: First, mouse-click event
listeners and key-down event listeners are added by calling the API function ad-
dListener() of the map class in APP initialize stage; Second, while a user input is
received, the corresponding event will be dispatched to certain function and the
related data will be changed (here new location data will be added and pushed
into the array); Finally, View will be changed (here an infoBox will be created
and displayed to user) as a feedback. A UML state machine diagram is provided
in Figure to describe this situation.
3.3. Server-Client Architecture
Server Side
Our prototype requires syncing data between Heterogeneous devices, so the
server side technology should provide connection with various terminals and op-
erating systems. To provide compatibility and scalability as much as possible, it’s
better to use standard web technologies which include: Java, ASP, PHP, Ruby,
node.js, etc. After a serious comparison, we decide to use PHP as our major
36

Figure 3.6: UML State Machine Diagram
server-side development tool, the reason include:
Figure 3.7: Server Side Programme Language
First, most websites use PHP to develop server-side application, sum up 82.1%
as statistics by w3Techs.com. Also, PHP’s success in Facebook development
proved its capability to satisfy the requirements of developing large scale social
network application.
Second, PHP could co-exist with many other developing tools, such as: python,
or node.js.
37

Client Side
This prototype has two kinds of clients: PC and mobile device. Their functions
and requirements are quite different:
• PC client aims to provide a productive tool to help user connect with various
location data sources, include: physical spatial data provider like Google
Map, and opinion spatial data provider like friends or websites. Hence, App
in PC should: Be capable of providing quick response to large data flow; Be
compatible with most existing LBSN web APIs (Google Map, Foursquare,
Facebook, etc); Be user-friendly to support spatial decision making; AJAX
is a web technology meets our requirements.
• Mobile client aims to provide relatively simpler functions, merely sync data
from database server that generated by PC, record user data (such as sen-
sors, camera, or user input) on the way, and upload data occasionally. How-
ever, because of various mobile platform existed today and they are all
incompatible, such as: Android, IPhone and Windows Phone, mobile app
should take a technology framework that could easily porting from one plat-
form to another and automatically adapt to various hardware specifications,
such as screen resolution.
Several cross-platform library could support our requirements, such as: Cordova,
Xamarin, Unity. In this prototype development, we selected Cordova because it
is: Lightweight; Easy to use; Compatible with mainstream web developing tools,
like: html5, CSS, Javascript, JQuery Mobile, etc.
3.4. Web Service Interface
In case some procedures may need remote call functions of our application, we
are managing to provide a RESTful interface to provide service addressing. This
will help us to better integrate with distributed services seamlessly.
38

To retrieve data from database, one could use a traditional Ajax-PHP remote
call which may looks like:
$.ajax({
type: ‘post’,
async: false,
url: ‘php/sqlAddUser.php’,
data: userName: window.userName,
dataType: ‘json’,
success: function(data)
{//codes to realize program logic
}});
Or, many developers may prefer a routine closer to HTTP web standard, which
is called REST. REST means Representational State Transfer, which refers to an
architectural style that use mere HTTP manipulator such as: GET and POST,
and hide the details of implementation and protocol syntax in order to focus on
the roles of components. Our RESTful api use four methods to manipulate remote
data, which include:
GET to retrieve data,
POST to add data,
PUT to update existing data,
DELETE to delete data
The same function as remote call shown above, while use RESTful interface in
curl may looks like:
curl -X POST -H “Content-Type: application/json” -d ‘“userName”: “xxx”’
http://reloc-rosa.com/user
39
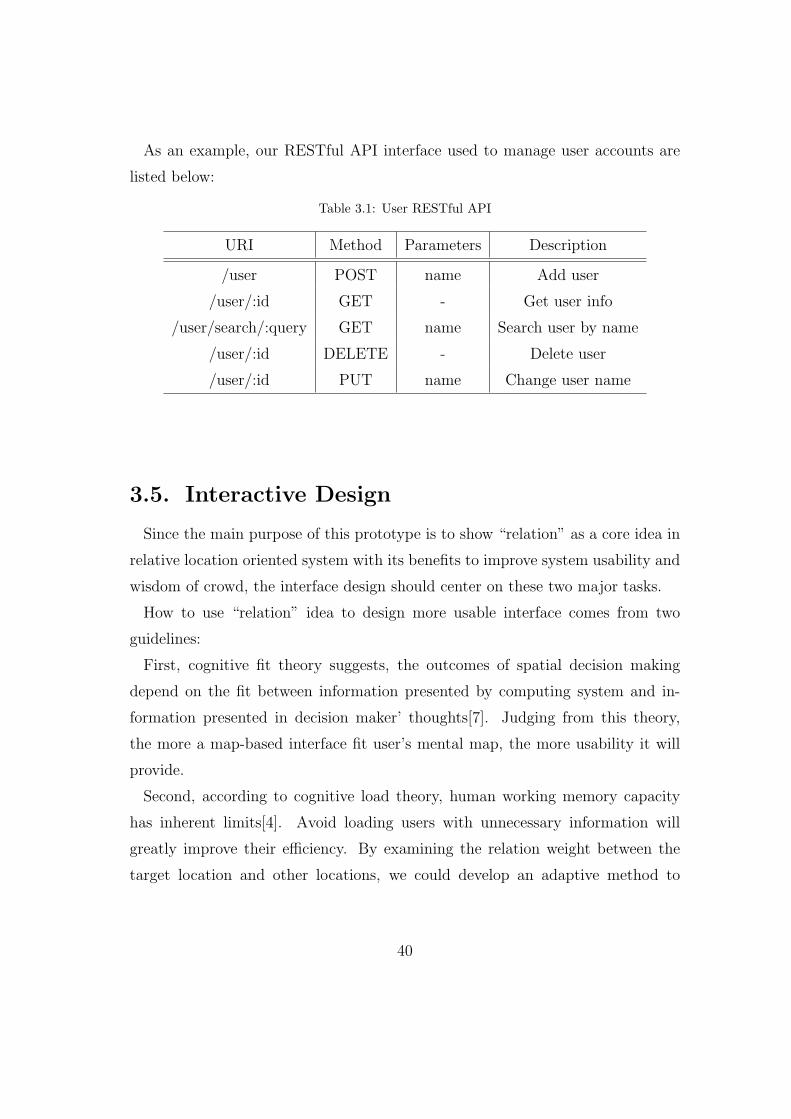
As an example, our RESTful API interface used to manage user accounts are
listed below:
Table 3.1: User RESTful API
URI Method Parameters Description
/user POST name Add user
/user/:id GET - Get user info
/user/search/:query GET name Search user by name
/user/:id DELETE - Delete user
/user/:id PUT name Change user name
3.5. Interactive Design
Since the main purpose of this prototype is to show “relation” as a core idea in
relative location oriented system with its benefits to improve system usability and
wisdom of crowd, the interface design should center on these two major tasks.
How to use “relation” idea to design more usable interface comes from two
guidelines:
First, cognitive fit theory suggests, the outcomes of spatial decision making
depend on the fit between information presented by computing system and in-
formation presented in decision maker’ thoughts[7]. Judging from this theory,
the more a map-based interface fit user’s mental map, the more usability it will
provide.
Second, according to cognitive load theory, human working memory capacity
has inherent limits[4]. Avoid loading users with unnecessary information will
greatly improve their efficiency. By examining the relation weight between the
target location and other locations, we could develop an adaptive method to
40

Figure 3.8: Interaction Flow Diagram
dynamically change information density on the map. This method will emphasis
on necessary information and hide unwanted to reduce cognitive burden.
Hence, our design objects includes: First, to design an interface that closer
to user’s mental map; Second, to design an interface that adaptively changes
information density; Third, to design an interface that is capable of promoting
users’ opinion sharing.
The whole working flow of user interaction is displayed by Figure 3.8. Following
with the graph, let us look at some specific details that worth of attentions out of
the whole blueprint.
• Mental-Map-like Interface. In a preliminary study, we asked partici-
41

Figure 3.9: Mental Map Like Interface
pates to describe the location of their home and then draw the image that
displayed in their thoughts while they were answering the question. A typi-
cal image looks like in Figure 3.9. From this study, we confirmed that user’s
mental map consists of multi-layers from global to local. All the layers
and locations in mental map are connected by certain relations, users may
instantly jump through these relations from one layer or location to another.
To simulate mental map as close as possible, we designed a two-layer map
to show global map and local map simultaneously. The global map could
be temporarily hidden to switch to local map immediately. Links between
locations are also displayed as visual cue and provide quick access.
• Adaptive Information Density. Information density change automati-
cally based on relation with target location to reduce. For example, while
searching for “Keio university”, unrelated map information will be hidden,
locations related to “Keio university” will be emphasized based on relation
strength, as shown in Figure 3.10.
42

As a comparison, the lower of Figure 3.10 is a result image while searching
“Keio university” in Google Map. Our interface is considered to be more
“readable” by users.
• Easy-to-Share Interaction. In our preliminary study, we confirmed that
users have requirements and willing to share spatial information. However,
difficulties in sharing with today’s LBSN usually reduced their efforts.
To address this problem, we designed: 1) A one-click interface to share
schedule easily; 2) A SNS integrated interface to send invitation to social
friends; 3) And a map visualized interface to sync opinions.
Figure 3.11 shown a typical user’s travel plan. He sent his plan to his friends
by this prototype application and asked for points of interest on the way. His
friends immediately gave feedbacks and displayed in user’s map interface (shown
as green dots). The user could click “accept” button to save recommendations
and comments from friends or “refuse” button to delete them. The whole opinion
gathering process could be completed in several minutes with a few clicks, no
extra typing or drawing was required, and the communication is very intuitive.
3.6. Summary
Chapter 3 was the specific implementation of RLOSN. In order to collect user
data, fully evaluate all features and functions, and apply the relation oriented
design philosophy to the user interface, a top-layer web service named ROSA was
devised and introduced in this chapter.
ROSA standed for Relative-location Oriented Schedule Assistant, an online hy-
brid application mainly used for assisting users to schedule all kinds of visit activ-
ities in their daily life. In the coming sections, ROSA’s database design, server-
client architecture,web service interface and interactive design were discussed in
details. The three most prominent features of user interface: mental-map-like
43

interface, adaptive information density,and easy-to-share interaction were intro-
duced in depth.
44
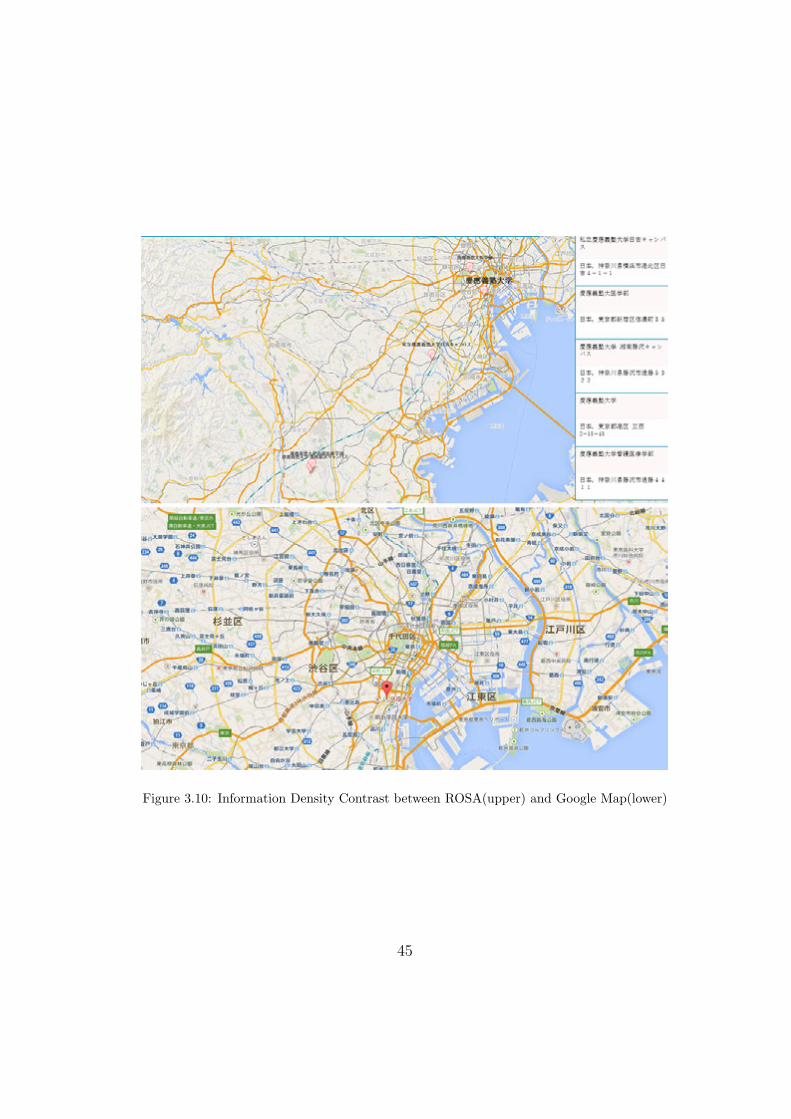
Figure 3.10: Information Density Contrast between ROSA(upper) and Google Map(lower)
45
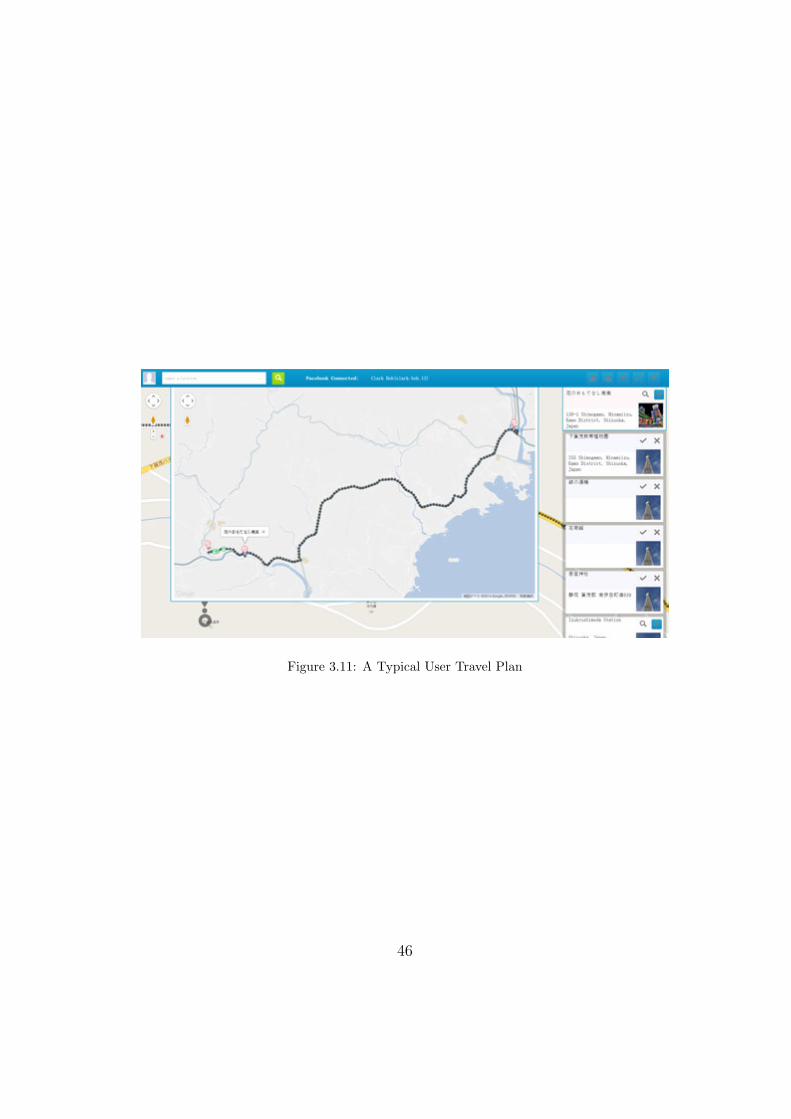
Figure 3.11: A Typical User Travel Plan
46
4.
Evalutaion
4.1. Concept Usability
To discuss the potential use of relative location and how it may influence user’s
spatial decision, since it’s actually an abstraction of historical data of other users
¨ spatial behavior, a preliminary user experiment was conducted using our specif-
ically developed web map interface. In this interface, when user search a certain
location or place a marker on the map (to simulate user’s current location), the in-
terface will switch to relative location mode. To better explain this mode, imagine
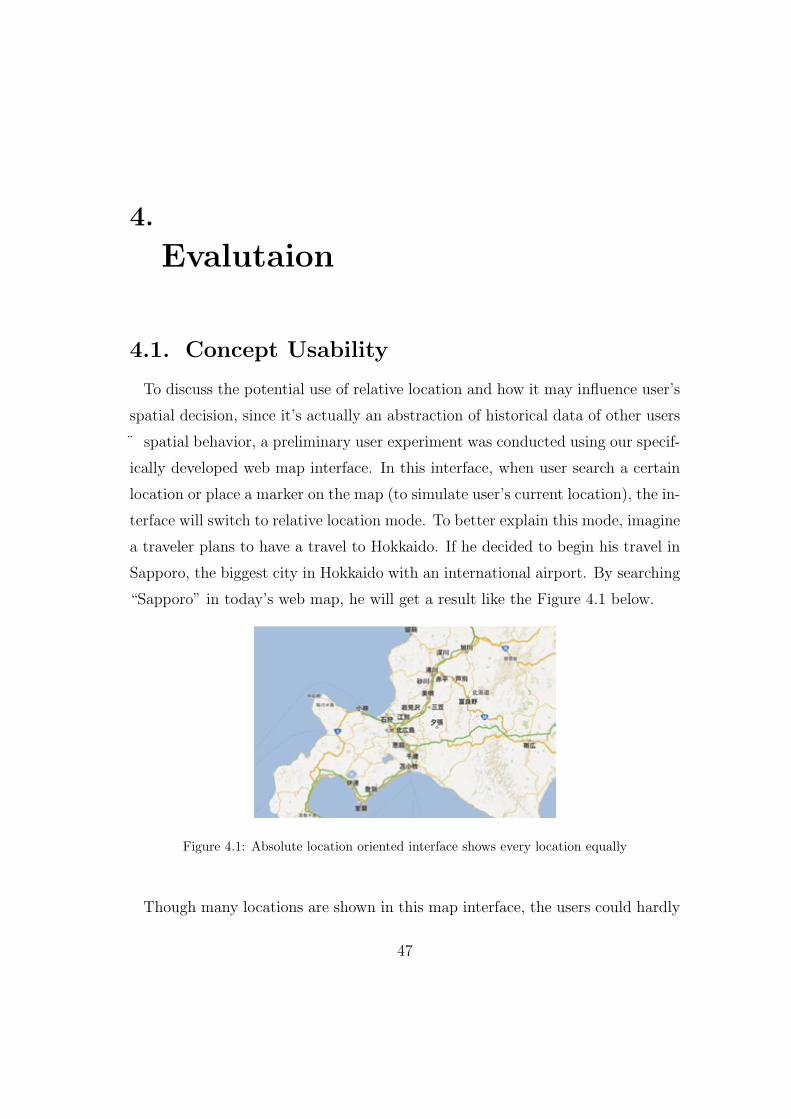
a traveler plans to have a travel to Hokkaido. If he decided to begin his travel in
Sapporo, the biggest city in Hokkaido with an international airport. By searching
“Sapporo” in today’s web map, he will get a result like the Figure 4.1 below.
Figure 4.1: Absolute location oriented interface shows every location equally
Though many locations are shown in this map interface, the users could hardly
47

decide where to go because every location is equally displayed. They will have no
idea about the difference between those locations. While in our relative location
oriented interface, location information will be displayed according to the relation
with current location: lower-related locations, which also means fewer travelers
will visit them from the current location under this circumstance, will be weaken
or hidden to simplify the interface, while information of higher-related locations
will be strengthen. This will help users to focus on potential destination from the
current location, by indicating other user’s choices.
Figure 4.2: Relative location oriented interface shows locations differently based on relations
How to decide the relations of locations and their strength is a core problem of
relative location oriented application, like app mentioned above. In real life, there
exist various kinds of relations between locations which reflect different human
knowledge and activities regarding related locations. For example, a similarity
relation between two book stores may means there are similar people have similar
activities on these locations; a collaboration relation may mean people living in
these locations have many communication and cooperative activities. All these
relation information are stored and used by human brain to support decision-
making process in spatial related tasks. However, it’s quite difficult for computers
to handle so many kinds of relations, not to mention many relations used by
human are very difficult to give a clear definition. Considering the complexity, we
48

could not process all these kinds of relations in one application. On the contrary,
desired relations should be chosen wisely on different situations. In this test, only
“route” relation are used, which means two locations are related with each other
because they are contained in the same route of a certain user’s travel. Here, a
3-stage strategy is designed to find relations of locations and their strength.
First, attractions and landmarks are collected as much as possible from human
knowledge (travel website, blog and magazine) by student volunteers. Because
this work is quite time-consuming, only those locations in Hokkaido are collected.
Second, initial strength of relation are calculated based on data from several
selected trip advisor websites. In those websites, travelers usually post their travel
notes which describe in detail where have they been during the trip. For each time
two locations are found in a travel note simultaneously, we add up the strength of
relation between these two locations. Data from different websites are normalized
to avoid bias.
Third, students are invited to design their own travel plans using this web-map
interface and other information they may found. Strength of relations are recur-
sively calculated based on each user’s feedback to simulate how users’ activities
could be reflected in the relation of locations dynamically. In the test, 20 students
in the same class were invited to take part in an asynchronous remote testing and
give subjective feedback. Students were divided randomly into two groups. Every
student in each group were asked to design a 7-day travel in Hokkaido. The only
difference is: group A use the relative location oriented interface described in this
paper, while group B use Google map. Students could also use any other infor-
mation source to help make decision. All students have never been to Hokkaido
before.
Findings include:
First, Relative location oriented application could help users to make decision
faster and better, which result in a reduction of task time consumption.
Second, Relative location oriented application could influence user’s decision,
49
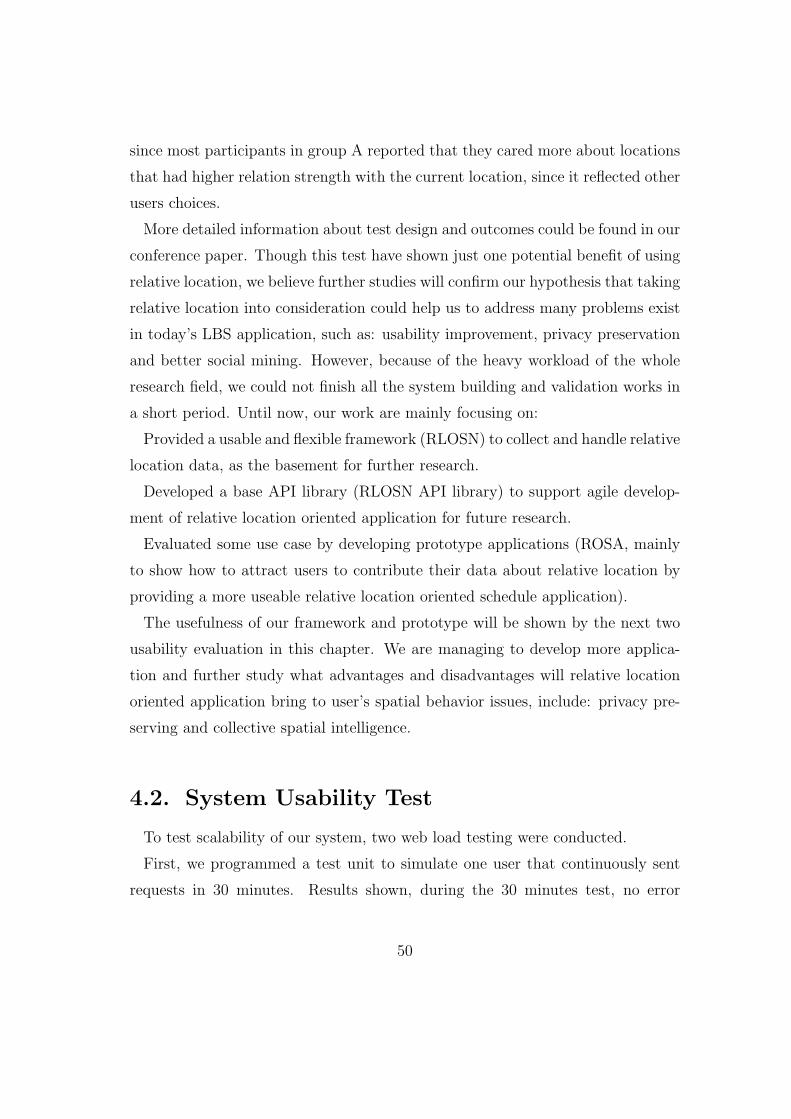
since most participants in group A reported that they cared more about locations
that had higher relation strength with the current location, since it reflected other
users choices.
More detailed information about test design and outcomes could be found in our
conference paper. Though this test have shown just one potential benefit of using
relative location, we believe further studies will confirm our hypothesis that taking
relative location into consideration could help us to address many problems exist
in today’s LBS application, such as: usability improvement, privacy preservation
and better social mining. However, because of the heavy workload of the whole
research field, we could not finish all the system building and validation works in
a short period. Until now, our work are mainly focusing on:
Provided a usable and flexible framework (RLOSN) to collect and handle relative
location data, as the basement for further research.
Developed a base API library (RLOSN API library) to support agile develop-
ment of relative location oriented application for future research.
Evaluated some use case by developing prototype applications (ROSA, mainly
to show how to attract users to contribute their data about relative location by
providing a more useable relative location oriented schedule application).
The usefulness of our framework and prototype will be shown by the next two
usability evaluation in this chapter. We are managing to develop more applica-
tion and further study what advantages and disadvantages will relative location
oriented application bring to user’s spatial behavior issues, include: privacy pre-
serving and collective spatial intelligence.
4.2. System Usability Test
To test scalability of our system, two web load testing were conducted.
First, we programmed a test unit to simulate one user that continuously sent
requests in 30 minutes. Results shown, during the 30 minutes test, no error
50

Figure 4.3: Web Traffic Result
occured, and the web traffic was show in Figure 4.3.
Then, we deployed a multi-thread testing program to simulate X (from 1 to
100) users that simultaneously send requests in 1 minute. We counted page load
time, response time and errors as shown in Figure 4.4.
Results shown, while user count continuously added and sent request without
interval, the page load time, server response and error number are all increasing.
While simultaneous visiting users is less than 50, no error occurred. Then, error
increased according to the visitor’s number linearly. After divided by total user
request, the error rate is relative low and very stable (less than 1%), which proved
the robustness and scalability of our system. The reason why request error will
happen when user counts more than 50 is mainly because Google limited the
concurrent connection from the same website. This will be shown in the next test
where we use merely our own database. To exceed concurrent connection, we may
have to pay Google for extra connections or add more servers to support extreme
cases and bypass the network flow.
51

Figure 4.4: Load Test Results
Finally, we tested our RESTful interface with the same method. In this test, we
simulated multiple users sent request to obtain a 8K byte dataset from RESTful
interface, codes that retrieve data from web APIs are excluded to avoid inter-
rupting. Results shown, while using merely our own data, the system runs more
effectively and stable. Results listed in Figure 4.5 and Figure 4.6.
52

Figure 4.5: Scalability Test
4.3. Interface Usability Test
6 users (3 male, 3 female) are divided into 3 groups (1 male and 1 female in
each group) to complete tasks. 3 groups are required to use different applications
to complete same tasks:
Control Group 1, Use Foursquare;
Control Group , Use Roadtrippers;
Experimental Group, Use Our Prototype.
Time to complete tasks were recorded and compared(see below). Survey and
Focus group were organized to obtain further information.
Tasks are given as:
Task1. Suppose you are an international exchange student in keio univer-
sity(hiyoshi campus) who decided to have trip to Tokyo in a weekend. Your
locations of interest are listed below, find them on the map, remember their loca-
tions.
53
Figure 4.6: RESTful Test Results
Task2. Select places where you want to visit and arrange them in your travel
plan (introduction of these locations are provided as webpages, time consumed in
browsing those pages are not counted). You are planning to start your journey
from Keio University, Hiyoshi campus at 9 am, and get back at 9 pm, please
take transportation time into consideration. (Approximate transportation times
between each two locations are provided). Participates can give up at any moment.
Task3. Suppose you are going to have lunch around Akihabara, because of
the time limitation, you decided to select the nearest restaurants to the subway
54

station. Confirm the location of restaurants in the list below and add the nearest
one into your travel plan.
Task4. Share the travel plan with your friend (the friend is assigned by re-
searcher)
Task5. Your friend recommended a restaurant (Musashiya, Hiyoshi) for you,
however, neither google nor foursquare could tell you where this restaurant is
located. Ask your friend for information to find it on the map and add it to
your travel plan. (The participates and their friends sit in the different rooms, to
simulate their daily communication scenes, they could use an instant messaging
software to chat with each other).
Figure 4.7: Interface Usability Test
Results are shown below:
As a summary, experimental Group completed the same task with better quality
and few time, which proved the advantages of using our prototype.
55

Table 4.1: Interface Usability Results
- Control Group 1 Control Group 2 Experimental Group
Task 1 8m39s 6m22s 5m48s
Task 2 16m10s(2 gave up) 18m34s(1 gave up) 14m27s
Task 3 5m32s(2 gave up) 8m14s 3m41s
Task 4 46s 9s 14s
Task 5 5m52s 1m49s 2m24s
4.4. Summary
In this chapter, evaluation part actually were divided into concept, system and
interface usability test.
The concept usability test is a preliminary study validated our hypothesis that
taking relative location into consideration will bring us some potential benefits.
The system usability test consisted of a series of web load testing, respetively
testing the error rate, web traffic, load time and response time, given multiple
users and consecutive requests.
The interface usability test were conducted among 6 participators and each of
them were given a seres of spatial tasks. The time used to complete each task,
the degree of task to be finished as well as user feedback were recorded.
To give a conclusion, our prototype generally maintained a positive performance
in comparison to any other like products and hence the advantages of adopting
RLOSN famework were proved to some exent.
56
5.
Conclusions
5.1. Contributions
This thesis contributed several unique attempts that are exclusive from previous
researches, mainly in the following three aspects:
Concept/Model
This thesis established a comprehensive socio-spatial location model, consisting
of both the physical coordinates space and the social conceptual space. In order
to distinguish from traditional concept as well as underline the social connectivity
aspect of locations, we brought out a new concept called “relative locations”.
Methodology
Derived from the core value of “relative location”, the methodology adopted in
this thesis shifted from geographical mapping to conceptual mapping, driven by
user activities, and centering correlations between location-location, user-location
and user-user. We applied this methodology to build a series of compatible data
models, network structures and interaction mechanisms.
Implementation
To further prove and evaluate the usability and efficiency of “relative locations”,
this thesis devised a novel but pragmatic prototype that can be used in planning
daily visit scenario.
57
5.2. Limitations
During the implementation of RLOSN, we adopted a relatively mature solution
and the results were inspring somehow. However, due to limited working time,
there were also obvious limitations in both the width and depth of our research.
As most commercial LBSN services today, we adopted the relational database
technology. It was pervasive, popular, somehow limited. Especially when dealing
with highly connected data,such as social graphs, or the location network that we
proposed. It would face larger and larger efficiency and cost challenges along with
the increase of network scale and query depth.
Also, our system is able to collect varied raw data by both sensor side and user
side. However, in order to better understand and infer users activity pattern,
further data process and analysis were necessary. Therefore we may need to
consider machine learning.
Moreover, to integrate physical and virtual space, sensors are considered to be
a possibility. We had always been conceived to involve the sensor network, or
in a more popular saying, IoT(Internet of things) into our framework, which was
closely related to, however, beyond the scope of this thesis. But we found it a
valuable attempt to strech out for this possibility.
5.3. Future Work
Graph Database
The concept, “graph database” was first systematically elaborated in the book
Graph Databases by Ian Robinson et al. and raised to help “manage and query
highly connected data”[14]. Readers with knowledge about “graph theory” may
know that a graph is just a collection of vertexes and edges, or a set of nodes and
the relationships that connect them. In Graph databases, graphs represent entities
as nodes and the ways in which those entities relate to the world as relationships.
58

Since data in our two layer model could be divided into two categories: nodes
and relations, we seek to use a database that provide fully support for both data
types. However, today s mainstream database solutions, both relational database
and graph database, could not complete this task alone.
Though the name of “relational database” suggests relation plays an important
role in this kind of database, it’s actually very limited. “Relational database”
only maintain relations between structural elements (table), not node elements
(record). “Graph database” solved this problem by maintain relations between
every nodes. This feature makes graph database especially suited to handle rela-
tion data from various network-structured applications, such as: social network.
Figure 5.1: Graph Database
However, comparing to relational database, graph database also have some im-
portant disadvantages:
First, graph database is much slower when operating on huge numbers of struc-
tured records. In a graph database, each record has to be examined individually
during a query in order to determine the structure of the data, while this is known
ahead of time in a relational database. Second, graph databases use less storage
space, since they have to store extra data of relation between every two nodes.
Considering those advantages and disadvantages respectively, a better solution
59
may be using relational database and graph database simultaneously. In practice,
we use relational database to store raw data, because raw data are usually big scale
highly structured data. Then we mining high-level data from raw data, which has
more irregular and complex structures, and store them in graph database.
Machine Learning
The second future mission is to involve machine learning methods into RLOSN.
The main challenge we face today in LBSN is actually how to teach machines to
understand human knowledge about space, such as: location naming or labeling,
location searching or recommendation, and spatial intelligence. Machine learning
researches will help to address this problem. Some classical classification methods
have already been tried with or without modification, such as: Decision Tree,
Artificial Neuro Network and Support Vector Machine. For example, Agrawal et
al. used a Gradient Boosted Decision Trees in local search to disambiguate location
queries[1]. Yamamoto et al. used a probabilistic model to classify locations related
to certain historical event[20]. However, most attempts nowadays treat locations
as isolated nodes, which exist in two aspects: first, researches usually retrieve date
from public accessible data sources, such as Foursquare, Brightkite, and use them
as separated records to train classifiers; second, Methods are usually proposed
to deal with every single location’s attributes, without considering their relations
with other entities. However, we argued that, many locations are related with
each other directly or indirectly. As shown in this paper, if well designed, these
relations could be collected while users interacting with computing systems. After
taking relation data into consideration, the previous isolated location nodes could
be connected into a graph which could be further analyzed by many graph mining
technologies. For example, today’s POI recommendation algorithm merely take
data from every single location into consideration. As a comparison, with a graph
based algorithm, data from adjacent node in the graph will also be considered,
such as pagerank method. We believe, it will introduce some new ideas into
machine learning process and result in better performance.
60

Wearable Devices
Finally, we want to prospect for the possibility to combine wearable devices with
RLOSN together. One commonly acknowledged technology trend is that within
the next 2 or more decades, the boundary between virtual and physical world will
become more and more vague, and the way that users gain, exchange and operate
information more natural and intuitive.
Wearable device, as one of the key revolutions that engine this tide, is a promis-
ing area that has not yet been fully exploited. Some IT scrutators have predicted
that in the coming future, wearable devices, e.g smart glass, smart watch etc, will
gradually replace portable devices like mobile phones that we used to be so famil-
iar with. While hidden behind this change, we can see an immanent transition
taking place in the traditional way that people get information.
Since the first computer ENIAC born in 1946, this great invention has dramat-
ically changed human being’s lifestyle ever since. With the evolution of personal
computing devices from desktop computers, laptop computers, PDAs, to tablets,
smart phones today, modern people are getting more and more used to relying
on them to get information once needed, which has almost formed a path depen-
dence: Rather than actually being at somewhere and getting to know the place,
it is more likely for modern people to first search on the Internet and find a desti-
nation. This kind of information flow from virtual data to real location, of course,
can bring us some advantages and conveniences. However, we human beings are
born to be sensitive to certain kinds of information, like distance, position, and
etc. Thus we are able to capture the spatial relation to environment around us
rapidly. Unfortunately, once we try to digitalize this information, we will lose a
considerable amount of it, which is usually crucial in support for spatial decision
making, if not dispensable.
To be complementary to the particular path “virtual data to real location”, it is
necessary to have some mechanism to provide a reversed flow that is “real location
to virtual data”, while wearable smart devices make it become possible. Products
61
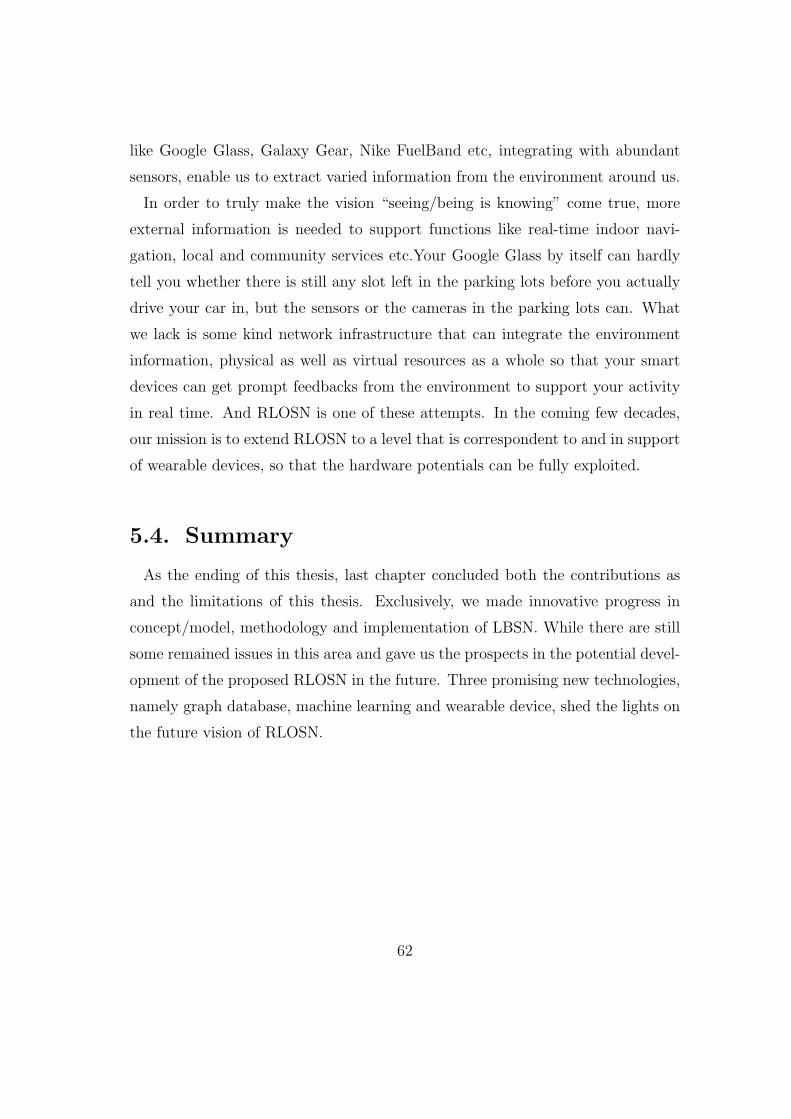
like Google Glass, Galaxy Gear, Nike FuelBand etc, integrating with abundant
sensors, enable us to extract varied information from the environment around us.
In order to truly make the vision “seeing/being is knowing” come true, more
external information is needed to support functions like real-time indoor navi-
gation, local and community services etc.Your Google Glass by itself can hardly
tell you whether there is still any slot left in the parking lots before you actually
drive your car in, but the sensors or the cameras in the parking lots can. What
we lack is some kind network infrastructure that can integrate the environment
information, physical as well as virtual resources as a whole so that your smart
devices can get prompt feedbacks from the environment to support your activity
in real time. And RLOSN is one of these attempts. In the coming few decades,
our mission is to extend RLOSN to a level that is correspondent to and in support
of wearable devices, so that the hardware potentials can be fully exploited.
5.4. Summary
As the ending of this thesis, last chapter concluded both the contributions as
and the limitations of this thesis. Exclusively, we made innovative progress in
concept/model, methodology and implementation of LBSN. While there are still
some remained issues in this area and gave us the prospects in the potential devel-
opment of the proposed RLOSN in the future. Three promising new technologies,
namely graph database, machine learning and wearable device, shed the lights on
the future vision of RLOSN.
62

Acknowledgements
I am indebt to Professor Kazonori Sugiura for giving me great freedom on my
personal research and always providing me inspring advice.Also I feel more than
grateful to the positive feedbacks from Professor Akira Kato and Professor Sam
Furugawa. And thank you, all the family member at KMD.
63

References
[1] Agrawal R. J, S. J. G. Location disambiguation in local searches using gra-
dient boosted decision trees. In Proceedings of the 18th SIGSPATIAL Inter-
national Conference on Advances in Geographic Information Systems, ACM
(2010), 129–136.
[2] Bardram, J. E. Activity-based computing: support for mobility and collab-
oration in ubiquitous computing. Pers Ubiquit Comput 9 (2005), 312–322.
[3] Bardram J, Gueddana S, H. S. Reticularspaces: activity-based computing
support for physically distributed and collaborative smart spaces. In Proceed-
ings of the SIGCHI Conference on Human Factors in Computing Systems.
ACM, 2012, ACM (2012), 2845–2854.
[4] Chandler P., S. J. Cognitive load theory and the format of instruction.
Cognition and Instruction 8, 4 (1991), 293C332.
[5] Consolvo S, Smith I E, M. T. Location disclosure to social relations: why,
when, & what people want to share. In Proceedings of the SIGCHI conference
on Human factors in computing systems, ACM (2005), 81–90.
[6] Cramer H, M. Rost, L. E. H. Performing a check-in: Emerging practices,
norms and “conflicts” in location-sharing using foursquare. In Proceedings of
ACM MobileHCI, 2011, ACM (2011), 57C66.
[7] Dennis A. R, C. T. A. Using geographical information systems for decision
making: Extending cognitive fit theory to map-based presentations. Infor-
mation Systems Research 9, 2 (1998), 194–203.
64

[8] Jakob E. Bardram, Jonathan BundePedersen, M. S. Support for activity
based computing in a personal computing operating system. In Proceedings
of the SIGCHI conference on Human Factors in computing systems. ACM,
2006, ACM (2006), 211–220.
[9] Jiang C, S. P. A hybrid location model with a computable location identifier
for ubiquitous computing. UbiComp 2 (2002), 246–263.
[10] Li N., C. G. Analysis of a location-based social network. Computational
Science and Engineering 4 (2009), 263–270.
[11] Lin J., Xiang G., H. J. I. Modeling people’s place naming preferences in
location sharing. In Proceedings of the 12th ACM international conference
on Ubiquitous computing, ACM (2010), 75–84.
[12] Lindqvist, J. Im the mayor of my house: Examining why people use
foursquare: A social-driven location sharing application. In Proceedings of
ACM CHI, 2012, ACM (2012), 2409C2418.
[13] Prashant Krishnamurthy, K. P. Advanced Location-Based Technologies and
Services, vol. Location-Based Social Networks. Taylor & Francis Group, LLC,
2010.
[14] Robinson I, Webber J, E. E. Graph databases. O’Reilly, 2013.
[15] Ruowei Xiao, Zhanwei Wu, K. S. Relative location oriented mobile lbs. In
MoMM 2013, ACM (2013), 311–313.
[16] Scellato S, Noulas A, L. R. Socio-spatial properties of online location-based
social networks. ICWSM 1 (2011), 329–336.
[17] Scellato S, Noulas A, M. C. Exploiting place features in link prediction on
location-based social networks. In Proceedings of the 17th ACM SIGKDD
international conference on Knowledge discovery and data mining, ACM
(2011), 1046–1054.
65

[18] Traynor D, C. K. Location-based social networks, vol. Mobile Services Indus-
tries, Technologies, and Applications in the Global Economy. CRC Press,
2012.
[19] Wright P C, M. A. F. The use of think-aloud evaluation methods in design.
ACM SIGCHI Bulletin 23, 1 (1991), 55–57.
[20] Yamamoto M, Takahashi Y, I. H. Extraction and geographical navigation of
important historical events in the web, vol. Web and Wireless Geographical
Information Systems. Springer Berlin Heidelberg, 2011.
[21] Ye M., Shou D., L. W. C. On the semantic annotation of places in location-
based social networks. In Proceedings of the 17th ACM SIGKDD interna-
tional conference on Knowledge discovery and data mining, ACM (2011),
520–528.
[22] Ye M., Yin P., L. W. C. Location recommendation for location-based social
networks. In Proceedings of the 18th SIGSPATIAL International Conference
on Advances in Geographic Information Systems, ACM (2010), 458–461.
[23] Zheng Y., Xie X., M. W. Y. Geolife: A collaborative social networking
service among user, location and trajectory. IEEE Data Eng. Bull. 33, 2
(2010), 32–39.
66

Appendix
A. Application Manual for ROSA: PC
In PC, ROSA could help users to quickly find spatial objects, arrange schedules
for spatial behaviors, such as: travel, share spatial objects with friends in a relative
location format, or ask for recommendations.
Interface Overview
Figure 5.2: The Initial Interface of ROSA
The whole interface could be divided into four areas:
67
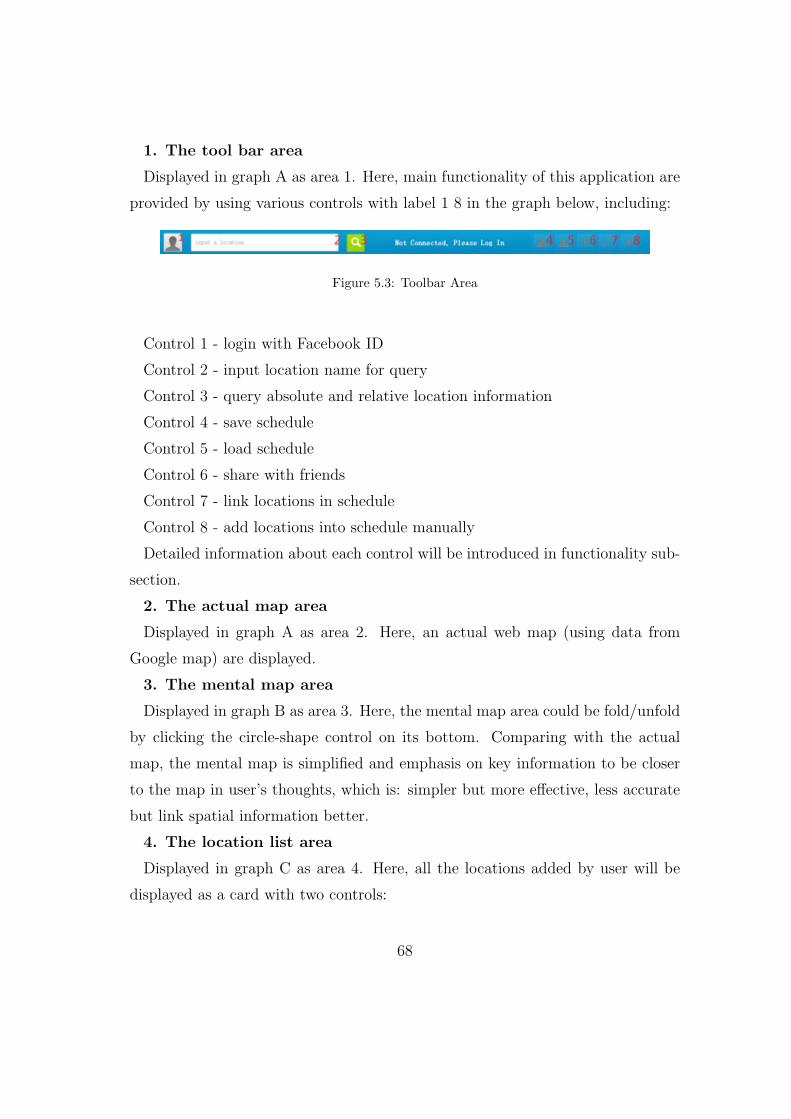
1. The tool bar area
Displayed in graph A as area 1. Here, main functionality of this application are
provided by using various controls with label 1 8 in the graph below, including:
Figure 5.3: Toolbar Area
Control 1 - login with Facebook ID
Control 2 - input location name for query
Control 3 - query absolute and relative location information
Control 4 - save schedule
Control 5 - load schedule
Control 6 - share with friends
Control 7 - link locations in schedule
Control 8 - add locations into schedule manually
Detailed information about each control will be introduced in functionality sub-
section.
2. The actual map area
Displayed in graph A as area 2. Here, an actual web map (using data from
Google map) are displayed.
3. The mental map area
Displayed in graph B as area 3. Here, the mental map area could be fold/unfold
by clicking the circle-shape control on its bottom. Comparing with the actual
map, the mental map is simplified and emphasis on key information to be closer
to the map in user’s thoughts, which is: simpler but more effective, less accurate
but link spatial information better.
4. The location list area
Displayed in graph C as area 4. Here, all the locations added by user will be
displayed as a card with two controls:
68
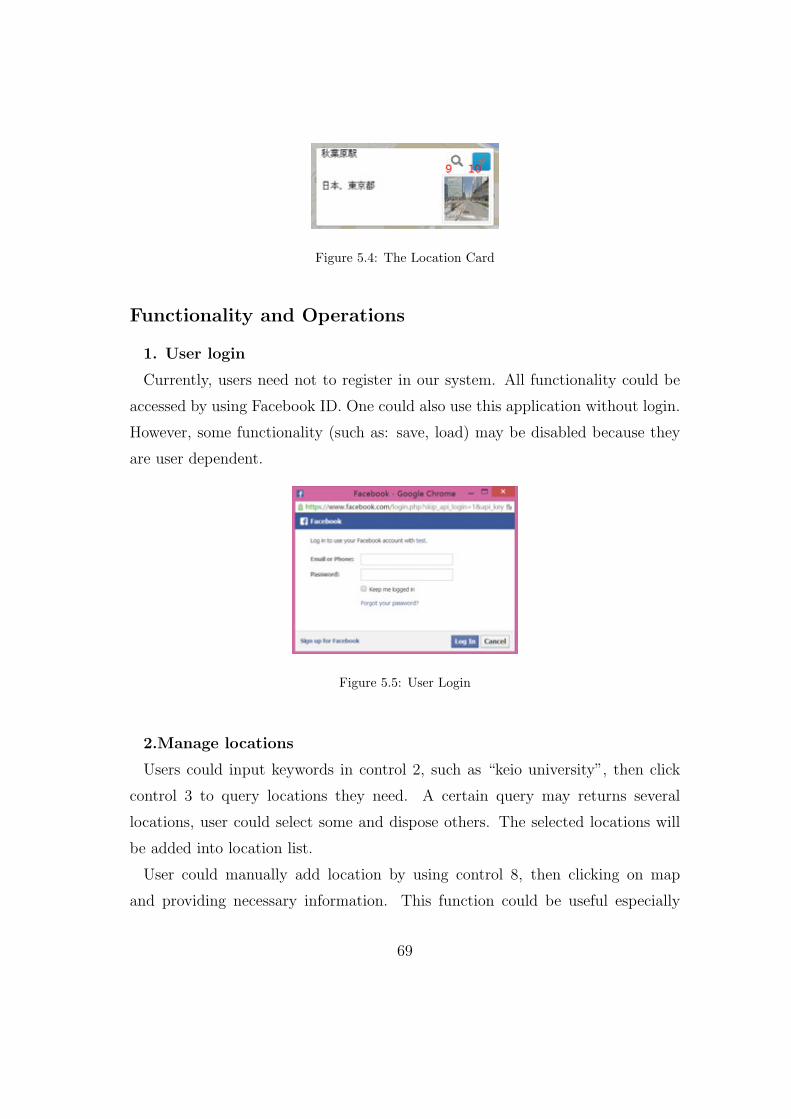
Figure 5.4: The Location Card
Functionality and Operations
1. User login
Currently, users need not to register in our system. All functionality could be
accessed by using Facebook ID. One could also use this application without login.
However, some functionality (such as: save, load) may be disabled because they
are user dependent.
Figure 5.5: User Login
2.Manage locations
Users could input keywords in control 2, such as “keio university”, then click
control 3 to query locations they need. A certain query may returns several
locations, user could select some and dispose others. The selected locations will
be added into location list.
User could manually add location by using control 8, then clicking on map
and providing necessary information. This function could be useful especially
69

Figure 5.6: User Defined Location
when certain locations could not be found on Google Map or Foursquare. Added
locations will also be displayed on the map as markers (red pin). Left-click on the
marker will open the infoBox to show information about current location, which
provided by the system or inserted by user. Right-click on the marker will show
relative location (blue dot) related to user-defined locations.
Figure 5.7: Show Defined Location Information
3. Manage relations
In relative location paradigm, locations are linked with each other with one of
more kinds of relations. Users could define relation between two locations by using
control 7. To achieve this goal, user should: first, click control 7; second, click
two locations (displayed as markers on the map) in sequence.
Currently, there are only two kinds of relation are visualized by the system,
which could be switched by left-clicking the line that represent this relation. The
first kind is “general”, which show a direct line between two locations; the sec-
70

Figure 5.8: Add General Relation
ond kind is “route” which show a path between two locations. Relations could
also be deleted by right-clicking the connection line. Other relations may also
exist between two locations, such as: identical, parent/child, alternative. We are
managing to develop functions to support those relations.
Figure 5.9: Switch To Route Relation
5. Save/Load schedules
Users could use control 4 to save schedule and control 5 to load schedule. Only
users who create and save the schedule could load it again. So users must login
71
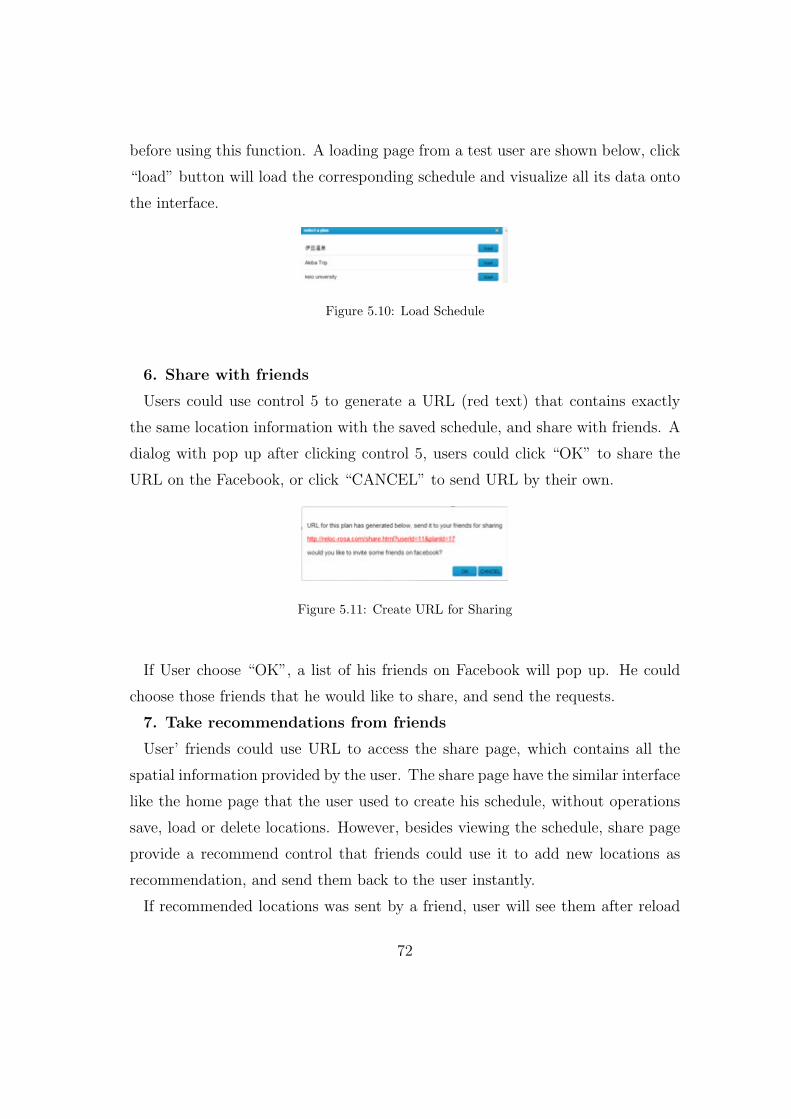
before using this function. A loading page from a test user are shown below, click
“load” button will load the corresponding schedule and visualize all its data onto
the interface.
Figure 5.10: Load Schedule
6. Share with friends
Users could use control 5 to generate a URL (red text) that contains exactly
the same location information with the saved schedule, and share with friends. A
dialog with pop up after clicking control 5, users could click “OK” to share the
URL on the Facebook, or click “CANCEL” to send URL by their own.
Figure 5.11: Create URL for Sharing
If User choose “OK”, a list of his friends on Facebook will pop up. He could
choose those friends that he would like to share, and send the requests.
7. Take recommendations from friends
User’ friends could use URL to access the share page, which contains all the
spatial information provided by the user. The share page have the similar interface
like the home page that the user used to create his schedule, without operations
save, load or delete locations. However, besides viewing the schedule, share page
provide a recommend control that friends could use it to add new locations as
recommendation, and send them back to the user instantly.
If recommended locations was sent by a friend, user will see them after reload
72

Figure 5.12: Share Schedules on Facebook
the homepage. The recommended locations are shown as different cards in the
location list comparing to normal location card, where the control 11 and 12 have
taken the place of control 9 and 10. Click control 11 means the user accept the
recommendation and turns it to be a normal card, while click control 12 means
user refuse it and the recommendation will be disposed.
Using this functionality, a group of users could easily sync their recognition
about a spatial activity, such as travel. And the data behind this will provide us
many useful evidences about how human beings take spatial actions under social
environment and “wisdom of crowd”. We are managing to collect data and further
study this mechanism.
B. Application Manual for ROSA: Mobile
The mobile app is relatively simple in this application, its main function include:
First, view saved schedules on the mobile platform.
Second, collect user data (mainly physical coordinates) on the move and upload
to the server.
73
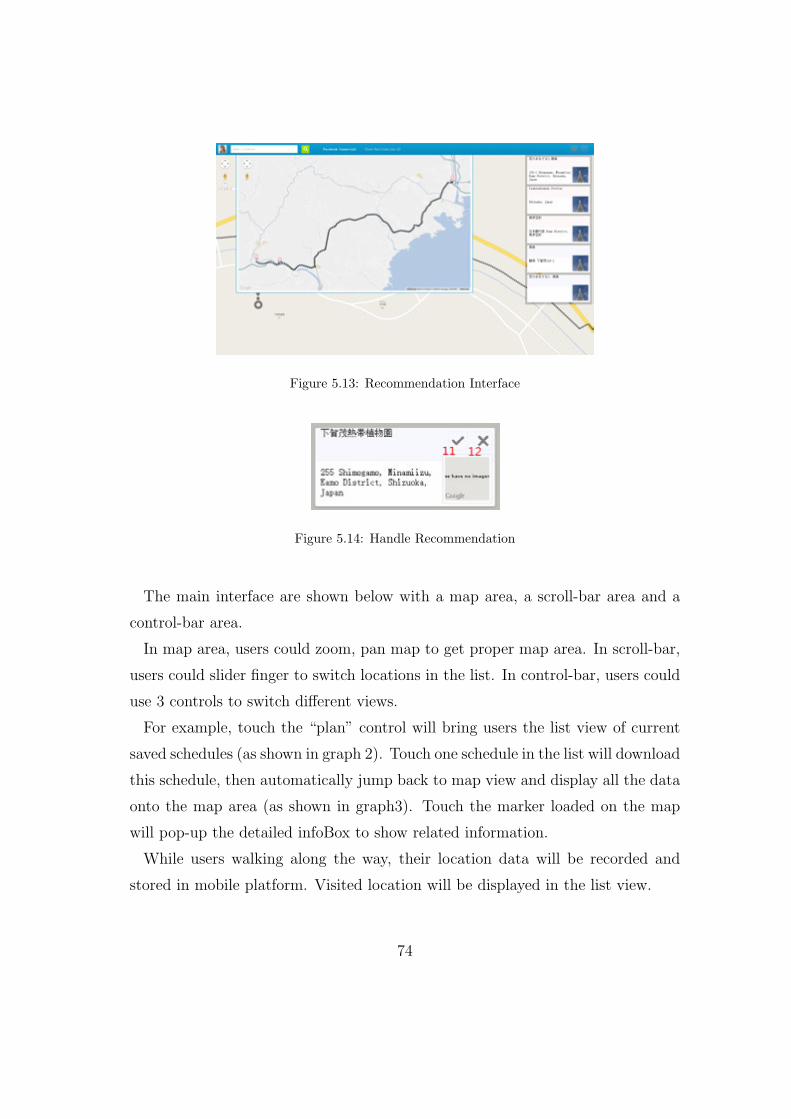
Figure 5.13: Recommendation Interface
Figure 5.14: Handle Recommendation
The main interface are shown below with a map area, a scroll-bar area and a
control-bar area.
In map area, users could zoom, pan map to get proper map area. In scroll-bar,
users could slider finger to switch locations in the list. In control-bar, users could
use 3 controls to switch different views.
For example, touch the “plan” control will bring users the list view of current
saved schedules (as shown in graph 2). Touch one schedule in the list will download
this schedule, then automatically jump back to map view and display all the data
onto the map area (as shown in graph3). Touch the marker loaded on the map
will pop-up the detailed infoBox to show related information.
While users walking along the way, their location data will be recorded and
stored in mobile platform. Visited location will be displayed in the list view.
74

Figure 5.15: Mobile Interface
C. PhP Code Sample
<?php header(’Content-type: text/plain; charset=utf-8’); ?>
<?php
//write locations to database
include ’dbPass.php’;
$planName = $_POST[’planName’];
$userId = $_POST[’userId’];
$locInfoArray = json_decode($_POST[’locInfoArray’]);
$linkInfoArray = json_decode($_POST[’linkInfoArray’]);
$status = ’success’;
$runtimeInfo = ’’;
$length = count($locInfoArray);
75
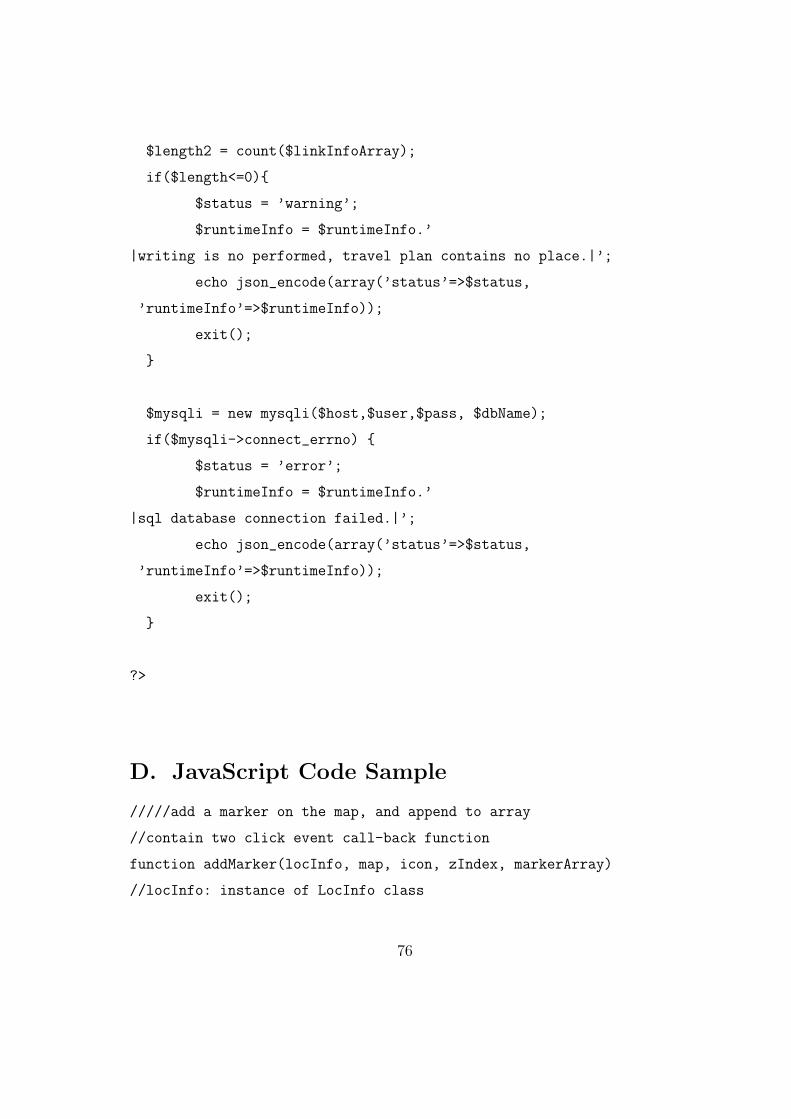
$length2 = count($linkInfoArray);
if($length<=0){
$status = ’warning’;
$runtimeInfo = $runtimeInfo.’
|writing is no performed, travel plan contains no place.|’;
echo json_encode(array(’status’=>$status,
’runtimeInfo’=>$runtimeInfo));
exit();
}
$mysqli = new mysqli($host,$user,$pass, $dbName);
if($mysqli->connect_errno) {
$status = ’error’;
$runtimeInfo = $runtimeInfo.’
|sql database connection failed.|’;
echo json_encode(array(’status’=>$status,
’runtimeInfo’=>$runtimeInfo));
exit();
}
?>
D. JavaScript Code Sample
/////add a marker on the map, and append to array
//contain two click event call-back function
function addMarker(locInfo, map, icon, zIndex, markerArray)
//locInfo: instance of LocInfo class
76

//map: instance of google map class
//icon: user-defined marker icon
//zIndex: z-depth
//markerArray: array to store markers
{
var position = new google.maps.LatLng(locInfo.lat, locInfo.lng);
var marker = new google.maps.Marker({
//create a marker to represent the user-defined location
map: map,
icon: icon,
zIndex: zIndex,
position: position,
lat: locInfo.lat,
lng: locInfo.lng,
title: locInfo.name,
html: locInfo.desc,
type: locInfo.type,
pin: locInfo.pin
});
if(map == window.map)
{
google.maps.event.addListener(marker, "rightclick", function () {
//use right click to search relative location
var locInfo = getLocInfoFromMarker(this);
locInfo.type = ’search location’;
clearTempMarkers();
77

searchRelativeLocation(locInfo);
});
}
//add line on the map to represent location relation
function addLine(startPoint, endPoint, type)
{
//logVariable(startPoint,’startPoint’);
//logVariable(endPoint, ’endPoint’);
var request = {
origin:startPoint,
destination:endPoint,
travelMode: google.maps.DirectionsTravelMode.DRIVING//TRANSIT
};
directionsService.route(request, function(response, status) {
//logVariable(status, ’DirectionsStatus’);
if (status == google.maps.DirectionsStatus.OK) {
//logVariable(response, ’DirectionsResponse’);
//mapDirectionDisplay.setMap(window.map);
//mapDirectionDisplay.setDirections(response);
//infoMapDirectionDisplay.setDirections(response);
var myRoute = response.routes[0].legs[0];
points = [];
if (status == google.maps.DirectionsStatus.OK)
{
for (var i = 0; i < myRoute.steps.length; i++) {
for (var j = 0; j < myRoute.steps[i].lat_lngs.length; j++) {
points.push(myRoute.steps[i].lat_lngs[j]);
78

}
}
}
google.maps.event.addListener(routeLine, ’click’, function(){
var i = findLineIndex(routeLine.startPoint, routeLine.endPoint);
changeLineType(i,’straight’);
});
google.maps.event.addListener(infoRouteLine, ’click’, function(){
var i = findLineIndex(infoRouteLine.startPoint, infoRouteLine.endPoint);
changeLineType(i,’straight’);
});
google.maps.event.addListener(straightLine, ’click’, function(){
var i = findLineIndex(straightLine.startPoint, straightLine.endPoint);
changeLineType(i,’route’);
});
google.maps.event.addListener(infoStraightLine, ’click’, function(){
var i = findLineIndex(infoStraightLine.startPoint, infoStraightLine.endPoint); changeLineType(i,’route’);
});
});
window.startPoint = null; //clear variables
window.endPoint = null;
}
});
}
////////////////search relative location
79
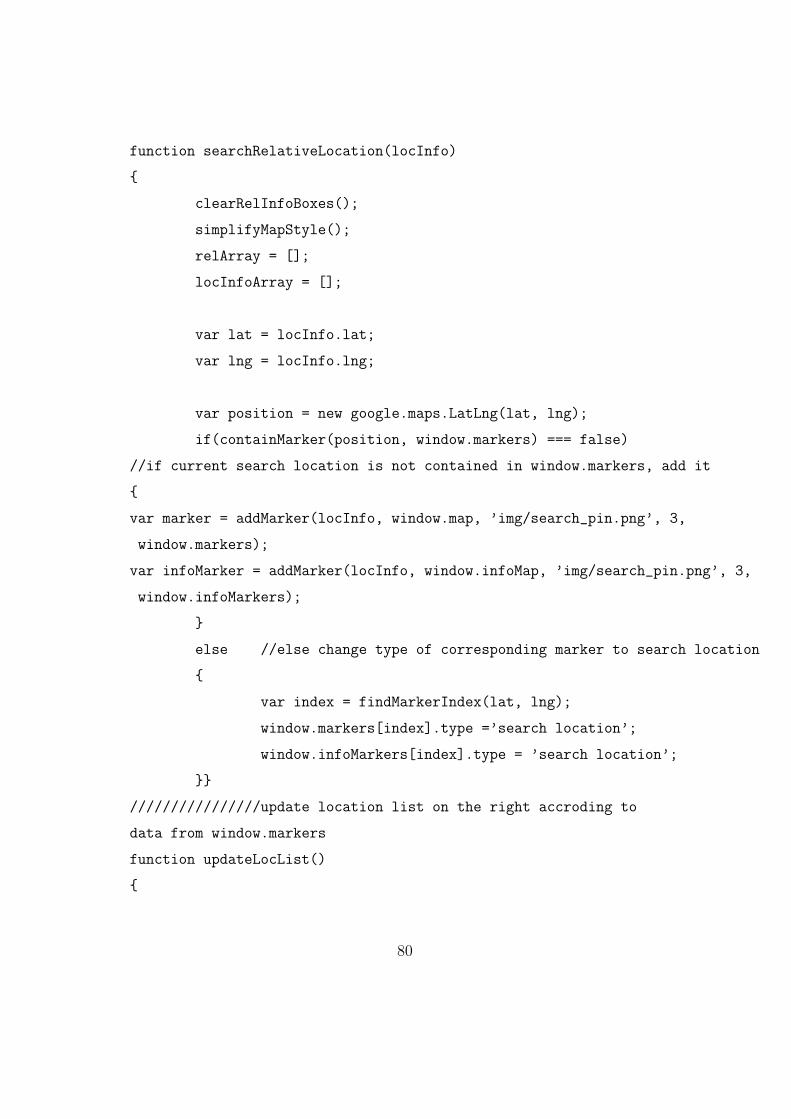
function searchRelativeLocation(locInfo)
{
clearRelInfoBoxes();
simplifyMapStyle();
relArray = [];
locInfoArray = [];
var lat = locInfo.lat;
var lng = locInfo.lng;
var position = new google.maps.LatLng(lat, lng);
if(containMarker(position, window.markers) === false)
//if current search location is not contained in window.markers, add it
{
var marker = addMarker(locInfo, window.map, ’img/search_pin.png’, 3,
window.markers);
var infoMarker = addMarker(locInfo, window.infoMap, ’img/search_pin.png’, 3,
window.infoMarkers);
}
else //else change type of corresponding marker to search location
{
var index = findMarkerIndex(lat, lng);
window.markers[index].type =’search location’;
window.infoMarkers[index].type = ’search location’;
}}
////////////////update location list on the right accroding to
data from window.markers
function updateLocList()
{
80

$("#curLocContainer").html(’’);
$("#locList").html(’’);
logVariable(window.markers, ’window.markers’);
logVariable(window.recommendMarkers, ’window.recommendMarkers’);
//add cards fro recommend Locations
for(i = 0; i < window.recommendMarkers.length; i++)
{
var info =
getRecommendLocInfoFromMarker(window.recommendMarkers[i]);
//logVariable(info,’info’);
var recommendLocCard = createRecommendLocCard(info.lat,
info.lng, info.name, info.desc);
$(’#locList’).append(recommendLocCard);
}
}
/////////////////stylizing relative location display according
to relation strength
function showSearchArray(locInfoArray, ratingArray)
{
simplifyMapStyle();
clearRelInfoBoxes();
//logVariable(ratingArray, ’ratingArray in showSearchArray’);
var maxRating = Math.max.apply(null, ratingArray);
var minRating = Math.min.apply(null, ratingArray);
var ratingRange = maxRating - minRating;
81

for(var i = 0; i < locInfoArray.length; i++)
{
var lat = locInfoArray[i].lat;
var lng = locInfoArray[i].lng;
var position = new google.maps.LatLng(lat, lng);}
}
82