
(TITLE OF THE THESIS)* - University of Albertalfoote/lab_files/Jon Hornung Ph.D... · boreal...
102
University of Alberta Library Release Form Name of Author: Jonathan Paul Hornung Title of Thesis: Invertebrate Community Structure in Relation to the Foraging Ecology of Mallard and Bufflehead Ducklings in Western Canada Degree: Doctor of Philosophy Year this Degree Granted: 2005 Permission is hereby granted to the University of Alberta Library to reproduce single copies of this thesis and to lend or sell such copies for private, scholarly or scientific research purposes only. The author reserves all other publication and other rights in association with the copyright in the thesis, and except as herein before provided, neither the thesis nor any substantial portion thereof may be printed or otherwise reproduced in any material form whatever without the author's prior written permission. _____________________________ 132 Patrick View S. W. Calgary, Alberta T3H 3J4 Date: June 14, 2005
Transcript of (TITLE OF THE THESIS)* - University of Albertalfoote/lab_files/Jon Hornung Ph.D... · boreal...
University of Alberta
Library Release Form
Name of Author: Jonathan Paul Hornung
Title of Thesis: Invertebrate Community Structure in Relation to the Foraging Ecology of
Mallard and Bufflehead Ducklings in Western Canada
Degree: Doctor of Philosophy
Year this Degree Granted: 2005
Permission is hereby granted to the University of Alberta Library to reproduce single copies of
this thesis and to lend or sell such copies for private, scholarly or scientific research purposes
only.
The author reserves all other publication and other rights in association with the copyright in the
thesis, and except as herein before provided, neither the thesis nor any substantial portion thereof
may be printed or otherwise reproduced in any material form whatever without the author's prior
written permission.
_____________________________
132 Patrick View S. W.
Calgary, Alberta
T3H 3J4
Date: June 14, 2005

Hope and the future for me
are not in lawns and cultivated fields,
not in towns and cities,
but in the impervious and quaking swamps.
-Henry David Thoreau
University of Alberta
Invertebrate Community Structure in Relation to the Foraging Ecology of Mallard and
Bufflehead Ducklings in Western Canada
Spine Title: Duckling Diets and Aquatic Invertebrates
by
Jonathan Paul Hornung
A thesis submitted to the Faculty of Graduate Studies and Research in partial fulfillment of the
requirements for the degree of Doctor of Philosophy
in
Wildlife Ecology and Management
Department of Renewable Resources
Edmonton, Alberta
Fall, 2005

Dedication
For Richard and Sharon, for their unwavering belief in my abilities;
and Christine, for her support and encouragement.

Abstract
Aquatic invertebrates are an integral part of wetland function and are essential for duckling
growth and development. The western boreal forest (WBF) is the primary breeding ground for
Bufflehead ducks (Bucephala albeola) and supports more than one quarter of the Canadian
breeding Mallard (Anas platyrhynchos) population. Understanding invertebrate community
ecology and how ducklings use this food source within the WBF are important as this area faces
ongoing anthropogenic alteration. Furthermore, there are continental population implications as
boreal wetlands can act as alternate breeding habitat for waterfowl during drought years in
southern locales.
Aquatic vegetation complexity and prevalence, and fish presence were used to predict the
distribution of invertebrate biomass in 24 wetlands within the southern portion of the WBF.
Brook Stickleback (Culaea inconstans) significantly reduced overall invertebrate biomass and the
biomass of most functional feeding groups of invertebrates, suggesting a competitive relationship
with ducklings. The biomass/L of most invertebrate feeding groups was negatively correlated
with dissected-leaf plant dominance, such as Northern Watermilfoil (Myriophyllum exalbescens);
presence of this plant has been associated with anthropogenic influence.
Comparative dietary and stable isotope analysis showed that Bufflehead ducklings from the
WBF significantly preferred predaceous aquatic invertebrates as prey, specifically the larval form
of the predaceous diving beetle (Coleoptera: Dytiscidae). Mallard duckling stable isotope
signatures and dietary constituents were compared to the stable isotope signatures and availability
of invertebrate prey over three ecozones: boreal plain, aspen parkland, and prairie. Overall,
Mallard ducklings also preferred predaceous invertebrates (specifically Coleoptera) and
maintained a more constricted foraging niche in boreal habitats, suggesting that the WBF

provides more available resources for foraging ducklings than the other two ecoregions. Boreal
wetlands also had the highest invertebrate biomass/L. Food limitation can structure waterfowl
populations; therefore the food preferences outlined here may help managers understand wetland
characteristics important for the sustainability of ducks in the WBF and in other regions.

Acknowledgements
I would like to thank Lee Foote. His enthusiasm, humor, generosity, and understanding made for an excellent supervisor and mentor. Beyond being taught how to be a scientist, I have learned that there is never a wrong time to apply an odd and somewhat inappropriate colloquialism, and that planning practical jokes is an excellent way to spend extra time and resources. I look forward to many years of one-upmanship.
I thank my committee, Drs. Eric Butterworth, Jim Beck, Uldis Silins, and William Tonn for their evaluation and direction that has undoubtedly made me a better scientist. Whatever doesn’t kill makes you stronger … right?
Field work is a unique aspect of what we do as students of the natural sciences, and the relationships with those we work with “in the bush” are equally as unique and important. I would like to thank field workers Stephanie Neufeld, for her impeccable work behind a dissecting scope, Jeff Hornung, for his trailer construction expertise and grumpy morning demeanor, and Christine Rice, for helping me get through several tough field seasons by providing more than just a helping hand. I have to thank the Captain for his willingness to get wet and “fetch ’em up”; he made my last field season really enjoyable and made me wish he was there all-along.
I would like to thank my fellow graduate students, staff and professors from the Department of Renewable Resources for making good times and science not mutually exclusive endeavors; specifically, Lane Gelhorn, Ryan Smith, Natalie Cooper, Robb Stavne, David Stepnisky, Chris Fisher, John Acorn, Curtis Stambaugh, Nicola Koper, Michael Sullivan, Neil Reid, Jordan Walker, Kathryn Martell, Nadele Flynn, and Stephanie Shifflett (sorry to all I have failed to remember). I would like to extend a special thanks to my office mates, Darcy Henderson and Douglas Reid. I have been very lucky to share ideas, jokes and an office with you (not to mention a few beers). Consider yourselves responsible for at least part of what this thesis represents.
Ducks Unlimited Canada was an important part my graduate studies. I would like to specifically thank Eric Butterworth, Wally Price, and notably Lisette Ross for her help and guidance with aquatic invertebrates.
I thank CCI-CBAR grants at the University of Alberta for personal funding. This project received the bulk of it’s funding via the Hydrology, Ecology, and Disturbance (H.E.A.D.) research group. Funding was provided to the H.E.A.D. group from Natural Sciences and Engineering Research Council of Canada, Ducks Unlimited Canada, Weyerhauser, Suncor Energy Inc., Syncrude Canada Ltd., and Alberta Pacific Forest Industries Inc.
The support my family has given me has been phenomenal. Richard, Sharon, Neil, Jeff, Jeni and her husband Scott have been greatest fans of my studies in “bug-ology”. Last, and certainly not least, I would like to thank my wife Christine. When I met Christine she helped convince me to stay in Alberta and work on a graduate degree; she also had a different last name. She has been instrumental in my development as a scientist, my drive when I would falter, and above all else, my best friend and lovely wife. Thank you Christine.

Table of Contents Chapter 1 Ducklings and Aquatic Invertebrates of the Western Boreal Forest .............................. 1
The Functional Ecology of Western Boreal Forest Wetlands ............................................... 1 The Community Ecology of Aquatic Invertebrates............................................................... 3
Fish and other invertebrate predators .......................................................................... 3 Vegetation ................................................................................................................... 3
Waterfowl Duckling Foraging Ecology................................................................................. 4 The determination of duckling preference .................................................................. 4
Summary of Knowledge Gaps............................................................................................... 5 Literature Cited...................................................................................................................... 6
Chapter 2 Aquatic Invertebrate Responses to Fish Presence and Vegetation Complexity in
Western Boreal Wetlands with Implications for Waterfowl Productivity .................................. 1 Introduction ........................................................................................................................... 1 Materials and Methods .......................................................................................................... 2
Description of Study Site ............................................................................................ 2 Invertebrate Sampling Protocol................................................................................... 3 Aquatic Vegetation and Fish Sampling....................................................................... 4 Statistical Analysis ...................................................................................................... 5
Results ................................................................................................................................... 6 Discussion.............................................................................................................................. 7
Management Implications ........................................................................................... 9 Literature Cited.................................................................................................................... 10
Chapter 3 Dietary and stable isotope analysis indicates Bufflehead (Bucephala albeola)
duckling’s reliance on larval Dytiscidae within the Western Boreal Forest ............................ 24 Introduction ......................................................................................................................... 24 Materials and Methods ........................................................................................................ 25
Study Area................................................................................................................. 25 Bufflehead Samples................................................................................................... 26 Statistical Analysis .................................................................................................... 27
Results ................................................................................................................................. 27 Discussion............................................................................................................................ 28 Literature Cited.................................................................................................................... 30
Chapter 4 Mallard duckling dietary analysis over three landscapes: niche breadth and the
importance of Coleoptera ......................................................................................................... 39 Introduction ......................................................................................................................... 39 Study Area and Methods ..................................................................................................... 40
Duckling collection ................................................................................................... 40 Wetland Invertebrate and Vegetation Surveys .......................................................... 41 Stable Isotope Analysis ............................................................................................. 42 Dietary Analysis ........................................................................................................ 43
Results ................................................................................................................................. 44 Discussion............................................................................................................................ 45
Mallard Duckling Diets ............................................................................................. 45 Stable Isotope Analysis ............................................................................................. 47 Mallard Duckling Foraging Niche ............................................................................ 48 Management Implications ......................................................................................... 49
Literature Cited.................................................................................................................... 50 Chapter 5 Synthesis: Aquatic Invertebrates and Waterfowl Management in Canada’s Western
Boreal Forest............................................................................................................................. 72 Prior Conclusions and Literature Review.................................................................. 72 Large scale considerations......................................................................................... 73
The Application of Optimal Foraging Theory to Ducklings ............................................... 74 Research Needs.................................................................................................................... 74 Literature Cited.................................................................................................................... 76

List of Tables
Table 1.1 - The percent abundance of foods of the Mallard duckling ........................................... 11 Table 1.2 - The percent volume of foods of the Bufflehead duckling ........................................... 12 Table 3.1 - Invertebrates consumed by Bufflehead ducklings from the Western Boreal Forest,
Alberta, Canada ........................................................................................................................ 34 Table 4.1 - Invertebrates in Mallard duckling diets percent availability (%A), percent
consumption (%C) and Manley’s selectivity ratio (ŵi) ............................................................ 55

List of Figures
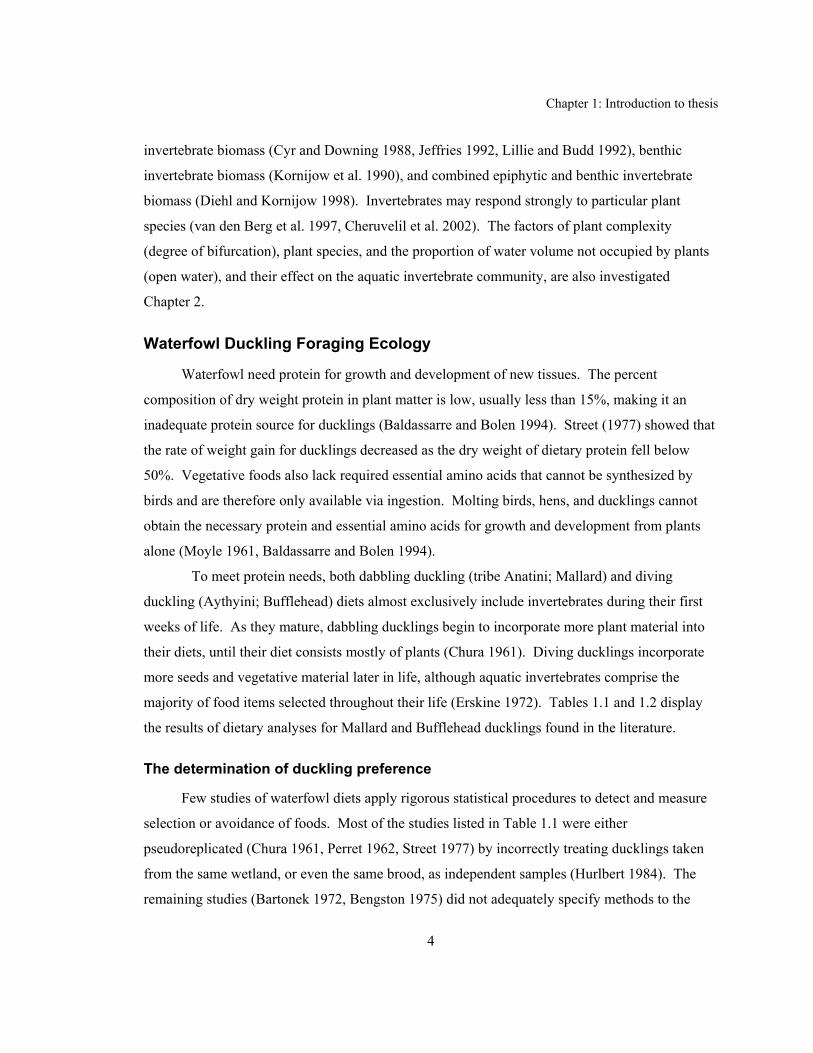
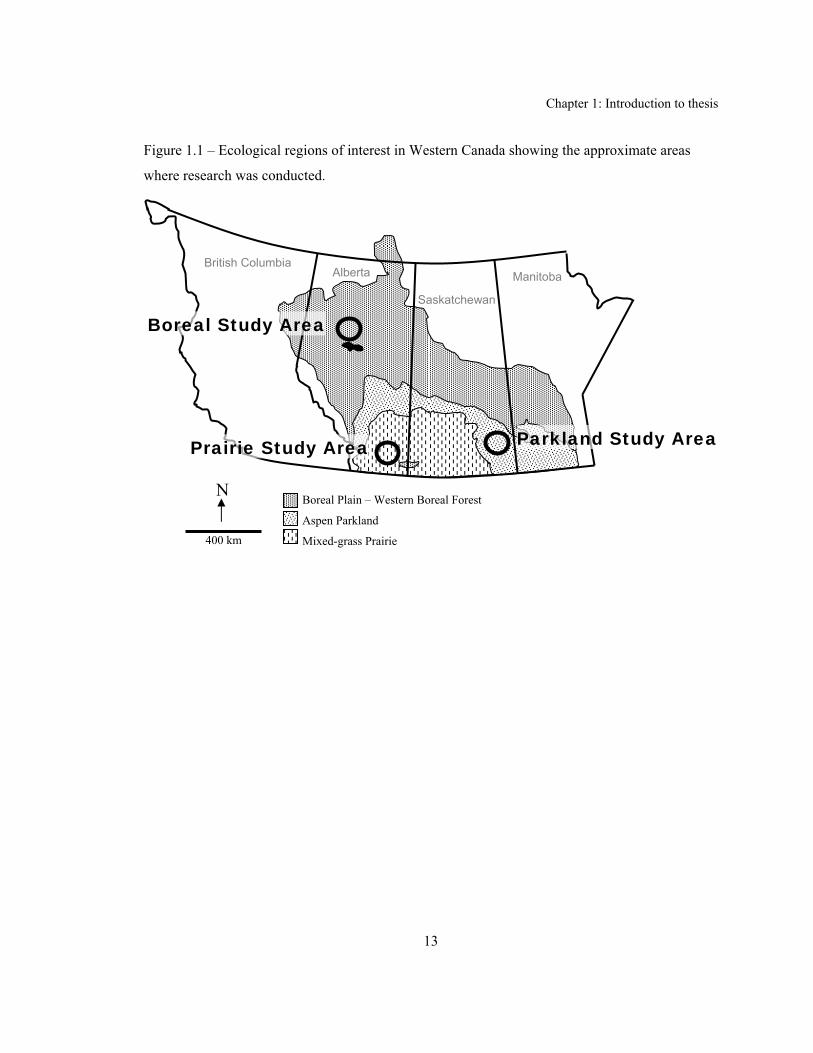
Figure 1.1 – Ecological regions of interest in Western Canada showing the approximate areas
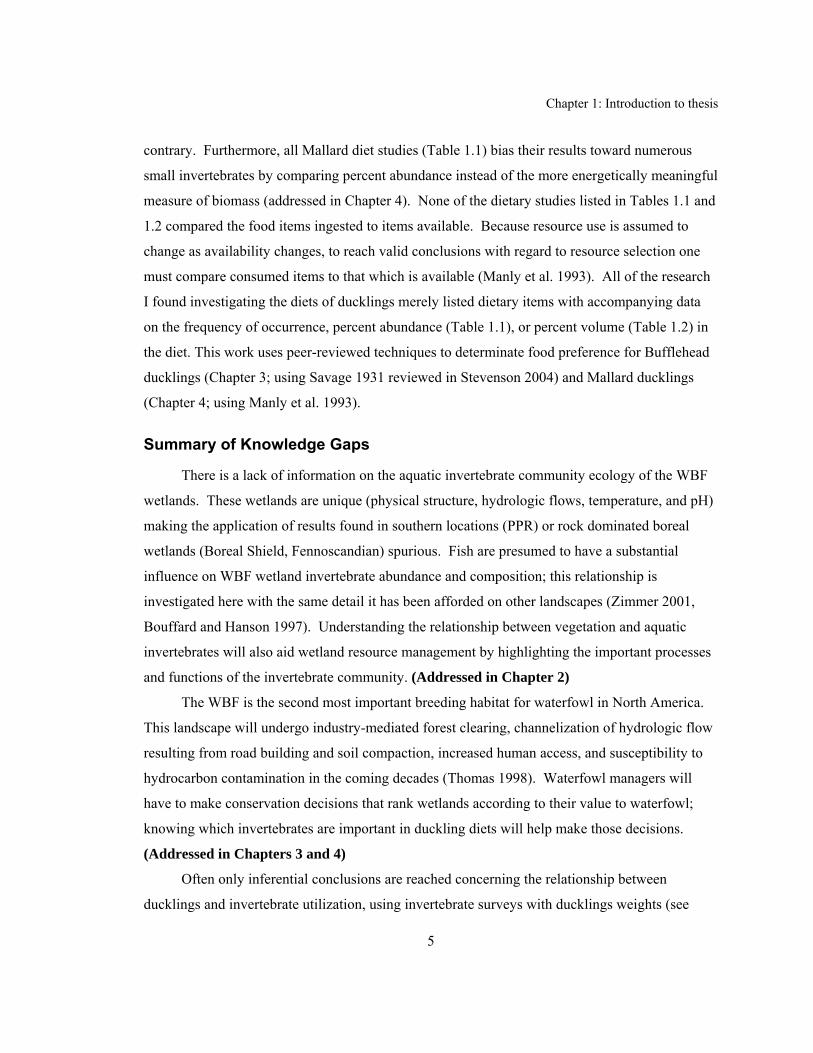
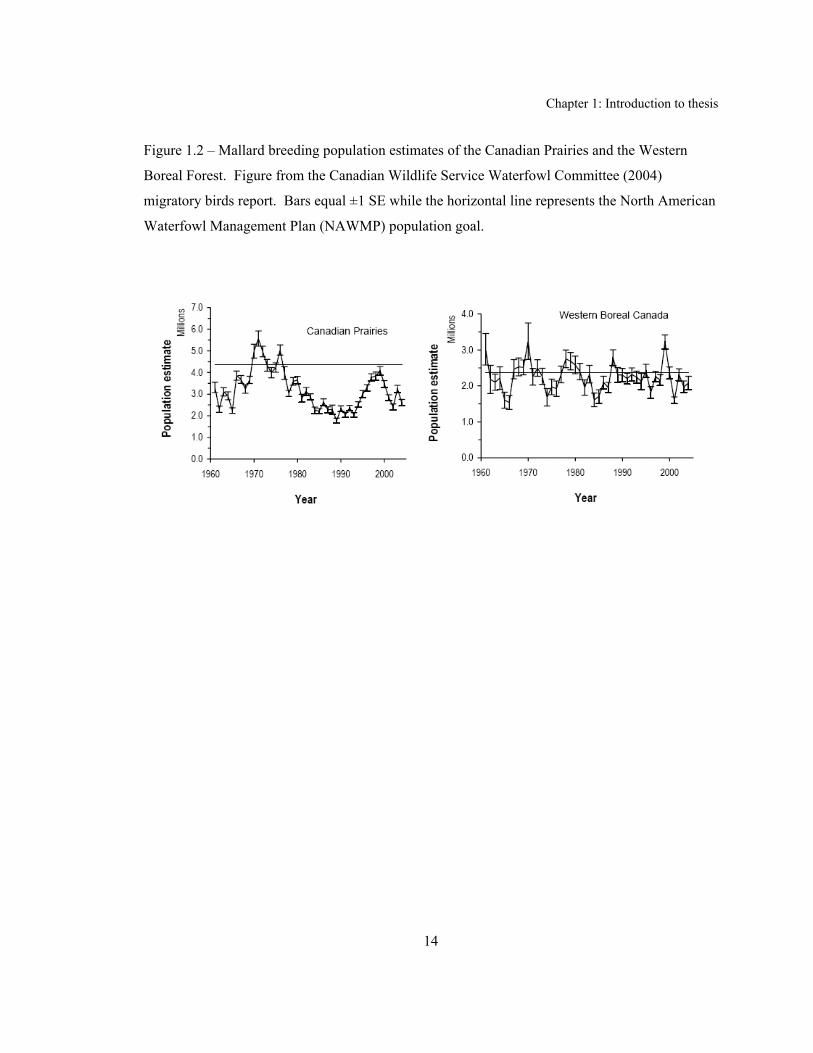
where research was conducted.................................................................................................. 13 Figure 1.2 – Mallard breeding population estimates of the Canadian Prairies and the Western
Boreal Forest............................................................................................................................. 14 Figure 2.1 - Aquatic invertebrate biomass (mg/L) versus total proportion plant water volume
occupied by aquatic plants........................................................................................................ 16 Figure 2.2 - Biomass of invertebrate functional feeding groups sampled over 6 sampling
rounds in 2001 between fishless (n = 20 for rounds 1-3, 5; n = 5 for rounds 4 and 6) and
Brook Stickleback (Culaea inconstans) inhabited wetlands .................................................... 17 Figure 2.3 - Biplot of Canonical Correspondence Analysis representing the influence aquatic
plant species have on invertebrate functional feeding group biomass...................................... 18 Figure 3.1 - Dietary preference by Bufflehead ducklings.............................................................. 35 Figure 3.2 - Aquatic food web isotope values for Bufflehead ducklings and invertebrates
collected from feeding wetlands ............................................................................................... 36 Figure 4.1 - Manley’s selection ratio for invertebrate groups found in Mallard duckling diets .... 55
Figure 4.2 - Wetland invertebrate biomass/L of those invertebrate groups found in duckling
diets at feeding and non-feeding (alternate) sites ..................................................................... 57 Figure 4.3 - Invertebrate biomass/L during the Mallard brooding season comparing
landscapes ................................................................................................................................. 58 Figure 4.4 - Macrophyte prevalence, cover, depth, and slope at Mallard duckling wetlands
comparing measurements at feeding to non-feeding sites ........................................................ 59 Figure 4.5 - Stable isotope values of Mallard duckling livers and invertebrate predators and
grazers....................................................................................................................................... 60 Figure 4.6 - Ordination biplot of invertebrate presence / absence in duckling diets...................... 61

Chapter 1: Introduction to thesis
1
Chapter 1 Ducklings and Aquatic Invertebrates of the
Western Boreal Forest
The sound management of waterfowl populations requires an understanding of their
feeding ecology and food preferences, especially during early life stages when mortality is high.
Aquatic invertebrates are the primary protein source for duckling growth and development.
Efficient foraging on aquatic invertebrates results in increased duckling survival (Cox et al.
1998), one of the three key determinants of waterfowl population dynamics (Hoekman et al.
2002). Hence, understanding the distribution and abundance of duckling food resources is
needed for the management and sustainability of waterfowl. After the Prairie Pothole Region
(PPR; Figure 1.1: Mixed-grass Prairie), the Western Boreal Forest (WBF; Figure 1.1: Boreal
Plain) provides breeding habitat for the greatest number of North American waterfowl. This area
has been assessed as the third most important waterfowl area in North America by Ducks
Unlimited Canada (2000), because of its role in sustaining continental waterfowl populations, the
lack of ecological information from the area, and rate of landscape alteration. This study is
conducted over three ecoregions; the WBF, PPR and the Aspen Parkland (Figure 1.1).
The Functional Ecology of Western Boreal Forest Wetlands
The WBF in Alberta is undergoing rapid anthropogenic alteration (Schindler 1998). This
area provides excellent habitat for waterfowl and other waterbirds, mammals, and invertebrates
with its relatively contiguous habitat and numerous wetland complexes (Thomas 1998, Afton and
Anderson 2001). Northern wetlands are hypothesized to support continental Mallard (Anas
platyrhynchos) populations by providing breeding habitat when wetland conditions in the PPR are
not favourable (Johnson and Grier 1988, Niemuth and Solberg 2003). Over the past 40 years,
Canadian Wildlife Service waterfowl surveys have found that a decrease in breeding Mallard
numbers in the Canadian Prairies has been offset by stable or increasing numbers in the WBF
(Figure 1.2). Conversely, when breeding waterfowl numbers have periodically decreased in the
WBF an increase was found in the PPR, with researchers attributing the PPR increases to

Chapter 1: Introduction to thesis
2
improved prairie wetland condition and density (Canadian Wildlife Service Waterfowl
Committee 2003).
More Bufflehead (Brucephala abeola) ducklings are reared in the WBF than in any other
region on earth (Erskine 1972, Gauthier 1993) highlighting this area’s role for the species.
Unfortunately, the amount of research initiated on boreal wetlands, especially with regard to
invertebrates, has left the aquatic trophic dynamics of the pre-disturbance state poorly understood
and has increased the potential for the mismanagement of boreal natural resources (Kellomaki
2000). It is important that the wetlands of the boreal forest be studied in light of the ongoing
alterations to which they are being subjected.
While little is known about the aquatic invertebrates of the WBF, it is certain that this area
has low overall species diversity because of its northern latitude and recent glacial history
(Schindler 1998). Low diversity leads to a lack of functional redundancy that can make aquatic
invertebrate communities there relatively susceptible to drastic alteration (MacArthur 1955,
Rosenzweig 1995, Jacobsen et al. 1997). This sensitivity may result in drastic changes in
invertebrate composition from seemingly innocuous landscape alterations, and may have
ramifications for waterbirds that depend on invertebrates. Winters are long in the WBF, with ice
forming early and persisting into the spring. This increases the likelihood of a fish winterkill
thereby altering wetland aquatic community composition and changing the relationship migratory
birds have with wetlands (Bouffard and Hanson 1997).
Waterfowl studies initiated within the Fennoscandian boreal region are not easily
compared when considering wetlands in the WBF. Nutrient states differ drastically;
Fennoscandian wetlands are considered ‘rich’ waterfowl ponds at phosphorus concentrations of
19 – 30 µg/L (Sjöberg et al. 2000), while in the WBF phosphorous concentrations average 120
µg/L (Bayley and Prather 2003). Less than 7% of 148 southern boreal plain wetlands surveyed
by Bayley and Prather (2003) were below a phosphorus threshold at which wetland invertebrate
productivity results in Mallard duckling food limitation (Sjöberg et al. 2000). The unique and
understudied status of WBF wetlands warrants rigorous investigation to facilitate sound
management practices thereby ensuring the sustainability of the waterfowl that depend on them.
Chapter 1: Introduction to thesis
3
The Community Ecology of Aquatic Invertebrates
Fish and other invertebrate predators
Aquatic invertebrates provide essential trophic links between wetland primary consumers
(Zimmer et al. 2001), macrophytes (Pieczynska et al. 1999), and insectivores like fish and
waterfowl (Diehl 1992, Sedinger 1992, Cox et al. 1998). Macroinvertebrates communities have
been shown to vary predictably with depth (Murkin 1984), agricultural chemicals (Dieter et al.
1996, Beeson et al. 1998), nutrient regimes (Pieczynska et al. 1999), winter hypoxia (Nelson and
Kaldec 1984), and fish presence (Mallory et al. 1994, Zimmer et al. 2001).
Insectivorous fish are purported to alter the aquatic invertebrate community of a wetland
substantially, suggesting that fish and waterfowl compete for the same invertebrate resource
(Bouffard and Hanson 1997). Alternatively, some researchers have found no effect of fish
presence on aquatic invertebrates (see review in Wooster 1994) or that invertebrate prey
communities are well adapted for, or can quickly respond to, fish predation (Wellborn and
Robinson 1991, Osenberg and Mittelbach 1996). In these latter scenarios predaceous
macroinvertebrates may dominate higher trophic levels of the aquatic food web (Diehl 1992).
Furthermore, predaceous invertebrates like dytiscids (Hicks and Larsson 1995, Dolmen and
Solem 2002) and odonates (Johansson and Nilsson 1991) are well equipped to survive a
winterkill-mediated extirpation from a wetland, a major determinant of fish distribution in the
WBF (Tonn et al. 2004). Therefore, the influence of predaceous macroinvertebrates on
invertebrate community ecology within the WBF may be wider-reaching than other top level
predators, such as fish. In Chapter 2, I investigate the relationship between fish, predaceous
macroinvertebrates, and the aquatic invertebrate community after classifying invertebrates into
feeding guilds.
Vegetation
The abundance of aquatic invertebrates is roughly proportional to the biomass and
complexity (greater incidence of stem and leaf bifurcation per volume occupied) of macrophytes
(Krecker 1939). Studies of aquatic invertebrate communities have corroborated this simple
model (Dvorak and Best 1982, Humphries 1996, Harrison 2000, Marklund et al. 2001). More
specifically researchers have found significant relationships between macrophytes and epiphytic
Chapter 1: Introduction to thesis
4
invertebrate biomass (Cyr and Downing 1988, Jeffries 1992, Lillie and Budd 1992), benthic
invertebrate biomass (Kornijow et al. 1990), and combined epiphytic and benthic invertebrate
biomass (Diehl and Kornijow 1998). Invertebrates may respond strongly to particular plant
species (van den Berg et al. 1997, Cheruvelil et al. 2002). The factors of plant complexity
(degree of bifurcation), plant species, and the proportion of water volume not occupied by plants
(open water), and their effect on the aquatic invertebrate community, are also investigated
Chapter 2.
Waterfowl Duckling Foraging Ecology
Waterfowl need protein for growth and development of new tissues. The percent
composition of dry weight protein in plant matter is low, usually less than 15%, making it an
inadequate protein source for ducklings (Baldassarre and Bolen 1994). Street (1977) showed that
the rate of weight gain for ducklings decreased as the dry weight of dietary protein fell below
50%. Vegetative foods also lack required essential amino acids that cannot be synthesized by
birds and are therefore only available via ingestion. Molting birds, hens, and ducklings cannot
obtain the necessary protein and essential amino acids for growth and development from plants
alone (Moyle 1961, Baldassarre and Bolen 1994).
To meet protein needs, both dabbling duckling (tribe Anatini; Mallard) and diving
duckling (Aythyini; Bufflehead) diets almost exclusively include invertebrates during their first
weeks of life. As they mature, dabbling ducklings begin to incorporate more plant material into
their diets, until their diet consists mostly of plants (Chura 1961). Diving ducklings incorporate
more seeds and vegetative material later in life, although aquatic invertebrates comprise the
majority of food items selected throughout their life (Erskine 1972). Tables 1.1 and 1.2 display
the results of dietary analyses for Mallard and Bufflehead ducklings found in the literature.
The determination of duckling preference
Few studies of waterfowl diets apply rigorous statistical procedures to detect and measure
selection or avoidance of foods. Most of the studies listed in Table 1.1 were either
pseudoreplicated (Chura 1961, Perret 1962, Street 1977) by incorrectly treating ducklings taken
from the same wetland, or even the same brood, as independent samples (Hurlbert 1984). The
remaining studies (Bartonek 1972, Bengston 1975) did not adequately specify methods to the
Chapter 1: Introduction to thesis
5
contrary. Furthermore, all Mallard diet studies (Table 1.1) bias their results toward numerous
small invertebrates by comparing percent abundance instead of the more energetically meaningful
measure of biomass (addressed in Chapter 4). None of the dietary studies listed in Tables 1.1 and
1.2 compared the food items ingested to items available. Because resource use is assumed to
change as availability changes, to reach valid conclusions with regard to resource selection one
must compare consumed items to that which is available (Manly et al. 1993). All of the research
I found investigating the diets of ducklings merely listed dietary items with accompanying data
on the frequency of occurrence, percent abundance (Table 1.1), or percent volume (Table 1.2) in
the diet. This work uses peer-reviewed techniques to determinate food preference for Bufflehead
ducklings (Chapter 3; using Savage 1931 reviewed in Stevenson 2004) and Mallard ducklings
(Chapter 4; using Manly et al. 1993).
Summary of Knowledge Gaps
There is a lack of information on the aquatic invertebrate community ecology of the WBF
wetlands. These wetlands are unique (physical structure, hydrologic flows, temperature, and pH)
making the application of results found in southern locations (PPR) or rock dominated boreal
wetlands (Boreal Shield, Fennoscandian) spurious. Fish are presumed to have a substantial
influence on WBF wetland invertebrate abundance and composition; this relationship is
investigated here with the same detail it has been afforded on other landscapes (Zimmer 2001,
Bouffard and Hanson 1997). Understanding the relationship between vegetation and aquatic
invertebrates will also aid wetland resource management by highlighting the important processes
and functions of the invertebrate community. (Addressed in Chapter 2)
The WBF is the second most important breeding habitat for waterfowl in North America.
This landscape will undergo industry-mediated forest clearing, channelization of hydrologic flow
resulting from road building and soil compaction, increased human access, and susceptibility to
hydrocarbon contamination in the coming decades (Thomas 1998). Waterfowl managers will
have to make conservation decisions that rank wetlands according to their value to waterfowl;
knowing which invertebrates are important in duckling diets will help make those decisions.
(Addressed in Chapters 3 and 4)
Often only inferential conclusions are reached concerning the relationship between
ducklings and invertebrate utilization, using invertebrate surveys with ducklings weights (see

Chapter 1: Introduction to thesis
6
Cooper and Anderson 1996, Cox et al. 1998, Sjöberg et al. 2000), or duckling stomach contents
alone (see Chura 1961, Pehrsson 1984). An investigation of ducking dietary preference, using
rigorous techniques to calculate resource selection is undertaken here. (Addressed in Chapters 3
and 4)
I found no study that compared waterfowl diets between landscapes. Mallards are
ubiquitous, with the largest worldwide distribution of any dabbling duck, yet the paradigm that
implicates chironomidae as a preferred food source has been employed over a wide geographical
region, from the Northwest Territories (Bartoneck 1972) to Fennoscandia (Sjöberg et al. 2000).
Virtually all paradigms of brood ecology for North American waterfowl have originated on the
prairies under the hydrologic and food base conditions found there. Resource use commonly
changes with availability (Manly et al. 1993), and I investigated the preferences of Mallards over
changing resource levels and ecozones. (Addressed in Chapter 4)
Literature Cited
Afton, A. D. and M. G. Anderson. 2001. Declining scaup populations: a retrospective analysis of long-term population and harvest survey data. Journal of Wildlife Management, 65: 781-796.
Baldassarre, G. A., and E. G. Bolen. 1994. Waterfowl Ecology and Management. Wiley, John & Sons, Inc. New York, 609 pp.
Bartonek, J. C. 1972. Summer foods of American widgeon, mallards, and a green-winged teal near Great Slave Lake, N.W.T. Canadian Field Naturalist, 86: 373-376.
Bayley, S. E and C. M. Prather. 2003. Do wetland lakes exhibit alternative stable states? Submersed aquatic vegetation and chlorophyll in western boreal shallow lakes. Limnolgraphy and Oceanography, 48: 2335–2345.
Beeson, D. R., M. C. Lewis,J. M. Powell, and D. R. Nimmo. 1998. Effects of pollutants on freshwater organisms. Water Environment Research, 70: 921-931.
Bengtson, S. A. 1975. Food of ducklings of surface feeding ducks at Lake Myvatn, Iceland. Ornis Fennica, 52: 1-4.
Bouffard, S. H. and M. A. Hanson. 1997. Fish in waterfowl marshes: waterfowl managers’ perspective. Wildlife Society Bulletin, 25: 146-157.
Canadian Wildlife Service Waterfowl Committee. 2003. Population Status of Migratory Game Birds in Canada: November 2003. CWS Migratory Birds Regulatory Report Number 10.
Canadian Wildlife Service Waterfowl Committee. 2004. Population Status of Migratory Game Birds in Canada: November 2004. CWS Migratory Birds Regulatory Report Number 13.

Chapter 1: Introduction to thesis
7
Cheruvelil, K. S., P. A. Soranno, J. D. Madsen and M. J. Roberson. 2002. Plant architecture and epiphytic macroinvertebrate communities: the role of an exotic dissected macrophyte. Journal of the North American Benthological Society, 21: 261-277.
Chura, N. J. 1961. Food availability and preferences of juvenile mallards. North American Wildlife and Natural Resources Conference, 26: 121-134.
Cooper, C. B. and S. H. Anderson. 1996. Significance of invertebrate abundance to dabbling duck brood use of created wetlands. Wetlands, 16: 557-563.
Cox, R. R., M. A. Hanson, C. C. Roy, N. H. Euliss, D. H. Johnson and M. G. Butler. 1998. Mallard duckling growth and survival in relation to aquatic invertebrates. Journal of Wildlife Management, 62: 124-133.
Cyr, H. and J. A. Downing. 1988. The abundance of phytophilous invertebrates on different species of submerged macrophytes. Freshwater Biology, 20: 365-374.
Diehl, S. 1992. Fish predation and benthic community structure: The role of omnivory and habitat complexity. Ecology, 73: 1646-1661.
Diehl, S. and R. Kornijow. 1998. Influence of submerged macrophytes on trophic interactions among fish and macroinvertebrates. p. 24-46. In E. Jeppesen, M. Sondergaard, M. Sondergaard and K. Christoffersen (eds.) The Structuring Role of Submerged Macrophytes in Lakes. Springer, NY, USA.
Dieter, C. D., W. G. Duffy and L.D. Flake. 1996. The effect of phorate on wetland macroinvertebrates. Environmental Toxicology and Chemistry, 15: 308–312.
Dixon, J. 1926. The Bufflehead breeds in California. Condor, 28: 47-48.
Dolmen, D. and J. O. Solem. 2002. Life history of Ilybius fenestratus (Fabricius) (Coleoptera, Dytiscidae) in a Central Norwegian lake. Aquatic Insects, 24: 199-205.
Ducks Unlimited Canada. 2000. Western Boreal Forest Initiative – Duck’s Unlimited Vision for the Western Boreal Forest. Ducks Unlimited Canada, Stonewall, MB, Canada.
Dvorak, J. and E. P. H. Best. 1982. Macroinvertebrate communities associated with the macrophytes of Lake Vechten - structural and functional-relationships. Hydrobiologia, 95: 115-126.
Erskine, A.J. 1972. Buffleheads. Canadian Wildlife Service Monograph Series - Number 4. Department of the Environment, Canada.
Gauthier, G. 1993. Bufflehead (Bucephala albeola). In A. F. Poole and F. B. Gill (eds.) The Birds of North America. The Birds of North America, Inc., Philadelphia, PA.
Harrison, S. S. C. 2000. The importance of aquatic margins to invertebrates in English chalk streams. Archiv fuer Hydrobiologie, 149: 213-240.
Heokman, S. T., L. S. Mills, D. W. Howerter, J. H. Devries and I. J. Ball. 2002. Sensitivity analysis of the life cycle of midcontinent mallards. Journal of Wildlife Management, 66: 883-900.
Hicks, B. J. and D. J. Larson. 1995. Life history patterns of Ilybius Erichson from Newfoundland (Coleoptera: Dytiscidae). Coleopterists Bulletin, 49: 281-287.

Chapter 1: Introduction to thesis
8
Humphries, P. 1996: Aquatic macrophytes, macroinvertebrate associations and water levels in a lowland Tasmanian river. Hydrobiologia, 321: 219-233.
Hurlbert, S. H. 1984. Pseudoreplication and the design of ecological field experiments. Ecological Monographs, 54: 187-211.
Jacobsen, D., R. Schultz and A. Encalada. 1997. Structure and diversity of stream invertebrate assemblages: the influence of temperature with altitude and latitude. Freshwater Biology, 38: 247-261.
Jeffries, M. 1992. Invertebrate colonization of artificial pondweeds of differing fractal dimension. Oikos, 67: 142-148.
Johansson, F. and A. N. Nilsson. 1991. Freezing tolerance and drought resistance of Somatochlora alpestris (Selys) larvae in boreal temporary pools (Anisoptera: Corduliidae). Odonatologica, 20: 245-252.
Johnson, D. H. and J. W. Grier. 1988. Determinants of breeding distributions of ducks. Wildlife Monographs, 100: 1-37.
Kellomaki, S. 2000. Forests of the boreal region: gaps in knowledge and research needs. Forest Ecology and Management, 132(1): 63-71.
Kornijow, R., R. D. Gulati and E. van Donk. 1990. Hydrophyte-macroinvertebrate interactions in Zwemlust, a lake undergoing biomanipulation. Hydrobiologia, 200/201: 467–74.
Krecker, F. H. 1939. A comparative study of the animal population of certain submersed aquatic plants. Ecology, 20: 553-562.
Lillie, R. A. and J. Budd. 1992. Habitat architecture of Myriophyllum spicatum L. as an index to habitat quality for fish and macroinvertebrates. Journal of Freshwater Ecology, 7: 113-125.
MacArthur, R. H. 1955. Fluctuations of animal populations and a measure of stability. Ecology, 36: 533-536.
Mallory, M. L., P. J. Blancher, P. J. Weatherhead and D. K. McNicol. 1994. Presence or absence of fish as a cue to macroinvertebrate abundance in boreal wetlands. Hydrobiologia, 279/280: 345-351.
Manly, B. F. J., L. L. McDonald and D. L. Thomas. 1993. Resource Selection by Animals: statistical design and analysis for field studies. Chapman and Hall, London, UK.
Marklund, O., I. Blindow and A. Hargeby. 2001. Distribution and diel migration of macroinvertebrates within dense submerged vegetation. Freshwater Biology, 46: 913-924.
Moyle, J. B. 1961. Aquatic invertebrates as related to larger water plants and waterfowl. Minn. Dep. Conserv., Div. Game Fish, Sect. Res. Plann. Invest. Rep. 233. 24pp.
Munro, J. A. 1942. Studies of waterfowl in British Columbia – Bufflehead. Canadian Journal of Research, 20: 133-160.
Murkin, H. 1984. Responses by aquatic invertebrates to prolonged flooding of marsh habitat. Ph.D. Thesis. Utah State University, Logan, 126 pp.

Chapter 1: Introduction to thesis
9
Nelson, J. W. and J. A. Kadlec. 1984. A conceptual-approach to relating habitat structure and macroinvertebrate production in fresh-water wetlands. Transactions of the North American Wildlife and Natural Resources Conference, 49: 262-270.
Niemuth, N. D., and J. W. Solberg. 2003. Response of waterbirds to number of wetlands in the Prairie Pothole Region of North Dakota, U.S.A. Waterbirds, 26: 233-238.
Osenberg, C. W. and G. G. Mittelbach. 1996. The relative importance of resource limitation and predator limitation in food chains. pp.134-148 In G. A. Polis and K. O. Winemiller (eds.) Food webs: integration of patterns and dynamics, Chapman and Hall, New York.
Pehrsson, O. 1984. Relationships of food to spatial and temporal breeding strategies of mallards in Sweden. Journal of Wildlife Management, 48: 322-339.
Perret, N. G. 1962. The spring and summer foods of the common mallard, Anas platyrhynchos platyrhynchos L., in south central Manitoba. Thesis, University of British Columbia, Vancouver, Canada.
Pieczynska, E., A. Kolodziejczyk and J. I. Rybak. 1999. The responses of littoral invertebrates to eutrophication-linked changes in plant communities. Hydrobiologia, 391: 9-21.
Rosenzweig, M. L. 1995. Species Diversity in Space and Time. Cambridge University Press, Cambridge.
Savage, R. E. 1931. The relation between the feeding of the herring off the east coast of England and the plankton of the surrounding waters. Fishery Investigation, Ministry of Agriculture, Food and Fisheries, 2: 1-88.
Schindler, D. W. 1998. Sustaining aquatic ecosystems in boreal regions. Conservation Ecology, 2: 18.
Sedinger, J. S. 1992. Ecology of prefledging waterfowl. pp.109-127 In B. D. J. Batt, A. D. Afton, M. G. Anderson, C. D. Ankney, D. H. Johnson, J. A. Kadlec, and G. L. Krapu (eds.). Ecology and Management of Breeding Waterfowl. University of Minnesota Press, Minneapolis, Minnesota, USA.
Sjöberg, K., H. Pöysä, J. Elmberg, and P. Nummi. 2000. Response of mallard ducklings to variation in habitat quality: An experiment of food limitation. Ecology, 81: 329-335.
Stevenson, P. R. 2004. Fruit choice by woolly monkeys in Tinigua National Park, Colombia. International Journal of Primatology, 25: 367-381.
Street, M. 1977. The food of mallard ducklings in a wet gravel quarry, and its relation to duckling survival. Wildfowl, 28: 113-125.
Thomas, R. 1998. The Boreal Forest Region of Alberta. Alberta Environment Protection, Edmonton, Alberta. 312 pp.
Tonn, W. M, P. W. Langlois, E. E. Prepas, A. J. Danylchuk and S. M. Boss. 2004. Winterkill cascade: indirect effects of a natural disturbance on littoral macroinvertebrates in boreal lakes. Journal of the North American Benthological Society, 23: 237-250.

Chapter 1: Introduction to thesis
10
van den Berg, M. S., H. Coops, R. Noordhuis, J. van Schie and J. Simons. 1997. Macroinvertebrate communities in relation to submerged vegetation in two Chara-dominated lakes. Hydrobiologia, 342/343: 143-150.
Wellborn, G. A. and J. V. Robinson. 1991. The influence of fish predation in an experienced prey community. Canadian Journal of Zoology, 69: 2515-2522.
Wooster, D. 1994. Predator impacts on stream benthic prey. Oecologia, 99: 7–15.
Zimmer, K. D., M. A. Hanson and M. G. Butler. 2001. Effects of fathead minnow colonization and removal on a prairie wetland ecosystem. Ecosystems, 4: 346-357.

Chapter 1: Introduction to thesis
11
Table 1.1* - The percent abundance of foods of the Mallard duckling. Only counts of individuals
included in the diet were available, therefore data represent the percent of total
abundance. Invertebrate groups are arranged from highest to lowest weighted average.
Location Manitoba Canada 1
Iowa USA 2
N.W.T. Canada 3 Iceland 4 England 5,† Average
Number 62 69 5 16 99
Diptera§ 39.3 44.4 65.1 49.7 13.2 42.3 Crustacea 2.7 27 2.1 30.8 12.5
Coleoptera§ 6.6 12.5 10.1 13.2 8.5 Gastropoda 11.7 7.7 45.7 1.1 13.2 Trichoptera§ 28.1 0.8 4.6 1.1 6.9 Hemiptera§ 3.5 3.0 12.6 13.2 6.5
Odonata§ 6.1 0.2 2.2 1.7 Ephemeroptera 3.2 12.1 3.1
Hirundea 1.4 1.1 0.6 Hymenoptera 0.5 0.5 0.2
Collembola 0.6 0.1 Arachnoidea 0.1 0.1 trace
Other 10.1 12.0 4.4 * - Invertebrate species groups are not the same as originally reported. Many invertebrate groups were
reclassified to a higher taxonomic group to maintain comparable results (i.e. Simulidae, Chironomidae,
Tendipedidae, and Tabanidae all become Diptera; Cladocera and Amphipoda become Crustacea). Data
sources: 1 - Perret (1962); 2 - Chura (1961); 3 -Bartonek (1972); 4 - Bengston (1975); 5 - Street (1977)
† - Fish eggs were eaten by 8 of 69 1a – 1c ducklings in one of three years of study. Street (1977) makes
mention of how they biased the data and therefore were not included here.
§ - Includes both adult and larval forms.

Chapter 1: Introduction to thesis
12
Table 1.2* - The percent volume of foods of the Bufflehead duckling. Data adapted from that
reported in Erskine (1972). Invertebrate groups are arranged from highest to lowest weighted
average.
Location Alberta, Canada 1
British Columbia, Canada 2
California, USA 3 Average
Number 11 20 4
Odonata§ 22.8 29.6 49.2 33.9 Coleoptera§ 56.5 36.5 31.0
Corixidae 3.1 6.8 49.2 19.7 Amphipoda 20.3 6.8
Ephemeroptera§ 10.7 3.6 Chironomidae§ 1.8 4.6 2.1
Trichoptera§ 4.2 2.3 2.2 Annelida 1.6 0.5 Porifera 0.3 0.1
Cladocera 0.3 0.1 Hydrachnidae 0.1 trace
* - Invertebrate species groups are not the same as originally reported. Many invertebrate groups were
reclassified to a higher taxonomic group to maintain comparable results (i.e.Dysiscidae, Haliplidae,
Hygrotus all become Coleoptera). Data sources: 1 - Erskine (1972); 2 - Munro (1942); 3 - Dixon (1926) § - Includes both adult and larval forms.
Chapter 1: Introduction to thesis
13
Figure 1.1 – Ecological regions of interest in Western Canada showing the approximate areas
where research was conducted.
400 km
Boreal Plain – Western Boreal Forest
Aspen Parkland
Mixed-grass Prairie
N
Manitoba
Saskatchewan
British Columbia Alberta
Boreal Study Area
Prairie Study Area Parkland Study Area
Chapter 1: Introduction to thesis
14
Figure 1.2 – Mallard breeding population estimates of the Canadian Prairies and the Western
Boreal Forest. Figure from the Canadian Wildlife Service Waterfowl Committee (2004)
migratory birds report. Bars equal ±1 SE while the horizontal line represents the North American
Waterfowl Management Plan (NAWMP) population goal.
Chapter 2: Aquatic invertebrates, fish and macrophytes
1
Chapter 2 Aquatic Invertebrate Responses to Fish Presence and
Vegetation Complexity in Western Boreal Wetlands with Implications for Waterfowl Productivity1
Introduction
The trophic interactions that shape aquatic invertebrate communities vary with habitat
complexity (Cheruvelil et al. 2002) and fish presence (Diehl 1992, Bouffard and Hanson 1997)
and can alter wetland food webs (Batzer and Wissinger 1996, Abjornsson et al. 2002, Zrum and
Hann 2002, Hall et al. 2004). Aquatic invertebrates in boreal wetlands link primary production
with many larger organisms, including waterfowl (Cox et al. 1998, Murkin and Ross 2000).
Highly productive eutrophic systems, like those studied here, provide essential resources for
much of North America’s waterfowl (Donaghey 1974, van de Wetering et al. 2000). I selected 24
wetlands in Alberta’s southern boreal forest to investigate the effects of vegetation structure,
abundance, and fish presence on aquatic macroinvertebrate biomass. New information can
improve wetland management and protection as energy and forestry activities continue to alter
Alberta's boreal forest (Schindler 1998, Thomas 1998).
Macrophyte abundance and diversity appears to affect aquatic invertebrate distribution by
providing invertebrates refuge from predators (Mittlebach 1988), increasing the availability of
food resources (Campeau et al. 1994), and furnishing attachment sites or building materials
(Lodge 1985, Dudley 1988). De Szalay and Resh (1996) found that changing wetland vegetation
influenced colonization patterns of invertebrate species, thereby impacting wetland dependent
birds. Fish presence significantly alters the composition and abundance of aquatic invertebrate
communities (Batzer et al. 2000, Zimmer et al. 2001), and typically reduces invertebrate
availability to waterfowl (Bendell and McNicol 1995, Bouffard and Hanson 1997). Omnivorous
1 A version of this paper has been submitted to Wetlands journal. Corresponding styles and format apply to
citations, figures and tables.

Chapter 2: Aquatic invertebrates, fish and macrophytes
2
fishes, like the Brook Stickleback (Culea inconstans), interact with macroinvertebrates by
predating both their early instars (predation) and prey base (competition).
Waterfowl of the western boreal forest (WBF) consume predaceous macroinvertebrates
because of their high relative abundance (Elmberg et al. 2000) and large size (Driver et al. 1974).
Furthermore, benthic invertebrates commonly associated with waterfowl diets, like chironomids
(Dzus and Clark 1997), are less abundant in the WBF (Sjöberg and Danell 1982, compared to
Nelson 1989), or are not available in their larval form as most wetlands are uniformly deep with
flocculent bottoms (Mitsch and Gosselink 2000). Finally, many predaceous invertebrates
(Dytiscids, Notonectids, Hemipterans) make frequent trips to the water’s surface to respire,
increasing their availability to 1-3 week old ducklings that feed at the surface.
My objective was to explain the distribution of aquatic invertebrate biomass as it relates to
plant abundance and complexity, and fish presence. Two testable hypotheses were generated; i)
percentage of the water column occupied by vegetation and the architectural complexity
(incidence of bifurcation) of the vegetation will be positively related to the biomass/L of aquatic
invertebrates, and, ii) the presence of Brook Stickleback reduce invertebrate biomass.
Materials and Methods
Description of Study Site
I studied 24 wetlands in a 30 km by 20 km study area approximately 110 km north of
Slave Lake, Alberta, Canada (56° 00’ – 56° 20’ N, and 115° 20’ – 115° 40’ W; Figure 1.1 –
Utikuma Study Site). Grey luvisols and deep organic peat deposits were the dominant substrate
type underlying aspen (Populus tremuloides), black spruce (Picea mariana) and white spruce
(Picea glauca) forests (Alberta Environmental Protection 1998). All wetlands were associated
with established floating peat beds, allowing the classification of peatlands (Vitt et al. 1998) or
quaking peatlands (Mitsch and Gosselink 2000), had an average depth of less than 2 m, mean
total phosphorus of 95.3 µg/L, mean total nitrogen of 2813.8 µg/L, and mean pH of 8.02.
Wetlands received minimal meltwater in the spring, and were maintained with mid-summer
precipitation and some groundwater inflow. Midsummer phytoplankton blooms were not
uncommon, but many wetlands retained a clear water column for the entire summer. All
wetlands had flocculent bottoms.

Chapter 2: Aquatic invertebrates, fish and macrophytes
3
Invertebrate Sampling Protocol
A total of 6 sampling rounds, each separated by approximately 2.5 weeks, occurred
between 10 May and 5 September, 2001. Each round lasted no longer than a week. All wetlands
were visited four times (sampling rounds 1, 2, 3 and 5), while only 8 of the 24 wetlands were
surveyed for invertebrates in rounds 4 and 6 due to logistic reasons. The data from rounds 4 and
6 are presented here solely in graphical form to maintain temporal continuity. Three sub-
sampling locations were established at each wetland using a stratified random design. All
sampling locations were randomly selected along a transect that ran parallel to the wetland shore
and was one third the entire shoreline length. The transect at each wetland was set away from
confounding factors such as roads, cut lines or oil well locations.
Upward, vertical sweeps with a standard D-shaped invertebrate dip net (640 cm2 opening,
500 micron mesh size), beginning with the net pushed 5 cm into sediment, were made in the
aquatic/terrestrial interface zone (at wetland edge), emergent vegetation zone (within 1m from
edge), and the submerged vegetation zone (between 1m and 2m from edge) at each of the 3 sub-
sampling locations along the shoreline transect. Two sweeps were collected from each aquatic
zone for a total of 18 sweeps per wetland per visit (2 sweeps per zone X 3 zones X 3 sampling
locations). Water depth (vertical sweep length) was measured at each sweep location to calculate
the volume of water sampled. The large mesh size of the dip net did not allow for the adequate
sampling of meiofauna (0.063 – 0.5 mm). Because of the predominance of Sphagnum spp.
surrounding most wetlands, the aquatic/terrestrial interface zone was commonly represented by a
floating bog mat that extended underwater 5 to 30 cm. If this vertical interface was missing from
a site due to drawdown, the shallow water near the shore was sampled. To maintain consistency
between invertebrate and vegetation sampling locations, no dip samples were taken greater than
2m from shore.
Aquatic invertebrates were kept chilled in sealed plastic bags to reduce oxygen depletion
and predation. Invertebrates were sorted from vegetation within 4 hours of sampling and
preserved in a 70% ethanol / 3% formalin solution. Invertebrates were then identified to the
lowest possible taxonomic resolution (Clifford 1991, Merritt and Cummins 1996). This resulted
in most species being identified to genus, with a small fraction to family or species (Appendix A).
After identification, each invertebrate was assigned a small/medium/large size class based
on size guilds within each taxonomic grouping (usually family or genus). Estimates of biomass
Chapter 2: Aquatic invertebrates, fish and macrophytes
4
for each size class were obtained by calculating the mean of approximately 30 dried individuals.
Total invertebrate biomass and the total water volume strained through the dip net were then
averaged over the three sub-sampling locations at a wetland to obtain the value for the
experimental sampling unit: invertebrate mg/L per wetland per sampling round (hereafter
biomass). Invertebrate composition and aquatic vegetation can change significantly over the
summer months, therefore when invertebrate biomass was analysed in relation to aquatic
vegetation, only invertebrate samples from rounds 3 and 5 were used to coincide with vegetative
sampling periods taken at the same time.
Invertebrates were grouped into functional feeding groups (Merrit and Cummings 1996),
detailed in Appendix A. There is difficulty assigning a resource utilization generalization to
some aquatic invertebrates, especially omnivorous taxa. For example, MacNeil et al. (1997)
found that freshwater Gammarus spp., which comprises a significant amount of the invertebrate
biomass found here, feed on many different food sources. Therefore, I created an omnivore
feeding group that included taxa previously described as omnivorous (Edmunds et al. 1976,
Martin et al. 1981, Berte and Pritchard 1983, Mihuc and Toetz 1994, Wiggins 1996, Wiggins and
Parker 1997, Barbour et al. 1999, Huryn and Gibbs 1999, Wissinger et al. 2004).
Aquatic Vegetation and Fish Sampling
Aquatic vegetation characteristics were recorded in 2 rounds from 1 - 9 July and 15 - 20
August, 2001, to coincide with peak standing crop. Two adjacent 1m2 quadrats were established
at each sub-sampling location, extending from the shoreline towards the center of the wetland.
Aquatic plants were identified to species using Moss (1983) and mean water depth measured.
Measurements of submersed plant height (h; cm) and areal plant cover (A; cm2) for each species
were used to estimate plant volume within the quadrat by using the volumetric equation: A x h =
plant volume (cm3). Finally, the total plant volume was divided by the total water volume to
estimate the percent volume of the quadrat occupied by plants. This value was averaged over the
2 quadrats and then averaged over the 3 sub-sampling locations at the wetland. The single value
of percent water volume occupied by plants for a wetland incorporates the mean derived from
both sampling rounds. To measure the relationship between invertebrate biomass and plant
structural differences, each species of plant was assigned to a group: dissected leaved architecture
(i.e. filamentous metaphyton, Ceratophyllum demersum, Myriophyllum exalbescens, Calla
Chapter 2: Aquatic invertebrates, fish and macrophytes
5
palustris), broad leaved architecture or emergent with submerged stems (i.e. Sagittaria cuneata,
Poa spp., Potomageton richardsonii, Scripus spp., Carex spp., Typha latifolia, Polygonum
punctatum, Potamogeton friesii, Caltha palustris), and floating plants (i.e. Lemna minor, Lemna
triscula, Nuphar variegatum).
Fish presence/absence was determined using 4 Gee minnow traps (0.5 cm2 wire-mesh with
2 funnel entrances) set at each wetland for 25 hours, providing over 100 trap hours per wetland
per round. Fish trapping was conducted over 2 rounds, 11 – 15 May and 18 – 22 July, 2001,
totaling 200 trap hours per wetland.
Statistical Analysis
I used a repeated measures ANOVA to test whether invertebrate biomass was significantly
different (alpha = 0.05) over the summer (n = 4 rounds) with respect to fish presence (n = 4
wetlands) or absence (n = 20). Because overall and functional feeding group data were skewed
and contained zeros, a log (x+1) transformation was used to normalize the invertebrate biomass
data, then normality checked with a Lilliefors test. Mauchly's Test of Sphericity was used to
monitor the spherical statistical violations unique to repeated measures analysis. Levene's Test of
Equality of Error Variances was used to test homogeneity of variances between groups through
time (sampling rounds) and between treatments (fish/no fish). Violations of repeated measures
statistical assumptions were problematic due to the unbalanced sample size (n fish absent = 20; n fish
present = 4), therefore analysis of some of the invertebrate feeding groups were inappropriate.
I suspected, because predatory invertebrates are visually oriented predators, that they may
prefer open water environments and may forage less effectively in sites occluded with dense
dissected leaved plants. I also tested for a relationship between overall invertebrate biomass and
overall plant volume using a simple linear regression with proportion plant volume as the
dependent variable. Plant proportion data were arcsine transformed to maintain normality
(McCune and Grace 2002) before being used in regressions and ordination analysis.
Canonical Correspondence Analysis (CCA), a multivariate ordination technique, was used
to investigate the relationships between the invertebrate composition (measured as biomass/L)
and the aquatic plant prevalence in fishless wetlands. CCA is a direct gradient analysis ordination
technique, relating the species (here invertebrates) and environmental (here aquatic macrophytes)
data matrices to each other by way of regression. Hypothesis testing is straightforward with CCA
Chapter 2: Aquatic invertebrates, fish and macrophytes
6
using a Monte Carlo randomization test (Manly 1992), indicating whether or not the species
matrix is associated with the environmental matrix once both have been randomly rearranged and
the analysis run again. An invertebrate feeding group or plant species was included in the CCA
only if non-zero data existed for at least 4 of the wetlands considered. Both matrices were
checked for variable correlations above 0.70 (McCune and Grace 2002), biplot scaling was used,
interspecies correlations were preserved, and a Monte-Carlo Permutation procedure was used to
test the null hypothesis that the species matrix was not related to the chosen environmental
variables.
An ordination biplot of invertebrate feeding groups and plant species reduced complex sets
of ecological variables into a two dimensional representation while maintaining accurate
depictions of relationships between them (McCune and Grace 2002). Pairs of CCA variable
vectors for both plants and invertebrates (arrows in biplot) are positively correlated if they point
in a similar direction; have no correlation on each other if they are at right angles to one another;
and are negatively correlated to each other if pointing in opposite directions (Jongman et al.
1995). Longer arrows represent stronger correlations, having more of an influence in distributing
the variables in ordination space.
Results
All wetlands were associated with peat-based soils, had an average depth of less than 2m,
and were eutrophic based on the total phosphorus criteria described by Wetzel (1983). Four of
the wetlands contained Brook Stickleback. Fish survived through the winter because most
wetlands, including those without fish, did not freeze to the bottom or have lethal O2
concentrations (confirmed during winter sampling), and were not connected to other surface
waters during the 2001/2002 seasons.
The aquatic invertebrate community contained 11 taxonomic orders, incorporating a total
of 105 unique species, genera or families (Appendix A). Gammarus lacustris (Amphipoda) was
the most abundant taxa, contributing 30% to the total biomass and 81% to the omnivore feeding
group. Other invertebrates that contributed greatly to overall biomass included Hyallela azteca
(Amphipoda) at 8.2%, Dytiscus spp. (Coleoptera) at 5.9%, Asynarchus spp. (Trichoptera) at 5.3%
and Notonecta spp. (Hemiptera) at 5.0% of total biomass. Invertebrates from the predatory

Chapter 2: Aquatic invertebrates, fish and macrophytes
7
functional feeding group comprised 33% of the standing invertebrate biomass, and 51% of the
total after excluding Gammarus lacustris.
Invertebrate biomass and aquatic plant volume were positively associated (P = 0.009; r2 =
0.27; Figure 2.1). In most sampling rounds the mean invertebrate biomass was higher in the
absence of Brook Stickleback (Figure 2.2). Predator biomass was significantly negatively
correlated with the volume of dissected leaved aquatic plants (P < 0.001; r2 = 0.83) the
relationship is corroborated in the CCA biplot (Figure 2.3). The predator (P = 0.040), gatherer /
collector (P = 0.011), or herbivore (P = 0.010) functional feeding group biomass was
significantly greater in the absence of fish. The effect of fish presence was also significant when
considering all invertebrates together (P < 0.001; Figure 2.2A). The within-subjects factor
(sampling rounds) and the interaction between fish presence and sampling round were found to be
non-significant (α = 0.05).
After removing fish-bearing wetlands from the analysis, I produced a biplot using CCA
data reduction (Figure 2.3). The first two axes explained 93.6% of the variation and the sum of
all eigenvalues was 0.720. A Monte Carlo test of all canonical axes was significant (P = 0.015;
9999 permutations).
Discussion
Aquatic invertebrates use macrophyte structure for predation refugia, as grazing substrate,
as a food source after senescence and death, and as components for case construction (Diehl and
Kornijow 1998). I found a positive relationship between invertebrate biomass and the prevalence
(proportion volume) of submersed plants (Figure 2.1). Similar relationships have been found
relating macrophyte biomass to epiphytic invertebrate biomass (Cyr and Downing 1988, Jeffries
1992, Lillie and Budd 1992), to benthic invertebrate biomass (Kornijow et al. 1990), and to
combined epiphytic and benthic invertebrate biomass (Diehl and Kornijow 1998). The
congruence between published results to those found here help validate our methods of
macrophyte community measurements using percent water volume occupied (following Canfield
et al. 1984 and Burks et al. 2001) as opposed to direct biomass determination via drying and
weighing.
By separating invertebrates into functional feeding groups (Merritt and Cummins 1996),
and plants into floating or dissected leaved or simple leaved architecture, I more closely

Chapter 2: Aquatic invertebrates, fish and macrophytes
8
investigated invertebrate preference for particular plant arrangements and addressed processes
that explain these associations. The negative relationship between predator biomass and
dissected leaved plants was evident. I advance two possible explanations; (1) visually-oriented
predators flourish in habitats with enough structural complexity to provide increased prey
biomass and hunting cover, but not so much as to make predation difficult, and (2) the phenolic
compounds in Myriophyllum spp. are mobilized to combat herbivory, decreasing prey abundance
and thereby decreasing predator abundance. These defensive hydrolysable tannins are present at
levels in M. exalbescens an order of magnitude more than other aquatic plants and discourage
direct herbivory and the growth of epiphytic algae important for herbivorous invertebrates (Leu et
al. 2002, Gross 2003).
The CCA biplot (Figure 2.3) suggests that invertebrate predators preferred habitats
lacking a high percentage of dissected leaved plants, consistent with the result from the linear
regression discussed above. Furthermore, the positive association omnivores had with dissected
leaved plants, as interpreted in the CCA biplot, could highlight the importance of refugia for these
invertebrates (Thorp and Bergey 1981) and increased detrital material to scavenge as these plants
senesce (MacNeil 1997). The effect of M. exalbescens’s defensive compounds, with broad
biological activity against herbivorous invertebrates, algae, cyanobacteria, and heterotrophic
bacteria (Gross 2003), are well illustrated in Figure 2.3. Not only are predators negatively
associated with this plant, the herbivorous groups represented by gatherer / collectors, shredders,
and piercers avoided them as well.
The predicted negative effect of fish on invertebrate population demonstrated here is
consistent with results from other studies (Bouffard and Hanson 1997, Zimmer et al. 2001).
Brook Stickleback reduce predaceous invertebrate biomass by competing directly for similar food
resources and by consuming early life stages of resident invertebrates when they are smaller and
more vulnerable (Tompkins and Gee 1983). Not only did their predatory and competitive
interactions with aquatic invertebrates correspond with a depletion of the biomass of non-
insectivorous invertebrates, they replaced predaceous macroinvertebrates at the top of the aquatic
food chain. Many aquatic insects emerge synchronously from aquatic larval to terrestrial adult
stages in large numbers, presumably to dilute an individual’s predation risk (Corbet 1999).
During these emergence events, aquatic insects move from deeper refugia to the surface or
shoreline vegetation during which time waterbirds feed heavily on them (de Szalay et al. 2003).
Chapter 2: Aquatic invertebrates, fish and macrophytes
9
The peaks in invertebrate biomass seen in Figures 2.2B-2.2G and 2.2I, represent emergence
events not found in wetlands containing Stickleback.
Waterfowl abundance has been shown to vary predictably with predaceous invertebrates in
boreal systems, as these invertebrates are an important food source for waterfowl (Elmberg et al.
2000). Disregarding amphipods, which are not commonly eaten by Mallard ducklings (Chura
1961, Bengtson 1975, Street 1977), predaceous invertebrates represent 51% of the available
biomass for duckling food. I assert that boreal wetlands contribute to Mallard duckling protein
needs via surface and shore dwelling predaceous invertebrates, unlike the more productive, hard-
bottomed prairie wetlands with accessible and abundant, emerging and benthic larval midge
populations consumed in both larval and emergent forms (Nelson 1989, Dzus and Clark 1997).
While extensive sampling aimed at the chironomid population did not occur here (emergence or
sticky traps, aerial sampling), dip samples that partially sampled the benthic environment found
mean larval chironomid density at 50 / m2 (maximum of 1000 / m2; # of chironomidae
found/benthic area scooped into net), which is much lower than 27,000 / m2 reported from the
prairie pothole region (Nelson 1989) or 3000 / m2 reported from other boreal systems (Sjöberg
and Danell 1982). At lower chironomidae abundance predaceous macroinvertebrates could
assume a larger role in duckling diets. Dissected leaved aquatic plants can decrease the
availability of predaceous invertebrate duckling food. Elmberg et al. (1993) showed that boreal
dabbling duck species richness in Fennoscandia was related to aquatic vegetation complexity,
while de Szalay and Resh (2000) used plant removal experiments to arrive at a similar conclusion
regarding the availability of invertebrates for feeding waterfowl in aquatic habitats with little
cover. I found that when submersed aquatic habitats are dominated by dissected leaf aquatic
plants like M. exalbescens there are fewer invertebrates available for duckling foraging.
Management Implications
The presence of Brook Stickleback resulted in the removal of invertebrate protein that
would be otherwise available to hatchling waterfowl (Pehrsson 1984, DesGranges and Gagnon
1994, Giles 1994, Nummi et al. 2000). A duckling / fish competitive relationship could be
exacerbated by anthropogenic influences (Bouffard and Hanson 1997). When access to remote
lakes is increased via forestry or energy sector practices (Thomas 1998), sportfishing can
introduce Brook Stickleback as baitfish (Schindler 1998), thereby decreasing available biomass as

Chapter 2: Aquatic invertebrates, fish and macrophytes
10
represented by invertebrate emergence events. While winterkill does control many fish
populations in the boreal zone (Danylchuk and Tonn 2003), many of the wetlands studied here do
not freeze to the bottom and Stickleback can tolerate extremely low oxygen levels (Joynt and
Sullivan 2003). Furthermore, clear-cutting increases runoff (Evans et al. 2000), potentially
providing colonization corridors for Stickleback via overland hydrological connections.
In the absence of fish, those invertebrates important for duckling diets are more available in
aquatic habitats lacking an abundance of dissected leaved plants and filamentous algae. The
effects of anthropogenic activities in the WBF, including forestry and access-road development,
often resemble those following fire by increasing runoff, silt, and nutrient loads to wetlands
(Nicolson 1975, Harr and Fredriksen 1988). This can allow dissected leaved plants, like
Myriophyllum exalbescens, to dominate aquatic habitats through increased nutrient loads
(Carpenter et al. 1998), decreasing the availability of those invertebrates important for waterfowl
diets.
Literature Cited
Abjornsson, K., C. Bronmark, and L. A. Hansson. 2002. The relative importance of lethal and non-lethal effects of fish on insect colonisation of ponds. Freshwater Biology 47:1489-1495.
Alberta Environmental Protection. 1998. Natural Regions and Subregions of Alberta – Base Map. Resource Data Division, Edmonton, Alberta, Canada.
Askevold, I. S. 1987. The genus Neohaemonia (Szekesay) in North America: systematics, reconstructed phylogeny, and geographic history. American Entomological Society Transactions 113:361-430.
Baldassarre, G. A., and E. G. Bolen. 1994. Waterfowl Ecology and Management. John Wiley & Sons, Inc. New York.
Barbour, M. T., J. Gerritsen, B. D. Snyder and J.B. Stribling. 1999. Rapid Bioassessment Protocols for use in Streams and Wadeable rivers: Periphyton, Benthic Macroinvertebrates and Fish. Second Edition. EPA 841-B-99-002. U.S. Environmental Protection Agency; Office of water: Washington, DC, WA.
Batzer, D. P. and S. A. Wissinger. 1996. Ecology of insect communities in nontidal wetlands. Annual Review of Entomology 41:75-100.
Batzer, D. P., C. R. Pusateri, and R. Vetter. 2000. Impacts of fish predation on marsh invertebrates: direct and indirect effects. Wetlands 20:307-312.
Bendell, B. E. and D. K. McNicol. 1995. The diet of insectivorous ducklings and the acidification of small Ontario lakes. Canadian Journal of Zoology 73:2044-2051.
Chapter 2: Aquatic invertebrates, fish and macrophytes
11
Bengtson, S. 1975. Food of ducklings of surface feeding duck at Lake Myvatn, Iceland. Ornis Fennica 52:1-4.
Berte, S. B. and G. Pritchard. 1983. The life history of Glyphopsyche irrorata: A caddisfly that over winters as an adult. Holartic Ecology 16:69-73.
Bouffard, S. H. and M. A. Hanson. 1997. Fish in waterfowl marshes: waterfowl managers’ perspective. Wildlife Society Bulletin 25:146-157.
Burks, R. L., E. Jeppesen and D. M. Lodge. 2001. Pelagic prey and benthic predators: impact of odonate predation on Daphnia. Journal of the North American Benthological Society 20:615-628.
Campeau, S., H. R. Murkin and R. D. Titman. 1994. Relative importance of algae and emergent plant litter to freshwater marsh invertebrates. Canadian Journal of Fisheries and Aquatic Sciences 51:681-692.
Canfield, D. E., J. V. Shireman, D. E. Colle, W. T. Haller, C. E. Watkins, and M. J. Maceina. 1984. Prediction of chlorophyll a concentrations in Flordia lakes: importance of aquatic macrophytes. Canadian Journal of Fisheries and Aquatic Sciences 41:497-501.
Carpenter, S. R., E. van Donk and R. G. Wetzel. 1998. Nutrient-loading gradient in shallow lakes: report of the group discussion. p. 393-396 In E. Jeppesen, M. Sondergaard, M. Sondergaard and K. Christoffersen (eds.) The Structuring Role of Submerged Macrophytes in Lakes. Springer, NY, USA.
Cheruvelil, K. S., P. A. Soranno, J. D. Madsen, and M. J. Roberson. 2002. Plant architecture and epiphytic macroinvertebrate communities: the role of an exotic dissected macrophyte. Journal of the North American Benthological Society 21:261-277.
Chura, N. J. 1961. Food availability and preferences of juvenile mallards. Transactions of the North American Wildlife and Natural Resources Conference 26:121-134.
Clifford, H. 1991. Aquatic Invertebrates of Alberta. University of Alberta Press, Edmonton, Alberta.
Corbet, P. S. 1999. Dragonflies: Behaviour and Ecology of Odonata. Harley Books, Martins, England.
Cox, R. R., M. A. Hanson, C. C. Roy, N. H. Euliss, D. H. Johnson, and M. G. Butler. 1998. Mallard duckling growth and survival in relation to aquatic invertebrates. Journal of Wildlife Management 62:124-133.
Cyr, H. and J. A. Downing. 1988. The abundance of phytophilous invertebrates on different species of submerged macrophytes. Freshwater Biology 20:365-374.
Danylchuk, A. J. and W. M. Tonn. 2003. Natural disturbances and fish: local and regional influences on winterkill of fathead minnows in boreal lakes. Transactions of the American Fisheries Society 132:289-298.
de Szalay, F. A. and V. H. Resh. 1996. Spatial and temporal variability of trophic relationships among aquatic macroinvertebrates in a seasonal marsh. Wetlands 16:458-466.
Chapter 2: Aquatic invertebrates, fish and macrophytes
12
de Szalay, F. A. and V. H. Resh. 2000. Factors influencing macroinvertebrate colonization of seasonal wetlands: reponses to emergent plant cover. Freshwater Biology 45:295-308.
de Szalay, F. A., L. C. Carroll, J. A. Beam, and V. H. Resh. 2003. Temporal overlap of nesting duck and aquatic invertebrate abundances in the grasslands ecological area, California, USA. Wetlands 23:739–749.
Deding, G. L. 1988. Gut analysis of diving beetles (Coleoptera: Dytiscidae). Natura Jutlandica 22:177-184.
DesGranges, J. L. and C. Gagnon. 1994. Duckling response to changes in the trophic web of acidified lakes. Hydrobiologia 279/280:207-221.
Diehl, S. 1992. Fish predation and benthic community structure: The role of omnivory and habitat complexity. Ecology 73:1646-1661.
Diehl, S. and R. Kornijow. 1998. Influence of submerged macrophytes on trophic interactions among fish and macroinvertebrates. p. 24-46. In E. Jeppesen, M. Sondergaard, M. Sondergaard and K. Christoffersen (eds.) The Structuring Role of Submerged Macrophytes in Lakes. Springer, NY, USA.
Donaghey, R. 1974. Waterfowl use of Boreal Forest waterbodies near Utikuma Lake, Northern Alberta. M.Sc. Thesis. University of Alberta, Edmonton, AB, Canada.
Driver, E. A., L. G. Sugden and R. J. Kovach. 1974. Calorific, chemical and physical values of potential duck foods. Freshwater Biology 4:281-292.
Dudley, T. L. 1988. The role of plant complexity and epiphyton in colonization of macrophytes by stream insects. Verhandlungen der Internationalen Vereinigung für Theoretische und Angewandte Limnologie 23:1153-1158.
Dzus, E. H. and R. G. Clark. 1997. Overland travel, food abundance, and wetland use by mallards: relationships with offspring survival. Wilson Bulletin 109:504-515.
Edmunds, G. F., Jr., S.T. Jensen, and L. Berner. 1976. The Mayflies of North and Central America. University of Minnesota Press, Minneapolis, MN, USA.
Elmberg, J., K. Sjöberg, H. Pöysä and P. Nummi. 2000. Abundance-distribution relationships on interacting trophic levels: the case of lake-nesting waterfowl and dytiscid water beetles. Journal of Biogeography 27:821-827.
Elmberg, J., P. Nummi, H. Pöysä and K. Sjöberg. 1993. Factors affecting species number and density of dabbling duck guilds in North Europe. Ecography 16:251–260.
Evans, J. E., E. E. Prepas, K. J. Devito and B. J. Kotak. 2000. Phosphorus dynamics in shallow subsurface waters in an uncut and cut subcatchment of a lake on the Boreal Plain. Canadian Journal of Fisheries and Aquatic Sciences 57:60–72.
Giles, N. 1994. Tufted duck (Aythya fuligula) habitat use and brood survival increases after fish removal from gravel pit lakes. Hydrobiologia 279/280:387-392.
Gross, E. M. 2003. Differential response of tellimagrandin II and total bioactive hydrolysable tannins in an aquatic angiosperm to changes in light and nitrogen. Oikos 103:497–504.
Chapter 2: Aquatic invertebrates, fish and macrophytes
13
Hall, D. L, M. R. Willig, D. R. Moorhead, R. W. Sites, E. B. Fish and T. R. Mollhagen. 2004. Aquatic macroinvertebrate diversity of playa wetlands: the role of landscape and island biogeographic characteristics. Wetlands 24:77-91.
Harr, R. D. and R. L. Fredriksen. 1988. Water quality after logging small watersheds within the Bull Run Watershed, Oregon. Water Resources Bulletin 24:1103-1111.
Huryn, A. D., and K. E. Gibbs. 1999. Riparian sedge meadows in Maine, a macroinvertebrate community structured by river-floodplain interaction. p. 363–382. In D. P. Batzer, R. B. Rader, S. A. Wissinger (eds.) Invertebrates in Freshwater Wetlands of North America: Ecology and Management. John Wiley & Sons, Inc. New York, NY, USA.
Jeffries, M. 1992. Invertebrate colonization of artificial pondweeds of differing fractal dimension. Oikos 67:142-148.
Jongman, R. H. G., C. J. F. ter Braak and O. F. R. van Tongeren. 1995. Data Analysis in Community and Landscape Ecology. Cambridge University Press, United Kingdom.
Joynt, A. and M. G. Sullivan. 2003. Fish of Alberta. Lone Pine Publishing, Edmonton, AB, Canada.
Juliano, S. A. 1988. Chrysomelid beetles on waterlily leaves: herbivore density, leaf survival, and herbivore maturation. Ecology 69:1294-1298.
Kornijow, R., R. D. Gulati and E. van Donk. 1990. Hydrophyte-macroinvertebrate interactions in Zwemlust, a lake undergoing biomanipulation. Hydrobiologia 200/201:467–74.
Lantsov, V. I. 1984. Ecology, morphology and taxonomy of artic craneflies of the genus Prionocera (Diptera: Tipulidae). Zoologicheskij Zhurnal 63:1196-1204.
Leu, E., A. Krieger-Liszkay, C. Goussias, and E. M. Gross. 2002. Polyphenolic Allelochemicals from the Aquatic Angiosperm Myriophyllum spicatum Inhibit Photosystem II. Plant Physiology 130:2011-2018.
Lillie, R. A. 1991. The adult aquatic and semiaquatic Coleoptera of nine northwestern Wisconsin wetlands. Coleopterists Bulletin 45:101-111.
Lillie, R. A. and J. Budd. 1992. Habitat architecture of Myriophyllum spicatum L. as an index to habitat quality for fish and macroinvertebrates. Journal of Freshwater Ecology 7:113-125.
Lodge, D. A. 1985. Macrophyte-gastropod associations: observations and experiments on macrophyte choice by gastropods. Freshwater Biology 15:695-708.
MacNeil C., J. T. A. Dick and R. W. Elwood. 1997. The trophic ecology of freshwater Gammarus (Crustacea: Amphipoda); problems and perspectives concerning the functional feeding group concept. Biological Review 72:349–364.
Manly, B. F. J. 1992. The design and analysis of research studies. Cambridge Univ. Press, Cambridge, U.K.
Martin, M. M., J. J. Kukor, J. S. Martin, D. L. Lawson and R. W. Merrit. 1981. Digestive enzymes of larvae of three species of caddisflies. Insect Biochemistry 11:501-505.
McCune, B. and J. B. Grace. 2002. Analysis of Ecological Communities. MjM Software, Gleneden Beach, Oregon, USA.

Chapter 2: Aquatic invertebrates, fish and macrophytes
14
Merritt, R.W. and K.W. Cummins, eds. 1996. An introduction to the aquatic insects of North America. Kendal/Hunt, Dubuque, IA, USA.
Mihuc, T. and D. Toetz. 1994. Determination of diets of alpine aquatic insects using stable isotopes and gut analysis. American Midland Naturalist 131:146-155.
Mitsch, W. J. and J. G. Gosselink. 2000. Wetlands: third edition. John Wiley & Sons, Inc., New York, NY, USA.
Mittlebach, G. G. 1988. Competition among refuging sunfishes and effects of fish density on littoral zone invertebrates. Ecology 69:614–623.
Moss, E. H. 1983. Flora of Alberta : a manual of flowering plants, conifers, ferns and fern allies found growing without cultivation in the province of Alberta, Canada. University of Toronto Press, Toronto, ON, Canada.
Murkin, H. R. and L. C. M. Ross. 2000. Invertebrates in prairie wetlands. p. 201–248. In H. R. Murkin, A. G. van der Valk, and W. R. Clark (eds.) Prairie Wetland Ecology. Iowa State University Press, Ames, IA, USA.
Nelson, R. D. 1989. Seasonal abundance and life cycles of chironomids (Diptera: Chironomidae) in four prairie wetlands. Ph. D. Dissertation. North Dakota State University, Fargo, ND, USA.
Nicolson, J. A. 1975. Water quality and clearcutting in a boreal forest ecosystem. Proceedings of Canadian Hydrology Symposium 75:734-738.
Nummi, P., K. Sjöberg and H. Pöysä. 2000. Individual foraging behaviour indicates resource limitation: an experiment with mallard ducklings. Canadian Journal of Zoology 78:1891-1895.
Pehrsson, O. 1984. Relationships of food to spatial and temporal breeding strategies of mallards in Sweden. Journal of Wildlife Management 48:322-339.
Pritchard, G. and S. B. Berte. 1987. Growth and food choice by two species of limniphilid caddis larvae given natural and artificial foods. Freshwater Biology 18:529-535.
Resh, V. H. 1976. The biology and immature stages of the caddisfly genus Ceraclea in eastern North America (Trichoptera: Leptoceridae). Annals of the Entomological Society of America 69:1039-1061.
Schindler, D. W. 1998. Sustaining aquatic ecosystems in Boreal regions. Conservation Ecology 2:18.
Scudder, G. G. E. 1987. Aquatic and semiaquatic Hemiptera of peatlands and marshes of Canada. Memoirs of the Entomological Society of Canada 140:65-98.
Shemanchuk, J. A. 1972. Observations on abundance and activity of three species of ceratopogonidae (Diptera) in north eastern Alberta. Canadian Entomologist 104:445-448.
Sjöberg, K. and K. Danell. 1982. Feeding activity of ducks in relation to diel emergence of chironomids. Canadian Journal of Zoology 60:1383-1387.
Street, M. 1977. The food of Mallard ducklings in a wet gravel quarry, and its relation to duckling survival. Wildfowl 28:113-125.

Chapter 2: Aquatic invertebrates, fish and macrophytes
15
Thomas, R. 1998. The boreal forest natural region of Alberta. Alberta Environmental Protection, Natural Resources Service, Recreation & Protected Areas Division, Natural Heritage Planning and Evaluation Branch, Edmonton, AB, Canada.
Thorp, J. H. and E. A. Bergey. 1981. Field experiments on responses of a freshwater, benthic macroinvertebrate community to vertebrate predators. Ecology 62:365-375.
Tindall, A. R. 1960. The larval case of Triaenodes bicolour Curtis (Trichoptera: Leptoceridae). Proceedings of the Royal Entomological Society 35:93-96.
Tompkins, A. M. and J. H. Gee. 1983. Foraging behavior of brook stickleback, Culaea inconstans (Kirtland): Optimization of time, space, and diet. Canadian Journal of Zoology 61:2482-2490.
van de Wetering, D., A. J. Richard , M. Gendron, S. A. Smyth, G. R. Stewart and J. B. Pollard. 2000. Integrating Remote Sensing and GIS for Wetland and Waterbird Conservation in the Western Boreal Forest: Ducks Unlimited’s Western Boreal Forest Initiative. American Association for the Advancement of Science & Yukon Science Institute Conference Proceedings.
Vitt, D. H., L. A. Halsey, M. N. Thormann, and T. Martin. 1998. Peatland Inventory of Alberta, Phase 1: Overview of Peatland Resources in the Natural Regions and Subregions of the Province. (Prepared for the Alberta Peat Task Force.) University of Alberta, Edmonton, AB, Canada.
Wetzel, R.G. 1983. Limnology: second edition. Saunders College Publishing, Philadelphia, PA, USA.
Wiggins, G. B. 1996. Larvae of the North American Caddisfly Genera (Trichoptera): second edition. University of Toronto Press, Totonto, ON, Canada.
Wiggins, G. B. and C. R. Parker. 1997. Caddisflies of the Yukon, with analysis of the Beringian and Holartic species of North America. p. 787-866. In H. V. Danks and J. A. Downes (eds.) Insects of the Yukon. Biological Survey of Canada (Terrestrial Arthropods), Ottawa, ON, Canada.
Wissinger, S., J. Steinmetz, J. S. Alexander and W. Brown. 2004. Larval cannibalism, time constraints, and adult fitness in caddisflies that inhabit temporary ponds. Oecologia 138:39-47.
Zimmer, K. D., M. A. Hanson, M. G. Butler and W. G. Duffy. 2001. Size distribution of aquatic invertebrates in two prairie wetlands, with and without fish, with implications for community production. Freshwater Biology 46:1373-1386.
Zrum, L. and B. J. Hann. 2002. Invertebrates associated with submersed macrophytes in a prairie wetland: Effects of organophosphorus insecticide and inorganic nutrients. Archiv fuer Hydrobiologie 154:413-445.
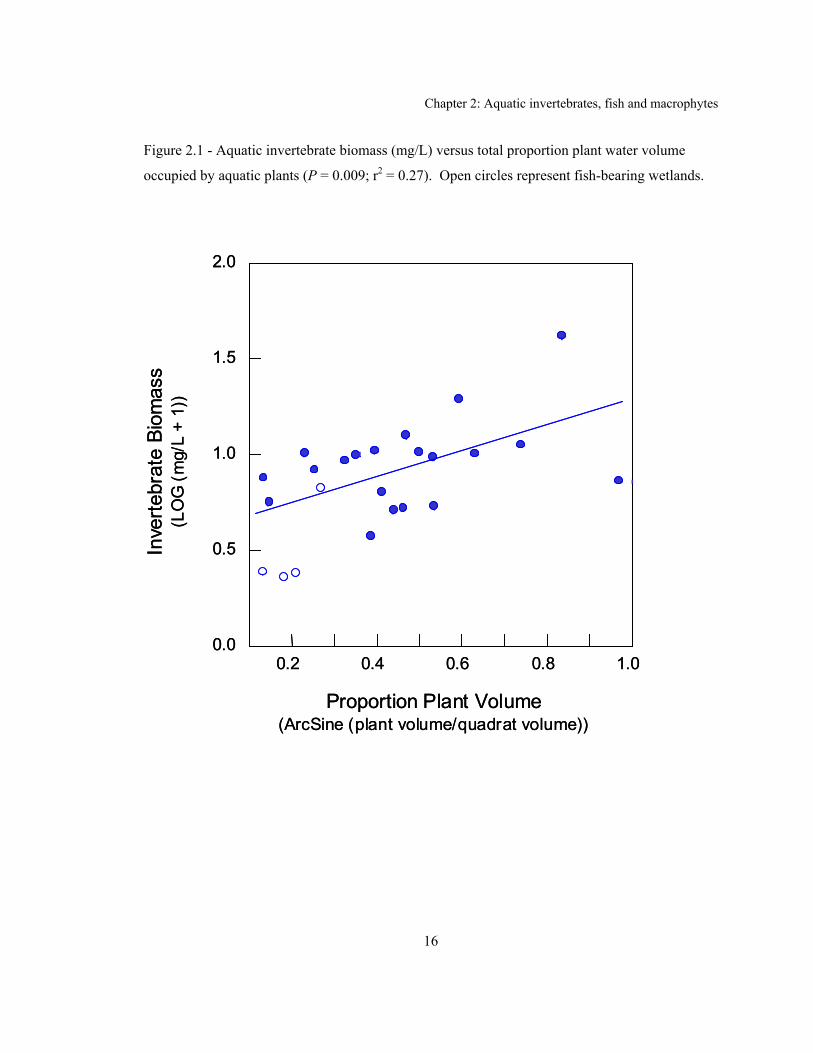
Chapter 2: Aquatic invertebrates, fish and macrophytes
16
Figure 2.1 - Aquatic invertebrate biomass (mg/L) versus total proportion plant water volume
occupied by aquatic plants (P = 0.009; r2 = 0.27). Open circles represent fish-bearing wetlands.
Proportion Plant Volume(ArcSine (plant volume/quadrat volume))
Inve
rtebr
ate
Biom
ass
(LO
G (
mg/
L +
1))
0.2 0.4 0.6 0.8 1.00.0
0.5
1.0
1.5
2.0
Proportion Plant Volume(ArcSine (plant volume/quadrat volume))
Inve
rtebr
ate
Biom
ass
(LO
G (
mg/
L +
1))
0.2 0.4 0.6 0.8 1.00.0
0.5
1.0
1.5
2.0
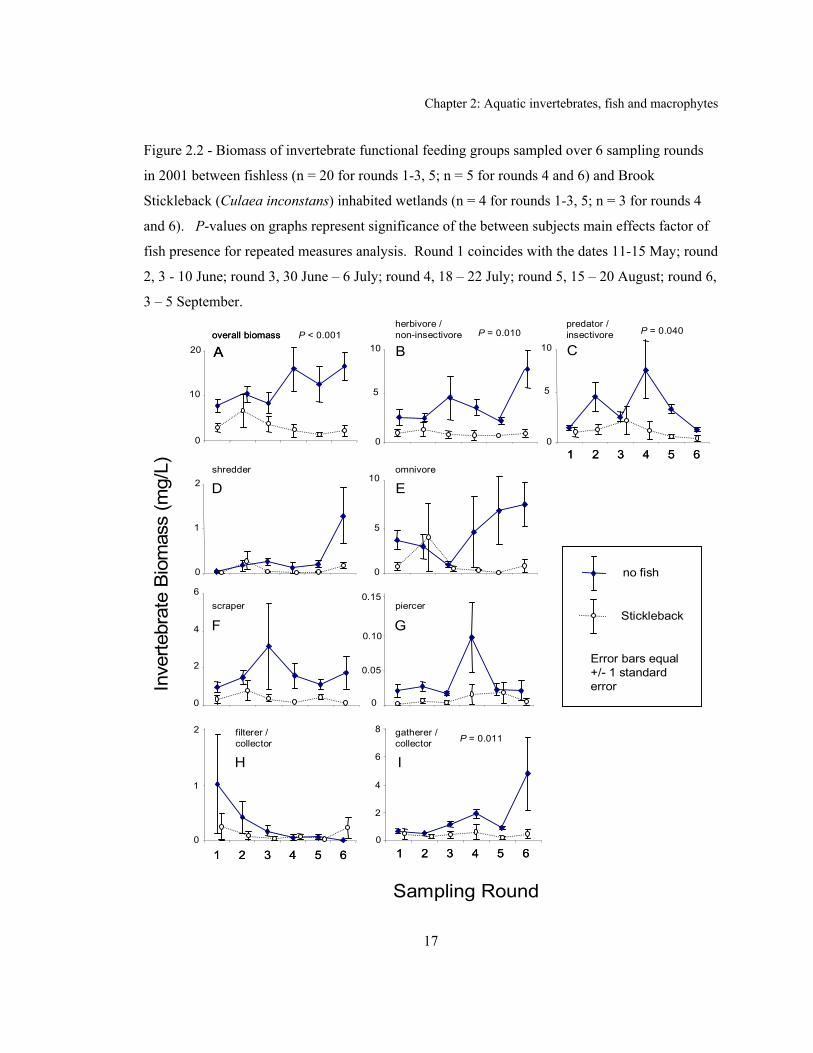
Chapter 2: Aquatic invertebrates, fish and macrophytes
17
Figure 2.2 - Biomass of invertebrate functional feeding groups sampled over 6 sampling rounds
in 2001 between fishless (n = 20 for rounds 1-3, 5; n = 5 for rounds 4 and 6) and Brook
Stickleback (Culaea inconstans) inhabited wetlands (n = 4 for rounds 1-3, 5; n = 3 for rounds 4
and 6). P-values on graphs represent significance of the between subjects main effects factor of
fish presence for repeated measures analysis. Round 1 coincides with the dates 11-15 May; round
2, 3 - 10 June; round 3, 30 June – 6 July; round 4, 18 – 22 July; round 5, 15 – 20 August; round 6,
3 – 5 September.
0
10
20
0
5
10omnivore
0
1
2shredder
0
5
10
0
2
4
6scraper
0
0.05
0.10
0.15piercer
0
2
4
6
8 gatherer /collector
0
1
2 filterer / collector
0
5
10
no fish
Stickleback
Error bars equal +/- 1 standard error
overall biomass
Aoverall biomass
A
herbivore / non-insectivore
B
D
predator / insectivore
C
E
F G
IH
Inve
rtebr
ate
Bio
mas
s (m
g/L)
Sampling Round
P < 0.001 P = 0.010 P = 0.040
P = 0.011
1 2 3 4 5 61 2 3 4 5 6 1 2 3 4 5 61 2 3 4 5 6
1 2 3 4 5 61 2 3 4 5 6
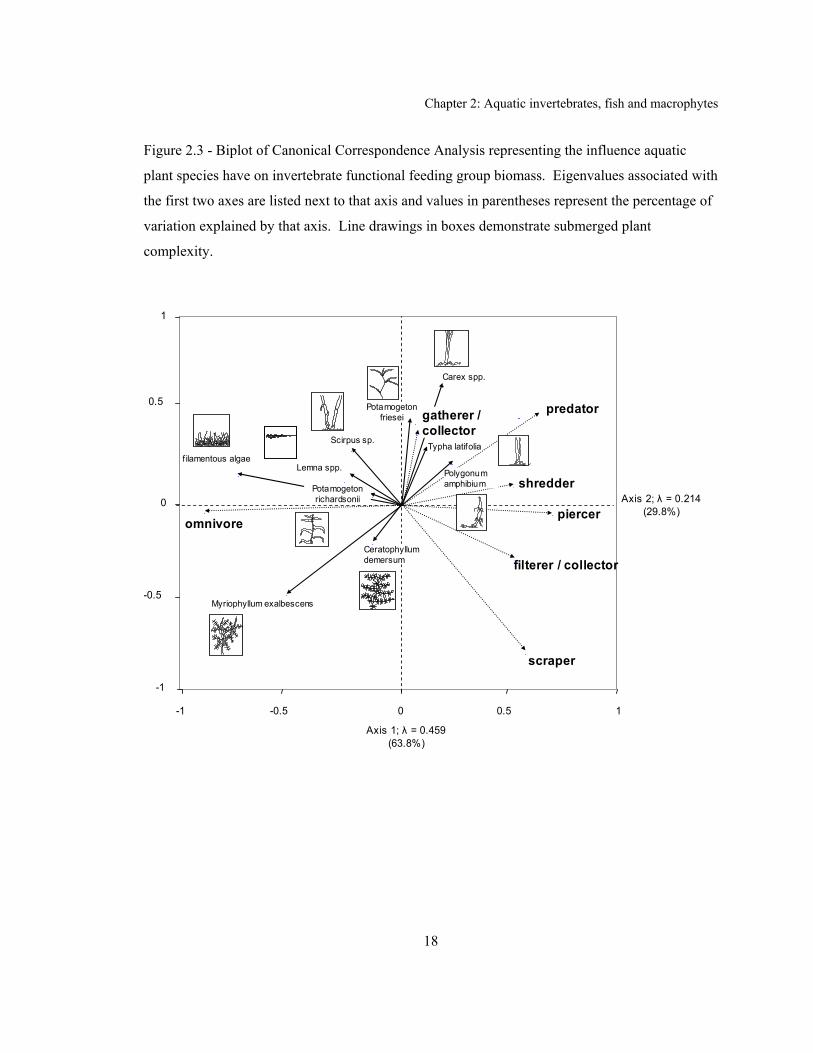
Chapter 2: Aquatic invertebrates, fish and macrophytes
18
Figure 2.3 - Biplot of Canonical Correspondence Analysis representing the influence aquatic
plant species have on invertebrate functional feeding group biomass. Eigenvalues associated with
the first two axes are listed next to that axis and values in parentheses represent the percentage of
variation explained by that axis. Line drawings in boxes demonstrate submerged plant
complexity.
Axis 1; λ = 0.459(63.8%)
Axis 2; λ = 0.214(29.8%)
-1
-0.5
0
0.5
1
-1 -0.5 0 0.5 1
Carex spp.
Polygonumamphibium
Potamogetonfriesei
Typha latifoliaScirpus sp.
Ceratophyllumdemersum
Lemna spp.
Myriophyllum exalbescens
f ilamentous algae
omnivorepiercer
predator
shredder
filterer / collector
scraper
gatherer / collector
Potamogetonrichardsonii

Chapter 2: Aquatic invertebrates, fish and macrophytes
19
Appendix 2A - Aquatic invertebrate species identified from boreal wetlands in Northern Alberta, Canada with total number of individuals
found (Abun.) per round and total biomass (Bio.; milligrams) in parentheses. Values are separated into rounds, corresponding to the dates
11-15 May for round 1, 3-11 June for round 2, 28 June to 6 July for round 3, 18–22 July for round 4, 15-20 August for round 5, and 5-6
September for round 6. Totals for abundance and biomass for rounds 1-3 and 5 incorporate the sampling of 24 wetlands, while in rounds
4 and 6 eight wetlands were sampled.
Feeding Group
Order FamilyGenus / Species
Ref* Round 1
Abun.(Bio.) Round 2
Abun.(Bio.) Round 3
Abun.(Bio.) Round 4
Abun.(Bio.) Round 5 Abun.(Bio.)
Round 6 Abun.(Bio.)
Diplostraca Lynceidae Lynceus 1 9 (3.6)filterer /
collector Diptera
Culicidae Aedes 2 1 (1.9)
Anopheles 2 10 (8.9) 10 (2.4) 1 (0.2)
Veneroida Pisidiidae Pisidium 2 19 (155.8) 98 (803.6) 12 (98.4) 2 (16.4) 1 (8.2)
Sphaerium 2 222 (2220.0) 11 (110.0) 10 (100.0) 6 (60.0) 8 (80.0) 16 (160.0)
Amphipoda Hyalellidae Hyalella azteca 2 1717 (1732.9) 875 (860.8) 2299 (1740.9) 1339 (1015.3) 3059 (1664.7) 1018 (1546.5)gatherer /
collector Diptera
Chironomidae 2, 3 137 (82.2) 419 (261.1) 990 (368.0) 232 (80.8) 165 (68.1) 34 (28.8)
Dixidae Dixella 2 16 (5.9) 13 (4.8) 8 (3.0) 28 (10.4) 2 (0.7)
Chironomidae pupae 2
480 (606.9) 172 (243.5) 138 (116.6) 7 (7.7) 3 (2.1) 1 (1.4)
Stratiomyidae 2, 3 4 (11.0) 1 (11.7)
Ephemoptera Caenidae Caenis 2 80 (20.0) 106 (38.0) 106 (26.5) 2 (0.5) 28 (7.0) 37 (9.3)
Siphlonuridae Siphlonurus 2, 5, 6 26 (307.1) 27 (318.9) 10 (118.1) 1 (11.8)
Baetidae Callibaetis 2 69 (64.8) 21 (27.5) 46 (26.1) 33 (47.0)
Centroptilum 3 1 (1.4)
Gastropoda Planorbidae Promenetus exacuous 2 1 (4.0)
Promenetus umbilicatellus 2
61 (93.6) 83 (122.9) 103 (149.4) 69 (100.1) 23 (33.4) 31 (45.0)
Oligochaets Lumbriculidae 2 47 (28.7) 51 (31.1) 137 (84.3) 22 (13.4) 11 (6.7) 12 (7.3)
Naididae 1 4 (2.4) 36 (22.0) 13 (7.9) 13 (7.9)

Chapter 2: Aquatic invertebrates, fish and macrophytes
20
Feeding Group
Order FamilyGenus / Species
Ref* Round 1
Abun.(Bio.) Round 2
Abun.(Bio.) Round 3
Abun.(Bio.) Round 4
Abun.(Bio.) Round 5 Abun.(Bio.)
Round 6 Abun.(Bio.)
Stylaria lacustris 1, 2 13 (7.9)
Ostracoda
2 16 (3.2)
Trichoptera Leptoceridae Cerclea 4 1 (0.5)
omnivore Amphipoda Gammaridae Gammarus lacustris 2 472 (4185.8) 1181 (11267.3) 305 (1659.0) 392 (1806.3) 1417 (9299.8) 535 (3296.0)
Coleoptera
Hydrophilidae Hydrobius 2, 3 4 (11.0) 16 (21.9) 3 (4.1)
Diptera Tabanidae Chrysops 2 1 (1.6)
Trichoptera Limnephilinae Arctopora 7, 8, 21 116 (23.2) 9 (1.8) 65 (13.6) 136 (27.2) 80 (16.0)
Glyphopsyche 2, 9, 10 10 (27.0)
Asynarchus 7, 8 197 (4091.7) 24 (498.5) 10 (187.7) 5 (103.9) 32 (664.6) 1 (20.8)
Phryganeidae Banksiola 9 50 (161.2) 20 (139.8) 95 (50.2) 2 (14.0)
Phryganea 2, 3, 9, 11 1 (7.0) 7 (3.2) 13 (45.2)
Ptilostomis 3, 9 1 (0.5) 12 (51.2)
piercer Coleoptera Haliplidae Haliplus 3, 12 24 (33.9) 44 (66.4) 26 (35.8) 32 (48.3) 41 (53.7) 6 (9.1)
Trichoptera
Hydroptilidae Orthotrichia 9 2 (0.9)
predator Trombidiformes (Hydrachnidia) 1, 2 115 (73.0) 150 (117.6) 84 (30.1) 39 (12.7) 117 (50.2) 4 (2.9)
Coleoptera
Dytiscidae Acilius 3, 13 2 (34.8)
Agabus 3, 13 4 (99.0) 49 (378.4) 2 (64.0) 3 (33.4)
Anacaena 3, 13 2 (3.5) 3 (8.3)
Colymbetes 3, 13 7 (19.3) 60 (132.2) 5 (13.8)
Dytiscus 3, 13 4 (1440.3) 6 (2160.5) 16 (1497.3) 2 (660.2) 1 (360.1)
Graphoderus 3, 13 9 (288.1) 18 (576.2) 31 (993.4) 7 (552.1) 30 (960.4)
Hydaticus 3, 13 1 (32.0) 3 (9.0)
Hydroporus 3, 13 6 (16.6) 5 (14.0) 1 (2.8) 12 (33.8) 3 (8.3)
Hygrotus 3, 13 23 (63.5) 29 (80.0) 85 (100.1) 20 (32.4) 41 (136.2) 7 (19.3)
Ilybius 3, 13 4 (128.0) 3 (38.0)
Laccophilus 2, 13 13 (65.1) 14 (34.5) 36 (29.0) 12 (33.1) 21 (49.7) 11 (88.9)
Laccornis 3, 13 1 (2.8) 3 (8.3)

Chapter 2: Aquatic invertebrates, fish and macrophytes
21
Feeding Group
Order FamilyGenus / Species
Ref* Round 1
Abun.(Bio.) Round 2
Abun.(Bio.) Round 3
Abun.(Bio.) Round 4
Abun.(Bio.) Round 5 Abun.(Bio.)
Round 6 Abun.(Bio.)
Liodessus 3, 13 5 (13.8) 6 (8.3) 3 (8.3) 1 (2.8)
Oreodytes 3, 13 2 (1.4)
Rhantus 3, 13 5 (160.1) 28 (369.8) 78 (133.0) 6 (16.6) 1 (0.7) 1 (2.8)
Gyrinidae Gyrinus 3 18 (22.5) 1 (1.3) 7 (10.8) 1 (1.3) 1 (1.3) 22 (27.5)
Hydrophilidae Laccobius 2 23 (30.4) 1 (2.8) 1 (2.8)
Paracymus 2, 3 2 (5.5)
Diptera Ceratopogonidae 2, 14 100 (26.0) 105 (27.3) 232 (60.3) 38 (9.9) 55 (14.3) 40 (10.4)
Chaoboridae Chaoborus 3 303 (239.4) 30 (24.1) 35 (27.7) 97 (76.6) 6 (4.7)
Sciomyzidae 3 2 (34.6) 4 (6.5)
Chironomidae Tanypodinae 2, 3 12 (4.0) 13 (5.6) 37 (16.5) 17 (5.3) 11 (16.4)
Hemiptera Corixidae 2, 15 51 (171.4) 15 (21.8) 151 (129.6) 136 (127.2) 171 (312.3) 25 (49.6)
Gerridae Limnoporus 3 7 (9.1) 7 (18.4) 13 (16.9) 16 (20.8) 13 (16.9)
Mesovelidae Mesovelia 3 4 (5.2) 1 (1.3) 1 (1.3)
Veliidae Microvelia 3 3 (0.4) 4 (0.6) 47 (6.6) 1 (0.1) 3 (0.4)
Notonectidae Notonecta 3 27 (405.5) 16 (278.0) 68 (866.0) 90 (1284.7) 164 (2276.6) 3 (67.7)
Rhynchobdellida Glossiphoniidae Glossiphonia complanata 2 15 (74.1) 11 (96.3) 9 (32.5) 11 (21.3) 12 (23.3) 13 (205.1)
Helobdella stagnalis 2 8 (30.5) 20 (316.3) 12 (23.3) 5 (9.7) 19 (36.9)
Theromyzon 2 1 (1.9)
Helobdella elongata 2 1 (1.9)
Arhynchobdellida Haemopidae
Haemopis grandis 2 10 (124.3) 8 (364.5) 1 (65.7)
Haemopis marmorata 2 5 (328.7)
Erpobdellidae Dina or Mooreobdella 2 15 (186.7) 36 (238.6) 11 (85.1) 12 (38.3) 5 (9.7)
Nephelopsis obscura 2 15 (89.1) 20 (350.1) 19 (299.4) 1 (1.9) 3 (5.8)
Erpobdella punctata 2 2 (33.9) 3 (133.4) 3 (35.8) 5 (9.7) 4 (22.8)
Odonata (Suborder: Anisoptera) (immature) 2, 3 8 (40.6) 40 (229.1) 3 (15.2) 41 (208.3) 1 (5.1)
Odonata Aeshnidae Aeshna 2, 3 8 (56.6) 6 (289.7) 41 (165.0) 44 (104.4) 32 (649.5) 1 (15.4)
Coenagrionidae Coenagrion 2, 3 3 (7.9) 1 (2.6) 4 (10.6)

Chapter 2: Aquatic invertebrates, fish and macrophytes
22
Feeding Group
Order FamilyGenus / Species
Ref* Round 1
Abun.(Bio.) Round 2
Abun.(Bio.) Round 3
Abun.(Bio.) Round 4
Abun.(Bio.) Round 5 Abun.(Bio.)
Round 6 Abun.(Bio.)
Enallagma 2, 3 175 (591.5) 119 (490.1) 86 (295.9) 29 (94.9) 178 (397.9) 43 (86.2)
Lestidae Lestes 2, 3 16 (37.0) 60 (294.2) 15 (93.2)
Libellulidae Sympetrum 2, 3 7 (311.2) 5 (44.6) 9 (105.3) 5 (53.9)
Leucorrhinia 2, 3 9 (382.7) 51 (2614.4) 21 (243.0) 4 (42.2) 12 (541.7) 3 (25.9)
(immature) 2, 3 5 (230.5) 3 (207.1) 1 (11.7) 6 (178.2)
Corduliidae Cordulia shurtleffi 2, 3 7 (421.3) 20 (912.7) 1 (11.7) 2 (138.1) 1 (11.7)
Somatochlora 2, 3 1 (7.1) 5 (102.0) 22 (245.4) 2 (23.4) 9 (330.0)
Trichoptera Phryganeidae Agrypnia 9 33 (99.0) 4 (28.0) 1 (0.5) 5 (2.3) 5 (2.3) 18 (60.5)
Leptoceridae Mystacides 9 8 (21.6) 66 (178.2) 4 (10.8) 3 (8.1) 21 (56.7) 20 (54.0)
Oecetis 2, 9 13 (5.9) 11 (5.0) 1 (0.5)
Polycentripodidae Polycentropus 9 21 (35.9) 9 (146.9) 2 (1.5)
Rhyacophila 9 1 (20.8)
scraper Coleoptera Haliplidae Brychius 2 3 (4.5)
Helodidae 2 2 (5.5)
Gastropoda Planorbidae Mentus cooperi 2 6 (24.2)
Gyraulus 2 33 (165.9) 52 (101.3) 23 (41.1)
Planorbidae Helisoma 2 22 (633.8) 15 (1160.9) 32 (1853.7) 9 (107.8) 27 (193.4)
Physidae Physa 2 380 (1098.2) 263 (1050.1) 252 (638.0) 97 (239.4) 219 (625.2) 83 (333.4)
Valvatidae Valvata sincera helicoidea 2
23 (33.4) 8 (14.2) 30 (66.8) 8 (11.6) 3 (4.4) 1 (1.5)
Valvata sincera sincera 2 1 (1.5) 8 (27.1)
Lymnaeidae Lymnaea stagnalis 2 7 (492.2) 39 (1809.7) 10 (358.3) 8 (319.7) 25 (1177.1) 7 (407.5)
Stagnicola 2 3 (10.1) 3 (23.0) 1 (3.4) 8 (52.6) 15 (82.6)
shredder Coleoptera Curculionidae 2 17 (45.9) 15 (40.5) 1 (2.7) 4 (10.8) 3 (8.1)
Heliophoridae Helophorus 3 26 (71.5) 2 (5.5) 2 (5.5) 1 (2.8)
Chrysomelidae Neohaemeonia 16 1 (2.7) 1 (2.7)
Pyrrhalta 17 1 (2.7)
Diptera Tipulidae Prioncera 2, 18 12 (25.2) 3 (2.8) 35 (73.0)

Chapter 2: Aquatic invertebrates, fish and macrophytes
23
Feeding Group
Order FamilyGenus / Species
Ref* Round 1
Abun.(Bio.) Round 2
Abun.(Bio.) Round 3
Abun.(Bio.) Round 4
Abun.(Bio.) Round 5 Abun.(Bio.)
Round 6 Abun.(Bio.)
Tipula 2 1 (0.7) 2 (3.2) 4 (1.9)
Lepidoptera
2, 3 2 (14.0) 1 (7.0)
Trichoptera Limnephilidae Nemotaulius 9, 19 4 (0.8)
Limnephilus 2 57 (32.0) 48 (257.6) 9 (84.1) 25 (46.1) 576 (204.2) 43 (833.1)
Leptoceridae Nectopsyche 9 15 (6.8)
Triaenodes 20 1 (2.7) 168 (453.6) 106 (286.2) 14 (37.8) 4 (10.8)
* 1 - Clifford 1991; 2 - Barbour et al. 1999; 3 - Merritt and Cummins 1996; 4 - Resh 1976; 5 - Huryn and Gibbs 1999; 6 - Edmunds et al. 1976; 7 - Wissinger et al. 2004; 8 - Mihuc and Toetz 1994; 9 - Wiggins 1996; 10 - Berte and Pritchard 1983; 11 - Martin et al. 1981; 12 - Lillie 1991; 13 - Deding 1988; 14 - Shemanchuk 1972; 15 - Scudder 1987; 16 - Askevold 1987; 17 - Juliano 1988; 18 - Lantsov 1984; 19 - Pritchard and Berte 1987; 20 - Tindall 1960; 21 - Wiggins and Parker 1997.

Chapter 3 Dietary and stable isotope analysis indicates Bufflehead
(Bucephala albeola) duckling’s reliance on larval Dytiscidae within the Western Boreal Forest 2
Introduction
Duckling survival is one of the most important factor determining waterfowl population
dynamics (Dzubin & Gollop 1972, Hoekman et al. 2002) and foraging is a critical component of
this survival (Street 1977, Reinecke & Owen 1980, Cox et al. 1998, Sjöberg et al. 2000).
Duckling mortality has been shown to be the key factor that determines autumn populations (Hill
1984). Ducks rely almost exclusively on aquatic invertebrates as a protein source for growth,
development, and survival during the first month of life (Driver 1981, Sedinger 1992, Pelayo &
Clark 2003). Ducklings with higher nutrient reserves and efficient foraging strategies are better
equipped to avoid weather-caused mortality (Talent, Krapu & Jarvis 1983, Gendron & Clark
2002) and predation (Mauser, Jarvis & Gilmer 1994, Nummi, Sjöberg & Pöysä 2000).
The western boreal forest (WBF; residing on the boreal plain) is an important area for
breeding waterfowl, housing an estimated 9.7 ± 0.4 million ducks, approximately 26% of North
America’s waterfowl (Canadian Wildlife Service Waterfowl Committee 2001). The WBF in
northern Alberta is very important habitat for Bufflehead (Bucephala albeola Linnaeus); wetlands
there provide rearing habitat for the greatest proportion of their population (Erskine 1972).
Between 1990 and 2003 Bufflehead numbers have had a significant negative trend, decreasing by
5.8% per year (Canadian Wildlife Service Waterfowl Committee 2003). With increased
development on this landscape, managers will have to decide which wetlands are most important
to sustain breeding waterfowl numbers. Exactly which groups of invertebrates Bufflehead
ducklings prefer and utilize is important as this information can be useful in the delineation and
enhancement of waterfowl habitat quality (Schroder 1973).
Bufflehead ducklings feed at the water’s surface during the first few days after hatch or
during periods of heavy invertebrate emergence, but in later developmental stages ducklings rely
on diving to capture prey (Bellrose 1978). It stands to reason that large-bodied, conspicuous
2 A version of this paper has been submitted to the journal Functional Ecology. Corresponding styles and
format apply to citations, figures and tables.
Chapter 3: The diet of Bufflehead ducklings
25
invertebrates comprise a large portion of the diet for this visually oriented predator. Erskine
(1972) reported on Bufflehead diets from Alberta and neighbouring British Columbia where
Coleopterans (larvae and adults) represented the highest percent volume of all food ingested.
Along with Odonata and Corixidae, large-bodied, nektonic invertebrate groups represented 69
percent by volume of all food. While this and other studies of Bufflehead duckling diets (Dixon
1926, Munro 1949) have contributed to our understanding of this species and its management, I
found no papers that compare dietary constituents to that which is available. Without information
on the availability of invertebrate prey items the importance of abundant and readily available
invertebrates may be overemphasised while those invertebrates that are available at low densities,
yet present at moderate proportions in the diet, could be underemphasised or vice versa (Krapu &
Reineke 1992).
The objective of this study was to compare invertebrates ingested by Buffleheads to
measurements of the invertebrate community available to them on WBF ponds. I tested if
Bufflehead ducklings demonstrate a preference for a particular family of aquatic invertebrates, in
relation to their availability. I also used stable isotope analysis (SIA) to provide a time-integrated
estimator of trophic position and, by extension, dietary selection of Bufflehead ducklings.
Materials and Methods
Study Area
This study is one aspect of the Hydrology, Ecology, and Disturbance (HEAD) research
project initiated at the universities of Alberta and Waterloo. In 1999, this multi-disciplinary
group chose 24 wetlands 20 kilometres north of Utikuma Lake, Alberta, Canada, (56° 00’ - 56°
20’ N, and 115° 20’ - 115° 40’ W; Figure 1.1 – Utikuma Study Site) within the Mid-Boreal
Upland Ecoregion of the WBF. The WBF comprises approximately 85% of the boreal forest
natural region in Alberta, Canada (greater than 293,000 km2; Thomas 1998), and represents more
than 50% of the mixedwood section of Canada’s Boreal Forest Region (Rowe 1972) stretching
from north western Ontario to the Yukon. All wetlands were classified as eutrophic (S. Bayley
unpublished data) with total phosphorus levels >25 mg per litre (Wetzel 1983), occurred on low-
relief, poorly drained sedimentary tills (Prepas et al. 2001), and all were associated with
established peat beds, allowing the additional classification of peatland according to Vitt et al.
(1998).
Chapter 3: The diet of Bufflehead ducklings
26
Bufflehead Samples
During the summers of 2001 and 2002, I used a shotgun to collect class II (Gollop &
Marshall 1954) Bufflehead ducklings from wetlands within the WBF under Canadian Wildlife
Service Permit (WSA-8-01) and under approval of the University of Alberta’s Animal Care and
Use Committee (Protocol #2001-36B). When more than one individual was taken from a brood
their results were combined to produce one sample. Immediately after collection, each ducklings’
proventriculus and oesophagus (hereafter proventriculus), and gizzard (ventriculus) was removed
and their contents preserved separately in 70% ethanol/3% formalin. Wetland samples of aquatic
invertebrates were taken by vertically sweeping a dip net at the duckling’s feeding location,
observed before shooting, and at two random locations along the wetland shore. At all three
locations I sampled the open water, emergent cover, and the peat/water interface with vertical net
sweeps, ensuring to submerge the dip net into the flocculent detritus approximately 5 cm before
raising it vertically. Live invertebrates were chilled, sorted from plant matter within 12 hours,
preserved in 70% ethanol/3% formalin solution, and later identified to the taxonomic resolution
of species or genus. During identification each invertebrate was assigned a small/medium/large
size class, based on size guilds within each taxonomic grouping (usually family or genus).
Estimates of biomass for each size class were obtained by calculating means of approximately 30
dried individuals.
Invertebrates in wetland samples were collected for stable isotope analysis and allowed to
void their gut contents before freezing. I collected representatives of both the aquatic invertebrate
primary consumers (Lymanalidae, Heliosoma, Chironomidae, Ephemeroptera, Amphipoda) and
secondary consumers (larval Dytiscidae, adult Dytiscidae, Anisoptera, Zygoptera) at each
wetland (trophic classification via Barbour et al. 1999). Invertebrate stable isotope samples and
duckling livers were frozen, freeze dried, pulverized, packed into tin cups and CO2 and N2 gases
analysed with a VG Optima triple collector isotope-ratio mass-spectrometer via open split at the
National Water Research Institute in Saskatoon, Saskatchewan, Canada. I expressed stable
isotope ratios in delta (δ) notation, defined as the parts per thousand (‰) deviation from a
standard material (δ13C or δ15N = [(Rsample/Rstandard) - 1] x 1000) where R was the ratio of 13C to 12C
or 15N to 14N. Standards for carbon and nitrogen were Pee Dee belemnite and atmospheric
nitrogen, respectively.
Chapter 3: The diet of Bufflehead ducklings
27
Statistical Analysis
The proportion each invertebrate group contributed to the dietary biomass of each duckling
was averaged across all ducklings to produce an invertebrate group’s mean dietary proportion
(Table 3.1). I measured duckling foraging selectivity by calculating the proportion each
invertebrate group represented of the total ingested biomass (%Bduckling; as above) and subtracting
the proportion that specific prey group represented in the corresponding wetland dip sample
(%Bwetland). This number was a positive value if the prey group was selected by the duckling more
frequently than it was represented in the wetland (Figure 3.1).
Proportion data were arcsine transformed and tested for normality with a Shapiro-Wilk test.
Wilcoxon - Signed Ranks test was used to test if the observed mean of the invertebrate group’s
relationship with duckling stomach contents (%B duckling - %B wetland over all duckling ponds;
Figure 3.1) were significantly above or below zero. Following Reinecke & Owen, only those
ducklings that contained more than four discernible invertebrates were considered in the analysis
(1980). Duckling oesophagus/proventriculus contained low invertebrate species richness,
probably due to rapid food passage, and few ducklings had more than four invertebrates;
therefore, only the combined (oesophagus/proventriculus/gizzards; hereafter stomach) measure
was used in the selectivity analysis. Indeed, Danell & Sjöberg (1980) found that ducklings,
unlike adult ducks, show little difference in dietary constituents between the gizzard and the
proventriculus, due to the small grit size found in the gizzard. An invertebrate group had to occur
in the diets of at least three ducklings (corresponding to > 23% of total duckling diets) to be
counted as the absence of a particular invertebrate from the stomach may indicate unavailability
as opposed to avoidance. ANOVA was used to assess variation in mean SIA values among the
duckling, primary, and secondary consumer groups, followed by a multiple comparison Tukey
HSD test.
Results
A total of 13 broods were sampled (1 duckling from 11 broods, 2 ducklings from 2 broods)
for dietary invertebrates. Invertebrate identification of duckling stomach contents yielded 14
groups of aquatic invertebrates (Table 3.1). Our Wilcoxon Signed Ranks test indicated a
significant preference in Bufflehead ducklings for larval Dytiscidae (Order: Coleoptera), larval
Zygoptera (Order: Odonata), and adult Coleoptera not including Dytiscidae (hereafter simply
adult Coleopterans) (Figure 3.1).

Chapter 3: The diet of Bufflehead ducklings
28
Ducklings were more enriched in δ15N than their prey (F2, 55 = 32.870; P < 0.0001).
Secondary consumers such as dytiscids were also enriched over primary consumers as all three
groups were significantly different from each other (Tukey HSD, P < 0.001). The δ13C values
between the three groups were not significantly different (F2, 55 = 3.83; P = 0.712). The trophic
shift in nitrogen isotope ratios between primary consumers and secondary consumers (∆δ15N) was
+2.4 ‰, while the shift between secondary consumers and ducklings was +1.5 ‰. The average
∆δ15N up one trophic level in aquatic environments is +2.3 ± 0.28 ‰ (McCutchan et al. 2003).
Discussion
Interpreting dietary preference requires measurement of both the ingested items and the
availability of those items. Krapu & Reineke (1992) warned that estimating waterfowl food
availability is difficult because commonly employed sampling methods inadequately describe this
complex variable. When relating diet constituents to food availability with other duckling
species, some authors have derived invertebrate measures by using insect traps that only capture
free-swimming or emerging aquatic invertebrates (Street 1977), while others were unable to
coordinate the timing of invertebrate surveys to coincide exactly with diet sampling periods
(Nummi 1993), or in some cases, invertebrates were not sampled at all (Hohman 1985). I
attempted to sample all common pond microhabitats, from benthic to surface, obtained by
scraping vegetation with nets at observed foraging positions.
Bufflehead ducklings’ foraging strategies include diving and visually searching for
invertebrates from the nekton of wetlands as well as surface feeding (Erskine 1972). Larval
dytiscids, preferred here (Figure 3.1), are large-bodied (2 - 6 cm) invertebrates that make frequent
trips between nektonic hunting sites and the water’s surface to respire. Zygoptera larvae can also
be quite conspicuous, especially when they migrate to the shore to metamorphise. Non-dytiscid
Coleoptera (mainly of the genus Haliplus) are also active in the nekton, maintaining an air bubble
under the elytra that needs to be replenished with trips to the water’s surface. The active,
conspicuous behaviour of the above mentioned invertebrates may explain why Bufflehead
ducklings selected for them (Figure 3.1). In addition, optimum foraging theory (MacArthur &
Pianka 1966) corroborates our prediction that the relatively large size of larval dytiscids (high
calorific content per individual) makes them a valuable prey item.
Adult dytiscids were also an important prey item for ducklings here, representing a major
portion of ingested biomass (17%), yet they were neither preferred nor avoided (Table 3.1).
These invertebrates are active free-swimmers, highly visible in the nekton making them likely
Chapter 3: The diet of Bufflehead ducklings
29
candidates for dietary preference. They may not have been preferred because of their large size
(MacArthur & Pianka 1966; D. alaskanus = 25mm), robust hard shell, and anti-predatory steroid
defence (Scrimshaw & Kerfoot 1987), which all serve to increase the handling time required for
their ingestion. I note that without data on their availability they almost certainly would have
been interpreted as a highly selected food item (sensu Erskine 1972). Furthermore, this may
point to other important criteria of Bufflehead-selected items; both Zygoptera and larval
Dytiscidae have soft, un-sclerotized bodies potentially facilitating handling or digestion.
The analysis of duckling stomach contents in relation to available food provides only a
snapshot estimate of the trophic interactions important to ducklings. Bufflehead ducklings are
highly mobile feeders that search for optimum prey concentrations (Kaminski & Prince 1981)
adapting their diet over their range (Dixon 1926, Munro 1949 and as they age (Erskine 1972,
Stott & Olson 1973, Thompson & Ankey 2002). SIA provides a time-integrated measure of a
duckling’s diet (Gannes, O’Brien & Martinez del Rio 1997, Hebert & Wassenaar 2001). The
recorded trophic shift in nitrogen isotope ratios establishes that these ducklings predominantly
selected predatory invertebrates. Very little of their diet originates at the primary consumer
trophic level, as corroborated by our dietary analysis; 83% of the invertebrate biomass Bufflehead
ducklings ingest are secondary consumers. I suggest that the reason there is a ∆δ15N of 1.5‰
between the secondary consumers and ducklings, and not the average 2.3‰ in aquatic habitats
(McCutchan et al. 2003), is because of the contribution of a limited amount of primary consumer
prey and isotopically depleted plant material in the diet (Jones et al. 2004). Conversely, because
the ∆δ15N between primary producers and ducklings is greater than 2.3 ‰, ducklings must be
ingesting predatory invertebrates (secondary consumers) to elevate their average δ15N values.
Future studies of duckling foraging should incorporate theoretical considerations by testing
concepts like the marginal value theorem of optimal foraging theory (Charnov 1976), with much
more detailed data on the availability of invertebrates. Other waterfowl studies have found that
waterfowl adhere to other optimal foraging assumptions, like patch feeding times (Tome 1989)
and area-restricted searches (Wood 1985). Krapu & Reinecke (1992) assert that estimates of
abundance of all food items for all microhabitats or patches are essential, and the profitability of
prey items ranked. While I precisely sampled invertebrates in duckling feeding areas and used
biomass estimates of diet items to more closely link calorific profitability, I feel even more
detailed work can be conducted in this area of research through empirical modelling of prey
switching behaviour under varied prey concentrations in concert with optimal foraging theory
Chapter 3: The diet of Bufflehead ducklings
30
considerations to isolate the benefits of specific wetland environmental characteristics and
invertebrate compositions.
The WBF in northern Alberta is rapidly being developed by the energy and forestry sectors
(Schindler 1998). This area is very important to the North American population of Bufflehead as
it houses the highest density and largest proportion of breeding pairs (Canadian Wildlife Service
Waterfowl Committee 2001). Ecologists are currently working with industry in the WBF to
minimise the anthropogenic impacts; the results found here can be implemented where
Bufflehead conservation is a consideration by equating the relative abundance of those preferred
invertebrate groups with favourable Bufflehead habitat. Clear water and relatively shallow
wetlands are ideal for diving beetles because they are visually oriented and obligated to respire at
the surface (Lundkvist 2003). The analysis of ingested items as related to available invertebrate
resources, and stable isotope analysis allowed us to extend the foraging results over time and
remove some speculation on dietary items important for Bufflehead ducklings, previously
emphasizing only Zygoptera and Coleoptera (Erskine 1972). Our analysis confirms that larval
predaceous diving beetles are preferred, comprising almost half of the ingested biomass for these
ducklings. Larval Dytiscidae play an indispensable role in the diets of Bufflehead ducklings
within the WBF. Clear water wetlands with abundant Dytiscid beetles should be set aside or the
upland surrounding these wetlands protected from clear-cutting if Bufflehead populations are a
conservation priority.
Literature Cited
Barbour, M.T., Gerritsen, J., Snyder, B.D. & Stribling, J.B. (1999) Rapid Bioassessment Protocols for use in Streams and Wadeable rivers: Periphyton, Benthic Macroinvertebrates and Fish. Second Edition. EPA 841-B-99-002. U.S. Environmental Protection Agency; Office of water: Washington, D.C.
Bellrose, F.C. (1978) Ducks, Geese and Swans of North America. Stackpole Books, Harrisburg, Pennsylvania, USA.
Canadian Wildlife Service Waterfowl Committee (2001) Population Status of Migratory Game Birds in Canada: November 2001. CWS Migratory Birds Regular Report No. 4.
Canadian Wildlife Service Waterfowl Committee (2003) Population Status of Migratory Game Birds in Canada: November 2003. CWS Migratory Birds Regular Report No. 10.
Charnov, E.L. (1976) Optimal foraging, the marginal value theorem. Theoretical Population Biology 9, 129-136.
Cox, R.R., Hanson, M.A., Roy, C.C., Euliss, N.H., Johnson, D.H. & Butler, M.G. (1998) Mallard duckling growth and survival in relation to aquatic invertebrates. Journal of Wildlife Management 62, 124-133.
Chapter 3: The diet of Bufflehead ducklings
31
Danell, K. & Sjöberg, K. (1980) Foods of wigeon, teal, mallard and pintail during the summer in a northern Swedish Lake. Viltrevy 11, 139-167.
Dixon, J. (1926) The Bufflehead breeds in California. Condor 28, 47-48.
Driver, E.A. (1981) Caloric values of pond invertebrates eaten by ducks. Freshwater Biology 11, 579-581.
Dzubin A., & Gollop, J.P. (1972) Aspects of mallard breeding ecology in Canadian parkland and grassland. Population ecology of migratory birds. (US Department of the Interior) pp. 113-152. Wildlife Resources Report No. 2.
Erskine, A.J. (1972) Buffleheads. Canadian Wildlife Service Monograph Series - Number 4. Department of the Environment, Canada.
Gannes, L.Z., O’Brien, D.M., & Martinez del Rio, C. (1997) Stable isotopes in animal ecology: assumptions, caveats, and a call for more laboratory experiments. Ecology 78, 1271-1276.
Gendron, M. & Clark, R.G. (2002) Survival of gadwall and mallard ducklings in southcentral Saskatchewan. Journal of Wildlife Management 66, 170-180.
Gollop, J.B. & Marshall, W.H. (1954) A guide for aging duck broods in the field. Flyway Council Technical Section.
Hebert, C.E. & Wassenaar, L.I. (2001) Stable nitrogen isotopes in waterfowl feathers reflect agricultural land use in Western Canada. Environmental Science and Technology 35, 3482 - 3487.
Hill, D.A. (1984) Population regulation in the mallard (Anas platyrhynchos). Journal of Animal Ecology 53, 191-202.
Hoekman, S.T., Mills, L.S., Howerter, D.W., Devries, J.H., & Ball, I.J. (2002) Sensitivity analysis of the life cycle of midcontinent mallards. Journal of Wildlife Management 66, 883-900.
Hohman, W.L. (1985) Feeding ecology of Ring-necked Ducks in northwestern Minnesota. Journal of Wildlife Management 49, 546-557.
Johnson, D.H., Sargeant, A.B., & Greenwood, R.J. (1989) Importance of individual species of predators on nesting success of ducks in the Canadian Prairie Pothole region. Canadian Journal of Zoology 67, 291-297.
Jones, R.I., King, L., Dent, M.M., Maberly, S.C. & Gibson, C.E. (2004) Nitrogen stable isotope ratios in surface sediments, epilithon and macrophytes from upland lakes with differing nutrient status. Freshwater Biology 49, 382.
Kaminski, R.H. & Price, H.H. (1981) Dabbling duck and aquatic macroinvertebrate responses to manipulated wetland habitat. Journal of Wildlife Management 45, 1-15.
Krapu, G.L., & Reinecke, K.J. (1992) Foraging ecology and nutrition. The ecology and management of breeding waterfowl. (eds. Batt, B.D.J., Afton, A.D., Anderson, M.G., Ankney, C.D., Johnson, D.H., Kadlec, J.A. & Krapu, G.L.) pp. 1-29. University of Minnesota Press, Minneapolis, USA.
Lundkvist, E.A. (2003) Diversity of wetlands for a diversity of diving beetles (Coleoptera: Dytiscidae). Entomologisk Tidskrift 124, 213-217.
Chapter 3: The diet of Bufflehead ducklings
32
MacArthur, R.H. & Pianka, E.R. (1966) On optimal use of a patchy environment. American Naturalist 100, 603-609.
Mauser, D.M., Jarvis, R.L., & Gilmer, D.S. (1994) Survival of radio-marked mallard ducklings in northeastern California. Journal of Wildlife Management 58, 82-87.
McCutchan, J.H. Jr., Lewis, W.M. Jr., Kendall, C., & McGrath, C.C. (2003). Variation in trophic shift for stable isotope ratios of carbon, nitrogen and sulphur. Oikos 102, 378-390.
Munro, J.A. (1949) The birds and mammals of the Vanderhoof region, British Columbia. American Midland Naturalist 41, 1-138.
Nummi, P. (1993) Food-niche relationships of sympatric mallards and green-winged teals. Canadian Journal of Zoology 71, 49-55.
Nummi, P., Sjöberg, K. & Pöysä, H. (2000) Individual foraging behaviour indicates resource limitation: an experiment with mallard ducklings. Canadian Journal of Zoology 78, 1891-1895.
Pelayo, J.T. & Clark, R.G. (2003) Consequences of egg size for offspring survival: a cross-fostering experiment in ruddy ducks (Oxyura jamaicensis). The Auk 120, 384-393.
Prepas, E.E., Pinel-Alloul, B., Planas, D., Méthot, G., Paquet, S., & Reedyk, S. (2001) Forest harvest impacts on water quality and aquatic biota on the Boreal Plain: introduction to the TROLS lake program. Canadian Journal of Fisheries and Aquatic Sciences 58, 421–436.
Reinecke, K.J., & Owen, R.B. Jr., (1980) Food use and nutrition of Black Ducks nesting in Maine. Journal of Wildlife Management 44, 549-558.
Rowe, J.S. (1972) Forest Regions of Canada. Canadian Forest Service Publication, No. 1300.
Schindler, D.W. (1998) Sustaining aquatic ecosystems in Boreal regions. Conservation Ecology 2, 18-25.
Schroder, L.D. (1973) A Literature Review on the Role of Invertebrates in Waterfowl Management. Colorado Division of Wildlife Special Report 29, USA.
Scrimshaw, S. & Kerfoot, W.C. (1987) Chemical defences of freshwater organisms: beetles and bugs. Predation-Direct and Indirect Impacts on Aquatic Communities. (eds. Kerfoot, W.C. & Sih, A.) pp. 240-262. University Press of New England, Hanover, New Hampshire.
Sedinger, J.S., (1992) Ecology of prefledging waterfowl. Ecology and management of breeding waterfowl. (eds. Batt, B.D.J., Afton, A.D., Anderson, M.G., Ankney, C.D., Johnson, D.H., Kadlec, J. A. & Krapu, G.L.) pp. 109-127. University of Minnesota Press, Minneapolis, Minnesota, USA.
Sjöberg, K., Pöysä, H., Elmberg, J. & Nummi, P. (2000) Response of mallard ducklings to variation in habitat quality: An experiment of food limitation. Ecology 81, 329 - 335.
Stott, R.S. & Olson, D.P. (1973) Food-habitat relationship of sea ducks on the New Hampshire coastline. Ecology 54, 966-1007.
Street, M. (1977) The food of mallard ducklings in a wet gravel quarry, and its relation to duckling survival. Wildfowl 28, 113-125.
Talent, L.G., Krapu, G.L., & Jarvis, R.L. (1983) Habitat use by mallard broods in south central North Dakota. Journal of Wildlife Management 46, 629-635.

Chapter 3: The diet of Bufflehead ducklings
33
Thomas, R. (1998) The Boreal Forest Region of Alberta. Alberta Environment Protection, Edmonton, Alberta, Canada.
Thompson, J.E., & Ankney, C.D. (2002) Role of food in territoriality and egg production of Buffleheads (Bucephala albeola) and Barrow’s Goldeneyes (Bucephala islandica). The Auk 119, 1075-1090.
Tome, M.W. (1989) Search-path characteristics of foraging Ruddy ducks. The Auk 106, 42-48.
Vitt, D.H., Halsey L.A., Thormann, M.N., & Martin, T. (1998) Peatland Inventory of Alberta, Phase 1: Overview of Peatland Resources in the Natural Regions and Subregions of the Province (Prepared for the Alberta Peat Task Force) University of Alberta, Edmonton, Alberta, Canada.
Wetzel, R.G. (1983) Limnology. 2nd edition. Saunders College Publishing, Philadelphia.
Wood, C.C. (1985) Food-searching behaviour of the Common Merganser, Mergus merganser, II: choice of foraging location. Canadian Journal of Zoology 63, 1271-1279.
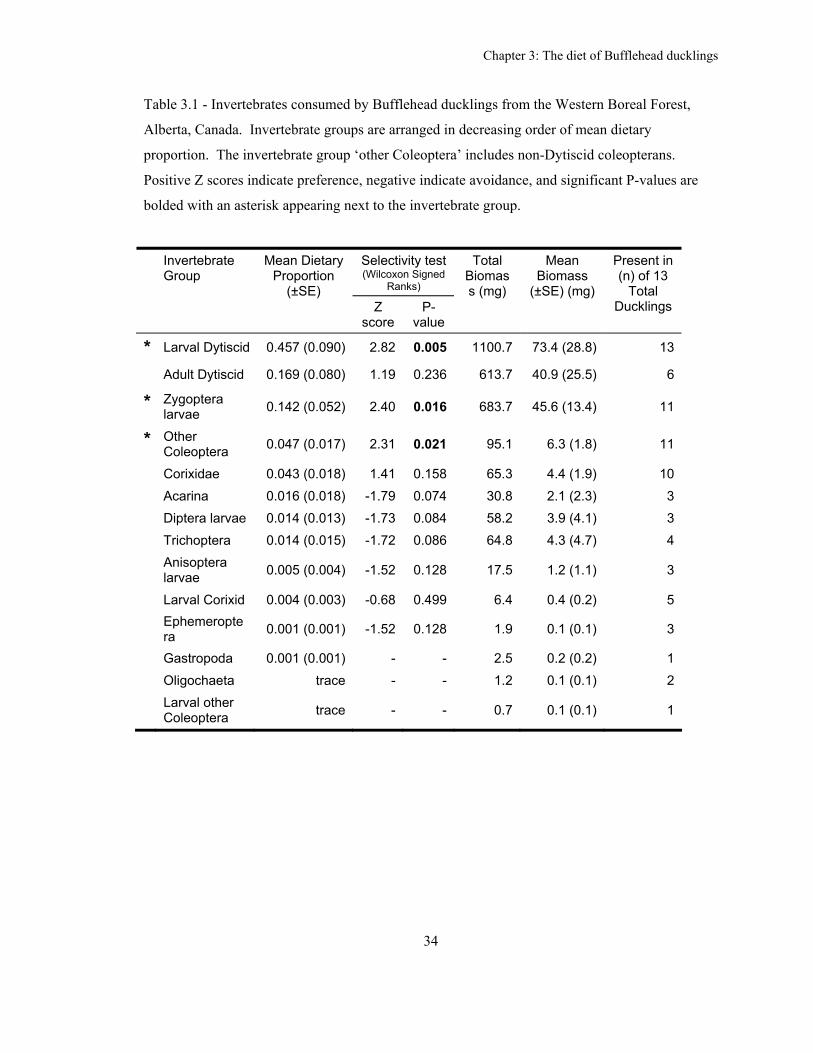
Chapter 3: The diet of Bufflehead ducklings
34
Table 3.1 - Invertebrates consumed by Bufflehead ducklings from the Western Boreal Forest,
Alberta, Canada. Invertebrate groups are arranged in decreasing order of mean dietary
proportion. The invertebrate group ‘other Coleoptera’ includes non-Dytiscid coleopterans.
Positive Z scores indicate preference, negative indicate avoidance, and significant P-values are
bolded with an asterisk appearing next to the invertebrate group.
Selectivity test (Wilcoxon Signed
Ranks)
Invertebrate Group
Mean Dietary Proportion
(±SE) Z
score P-
value
Total Biomass (mg)
Mean Biomass
(±SE) (mg)
Present in (n) of 13
Total Ducklings
* Larval Dytiscid 0.457 (0.090) 2.82 0.005 1100.7 73.4 (28.8) 13
Adult Dytiscid 0.169 (0.080) 1.19 0.236 613.7 40.9 (25.5) 6
* Zygoptera larvae 0.142 (0.052) 2.40 0.016 683.7 45.6 (13.4) 11
* Other Coleoptera 0.047 (0.017) 2.31 0.021 95.1 6.3 (1.8) 11
Corixidae 0.043 (0.018) 1.41 0.158 65.3 4.4 (1.9) 10 Acarina 0.016 (0.018) -1.79 0.074 30.8 2.1 (2.3) 3 Diptera larvae 0.014 (0.013) -1.73 0.084 58.2 3.9 (4.1) 3 Trichoptera 0.014 (0.015) -1.72 0.086 64.8 4.3 (4.7) 4 Anisoptera
larvae 0.005 (0.004) -1.52 0.128 17.5 1.2 (1.1) 3
Larval Corixid 0.004 (0.003) -0.68 0.499 6.4 0.4 (0.2) 5 Ephemeropte
ra 0.001 (0.001) -1.52 0.128 1.9 0.1 (0.1) 3
Gastropoda 0.001 (0.001) - - 2.5 0.2 (0.2) 1 Oligochaeta trace - - 1.2 0.1 (0.1) 2 Larval other
Coleoptera trace - - 0.7 0.1 (0.1) 1

Chapter 3: The diet of Bufflehead ducklings
Figure 3.1 - Dietary preference by Bufflehead ducklings. Preferred invertebrate groups are
positive values, avoided groups are negative. Significant difference above (prefence) or below
(avoidance) zero is indicated by * (p < 0.05; Wilcoxon Signed Ranks test).
-60
-40
-20
0
20
40
60
Larval Dytiscid Beetle
Zygoptera
Adult Dytiscid Beetle
Other Coleoptera
Corixidae
Acarina
Diptera
Larval Corixidae
Ephemeroptera
Anisoptera
Trichoptera
Error Bars = +/- 1 Standard Error
% In
gest
ed -
% A
vaila
ble
(%B d
uckl
ing
-%B
wet
land
)
*
*
*
-60
-40
-20
0
20
40
60
Larval Dytiscid Beetle
Zygoptera
Adult Dytiscid Beetle
Other Coleoptera
Corixidae
Acarina
Diptera
Larval Corixidae
Ephemeroptera
Anisoptera
Trichoptera
Error Bars = +/- 1 Standard Error
% In
gest
ed -
% A
vaila
ble
(%B d
uckl
ing
-%B
wet
land
)
*
*
*
35

Chapter 3: The diet of Bufflehead ducklings
36
Figure 3.2 - Aquatic food web isotope values for Bufflehead ducklings and invertebrates collected from feeding wetlands. Values on the
right are grouped by trophic level. Values in parenthesis indicate the number of samples for that group while error bars equal ± 1 Standard
Error. Primary consumers are denoted by diamonds, secondary consumers by triangles, and ducklings by circles.
0
2
4
6
8
10
12
-35 -30 -25 -20 -15
Ephemeroptera (1)
Chironomidae (2) Lymanalidae (12)
Amphipoda (1)
Heliosoma (2)Zygoptera (2)
larval Dytiscidae (10)Anisoptera (5)
Bufflehead liver (15)
adult Dytiscidae (3)
δ15 N
δ13C
0
2
4
6
8
10
12
-35 -30 -25 -20 -15
Ephemeroptera (1)
Chironomidae (2) Lymanalidae (12)
Amphipoda (1)
Heliosoma (2)Zygoptera (2)
larval Dytiscidae (10)Anisoptera (5)
Bufflehead liver (15)
adult Dytiscidae (3)
0
2
4
6
8
10
12
-35 -30 -25 -20 -15
Ephemeroptera (1)
Chironomidae (2) Lymanalidae (12)
Amphipoda (1)
Heliosoma (2)Zygoptera (2)
larval Dytiscidae (10)Anisoptera (5)
Bufflehead liver (15)
adult Dytiscidae (3)
δ15 N
δ13C
-35 -30 -25 -20 -15
Primary Consumers (n = 18)
Secondary Consumers (n = 20)
Duckling Livers (n = 15)
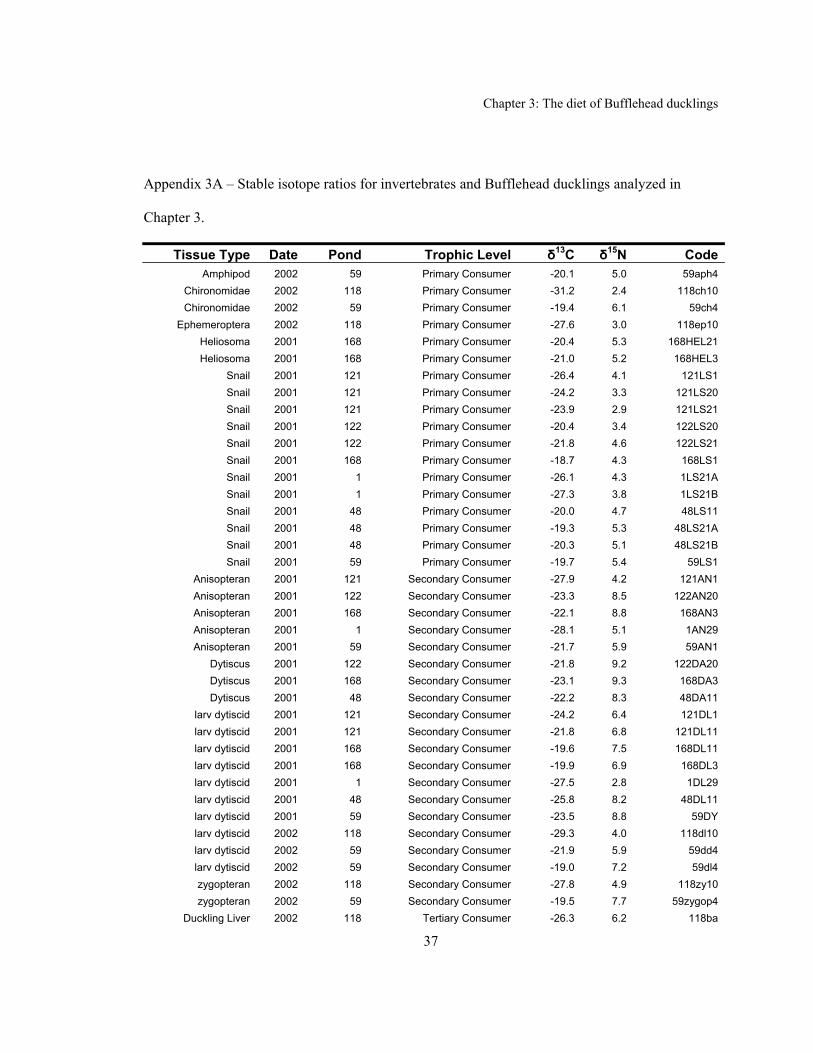
Chapter 3: The diet of Bufflehead ducklings
37
Appendix 3A – Stable isotope ratios for invertebrates and Bufflehead ducklings analyzed in
Chapter 3.
Tissue Type Date Pond Trophic Level δ13C δ15N CodeAmphipod 2002 59 Primary Consumer -20.1 5.0 59aph4
Chironomidae 2002 118 Primary Consumer -31.2 2.4 118ch10 Chironomidae 2002 59 Primary Consumer -19.4 6.1 59ch4
Ephemeroptera 2002 118 Primary Consumer -27.6 3.0 118ep10 Heliosoma 2001 168 Primary Consumer -20.4 5.3 168HEL21 Heliosoma 2001 168 Primary Consumer -21.0 5.2 168HEL3
Snail 2001 121 Primary Consumer -26.4 4.1 121LS1 Snail 2001 121 Primary Consumer -24.2 3.3 121LS20 Snail 2001 121 Primary Consumer -23.9 2.9 121LS21 Snail 2001 122 Primary Consumer -20.4 3.4 122LS20 Snail 2001 122 Primary Consumer -21.8 4.6 122LS21 Snail 2001 168 Primary Consumer -18.7 4.3 168LS1 Snail 2001 1 Primary Consumer -26.1 4.3 1LS21A Snail 2001 1 Primary Consumer -27.3 3.8 1LS21B Snail 2001 48 Primary Consumer -20.0 4.7 48LS11 Snail 2001 48 Primary Consumer -19.3 5.3 48LS21A Snail 2001 48 Primary Consumer -20.3 5.1 48LS21B Snail 2001 59 Primary Consumer -19.7 5.4 59LS1
Anisopteran 2001 121 Secondary Consumer -27.9 4.2 121AN1 Anisopteran 2001 122 Secondary Consumer -23.3 8.5 122AN20 Anisopteran 2001 168 Secondary Consumer -22.1 8.8 168AN3 Anisopteran 2001 1 Secondary Consumer -28.1 5.1 1AN29 Anisopteran 2001 59 Secondary Consumer -21.7 5.9 59AN1
Dytiscus 2001 122 Secondary Consumer -21.8 9.2 122DA20 Dytiscus 2001 168 Secondary Consumer -23.1 9.3 168DA3 Dytiscus 2001 48 Secondary Consumer -22.2 8.3 48DA11
larv dytiscid 2001 121 Secondary Consumer -24.2 6.4 121DL1 larv dytiscid 2001 121 Secondary Consumer -21.8 6.8 121DL11 larv dytiscid 2001 168 Secondary Consumer -19.6 7.5 168DL11 larv dytiscid 2001 168 Secondary Consumer -19.9 6.9 168DL3 larv dytiscid 2001 1 Secondary Consumer -27.5 2.8 1DL29 larv dytiscid 2001 48 Secondary Consumer -25.8 8.2 48DL11 larv dytiscid 2001 59 Secondary Consumer -23.5 8.8 59DY larv dytiscid 2002 118 Secondary Consumer -29.3 4.0 118dl10 larv dytiscid 2002 59 Secondary Consumer -21.9 5.9 59dd4 larv dytiscid 2002 59 Secondary Consumer -19.0 7.2 59dl4 zygopteran 2002 118 Secondary Consumer -27.8 4.9 118zy10 zygopteran 2002 59 Secondary Consumer -19.5 7.7 59zygop4
Duckling Liver 2002 118 Tertiary Consumer -26.3 6.2 118ba

Chapter 3: The diet of Bufflehead ducklings
38
Tissue Type Date Pond Trophic Level δ13C δ15N CodeDuckling Liver 2002 118 Tertiary Consumer -26.3 5.5 118bb Duckling Liver 2002 118 Tertiary Consumer -26.2 5.9 118bc Duckling Liver 2002 59 Tertiary Consumer -21.0 7.8 59ba Duckling Liver 2002 59 Tertiary Consumer -21.1 8.0 59bb Duckling Liver 2001 121 Tertiary Consumer -21.5 9.6 121BUFFA11 Duckling Liver 2001 121 Tertiary Consumer -21.6 9.4 121BUFFB11 Duckling Liver 2001 122 Tertiary Consumer -20.1 10.2 122BUFF20 Duckling Liver 2001 168 Tertiary Consumer -18.7 9.1 168BUFF11 Duckling Liver 2001 168 Tertiary Consumer -18.2 9.3 168BUFF17 Duckling Liver 2001 1 Tertiary Consumer -26.8 8.5 1BUFFA29 Duckling Liver 2001 1 Tertiary Consumer -26.9 7.9 1BUFFB29 Duckling Liver 2001 48 Tertiary Consumer -23.6 8.8 48BUFFA11 Duckling Liver 2001 48 Tertiary Consumer -23.3 8.5 48BUFFB11 Duckling Liver 2001 59 Tertiary Consumer -19.7 9.5 59BUFF
Leech 2001 121 Tertiary Consumer -27.0 11.0 121LE11 Leech 2001 168 Tertiary Consumer -21.3 8.4 168LE11 Leech 2001 1 Tertiary Consumer -29.5 6.2 1LE29 Leech 2001 48 Tertiary Consumer -23.6 7.5 48LE11 Leech 2001 59 Tertiary Consumer -24.1 9.0 59LE1

39
Chapter 4 Mallard duckling dietary analysis over three landscapes: niche
breadth and the importance of Coleoptera 3
Introduction
The sustainability of waterfowl populations depend on duckling survival and development,
and therefore the management and protection of wetlands that provide broods with sufficient
foraging opportunities. Duckling survival is one of the most important factors determining
waterfowl population dynamics (Dzubin and Gollop 1972; Johnson et al. 1989; Nummi et al.
2000, Hoekman et al. 2002). Efficient foraging on aquatic invertebrates results in an increased
chance of survival (Cox et al. 1998; Sjöberg et al. 2000; Robinson et al. 2003), resistance to
weather-caused mortality (Talent et al. 1983; Gendron and Clark 2002), and predation (Mauser et
al. 1994; Nummi et al. 2000). Accurate information on duckling food choices and the associated
environmental characteristics can aid in the management and conservation of wetlands along the
front of anthropogenic activities of the wetland rich landscapes of the western boreal forest
(WBF).
It is not clear which groups of invertebrates are preferred by Mallard ducklings. In the
Prairie Pothole Region (PPR), Chura (1961) found dipterans to be the most abundant aquatic
invertebrate in Mallard duckling diets. Although correlative, a theory relating duckling success to
dipteran abundance arose as a convenient and measurable metric of habitat quality, and was
adopted in subsequent studies across a broad geographical area (Danell and Sjöberg 1980;
Sjöberg and Dannell 1982; Pehrsson 1984; Dzus and Clark 1997; Ashley et al. 2000). Duckling
foraging studies in boreal regions indicated that large bodied macroinvertebrates were important.
In Sweden, Nummi (1993) found Mallard ducklings cued in on larger insects, and Elmberg et al.
(2000) related duckling density to dytiscid water beetle distribution. Researchers of Mallard
feeding habits found that ducklings forage preferentially where invertebrates tend to be the largest
near the shoreline (Perret 1962). Optimal foraging theory suggests that the handling time
3 A version of this paper has been submitted to The Canadian Journal of Zoology. Corresponding styles
and format apply to citations, figures and tables.

Chapter 4: The diet of Mallard ducklings
40
ducklings expend to include dipteran larvae in the diet requires many captures, resulting in a low
caloric reward relative to the larger bodied predaceous invertebrates (MacArthur and Pianka
1966).
Approximately two million Mallards breed within the WBF yet little is known about
waterfowl feeding ecology there; I feel the common practice of extrapolating results from
southern locales is questionable (Bellrose 1980; Austin et al. 2000; Canadian Wildlife Service
Waterfowl Committee 2003). Boreal wetlands play a vital role during the years the prairies
experience drought as breeding Mallards “overfly” these unsuitable or crowded prairie wetlands
to breed near more dependable, underutilized boreal habitats (Niemuth and Solberg 2003). I
compared the diets of Mallard ducklings from the WBF to diets from the prairie and parkland
ecoregions of the PPR to better understand Mallard food preferences and the relative importance
of the WBF. Investigating dietary selection can provide insight into the availability of preferred
resources, and by extension habitat quality. Optimal foraging theory states that a more productive
environment permits a higher degree of specialization in the diet (MacArthur and Pianka 1966).
Our objectives were to investigate Mallard duckling diets across three ecozones, comparing
resource selection and environmental characteristics to estimate habitat suitability. I investigated
the hypotheses that i) Mallard ducklings prefer large-bodied nektonic invertebrates as opposed to
small, benthic-dwelling chironomid larvae, ii) large-bodied nektonic invertebrates occur in
Mallard duckling diets in proportion to their availability, iii) ducklings select sites within the
wetland where invertebrate resources are the highest, and iv) ducklings in the more productive
prairie and parkland ecoregions will show a higher degree of dietary specialization.
Study Area and Methods
Duckling collection
I examined three study areas: the Mid-Boreal Upland Ecoregion of the WBF of northern
Alberta (56° 00’ – 56° 20’ N, and 115° 20’ – 115° 40’ W; Figure 1.1- Utikuma Study Site, boreal
plain), the Mixed Grassland Ecoregion of southern Alberta (50° 15’ – 50° 45’ N, and 111° 30’ –
112° 15’ W; Figure 1.1 – Prairie Study Site), and the Aspen Parkland Ecoregion of south eastern
Saskatchewan (50° 35’ – 50° 55’ N, and 102° 30’ – 103° 40’ W; Figure 1.1 – Parkland Study
Site). Only wetlands on which Mallard ducklings were observed feeding were used in this study.
Chapter 4: The diet of Mallard ducklings
41
Class IC to class III ducklings (Gollop and Marshall 1954) were collected using a shotgun under
Canadian Wildlife Service Permit (WSA-8-01) and under approval of the University of Alberta’s
Animal Care and Use Committee (2001-36B). Ducklings were shot during early morning
foraging bouts (within 3 hours of sunrise) and in the late afternoon (2 hours prior to sunset). Only
ducklings observed feeding were collected. When more than one individual was taken from a
brood their results were combined to produce one sample. Immediately after shooting, ducklings
were weighed, classified by developmental stage, the oesophagus/proventriculus and gizzard
(ventriculus) removed and their separate contents preserved in a 70% ethanol / 3% formalin
solution. I identified all invertebrates to the lowest possible taxonomic grouping and measured
either invertebrate length or head capsule size to ascertain biomass estimates for each individual
using power relationships from Smock (1980) and Benke et al. (1999). I ignored seeds and other
plant material.
Wetland Invertebrate and Vegetation Surveys
Invertebrate surveys of the sample wetlands consisted of two vertical sweeps of a standard
D-shaped aquatic dip net, starting with the net submerged 5 cm into the benthic material. Water
depth was recorded at each sweep site to calculate invertebrate occurrence on a per water-volume
basis. A benthic sample was taken by dragging the dip net along the pond bottom for 30 cm. A
surface sample was conducted by sweeping the water’s surface in two 1 meter sweeps with the
net opening ¾ submerged. Vertical, benthic and surface samples were taken at the duckling
feeding location, immediately after shooting (except in two cases in 2001), and at two additional
locations located 20 meters in either direction along the shoreline. Bottom slope was also
measured at each collection site. Two 1 m2 quadrats at each sampling location were established
to estimate the volumetric proportion inhabited by aquatic plants and emergent cover for
ducklings. Water depth (cm), submersed plant height (h; cm), and areal plant cover (A;
proportion of 1m2 quadrat) were used to estimate plant volume within the quadrat by using the
volumetric equation: A x h = plant volume (cm3). Finally, the total plant volume was divided by
the total water volume of each quadrat (10000 cm2 x quadrat water depth), to estimate the percent
volume of the quadrat occupied by plants. Terrestrial plant cover was determined by areal cover
alone, tabulating only the plants that exceeded 10 cm in height.
Chapter 4: The diet of Mallard ducklings
42
I used paired t-tests to test for differences in available prey biomass/L between feeding
sites and non-feeding sites at all wetlands. Sampling invertebrates with benthic, vertical, and
surface sweeps can result in varied invertebrate sample compositions; these were treated
separately in the analysis. Only those invertebrate groups identified as duckling food were
included so not to overemphasize the importance of invertebrate groups that were selected. I
tested for differences in the invertebrate prey biomass/L between landscapes using an analysis of
variance. I then repeated the above test after weighting each invertebrate group’s biomass/L in
the wetland sample by its proportional biomass in duckling diets so that an invertebrate group that
was high in biomass but relatively unimportant or unavailable to Mallard ducklings, such as
Amphipoda, did not bias the results. To compare slope, depth, cover, aquatic plant proportion,
and invertebrate biomass between feeding and non-feeding sampling locations I used paired t-
tests. When contrasting these environmental variables between landscapes I averaged values
from feeding and non-feeding sites and used Tukey’s HSD to compare individual differences;
reported P-values correspond to the nearest neighbour differences. All statistical methods follow
that which is outlined in Zar (1999).
Stable Isotope Analysis
To provide a secondary estimator of food habits, I analysed the stable isotopes of nitrogen
and carbon in duckling livers, invertebrate predators (Anisoptera, Corixidae, Dytiscidae,
Notonectidae, Tanypodinae, Zygoptera) and invertebrate grazers (Gammaridae, Chironomidae,
Cladocera, Ephemeroptera, Lymnaea stagnalis). Live invertebrates were allowed to void their
gut contents for 24 hours in distilled water then stored frozen to be freeze dried, crushed with a
mortar and pestle, and packed in tin capsules for isotopic analysis in the laboratory. CO2 and N2
gases were analysed with a VG Optima triple collector isotope-ratio mass-spectrometer via open
split. I expressed stable isotope ratios in delta (δ) notation, defined as the parts per thousand (‰)
deviation from a standard material (δ13C or δ15N = [(Rsample / Rstandard) – 1] x 1000) where R was
the ratio of 13C to 12C or 15N to 14N. Standards for carbon and nitrogen were Pee Dee belemnite
and atmospheric nitrogen, respectively. I tested for significant differences in δ15N and δ13C
between the invertebrate trophic groups and ducklings on each landscape with Tukeys HSD.
Bearhop et al. (2004) suggest using the variance in δ13C or δ15N as an indicator of dietary
niche breadth; a group of individuals that consume a broad spectrum of prey species will show

Chapter 4: The diet of Mallard ducklings
43
more isotopic variance than those which feed on a limited few prey species. I used Levene’s Test
to compare the variation in duckling liver δ13C and δ15N over the three landscapes, followed by a
Tukey’s HSD to delineate differences between the groups.
Dietary Analysis
Ducklings were included in the analysis if their diet contained over four discernible
invertebrates (Reinecke and Owen 1980), and invertebrate groups were included only if their
biomass comprised at least 5% of the (pooled across landscapes) duckling’s diet. Duckling
oesophagus/proventriculus contained low invertebrate species richness resulting in only few
ducklings meeting the above criteria, probably due to rapid food passage, therefore only the
combined (oesophagus/proventriculus/gizzards, hereafter stomach) measure was used in the
selectivity analysis. Danell and Sjöberg (1980) found that unlike adult ducks the mastication of
food items is not significant in the gizzard of ducklings due to the small grit size found there, and
most items could still be identified.
Data on consumption and availability of invertebrates were analyzed using Manley’s
selection ratios (ŵi - sampling protocol A, type III; Manly et al. 2002). Generally, these ratios are
proportional to the probability of that resource group being utilized (groups in Appendix A). A
log likelihood chi-square test was used to test the null hypothesis of no selection (ŵi equal to 1),
and Bonferroni confidence intervals were estimated to evaluate if each resource category was
significantly selected (ŵi >1), avoided (ŵi<1) (Manly et al. 2002).
Principle component analysis (PCA), a multivariate ordination technique, was used to
investigate dietary breadth shown by ducklings on the three landscapes. An invertebrate group
was included in the ordination if it was in the diet of over 5% of the ducklings. Presence/absence
data was used, the species matrix was checked for variable correlations above 0.70, intersample
correlations were preserved, and 95% confidence ellipses around the centriods were plotted for
sample scores (ducklings) grouped by landscape. An ordination biplot simultaneously displayed
multiple invertebrate variables and duckling scores in a two-dimensional representation, while it
maintained accurate depictions of relationships between them (McCune and Grace 2002). Pairs
of PCA duckling scores were positively correlated if they were plotted close to each other and
were dissimilar if plotted further from each other (Jongman et al. 1995). Invertebrate species
vectors were arranged to provide the greatest separation in duckling scores; if a vector points in

Chapter 4: The diet of Mallard ducklings
44
the direction of a 95% confidence ellipse that species was utilized more predominately by
ducklings on the landscape indicated by the ellipse.
Results
Fifty-nine duckling / wetland relationships were investigated in this study with 36 from the
boreal plain, 14 from the parkland, and 9 from the prairie. The invertebrate group that
contributed most to duckling diets were larval and adult Dytiscidae, amounting to 72% in the
boreal, 56% in the parkland and 26% in the prairie. When invertebrate consumption was
compared to availability, I found that Amphipoda and Gastropoda were avoided on all landscapes
(Table 1). Coleopterans, in aggregate, comprised the highest proportion of biomass in duckling
diets amounting to 80% in the boreal, 71% in the parkland, and 38% in the prairie. Surface
Hemiptera had the highest selection ratio (ŵi ) on those landscapes where it was ingested (Figure
4.1), however I questioned these results because surface Hemiptera are very good at avoiding net
capture and occurred in fewer than 5% of the available resource samples and have therefore been
disregarded (following Manly et al. 2002). Dipterans were avoided in parkland and prairie
landscapes and not selected for or against in the boreal habitat. Mallard ducklings demonstrated
significant preference for Coleoptera, Dytiscidae, Trichoptera, and larval Dytiscidae on boreal
wetlands, Dytiscidae and larval Dytiscidae on parkland wetlands, and Coleoptera and Corixidae
on prairie wetlands.
On all landscapes Mallard duckling livers were significantly enriched in their nitrogen
isotope ratios (δ15N) relative to their prey. Boreal ducklings averaged an enrichment of 2.6‰ in
δ15N over predaceous invertebrates (P< 0.001) and 3.7‰ over invertebrate grazers (P< 0.001)
while predaceous invertebrates were significantly different from grazers by 1.1‰ (P= 0.010).
There was no difference in δ13C between boreal groups. Parkland ducklings were significantly
enriched over predaceous invertebrates in nitrogen isotopes by 2.1‰ (P= 0.022), and invertebrate
grazers by 2.4‰ (P= 0.020), while the isotopic signatures between invertebrate predators and
grazers were not significantly different. Parkland δ13C was the same for ducklings and
invertebrates. Prairie δ15N values were significantly different between ducklings and predaceous
(2.3‰; P= 0.048) and grazing invertebrates. Although there was a large difference in the δ13C
means between prairie ducklings and invertebrate predators (2.7‰) and grazers (3.3‰), I
detected no significant difference.

Chapter 4: The diet of Mallard ducklings
45
The variability in duckling liver δ15N was significantly different across landscapes (F2,62 =
12.03; P< 0.001; Figure 4.5) with boreal ducklings showing significantly less variation in δ15N
(Tukey’s HSD; P< 0.001) than the other landscapes. The Levene’s Test of δ13C residuals were
also significant when considering the three landscape groups (F2,62 = 32.50; P= 0.001). Boreal
ducklings had significantly less variation in δ13C than ducklings from the other two study areas
(P< 0.006).
There was no difference in invertebrate biomass sampled at feeding and non-feeding sites
when considering benthic (P= 0.152), vertical (P= 0.390), or surface (P= 0.188) dip netting
techniques (Figure 4.2). The weighted invertebrate biomass/L was not significantly different
between landscapes (P= 0.337) although the total invertebrate biomass/L showed a significant
difference between boreal and prairie landscapes (Tukey HSD < 0.05; Figure 4.3). There was
more aquatic macrophyte volume at feeding sites in boreal wetlands (P= 0.036), less emergent
cover at feeding sites in prairie wetlands (P= 0.029), and a steeper bottom slope at non-feeding
sites in parkland wetlands (P= 0.046; Figure 4.4). The boreal wetlands sampled in this study had
less aquatic (P= 0.015; Tukey’s HSD) and emergent (P= 0.017) macrophyte cover per volume,
were deeper (P= 0.050), and their depth increased more rapidly away from the shoreline (P=
0.098).
The first two axes of the PCA ordination explained 62.6% of the variation (Figure 4.6).
The 95% confidence ellipse of boreal duckling scores was contained within the prairie and
parkland ellipses.
Discussion
Mallard Duckling Diets
Interpreting dietary preference requires measurement of ingested items and the availability
of those items. Krapu and Reineke (1992) warned that most studies of waterfowl feeding ecology
have inaccurate estimates of food availability. Other duckling foraging ecology studies have
surveyed the invertebrate community using insect traps that only capture free-swimming or
emerging aquatic invertebrates (Street 1977). To overcome these limitations I attempted to
sample all common pond microhabitats, using three dip-netting techniques immediately after

Chapter 4: The diet of Mallard ducklings
46
duckling collection, at observed foraging positions. Furthermore, I avoided biasing the
preference results by removing those invertebrates not included in duckling diets, presumably
inaccessible to ducklings, from the calculation of our foraging Manley’s section ratios.
Most studies of Mallard duckling diets designate dipteran larvae as the dominant food
source, suggesting a link between Mallard duckling success and chironomid abundance (Danell
and Sjöberg 1980; Sjöberg and Danell 1982; Talent et al. 1982; Batzer et al. 1993; Dzus and
Clark 1997; King and Wrubleski 1998; Ashley et al. 2000). Our data did not support this. I
found that Mallard ducklings either consume dipterans in proportion to their availability or avoid
them within the ecoregions studied here (Table 1). Chironomidae larvae can reach high densities
within the benthic zone of wetlands, especially in southern prairie wetlands where Chrua (1961)
first studied Mallard duckling diets (Nelson 1990). I suspected that benthic chironmids were not
ingested by many ducklings because those younger than class II prefer not to submerge their
nares and therefore do not employ a tip-up feeding strategy by which they can exploit the
benthos. This offers only a partial explanation, as 78% of all the ducklings examined were of
class IIA or older. Water depth may have prevented Chironomidae from being included in
duckling diets; observed feeding sites were deeper that 20cm on all landscapes thus making tip-up
feeding infeasible for ducklings that have a maximum reach of only 14cm (Sugden 1973,
Pehrsson 1979). Again, this does not fully explain the incongruity between our results and those
from the literature as 81% of the ingested Dipteran biomass found here were in pupae and
emergent forms, suggesting that surface feeding was preferred to tip-up feeding, even in older
ducklings.
A clear explanation for the emphasis prior research has placed on Chironomidae emerged
from our review of Mallard duckling dietary studies (Chura 1961; Perret 1962; Bengtson 1975;
Street 1977). I found that assumptions regarding preference were made by considering the
numerical abundance of dietary constituents, not the more biologically and energetically
meaningful measure of biomass.
Amphipoda was avoided on all landscapes. Again, I interpreted this as evidence that
ducklings did not forage in the benthic zones of the wetland, where Amphipoda take refuge
(Åbjörnsson et al. 2004). Mallard ducklings are described as tactile foragers (Sedinger 1992), but
the large size, random distribution, and free swimming behaviour of those preferred invertebrates
(Table 1) suggests a visually oriented, surface-foraging behaviour. This underscores the

Chapter 4: The diet of Mallard ducklings
47
importance of Coleoptera, and further the family Dytiscidae, in the diets of Mallard ducklings. In
boreal and parkland habitats the Dytiscidae group were significantly selected for and provided the
most dietary biomass. In prairie habitats non-dytiscid Coleoptera are preferred; this group along
with Dytiscidae, still comprise the bulk of the dietary biomass there. The only other invertebrate
groups preferred by Mallard ducklings were Trichoptera within the boreal and Corixidae within
the prairie.
I propose that measures of Coleoptera biomass (with emphasis on Dytiscidae) become the
new benchmark by which to assess Mallard duckling invertebrate resource availability, as
opposed to Chironomidae abundance. Similarly, Elmberg et al. (2000) have associated dabbling
duck distribution with Dytiscidae abundance on boreal wetlands in northern Europe. I also
acknowledge that because dytiscids are predaceous, they may have a dependence on the
abundance of chironomidae. This is consistent with our isotopic findings from boreal habitats.
Stable Isotope Analysis
The analysis of gastrointestinal contents to infer duckling preference for invertebrate
groups provides only a snapshot estimate of the trophic interactions important to ducklings.
Stable isotope analysis (SIA) helps to corroborate these results and fill the temporal gap as it
provides a time-integrated measure of a duckling’s diet (Gannes et al. 1997, Hebert and
Wassenaar 2001). Mallard ducklings are highly mobile feeders that search for optimial prey
concentrations (Kaminski and Prince 1981) and rapidly change food preferences throughout the
precocial period (Chura 1961). The trophic shift in nitrogen isotope ratios between ducklings and
predaceous invertebrates on all landscapes suggest that these invertebrates comprise a large
portion of their diets, although it is only with boreal samples that I can confidently separate
predaceous invertebrates from grazers with δ15N and therefore conclude that ducklings are relying
on predaceous invertebrates. I suspect the nitrogen isotope ratios from the prairie and parkland
landscapes have been elevated as a result of the application of agricultural fertilizer or manure to
uplands adjacent to the study wetlands (Hebert and Wassenaar 2001). Bearhop et al. (2004)
suggest that the variation in δ 13C and δ15N within a group can indicate the breadth of the dietary
niche. Ducklings from the boreal ecoregion had significantly less variation in their carbon and
nitrogen isotopic signatures; if this is true I would conclude that their diet was more specialized.
Chapter 4: The diet of Mallard ducklings
48
Mallard Duckling Foraging Niche
I found that duckling foraging sites within the wetland could not be predicted by available
invertebrate biomass (Figure 4.2). This suggests that ducklings do not search out or follow the
hen to patches of high invertebrate density (Monda and Ratti 1988). Other criteria, such as
predator avoidance, may have directed area use more than food availability; however I found that
ducklings on prairie wetlands foraged where cover was significantly reduced (Figure 4.4).
Despite the aforementioned and isolated significant result, and the significant results from other
landscapes (slope in the parkland; aquatic plant prevalence in the boreal), I found no consistent
trend across all landscapes that could predict where ducklings would forage within the wetland.
Choices with respect to feeding location are likely made by the hen at the resolution of the entire
wetland, not through consideration of microhabitats within the wetland (Monda and Ratti 1988,
Fast et al. 2004).
The environmental characteristics of boreal wetlands may explain why ducklings there
preferred larval Dytiscidae (65% of dietary biomass; ŵi = 1.68). Brood-rearing wetlands in the
WBF were deeper, more steeply sloped, and had less aquatic vegetation and cover than wetlands
in southern locals (Bethke and Nudds 1993). Predatory invertebrates that are visually-oriented,
like Dytiscidae adults and larvae, thrive in wetlands with a deep nekton and few aquatic plants
(Elmberg et al. 2000; Hornung and Foote 2005).
To compare landscape suitability I employed optimal foraging theory’s most robust
theorem, stating that dietary breadth contracts when food is abundant and expands when food is
scarce (Pianka 1991). Ducklings from boreal landscapes demonstrated a high degree of
selectivity by significantly avoiding or preferring all but one of the invertebrate groups found in
their diets. The 95% confidence interval ellipses of duckling dietary scores from each landscape
can be interpreted as measures of niche breadth (Figure 4.6). The boreal duckling ordination
scores result in a significantly smaller dietary ellipse, contained within the ellipses from the other
two landscapes, indicating a more specialized diet.
Dietary breadth has been used to infer habitat suitability between geographic regions
(Pedrini and Sergio 2002), foraging areas and season (Tebbich et al. 2004), and levels of prey
cover (Anderson 1984). Competitive interactions can also constrict dietary niche breadth
(Roughgarden 1974); this may be the case in regards to the competitive interaction between fish
and waterfowl considered here (Bouffard and Hanson 1997). As a result of winterkill or hens
Chapter 4: The diet of Mallard ducklings
49
choosing wetlands where fish are absent (Pehrsson 1984; McNicol and Wayland 1992; Mallory et
al. 1994) fish occurrence in the study wetlands over all three landscapes is reported as
consistently low (Lawler et al. 1974; Benoy et al. 2002; Danylchuck and Tonn 2003). Fish were
detected in few invertebrate samples during this study.
The constricted dietary niche in boreal habitats as indicated by Manly’s selection ratios
(Table 4.1), the relatively small boreal ellipse within the ordination biplot (Figure 4.6), and the
low variability in δ15N, in addition to the significantly higher biomass/L of invertebrate resources
in boreal wetlands (Figure 4.3), suggests that boreal wetlands provide more invertebrate resources
for Mallard ducklings as compared to prairie and parkland wetlands. Why then, given adequate
wetland conditions, do Mallards breed in the greatest densities in prairie and parkland habitats?
This question is important to assess the potential of the northern boreal plain; I show that it is not
because of a lack of invertebrate food resources. Sjöberg et al. (2000) have shown that food
limitation may prevent Mallards from rearing young on many boreal wetlands in Sweden. An
explanation for the incongruity found here is furnished by comparing total phosphorus
concentrations. Fennoscandian wetlands are considered ‘rich’ waterfowl ponds at phosphorus
levels of 19 – 30 µg/L (Sjöberg et al. 2000), while in the WBF phosphorous levels average 120
µg/L (Bayley and Prather 2003).
Management Implications
Shallow, chironomid-rich wetlands are important for Mallards, especially in the fall when
high densities of these invertebrates can inhabit the benthic zone of wetlands and adult ducks can
access them via tip-up feeding (Dykman and Hann 1996). Conversely, during the cool spring
months in Canada when Mallard ducklings hatch, brooding wetlands are generally deep with
spring meltwater making benthic zones unreachable, and chironomids averse to emerge. Instead
ducklings rely on aquatic predaceous macroinvertebrates that dwell near the surface and can
overwinter as either larvae or adults.
Our results give evidence that Mallard rearing habitat should be assessed by the abundance
of coleopterans, specifically Dytiscidae, and not dipterans, specifically Chironomidae (Danell and
Sjöberg 1980; Sjöberg and Danell 1982; Swanson et al. 1985; Jacobson 1991; Batzer et al. 1993).
Boreal habitats provide abundant food resources and foraging opportunities for Mallard
ducklings, as indicated by dietary niche breadth. Reasons why more southerly wetlands result in

Chapter 4: The diet of Mallard ducklings
50
a wider dietary niche for Mallard ducklings, and less of a specialization on particular invertebrate
groups, could be the increased competition from other broods, predator avoidance resulting in
sub-optimal foraging, or anthropogenic influence resulting in decreased habitat suitability. I have
further outlined how boreal wetlands play a role in Mallard ecology, and provided a new criterion
(predaceous invertebrates as a food resource) for managers to use to assess habitat quality for
Mallards in the understudied, and rapidly changing WBF.
Literature Cited
Åbjörnsson, K., Hansson, L., and Brönmark, C. 2004. Responses of prey from habitats with different predator regimes: local adaptation and heritability. Ecology, 85: 1859-1866.
Anderson, O. 1984. Optimal foraging by largemouth bass in structured environments. Ecology, 65: 851-861.
Ashley, M.C., Robinson, J.A., Oring, L.W., and Vinyard, G.A. 2000. Dipteran standing stock biomass and effects of aquatic bird predation at a constructed wetland. Wetlands, 20: 84-90.
Austin, J.E., Afton, A.D., Anderson, M.G., Clark, R.G., Custer, C.M., Lawrence, J.S., Pollard, J.B., and Ringelman, J.K. 2000. Declining scaup populations: issues, hypotheses, and research needs. Wildl. Soc. Bull. 28: 254-263.
Batzer, D.P., McGee, M., Resh, V.H. and Smith, R.R. 1993. Characteristics of the invertebrates consumed by mallards and prey response to wetland flooding schedules. Wetlands, 13: 41-49.
Bayley, S.E., and Prather, C.M. 2003. Do wetland lakes exhibit alternative stable states? Submersed aquatic vegetation and chlorophyll in western boreal shallow lakes Limnol. Oceanogr. 48: 2335–2345.
Bearhop, S., Adams, C.E., Waldron, S., Fuller, R.A., and Macleod, H. 2004. Determining trophic niche width: a novel approach using stable isotope analysis. J. Anim. Ecol. 73: 1007-1012.
Bellrose, F.C. 1980. Ducks, geese, and swans of North America. Third edition. Stackpole, Harrisburg, Pennsylvania, USA.
Bengtson, S.A. 1975. Food of ducklings of surface feeding ducks at Lake Myvatn, Iceland. Ornis Fennica, 52: 1-4.
Benke, A.C., Huryn, A.D., Smock, L.A., and Wallace, J.B. 1999. Length-mass relationships for freshwater macroinvertebrates in North America with particular reference to the southeastern United States. J. N. Am. Benthol. Soc. 18: 308-343.
Benoy G.A., Nudds T.D., and Dunlop E. 2002. Patterns of habitat and invertebrate diet overlap between tiger salamanders and ducks in prairie potholes. Hydrobiologia, 481: 47-59.
Bethke, R.W. and Nudds, T.D. 1993. Variation in the diversity of ducks along a gradient of environmental variability. Oecologia, 93: 242-250.
Chapter 4: The diet of Mallard ducklings
51
Bouffard, S.H., and Hanson, M.A. 1997. Fish in waterfowl marshes: waterfowl managers' perspective. Wildlife Soc. B. 25: 146-157.
Canadian Wildlife Service Waterfowl Committee. 2003. Population Status of Migratory Game Birds in Canada: November 2003. CWS Migr. Birds Regul. Rep. No. 10.
Chura, N.J. 1961. Food availability and preferences of juvenile mallards. T. N. Am. Wildl. Nat. Res. 26: 121-134.
Cox, R.R., Hanson, M.A., Roy, C.C., Euliss, N.H., Johnson, D.H., and Butler, M.G. 1998. Mallard duckling growth and survival in relation to aquatic invertebrates. J. Wildlife Manage. 62: 124-133.
Danell, K., and Sjöberg , K. 1980. Foods of wigeon, teal, mallard and pintail during the summer in a northern Swedish Lake. Viltrevy, 11:139-167.
Danylchuk, A.J., and Tonn, W.M. 2003. Natural disturbances and fish: local and regional influences on winterkill of fathead minnows in boreal lakes. T. Am. Fish. Soc. 132: 289-298.
Dykman, E., and Hann, B.J. 1996. Seasonal emergence of chironomids (Chironomidae, Diptera) in Delta Marsh. UFS (Delta Marsh) Annual Report, 31: 34-39.
Dzubin, A., and Gollop, J.P. 1972. Aspects of mallard breeding ecology in Canadian parkland and grassland. In Population ecology of migratory birds. U.S. Dep. Inter., Bur. Sport Fish. and Wildl., Wildlife Resources Report No. 2. pp. 113-152.
Dzus, E.H., and Clark, R.G. 1997. Overland travel, food abundance, and wetland use by mallards: relationships with offspring survival. Wilson Bull. 109: 504-515.
Elmberg, J., Sjöberg, K., Pöysä, H., and Nummi, P. 2000. Abundance-distribution relationships on interacting trophic levels: the case of lake-nesting waterfowl and dytiscid beetles. J. Biogeogr. 27: 821-827.
Fast, P.L.F., Clark, R.G., Brook, R.W., and Hines, J.E. 2004. Patterns of wetland use by brood-rearing lesser scaup in northern boreal forest of Canada. Waterbirds, 27: 177-182.
Gannes, L.Z., O’Brien, D.M., and Martinez del Rio, C. 1997. Stable isotopes in animal ecology: assumptions, caveats, and a call for more laboratory experiments. Ecology, 78: 1271–1276.
Gendron, M. and Clark, R.G. 2002. Survival of gadwall and mallard ducklings in southcentral Saskatchewan. J. Wildlife Manage. 66: 170-180.
Gollop, J.B., and Marshall, W.H. 1954. A guide for aging duck broods in the field. Flyway Council Technical Sect.
Hebert, C.E., and Wassenaar, L.I. 2001. Stable nitrogen isotopes in waterfowl feathers reflect agricultural land use in Western Canada. Environ. Sci. Technol. 35: 3482 – 3487.
Hornung, J.P. and Foote, A.L. 2005. Aquatic invertebrate responses to aquatic vegetation and fish presence in the Western Boreal Forest. Wetlands, in Press.
Hoekman, S.T., Mills, L.S., Howerter, D.W., Devries, J.H., and Ball, I.J. 2002. Sensitivity analysis of the life cycle of midcontinent mallards. J. Wildl. Manage. 66: 883-900.
Chapter 4: The diet of Mallard ducklings
52
Jacobsen, O.W. 1991. Feeding behaviour of breeding wigeon Anas Penelope in relation to seasonal emergence and swarming behaviour of chironomids. Ardea, 79: 409-418.
Johnson, D.H., Sargeant, A.B., and Greenwood, R.J. 1989. Importance of individual species of predators on nesting success of ducks in the Canadian Prairie Pothole region. Can. J. Zool. 67: 291-297.
Jongman, R.H.G., Ter Braak, C.J.F. and Van Tongeren, O.F.R. 1995. Data Analysis in Community and Landscape Ecology. Cambridge University Press, Great Britain.
Kaminski, R.H., and Price, H.H. 1981. Dabbling duck and aquatic macroinvertebrate responses to manipulated wetland habitat. J. Wildl. Manage. 45: 1-15.
King, R.S., and Wrubleski, D.A. 1998. Spatial and diel availability of flying insects as potential duckling food in prairie wetlands. Wetlands, 18: 100-114.
Krapu, G.L., and Reinecke, K.J. 1992. Foraging ecology and nutrition. In The ecology and management of breeding waterfowl. Edited by Batt, B.D.J., Afton, A.D., Anderson, M.G., Ankney, C.D., Johnson, D.H., Kadlec, J.A., and Krapu, G.L. University of Minnesota Press, Minneapolis, USA. pp. 1-29.
Lawler, G.H., Sunde, L.A., and Whitaker, J. 1974. Trout production in prairie ponds. J. Fish. Res. Bd. Can. 31: 929–936.
MacArthur, R.H., and Pianka, E.R. 1966. On optimal use of a patchy environment. Am. Nat. 100: 603–609.
Mallory, M.L., Blancher, P.J., Weatherhead, P.J., and McNicol, D.K. 1994. Presence or absence of fish as a cue to macroinvertebrate abundance in boreal wetlands. Hydrobiologia, 279-280: 345-351.
Manley, B.F.J., McDonald L.L., Thomas D.L., McDonald T.L., and Erikson W.P. 2002. Resource selection by animals. 2nd ed. Kluwer Academic Publishers.
Mauser, D.M., Jarvis, R.L. and Gilmer, D.S. 1994. Survival of radio-marked mallard ducklings in northeastern California. J. Wildl. Manage. 58: 82-87.
McCune, B., and Grace, J.B. 2002. Analysis of Ecological Communities. MjM Software, Gleneden Beach, Oregon, USA.
McNicol, D.K. and Wayland, M. 1992. Distribution of waterfowl broods in Sudbury area lakes in relation to fish, macroinvertebrates, and water chemistry. Can. J. Fish. Aq. Sci. 49: 122 133.
Monda, M.J., and Ratti, J.T. 1988. Niche overlap and habitat use by sympatric duck broods in eastern Washington. J. Wildl. Manage. 52: 95-103.
Nelson, R.D. 1990. Seasonal abundance and life cycles of chironomids (Diptera: Chironomidea) in four prairie wetlands. Diss. Abst. Pt. B - Sci. Eng. 51: 124 pp.
Niemuth, N.D., and Solberg, J.W. 2003. Response of waterbirds to number of wetlands in the Prairie Pothole Region of North Dakota, U.S.A. Waterbirds, 26: 233-238.
Nummi, P. 1993. Food-niche relationships of sympatric mallards and green winged teals. Can. J. Zool. 71: 49-55.

Chapter 4: The diet of Mallard ducklings
53
Nummi, P., Sjöberg , K., and Poysa, H. 2000. Individual foraging behaviour indicates resource limitation: an experiment with mallard ducklings. Can. J. Zool. 78: 1891-1895.
Pedrini, P., and Sergio, F. 2002. Regional conservation priorities for a large predator: golden eagles (Aquila chrysaetos) in the Alpine range. Biol. Conserv. 103: 163-172.
Pehrsson, O. 1979. Feeding behaviour, feeding habitat utilization, and feeding efficiency of Mallard ducklings (Anas platyrhynchos L.) as guided by a domestic duck. Swedish Wildlife Research (Viltrevy), 10: 193-218.
Pehrsson, O. 1984. Relationships of food to spatial and temporal breeding strategies of mallards in Sweden. J. Wildl. Manage. 48: 322-339.
Perret, N.G. 1962. The spring and summer foods of the common mallard, Anas platyrhynchos platyrhynchos L., in south central Manitoba. Thesis, University of British Columbia, Vancouver, Canada.
Pianka, E.R. 1991. This Week's Citation Classic - Agriculture, Biology & Environmental Sciences, August 1988. Reprinted in Foundations of Ecology - Classic Papers with Commentaries. Edited by Real, L.A., and Brown, J.H. University of Chicago Press, Chicago, IL, USA.
Reinecke, K.J., and Owen, R.B., Jr. 1980. Food use and nutrition of Black Ducks nesting in Maine. J. Wildl. Manage. 44: 549-558.
Robinson, J.A., Aldridge, N.S., Wright, L., and Culzac, L.G. 2003. Invertebrate food supply and breeding success of mallards Anas platyrhynchos at flooded gravel quarries in southern Britain. Ardea, 91: 3-9.
Roughgarden, J. 1974. Species competition and the competition function with illustrations from coral reef fish. Theor. Popul. Biol. 5: 163-186.
Sedinger, J.S. 1992. Ecology of prefledging waterfowl. In The ecology and management of breeding waterfowl. Edited by Batt, B.D.J., Afton, A.D., Anderson, M.G., Ankney, C.D., Johnson, D.H., Kadlec, J.A., and Krapu, G.L. University of Minnesota Press, Minneapolis, USA. pp. 109-127.
Sjöberg , K., and Danell, K. 1982. Feeding activity of ducks in relation to diel emergence of chironomids. Can. J. Zool. 60: 1383-1387.
Sjöberg , K., Poysa, H., Elmberg, J., and Nummi, P. 2000. Response of mallard ducklings to variation in habitat quality: An experiment of food limitation. Ecology, 81: 329 – 335.
Smock, L.A. 1980. Relationships between body size and biomass of aquatic insects. Freshwat. Biol. 10: 375-383.
Street, M. 1977. The food of mallard ducklings in a wet gravel quarry, and its relation to duckling survival. Wildfowl, 28: 113-125.
Sugden, L.G. 1973. Feeding ecology of pintail, gadwall, American widgeon and lesser scaup ducklings in southern Alberta. Can. Wildl. Serv. Rep. Set. 24.
Swanson, G.A., Meyer, M.I., and Adomaitis, V.A. 1985. Foods consumed by breeding mallards on wetlands of south-central North Dakota. J. Wildl. Manage. 49: 197-203.
Chapter 4: The diet of Mallard ducklings
54
Talent, L.G., Jarvis, R.L., and Krapu, G.L. 1983. Survival of mallard broods in south-central North Dakota. Condor, 85: 74-78.
Talent, L.G., Krapu, G.L., and Jarvis, R.L. 1982. Habitat use by Mallard broods in south central North Dakota. J. Wildl. Manage. 46: 629-635.
Tebbich, S., Taborsky, M.B., Dvorak, F.M., and Winkler, H. 2004. Feeding behavior of four arboreal darwin’s finches: adaptations to spatial and seasonal variability. Condor, 106: 95–105.
Zar, J.H. 1999. Biostatistical Analysis – fourth edition. Prentice Hall, New Jersey, NJ.
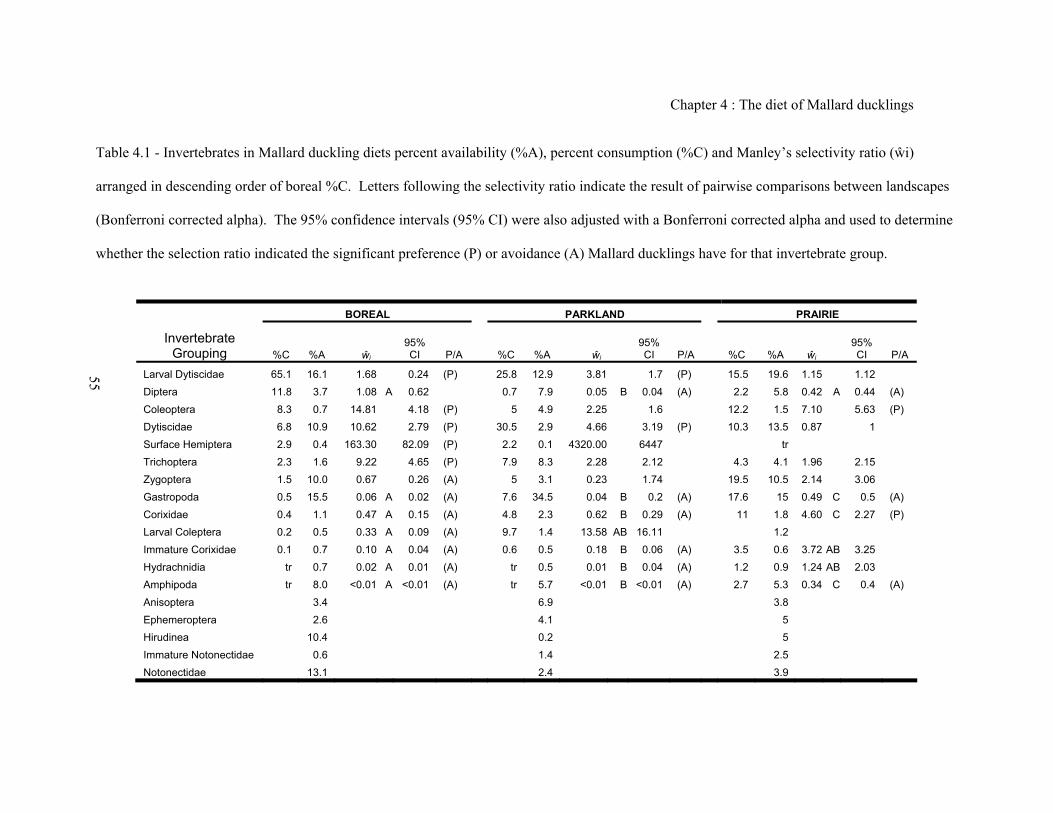
Chapter 4 : The diet of Mallard ducklings
Table 4.1 - Invertebrates in Mallard duckling diets percent availability (%A), percent consumption (%C) and Manley’s selectivity ratio (ŵi)
arranged in descending order of boreal %C. Letters following the selectivity ratio indicate the result of pairwise comparisons between landscapes
(Bonferroni corrected alpha). The 95% confidence intervals (95% CI) were also adjusted with a Bonferroni corrected alpha and used to determine
whether the selection ratio indicated the significant preference (P) or avoidance (A) Mallard ducklings have for that invertebrate group.
55
BOREAL PARKLAND PRAIRIE
Invertebrate Grouping %C %A ŵi
95% CI P/A
%C %A ŵi 95% CI P/A
%C %A ŵi 95% CI P/A
Larval Dytiscidae 65.1 16.1 1.68 0.24 (P) 25.8 12.9 3.81 1.7 (P) 15.5 19.6 1.15 1.12Diptera
11.8 3.7 1.08 A 0.62 0.7 7.9 0.05 B 0.04 (A) 2.2 5.8 0.42 A 0.44 (A)Coleoptera 8.3 0.7 14.81 4.18 (P) 5 4.9 2.25 1.6 12.2 1.5 7.10 5.63 (P)Dytiscidae 6.8 10.9 10.62 2.79 (P) 30.5 2.9 4.66 3.19 (P) 10.3 13.5 0.87 1Surface Hemiptera 2.9 0.4 163.30 82.09 (P) 2.2 0.1 4320.00 6447 trTrichoptera 2.3 1.6 9.22 4.65 (P) 7.9 8.3 2.28 2.12 4.3 4.1 1.96 2.15Zygoptera 1.5 10.0 0.67 0.26 (A) 5 3.1 0.23 1.74 19.5 10.5 2.14 3.06Gastropoda 0.5 15.5 0.06 A 0.02 (A) 7.6 34.5 0.04 B 0.2 (A) 17.6 15 0.49 C 0.5 (A)Corixidae 0.4 1.1 0.47 A 0.15 (A) 4.8 2.3 0.62 B 0.29 (A) 11 1.8 4.60 C 2.27 (P)Larval Coleptera 0.2 0.5 0.33 A 0.09 (A) 9.7 1.4 13.58 AB 16.11 1.2Immature Corixidae 0.1 0.7 0.10 A 0.04 (A) 0.6 0.5 0.18 B 0.06 (A) 3.5 0.6 3.72 AB 3.25Hydrachnidia tr 0.7 0.02 A 0.01 (A) tr 0.5 0.01 B 0.04 (A) 1.2 0.9 1.24 AB 2.03Amphipoda tr 8.0 <0.01 A <0.01 (A) tr 5.7 <0.01 B <0.01 (A) 2.7 5.3 0.34 C 0.4 (A)Anisoptera 3.4 6.9 3.8Ephemeroptera 2.6 4.1 5Hirudinea 10.4 0.2 5Immature Notonectidae 0.6 1.4 2.5Notonectidae 13.1 2.4 3.9

Chapter 4 : The diet of Mallard ducklings
Figure 4.1 - Manley’s selection ratio for invertebrate groups found in Mallard duckling diets. Information on whether an invertebrate group is
significantly preferred or avoided is included in Table 4.1. Members of each invertebrate group are included in Appendix 4A.
0.00
0.00
0.01
0.10
1.00
10.00
100.00
1000.00
10000.00
Amphipo
da
Coleop
tera
Corixid
ae
Diptera
Dytiscid
ae
Gastro
poda
Surfac
e Hem
iptera
Hydrac
hnidi
a
Immatu
re Cori
xidae
larva
l Cole
opter
a
larv Dytis
cidae
Trich
opter
a
Zygop
tera
boreal
parkland
prairie
All error bars equal Bonferonni corrected 95% Confidence Intervals
Man
ley’
s S
elec
tion
Rat
io (L
og ŵ
i)
56

Chapter 4: The diet of Mallard ducklings
57
Figure 4.2 - Wetland invertebrate biomass/L of those invertebrate groups found in duckling diets
at feeding and non-feeding (alternate) sites using three types of invertebrate sampling methods:
scoops of the benthic zone, horizontal sweeps of the water’s surface, and vertical hauls of the
wetland’s nekton.
0
5
10
15
20
BENTHIC SURFACE VERTICAL
AlternateFeeding
Inve
rtebr
ate
biom
ass
(mg/
L) Error Bars = +/- 1 SE

Chapter 4: The diet of Mallard ducklings
58
Figure 4.3 - Invertebrate biomass/L during the Mallard brooding season comparing landscapes.
Weighted biomass/L is multiplied by the invertebrate group’s proportion in duckling diets.
Significant differences in means (α = 0.05) are denoted by letters above bars.
0
4
8
12
Boreal Parkland Prairie
AAB
B
Bio
mas
s/Li
ter
(mg/
L)
0
0.4
0.8
1.2
1.6
Wei
ghte
d B
iom
ass/
Lite
r(m
g/L
x pr
opor
tion
use)

Chapter 4: The diet of Mallard ducklings
59
Figure 4.4 - Macrophyte prevalence, cover, depth, and slope at Mallard duckling wetlands
comparing measurements at feeding to non-feeding sites. Asterisks indicate a significant
difference (P < 0.05) using paired t-test.
AlternateFeeding
0
10
20
30
40
boreal plain parkland prairie
Aver
age
Dep
th
(cm
)
0
0.2
0.4
0.6
0.8
Aqua
tic P
lant
Pre
vale
nce
(cm
3pl
ant /
cm
3w
ater
)
0
0.1
0.2
0.3
0.4
0.5
Perc
ent T
erre
stria
l Cov
er(%
em
erge
nt c
over
)
0
4
8
12
16
20
boreal plain parkland prairie
Slop
e(c
m/m
)
*
*
*
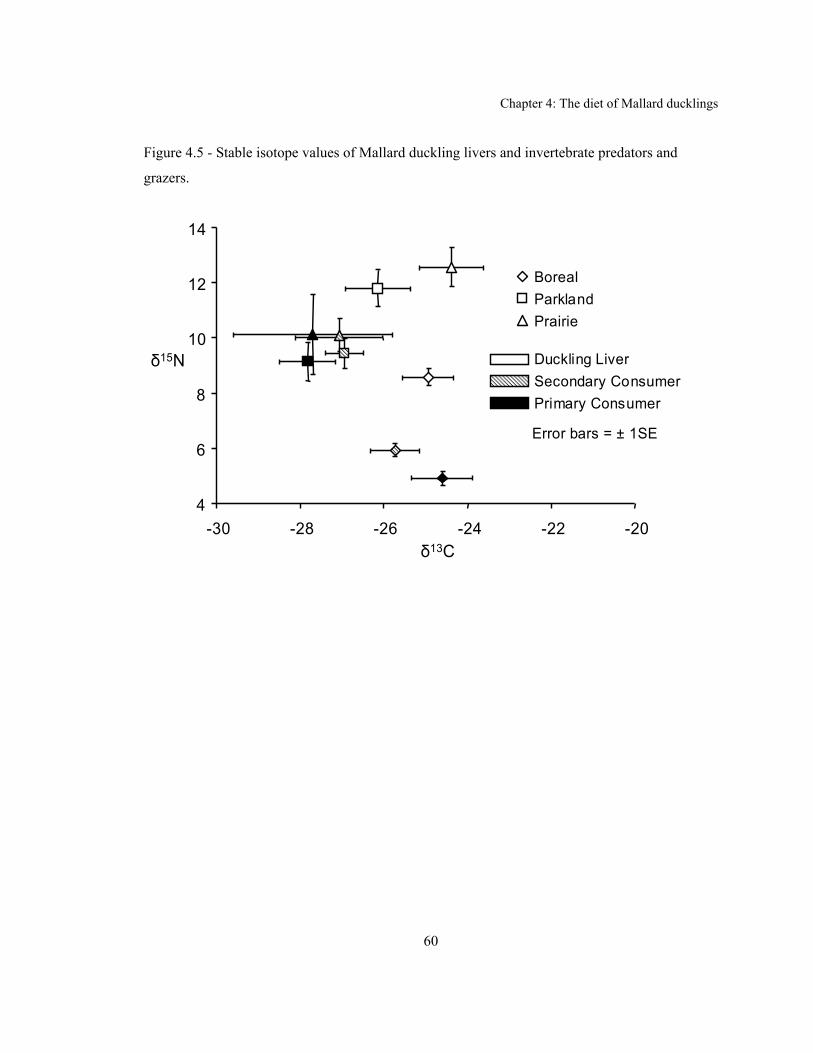
Chapter 4: The diet of Mallard ducklings
60
Figure 4.5 - Stable isotope values of Mallard duckling livers and invertebrate predators and
grazers.
4
6
8
10
12
14
-30 -28 -26 -24 -22 -20
BorealParklandPrairie
Duckling LiverSecondary ConsumerPrimary Consumer
Error bars = ± 1SE
δ15N
δ13C

Chapter 4: The diet of Mallard ducklings
61
Figure 4.6 - Ordination biplot of invertebrate presence / absence in duckling diets. Ellipses are
95% confidence intervals around the centriods of duckling PCA scores from each landscape. The
first axis explained 52.2% of the variation while the second explained an additional 10.4%.
0.5
PCA 1; λ = 0.522
-1.0
0.0
1.0
Cladocera
Larval Coleoptera
Gastropoda
Zygoptera
Trichoptera
Coleoptera
Corixidae
Diptera
larval Dytiscidae
Imm. CoriixidaeDytiscidae
PCA 2λ = 0.104
1.00.0
Boreal
Parkland
Prairie
Boreal
Parkland
Prairie
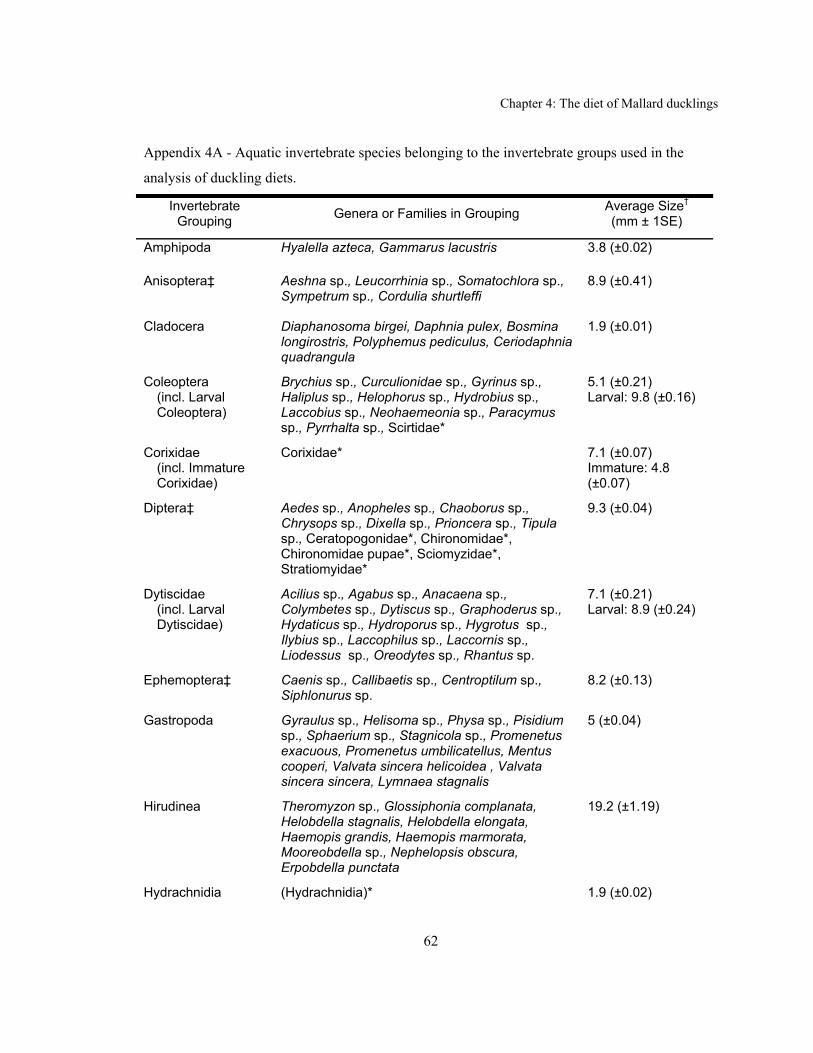
Chapter 4: The diet of Mallard ducklings
62
Appendix 4A - Aquatic invertebrate species belonging to the invertebrate groups used in the
analysis of duckling diets.
Invertebrate Grouping Genera or Families in Grouping Average Size†
(mm ± 1SE)
Amphipoda Hyalella azteca, Gammarus lacustris 3.8 (±0.02)
Anisoptera‡ Aeshna sp., Leucorrhinia sp., Somatochlora sp., Sympetrum sp., Cordulia shurtleffi
8.9 (±0.41)
Cladocera Diaphanosoma birgei, Daphnia pulex, Bosmina longirostris, Polyphemus pediculus, Ceriodaphnia quadrangula
1.9 (±0.01)
Coleoptera (incl. Larval Coleoptera)
Brychius sp., Curculionidae sp., Gyrinus sp., Haliplus sp., Helophorus sp., Hydrobius sp., Laccobius sp., Neohaemeonia sp., Paracymus sp., Pyrrhalta sp., Scirtidae*
5.1 (±0.21) Larval: 9.8 (±0.16)
Corixidae (incl. Immature Corixidae)
Corixidae* 7.1 (±0.07) Immature: 4.8 (±0.07)
Diptera‡
Aedes sp., Anopheles sp., Chaoborus sp., Chrysops sp., Dixella sp., Prioncera sp., Tipula sp., Ceratopogonidae*, Chironomidae*, Chironomidae pupae*, Sciomyzidae*, Stratiomyidae*
9.3 (±0.04)
Dytiscidae (incl. Larval Dytiscidae)
Acilius sp., Agabus sp., Anacaena sp., Colymbetes sp., Dytiscus sp., Graphoderus sp., Hydaticus sp., Hydroporus sp., Hygrotus sp., Ilybius sp., Laccophilus sp., Laccornis sp., Liodessus sp., Oreodytes sp., Rhantus sp.
7.1 (±0.21) Larval: 8.9 (±0.24)
Ephemoptera‡ Caenis sp., Callibaetis sp., Centroptilum sp., Siphlonurus sp.
8.2 (±0.13)
Gastropoda Gyraulus sp., Helisoma sp., Physa sp., Pisidium sp., Sphaerium sp., Stagnicola sp., Promenetus exacuous, Promenetus umbilicatellus, Mentus cooperi, Valvata sincera helicoidea , Valvata sincera sincera, Lymnaea stagnalis
5 (±0.04)
Hirudinea Theromyzon sp., Glossiphonia complanata, Helobdella stagnalis, Helobdella elongata, Haemopis grandis, Haemopis marmorata, Mooreobdella sp., Nephelopsis obscura, Erpobdella punctata
19.2 (±1.19)
Hydrachnidia (Hydrachnidia)* 1.9 (±0.02)

Chapter 4: The diet of Mallard ducklings
63
Invertebrate Grouping Genera or Families in Grouping Average Size†
(mm ± 1SE)
Notonectidae
Notonecta sp. 12.7 (±0.42) Immature: 7.8 (±0.28)
Oligochaets Stylaria lacustris sp., Lumbriculidae* 16.4 (±0.54)
Ostracoda Ostracoda sp. 3.5 (±0.01)
Surface Hemiptera Limnoporus sp., Mesovelia sp., Microvelia sp. 3.7 (±0.4)
Trichoptera‡ Agrypnia sp., Arctopora sp., Asynarchus sp., Banksiola sp., Cerclea sp., Glyphopsyche sp., Limnephilus sp., Mystacides sp., Nectopsyche sp., Nemotaulius sp., Oecetis sp., Orthotrichia sp., Phryganea sp., Polycentropus sp., Ptilostomis sp., Rhyacophila sp., Triaenodes sp.
10.1 (±0.33)
Zygoptera‡ Coenagrion sp., Enallagma sp., Lestes sp. 12.9 (±0.24)
* - Indicates taxonomic resolution at the family level only.
† - Average size of those invertebrates measured in this study.
‡ - Includes larval, emergent (teneral) and adult forms.

Chapter 4: The diet of Mallard ducklings
64
Appendix 4B – Stable isotope values of invertebrates and Mallard ducklings
Tissue Type Year Eco-regionPond
Number Trophic Level δ13C δ15NAmphipoda 2002 Boreal 59 Primary Consumer -20.1 5.0
Amphipoda 2002 Boreal 121 Primary Consumer -23.7 3.7
Amphipoda 2002 Boreal 48 Primary Consumer -20.0 4.8
Amphipoda 2002 Boreal 102 Primary Consumer -21.3 3.8
Amphipoda 2002 Boreal 37 Primary Consumer -20.1 2.6
Amphipoda 2003 Boreal 31 Primary Consumer -23.2 6.4
Amphipoda 2004 Boreal 2 Primary Consumer -23.4 1.6
Amphipoda 2004 Boreal 12 Primary Consumer -17.7 3.6
Amphipoda 2004 Boreal 13 Primary Consumer -15.8 7.4
chironomidae 2004 Boreal 1 Primary Consumer -33.0 3.8
chironomidae 2004 Boreal 2 Primary Consumer -26.4 4.5
chironomidae 2004 Boreal 3 Primary Consumer -34.7 5.2
chironomidae 2004 Boreal 4 Primary Consumer -31.3 4.8
chironomidae 2004 Boreal 5 Primary Consumer -33.9 4.0
chironomidae 2004 Boreal 12 Primary Consumer -20.6 6.4
chironomidae 2004 Boreal 13 Primary Consumer -17.6 7.3
chironomidae 2004 Boreal 15 Primary Consumer -14.7 5.5
chironomidae 2004 Boreal 16 Primary Consumer -37.0 4.6
chironomidae 2004 Boreal 18 Primary Consumer -34.7 2.6
chironomidae 2004 Boreal 20 Primary Consumer -20.7 6.4
cladocera 2004 Boreal 13 Primary Consumer -16.8 4.5
cladocera 2004 Boreal 16 Primary Consumer -26.6 2.8
Diptera 2002 Boreal 59 Primary Consumer -19.4 6.1
Diptera 2002 Boreal 121 Primary Consumer -24.2 4.6
Diptera 2002 Boreal 102 Primary Consumer -21.5 2.8
Diptera 2002 Boreal 118 Primary Consumer -31.2 2.4
Diptera 2003 Boreal 11 Primary Consumer -37.5 6.1
Diptera 2003 Boreal 31 Primary Consumer -21.3 6.8
Diptera 2003 Boreal 31 Primary Consumer -21.0 6.1
Diptera 2003 Boreal 31 Primary Consumer -20.5 6.1
Diptera 2003 Boreal 32 Primary Consumer -30.9 4.4
Diptera 2003 Parkland 13 Primary Consumer -24.5 6.4
Diptera 2003 Parkland 14 Primary Consumer -27.1 14.1
Diptera 2003 Parkland 15 Primary Consumer -23.7 10.9
Diptera 2003 Parkland 16 Primary Consumer -28.5 9.3
Diptera 2003 Parkland 23 Primary Consumer -28.3 6.2
Diptera 2003 Parkland 24 Primary Consumer -27.8 10.4

Chapter 4: The diet of Mallard ducklings
65
Tissue Type Year Eco-regionPond
Number Trophic Level δ13C δ15NDiptera 2003 Parkland 25 Primary Consumer -29.9 7.7
Diptera 2003 Parkland 28 Primary Consumer -29.8 5.7
Diptera 2003 Parkland 29 Primary Consumer -32.9 9.0
Diptera 2003 Prairie 1 Primary Consumer -33.9 14.3
Diptera 2003 Prairie 4 Primary Consumer -29.9 6.8
Diptera 2003 Prairie 5 Primary Consumer -31.3 5.1
Diptera 2003 Prairie 7 Primary Consumer -24.5 13.1
Diptera 2003 Prairie 10 Primary Consumer -19.6 5.2
Ephemeropteran 2002 Boreal 118 Primary Consumer -27.6 3.0
Ephemeropteran 2003 Boreal 31 Primary Consumer -24.5 7.9
Ephemeropteran 2003 Boreal 32 Primary Consumer -36.1 4.1
Ephemeropteran 2004 Boreal 3 Primary Consumer -38.4 4.2
Ephemeropteran 2004 Boreal 5 Primary Consumer -32.2 3.3
Ephemeropteran 2003 Prairie 3 Primary Consumer -24.3 10.6
Heliosoma 2001 Boreal 168 Primary Consumer -20.4 5.3
Heliosoma 2001 Boreal 168 Primary Consumer -21.0 5.2
Lymanalidae 2001 Boreal 59 Primary Consumer -19.7 5.4
Lymanalidae 2001 Boreal 168 Primary Consumer -18.7 4.3
Lymanalidae 2001 Boreal 48 Primary Consumer -19.3 5.3
Lymanalidae 2001 Boreal 48 Primary Consumer -20.3 5.1
Lymanalidae 2001 Boreal 48 Primary Consumer -20.0 4.7
Lymanalidae 2001 Boreal 122 Primary Consumer -21.8 4.6
Lymanalidae 2001 Boreal 1 Primary Consumer -26.1 4.3
Lymanalidae 2001 Boreal 121 Primary Consumer -26.4 4.1
Lymanalidae 2001 Boreal 1 Primary Consumer -27.3 3.8
Lymanalidae 2001 Boreal 122 Primary Consumer -20.4 3.4
Lymanalidae 2001 Boreal 121 Primary Consumer -24.2 3.3
Lymanalidae 2001 Boreal 121 Primary Consumer -23.9 2.9
Lymanalidae 2002 Boreal 37 Primary Consumer -22.9 3.7
Lymanalidae 2001 Boreal 201 Primary Consumer -21.8 6.3
Lymanalidae 2001 Boreal 201 Primary Consumer -21.4 5.8
Lymanalidae 2001 Boreal 201 Primary Consumer -21.1 5.7
Lymanalidae 2001 Boreal 206 Primary Consumer -26.8 2.7
Lymanalidae 2001 Boreal 206 Primary Consumer -26.5 1.4
Lymanalidae 2003 Boreal 31 Primary Consumer -24.8 10.7
Lymanalidae 2003 Boreal 32 Primary Consumer -22.0 12.4
Lymanalidae 2003 Boreal 32 Primary Consumer -32.5 7.0
Lymanalidae 2004 Boreal 4 Primary Consumer -29.4 1.6
Lymanalidae 2004 Boreal 8 Primary Consumer -21.3 4.1
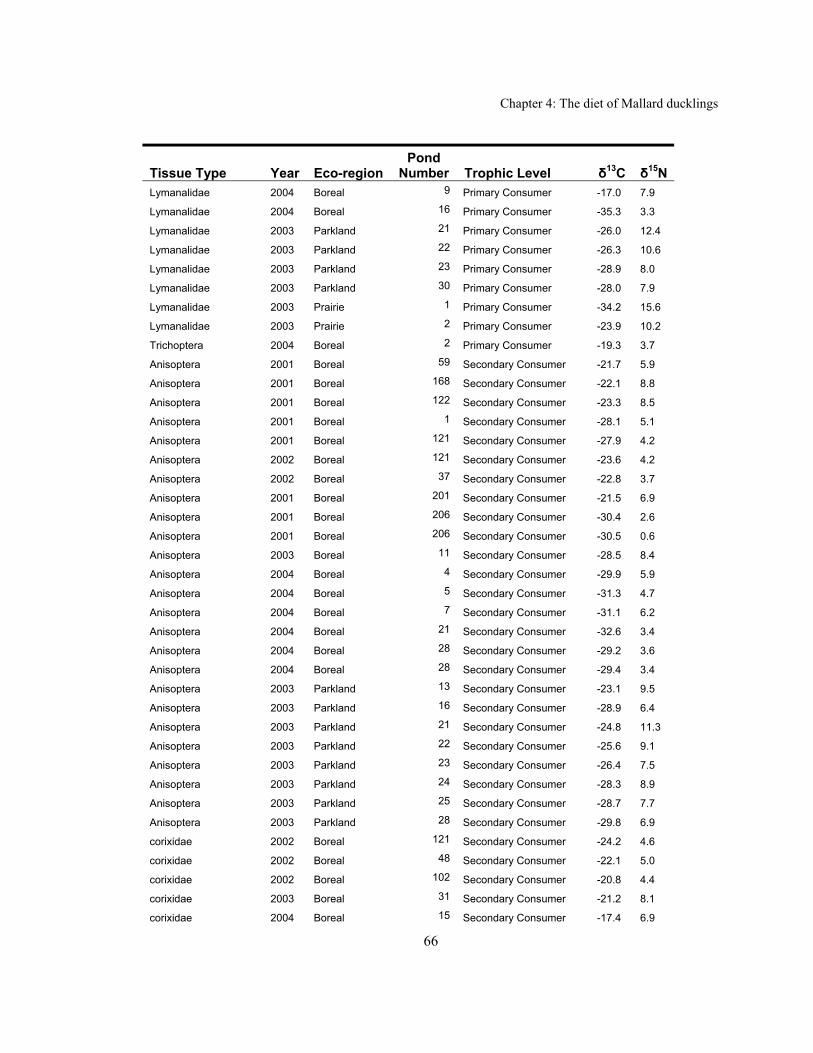
Chapter 4: The diet of Mallard ducklings
66
Tissue Type Year Eco-regionPond
Number Trophic Level δ13C δ15NLymanalidae 2004 Boreal 9 Primary Consumer -17.0 7.9
Lymanalidae 2004 Boreal 16 Primary Consumer -35.3 3.3
Lymanalidae 2003 Parkland 21 Primary Consumer -26.0 12.4
Lymanalidae 2003 Parkland 22 Primary Consumer -26.3 10.6
Lymanalidae 2003 Parkland 23 Primary Consumer -28.9 8.0
Lymanalidae 2003 Parkland 30 Primary Consumer -28.0 7.9
Lymanalidae 2003 Prairie 1 Primary Consumer -34.2 15.6
Lymanalidae 2003 Prairie 2 Primary Consumer -23.9 10.2
Trichoptera 2004 Boreal 2 Primary Consumer -19.3 3.7
Anisoptera 2001 Boreal 59 Secondary Consumer -21.7 5.9
Anisoptera 2001 Boreal 168 Secondary Consumer -22.1 8.8
Anisoptera 2001 Boreal 122 Secondary Consumer -23.3 8.5
Anisoptera 2001 Boreal 1 Secondary Consumer -28.1 5.1
Anisoptera 2001 Boreal 121 Secondary Consumer -27.9 4.2
Anisoptera 2002 Boreal 121 Secondary Consumer -23.6 4.2
Anisoptera 2002 Boreal 37 Secondary Consumer -22.8 3.7
Anisoptera 2001 Boreal 201 Secondary Consumer -21.5 6.9
Anisoptera 2001 Boreal 206 Secondary Consumer -30.4 2.6
Anisoptera 2001 Boreal 206 Secondary Consumer -30.5 0.6
Anisoptera 2003 Boreal 11 Secondary Consumer -28.5 8.4
Anisoptera 2004 Boreal 4 Secondary Consumer -29.9 5.9
Anisoptera 2004 Boreal 5 Secondary Consumer -31.3 4.7
Anisoptera 2004 Boreal 7 Secondary Consumer -31.1 6.2
Anisoptera 2004 Boreal 21 Secondary Consumer -32.6 3.4
Anisoptera 2004 Boreal 28 Secondary Consumer -29.2 3.6
Anisoptera 2004 Boreal 28 Secondary Consumer -29.4 3.4
Anisoptera 2003 Parkland 13 Secondary Consumer -23.1 9.5
Anisoptera 2003 Parkland 16 Secondary Consumer -28.9 6.4
Anisoptera 2003 Parkland 21 Secondary Consumer -24.8 11.3
Anisoptera 2003 Parkland 22 Secondary Consumer -25.6 9.1
Anisoptera 2003 Parkland 23 Secondary Consumer -26.4 7.5
Anisoptera 2003 Parkland 24 Secondary Consumer -28.3 8.9
Anisoptera 2003 Parkland 25 Secondary Consumer -28.7 7.7
Anisoptera 2003 Parkland 28 Secondary Consumer -29.8 6.9
corixidae 2002 Boreal 121 Secondary Consumer -24.2 4.6
corixidae 2002 Boreal 48 Secondary Consumer -22.1 5.0
corixidae 2002 Boreal 102 Secondary Consumer -20.8 4.4
corixidae 2003 Boreal 31 Secondary Consumer -21.2 8.1
corixidae 2004 Boreal 15 Secondary Consumer -17.4 6.9

Chapter 4: The diet of Mallard ducklings
67
Tissue Type Year Eco-regionPond
Number Trophic Level δ13C δ15Ncorixidae 2003 Parkland 14 Secondary Consumer -25.0 11.8
corixidae 2003 Parkland 15 Secondary Consumer -24.6 10.3
corixidae 2003 Parkland 16 Secondary Consumer -29.2 6.5
corixidae 2003 Parkland 21 Secondary Consumer -28.3 8.7
corixidae 2003 Prairie 9 Secondary Consumer -30.4 13.1
corixidae 2003 Prairie 10 Secondary Consumer -27.3 6.6
Dytiscus 2001 Boreal 168 Secondary Consumer -23.1 9.3
Dytiscus 2001 Boreal 122 Secondary Consumer -21.8 9.2
Dytiscus 2001 Boreal 48 Secondary Consumer -22.2 8.3
Dytiscus 2002 Boreal 121 Secondary Consumer -23.4 4.9
Dytiscus 2002 Boreal 37 Secondary Consumer -22.4 6.4
Dytiscus 2001 Boreal 206 Secondary Consumer -31.4 7.3
Dytiscus 2001 Boreal 201 Secondary Consumer -21.4 6.7
Dytiscus 2004 Boreal 1 Secondary Consumer -35.0 4.6
Dytiscus 2004 Boreal 7 Secondary Consumer -30.0 7.5
Dytiscus 2004 Boreal 8 Secondary Consumer -24.0 6.7
Dytiscus 2004 Boreal 20 Secondary Consumer -22.0 4.8
Dytiscus 2003 Parkland 14 Secondary Consumer -27.2 12.0
Dytiscus 2003 Parkland 22 Secondary Consumer -26.7 9.5
Dytiscus 2003 Parkland 28 Secondary Consumer -32.4 6.5
Dytiscus 2003 Prairie 2 Secondary Consumer -26.7 9.7
Dytiscus Larvae 2003 Boreal 32 Secondary Consumer -37.7 4.0
Dytiscus Larvae 2001 Boreal 59 Secondary Consumer -23.5 8.8
Dytiscus Larvae 2001 Boreal 168 Secondary Consumer -19.6 7.5
Dytiscus Larvae 2001 Boreal 168 Secondary Consumer -19.9 6.9
Dytiscus Larvae 2001 Boreal 48 Secondary Consumer -25.8 8.2
Dytiscus Larvae 2001 Boreal 121 Secondary Consumer -21.8 6.8
Dytiscus Larvae 2001 Boreal 121 Secondary Consumer -24.2 6.4
Dytiscus Larvae 2002 Boreal 59 Secondary Consumer -19.0 7.2
Dytiscus Larvae 2002 Boreal 59 Secondary Consumer -21.9 5.9
Dytiscus Larvae 2002 Boreal 121 Secondary Consumer -24.4 5.5
Dytiscus Larvae 2002 Boreal 48 Secondary Consumer -20.2 5.9
Dytiscus Larvae 2001 Boreal 201 Secondary Consumer -20.7 7.4
Dytiscus Larvae 2001 Boreal 206 Secondary Consumer -29.6 4.9
Dytiscus Larvae 2002 Boreal 118 Secondary Consumer -29.3 4.0
Dytiscus Larvae 2003 Boreal 31 Secondary Consumer -21.2 9.1
Dytiscus Larvae 2003 Boreal 32 Secondary Consumer -31.0 5.1
Dytiscus Larvae 2001 Boreal 1 Secondary Consumer -27.5 2.8
Dytiscus Larvae 2004 Boreal 1 Secondary Consumer -31.0 3.0
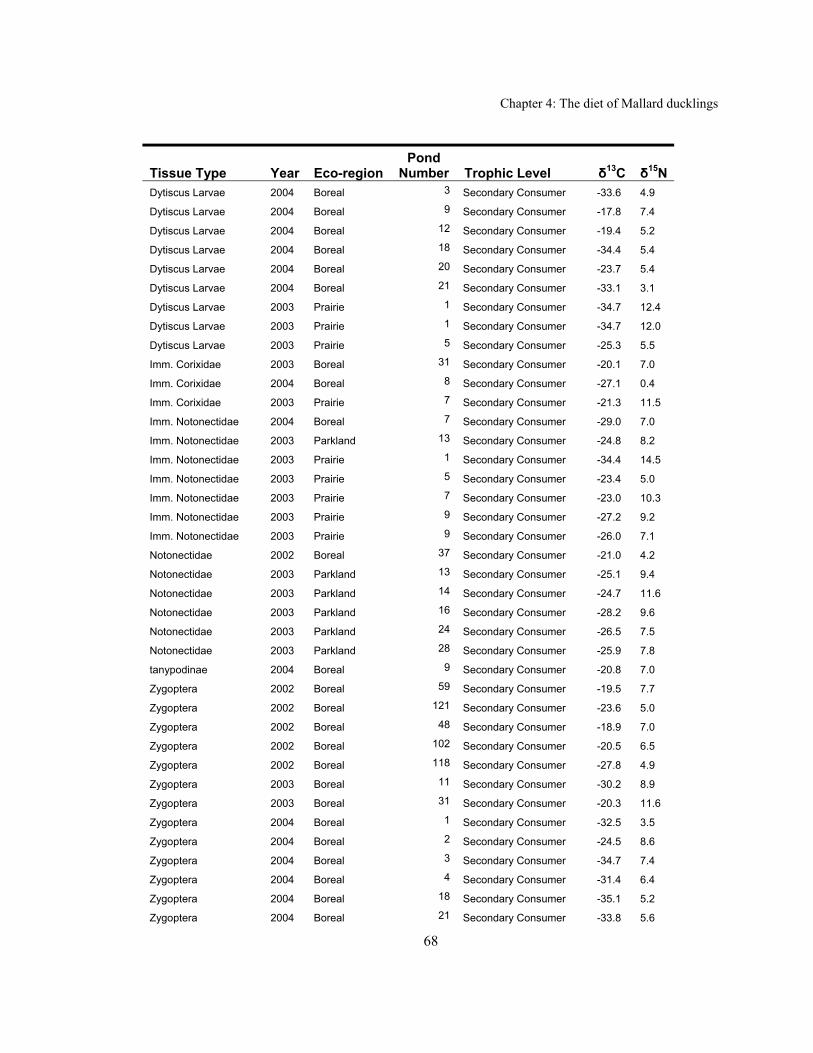
Chapter 4: The diet of Mallard ducklings
68
Tissue Type Year Eco-regionPond
Number Trophic Level δ13C δ15NDytiscus Larvae 2004 Boreal 3 Secondary Consumer -33.6 4.9
Dytiscus Larvae 2004 Boreal 9 Secondary Consumer -17.8 7.4
Dytiscus Larvae 2004 Boreal 12 Secondary Consumer -19.4 5.2
Dytiscus Larvae 2004 Boreal 18 Secondary Consumer -34.4 5.4
Dytiscus Larvae 2004 Boreal 20 Secondary Consumer -23.7 5.4
Dytiscus Larvae 2004 Boreal 21 Secondary Consumer -33.1 3.1
Dytiscus Larvae 2003 Prairie 1 Secondary Consumer -34.7 12.4
Dytiscus Larvae 2003 Prairie 1 Secondary Consumer -34.7 12.0
Dytiscus Larvae 2003 Prairie 5 Secondary Consumer -25.3 5.5
Imm. Corixidae 2003 Boreal 31 Secondary Consumer -20.1 7.0
Imm. Corixidae 2004 Boreal 8 Secondary Consumer -27.1 0.4
Imm. Corixidae 2003 Prairie 7 Secondary Consumer -21.3 11.5
Imm. Notonectidae 2004 Boreal 7 Secondary Consumer -29.0 7.0
Imm. Notonectidae 2003 Parkland 13 Secondary Consumer -24.8 8.2
Imm. Notonectidae 2003 Prairie 1 Secondary Consumer -34.4 14.5
Imm. Notonectidae 2003 Prairie 5 Secondary Consumer -23.4 5.0
Imm. Notonectidae 2003 Prairie 7 Secondary Consumer -23.0 10.3
Imm. Notonectidae 2003 Prairie 9 Secondary Consumer -27.2 9.2
Imm. Notonectidae 2003 Prairie 9 Secondary Consumer -26.0 7.1
Notonectidae 2002 Boreal 37 Secondary Consumer -21.0 4.2
Notonectidae 2003 Parkland 13 Secondary Consumer -25.1 9.4
Notonectidae 2003 Parkland 14 Secondary Consumer -24.7 11.6
Notonectidae 2003 Parkland 16 Secondary Consumer -28.2 9.6
Notonectidae 2003 Parkland 24 Secondary Consumer -26.5 7.5
Notonectidae 2003 Parkland 28 Secondary Consumer -25.9 7.8
tanypodinae 2004 Boreal 9 Secondary Consumer -20.8 7.0
Zygoptera 2002 Boreal 59 Secondary Consumer -19.5 7.7
Zygoptera 2002 Boreal 121 Secondary Consumer -23.6 5.0
Zygoptera 2002 Boreal 48 Secondary Consumer -18.9 7.0
Zygoptera 2002 Boreal 102 Secondary Consumer -20.5 6.5
Zygoptera 2002 Boreal 118 Secondary Consumer -27.8 4.9
Zygoptera 2003 Boreal 11 Secondary Consumer -30.2 8.9
Zygoptera 2003 Boreal 31 Secondary Consumer -20.3 11.6
Zygoptera 2004 Boreal 1 Secondary Consumer -32.5 3.5
Zygoptera 2004 Boreal 2 Secondary Consumer -24.5 8.6
Zygoptera 2004 Boreal 3 Secondary Consumer -34.7 7.4
Zygoptera 2004 Boreal 4 Secondary Consumer -31.4 6.4
Zygoptera 2004 Boreal 18 Secondary Consumer -35.1 5.2
Zygoptera 2004 Boreal 21 Secondary Consumer -33.8 5.6

Chapter 4: The diet of Mallard ducklings
69
Tissue Type Year Eco-regionPond
Number Trophic Level δ13C δ15NZygoptera 2003 Parkland 14 Secondary Consumer -27.4 13.4
Zygoptera 2003 Parkland 21 Secondary Consumer -28.0 16.8
Zygoptera 2003 Prairie 1 Secondary Consumer -35.0 13.0
Zygoptera 2003 Prairie 2 Secondary Consumer -26.0 13.6
Zygoptera 2003 Prairie 3 Secondary Consumer -23.0 10.1
Zygoptera 2003 Prairie 4 Secondary Consumer -24.9 9.8
Zygoptera 2003 Prairie 5 Secondary Consumer -26.0 7.4
Zygoptera 2003 Prairie 6 Secondary Consumer -18.4 9.3
Zygoptera 2003 Prairie 9 Secondary Consumer -27.6 11.4
Zygoptera 2003 Prairie 9 Secondary Consumer -26.1 10.2
Mallard Duckling liver 2001 Boreal 59 Tertiary Consumer -21.0 8.8
Mallard Duckling liver 2001 Boreal 59 Tertiary Consumer -21.5 8.2
Mallard Duckling liver 2001 Boreal 168 Tertiary Consumer -20.9 9.1
Mallard Duckling liver 2001 Boreal 168 Tertiary Consumer -24.7 1.0
Mallard Duckling liver 2002 Boreal 59 Tertiary Consumer -19.9 7.7
Mallard Duckling liver 2002 Boreal 121 Tertiary Consumer -22.6 7.3
Mallard Duckling liver 2002 Boreal 121 Tertiary Consumer -22.5 7.2
Mallard Duckling liver 2002 Boreal 48 Tertiary Consumer -20.7 7.8
Mallard Duckling liver 2002 Boreal 48 Tertiary Consumer -20.7 7.0
Mallard Duckling liver 2002 Boreal 102 Tertiary Consumer -20.9 8.5
Mallard Duckling liver 2002 Boreal 102 Tertiary Consumer -20.8 7.9
Mallard Duckling liver 2002 Boreal 37 Tertiary Consumer -21.3 6.6
Mallard Duckling liver 2002 Boreal 37 Tertiary Consumer -21.4 6.6
Mallard Duckling liver 2003 Boreal 11 Tertiary Consumer -25.3 10.4
Mallard Duckling liver 2003 Boreal 12 Tertiary Consumer -25.2 8.1
Mallard Duckling liver 2004 Boreal 1 Tertiary Consumer -31.1 7.4
Mallard Duckling liver 2004 Boreal 2 Tertiary Consumer -22.5 10.7
Mallard Duckling liver 2004 Boreal 3 Tertiary Consumer -31.0 8.8
Mallard Duckling liver 2004 Boreal 4 Tertiary Consumer -30.5 7.8
Mallard Duckling liver 2004 Boreal 5 Tertiary Consumer -31.5 6.7
Mallard Duckling liver 2004 Boreal 6 Tertiary Consumer -29.4 7.6
Mallard Duckling liver 2004 Boreal 7 Tertiary Consumer -26.1 8.8
Mallard Duckling liver 2004 Boreal 8 Tertiary Consumer -22.2 10.8
Mallard Duckling liver 2004 Boreal 9 Tertiary Consumer -17.4 12.1
Mallard Duckling liver 2004 Boreal 10 Tertiary Consumer -17.5 12.8
Mallard Duckling liver 2004 Boreal 11 Tertiary Consumer -17.5 13.3
Mallard Duckling liver 2004 Boreal 12 Tertiary Consumer -22.3 11.4
Mallard Duckling liver 2004 Boreal 13 Tertiary Consumer -21.9 10.5
Mallard Duckling liver 2004 Boreal 14 Tertiary Consumer -21.0 11.4
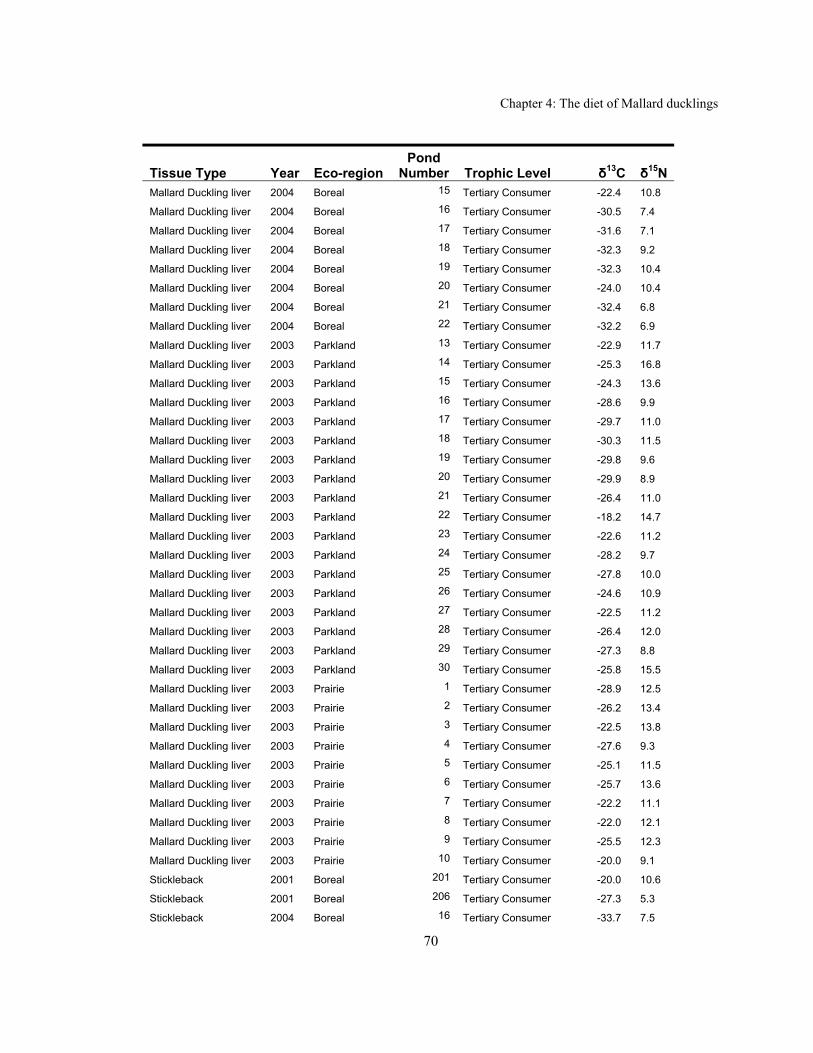
Chapter 4: The diet of Mallard ducklings
70
Tissue Type Year Eco-regionPond
Number Trophic Level δ13C δ15NMallard Duckling liver 2004 Boreal 15 Tertiary Consumer -22.4 10.8
Mallard Duckling liver 2004 Boreal 16 Tertiary Consumer -30.5 7.4
Mallard Duckling liver 2004 Boreal 17 Tertiary Consumer -31.6 7.1
Mallard Duckling liver 2004 Boreal 18 Tertiary Consumer -32.3 9.2
Mallard Duckling liver 2004 Boreal 19 Tertiary Consumer -32.3 10.4
Mallard Duckling liver 2004 Boreal 20 Tertiary Consumer -24.0 10.4
Mallard Duckling liver 2004 Boreal 21 Tertiary Consumer -32.4 6.8
Mallard Duckling liver 2004 Boreal 22 Tertiary Consumer -32.2 6.9
Mallard Duckling liver 2003 Parkland 13 Tertiary Consumer -22.9 11.7
Mallard Duckling liver 2003 Parkland 14 Tertiary Consumer -25.3 16.8
Mallard Duckling liver 2003 Parkland 15 Tertiary Consumer -24.3 13.6
Mallard Duckling liver 2003 Parkland 16 Tertiary Consumer -28.6 9.9
Mallard Duckling liver 2003 Parkland 17 Tertiary Consumer -29.7 11.0
Mallard Duckling liver 2003 Parkland 18 Tertiary Consumer -30.3 11.5
Mallard Duckling liver 2003 Parkland 19 Tertiary Consumer -29.8 9.6
Mallard Duckling liver 2003 Parkland 20 Tertiary Consumer -29.9 8.9
Mallard Duckling liver 2003 Parkland 21 Tertiary Consumer -26.4 11.0
Mallard Duckling liver 2003 Parkland 22 Tertiary Consumer -18.2 14.7
Mallard Duckling liver 2003 Parkland 23 Tertiary Consumer -22.6 11.2
Mallard Duckling liver 2003 Parkland 24 Tertiary Consumer -28.2 9.7
Mallard Duckling liver 2003 Parkland 25 Tertiary Consumer -27.8 10.0
Mallard Duckling liver 2003 Parkland 26 Tertiary Consumer -24.6 10.9
Mallard Duckling liver 2003 Parkland 27 Tertiary Consumer -22.5 11.2
Mallard Duckling liver 2003 Parkland 28 Tertiary Consumer -26.4 12.0
Mallard Duckling liver 2003 Parkland 29 Tertiary Consumer -27.3 8.8
Mallard Duckling liver 2003 Parkland 30 Tertiary Consumer -25.8 15.5
Mallard Duckling liver 2003 Prairie 1 Tertiary Consumer -28.9 12.5
Mallard Duckling liver 2003 Prairie 2 Tertiary Consumer -26.2 13.4
Mallard Duckling liver 2003 Prairie 3 Tertiary Consumer -22.5 13.8
Mallard Duckling liver 2003 Prairie 4 Tertiary Consumer -27.6 9.3
Mallard Duckling liver 2003 Prairie 5 Tertiary Consumer -25.1 11.5
Mallard Duckling liver 2003 Prairie 6 Tertiary Consumer -25.7 13.6
Mallard Duckling liver 2003 Prairie 7 Tertiary Consumer -22.2 11.1
Mallard Duckling liver 2003 Prairie 8 Tertiary Consumer -22.0 12.1
Mallard Duckling liver 2003 Prairie 9 Tertiary Consumer -25.5 12.3
Mallard Duckling liver 2003 Prairie 10 Tertiary Consumer -20.0 9.1
Stickleback 2001 Boreal 201 Tertiary Consumer -20.0 10.6
Stickleback 2001 Boreal 206 Tertiary Consumer -27.3 5.3
Stickleback 2004 Boreal 16 Tertiary Consumer -33.7 7.5

Chapter 4: The diet of Mallard ducklings
71
Tissue Type Year Eco-regionPond
Number Trophic Level δ13C δ15NStickleback 2004 Boreal 21 Tertiary Consumer -32.5 6.1
Stickleback 2003 Prairie 2 Tertiary Consumer -25.2 16.2
Stickleback 2003 Prairie 7 Tertiary Consumer -21.7 13.8
Chapter 5: Synthesis and conclusions
72
Chapter 5 Synthesis: Aquatic Invertebrates and Waterfowl Management in
Canada’s Western Boreal Forest
Prior Conclusions and Literature Review
Here I synthesize the findings of the previous chapters and relate how the results discussed
within this thesis can contribute to wetland and waterfowl management. Conclusions that can
help inform managers include:
• Mallard and Bufflehead ducklings showed a strong preference for predaceous
macroinvertebrates, specifically Dytiscidae larvae (Figures 3.1, 4.1);
• Predaceous macroinvertebrates were associated with wetlands containing aquatic
macrophytes of simple architecture (Figure 2.3); and
• The presence of Brook Stickleback (Culea inconstans) significantly decreased the
amount of biomass available to developing ducklings in the form of aquatic
invertebrates (Figure 2.2).
Coupling these results with other duckling habitat research can further define protection
and sustainability criteria. Mortality from freezing or anoxia (winterkill) is a principal
determinant of Brook Stickleback distribution in the WBF (Tonn et al. 2004); deeper water can
reduce risks of winterkill and allow stickleback populations to persist. Increased road
development and soil compaction may promote channelization of upland water flow and runoff to
wetlands. This may connect adjacent wetlands with overland flow and increase wetland depth
before freeze, resulting in colonization opportunities and increased chance of winter survival,
respectively, for stickleback. Field workers in the WBF have observed stickleback swimming up
a channel leading to a hillside seep during winter, as much as 50m away from a source wetland,
presumably to escape winterkill conditions (K. Devito, pers. comm.). Logging of upland forests
can increase phosphorus loading to wetlands and lakes within the catchment (Prepas et al. 2001).
Increased macronutrient concentrations can lead to wetland domination by Myriophyllum
exalbescens (Carpenter et al. 1998) or phytoplankton (Annadotter et al. 1999). Both these
characteristics would decrease the habitat suitability for Bufflehead and Mallard ducklings on

Chapter 5: Synthesis and conclusions
73
wetlands of the WBF by reducing prey species or by increasing water opacity. To improve
access to preferred food resources for Mallard and Bufflehead ducklings, brooding wetlands
within the WBF should (1) have clear water, (2) support moderate amounts of simple aquatic
macrophytes (preventing algal dominance; Norlin et al. 2005), (3) be fish-free, (4) have water
depths of 30 to 40 cm, and (5) not occur within deforested catchments.
Large scale considerations
At a landscape level, WBF managers may want to concentrate on the protection of wetland
complexes that are unconnected by surface flows yet maintained by groundwater (low
susceptibility to fish colonization) to support abundant invertebrate forage for ducklings, instead
of large, connected waterbodies. Small wetlands support a higher edge to open water ratio, that is
important for waterfowl (Murkin et al. 1997), and are generally shallower, thereby promoting
submerged macrophyte growth and fish winterkill. Predaceous diving beetles are capable of
tolerating a wide range of adverse environmental conditions as adults, relative to other
invertebrates (Minakawa et al. 2001), because of their sealed exoskeleton and utilization of
atmospheric oxygen for respiration (as opposed to adsorption from aqueous medium over a gill
structure). Dytiscidae larvae seem to be more susceptible to environmental variation, their
abundance decreases as sedimentation from runoff increases (Martin and Neely 2001). The
paucity of information specific to this group of macroinvertebrates prevents the demarcation of a
definitive range of environmental tolerances. If dytiscid beetle abundance is used to imply
Mallard breeding habitat quality, it is important to sample dytiscid larvae, as opposed to adults
whose augmented dispersal capability allows for their presence in what could be sub-optimal
habitat. Further, to accurately assess a wetland’s suitability for dytisicids, the determination
whether or not they are breeding there (with the resultant recruitment of new individuals) is
important, as this is the most susceptible life stage (Inoda and Kamimura 2004).
The WBF’s already significant role in supplying breeding habitat for North American
waterfowl will probably increase for those species that now preferentially breed in the Prairie
Pothole Region (PPR). Breeding wetlands of the PPR have been significantly reduced, largely
through a combination of drought and the farming of marginal cropland. Drought conditions in
the late 1980’s through to the early 1990’s, and locally in southern Alberta during the early
Chapter 5: Synthesis and conclusions
74
2000’s, severely reduced overall waterfowl numbers (Canadian Wildlife Service Waterfowl
Committee 2004) and the Mallard population (Bethke and Nudds 1995).
Global warming models predict that warming and drying in the PPR will drastically reduce
the number of prairie breeding waterfowl over the next 60 years (Sorenson et al. 1998, Warren
2004). This could result in a greater proportion of North American Mallard populations
originating in boreal wetlands, as a result of an increased growing season in northern climates and
habitat loss in the PPR.
The Application of Optimal Foraging Theory to Ducklings
Ducklings from the boreal included fewer types of invertebrate prey in their diets (Chapter
4). Predictions from optimal foraging theory hold that diet breadth will contract when highly
ranked food is readily available and abundant, and expand when it is not. I conclude that Mallard
broods are not limited by food availability in the WBF, as proposed for the nutrient-poor
Fennoscadian wetlands (Sjöberg et al. 2000). This indicates that factors other than duckling food
availability (most likely limited chances for renesting, hen food availability, or inclement
weather; see below) dictate the breeding Mallard numbers in the WBF. Even after considering
other factors, the WBF currently plays a large role in the maintenance and sustainability of
Mallard populations.
Waterfowl scientists have speculated that reduced waterfowl recruitment on northern
wetlands was due to the “lower wetland productivity” (Rogers 1964, Pospahala et al. 1974,
Cowardin et al. 1985). Overall (year-long) invertebrate production in southern locales is almost
certainly greater, yet during the brooding season northern wetlands seem to have more available
invertebrate resources for ducklings (Figure 4.3). The results found here are not consistent with
Bethke and Nudds’ (1993) assertion that boreal habitats have low resource production during the
brooding season and therefore support fewer waterfowl species. I suggest the reduced abundance
of waterfowl is influenced more by the length of the brooding season and reduced opportunities
for re-nesting attempts.
Research Needs
Mallard duckling preference for particular invertebrate groups on wetlands within the
boreal plain is well defined here. How does the composition and abundance of those invertebrate

Chapter 5: Synthesis and conclusions
75
groups preferred by ducklings change when exposed to anthropogenic disturbance like upland
forest clearing, oil well-site construction, or road development within the catchments? As the
Utikuma area is subjected to additional, and substantial, energy sector development and large-
scale forestry, the same wetlands surveyed throughout this study could be revisited to quantify the
effects of these practices.
Are available habitats in the WBF fully occupied by breeding Mallards? Chapter 4
provides evidence that the productive wetlands of the WBF satisfy the dietary needs of ducklings.
Empirical evidence to answer the above question is lacking, yet important factors such as
competitive interactions, tolerance to inclement weather, or the influence of predators could be
compared between their preferred habitat and the WBF. These questions are important if the
WBF’s relative contribution to duck populations increases.
Comparisons of spatial differences in breeding waterfowl numbers on both the WBF and
PPR are a logical progression for further ecological study. First, more information is needed to
understand the factors influencing migration between these two regions. I compare the WBF and
PPR habitat characteristics and resources, yet it is not clear if these factors direct the abundance
and distribution of breeding waterfowl on a regional scale.
To isolate local resource factors as the causal mechanism for waterfowl distribution
requires a working model that quantifies the “overflight” hypothesis. Although this concept is
touted as an important dispersal mechanism, and implicated when local breeding numbers
fluctuate, analysis of redistribution is difficult. Researchers have worked to answer large-scale
questions regarding continental waterfowl distribution (see Bethke and Nudds 1993, 1995 for
example). The necessary information to rigorously explore this issue exist in long-term
waterfowl data-sets (Canadian Wildlife Service Waterfowl Committee 2004) the quality of which
are being consistently improved (Ducks Unlimited initiative as part of H.E.A.D. study); new
sophisticated remote sensing techniques can accurately track waterfowl over local habitats (Pinsat
Discovery for Recovery initiative) and advanced modeling techniques could investigate
waterfowl distribution as related to changing environmental conditions (Sorenson et al. 1998).
The exchange of waterfowl between the WBF and the PPR has important ramifications for
waterfowl densities in the boreal, for the evaluation of the WBF’s role in sustaining continental
waterfowl populations, and especially for the interpretation of data from this region.
Chapter 5: Synthesis and conclusions
76
Literature Cited
Annadotter, H., G. Cronberg, R. Aagren, B. Lundstedt, P. Nilsson and S. Stroebeck. 1999.
Multiple techniques for lake restoration. Hydrobiologia, 395/396: 77-85.
Bethke, R. W. and T. D. Nudds. 1993. Variation in the diversity of ducks along a gradient of
environmental variability. Oecologia, 93: 242-250.
Bethke, R. W. and T. D. Nudds. 1995. Effects of climate change and land use on duck abundance
in Canadian prairie-parklands. Ecological Applications, 5: 588-600.
Canadian Wildlife Service Waterfowl Committee. 2004. Population Status of Migratory Game
Birds in Canada: November 2004. CWS Migratory Birds Regulatory Report Number 13.
Carpenter, S. R., E. van Donk and R. G. Wetzel. 1998. Nutrient-loading gradient in shallow lakes:
report of the group discussion. pp. 393-396 In E. Jeppesen, M. Søndergaard, M.
Søndergaard and K. Christoffersen (eds.) The Structuring Role of Submerged Macrophytes
in Lakes. Springer, NY, USA.
Cowardin, L. M., D. S. Gilmer and C. W. Shaiffer. 1985. Mallard recruitment in the agricultural
environment of North Dakota. Wildlife Monographs, 92: 1-37.
Inoda, T. and S. Kamimura. 2004. New open aquarium system to breed larvae of water beetles
(Coleoptera: Dytiscidae). Coleopterists Bulletin, 58: 37-43.
Martin, D.C. and R. K. Neely. 2001. Benthic macroinvertebrate response to sedimentation in a
Typha angustifolia L. wetland. Wetlands Ecology and Management, 9: 441-454.
Minakawa, N., K. L. Kurowski and M. Yabe. 2001. Salinity tolerance of the diving beetle
Hygrotus impressopunctatus (Coleoptera: Dytiscidae) and its implication for insect
dispersal. Entomological Science, 4: 393-397.
Murkin, H. R., E. J. Murkin and J. P. Ball. 1997. Avian habitat selection and prairie wetland
dynamics: a 10-year experiment. Ecological Applications, 7: 1144-1159.
Norlin, J. I, S. E. Bayley and L. M. Ross. 2005. Submerged macrophytes, zooplankton and the
predominance of low- over high-chlorophyll states in western boreal, shallow-water
wetlands. Freshwater Biology 50: 868-881.

Chapter 5: Synthesis and conclusions
77
Pinel-Alloul, B., E. Prepas, D. Planas, R. Steedman and T. Charette. 2002. Watershed Impacts of
Logging and Wildfire: Case Studies in Canada. Lake and Reservoir Management, 18: 307-
318.
Prepas, E. E., B. Pinel-Alloul, D. Planas, G. Méthot, S. Paquet and S. Reedyk. 2001. Forest
harvest impacts on water quality and aquatic biota on the Boreal Plain: introduction to the
TROLS lake program. Canadian Journal of Fisheries and Aquatic Sciences, 58: 421–436.
Pospahala, R. S., D. R. Anderson and C. J. Henny. 1974. Populations ecology of the mallard II.
Breeding habitat conditions, size of the breeding populations, and population indicies. U. S.
Fish and Wildlife Service Res. Publ., 115.
Rogers, J. P. 1964. Effect of drought on reproduction of lesser scaup. Journal of Wildlife
Management, 28: 213-222.
Sjöberg, K., H. Pöysä, J. Elmberg and P. Nummi. 2000. Response of mallard ducklings to
variation in habitat quality: An experiment of food limitation. Ecology, 81: 329-335.
Sorenson, L.G., R. Goldberg, T. L. Root and M. G. Anderson. 1998. Potential effects of global
warming on waterfowl populations breeding in the Northern Great Plains. Climatic
Change, 40: 343-369.
Tonn, W. M, P. W. Langlois, E. E. Prepas, A. J. Danylchuk and S. M. Boss. 2004. Winterkill
cascade: indirect effects of a natural disturbance on littoral macroinvertebrates in boreal
lakes. Journal of the North American Benthological Society, 23: 237-250.
Warren, F. J. 2004. Climate Change Impacts and Adaptation: A Canadian Perspective. Natural
Resources Canada, the Government of Canada, Ottawa.


![2014.09.30 - Robert Hornung - Wind Energy [v4]](https://static.fdocuments.net/doc/165x107/61f568bf9f41b52d3c25c781/20140930-robert-hornung-wind-energy-v4.jpg)
