Title of Dissertation / Thesis: DESIGN OF ONLINE AUCTION - DRUM
83
shree ABSTRACT Title of Dissertation / Thesis: DESIGN OF ONLINE AUCTION SYSTEM WITH ALTERNATIVE CURRENCIES Vainateya Suresh Deshpande, Master of Science in Business Administration, May 2004 Dissertation / Thesis Directed By: Professor Henry Lucas Jr. Decision and Information Technologies, Robert H. Smith School of Business The University of Maryland has one of the most popular Basketball programs in the region. About 35,000 students seek 4,000 free student tickets allocated for every home game. An auction-based system provides a procedure to achieve and equitable and fair distribution of a high-demand resource. In an auction-based system, goods being sold end up with the person who values them the most. This is a very desirable scenario for a ticket distribution system that aims at maximizing attendance for home games. People who bid high have high values for the tickets and are more likely to attend a game than someone who receives a ticket through a random draw. The thesis lays out the framework for an auction based system to distribute home game tickets.
Transcript of Title of Dissertation / Thesis: DESIGN OF ONLINE AUCTION - DRUM
shree
ABSTRACT
Title of Dissertation / Thesis: DESIGN OF ONLINE AUCTION SYSTEM
WITH ALTERNATIVE CURRENCIES
Vainateya Suresh Deshpande, Master of Science in Business Administration, May 2004
Dissertation / Thesis Directed By: Professor Henry Lucas Jr. Decision and Information Technologies, Robert H. Smith School of Business
The University of Maryland has one of the most popular Basketball programs
in the region. About 35,000 students seek 4,000 free student tickets allocated for
every home game. An auction-based system provides a procedure to achieve and
equitable and fair distribution of a high-demand resource. In an auction-based system,
goods being sold end up with the person who values them the most. This is a very
desirable scenario for a ticket distribution system that aims at maximizing attendance
for home games. People who bid high have high values for the tickets and are more
likely to attend a game than someone who receives a ticket through a random draw.
The thesis lays out the framework for an auction based system to distribute
home game tickets.

DESIGN OF A ONLINE AUCTION SYSTEM WITH ALTERNATIVE CURRENCIES
by
Vainateya Suresh Deshpande
Thesis submitted to the Faculty of the Graduate School of the University of Maryland, College Park, in partial fulfillment
of the requirements for the degree of Master of Science in Business Administration
2004
Advisory Committee:
Professor Henry Lucas Jr., Chair Professor Gnana “Anand” Anandalingam Assistant Professor Siva Viswanathan

© Copyright by
Vainateya Suresh Deshpande
2004
ii
PREFACE
The Diamondback, the University of Maryland’s independent student
newspaper, carried the headline – “ First at Last” on April 2, 2002. The men’s
basketball team had won its first national title in school history by defeating the
Indiana Hoosiers by 64-52.
Maryland Basketball had completed its slow trudging journey from being under
NCAA sanctions a decade ago to being a team of national repute. During this time the
popularity of the athletics program soared - almost 10,000 fans turned out to celebrate
the victory in College Park, thousands more celebrated at different venues.
The newfound status and popularity also presented new problems like crowd
control, ticket distribution and ticket control. The old system of ticket distribution
proved to be not only ineffective but also perilous to life and property. Thousands of
students camped out in sub-zero temperatures outside the Cole Field House, waiting
for the ticket offices to start the distribution of 4000 free student tickets. The resulting
scuffles and chaos proved to be a risk most fans were not willing to take.
In the fall semester of 2002, the athletic department moved to the Comcast
Center – the new multi-million dollar home for Maryland Basketball. The
improvement in the ticket allocation system did not, unfortunately, match the
improvement in other facilities. The purpose of this thesis is to propose an alternate
method that would help meet the objectives of a student ticket allocation system
better.
The investigation and prototype implementation for the system was conducted
under the aegis of the Center for Electronic Markets and Enterprises, at the Robert
iii
Smith School of Business. The purpose of the Center on Electronic Markets and
Enterprises (CEME) is to sponsor multidisciplinary research on how the networked
economy is transforming markets and businesses. Information technology (IT) makes
possible new markets and business models. The Center sponsors research, which
explores the factors, associated with the success and failure of these new models, the
impact of new markets and businesses on the economy, and the design of new kinds
of organizations. The focus of the Center is on publishable research about electronic
markets and enterprises, and faculty associated with the Center have areas of
expertise which include the study of auction markets, agent technology,
telecommunications, applied economics, market design, systems theory, pricing, and
organization theory among others.
This document begins with a discussion of the current system to allocate
student tickets. The next chapter includes information collected through interviews of
various officials of the athletic department. These interviews provided tremendous
information regarding the operation of the current system and the objectives that the
newer system should meet. The following chapters the online auction system in
detail.
The last chapter appraises the new system and gives details about the
prototype implementation.

iv
DEDICATION
To my Parents

v
ACKNOWLEDGEMENTS
Thanks to Prof. Hank Lucas, Prof. Anand Anandalingam and Prof.
Viswanathan for their support; who answered all my questions, no matter how stupid,
with patience.
Thanks to Prof. Michael Ball for his inputs; Nathan Larson for catching my
errors and correcting my ideas.
vi
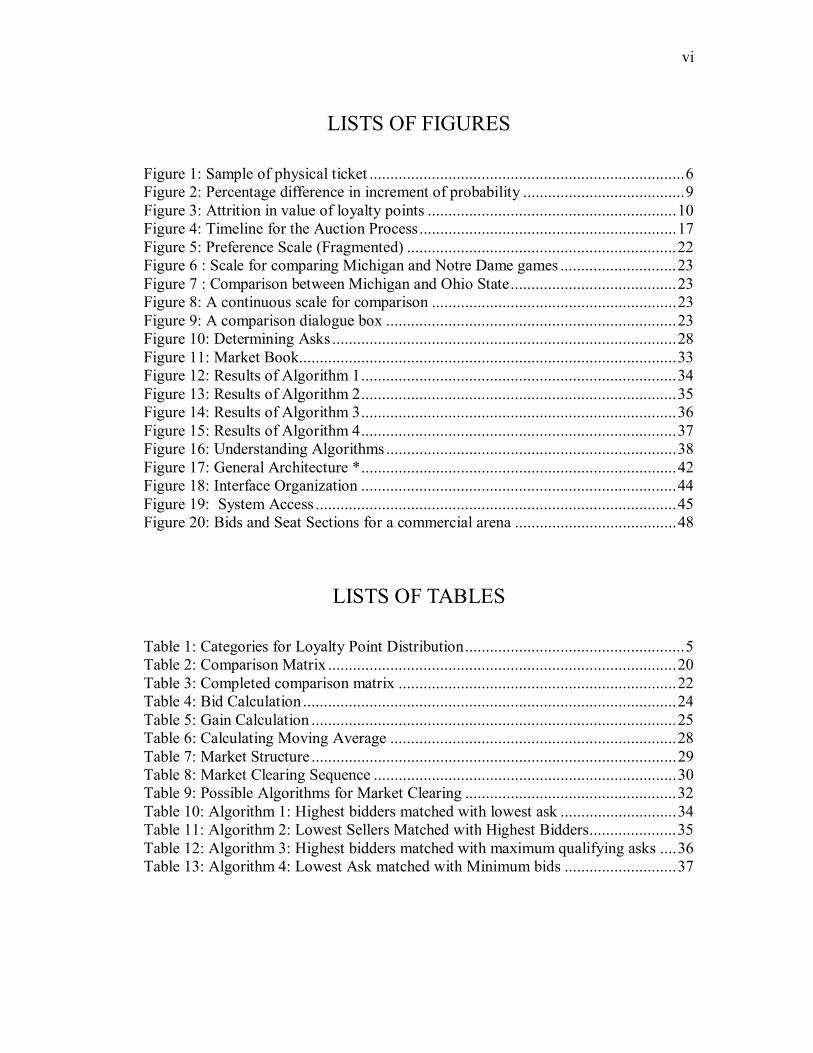
LISTS OF FIGURES
Figure 1: Sample of physical ticket ............................................................................6 Figure 2: Percentage difference in increment of probability .......................................9 Figure 3: Attrition in value of loyalty points ............................................................10 Figure 4: Timeline for the Auction Process..............................................................17 Figure 5: Preference Scale (Fragmented) .................................................................22 Figure 6 : Scale for comparing Michigan and Notre Dame games ............................23 Figure 7 : Comparison between Michigan and Ohio State........................................23 Figure 8: A continuous scale for comparison ...........................................................23 Figure 9: A comparison dialogue box ......................................................................23 Figure 10: Determining Asks ...................................................................................28 Figure 11: Market Book...........................................................................................33 Figure 12: Results of Algorithm 1............................................................................34 Figure 13: Results of Algorithm 2............................................................................35 Figure 14: Results of Algorithm 3............................................................................36 Figure 15: Results of Algorithm 4............................................................................37 Figure 16: Understanding Algorithms......................................................................38 Figure 17: General Architecture *............................................................................42 Figure 18: Interface Organization ............................................................................44 Figure 19: System Access .......................................................................................45 Figure 20: Bids and Seat Sections for a commercial arena .......................................48
LISTS OF TABLES
Table 1: Categories for Loyalty Point Distribution.....................................................5 Table 2: Comparison Matrix ....................................................................................20 Table 3: Completed comparison matrix ...................................................................22 Table 4: Bid Calculation ..........................................................................................24 Table 5: Gain Calculation ........................................................................................25 Table 6: Calculating Moving Average .....................................................................28 Table 7: Market Structure ........................................................................................29 Table 8: Market Clearing Sequence .........................................................................30 Table 9: Possible Algorithms for Market Clearing ...................................................32 Table 10: Algorithm 1: Highest bidders matched with lowest ask ............................34 Table 11: Algorithm 2: Lowest Sellers Matched with Highest Bidders.....................35 Table 12: Algorithm 3: Highest bidders matched with maximum qualifying asks ....36 Table 13: Algorithm 4: Lowest Ask matched with Minimum bids ...........................37

vii
TABLE OF CONTENTS
LISTS OF FIGURES vi
LISTS OF TABLES vi
Chapter 1: The Current Ticket Distribution System 1
Introduction ...........................................................................................................1 The Setting ............................................................................................................1 Overview of the system .........................................................................................2
Loyalty / Attendance Points ..........................................................................................2 The Process ...........................................................................................................3
Loyalty Distribution System .........................................................................................5 Ticket Distribution and Game Day Rules ...............................................................6 Appraisal of Objectives..........................................................................................8
#1: A Question of Rewards ...........................................................................................8 #2: Changing Value of Loyalty Points ..........................................................................9 #3: Incentives to attend a game ...................................................................................10 #4: A question of luck, not loyalty ..............................................................................11
Student Strategy...................................................................................................11
Chapter 2: An Auction Based System: Primary Market 13 Introduction .........................................................................................................13 Advantages of the proposed Auction Based System.............................................13 Policies for awarding and penalizing students ......................................................15 System Basics......................................................................................................16 Timeline ..............................................................................................................18 1st Round: Primary Market...................................................................................19
Recording Student preferences and calculating bids ....................................................19 Clearing the Market .............................................................................................24 Gain Calculation..................................................................................................25
Chapter 3: An Auction Based System: Secondary Market 26
Introduction .........................................................................................................26 Selling Price of Tickets in the second round.........................................................27 Market Structure and Clearing Sequence..............................................................29 Market Clearing Mechanisms ..............................................................................32
Algorithm 1: Highest Bid ↔ Min (Qualifying Ask) ....................................................34 Algorithm 2: Lowest Ask ↔ Max (Qualifying Bid) ....................................................35 Algorithm 3: Highest Bid ↔ Max (Qualifying Ask)....................................................36 Algorithm 4: Lowest Ask ↔ Min (Qualifying Bid).....................................................37
Selecting the Best Mechanism .............................................................................38 Economic Theory ................................................................................................40 Loyalty Points......................................................................................................41
viii
Chapter 4: Going Ahead 42
Introduction .........................................................................................................42 The Prototype ......................................................................................................42 The Full-Fledged System.....................................................................................45 Porting the System...............................................................................................47 Conclusion...........................................................................................................49
APPENDIX A: Wharton MBA Auctions 51
APPENDIX B: Analytic Hierarchy Process 57
APPENDIX C: The Print-on-Demand Page (modified to fit the page) 60
APPENDIX D: Ticketing Policy (Current as on Feb 25th 2004) 61
Bibliography 73

1
Chapter 1: The Current Ticket Distribution System
Introduction
Beginning Fall 02 the athletic department introduced an online lottery-based
system to distribute student tickets; 4000 tickets for basketball games and 10,000
tickets for football games. Other university sports were not included in this system.
The ticketing policy, which is available on the ticketing web page
(www.tickets.umd.edu), proved to be a good source of information to understand the
system. The ticket policy is attached as an APPENDIX D. Based on analysis of the
ticketing policy and interviews with officials from the ticketing office the following
objectives for the system were outlined:
1) The system should be accessible, safe and fair to all students.
2) The system should award students who are most loyal.
3) The system should maximize attendance at all games.
4) Students should not have to pay for the seat
The Setting
Of the 17,950 seats in the Comcast Center, the Athletic Department sets aside
4,000 seats for the registered students of the University, 2,600 of these seats occupy
the first ten rows whereas the other 1,400 are located behind the visiting team’s
second half basket. (Diamond Back Archives – “Enter the Comcast Center” – Oct
14th 2002). These seats constitute what is known as the “students section” in the
Comcast Center. The tickets to this section are available free of charge to College

2
Park campus students who pay the athletic fee. Students from satellite campuses like
Shady Grove are eligible for these tickets if they pay the athletic fee.
Overview of the system
The current ticket allocation system is the two-stage process. The first stage is
mandatory and lets the athletic department gauge the demand for a particular game. If
the demand for seats is greater than the supply then the winners are selected using a
lottery– this is called the Loyalty Distribution System. However, before we discuss
the system in detail let us understand the “currency” that it uses.
Loyalty / Attendance Points
The current ticket distribution system uses Loyalty points as means of
awarding students for consistent support of the home team. Every student has a
loyalty point account that is incremented when he / she attends a home game. The
more loyalty points a student has the more entries he / she gets in the lottery, thus
increasing his / her probability of getting a ticket for next games in the season. In
addition, the amount of loyalty points earned by a student governs the group
allocation if a student wins a ticket. We will discuss these aspects later.
Loyalty Points are also used to penalize a student for failing to attend a game
for which he / she owns a ticket. Loyalty points are added and / or deducted in
accordance to the following rules:
Rule 1: Student attends a game (Award Loyalty Points)
(a) If a lottery was required for the game then loyalty points awarded = 1
(b) If the lottery stage was not reached then loyalty points awarded = 2

3
(c) If the game is played during the universities official winter break = 1
Rule 2: Student fails to attend a game (Deduct Loyalty Points)
(a) If the student returns the ticket before 12.00 pm one day prior to the game
then loyalty points deducted = 0
(b) If the student returns the ticket after 12.00 pm one day prior to the game
then loyalty points deducted = 1
(c) If the student does not return the ticket then loyalty points deducted = 2
At the beginning of every academic year the each loyalty point account is
reset to zero. Loyalty points are game specific. Thus, loyalty points gained by
attending football games can only be used for football game lotteries. The same
applies to loyalty points earned by attending basketball games.
The Process
The process starts when a student registers for a game that he /she wishes to
attend. This can be accomplished online during the two day registration period for
each game. Information about the registration and claim period is available online.
Students use their campus email address and UMCP ID barcode number to log into
their account. Registration initiates the first stage of the process. There are two
possible outcomes at the end of the registration period:
Before we proceed
Let,
R be the total number of students registered for a particular game.
S be the number of seats available in the student section,
S = 4,000 for basketball games;

4
T be the actual number of tickets picked up by the students
Case 1: R =< S (these will be referred to as Low Demand Games)
The total number of registered students is less than or equal to the
number to student section tickets available. Every registered student is allotted
a ticket that has to be claimed by the student within the stipulated two-day
claim period. This can be done by either printing the ticket from the ticketing
website or by collecting a physical ticket from the ticket office. The excess
tickets (S-R) are then offered to students who did not register for the game. If
a registered student fails to collect the ticket allotted to him / her, this ticket is
then added to the pool of tickets available to the non-registered students. Thus
total number of tickets available to non-registered students after the end of the
two (2) day claim period is equal to ((S-R)+(R-T)) = (S-T).
The ticket distribution process ends after the first stage without
initiating the second stage, the loyalty distribution system.
Case 2: R > S (these will be referred to as High Demand Games)
The total number of registered students is greater than the total number
of student tickets available. The process now enters the second stage of the
distribution process – the Lottery. The details of this process are discussed in
the next section: Loyalty Distribution System.
5
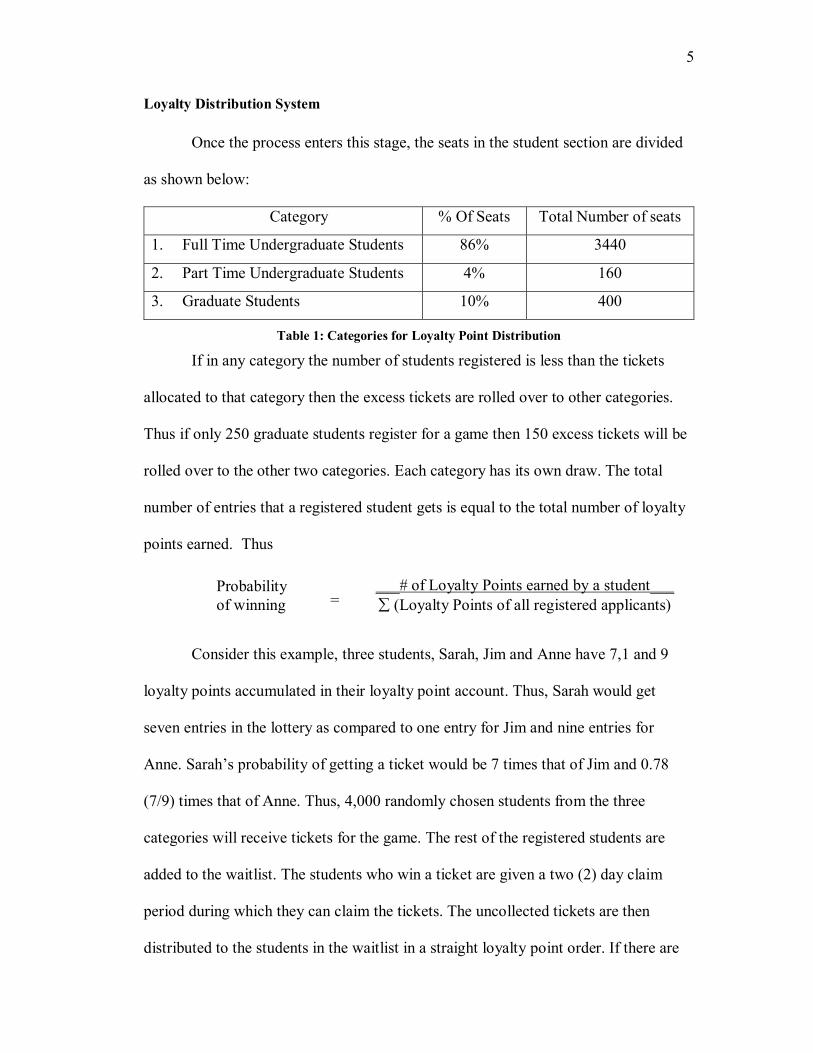
Loyalty Distribution System
Once the process enters this stage, the seats in the student section are divided
as shown below:
Category % Of Seats Total Number of seats
1. Full Time Undergraduate Students 86% 3440
2. Part Time Undergraduate Students 4% 160
3. Graduate Students 10% 400
Table 1: Categories for Loyalty Point Distribution
If in any category the number of students registered is less than the tickets
allocated to that category then the excess tickets are rolled over to other categories.
Thus if only 250 graduate students register for a game then 150 excess tickets will be
rolled over to the other two categories. Each category has its own draw. The total
number of entries that a registered student gets is equal to the total number of loyalty
points earned. Thus
Consider this example, three students, Sarah, Jim and Anne have 7,1 and 9
loyalty points accumulated in their loyalty point account. Thus, Sarah would get
seven entries in the lottery as compared to one entry for Jim and nine entries for
Anne. Sarah’s probability of getting a ticket would be 7 times that of Jim and 0.78
(7/9) times that of Anne. Thus, 4,000 randomly chosen students from the three
categories will receive tickets for the game. The rest of the registered students are
added to the waitlist. The students who win a ticket are given a two (2) day claim
period during which they can claim the tickets. The uncollected tickets are then
distributed to the students in the waitlist in a straight loyalty point order. If there are
Probability of winning
___# of Loyalty Points earned by a student___ ∑ (Loyalty Points of all registered applicants) =
6
some tickets leftover from the Loyalty distribution then these are available for
students to print on demand or pick up at the ticket office.
Ticket Distribution and Game Day Rules
After each round, the students are informed about their status for the game by
email. Students who have not won tickets are informed that they have been placed on
a waitlist. Students who win tickets are asked to collect their tickets. There are two
ways student can get a physical tickets he /she has won:
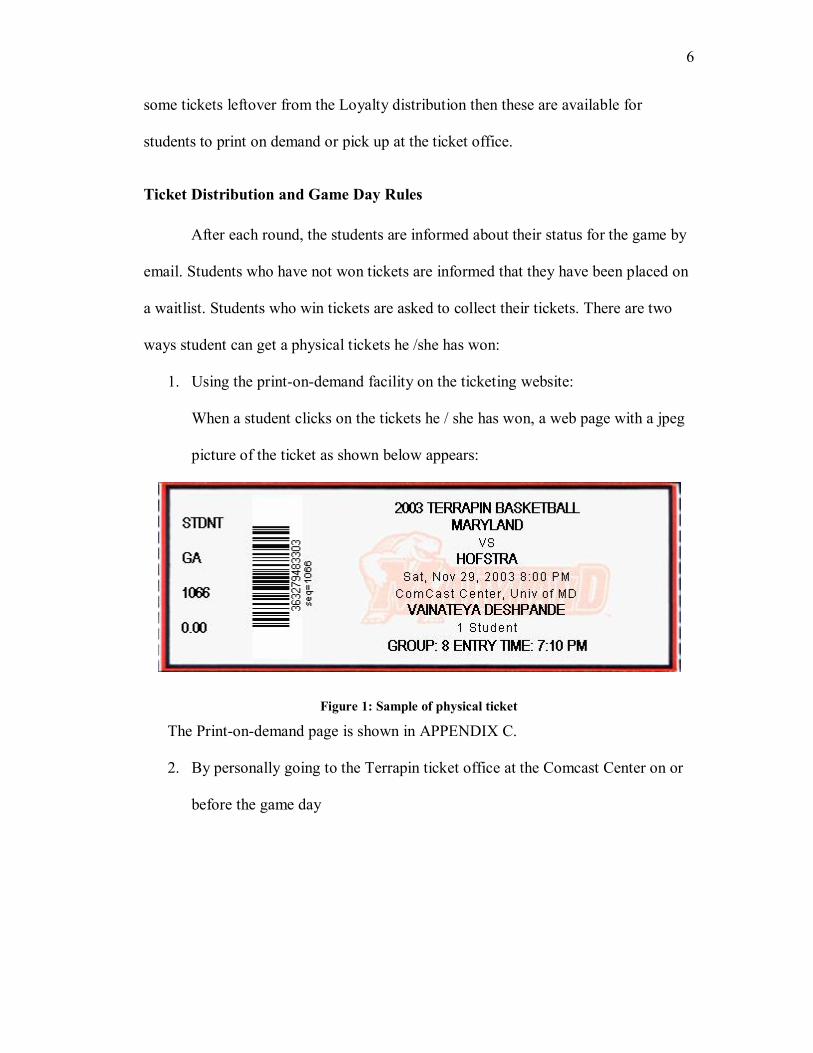
1. Using the print-on-demand facility on the ticketing website:
When a student clicks on the tickets he / she has won, a web page with a jpeg
picture of the ticket as shown below appears:
Figure 1: Sample of physical ticket
The Print-on-demand page is shown in APPENDIX C.
2. By personally going to the Terrapin ticket office at the Comcast Center on or
before the game day

7
The physical ticket as shown in figure 1 has the following information:
1. Game Information: This is found on the top right hand side of the ticket stub.
It includes the date, time and location of the game as well as the name of the
opposition team. Thus, the ticket shown above is for Maryland Basketball
game versus Hofstra on Saturday, November 29 2003, at 8:00 PM. The game
will be played at the Comcast Center at the University of Maryland.
2. Student name, quantity and type of ticket are printed below this
information. The ticket bears my name (Vainateya Deshpande) and the line “
1 Student” indicates that this is a single ticket for the students’ section.
3. The Group number (8) and entry time (7:10 pm) indicate that I have been
allocated to Group 8 in the student section and that this group will be allowed
to enter the arena at 7:10 pm. Thus, groups 1 through 7 will enter the arena
before me to occupy seats closer to court. Group allocation is based on total
number of loyalty points in the students account. Thus if I had more loyalty
points I could have been assigned to, lets say, group 3 instead of eight. This
would mean I would have entered the arena earlier and could get a seat much
closer to the court.
4. The face of the ticket also bears a unique barcode that links the ticket to the
student. At the point of entry, the bar code is scanned and the student has to
present a valid UMCP ID. Visual verification allows for positive identification
of the student, thus thwarting any chance of identity theft. The scanning
process also registers the students’ presence at the game thus adding loyalty
points to the student account.

8
Appraisal of Objectives
The new online system was overwhelmingly successful in making the system
equally accessible and safe for all students irrespective of size and willingness to
stampede. By taking the system online, the Athletics department eliminated the need
for queuing and rushing for tickets. To what extent the current system meets the
other, albeit more important, objectives can be judged by discussing a few issues.
#1: A Question of Rewards
Awarding students who are loyal to university athletics is one of the
objectives of the ticket distribution system. Since the ticket distribution system
operates with loyalty points, which are not redeemable outside the system, it is
important that the system is designed to allow students to use loyalty points directly.
However, the current system does not allow that.
Irrespective of how many loyalty points a student has gained he /she will be
subjected to the lottery. Increasing the total number of loyalty points simply increases
the probability that a student wins a ticket. Therefore, the real reward for loyalty is
the increased probability of winning a ticket for the next high demand game. This can
be measured as a percentage change in probability. Let us consider a hypothetical
case:
Sarah, a junior, has earned seven loyalty points in previous games. Jim, a
sophomore, has gained two loyalty points from a low demand game that he attended
at the beginning of the season. Both attend the next low demand game against Hofstra
to gain two loyalty points. The next game they both register for is a high demand
9
game and exactly 4001 students register for tickets. How do the 2 points gained in the
game against Hofstra help them?
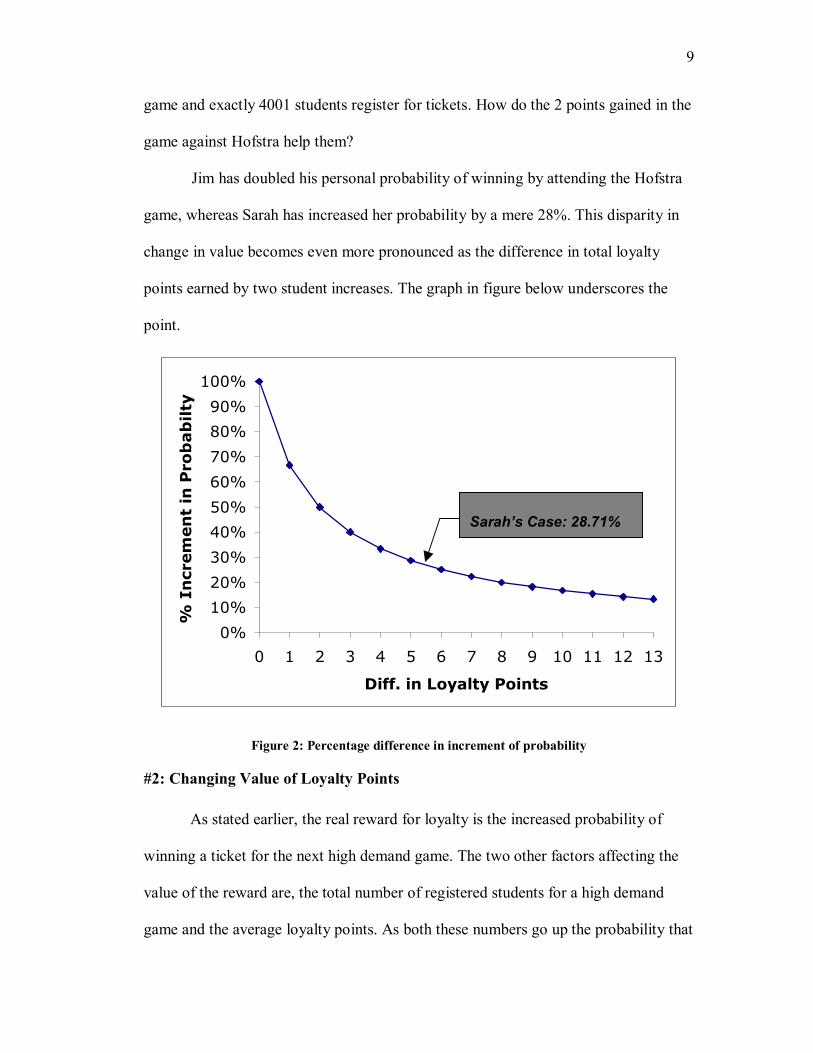
Jim has doubled his personal probability of winning by attending the Hofstra
game, whereas Sarah has increased her probability by a mere 28%. This disparity in
change in value becomes even more pronounced as the difference in total loyalty
points earned by two student increases. The graph in figure below underscores the
point.
0%
10%
20%
30%
40%
50%
60%
70%
80%
90%
100%
0 1 2 3 4 5 6 7 8 9 10 11 12 13
Diff. in Loyalty Points
% I
ncr
em
en
t in
Pro
bab
ilty
Figure 2: Percentage difference in increment of probability
#2: Changing Value of Loyalty Points
As stated earlier, the real reward for loyalty is the increased probability of
winning a ticket for the next high demand game. The two other factors affecting the
value of the reward are, the total number of registered students for a high demand
game and the average loyalty points. As both these numbers go up the probability that
Sarah’s Case: 28.71%

10
a student gets a ticket decreases. The attrition in probability of winning is shown in
the figure below:
Cumulative Loss of Value
0%10%20%30%40%50%60%70%80%90%
100%
4001
4501
5001
5501
6001
6501
7001
7501
8001
8501
9001
9501
10001
Number of Entries
% A
ttri
tio
n
Figure 3: Attrition in value of loyalty points
#3: Incentives to attend a game
Maximizing attendance for games is the third and probably the most important
objective of the ticket distribution system. The attendance for any game of the season
is the function of the popularity of the match up. Lets consider two games for men’s
basketball against Hofstra and the other is against Pepperdine. Both the matches are
low demand games, though the game against Hofstra is expected to attract more
students than the game against Pepperdine. The current system awards two loyalty
points for each of the game. Thus, no additional incentives are provided for the
Pepperdine game to account for the lower demand.
The process allows the athletic department to gauge the demand for every game. This
information should be used to provide additional incentives for low demand games.
11
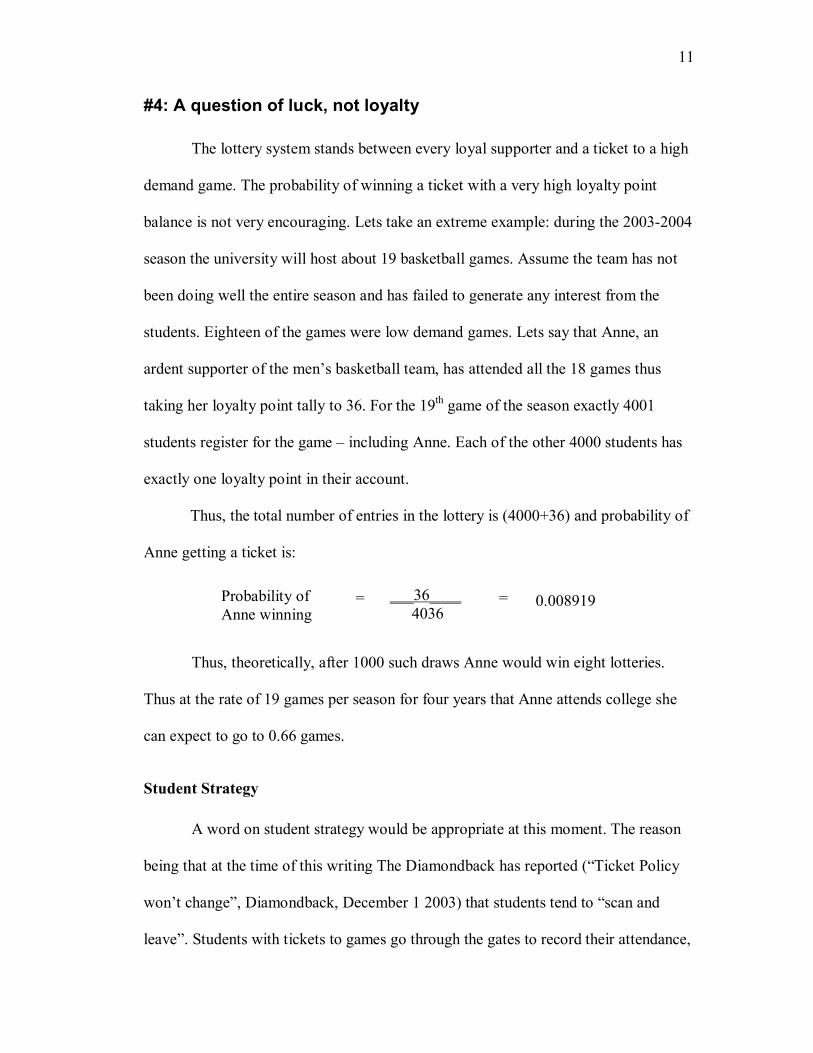
#4: A question of luck, not loyalty
The lottery system stands between every loyal supporter and a ticket to a high
demand game. The probability of winning a ticket with a very high loyalty point
balance is not very encouraging. Lets take an extreme example: during the 2003-2004
season the university will host about 19 basketball games. Assume the team has not
been doing well the entire season and has failed to generate any interest from the
students. Eighteen of the games were low demand games. Lets say that Anne, an
ardent supporter of the men’s basketball team, has attended all the 18 games thus
taking her loyalty point tally to 36. For the 19th game of the season exactly 4001
students register for the game – including Anne. Each of the other 4000 students has
exactly one loyalty point in their account.
Thus, the total number of entries in the lottery is (4000+36) and probability of
Anne getting a ticket is:
Thus, theoretically, after 1000 such draws Anne would win eight lotteries.
Thus at the rate of 19 games per season for four years that Anne attends college she
can expect to go to 0.66 games.
Student Strategy
A word on student strategy would be appropriate at this moment. The reason
being that at the time of this writing The Diamondback has reported (“Ticket Policy
won’t change”, Diamondback, December 1 2003) that students tend to “scan and
leave”. Students with tickets to games go through the gates to record their attendance,
Probability of Anne winning
___36____4036
= 0.008919 =

12
gain loyalty points, and leave the arena. The athletic department also has reported 900
no-shows on an average for basketball games this season. The reason for this problem
can be traced back to our earlier discussion regarding the real reward for attending a
game: increased probability of winning a ticket. The best strategy for any student to
win a ticket to a high demand game is to maximize his / her loyalty point tally. In
order to execute this strategy a student will register for every game irrespective of
interest. If the student wins a ticket to a game that is of no interest then the student
will at least try to gain loyalty points by showing up at the gates, scanning his /her
ticket and leaving. The other option, which actually goes against the strategy, is not to
show up.
This observation actually brings up a very important flaw in the system: the
inability for students to have any control over which games they would like to attend.
By limiting the role of students to registering for tickets, the current system fails to
record and use any personal game preference information. This also impedes the
athletic department’s ability to provide proportional incentives. In conclusion it can
be said that the current system is safe and accessible to all students and Loyalty
Points are an excellent substitute for money. The concept of entry groups is also a
good idea, in terms of not only awarding loyal students but also crowd management
at the venue. The success of the system in meeting other goals like fairness is
debatable.

13
Chapter 2: An Auction Based System: Primary Market
Introduction
An auction based ticket distribution system is discussed in this chapter. This
system eliminates the entire lottery based ticket allocation and provides the students
the opportunity to select and bid on games that they wish to see. The system would be
just as accessible through the Internet as the current system and would use loyalty
points as its currency. The concept of Entry groups is also carried over and will be
used in this system.
Advantages of the proposed Auction Based System
The advantage of an auction system over a lottery system is that goods being
sold end up with the person who values them the most. This is a very desirable
scenario for a ticket distribution system that aims at maximizing attendance for home
games. People who bid high have high values for the tickets and are more likely to
attend a game than someone who receives a ticket through a random draw.
The current system does not take into account student preferences while
deciding ticket allocation. Using an auction-based system affords more control to
students over which games they attend. This would allow students to develop unique
bidding strategies to suit their personal game preferences as opposed to the current
prevalent strategy of registering for all games irrespective of game preferences. In
addition, the secondary market in the system provides a mechanism to transfer tickets
to students willing to go to the game. Thus the system provides a framework through

14
which tickets end up in the hand of people who are most willing to attend a particular
game.
By being loyal to university athletics a student can earn loyalty points. Since
the auction system uses loyalty points as currency, loyalty point become directly
redeemable. Thus high number of loyalty points earned provides more purchasing
power, which can be translated into tickets for high demand games. Thus there is
positive correlation between loyalty to university athletics and ability to purchase
tickets for home games.
Since loyalty points are directly convertible into tickets the value of loyalty
points remains stable. Students can make qualitative judgements about the tickets
they can expect to get with certain number of loyalty points. They can also take steps
in order to build up their loyalty point’s balance in order to afford tickets. As an
additional benefit, students who have yet to step into the “real world” can get hands
on experience in managing and budgeting valuable resource.
By allowing loyalty point balance to be carried over to the next academic year
the system accounts for student loyalty when a team is not near its peak. For example
consider a scenario when during a year the team has not performed well but an ardent
supporter has been loyal to the team through out the time. By resetting loyalty points
to zero all records of the students loyalty during bad times for the team are lost and
can no longer be translated into tickets. The auction system proposes that the loyalty
points be carried over

15
The direct relation between loyalty point balance and purchasing power has a
very positive effect on policies that relate to students. This is discussed in more detail
in the following section.
Policies for awarding and penalizing students
With a currency at their disposal, the athletic department and the university
will be able to draft better policies for penalizing and awarding students. In this
system an increase or decrease in loyalty point balance can be directly linked to
change in purchasing power. Hence, a policy that is directly linked to the purchasing
power will be a more effective deterrent or incentive, as the case might be.
Typically the athletic department can effectively administer penalties for
undesirable practices by effecting a reduction in loyalty point balance. For example, if
a student fails to show up for a game for which he/she has a ticket then 100 loyalty
points will be deducted from his / her account.
A more effective and university wide implication of this effective policy
implementation is in the form of providing incentives. It should be remembered that
the University of Maryland is an academic institution. Thus incentives for good
academic performance can be provided through award of loyalty points. For example
a GPA bonus of 300 loyalty points for all students maintaining a 4.0 GPA or an
award of 250 loyalty points for a student winning a science quiz. The athletic
department too could provide incentives for attending other University sports that do
not congregate as much attention as basketball and football. After all other
sportspeople represent the university and would definitely appreciate some support
from their fellow students. At this point it would be worth mentioning that associating

16
certain number of loyalty points, as bonus for students holding administrative and
representative position within the university is highly unadvisable.
Policies need to drafted and adapted to changes in environment in which they
are enforced. The examples above are nothing more than just that – they do not
represent a charter of policies that the author of this document suggests the athletic
department follow. With the auction system at their disposal the department can use
loyalty point effectively to administer its policies.
System Basics
Even though this system uses loyalty points as its currency, there is a major
difference in the quantity of loyalty points awarded and used in transactions. Since
granularity in currency would help the auction process, it is proposed that when the
system is launched all eligible students should be given 1000 loyalty points.
The auction is designed as a two stage multiple sequential auctions. The first
stage of the auction deals with the primary market for tickets during which the
athletic department releases tickets to the students. During this round students are
buyers and athletic department is the seller. Students submit sealed bids and the
market is cleared once at the end of the round. During the second round students can
buy and sell their tickets. The market is cleared at regular intervals thus giving the
users a chance to update their bids and asks to be in harmony with the market. The
next page shows the timeline for the auction.

17
Figure 4: Timeline for the Auction Process
18
Timeline
The athletic department groups the games scheduled to be played in the
Comcast Center. Group 1 could be all the games played during the fall semester,
Group 2 could be all the games played during winter break and spring semester,
Group 3 could be all conference games and so on. The athletic department then
announces the availability of tickets for a particular group thus starting the first round
of the auction process. This stage of the auction should ideally last for 1 week thus
giving all students enough time to enter their game preferences and 1st round bid
limit. In case of shortage of time the duration of this stage can be reduced. At the end
of this period, the market is cleared and tickets are allocated to the winners. This
point marks the end of the first stage and the beginning of the next stage, which is the
secondary market.
The second stage stays open until few hours before game time. In this stage,
students can be both buyers and sellers. The athletic department also participates in
this market in order to sell tickets that were leftover from the first round and to
buyback returned tickets for a bid of zero. The athletic department withdraws the
buyback option one day before game day. This allows the athletic department to react
to the demand for a game. If the demand is low, the athletic department can then
provide additional incentives for students to attend by awarding more loyalty points
for these tickets.
Students submit sealed bids and asks for the tickets. Some guidance is
provided through limited information about the state of the market. The secondary

19
market is cleared at regular intervals thus allowing students to revise unsuccessful
bids and asks at regular intervals.
In order to avoid students spending excessive time on the system vying for
tickets, sealed bids have been preferred to open bids in the current form of the system.
In the future, however, an open bid system with automotive proxy bidding
mechanism may be considered. The proxy bidding system will allow students to
specify starting bid, ending bid and bid increment, thus would eliminate the need for
students to continually monitor the state of the auctions.
A more detailed discussion of the entire process follows.
1st Round: Primary Market
As mentioned earlier the first round begins with the Athletic department
announcing the availability of tickets for a group of games. The next important step is
recording student preferences and calculating their first round bids. This stage is
described below:
Recording Student preferences and calculating bids
The students then log into their accounts and enter their game preference
information for games in the group being auctioned. The process of recording these
preferences is accomplished using the “Analytic Hierarchy Process” or AHP in short.
The process is described in short in APPENDIX B.
The students are asked to make pair wise comparisons between games. If ‘n’
is the number of games in a group then the students would have to make nC2 pair wise

20
combinations. The students have the option of eliminating a game from the pair wise
comparison process if they are not interested in the game.
Let us consider the following example: The athletic department has announced
the availability of tickets for the home games against Duke, Michigan, Iowa State,
Notre Dame and Ohio State. Sarah, a student, has 1,000 loyalty points in her account
has logged on to the system to enter her bids.
The preference matrix as shown in the figure below is displayed on her screen.
Duke Michigan Iowa State Notre Dame Ohio State Duke Michigan X Y Iowa State Notre Dame Ohio State
Table 2: Comparison Matrix
The cells below the diagonal and the diagonal itself represent redundant
comparisons hence are eliminated. Each white cell in the table above represents a
comparison between two games: represented in the first column and first Row of the
table. Asking the following question makes the actual comparison:
“Is the game against <Column Game> more important than the game
against <Row Game>?”
The question will have the following responses:
1. Oh Yes!
2. Yes
3. Its Same
4. No
5. Oh No!

21
Each of these responses indicates varying preferences for either of these
games. The following comparison will make the concept clear.
From table 2 let, us take the cell with an X in it. This cell represents the
comparison between games against Michigan (Column Game) and Notre Dame (Row
Game). Thus, the question will be framed as:
“Is the game against Michigan more important than the game against Notre Dame?”
The response to this question can be as interpreted as follows:
Oh Yes! : STRONG PREFERNCE for MICHIGAN over NOTRE DAME
Yes : PREFERENCE for MICHIGAN over NOTRE DAME
Its Same : both games have SAME IMPORTANCE
No : PREFERENCE for NOTRE DAME over MICHIGAN
Oh No! : STRONG PREFERNCE for MICHIGAN over NOTRE DAME
Let us say Sarah has a very strong preference to see the Maryland play
Michigan when compared to Maryland’s game against Notre Dame and thus her
response to the question posed is “Oh Yes!”
Next, in the cell marked “Y” Sarah has to choose between Michigan and Ohio
State. In this comparison, however, Sarah has a preference to see Ohio State over
Michigan. The question asked is:
“Is the game against Michigan more important than the game against Ohio State?”
Sarah does prefer to see the game against Ohio State though it is not a “strong”
preference. Thus, her response is a “No”.
22
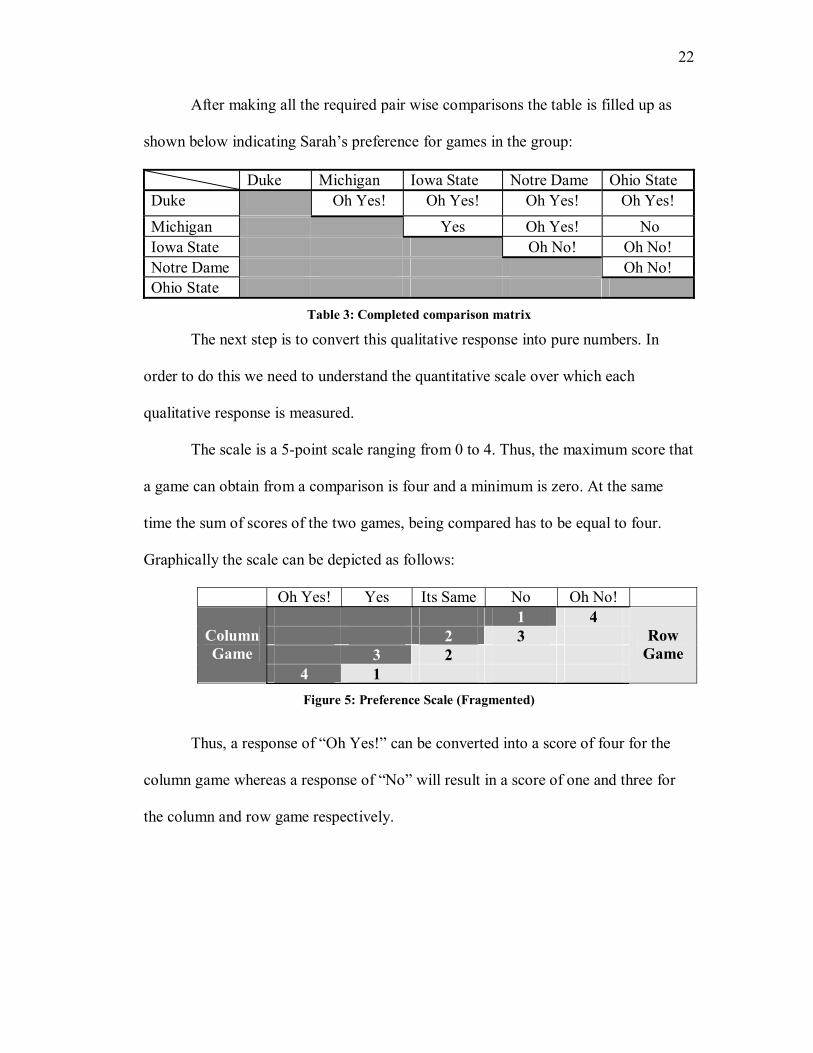
After making all the required pair wise comparisons the table is filled up as
shown below indicating Sarah’s preference for games in the group:
Duke Michigan Iowa State Notre Dame Ohio State Duke Oh Yes! Oh Yes! Oh Yes! Oh Yes! Michigan Yes Oh Yes! No Iowa State Oh No! Oh No! Notre Dame Oh No! Ohio State
Table 3: Completed comparison matrix
The next step is to convert this qualitative response into pure numbers. In
order to do this we need to understand the quantitative scale over which each
qualitative response is measured.
The scale is a 5-point scale ranging from 0 to 4. Thus, the maximum score that
a game can obtain from a comparison is four and a minimum is zero. At the same
time the sum of scores of the two games, being compared has to be equal to four.
Graphically the scale can be depicted as follows:
Oh Yes! Yes Its Same No Oh No! 1 4 2 3 3 2
Column Game
4 1
Row Game
Figure 5: Preference Scale (Fragmented)
Thus, a response of “Oh Yes!” can be converted into a score of four for the
column game whereas a response of “No” will result in a score of one and three for
the column and row game respectively.
23
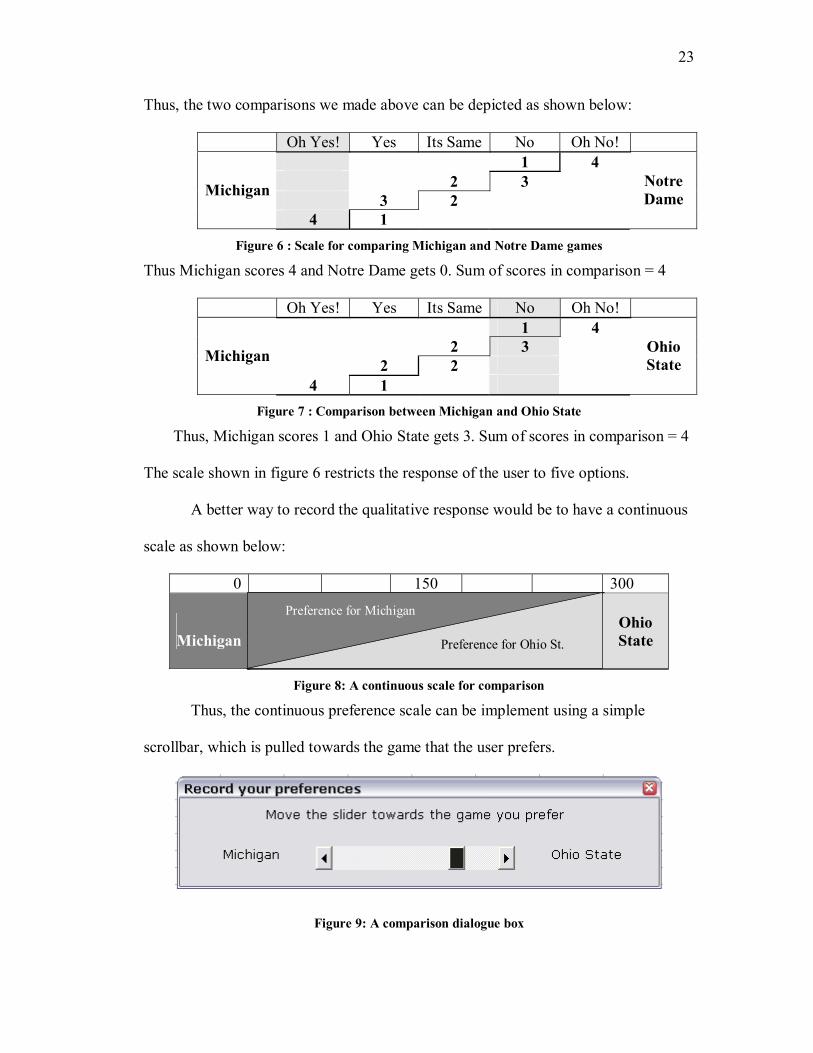
Thus, the two comparisons we made above can be depicted as shown below:
Oh Yes! Yes Its Same No Oh No! 1 4 2 3 3 2
Michigan
4 1
Notre Dame
Figure 6 : Scale for comparing Michigan and Notre Dame games
Thus Michigan scores 4 and Notre Dame gets 0. Sum of scores in comparison = 4
Oh Yes! Yes Its Same No Oh No! 1 4 2 3 2 2 Michigan
4 1
Ohio State
Figure 7 : Comparison between Michigan and Ohio State
Thus, Michigan scores 1 and Ohio State gets 3. Sum of scores in comparison = 4
The scale shown in figure 6 restricts the response of the user to five options.
A better way to record the qualitative response would be to have a continuous
scale as shown below:
0 150 300
Michigan Ohio
State
Figure 8: A continuous scale for comparison
Thus, the continuous preference scale can be implement using a simple
scrollbar, which is pulled towards the game that the user prefers.
Figure 9: A comparison dialogue box
Preference for Michigan
Preference for Ohio St.
24
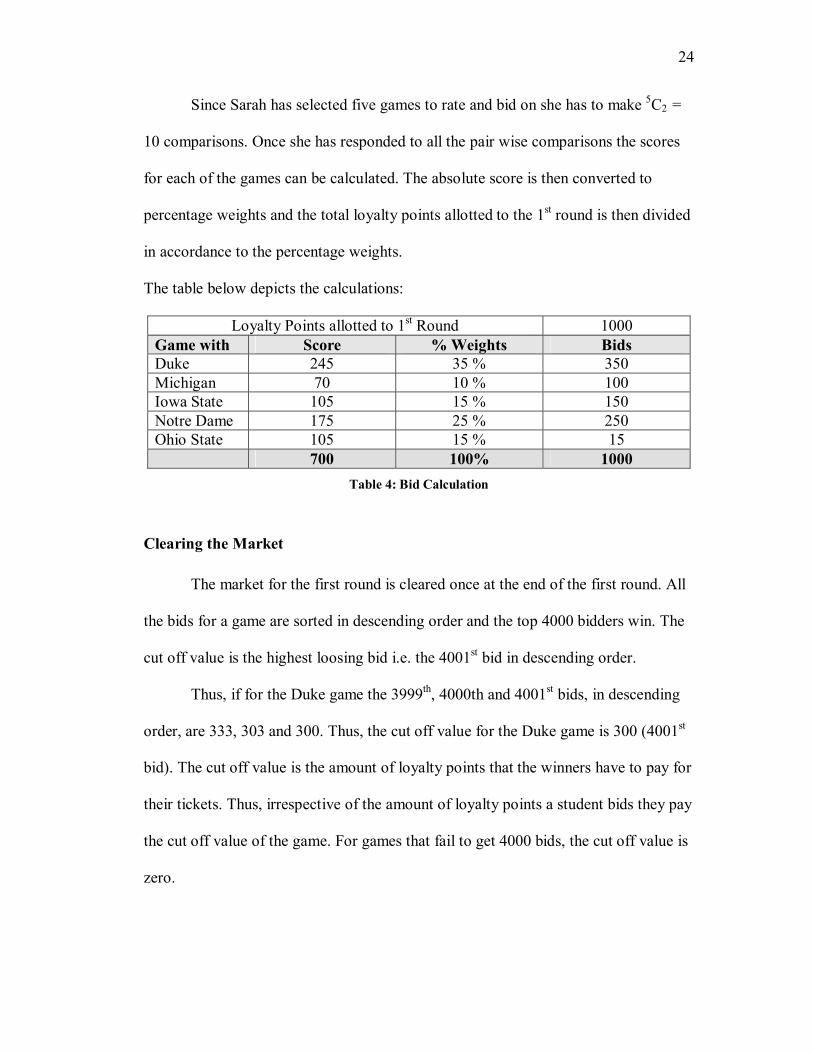
Since Sarah has selected five games to rate and bid on she has to make 5C2 =
10 comparisons. Once she has responded to all the pair wise comparisons the scores
for each of the games can be calculated. The absolute score is then converted to
percentage weights and the total loyalty points allotted to the 1st round is then divided
in accordance to the percentage weights.
The table below depicts the calculations:
Loyalty Points allotted to 1st Round 1000 Game with Score % Weights Bids Duke 245 35 % 350 Michigan 70 10 % 100 Iowa State 105 15 % 150 Notre Dame 175 25 % 250 Ohio State 105 15 % 15 700 100% 1000
Table 4: Bid Calculation
Clearing the Market
The market for the first round is cleared once at the end of the first round. All
the bids for a game are sorted in descending order and the top 4000 bidders win. The
cut off value is the highest loosing bid i.e. the 4001st bid in descending order.
Thus, if for the Duke game the 3999th, 4000th and 4001st bids, in descending
order, are 333, 303 and 300. Thus, the cut off value for the Duke game is 300 (4001st
bid). The cut off value is the amount of loyalty points that the winners have to pay for
their tickets. Thus, irrespective of the amount of loyalty points a student bids they pay
the cut off value of the game. For games that fail to get 4000 bids, the cut off value is
zero.

25
Entry groups are allotted to students based on their loyalty point balance
before the 1st Round begins with students with highest number of loyalty points being
allotted to the earliest entry groups.
Gain Calculation
After the cut off values of all games are worked out, the athletic department
has information about the demand for each of the game. This information is then used
to calculate the “gain” for each game. “Gain” is defined as the amount of loyalty
points that the athletic department will pay a student for attending a game to which he
/ she has won a ticket.
Let us consider the five games mentioned above. Given below are the cut offs
for each game listed in ascending order. The gain for each game is obtained by
flipping the demand curve as seen in the graph overleaf.
Cut Off Gain Duke 300 110 Michigan 200 130 Iowa State 150 150 Notre Dame 130 200 Ohio State 110 300
100
150
200
250
300
350
Table 5: Gain Calculation
The gain thus helps create proportional incentives for students to buy tickets
to games that have lesser demand.
The next step in the process is the second round. The second round allows the
students to sell and buy tickets. The details of the process are discussed in the next
chapter.
Cut Off Gain

26
Chapter 3: An Auction Based System: Secondary Market
Introduction
The second round of the auction involves both the students and the athletic
department acting as buyers and sellers in the secondary market. This stage of the
auction begins with the end of the first round of the auction process. The secondary
market may have some of the following participants:
1. Athletic Department as a buyer:
Through out the 2nd round the athletic department will bid for every ticket
in the market for a price of zero (0) loyalty points. If required the student can set
the ask for his /her ticket to zero (0) in order to dump a ticket. This leaves all the
buyers with the option of selling back as there will always be at least one buyer in
the market. The Athletic department withdraws from the market as a buyer one
day before game day.
2. Athletic Department as a seller:
The Athletic department will be in the market as a seller for tickets from
two sources:
Tickets that were left over from the first round.
Tickets that were purchased from students for zero (0) loyalty points
The selling price for these tickets is decided based on the moving average
of average successful bid in recent market clearing. This aspect is discussed in the
next section.
27
3. Students as Buyers:
Students who have bid unsuccessfully for a ticket to a game can try to
revise their bids and try to find sellers whose asks they can match. The bid limit
for each individual bid by a student is equal to the loyalty point balance at the end
of the first round. Thus, the sum of bids submitted for the second round can
exceed the loyalty point balance but each individual bid cannot exceed the
balance amount. This aspect allows the students to bid their true values for each
game.
Students can hold more than two tickets for a game though the gain
associated with attendance can be claimed for one ticket only. Thus, it is in the
best interest of the student to hold just one ticket. Nevertheless, a student with a
ticket can try to obtain a ticket for an earlier entry group in the second round.
4. Students as Sellers:
Students who wish to dispose off their tickets, either because of inability to
attend the game or pure profiteering can do so in the second Round.
Selling Price of Tickets in the second round
The price of tickets is based on the moving average of successful bids in
recent market clearings. The average successful bid is the average of all bids, which
have been matched with a seller. To understand this process let us assume the athletic
department wishes to sell one unclaimed ticket for a game with Clemson. The next
scheduled clearing for the Clemson game is the 11th clearing for this ticket and the
data for previous market clearings is as shown in the table overleaf.

28
Market Clearing # 7 8 9 10 11
Average successful bid 120 150 160 145 Moving Average (3) 151.67
Bid 152
Table 6: Calculating Moving Average
The average successful bids for the eighth, 9th and 10th game are 150, 160 and
145 respectively. The average of these three clearings is 151.67 viz. the average of
150, 160, 145. Thus after rounding off to the nearest integer, 152 is the predicted
average successful bid for the 11th clearing.
For deciding the ask for unclaimed tickets refer to the figure given below:
0
200
400
600
800
1000
1200
A B
Figure 10: Determining Asks

29
Let,
b be the moving average (3) for the average successful bids in the three
most recent market clearings for a particular ticket.
c be the cut off for the game determined at the end of the 1st round
g be the gain associated with a particular game
s be the selling price for a ticket sold by the athletic department.
Case I: b >= max(c, g) (point “” in the figure above)
s = max (c,g)
Case II: b >= min (c, g) AND b < max(c, g) (point “X” in the figure above)
s = min(c,g)
Case III: b <= min(c, g) (point “◊” in the figure above)
s = 0.
Market Structure and Clearing Sequence
Before delving into the market clearing processes, it is very important to
understand the structure of the market. The entire market is fragmented not only into
smaller markets for individual games but each game is further divided into even
smaller markets for individual entry groups for a game. This concept can be further
understood by referring to the figure below:
Entry Groups 1 2 3 Duke Sub Market 1 Sub Market 2 Sub Market 3 Michigan Sub Market 4 Sub Market 5 Sub Market 6 Iowa State Sub Market 7 Sub Market 8 Sub Market 9 Notre Dame Sub Market 10 Sub Market 11 Sub Market 12 Ohio State Sub Market 13 Sub Market 14 Sub Market 15
Table 7: Market Structure
30
Thus, the entire market is divided into sub markets for tickets to a particular
entry group for a particular game. Students can specify the entry group for which they
are placing a bid. In case the student does not specify the entry group then his / her
bid will be included in every sub-market for a game until he / she gets a ticket.
The clearing algorithm starts at the sub-market for a game with the lowest cut-
off and the earliest Entry group. After all the entry groups for this game have been
cleared, the game with the second lowest cut off is cleared in the same sequence.
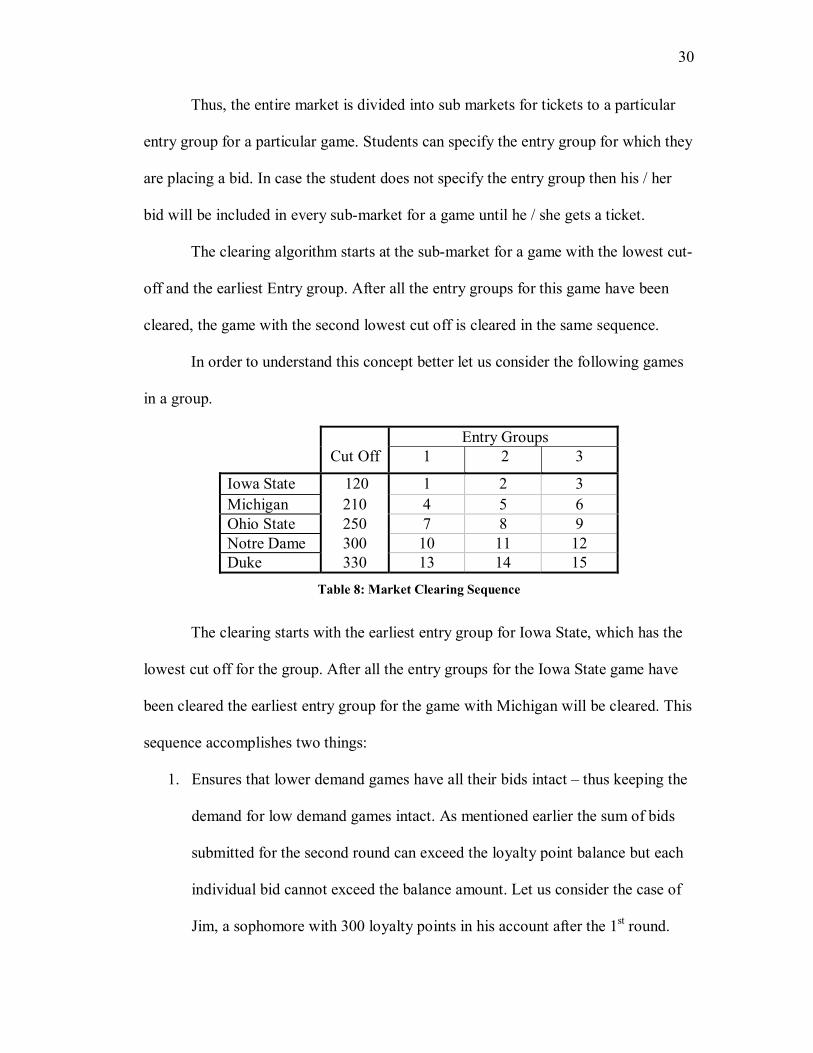
In order to understand this concept better let us consider the following games
in a group.
Entry Groups Cut Off 1 2 3
Iowa State 120 1 2 3 Michigan 210 4 5 6 Ohio State 250 7 8 9 Notre Dame 300 10 11 12 Duke 330 13 14 15
Table 8: Market Clearing Sequence
The clearing starts with the earliest entry group for Iowa State, which has the
lowest cut off for the group. After all the entry groups for the Iowa State game have
been cleared the earliest entry group for the game with Michigan will be cleared. This
sequence accomplishes two things:
1. Ensures that lower demand games have all their bids intact – thus keeping the
demand for low demand games intact. As mentioned earlier the sum of bids
submitted for the second round can exceed the loyalty point balance but each
individual bid cannot exceed the balance amount. Let us consider the case of
Jim, a sophomore with 300 loyalty points in his account after the 1st round.

31
For the second round Jim wishes to bid for the games of Duke, Ohio State and
Iowa State. Thus, he can place three bids of maximum 300 points each for
each of the games. Let us say he places bids of 120, 150 and 300 for the Iowa
State, Ohio State and Duke game respectively. Thus, when the market starts
clearing Iowa State has the 120-loyalty point bid still intact. If the bid is
successful then the loyalty point balance falls to 180 loyalty points. This
means that 300 loyalty point bid for the Duke game will be withdrawn
automatically whereas the 150 loyalty point bid for Ohio state will still be
active. If the market is cleared the other way around with the Duke game
being cleared first then both Ohio State and Iowa State markets will face a
reduction in demand – this is not desirable.
2. A student can get the best entry group for loyalty points he / she is bidding.
Take the example of two students: Jim and Anne. Anne did get a ticket for the
Ohio State game for entry group 5 whereas Jim was unsuccessful in securing a
ticket in the first round. Anne intends to purchase a ticket for an earlier entry
group whereas Jim would be just happy to get to go to the game. Thus, Jim
submits a bid of 150 without specifying the entry group whereas Anne
submits a bid for 200 for entry group 3. During clearing, Jim’s bid will be
present in the market book for all the entry groups starting with entry group 1
till he gets ticket or till the entire market for the Ohio State game is cleared.
Anne’s bid on the other hand will be present in market books for entry groups
1,2, and 3 only. The market book for entry group 4 and greater will have Jim’s
bid but will not have Anne’s bid in them.

32
Market Clearing Mechanisms
A market clearing mechanism is an algorithm by which the software matches
buyers and sellers. The figure given below shows some possible combinations as to
how bids and asks can be matched.
Maximum Minimum
Bid Ask Bid Ask
Bid Lowest
Ask Algorithm 2 Algorithm 4
Bid Algorithm 3 Algorithm 1 Highest
Ask
Table 9: Possible Algorithms for Market Clearing
One of the main objectives of this system is to maximize attendance for
games. It can be logically inferred that students with high bids are more likely to
attend games than students who are selling their tickets or have lower bid for a game.
Thus, a market clearing mechanism has to be slightly skewed in order to favor
students with high bids. Thus, only four algorithms, which try to match highest bids
to (max / min) asks and lowest asks to (max / min) bids have been discussed in the
subsequent sections.
Each algorithm has to select qualifying bids for a particular ask or vice versa
and select the best qualifying bid or ask to process the transactions. The qualifying
rule for any bid ask combination is:
Bid ≥ Ask

33
The figure given below shows the market book we will use to understand the
algorithms.
Bids Asks 733 777 700 750 650 700 550 696 370 373 330 350 0 333 Figure 11: Market Book

34
Algorithm 1: Highest Bid ↔ Min (Qualifying Ask) The steps in the first algorithm are as follows:
1. Start with the highest bid
2. Find all qualifying asks
3. Choose minimum qualifying ask
Thus, we start with the bid of 733 and select all qualifying asks: 700, 696,
373, 350 and 333. From this set, we select 333 as the matching ask. The bid – ask
spread is equal to 733 – 333 = 400. Next, we take the bid of 700 and select all
qualifying asks: 700, 696, 373 and 350. 333 is a qualifying ask but it has already been
matched with 733. The table below shows the qualifying asks and matching asks for
each bid.
Bids 733 700 650 550 370 330 0
777 750 700 700 700 696 696 696 373 373 373 373 350 350 350
Ask
s
333 333
Table 10: Algorithm 1: Highest bidders matched with lowest ask Thus the results of market clearing by this algorithm is as follows:
Transactions Unsuccessful Bids Unsuccessful Asks 733 ↔ 333 550 777 700 ↔ 350 370 750 650 ↔ 373 330 700
0 696
Figure 12: Results of Algorithm 1
35
The matched bidder and seller information is used to process transactions. The
bidder pays his /her bidding price and the seller receives his / her ask. The athletic
department retains the bid-ask spread.
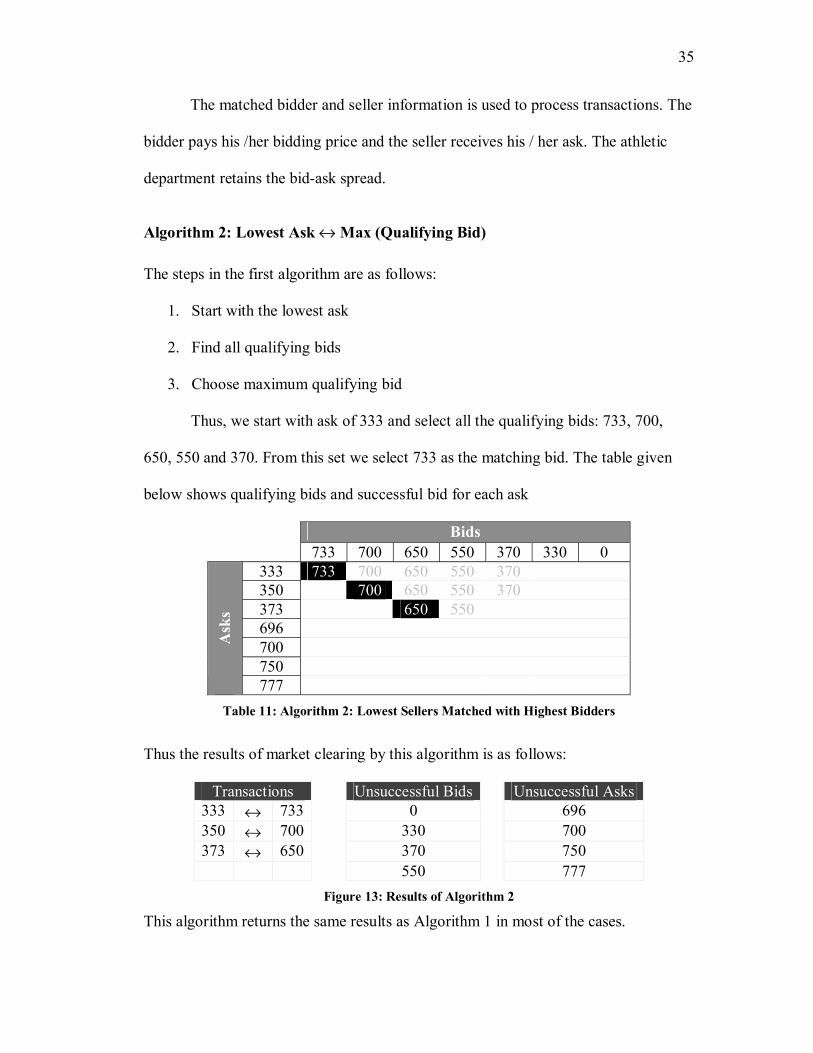
Algorithm 2: Lowest Ask ↔ Max (Qualifying Bid)
The steps in the first algorithm are as follows:
1. Start with the lowest ask
2. Find all qualifying bids
3. Choose maximum qualifying bid
Thus, we start with ask of 333 and select all the qualifying bids: 733, 700,
650, 550 and 370. From this set we select 733 as the matching bid. The table given
below shows qualifying bids and successful bid for each ask
Bids 733 700 650 550 370 330 0
333 733 700 650 550 370 350 700 650 550 370 373 650 550 696 700 750
Ask
s
777 Table 11: Algorithm 2: Lowest Sellers Matched with Highest Bidders
Thus the results of market clearing by this algorithm is as follows:
Transactions Unsuccessful Bids Unsuccessful Asks 333 ↔ 733 0 696 350 ↔ 700 330 700 373 ↔ 650 370 750
550 777 Figure 13: Results of Algorithm 2
This algorithm returns the same results as Algorithm 1 in most of the cases.
36
The matched bidder and seller information is used to process transactions. The
bidder pays his /her bidding price and the seller receives his / her ask. The athletic
department retains the bid-ask spread.
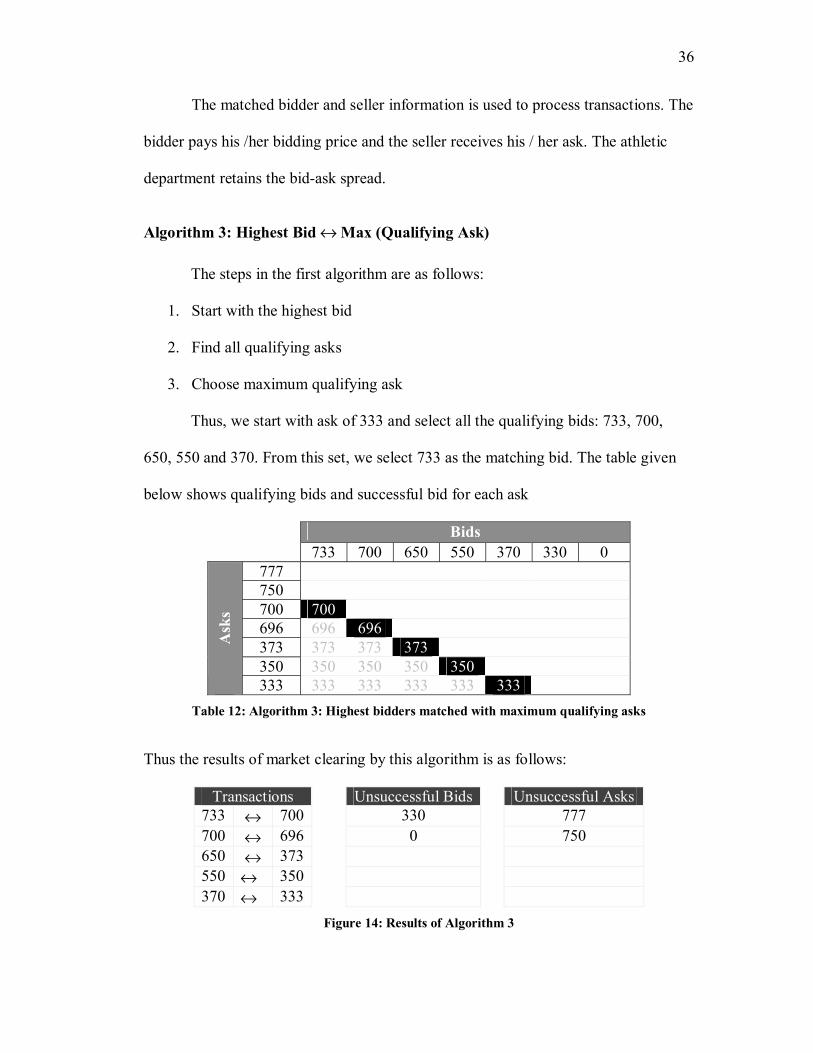
Algorithm 3: Highest Bid ↔ Max (Qualifying Ask)
The steps in the first algorithm are as follows:
1. Start with the highest bid
2. Find all qualifying asks
3. Choose maximum qualifying ask
Thus, we start with ask of 333 and select all the qualifying bids: 733, 700,
650, 550 and 370. From this set, we select 733 as the matching bid. The table given
below shows qualifying bids and successful bid for each ask
Bids 733 700 650 550 370 330 0
777 750 700 700 696 696 696 373 373 373 373 350 350 350 350 350
Ask
s
333 333 333 333 333 333 Table 12: Algorithm 3: Highest bidders matched with maximum qualifying asks
Thus the results of market clearing by this algorithm is as follows:
Transactions Unsuccessful Bids Unsuccessful Asks 733 ↔ 700 330 777 700 ↔ 696 0 750 650 ↔ 373 550 ↔ 350 370 ↔ 333
Figure 14: Results of Algorithm 3
37
The matched bidder and seller information is used to process transactions. The
bidder pays his /her bidding price and the seller receives his / her ask. The athletic
department retains the bid-ask spread.
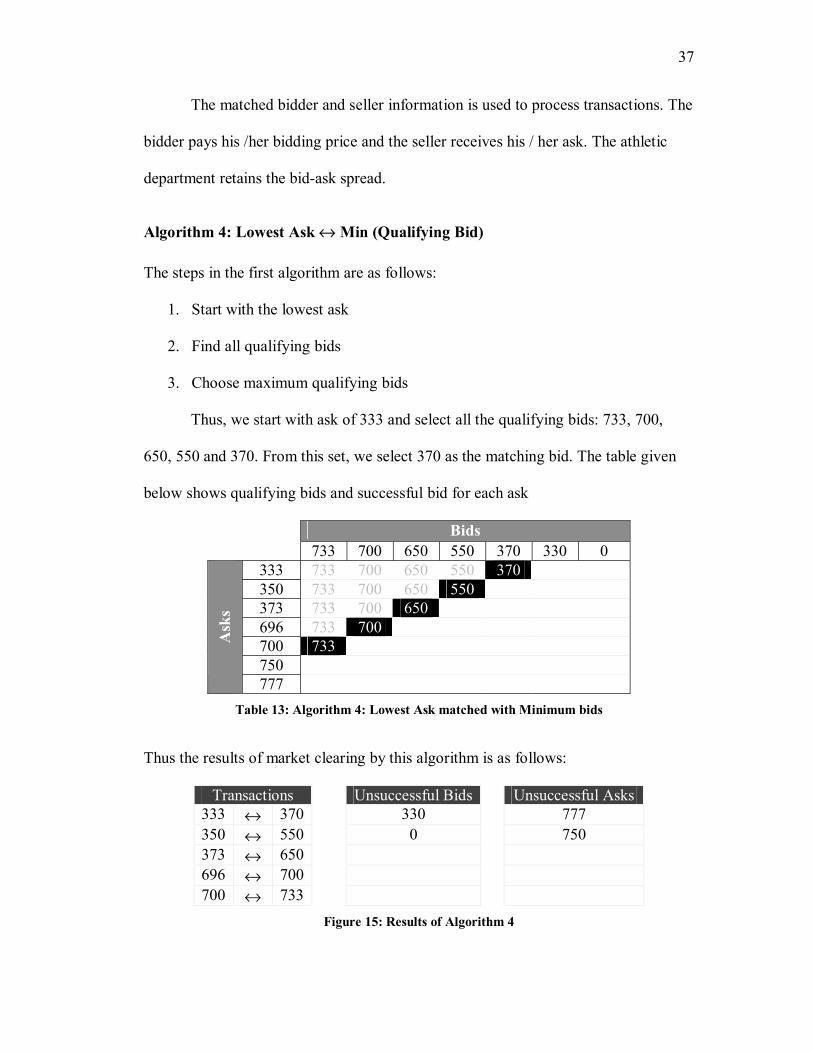
Algorithm 4: Lowest Ask ↔ Min (Qualifying Bid) The steps in the first algorithm are as follows:
1. Start with the lowest ask
2. Find all qualifying bids
3. Choose maximum qualifying bids
Thus, we start with ask of 333 and select all the qualifying bids: 733, 700,
650, 550 and 370. From this set, we select 370 as the matching bid. The table given
below shows qualifying bids and successful bid for each ask
Bids 733 700 650 550 370 330 0
333 733 700 650 550 370 350 733 700 650 550 373 733 700 650 696 733 700 700 733 750
Ask
s
777 Table 13: Algorithm 4: Lowest Ask matched with Minimum bids
Thus the results of market clearing by this algorithm is as follows:
Transactions Unsuccessful Bids Unsuccessful Asks 333 ↔ 370 330 777 350 ↔ 550 0 750 373 ↔ 650 696 ↔ 700 700 ↔ 733
Figure 15: Results of Algorithm 4

38
The matched bidder and seller information is used to process transactions. The
bidder pays his /her bidding price and the seller receives his / her ask. The athletic
department retains the bid-ask spread.
Selecting the Best Mechanism
These algorithms were tested using prototypes built in MS Excel and Visual
Basic for Applications. During simulations for these algorithms it was found that
algorithms 3 and 4 consistently produced more number of transactions for a given
market book than algorithms 1 and 2. This is some what expected as algorithms 1 and
2 matches buyers with high values with sellers with low values and vice versa.
On the other hand, algorithms 3 and 4 match buyers and sellers with similar
values. This becomes clearer from the graph shown below. (Bids are arranged in
ascending order, Asks are arranged in descending order):
250
350
450
550
650
750
850
Figure 16: Understanding Algorithms
Both A and B have high values for this ticket where as C and D have low
values for the ticket. Thus, Algorithm 1 starts at point A and the lower end of the bid
Asks
Bids A
B
C D
Bid
– A
sk S
pect
rum

39
curve where as Algorithm 2 starts with point D and the higher end of the bid curve.
For both these algorithms all bids and asks to the left of the cross over point of the
two curves do not qualify. Thus, this algorithm manages to match the bids and asks
on the right hand of the cross over point. Algorithm 3 starts with point B and the
higher end of the ask curve whereas algorithm 4 starts with point C and the lower end
of the bid curve. Thus, both algorithms 3 and 4 have much more qualifying bid –ask
combinations than algorithms one and two which results in more number of
transactions.
While deciding between algorithms 3 and 4 lets consider the case of a high
demand game where there are many more buyers than sellers. Lets take a specific
example with 10 buyers and 3 sellers. The results of clearing markets by algorithm3
and algorithm 4 are given below:
Market Book Bids Asks Market Clearing Results: 815 709 Algorithm 3 Algorithm 4 761 414 Bids Asks Bids Asks 706 45 815 709 761 709 580 761 414 533 414 533 706 45 100 45 302 289 100 14 0
Algorithm 4 fails to allocate any ticket to the highest bidder because by the
time the highest bidder is considered for matching there are no sellers left in the
market. This is a highly undesirable situation.
Thus, Algorithm 3 provides the best solution for clearing the market amongst
all the competing mechanisms.
40
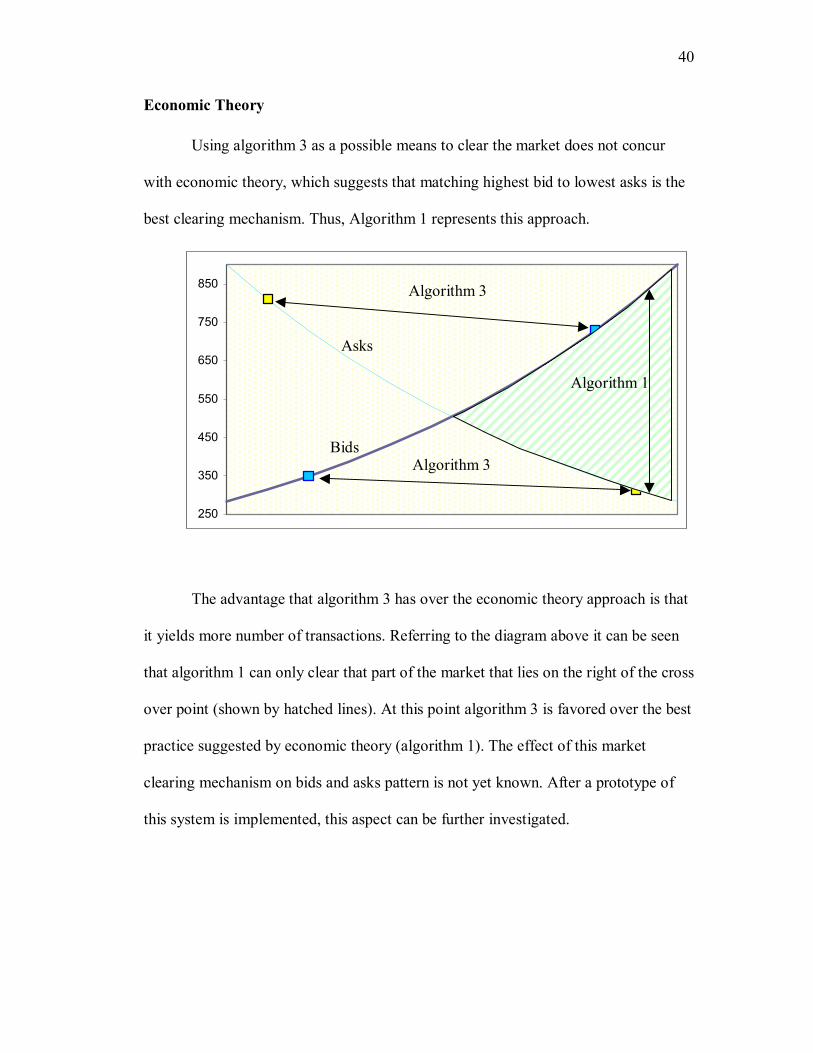
Economic Theory
Using algorithm 3 as a possible means to clear the market does not concur
with economic theory, which suggests that matching highest bid to lowest asks is the
best clearing mechanism. Thus, Algorithm 1 represents this approach.
250
350
450
550
650
750
850
The advantage that algorithm 3 has over the economic theory approach is that
it yields more number of transactions. Referring to the diagram above it can be seen
that algorithm 1 can only clear that part of the market that lies on the right of the cross
over point (shown by hatched lines). At this point algorithm 3 is favored over the best
practice suggested by economic theory (algorithm 1). The effect of this market
clearing mechanism on bids and asks pattern is not yet known. After a prototype of
this system is implemented, this aspect can be further investigated.
Algorithm 1
Algorithm 3
Asks
Bids Algorithm 3

41
Loyalty Points
As the currency for the framework of rules and algorithms loyalty points form
the core of the system. Every year, a large number of new students become a part of
the student community here at the university. These students have to be given a
certain number of loyalty points at the beginning of their association with the
University. The number of loyalty points awarded at this time should give them a fair
chance while competing for game tickets. At the same time, this “initiation award”
should not be so high as to put the current students the University at a disadvantage. It
is proposed that the number of loyalty points awarded to an incoming student be
equal to the average number of loyalty points with any student at the university.
Each year depending on a number of factors the athletic department may end
up with a profit or a loss. A profit would be the total number of surplus loyalty points
that are left over after incoming students are given the initiation award. A loss would
be the total number of loyalty points that the athletic department would have to
introduce into the system in order to provide initiation award to incoming students in
compliance to the rule suggested in the previous paragraph.
Unlike the current system loyalty point, balances for students will not be reset
every year. The loyalty point balance for a continuing student will be carried forward
until he / she graduates from the university. Students will loose loyalty points when
payments are made in exchange for ticket or if he / she is penalized. Loyalty points
can be gained when tickets are sold or when he / she attends a game.

42
Chapter 4: Going Ahead
Introduction
At the time of this writing, the framework of rules and algorithms mentioned
in the previous chapters was being implemented as a prototype with the help of
computer programmers associated with the CEME lab. The purpose of this chapter is
to discuss some advantages that this system has over the current system and introduce
the reader to the prototype. We will also extrapolate the prototype to discuss the
working and features of the full-fledged implementation of the system. We begin this
chapter by summarizing some advantages that this system has over the current
system.
The Prototype
The primary interface of the system is through the Internet using JSP enabled
dynamic web pages and the back end of the system is an Oracle Database. The
general architecture of the system is as shown in the figure below:
Figure 17: General Architecture * * The programmers at the CEME created the general architecture of the
system shown above.
Oracle dbEnterprise Java
Beans (EJB) Struts
FrameworkJSP

43
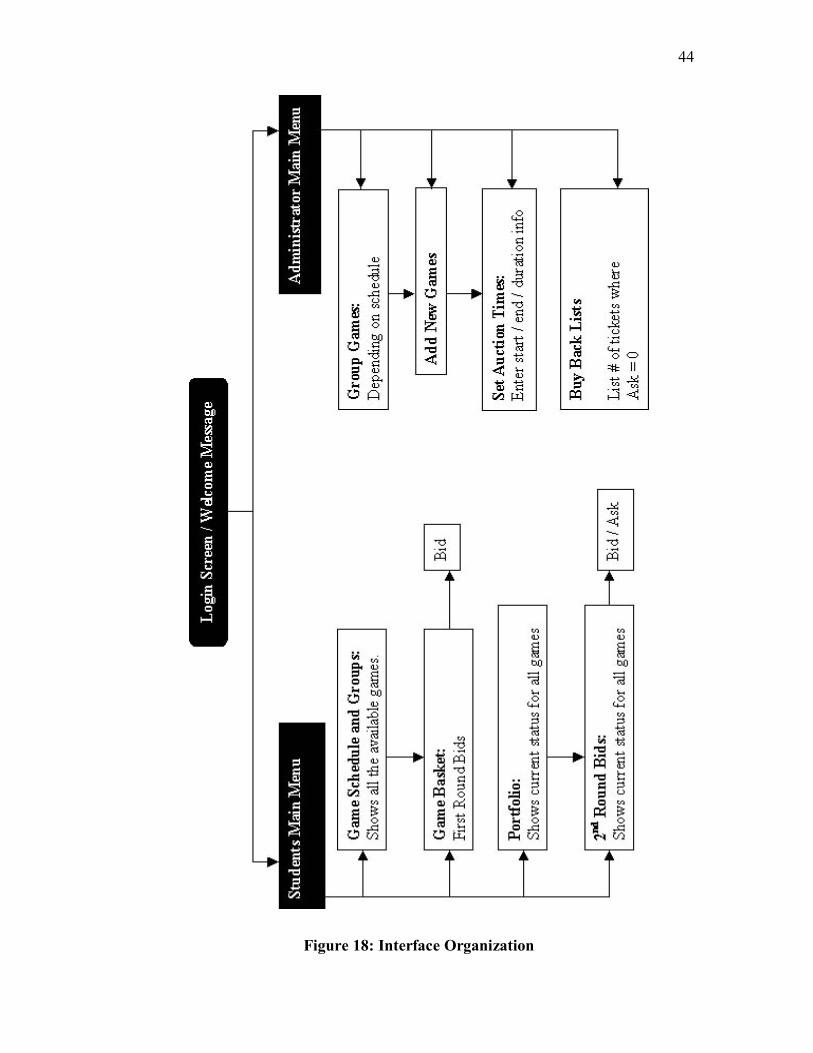
The system is designed to cater two categories of users: The administration,
which is represented by the athletic department and the subscribers, represented by
the students.
The typical functions of the to groups are as follows.
Administrator (The Athletic Department):
1. Entering new game information:
a. Game Date / Time
b. Game Venue and number of seats being offered
c. Opposition team
d. Other details like conference game and general description
2. Creating groups of games
3. Specifying date and time for starting each round of the auction process.
4. View status of tickets for each game.
5. Selling unsold tickets with added loyalty-point awards.
Subscribers (Students):
1. Choosing games to bid on and placing individual bids
2. Checking on loyalty point balance and personal ticket inventory
3. Buying and selling tickets.
The overview of the forms interface is as shown in the figure overleaf.
Snapshots of the actual interface are shown in APPENDIX E.
44
Figure 18: Interface Organization

45
The Full-Fledged System
Increasing the availability of information is of critical importance in case of
auctions that deal in time sensitive goods like tickets. Users of the system should have
the ability to check the status of auctions that they are participating in. Access to the
system through alternate devices like PDA’s and or cell phones could provide more
value to the system. Most cell phones have a dedicated email address, thus
notification of status through simple text emails to these email address would provide
a low cost solution. A general overview of the proposed system is shown below:
Figure 19: System Access
Administration /Athletic Department
Backend SystemServers
Authentication LDAP Servers
On Campus Access
Internet
WAP Server
Service Provider
Off Campus Access
46
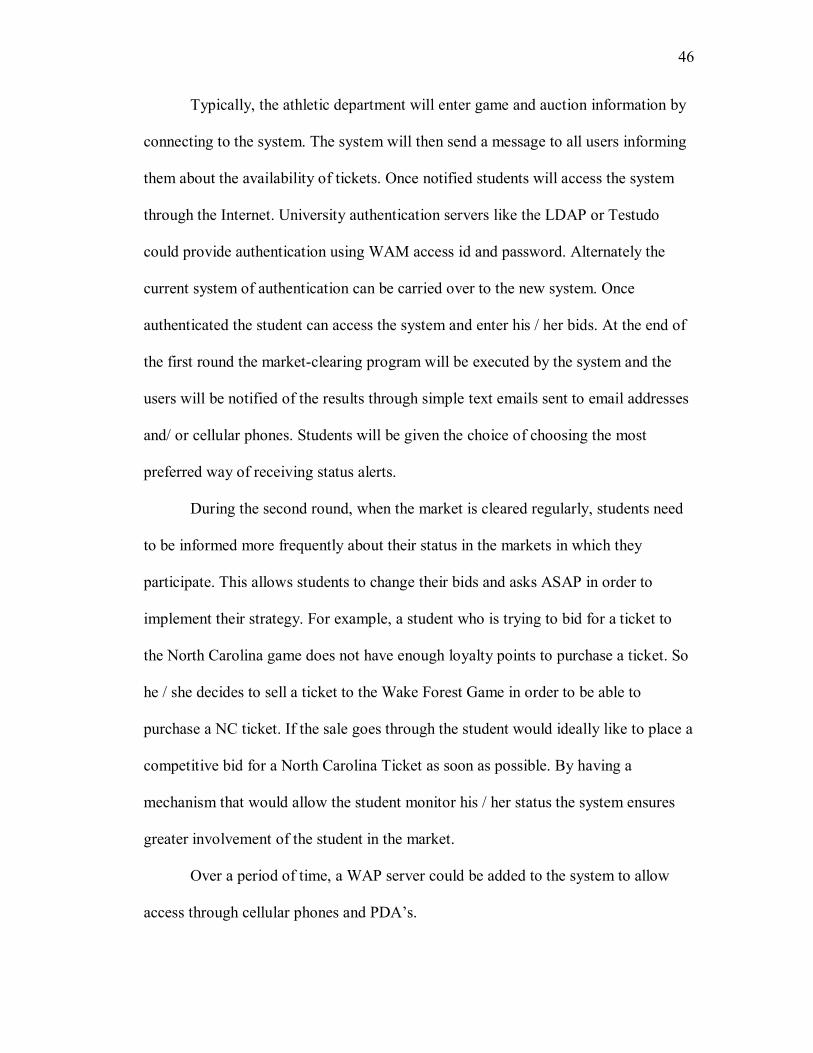
Typically, the athletic department will enter game and auction information by
connecting to the system. The system will then send a message to all users informing
them about the availability of tickets. Once notified students will access the system
through the Internet. University authentication servers like the LDAP or Testudo
could provide authentication using WAM access id and password. Alternately the
current system of authentication can be carried over to the new system. Once
authenticated the student can access the system and enter his / her bids. At the end of
the first round the market-clearing program will be executed by the system and the
users will be notified of the results through simple text emails sent to email addresses
and/ or cellular phones. Students will be given the choice of choosing the most
preferred way of receiving status alerts.
During the second round, when the market is cleared regularly, students need
to be informed more frequently about their status in the markets in which they
participate. This allows students to change their bids and asks ASAP in order to
implement their strategy. For example, a student who is trying to bid for a ticket to
the North Carolina game does not have enough loyalty points to purchase a ticket. So
he / she decides to sell a ticket to the Wake Forest Game in order to be able to
purchase a NC ticket. If the sale goes through the student would ideally like to place a
competitive bid for a North Carolina Ticket as soon as possible. By having a
mechanism that would allow the student monitor his / her status the system ensures
greater involvement of the student in the market.
Over a period of time, a WAP server could be added to the system to allow
access through cellular phones and PDA’s.

47
Porting the System
Adapting this system outside an academic environment, for example the
Washington Wizards, requires rethinking certain aspects of the current system. The
two most important aspects are the currency for the system, which would obviously
be money, and the need for a special secondary market. As a system implemented in
an academic environment usage of money as currency in the proposed system was
ruled out. However, for a commercial system money is definitely a better currency.
The secondary market for a proposed system was created to provide a system for
users to buy or sell tickets after the initial allocation of tickets was done through the
primary market. Secondary markets like Ebay.com have already proven their
convenience for selling and purchase of tickets. Unless the situation demands so,
design of secondary market for a commercial enterprise like Washington Wizards is
not required. This also means that the allocation resulting after the primary market is
cleared is critical for the systems success.
Typically, the seating in the stadium will be divided in sections – closer the
section to the court more will be the price for the seats within the section. The
administration can append a reserve price for tickets in each section based on historic
data on seat pricing. A user can enter a bid price for a certain section – though his /
her bid price will be considered for costlier sections if the bid is greater than the
reserve price for that section. Let us consider that the stadium is divided into sections
named A through Z- A being the closest to the court and Z being the farthest. I wish
to place a bid of $150 for section C with a reserve price of $75. Assume that sections
A and B have a reserve price of $175 and $125 respectively. Thus, my bid for section

48
C shall also be considered for section B but not for section A. Alternatively, Sarah,
another patron, would not like to see the game from any other location farther away
than section B. Lets assume that her bid limit too is $150. She thus places a bid of
$150 for section B and her bid will only be considered for section B. The situation is
shown graphically below:
Reserve Price My Bid Sarah Section A
$175
Section B
$150 $125
Section C $150 $75
Section D
Figure 20: Bids and Seat Sections for a commercial arena
This system is similar to the second round clearing mechanism of the
proposed auction system and provides two advantages for the user:
1. Allows user to get the best seat for the bid amount
2. Allows the user to specify the farthest section that he / she is willing to
watch the game from.
Sections are cleared at the end of bidding time with the top bidders paying the
cut-off value. Active user participation can also be induced by letting the user know
whether he / she is above the cut off value after a bid is submitted. Allowing users to

49
have proxy agents to increment their bids would let the user set starting and
maximum bids.
As with any other money based system – security and identification are very
serious issues and have to be given due thought. In addition, possibilities of gaming
the system have to be well thought out as any incident can lead to serious doubts
about the system.
Conclusion
Auctions have certain inherent advantages over traditional “catalogue price”
market mechanisms. By providing a forum for buyer and sellers to submit bids and
asks, auctions lead to a more efficient price discovery. This is of critical importance
for goods that are time sensitive i.e. goods that loose their value, partly or completely
after a certain period of time. Organizations that endeavour to sell such goods at
catalogue price run the risk of quoting an inefficient price. This can leave them with
either unsold inventory of no value or revenues that are lesser than what the inventory
is worth. In the context of the University of Maryland’s athletic department the issue
is more about attendance than money. An inefficient ticket distribution system leads
to empty seats and lesser support during a home game. With a time sensitive good
like ticket to sell, the athletic department needs a ticket distribution system that
ensures that tickets end up with people that value it the most.
The underlying idea for creating an auction-based system for distributing
game tickets is to provide an efficient market for a high demand - limited supply
resource. The entire work for this thesis was aimed at finding a pragmatic solution to
a real world problem. In many ways the situation at the athletic department provides a

50
unique scenario with unique set of problems. Since the system is based in an
academic environment the most common denominator – money could not be used for
trading. With an alternative currency that could only be used within the system some
well-established economic theories have been ignored in favour of more intuitive
solutions.
No information system can stay static. An active program to analyse the
performance of the system over time is highly recommended. Changes can then be
made to the system in order to tune it to new requirements. Certain areas like
frequency of market clearing, bidder and seller matching algorithms and policies for
subscribers of the system might have to be adapted to changing needs. Starting with
an initial implementation for basketball games this system can easily be adapted to
include other university sports. As discussed earlier drafting effective policies to
provide incentives for various actions by student and deterring undesirable behaviour
can easily be done through the system. More importantly this system allows students
to budget a currency and thus provides a fertile ground for training students in
managing their resources in the real world that is increasingly adopting auctions as
preferred means of trading.

51
APPENDIX A: Wharton MBA Auctions
Introduction:
Since the academic year of 1996-1997 Wharton introduced an auction based
system for MBA electives. The stated objective of this system is to “achieve an
equitable and efficient allocation of seats in elective courses when demand exceeds
supply.” In addition to this, the auction also tries to “transform a random outcome
into a matter of choice”.
This particular auction system is of particular interest because of the
a.) Possible similarities in objectives
b.) Academic setting in which it operates
c.) Use of an alternative currency (points).
Scope of the Auction
The auction system does not cover the core courses of the MBA program –
only the electives that the students have to take in their second year. In some cases, a
student may waive a particular core course requirement and take an elective in the
first year itself. Both semester length electives as well as quarter length electives are
auctioned.

52
Auction Schedule
The entire process is held twice a year – for the Fall and Spring semesters –
and has 10 rounds of seal-bid auctions. The process has three main phases:
a.) Phase 1: This phase is held before the semester begins and the first four
rounds of bidding are done in this phase. The fifth round of bidding starts in
this phase and ends when phase 2 begins.
b.) Phase 2: This phase is held during the first week of classes. Round five of
bidding ends and rounds 6-10 are conducted during this period.
c.) Phase 3 (or 2.5): This phase is held in the first week of the 2nd and 4th
quarters. This phase involves two additional rounds of bidding for the quarter
length courses that start in the 2nd and 4th quarter every year.
Alternative Currencies
The auction uses points as the currency for the auction. Each student gets
5000 points when he / she begins the program. Each semester length elective is worth
1000 points (which are added to the student account on successful completion) and
each quarter length elective is worth 500 points. The student does not get any
additional endowments from the school – additional points can be earned through the
auction process.

53
The Auction Process
The process used by Wharton is a combinatorial auction. The first round
(primary market) is a second-price auction in which the Graduate division is the sole
seller of courses. Each course is offered for 100 points. The top ‘k’ bidders win the
auction for a class size of ‘k’. The clearing price for this course is the highest loosing
bid (the (k+1) th bid). The next rounds (secondary markets) allow the students to
resell and buy other courses. This involves a seal-bid double auction process. The
clearing price for these rounds (2-10) is the maximum of the first loosing bid and the
highest winning ask. Ties are randomly broken.
Role of the Graduate division (Market Maker)
The Graduate Division, as mentioned earlier, is the sole owner of all courses
until the first round of the auctioning process gets over. It also promises to buy back
all seats in all courses for a price of zero points thus allowing students to
unconditionally drop any course they wish at any given time before the last round of
the auction process is over. Of course, if a course were in demand then the student
would rather sell the seat for a higher price to another student.
Important Rules of the Auction:
1. Minimum bid amount is 100 points, minimum ask is 0 points (price at which
Graduate division promises to buy back all courses)
2. Total amount of bids in a round cannot exceed the total balance at the end of
the previous points.

54
3. Changes in available capacity mid-way through the auction process
a. Any increase in capacity is offered at the weighed average clearing
price based on data from already completed rounds
b. Any reduction / cancellation in capacity clearing prices paid by
students are refunded.
4. A student cannot hold multiple seats in the same section of a course. He / She
can hold multiple seats for a course as long as they are in different sections.
5. A student can hold seats even if there is a conflict in times. It is the students’
responsibility to adjust his/her portfolio of seats before the last round of
auctioning is over to resolve any time conflicts.
6. A student can bid and hold a portfolio of courses, which is worth more than
six credit units (maximum allowed, similar to the 15 credit unit cap placed by
the Smith School) until the last round of auctioning is finished. Again its his /
her responsibility to adjust the portfolio to be worth a maximum of 6 credit
units.
7. In case adjustments have to be made to the portfolio after the last round of
auctions has been closed, the following rules / penalties apply (permission of
the instructor and advisor are required):
Dropping a course after the first round:
a. Clearing price = 0 points (there are open seats in the section)
No 1000 point replenishment
No reimbursement of clearing price paid for the course
b. Clearing price > 0 points (No open seats in the section)

55
“W” on transcripts => withdrawn.
Undetermined auction point penalty.
Adding a course:
a. If there are seats available in the section (Open section)
Pay Max (Closing price, 100)
Pay 350 auction point penalty
Gets 1000 points on successful completion
b. If a seat becomes available in a closed section it is offered to the next
highest bidder as per the 10th round bids. This is continued until some
bidder accepts the offer. The bidder who accepts the offer:
Pay his / her 10th round bid for the course
Gets 1000 points on successful completion
Swapping Sections:
a. Switching to an open section
Pay clearing price of the costlier section (original /
destination)
Gets 1000 points on successful completion
b. Switching to an closed section
Pay the larger of the clearing price of the original section and
the WAP price of the destination section
Pay 350 auction point penalty
Will NOT receive 1000 points on successful completion
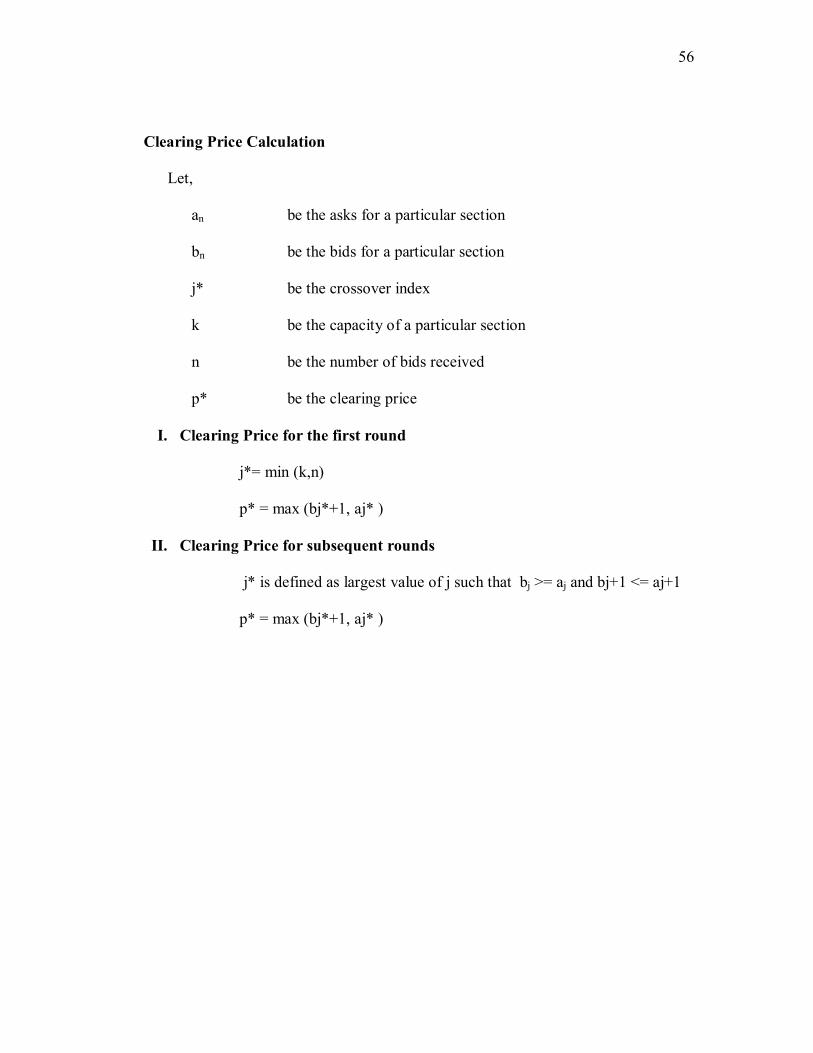
56
Clearing Price Calculation
Let,
an be the asks for a particular section
bn be the bids for a particular section
j* be the crossover index
k be the capacity of a particular section
n be the number of bids received
p* be the clearing price
I. Clearing Price for the first round
j*= min (k,n)
p* = max (bj*+1, aj* )
II. Clearing Price for subsequent rounds
j* is defined as largest value of j such that bj >= aj and bj+1 <= aj+1
p* = max (bj*+1, aj* )

57
APPENDIX B: Analytic Hierarchy Process
“The Analytic Hierarchy Process (AHP) is a decision-making technique used
in a wide variety of settings to rank alternative decisions. The method involves
breaking down a complex problem into a group of disjoint levels comprising of a
hierarchical structure and then establishing the priorities among elements of the
hierarchy. At the top of the hierarchy lies the macro decision.”
- “Outstanding Sports Records” by Prof. Bruce Golden, Prof. Wassil.
Let us consider a simple example of choosing a university to apply for
graduate education. This decision this becomes the “macro decision” mentioned in
the statement above. In this decision making scenario our alternatives are:
Johns Hopkins University
George Mason University
University of Maryland, College Park
The first step in AHP is to define criteria based on which the decision has to
be made. The following are the criteria based on which the decision has to be made:
Reputation
Academics
Costs
Distance from home
Availability of on-campus housing
The nest step is to define sub-criteria, is any, for each of the criteria
determined in the previous step. For example, the criteria “Costs” can have
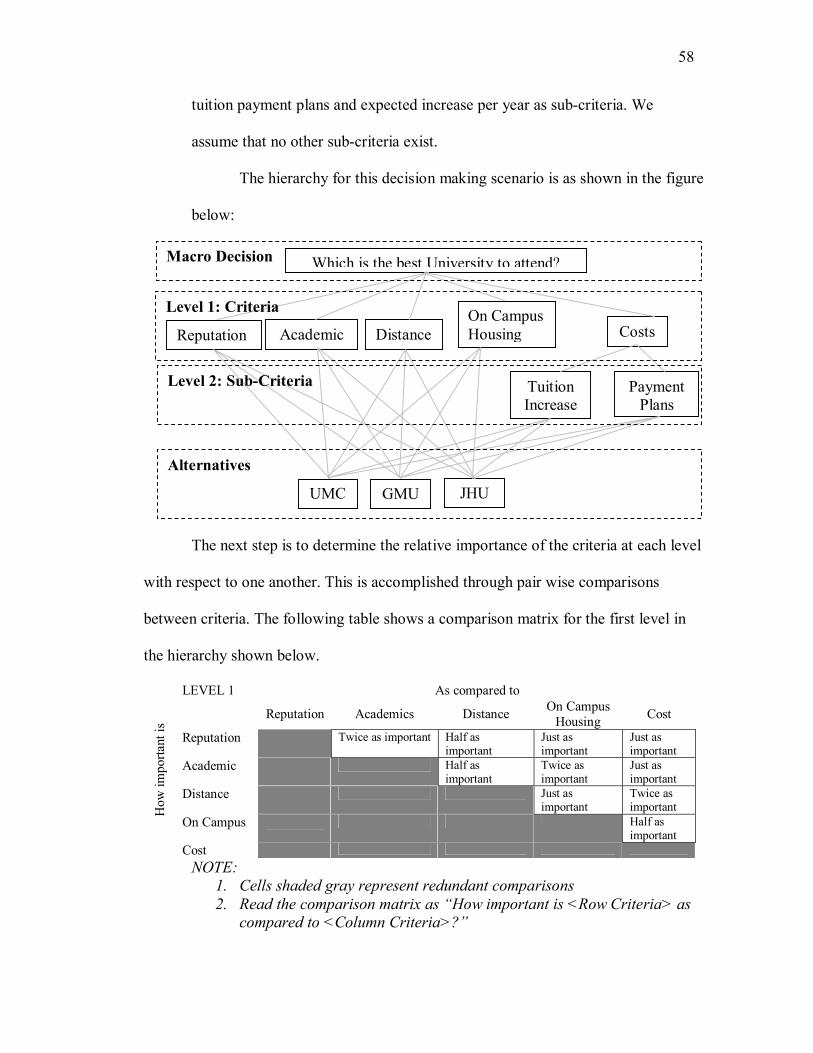
58
tuition payment plans and expected increase per year as sub-criteria. We
assume that no other sub-criteria exist.
The hierarchy for this decision making scenario is as shown in the figure
below:
The next step is to determine the relative importance of the criteria at each level
with respect to one another. This is accomplished through pair wise comparisons
between criteria. The following table shows a comparison matrix for the first level in
the hierarchy shown below.
LEVEL 1 As compared to Reputation Academics Distance On Campus
Housing Cost
Reputation Twice as important Half as important
Just as important
Just as important
Academic Half as important
Twice as important
Just as important
Distance Just as important
Twice as important
On Campus Half as important
How
impo
rtant
is
Cost
NOTE: 1. Cells shaded gray represent redundant comparisons 2. Read the comparison matrix as “How important is <Row Criteria> as
compared to <Column Criteria>?”
Which is the best University to attend?
Reputation Academic DistanceOn Campus Housing Costs
UMC GMU JHU
Tuition Increase
Payment Plans
Macro Decision
Level 1: Criteria
Level 2: Sub-Criteria
Alternatives

59
Such comparison are made at every level of the hierarchy; at the last level
comparison would be made between the alternatives, for e.g. comparing JHU, GMU
and UMCP on the basis of payment plans.
The last step in the process, which is done by the software, is to convert
qualitative responses into numbers.
LEVEL 1 As compared to Reputation Academics Distance On Campus
Housing Cost
Reputation 2 ½ 1 1 Academic ½ 2 1 Distance 1 2 On Campus ½ H
ow im
porta
nt is
Cost
The software calculates Eigen Value for each comparison matrix and
determines the ranking of each alternative.

60
APPENDIX C: The Print-on-Demand Page (modified to fit the page)
Your Tickets
Print Student Ticket
Students must present their valid UMCP Student I.D., and student ticket to be admitted.
The student and student guest entrance for football is located at Byrd Stadium's NORTH
GATE. The student entrance for basketball is located at the Southwest Gate at the Comcast Center.
Students who violate provisions of the Student Ticket Distribution Policy will be referred to
the Office of Judicial Programs (OJP) and, when necessary, to the Department of Public Safety (Campus Police). Violations that will result in referrals include, but are not limited to: (1) the sale or attempted sale of student tickets, (2) the duplication, replication, or alteration of student tickets, (3) the presentation of a false, duplicated, replicated, or altered Student ID, or the Student ID of another student, at the student entry gate or the Terrapin Ticket
Office, or (4) gaining or attempting to gain unauthorized access to the online student ticket distribution system or the personal account of another student.
Spectator Code of Conduct: Athletic event spectators please behave responsibly at all games. Threatening physical actions, disorderly or disruptive conduct will not be tolerated, and may result in removal from the game, denial of access to the campus and other penalties. Make
games a safe and enjoyable experience for all.

61
APPENDIX D: Ticketing Policy (Current as on Feb 25th 2004) 1.0 ONLINE STUDENT TICKET DISTRIBUTION
1.1 Students register online at www.tickets.umd.edu for student tickets to
regular season football and men’s basketball home games. [Online registration for
the NCAA men’s basketball tournament and football bowl games is determined on a
game-by-game basis.]
1.1.1 Students login using their campus email address and barcode number from
the back of their UMCP Student ID card.
1.1.1.1 Students who have lost or misplaced their UMCP ID or who cannot
read the barcode number can click here to look up the barcode online. Students can
also get a replacement ID at the Office of the Registrar in the Mitchell Building, 1st
Floor from 8:30 AM – 5:30 PM, Monday through Friday.
1.1.2 Currently enrolled, athletic-fee paying UMCP students are eligible to
receive one (1) ticket each to football and men’s basketball home games.
1.1.2.1 Students at the University of Maryland, Shady Grove campus may
become eligible to receive tickets for UMCP football and men’s basketball home
games by paying the appropriate student athletic fee. Contact the Office of Student
Services at Shady Grove at (301) 738-6023 for more information.

62
1.2 Students have secure, personal accounts from which to: (a) manage their
account information, (b) track their attendance history, (c) view their Loyalty Point
total (see 3.0 for details), (d) print their ticket (e) cancel a previously claimed ticket,
and (g) purchase student guest tickets for football, if available (see 5.0 for details).
1.3 Registration for each football and men’s basketball home game is open for
two (2) days. There is no advantage to being the first student to register, nor is there a
disadvantage to being the last student to register.
1.4 When the number of students that register is fewer than the number of
tickets available, all registered students receive email notification that (a) each student
has been awarded a ticket and (b) how and by what deadline to claim their ticket.
1.4.1 Students then have two (2) days to claim their ticket by: (a) printing the
ticket or (b) picking up the ticket in-person prior to gameday at the Terrapin Ticket
Office at the Comcast Center.
1.4.2 Following the two-day claim period for students who registered for tickets,
additional students who desire to attend the game can claim any available tickets
during the print-on-demand period up until kick-off/tip-off on gameday by (a)
printing out the ticket or (b) picking up the ticket in-person prior to gameday at the
Terrapin Ticket Office at the Comcast Center.

63
1.4.3 Students who claim a ticket but later decide not to attend the game for
whatever reason must cancel their ticket online no later than 12:00 Noon one day
prior to gameday to avoid losing Loyalty Points (see 3.2 for details).
1.5 If a greater number of students register for tickets than the number of
tickets available, then Loyalty Distribution is automatically initiated (see 2.0 for
details).
2.0 LOYALTY DISTRIBUTION
2.1 Loyalty Distribution is a loyalty-based lottery that is initiated only when
demand for tickets exceeds supply.
2.2 Students who register for tickets have entries in the lottery equal to the
number of Loyalty Points earned by attending previous games (see 3.0 for details).
2.2.1 Therefore, students can increase the opportunity to obtain tickets to future
games by attending games throughout the football or men’s basketball season.
2.3 Students who are awarded tickets via Loyalty Distribution receive email
notification regarding how and by what deadline to claim their tickets.

64
2.3.1 Students then have two (2) days to claim their ticket by: (a) printing the
ticket or (b) picking up the ticket in-person prior to gameday at the Terrapin Ticket
Office at the Comcast Center.
2.3.1.1 Tickets that are awarded but not claimed within two days revert back to
the Terrapin Ticket Office and are awarded to students on the waiting list (see 2.4 for
details).
2.4 Students who are not awarded tickets via Loyalty Distribution receive
email notification that they have been placed on the waiting list.
2.4.1 If tickets go unclaimed or are claimed and returned during Loyalty
Distribution, a second distribution occurs among registrants on the waiting list in
straight Loyalty Point order, with students again receiving email notification
regarding how and by what deadline to claim their tickets.
2.4.2 Students then have one (1) day to claim their tickets by: (a) printing the
ticket or (b) picking up the ticket in-person prior to gameday at the Terrapin Ticket
Office at the Comcast Center.
2.5 Following the second, one-day claim period, additional students who
desire to attend the game can claim any available tickets during the print-on-demand
period up until kick-off/tip-off on gameday by (a) printing out the ticket or (b)

65
picking up the ticket in-person prior to gameday at the Terrapin Ticket Office at the
Comcast Center.
2.6 Students who claim a ticket but later decide not to attend the game for
whatever reason must cancel their ticket online no later than 12:00 Noon one day
prior to gameday to avoid losing Loyalty Points (see 3.2 for details).
3.0 LOYALTY POINTS AWARDED FOR ATTENDANCE AT HOME
FOOTBALL & MEN’S BASKETBALL GAMES
3.1 Loyalty Points are awarded based on attendance at home games, which is
tracked via handheld scanners at the student entrance at Byrd Stadium and the
Comcast Center.
3.1.1 A student’s total number of Loyalty Points can never fall below zero (0).
3.1.2 Zero (0) Loyalty Points are earned simply for registering for a student ticket
or claiming a student ticket that has been awarded.
3.1.2.1 Attendance is required to earn Loyalty Points. Students must have
their tickets scanned at the student entry gates at Byrd Stadium or the Comcast Center
to earn Loyalty Points for attending a game.

66
3.1.3 One (1) Loyalty Point is earned for attending a game for which Loyalty
Distribution occurs because the demand for tickets exceeds the supply.
3.1.4 One (1) Loyalty Point is earned for attending a game that is played during
the official University winter break, irrespective of the demand for tickets, because
many students are away from campus.
3.1.5 Two (2) Loyalty Points are earned for attending a game for which Loyalty
Distribution does not occur because the demand for tickets does not exceed the
supply.
3.2 Ticket Cancellation and No-Show Policy. Students who claim a ticket but
later decide not to attend the game for whatever reason must cancel their ticket online
no later than 12:00 Noon one day prior to gameday to avoid losing Loyalty Points.
3.2.1 One (1) Loyalty Point is deducted if a student claims a ticket but (a) does
not attend the game and (b) cancels before kick-off/tip-off on gameday, but after the
ticket cancellation deadline of 12:00 noon one day prior to gameday.
3.2.2 Two (2) Loyalty Points are deducted if a student claims a ticket but (a) does
not to attend the game and (b) does not cancel the ticket prior to kick-off/tip-off on
gameday.

67
3.3 Loyalty Points are sport-specific. Points accumulated by attending
football games apply only to registration for future football games. Points
accumulated by attending men’s basketball games apply only to registration for future
basketball games.
3.4 Loyalty Points are not retained from one academic year to the next. All
student accounts begin each academic year with Zero (0) Loyalty Points in football
and men’s basketball.
4.0 STUDENT ADMISSION TO FOOTBALL AND MEN’S
BASKETBALL HOME GAMES
4.1 Basic Requirements: admission to all football and men’s basketball home
games requires that students present: (a) their valid student ticket and (b) their valid,
UMCP Student ID.
4.1.1 Each student ticket has printed on it (a) a unique barcode (1 of 30,000,000 per
game), (b) the student’s name, and (c) the student’s Entry Group and time, if
necessary for a sold out men’s basketball game (see 4.2 for details).
4.1.1 Student tickets are non-transferable. Students cannot buy, sell, or transfer
student tickets to other students, non-students, or any other person. This is designed
to eliminate the scalping of student tickets.
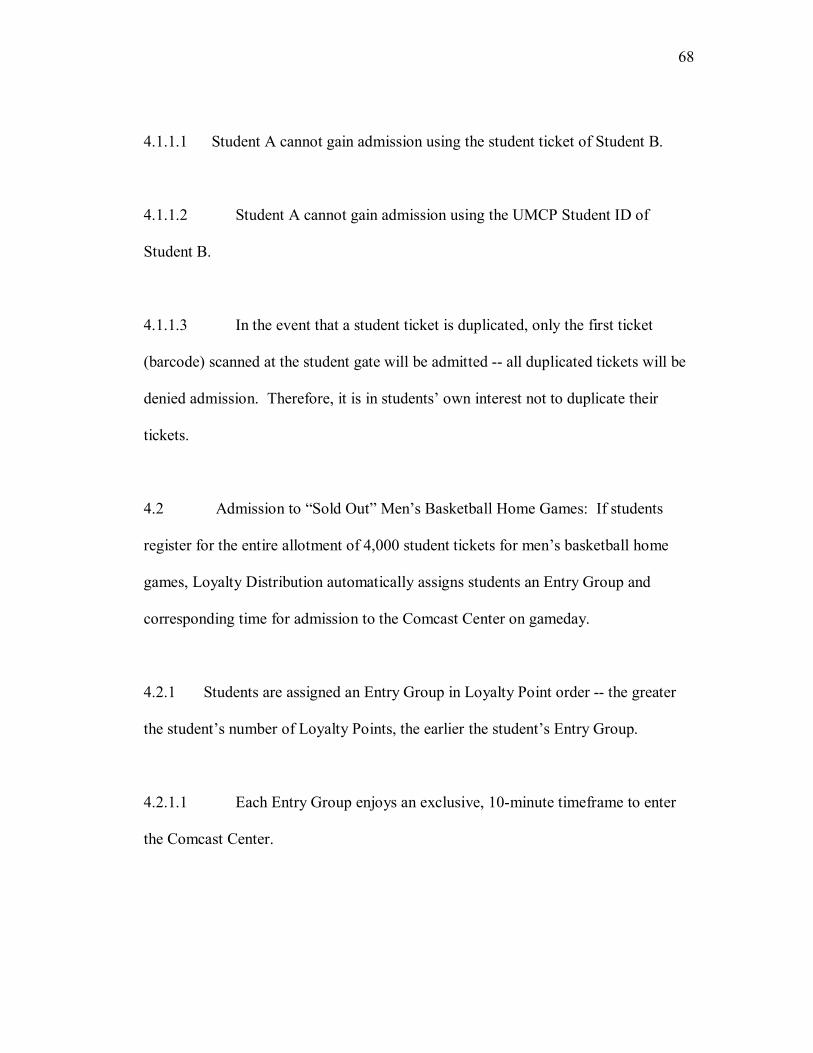
68
4.1.1.1 Student A cannot gain admission using the student ticket of Student B.
4.1.1.2 Student A cannot gain admission using the UMCP Student ID of
Student B.
4.1.1.3 In the event that a student ticket is duplicated, only the first ticket
(barcode) scanned at the student gate will be admitted -- all duplicated tickets will be
denied admission. Therefore, it is in students’ own interest not to duplicate their
tickets.
4.2 Admission to “Sold Out” Men’s Basketball Home Games: If students
register for the entire allotment of 4,000 student tickets for men’s basketball home
games, Loyalty Distribution automatically assigns students an Entry Group and
corresponding time for admission to the Comcast Center on gameday.
4.2.1 Students are assigned an Entry Group in Loyalty Point order -- the greater
the student’s number of Loyalty Points, the earlier the student’s Entry Group.
4.2.1.1 Each Entry Group enjoys an exclusive, 10-minute timeframe to enter
the Comcast Center.

69
4.2.1.2 Students’ Entry Group and corresponding time are printed their student
tickets.
4.2.1.3 Students can always enter later than the time designated for their Entry
Group, but never earlier.
4.2.2 Use of Entry Groups for admission to “sold out” men’s basketball home
games removes the need for reserved student seating as a means to (a) regulate lines
and (b) reduce the potential risk of injury created when students in line enter the
student section to claim their preferred seat.
4.3 All student tickets for football and men’s basketball are general admission
seating. This enables students to sit with friends and select their preferred seat
location within the student sections at Byrd Stadium and the Comcast Center.
5.0 STUDENT GUEST TICKETS
5.1 Football: students may purchase up to four (4) guest tickets each IF
tickets remain available after all deadlines for students to claim tickets have passed.
5.1.1 Students may purchase student guest tickets online or in person at the
Terrapin Ticket Office.

70
5.1.2 Student guest tickets are general admission seating.
5.1.3 Student guest tickets are non-refundable.
5.2 Men’s Basketball: student guest tickets are not available due to the
number of student tickets available (4,000) and the student demand for those tickets.
6.0 STUDENT TICKET ALLOTMENTS
6.1 Students receive 4,000 student tickets for men’s basketball home games in the
Comcast Center and 10,000 student tickets for football home games at Byrd Stadium.
6.2 The per game allotment of student tickets among the Maryland student
body is proportional to the percentage of athletic fee paid by each student enrollment
category: (a) fulltime undergraduate students receive 86%, (b) part-time
undergraduate students receive 4%, and (c) graduate students receive 10%.
6.2.1 Loyalty Distribution, when triggered, is conducted separately within these
categories.
6.2.2 If students in one enrollment category register for fewer than the number of
tickets allotted to that category, the tickets automatically roll-over and are awarded to

71
registrants of the other categories until tickets are awarded to all registrants or the
supply of tickets is exhausted.
6.3 Students can check their enrollment status with the Office of the Registrar
in the Mitchell Building, 1st Floor from 8:30 AM to 5:30 PM, Monday through
Friday.
7.0 VIOLATIONS OF THE STUDENT TICKET DISTRIBUTION POLICY
7.1 Students who violate provisions of the student ticket distribution policy
will be referred to the Office of Judicial Programs (OJP) and, when necessary, to the
Department of Public Safety (UMCP Police).
7.1.1 Violations that will result in referrals include, but are not limited to:
7.1.1.1 The sale or attempted sale of student tickets.
7.1.1.2 The duplication, replication, or alteration of student tickets.
7.1.1.3 The presentation of a false, duplicated, replicated, or altered UMCP
Student ID, or the UMCP Student ID of another student, at the student entry gate or
the Terrapin Ticket Office.

72
7.1.1.4 Attempting to enter a “sold out” men’s basketball home game in an
Entry Group earlier than assigned.
7.1.1.5 Gaining or attempting to gain unauthorized access to the online student
ticket distribution system or the personal account of another student.
7.2 Students found “responsible” for violations of the student ticket
distribution policy by OJP or convicted of a criminal act related to the student ticket
distribution policy, face the loss of all accumulated Loyalty Points in both football
and men’s basketball, in addition to other penalties.

73
BIBLIOGRAPHY Rothkopf , Michael H.; Park, Sunju, 2001, “An Elementary Introduction to Auctions”, INFORMS, November – December 2001 (pp83-97) Klemperer, Paul, 2001, “What Really Matters in Auction Design”, Working Paper, JEL Nos D44 (Auctions), L41 (Antitrust), L96 (Telecommunications) The Wharton School, University of Pennsylvania, 2002, “The Course Registration Auction for MBA Electives”, Academic Services Office. Ausubel, Lawrence M.; Peter Cramton, 1999, “Vickery Auctions with Reserve Pricing”, Working Paper, University of Maryland. G. Anandalingam, and R. Kwon, 2001, “On the Use of Vickrey Auctions for Spectrum Allocation in Developing Countries" Krishna, Vijay, 2002, “Auction Theory”, Academic Press; 1st edition (March 1, 2002) Kambil, Ajit; Van Heck, Eric, Van Heck, E., 2002, “Making Markets: How Firms Can Design and Profit from Online Auctions and Exchanges”, Harvard Business School Press; (June 24, 2002)