Title: Implication of the Cluster Analysis Using Greenhous ...
35
1 Title Page Original article Title: Implication of the Cluster Analysis Using Greenhous Gas Emissions of Asian Countries to Climate Change Mitigation Yongbum Kwon, Hyeji Lee and Heekwan Lee, Ph.D. *, 1 Department of Environmental Engineering, Incheon National University, Incheon, Republic of Korea 1 Visiting Scholar, International Institute for Applied Systems Analysis, Laxenburg, Austria * Corresponding author: Heekwan Lee Tel: +82-32-835-4752; Fax: +82-32-777-8468; E-mail: [email protected]
Transcript of Title: Implication of the Cluster Analysis Using Greenhous ...

1
Title Page
Original article
Title: Implication of the Cluster Analysis Using Greenhous Gas Emissions of
Asian Countries to Climate Change Mitigation
Yongbum Kwon, Hyeji Lee and Heekwan Lee, Ph.D.*, 1
Department of Environmental Engineering, Incheon National University, Incheon, Republic of Korea
1 Visiting Scholar, International Institute for Applied Systems Analysis, Laxenburg, Austria
* Corresponding author: Heekwan Lee
Tel: +82-32-835-4752; Fax: +82-32-777-8468; E-mail: [email protected]

2
Title: Implication of the Cluster Analysis Using Greenhouse Gas Emissions of Asian
Countries to Climate Change Mitigation
ABSTRACT
Climate change caused by excessive emission of greenhouse gases (GHGs) into the atmosphere
has gained serious attention from the global community for a long time. More and more
countries have decided to propose their goals such as Paris agreements, to reduce emitting these
heat trapping compounds for sustainability. The Asian region houses dramatic changes with
diverse religions and cultures, large populations as well as a rapidly changing socio-economic
situations all of which are contributing to generating a mammoth amount of GHGs, hence they
require calls for related studies on climate change strategies. After pre-filtering of GHG
emission information, twenty four Asian countries have been selected as primary target
countries. Hierarchical cluster analysis method using complete linkage technique was
successfully applied for appropriate grouping. Six groups were categorized through GHG
emission properties with major and minor emission sectors based on the GHG inventory
coverings energy, industrial processes, agriculture, waste, land use change and forestry and
bunker fuels. Assigning six groups using cluster analysis finally implied that the approach to
establish GHG emission boundaries were meaningful to develop further mitigation strategies.
Following the outcome of this study, calculating amount of reduction potential in suitable
sectors as well as determining best practice, technology and regulatory framework can be
improved by policy makers, environmental scientists and planners at the different levels.
Therefore, this work on reviewing a wide range of GHG emission history and establishing
boundaries of emission characteristics would provide further direction of effective climate
change mitigation for sustainability and resilience in Asia.
Keywords: GHGs inventory; cluster analysis; Asian countries; climate change mitigation

3
1. INTRODUCTION
Global warming and climate change produced by superfluous emission of greenhouse
gases (GHGs) into the atmospheric environment is an insistent concern for both the mother
nature and human-beings. Due to the potential impacts of extreme weather, for instance,
abnormal climate changes, rising sea levels, cyclones, droughts and the issues of desertification
as well as loss of biodiversity, the United Nation Framework Convention on Climate Change
(UNFCCC) 21st Conference of the Parties recently made the Paris agreement (COP21) to
reflect even further intensified restriction (Rhodes 2016). In fact, global climate change and its
unspecified impacts have lasted for ages long across the world. In Bangladesh, more than
130,000 people were killed in April 1990 due to unprecedentedly fierce storm (Huq 2001), the
Himalayas, reserving the largest glaciers except the polar region, have lately been melting
down due to increasing global temperature (Bajracharya et al. 2007), and even the global
warming in South Asia is mostly to be above the global average (Knox et al. 2012). Moreover,
Clarke et al. (2007) has reported that the concentration of carbon dioxide in the atmosphere
will be elevating up to between 700ppmv and 900ppmv in 2100, considering the growth in
world populations to 9.9 billion, GDP growth patterns with historical experience and
background, energy production as well as consumption based on the three different models,
namely IGSM, MERGY and MiniCAM.
Although the formal negotiation of Kyoto Protocol in 1997 with instruments that
Emission Trading (ET), Clean Development Mechanism (CDM) and Joint Implementation (JI)
had been developed and implemented, it was not sufficiently affordable to reach successful
international climate cooperation for reduction of GHG emissions (Falkner 2016). As result of
Paris agreement, 195 countries including not only Annex Ⅰ and Annex Ⅱ but also Non-Annex Ⅰ
countries have agreed and proposed their greenhouse gas reduction goals through
implementing Intended Nationally Determined Contribution (INDC) for sustainability and
resilience in global village (UNFCCC 2015). The Asian region maintains dynamic changes
owing to its large amount of inhabitants coming from variety of religious, cultural and
economic backgrounds which can provide an interesting and important case for a sensational
study in terms of the impact on the environment (Marcotullio et al. 2012). Furthermore, Botzen
et al. (2008) reported that average annual growth, especially in energy-related carbon dioxide
emissions between 2004 and 2030 of major countries in Asia such as China (3.4%) and India

4
(2.6%) overtake USA (1.1%), even more than the total growth of the world (1.8%). Thus, this
paper has aimed to explore the GHG emission characteristics among the 24 Asian countries
(Armenia, Azerbaijan, Bangladesh, Brunei, Cambodia, China, Cyprus, India, Indonesia, Iran,
Iraq, Japan, Kazakhstan, South Korea, Kuwait, Mongolia, Myanmar, Nepal, Oman, Pakistan,
Thailand, Turkey, United Arab Emirate and Vietnam) using R®; a language for statistical
analysis and visualization.
There are more and more research articles with different perspectives on the analysis
of climate change mitigation implementations at the assorted levels (Backman et al. 2017;
Kafle et al. 2017; Mottet et al. 2017; Wigand et al. 2017). Even if numerous scientists and
decision makers have suggested climate strategies covering public policy, national GHG
reduction plan as well as regional climate response, not much incisive intimations were
introduced. For those reasons, cluster analysis was applied on the basis of GHG emissions
inventory data highlights in 2013 and 6 sectoral emission data; Energy, Industrial process,
Agriculture, Waste, Land-Use Change and Forestry (LUCF) as well as Bunker fuel from 2004
to 2013 in order to clarify the emission patterns and their properties. At the same time, the result
of this article that drawing boundaries according to GHG emission peculiarities finally
shepherds to develop further climate change mitigation strategies. Therefore, this paper
analyzing GHG emission history across certain Asian countries by using cluster technique and
by investigating the possibly reducible sectors will be providing keen insights to drive further
climate mitigation strategies for well-being of humanity and ecology.

5
2. METHODOLOGY
2.1 Literature review
Geographically, The Asian region is mainly subdivided into five areas that Eastern
Asia, Southeast Asia (Indochina peninsula and the Malay Archipelagos), Southwest Asia,
Central Asia and Southern Asia with 47 independent countries as in Table 1.
Table 1. Geographically and historically classified independent countries in Asian region
The Climate Access Indicators Tool (CAIT, http://cait.wri.org), the main data source
in this paper is an online visualization explorer organized by World Resources Institute (WRI).
CAIT contains amazingly useful GHG emissions data in worldwide that can provide UNFCCC
climate negotiations by sharing a novel approach to climate equity. The raw data is basically
available for the period 1990 to 2013 and the data source of each country is compiled by
globally prestigious agencies and organizations; International Energy Agency (IEA),
international energy statistics; U.S Energy Information Administration (EIA), global non-CO2
GHG emissions; U.S Environmental Protection Agency (EPA) as well as agriculture statistics;
Eastern Asia China Japan Korea, Dem. Rep.
Korea (South)
Southeast
Asia
Indochina
peninsula
Cambodia Laos Myanmar
Thailand Vietnam
Malay
Archipelagos
Brunei East Timor Indonesia
Malaysia Philippines Singapore
Southwest Asia
Afghanistan Armenia Azerbaijan
Bahrain Cyprus Georgia
Iran Iraq Israel
Jordan Kuwait Lebanon
Oman Qatar Saudi Arabia
Syria Turkey United Arab Emirates
Yemen
Central Asia Kazakhstan Kyrgyzstan Mongolia
Tajikistan Turkmenistan Uzbekistan
Southern Asia
Bangladesh Bhutan India
Maldives Nepal Pakistan
Sri Lanka

6
Food and Agriculture Organization of the United Nations (FAO).
Many utilized data is also accessible such as CO2 and/or GHG emission data per capita,
socio-economic (e.g. population, GDP-USD and energy use) per capita, CO2 and/or GHG
emission data per GDP as well as cumulative population and energy use per GDP from 1960’s.
Unfortunately, there are some missing data or inaccurate emission history to refer through. For
example, Afghanistan does not have emission data, especially in energy sector and land-use
change and forestry (LUCF). Georgia, Israel, Jordan, Qatar, Saudi Arabia, Tajikistan,
Turkmenistan and Yemen have no LUCF data for several years, and there is no energy sector
data in Bhutan during recent 10 years of 2004 to 2013. Laos and Maldives have omitted data
from energy and bunker fuels for the target years. In case of Syria, none of data has been
updated during the target period. Furthermore, Afghanistan, Bhutan, Laos, Maldives and some
other countries have omitted energy subsector that electricity and heat, manufacturing and
construction, transportation, other fuel combustion as well as fugitive emission. All acceptable
cases including data repletion, geographical and economical diversity as well as the population
considered, it has been filtered and determined that 24 countries (see Table 2) are eligible for
available recent 10 years (2004-2013) of GHGs emissions from the CAIT data resource.
As several previous papers have already studied that economic status and GHG
emission are closely related due to energy consumption and urbanization (Aaheim et al. 2012;
Li et al. 2016; Marcotullio et al. 2012; Timilsina and Shrestha 2009). Furthermore, Dulal and
Akbar (2013) emphasized that the main four factors consisting of economic base of the cities,
urban formation, transportation structure and lay out as well as waste management system
contribute to the growing emissions from the cities. Therefore, it is required to understand
different kinds of social trends including population, GDP and economical background as
shown in Table 2.

7
Table 2. Selected countries in Asia for GHG emission analysis
1) Central Intelligence Agency, CIA (2016)
2) International Monetary Fund, IMF (2016)
3) World Bank (2004-2015)
Country Population 1) Nominal GDP 2)
(Billions USD)
Economical
history 3) Country Population 1)
Nominal GDP 2)
(Billions USD)
Economical
history 3)
Armenia 3,051,250 10.74
Kazakhstan 18,360,353 157.88
Azerbaijan 9,872,765 38.62
Korea (South) 51,732,586 1,498.17
Bangladesh 156,186,882 248.85
Kuwait 2,832,776 110.52
Brunei 436,602 12.33
Mongolia 3,031,330 10.27
Cambodia 15,957,223 20.95
Myanmar 56,890,418 72.37
China 1,373,541,278 11,391.67
Nepal 29,033,914 23.32
Cyprus 1,250,575 19.64
Oman 3,355,262 71.33
India 1,266,883,598 2,451.24
Pakistan 201,995,540 270.95
Indonesia 258,316,051 1,020.07
Thailand 68,200,824 432.91
Iran 82,801,633 368.43
Turkey 80,274,604 793.72
Iraq 38,146,025 189.43
United Arab Emirates 5,927,482 407.21
Japan 126,702,133 4,730.32
Vietnam 95,261,021 215.83

8
2.2 Cluster analysis
The principal of pattern recognition is introduced into various parts of the study such as
mechanical engineering, medical science, computer vision, marketing, biology and psychology
(Al-Nuaimy et al. 2000; Jain et al. 2000; Wright et al. 2010). Pattern recognition is known as
grouping method according to specific criteria and it is typically classified into variety of
problems like description, classification and clustering. In this paper, optimal cluster
methodology was applied in order to assign suitable groups that represent particular emission
characteristics, and thus this will provide further direction to develop climate change mitigation.
There are two standard clustering strategies including hierarchical clustering and partitioning
(non-hierarchical) methods (e.g. K-means algorithm, PAM; partitioning around medoids and
CLARA; clustering large applications) (Ferrari and De Castro 2015; Kaufman and Rousseeuw
2009; Zadegan et al. 2013) as described in Figure 1.
Figure 1. Conceptual diagram for hierarchical clustering
We adopted hierarchical technique since it is not required to pre-specify the number of
clustered group whereas K-means clustering requires so (Li et al. 2014). Hierarchical clustering

9
is commonly designed by two types of methods which are the agglomerative hierarchical
method and divisive hierarchical method (Bouguettaya et al. 2015). The agglomerative method
known as AGNES starts with n (the number of observations) groups and gradually merges into
the most similar groups until one station is left. The divisive clustering (DIANA), on the other
hand, is the opposite of agglomerative method that begins with one large cluster and
consecutively split the root until the all objects have a small single leaf. However,
agglomerative clustering is preferred rather than DIANA because of its computational
efficiency (Webb 2003). In addition, there are commonly five different methods onto
agglomerative hierarchical clustering, in particular single linkage, complete linkage, centroid
linkage, average linkage and Ward’s method according to the calculation methods of distance
between each cluster (Bouguettaya et al. 2015; Murtagh and Legendre 2014). Single linkage
method computes the smallest distance between clusters and merge using minimum distance
(Ferrari and De Castro 2015). Complete linkage, on the contrary, defines the maximum distance
calculated between the observations (Ryberg 2015). Centroid linkage considers the distance
calculated between the centroids of two groups (Kasneci et al. 2014). Whenever an observation
is added or subtracted, the centroid distance is recalculated. The distance between two different
groups using average linkage method that starts similar way as single and complete linkage
considers the cluster criterion as average distance (Sibley et al. 2014). Ward’s method uses the
incremental sum of the squares between two similar group and it minimizes the total within
cluster variance (Martinez and Martinez 2007). Hence, each clustering linkage can be
computed by distance matrix following in Figure 2.
Figure 2. Agglomerative hierarchical clustering algorithm

10
3. RESULT AND DISCUSSION
3.1 Overview of GHG emissions
This study has reviewed the GHG emission properties in 24 Asian countries including
Armenia, Azerbaijan, Bangladesh, Brunei, Cambodia, China, Cyprus, India, Indonesia, Iran,
Iraq, Japan, Kazakhstan, South Korea, Kuwait, Mongolia, Myanmar, Nepal, Oman, Pakistan,
Thailand, Turkey, United Arab Emirate and Vietnam. All selected countries in this study with
the exception of Cambodia and Cyprus, experienced momentous GHGs emission growth
during the years of 2004 to 2013. As seen from Table 3, China (45.88%), India (43.31%) and
Iraq (41.72%) have the most dramatic growth rate whereas the world has 14.22 % of growth
rate. Particularly, the GHG emission growth rates of most selected countries that China, India,
Iran, South Korea, Thailand, Pakistan, Turkey, Kazakhstan, Iraq, United Arab Emirates,
Vietnam, Kuwait, Bangladesh, Oman, Mongolia, Azerbaijan, Nepal and Armenia are higher
than the world average which indicates rapid growth of GHG emissions. On the contrary, two
countries, Cambodia and Cyprus have remarkably decreased which rarely happens compared
to the international trend, even though the declined amount is not that high.
Table 3. Comparison of GHG emissions growth between the year of 2004 and 2013 including
Land-Use Change and Forestry (LUCF)
Rank Country 2004
(Mt CO2eq) Country
2013
(Mt CO2eq)
Rate
(%)
World 42,341.58 World 49,362.63 14.22
Asia 16,088.41 Asia 24,251.33 33.66
1 China 6,250.72 China 11,467.59 45.88
2 Indonesia 1,877.73 India 3,047.67 43.31
3 India 1,727.85 Indonesia 2,163.73 13.22
4 Japan 1,298.90 Japan 1,393.35 6.78
5 Korea (South) 543.19 Iran 797.20 32.61
6 Iran 537.24 Korea (South) 673.62 19.36
7 Thailand 317.85 Thailand 398.50 20.24
8 Turkey 281.06 Pakistan 356.30 22.23
9 Pakistan 277.09 Turkey 350.49 19.81

11
10 Kazakhstan 200.10 Kazakhstan 314.31 36.33
11 United Arab Emirates 184.79 Iraq 284.35 41.72
12 Myanmar 175.77 United Arab Emirates 281.53 34.36
13 Kuwait 165.82 Vietnam 241.82 34.06
14 Iraq 165.72 Myanmar 201.58 12.80
15 Vietnam 159.47 Kuwait 201.26 17.61
16 Bangladesh 149.77 Bangladesh 194.01 22.80
17 Oman 66.42 Oman 106.02 37.35
18 Cambodia 52.84 Mongolia 63.61 25.13
19 Azerbaijan 52.64 Azerbaijan 62.68 19.07
20 Mongolia 47.62 Cambodia 51.86 -1.90
21 Nepal 34.05 Nepal 42.63 20.11
22 Brunei 18.82 Brunei 19.92 5.48
23 Cyprus 9.56 Armenia 8.59 25.79
24 Armenia 6.38 Cyprus 8.16 -17.16
In addition, the total GHG emissions (Mton CO2eq) and its sectoral emission data
including the each percentage in 2013 are summarized in Table 4. Each selected country has
different emission characteristics possibly influenced by their population, economic situations
(GDP growths), industrial structures (e.g. primary industry, secondary industry and tertiary
industry), waste management system, energy generations and usage (e.g. thermal power
generation, nuclear power generation, the amount of fossil fuel use, renewable energy
application), topographical features and land use (e.g. desert, mountainous area, alpine region
and forest area) as well as climatic condition (e.g. tropical climate, temperate climate and dry
climate) (An and Sauer 2004; Liu et al. 2012; Searchinger et al. 2008; Weisser 2007; Woodcock
et al. 2009).

12
Table 4. Total GHG emissions including sectoral data and percentage in 2013
(Unit: Mt CO2eq)
Country Total GHG
emissions Energy (%)
Industrial
process (%)
Agriculture
(%) Waste (%) LUCF (%)
Bunker fuels
(%)
World 49362.63 35520.28 3054.3 5179.42 1507.25 2996.05 1105.33
Armenia 8.59 5.94 (69.15) 0.60 (6.98) 1.35 (15.72) 0.71 (8.27) -0.15 (-1.75) 0.14 (1.63)
Azerbaijan 62.68 59.59 (95.07) 1.49 (2.38) 6.42 (10.24) 2.23 (3.56) -8.47 (-13.52) 1.42 (2.27)
Bangladesh 194.01 62.42 (32.17) 8.18 (4.22) 74.51 (38.41) 18.52 (9.55) 29.08 (14.99) 1.30 (0.66)
Brunei 19.92 18.48 (92.77) 0.26 (1.31) 0.14 (0.70) 0.15 (0.75) 0.38 (1.91) 0.51 (2.56)
Cambodia 51.85 7.30 (14.07) 0.63 (1.21) 18.78 (36.22) 0.39 (0.75) 24.57 (47.38) 0.19 (0.37)
China 11467.59 9430.23 (82.24) 1408.35 (12.28) 697.90 (6.08) 198.53 (1.73) -312.08 (-2.72) 44.66 (0.39)
Cyprus 8.10 5.63 (69.46) 0.57 (7.04) 0.38 (4.69) 0.36 (4.43) -0.30 (-3.76) 1.47 (18.14)
India 3047.67 2027.86 (66.54) 192.64 (6.32) 628.27 (20.62) 60.28 (1.97) 122.29 (4.01) 16.33 (0.54)
Indonesia 2163.73 489.11 (22.61) 30.23 (1.40) 160.28 (7.41) 64.72 (2.97) 1416.30 (65.47) 3.09 (0.14)
Iran 797.20 620.21 (77.80) 39.78 (4.99) 34.70 (4.35) 22.13 (2.78) 67.08 (8.41) 13.30 (1.67)
Iraq 284.36 260.98 (91.78) 6.10 (2.15) 8.62 (3.03) 8.88 (3.12) -2.04 (-0.72) 1.82 (0.64)
Japan 1393.35 1240.08 (89.00) 87.48 (6.27) 21.23 (1.52) 4.55 (0.33) 7.47 (0.54) 32.54 (2.34)
Kazakhstan 314.31 286.10 (91.02) 4.50 (1.43) 18.41 (5.86) 4.72 (1.51) 0.08 (0.03) 0.50 (0.16)
Korea (South) 673.62 584.13 (86.72) 65.41 (9.71) 12.91 (1.92) 11.09 (1.64) -39.60 (-5.88) 39.68 (5.89)
Kuwait 201.26 191.02 (94.92) 3.41 (1.69) 0.39 (0.19) 0.95 (0.47) -0.02 (-0.01) 5.51 (2.74)
Mongolia 63.61 19.46 (30.59) 0.16 (0.25) 18.84 (29.62) 0.19 (0.30) 24.84 (39.05) 0.12 (0.19)
Myanmar 201.58 22.05 (10.94) 0.33 (0.16) 64.66 (32.08) 11.71 (5.81) 102.70 (50.95) 0.13 (0.06)
Nepal 42.63 11.86 (27.82) 1.54 (3.62) 21.84 (51.23) 0.81 (1.89) 6.27 (14.71) 0.31 (0.73)
Oman 106.02 96.37 (90.90) 2.89 (2.72) 1.60 (1.51) 0.93 (0.88) 0.00 (0.00) 4.23 (3.99)
Pakistan 356.30 156.30 (43.87) 16.75 (4.70) 147.06 (41.27) 6.67 (1.87) 28.60 (8.03) 0.92 (0.26)
Thailand 398.50 264.64 (66.41) 27.04 (6.79) 67.62 (16.97) 10.13 (2.54) 14.94 (3.74) 14.13 (3.55)
Turkey 350.49 291.65 (83.21) 38.12 (10.88) 43.81 (12.50) 34.88 (9.95) -64.86 (-18.51) 6.89 (1.97)
United Arab Emirates 281.53 203.13 (72.15) 12.17 (4.32) 1.64 (0.58) 4.47 (1.59) -0.21 (-0.07) 60.33 (21.43)
Vietnam 241.82 153.74 (63.58) 29.84 (12.34) 63.93 (26.43) 9.25 (3.83) -17.67 (-7.31) 2.73 (1.13)

13
Figure 3. GHG inventory data (emission percentage) for selected countries in 2013
Most of countries in Figure 3, for example, have significant portion of emissions from
energy sector, especially Azerbaijan, Brunei, Iraq, Kazakhstan, Kuwait and Oman are occupied
by more than 90 % of energy sector. In addition, China, Japan, South Korea and Turkey also
have more than 80 % of energy sector emissions. China, Turkey and Vietnam emit more than
10 % of total national greenhouse gases from industrial parts, besides India, Japan, South Korea
and Thailand also generate comparably large amount of emission gas through industrial sector.
Particularly, industrial processes are closely associated with major non-CO2 greenhouse gases
covering sulfur hexafluoride (SF6, GWP: 22,800, when GWP of CO2 is standardized as of ‘1’)
uses dielectric insulator, electronic equipment production including electric cables and buses
as well as circuit switchgear (Sulbaek Andersen et al. 2017), nitrous oxide (N2O, GWP: 298)
which is the source of adipic acid and nitiric acid production (Zhang et al. 2015), and even
applied for pain management during the medical treatment (Schneider et al. 2017),
-20%
0%
20%
40%
60%
80%
100%
Energy Industrial Processes
Agriculture Waste
Land-Use Change and Forestry Bunker Fuels

14
hydrofluorocarbons (HFCs, GWP: 124-14,800) normally used for semiconductor
manufacturing and ozone depleting substances production (Zhang et al. 2015) as well as
perfluorocarbons (PFCs, GWP: 7,390-12,200) generated in electrolysis process especially
during anode effects (AEs) (Liu et al. 2016; Vogel et al. 2017). Although non-CO2 GHGs like
SF6, N2O, HFCs and PFCs are generally of small amounts (Montzka et al. 2011), their usage is
remarkably important in the dispute against global warming and climate change response due
to high global warming potential (GWP, relative measure to compare global warming impacts)
(Jiang et al. 2016). Some countries such as Bangladesh, Cambodia, India, Mongolia, Myanmar,
Nepal, Pakistan and Vietnam have more than 20 % of total GHG emissions from agriculture
sector. Interestingly, the emissions from agriculture sector in Bangladesh, Cambodia, Myanmar
and Nepal are even higher than these in energy sector. In terms of land-use change and forestry
(LUCF), it can be classified as two groups that positive quantities (+) of LUCF (Bangladesh,
Brunei, Cambodia, India, Indonesia, Iran, Japan, Kazakhstan, Mongolia, Myanmar, Nepal,
Pakistan, and Thailand) as well as negative quantities (-) of LUCF (Armenia, Azerbaijan, China,
Cyprus, Iraq, South Korea, Kuwait, Turkey, United Arab Emirates and Vietnam). Those aspects
can be determined as the contribution of forestry either carbon emission sources as a result of
deforestation and degraded forest (+) or the sink of carbon through forest conservation and
enhancing carbon storages in degraded forest land area (-) (Lasco and Pulhin 2000). Armenia
and Turkey tend to emit comparably large amount of GHGs from waste sector mainly
contributed by waste (or landfill), anaerobic digester biogas, incineration and wastewater.
Referring bunker fuels used the most in vessel fuel, power generation, boiler fuel and factory
machines, Cyprus (18.14%) and United Arab Emirates (21.43%) tend to emit relatively large
amount of greenhouse gas.
3.2 Grouping methodology using effective clustering approach
In order to determine suitable clustering method, several hierarchical clustering
techniques that single linkage, complete linkage, centroid linkage, average linkage and Ward’s
method were compared for reviewing GHG emission characters across Asian countries. One
of the major issues when adapting cluster analysis is to define the best number of clusters for
instance, which steps should be terminated on the clustering process. Figure 4 shows one of
the approaches for hierarchical clustering to determine optimal clusters that elbow method; the
distance between each cluster (correlation between selected countries) versus optimum number

15
of clusters for complete linkage as guidance. According to the Figure 4, the value on y-axis
(within groups sum of squares; value of differences between each station) rapidly goes down
with increasing the number of clusters from 1. The elbow in the curve finally indicates number
of clusters=6 that six is an affordable estimate of the number of clustering groups.
Figure 4. Determination for the suitable number of clusters
Table 5 summarizes the number of optimal clusters within different techniques of
clustering method. It is certainly clear that single linkage technique arranges most of the groups
(15 stations) into one cluster also, centroid and average linkage methods have 12 and 13 clusters
in a single group. Ward’s methods has equally distributed the clusters than single linkage,
centroid linkage and average linkage but not clearly arranged rather than complete technique.
For example, Armenia, Turkey and Bangladesh gathered onto the same group, even though
Bangladesh mainly emits the greenhouse gas through agriculture sector, whereas Armenia and
Turkey mostly generate from energy and agriculture. Furthermore, emission tendency of LUCF
are contrasting that Armenia and Turkey have the negative quantities while Bangladesh has the
positive quantity which is not reasonably evaluated. Finally, Complete linkage method most
reasonably assigns each station among the 24 clusters that Group A: 4; Group B: 3; Group C:
2; Group D: 3; Group E: 6; Group F: 6 as summarized in Table 5 and plotted in Figure 5.

16
Table 5. The number of clusters within each applied clustering method
Clustering method A B C D E F G
Single linkage 2 1 2 1 15 1 2
Complete linkage 4 3 2 3 6 6
Centroid linkage 2 1 1 5 12 1 2
Average linkage 2 4 2 13 1 2
Ward’s method 2 4 6 2 7 3
Based on the technical knowledge and national GHGs inventory data in this paper,
twenty four Asian countries have been analyzed with the most acceptable cluster model that
complete linkage technique. Clustering solution using complete linkage has been performed as
shown Figure 5 with cluster dendrogram. Six cluster groups were produced that Group A:
Cambodia, Indonesia, Mongolia and Myanmar; Group B: Bangladesh, Nepal and Pakistan;
Group C: Cyprus and United Arab Emirates; Group D: Armenia, Turkey and Vietnam; Group
E: Azerbaijan, Brunei, Iraq, Kazakhstan, Kuwait and Oman; Group F: China, India, Iran, Japan,
South Korea and Thailand.
Figure 5. Cluster dendrogram computed by complete linkage technique

17
3.3 Sectoral analysis for the clustered groups
Based on the complete linkage solution, six groups have been assigned. Figure 6 to
Figure 11 describe the greenhouse gas emissions histories for 10 years of 2004 to 2013. Group
A; Cambodia, Indonesia, Mongolia and Myanmar particularly tend to emit from LUCF
(Cambodia, 47.38%; Indonesia, 65.47%; Mongolia, 39.05% and Myanmar, 50.95%),
agriculture (Cambodia, 36.21%; Indonesia, 7.41%; Mongolia, 29.62% and Myanmar, 32.08%)
and following a little energy sector especially in Cambodia (14.08%), Indonesia (22.61%) as
well as Myanmar (10.94%) in 2013 and these properties have been endured since 2004. On the
other hand, all the countries in Group A generated extremely few amount of GHG through
industrial process (0.72±0.49%) and bunker fuel (0.22±0.15%) during 10 years.
Figure 6. GHG inventory of Group A for 10 years (2004-2013)
(a) Cambodia (b) Indonesia
(c) Mongolia (d) Myanmar

18
Sasaki (2006) reported Cambodia has lost about 2.5 million hectare that annually about
0.7% over 30 years from 1970s as a result of deforestation and logging. Furthermore,
Murdiyarso and Lebel (2007); Verchot et al. (2010) have pointed out that the deforestation
mainly played due to peat fire in Southeast Asia including Indonesia, through stopping land
fires however, LUCF sector could be reduction opportunities.
Figure 7. GHG inventory of Group B for 10 years (2004-2013)
In case of Group B in 2013, emissions onto agriculture sector in Bangladesh, 38.41%;
Nepal, 51.23% and Pakistan, 41.27% present a vast portion that are slightly higher (Bangladesh,
32.17% and Nepal, 27.82%) or similar (Pakistan, 43.87%) amount with energy sector, for
reference, the ten-year average GHG emissions of agriculture sector are Bangladesh, 43.09%;
Nepal, 48.68% and Pakistan, 40.01% respectively. Moreover, Group B generally indicates to
(a) Bangladesh (b) Nepal
(c) Pakistan

19
emit less than 1% of total GHG emissions from bunker fuel during 2004 to 2013 (in average,
Bangladesh, 0.65%; Nepal, 0.54 and Pakistan, 0.29%). Actually in Nepal, the emissions from
LUCF were aberrantly higher in 2004 and 2005 despite LUCF sector during 2006 to 2013
maintained 5.8 to 6.5 MtonCO2eq. The possible reason of inconsistency in the data is that there
might be human errors such as data omission and/or data processing error when the national
GHG data is calculated (Rypdal and Winiwarter 2001), therefore, we interpolated the correction
value computed using trend line (y=0.686x+5.5935) instead of abstruse LUCF data in 2004
and 2005.
Figure 8. GHG inventory of Group C for 10 years (2004-2013)
Figure 8 shows GHG emission histories for Cyprus and United Arab Emirates (UAE)
belonging Group C. Both countries mostly emit the greenhouse gas from energy sector that
Cyprus, 71.20% and UAE, 70.75% as ten-year average. According to the previous studies,
Cyprus and UAE are completely dependent more than 95% on the primary energy (Juaidi et al.
2016; Mirasgedis et al. 2004). Most of all, Mirasgedis et al. (2004) reported that Cyprus mostly
uses heavy fuel among coal, crude oil, diesel, gasoline as well as any other liquid fuels, and the
expected heavy fuel use would be continuously growing. For that reasons, the emissions from
bunker fuel are comparably higher that Cyprus, 15.71±2.45% and UAE, 23.12±2.21% during
(a) Cyprus (b) United Arab Emirates

20
10 years, otherwise most of target countries have maintained no more than 5%. Additionally,
Group C tends to be partially affected by energy sector emission although the emissions from
other sectors have been constantly maintained during 2004 to 2013. For instance, total emission
in Cyprus has been decreased due to the reduction of energy sector emission since 2008, on the
other hand the total amount of emission in UAE has been increased because of the emission
growth of energy sector.
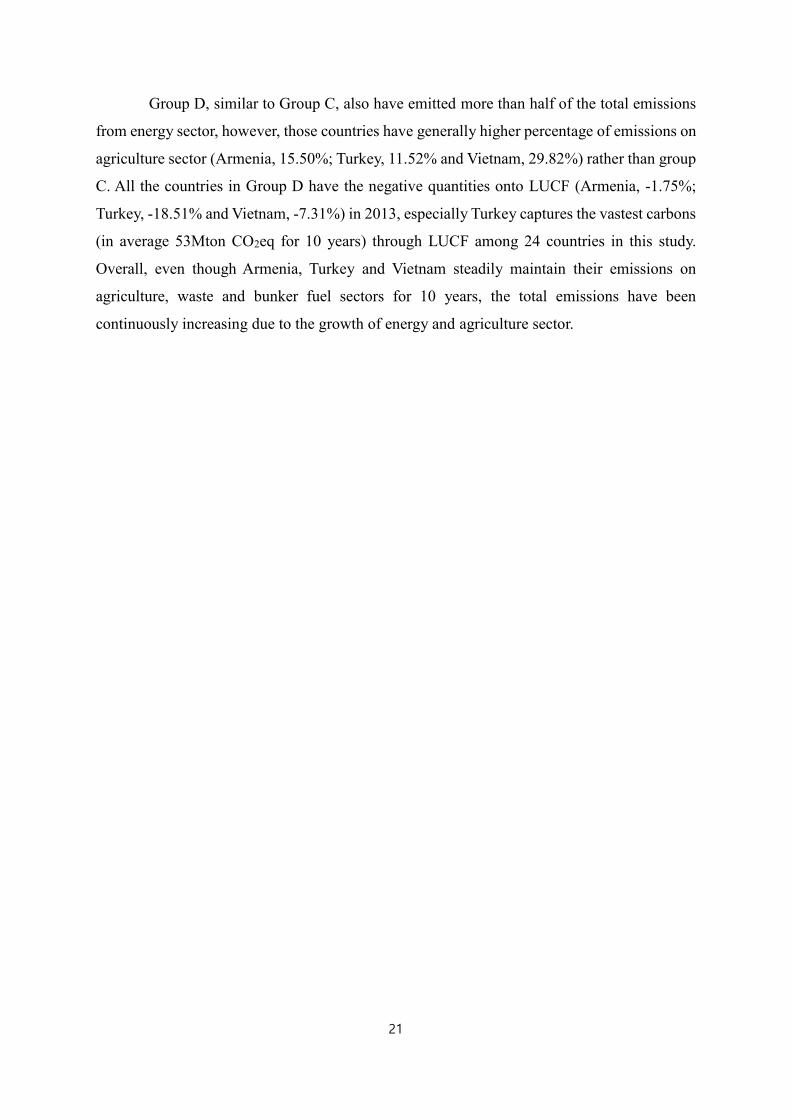
(a) Armenia (b) Turkey
(c) Vietnam
Figure 9. GHG inventory of Group D for 10 years (2004-2013)
21
Group D, similar to Group C, also have emitted more than half of the total emissions
from energy sector, however, those countries have generally higher percentage of emissions on
agriculture sector (Armenia, 15.50%; Turkey, 11.52% and Vietnam, 29.82%) rather than group
C. All the countries in Group D have the negative quantities onto LUCF (Armenia, -1.75%;
Turkey, -18.51% and Vietnam, -7.31%) in 2013, especially Turkey captures the vastest carbons
(in average 53Mton CO2eq for 10 years) through LUCF among 24 countries in this study.
Overall, even though Armenia, Turkey and Vietnam steadily maintain their emissions on
agriculture, waste and bunker fuel sectors for 10 years, the total emissions have been
continuously increasing due to the growth of energy and agriculture sector.

22
(a) Azerbaijan (b) Brunei
(c) Iraq (d) Kazakhstan
(e) Kuwait (f) Oman
Figure 10. GHG inventory of Group E for 10 years (2004-2013)

23
Group E definitely emits the most of greenhouse gas through energy sector (averagely,
Azerbaijan, 92.60%; Brunei, 87.68%; Iraq, 90.92%; Kazakhstan, 88.72%; Kuwait, 95.44% and
Oman, 91.46) in contrast, industrial process sector (averagely, Azerbaijan, 1.94%; Brunei,
0.99%; Iraq, 1.54%; Kazakhstan, 1.38%; Kuwait, 1.41% and Oman, 2.58) is comparably less
than other groups. Remarkably, Brunei showed different aspect with the other countries in
Group E until 2010 and slightly changed due to reduction of LUCF emission, whereas the
energy sector had increased. Iraq, Kazakhstan and Oman indicated a great deal of emission
growth during the analyzed period due to the rapidly increasing energy sector for 10 years.
Abdul-Wahab et al. (2015) has found that as Oman have started producing their own liquid
fossil fuel and natural gas, the carbon emissions in Oman have drastically increased as a result
of combustion petroleum refined products, according to analyzing energy sector associated-
carbon emission trend from 1972 to 2013.

24
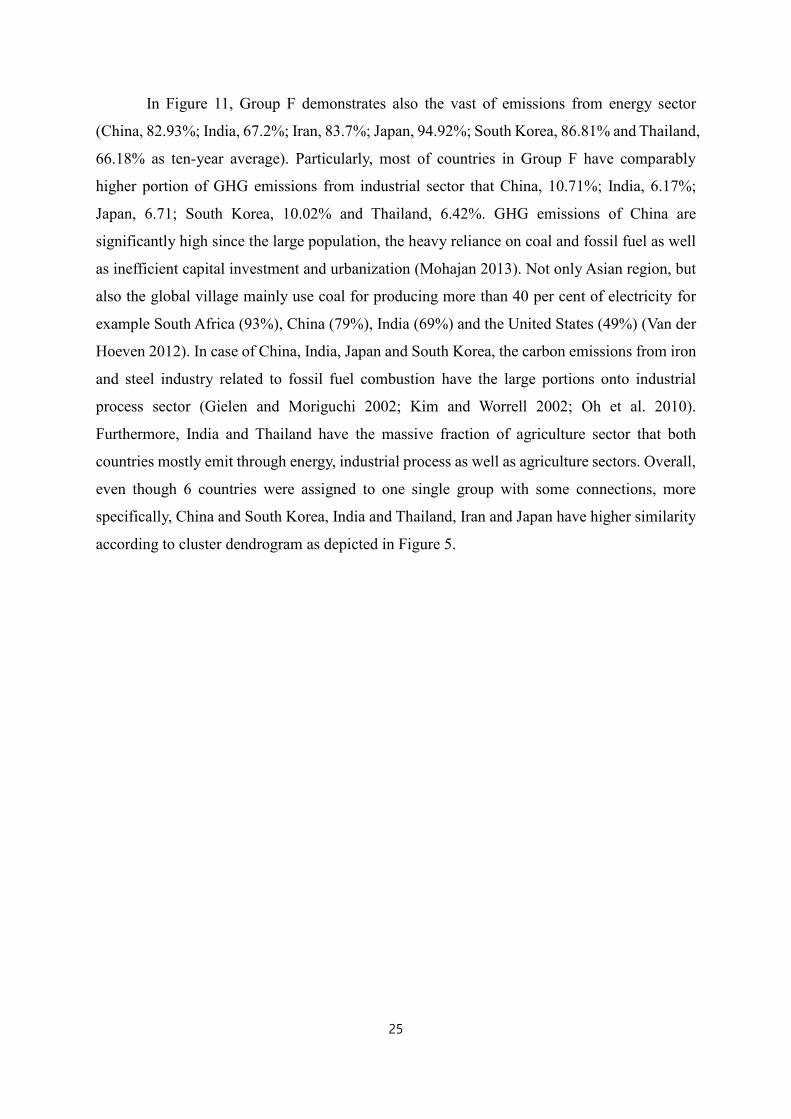
(a) China (b) India
(c) Iran (d) Japan
(e) Korea (South) (f) Thailand
Figure 11. GHG inventory of Group F for 10 years (2004-2013)
25
In Figure 11, Group F demonstrates also the vast of emissions from energy sector
(China, 82.93%; India, 67.2%; Iran, 83.7%; Japan, 94.92%; South Korea, 86.81% and Thailand,
66.18% as ten-year average). Particularly, most of countries in Group F have comparably
higher portion of GHG emissions from industrial sector that China, 10.71%; India, 6.17%;
Japan, 6.71; South Korea, 10.02% and Thailand, 6.42%. GHG emissions of China are
significantly high since the large population, the heavy reliance on coal and fossil fuel as well
as inefficient capital investment and urbanization (Mohajan 2013). Not only Asian region, but
also the global village mainly use coal for producing more than 40 per cent of electricity for
example South Africa (93%), China (79%), India (69%) and the United States (49%) (Van der
Hoeven 2012). In case of China, India, Japan and South Korea, the carbon emissions from iron
and steel industry related to fossil fuel combustion have the large portions onto industrial
process sector (Gielen and Moriguchi 2002; Kim and Worrell 2002; Oh et al. 2010).
Furthermore, India and Thailand have the massive fraction of agriculture sector that both
countries mostly emit through energy, industrial process as well as agriculture sectors. Overall,
even though 6 countries were assigned to one single group with some connections, more
specifically, China and South Korea, India and Thailand, Iran and Japan have higher similarity
according to cluster dendrogram as depicted in Figure 5.

26
3.4 Discussion
Cluster analysis suggested to establish GHG emission boundary in this study was
appropriate for assigning 6 clustered groups, because we could highlight that each clustered
group respectively has major and minor emission sectors among energy, industrial process,
agriculture, waste, land-use change and forestry (LUCF) as well as bunker fuel as summarized
in Table 6. Furthermore, the relation between topographical characteristics and climate (e.g.
tropical-, temperate- and dry climate) that probably influence carbon emission can also be
considered for more discussion following our research outcome.
Figure 12. Geographically marked as clustered group

27
Table 6. Overall perspectives for analyzed clustering group
Clustered
countries
Major emissions
sectors
Minor emissions
sectors LUCF value
Group A
Cambodia
Indonesia
Mongolia
Myanmar
LUCF
Agriculture
Industrial process
Waste
Bunker fuel
Positive quantity
Group B
Bangladesh
Nepal
Pakistan
Agriculture Bunker fuel Positive quantity
Group C Cyprus
UAE
Energy
Bunker fuel
Agriculture Negative quantity
Group D
Armenia
Turkey
Vietnam
Energy
Agriculture
Waste
Bunker fuel Negative quantity
Group E
Azerbaijan
Brunei
Iraq
Kazakhstan
Kuwait
Oman
Energy Industrial process
Waste
Bunker fuel
Negative quantity
(except Brunei)
Group F
China
India
Iran
Japan
Korea (South)
Thailand
Energy
Industrial process
Agriculture (only
India and Thailand)
Waste Negative quantity
(except Iran and
Thailand)
According to Table 6 that the key solution of this research, Group A mostly emits
GHGs through LUCF and agriculture sector, whereas rarely emits from industrial process. As
Xiao et al. (2006) reported, rice agriculture in South and Southeast Asia, including countries in
Group A provide a tremendous amount of harvest over a wide range of cropland area with
diverse climatic conditions. Due to the great dependence of their economy on crop agriculture,
large emission from agriculture sector would be continuously sustained. Furthermore,
Dagvadorj et al. (2009) pointed field burning and traditional animal husbandry can be a major
GHGs emission source in Mongolia. Consequentially, crop cultivation and livestock farming
performed by economic dependence, climatic environment and long tradition lead higher
emission from LUCF and agriculture sectors.
Group B has the vastest emission from agriculture sector and its growth rate is similar
or more rapid than energy sector. Because all the countries in Group B significantly rely on
agricultural production for their economic contributions (Shrestha and Aryal 2011; Sultana et
al. 2009; Yu et al. 2010), GHG emissions from agriculture sector deservedly stands out as

28
among the most sizable emission sector. Moreover, as a number of research articles investigated
the economic impacts of climate change on crop agriculture and cultivation in developing
countries (Chang 2002; Guiteras 2009; Kurukulasuriya and Ajwad 2007; Lansigan et al. 2000;
Wang et al. 2009), effective management and climate strategy focused on agriculture
production should be needed for both GHG emission reductions, food security. Difference
between Group A and B would be LUFC emission sector possibly caused from shifting
cultivation, tropical deforestation and clearing of secondary vegetation (Fearnside 2000; Miles
and Kapos 2008).
Bunker fuel emissions were highlighted in Group C unlike the other countries, due to
large usage of maritime shipping and power generation (Bensassi et al. 2011). However,
although we infer from Rodoulis (2010) that marine aviation and shipping led by geographic
position (e.g. island or sea-girt county) can be a potential comprehension to increase bunker
fuel emissions, implication from higher bunker fuel emission aspect in Group C was not
sufficiently accessible due to the lack of information.
Group D has large emissions from energy, agriculture and waste sectors. Moreover,
Turkey and Vietnam hold comparably large amount of carbons through LUCF stock. Waste
sector in Group D has turned out as one of the major emission sources unlike the other groups
in particular Turkey. Because they are reliant on the energy importing, Turkish government has
tried to increase the supply of renewable energy especially through the waste incineration and
digester of animal waste (Yuksel and Kaygusuz 2011), as a result waste sector is responsible
for relatively higher emission source.
Group E overwhelmingly generates GHGs from energy sector otherwise, industrial
process, waste and bunker fuel sectors are extremely little. Solanki et al. (2013) reported that
Oman and Kuwait well known as Gulf cooperation council (GCC) states cover most of their
domestic energy consumptions from fossil fuel, that finally plays an important role to
contribute higher emissions from energy sector. Furthermore, tax-free regulations as well as
subsidized electricity and energy will be one of the understandings that energy sector is the
most dominant GHG emission source in GCC countries and other oil-producing countries
(Qader 2009).
Group F similarly have massive portion onto energy sector, but contrary to Group E, a
chunk of industrial process sector occupies due to energy intensive manufacturing process (e.g.
cement, iron and steel industry). In addition, although both groups that Group E and Group F
29
emit large amount of greenhouse gas onto energy sector, they indicate different emission
properties according to the energy subsector data in Figure 13.
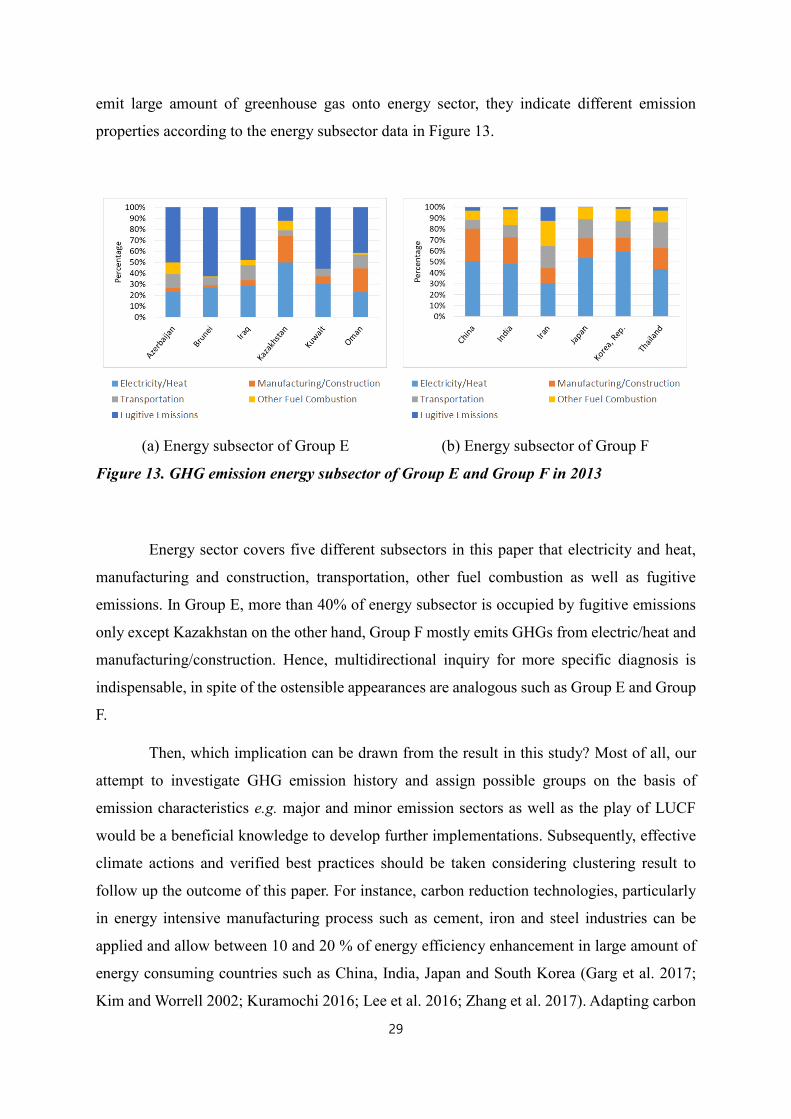
(a) Energy subsector of Group E (b) Energy subsector of Group F
Figure 13. GHG emission energy subsector of Group E and Group F in 2013
Energy sector covers five different subsectors in this paper that electricity and heat,
manufacturing and construction, transportation, other fuel combustion as well as fugitive
emissions. In Group E, more than 40% of energy subsector is occupied by fugitive emissions
only except Kazakhstan on the other hand, Group F mostly emits GHGs from electric/heat and
manufacturing/construction. Hence, multidirectional inquiry for more specific diagnosis is
indispensable, in spite of the ostensible appearances are analogous such as Group E and Group
F.
Then, which implication can be drawn from the result in this study? Most of all, our
attempt to investigate GHG emission history and assign possible groups on the basis of
emission characteristics e.g. major and minor emission sectors as well as the play of LUCF
would be a beneficial knowledge to develop further implementations. Subsequently, effective
climate actions and verified best practices should be taken considering clustering result to
follow up the outcome of this paper. For instance, carbon reduction technologies, particularly
in energy intensive manufacturing process such as cement, iron and steel industries can be
applied and allow between 10 and 20 % of energy efficiency enhancement in large amount of
energy consuming countries such as China, India, Japan and South Korea (Garg et al. 2017;
Kim and Worrell 2002; Kuramochi 2016; Lee et al. 2016; Zhang et al. 2017). Adapting carbon

30
footprint (CF) assessment and effective farm management during farm production (crops,
fertilizer, farm production, forage feeding and manure treatment) and consumption (sales and
distribution system as well as home dining) are also applicable for food security and climate
change mitigation especially in agricultural-economic based developing countries. Protection
of forests through reducing deforestation and illegally over-logging is significant particularly
in large amount of LUCF emitting countries (e.g. Group A) because forests play a greatly
important role for carbon sink by themselves. Thus, further framework for climate change
response can be suggested following the research outcome as summarized in Figure 14.
Figure 14. Further development framework for climate change strategy

31
4. CONCLUSION
This study explored the greenhouse gas emission information in 24 Asian countries on
the basis of national GHG inventory data during the ten years of period between 2004 and 2013.
In spite of the minuscule amount of potential inaccuracies and inconsistencies in CAIT data, it
was interesting to remark that assigning 6 clustered groups respectively have GHG emission
characteristics i.e. major and minor GHG emission sectors. As adapting one of hierarchical
clustering techniques that complete linkage method, it was meaningful to present our approach
for establishing boundaries of GHG emission features across certain Asian countries. Therefore,
the result of this study can provide fundamental reference to develop further climate mitigation
strategies.
Furthermore, the research outcome can be adapted as future directions and decision
criteria that determining practical reduction sectors, calculating the amount of carbon reduction
potential and considering best practice, technology, appropriate policy and regulatory
framework to establish climate change strategies corresponding to each clustered groups. Thus,
we expect that this innovative approach for clarify emission attributes would be useful to policy
makers, environmental scientists, decision makers as well as planners for extending further
implementation at the local government, national and regional levels.
Although we present GHG emission analysis and suitable clustered groups, some of
national GHG inventory data were omitted or not sufficiently built due to the different possible
errors. As implied in Figure 14, it is significant to establish well-organized framework for
further development and improvement of climate change mitigation strategy. Hence, more
accurate and reliable GHG emission information should be established for effective approach
to climate change implementation. Overall, the first step of entirely reviewing the wide range
of GHG emission histories and sectoral GHG emission properties would be beneficial to
develop reduction potential in Asian region as a guideline. At the same time, further study for
evaluating specific reduction in the amount of carbon and improving climate change mitigation
strategy is to be carried out to successfully drive and manage the forthcoming achievement for
human well-being and sustainable societies in Asia.

32
5. ACKNOWLEDGEMENT
This work is financially supported by Ministry of Environment (MOE), South Korea as
「Knowledge based environmental service Human resource development Project」. Furthermore, we
appreciate to World Resources Institute (WRI) for sharing country GHG emissions data across the
world through the Climate Access Indicators Tool (CAIT, http://cait.wri.org/).
6. REFERENCE
Aaheim A, Amundsen H, Dokken T, Wei T (2012) Impacts and adaptation to climate change in
European economies Global Environmental Change 22:959-968
Abdul-Wahab SA, Charabi Y, Al-Maamari R, Al-Rawas GA, Gastli A, Chan K (2015) CO 2 greenhouse
emissions in Oman over the last forty-two years Renewable and Sustainable Energy Reviews
52:1702-1712
Al-Nuaimy W, Huang Y, Nakhkash M, Fang M, Nguyen V, Eriksen A (2000) Automatic detection of
buried utilities and solid objects with GPR using neural networks and pattern recognition
Journal of applied Geophysics 43:157-165
An F, Sauer A (2004) Comparison of passenger vehicle fuel economy and greenhouse gas emission
standards around the world Pew Center on Global Climate Change 25
Backman CA, Verbeke A, Schulz RA (2017) The drivers of corporate climate change strategies and
public policy: a new resource-based view perspective Business & Society 56:545-575
Bajracharya SR, Mool PK, Shrestha BR (2007) Impact of climate change on Himalayan glaciers and
glacial lakes: case studies on GLOF and associated hazards in Nepal and Bhutan. International
Centre for Integrated Mountain Development Kathmandu,
Bensassi S, Márquez-Ramos L, Martínez-Zarzoso I, Zitouna H The geography of trade and the
environment: The case of CO2 emissions. In: Economic Research Forum Working Papers, 2011.
vol 635.
Botzen WJ, Gowdy JM, van den Bergh JC (2008) Cumulative CO2 emissions: shifting international
responsibilities for climate debt Climate policy 8:569-576
Bouguettaya A, Yu Q, Liu X, Zhou X, Song A (2015) Efficient agglomerative hierarchical clustering
Expert Systems with Applications 42:2785-2797
Chang CC (2002) The potential impact of climate change on Taiwan's agriculture Agricultural
Economics 27:51-64
Clarke L, Edmonds J, Jacoby H, Pitcher H, Reilly J, Richels R (2007) Scenarios of greenhouse gas
emissions and atmospheric concentrations US Department of Energy Publications:6
Dagvadorj D, Natsagadorj L, Dorjpurev J, Namkhainyam B (2009) MARCC 2009: Mongolia
assessment report on climate change 2009.
Dulal HB, Akbar S (2013) Greenhouse gas emission reduction options for cities: Finding the
“Coincidence of Agendas” between local priorities and climate change mitigation objectives
Habitat International 38:100-105
Falkner R (2016) The Paris Agreement and the new logic of international climate politics International
Affairs 92:1107-1125
Fearnside PM (2000) Global warming and tropical land-use change: greenhouse gas emissions from
biomass burning, decomposition and soils in forest conversion, shifting cultivation and

33
secondary vegetation Climatic change 46:115-158
Ferrari DG, De Castro LN (2015) Clustering algorithm selection by meta-learning systems: A new
distance-based problem characterization and ranking combination methods Information
Sciences 301:181-194
Garg A, Shukla P, Kankal B, Mahapatra D (2017) CO2 emission in India: trends and management at
sectoral, sub-regional and plant levels Carbon Management 8:111-123
Gielen D, Moriguchi Y (2002) CO 2 in the iron and steel industry: an analysis of Japanese emission
reduction potentials Energy policy 30:849-863
Guiteras R (2009) The impact of climate change on Indian agriculture Manuscript, Department of
Economics, University of Maryland, College Park, Maryland
Huq S (2001) Climate change and Bangladesh Science 294:1617-1617
Jain AK, Duin RPW, Mao J (2000) Statistical pattern recognition: A review IEEE Transactions on
pattern analysis and machine intelligence 22:4-37
Jiang X, Mira D, Cluff D (2016) The combustion mitigation of methane as a non-CO 2 greenhouse gas
Progress in Energy and Combustion Science
Juaidi A, Montoya FG, Gázquez JA, Manzano-Agugliaro F (2016) An overview of energy balance
compared to sustainable energy in United Arab Emirates Renewable and Sustainable Energy
Reviews 55:1195-1209
Kafle S, Parajuli R, Bhattarai S, Euh SH, Kim DH (2017) A review on energy systems and GHG
emissions reduction plan and policy of the Republic of Korea: Past, present, and future
Renewable and Sustainable Energy Reviews 73:1123-1130
Kasneci E, Kasneci G, Schiefer U, Rosenstiel W Rule-based Classification of Visual Field Defects. In:
HEALTHINF, 2014. pp 34-42
Kaufman L, Rousseeuw PJ (2009) Finding groups in data: an introduction to cluster analysis vol 344.
John Wiley & Sons,
Kim Y, Worrell E (2002) International comparison of CO 2 emission trends in the iron and steel industry
Energy policy 30:827-838
Knox J, Hess T, Daccache A, Wheeler T (2012) Climate change impacts on crop productivity in Africa
and South Asia Environmental Research Letters 7:034032
Kuramochi T (2016) Assessment of midterm CO 2 emissions reduction potential in the iron and steel
industry: a case of Japan Journal of Cleaner Production 132:81-97
Kurukulasuriya P, Ajwad MI (2007) Application of the Ricardian technique to estimate the impact of
climate change on smallholder farming in Sri Lanka Climatic Change 81:39-59
Lansigan F, De los Santos W, Coladilla J (2000) Agronomic impacts of climate variability on rice
production in the Philippines Agriculture, ecosystems & environment 82:129-137
Lasco RD, Pulhin FB (2000) Forest land use change in the Philippines and climate change mitigation
Mitigation and adaptation strategies for global change 5:81-97
Lee H, Matsuura H, Sohn I (2016) Symbiosis of Steel, Energy, and CO2 Evolution in Korea
Metallurgical and Materials Transactions E 3:171-178
Li L, Hong X, Tang D, Na M (2016) GHG Emissions, Economic Growth and Urbanization: A Spatial
Approach Sustainability 8:462
Li M, Deng S, Wang L, Feng S, Fan J (2014) Hierarchical clustering algorithm for categorical data
using a probabilistic rough set model Knowledge-Based Systems 65:60-71
Liu et al. (2016) Uncovering driving forces on greenhouse gas emissions in China’aluminum industry
from the perspective of life cycle analysis Applied Energy 166:253-263
Liu, Geng Y, Lindner S, Guan D (2012) Uncovering China’s greenhouse gas emission from regional
and sectoral perspectives Energy 45:1059-1068
Marcotullio PJ, Sarzynski A, Albrecht J, Schulz N (2012) The geography of urban greenhouse gas
emissions in Asia: A regional analysis Global Environmental Change 22:944-958
Martinez WL, Martinez AR (2007) Computational statistics handbook with MATLAB vol 22. CRC
press,
Miles L, Kapos V (2008) Reducing greenhouse gas emissions from deforestation and forest degradation:
global land-use implications science 320:1454-1455
Mirasgedis S, Sarafidis Y, Georgopoulou E, Lalas D, Papastavros C (2004) Mitigation policies for

34
energy related greenhouse gas emissions in Cyprus: the potential role of natural gas imports
Energy Policy 32:1001-1011
Mohajan H (2013) Greenhouse gas emissions of China Journal of Environmental Treatment Techniques
1:190-202
Montzka SA, Dlugokencky EJ, Butler JH (2011) Non-CO2 greenhouse gases and climate change Nature
476:43
Mottet A et al. (2017) Climate change mitigation and productivity gains in livestock supply chains:
insights from regional case studies Regional Environmental Change 17:129-141
Murdiyarso D, Lebel L (2007) Local to global perspectives on forest and land fires in Southeast Asia
Mitigation and Adaptation Strategies for Global Change 12:3-11
Murtagh F, Legendre P (2014) Ward’s hierarchical agglomerative clustering method: which algorithms
implement Ward’s criterion? Journal of Classification 31:274-295
Oh I, Wehrmeyer W, Mulugetta Y (2010) Decomposition analysis and mitigation strategies of CO 2
emissions from energy consumption in South Korea Energy Policy 38:364-377
Qader MR (2009) Electricity consumption and GHG emissions in GCC countries Energies 2:1201-1213
Rhodes CJ (2016) The 2015 Paris climate change conference: COP21 Science progress 99:97-104
Rodoulis N (2010) Evaluation of Cyprus’ electricity generation planning using mean-variance portfolio
theory Cyprus Economic Policy Review 4:25-42
Ryberg M (2015) Molecular operational taxonomic units as approximations of species in the light of
evolutionary models and empirical data from Fungi Molecular ecology 24:5770-5777
Rypdal K, Winiwarter W (2001) Uncertainties in greenhouse gas emission inventories—evaluation,
comparability and implications Environmental Science & Policy 4:107-116
Sasaki N (2006) Carbon emissions due to land-use change and logging in Cambodia: a modeling
approach Journal of forest research 11:397-403
Schneider EN, Riley R, Espey E, Mishra SI, Singh RH (2017) Nitrous oxide for pain management
during in-office hysteroscopic sterilization: a randomized controlled trial Contraception
95:239-244
Searchinger T et al. (2008) Use of US croplands for biofuels increases greenhouse gases through
emissions from land-use change Science 319:1238-1240
Shrestha AB, Aryal R (2011) Climate change in Nepal and its impact on Himalayan glaciers Regional
Environmental Change 11:65-77
Sibley KM, Voth J, Munce SE, Straus SE, Jaglal SB (2014) Chronic disease and falls in community-
dwelling Canadians over 65 years old: a population-based study exploring associations with
number and pattern of chronic conditions BMC geriatrics 14:22
Solanki PS, Mallela VS, Zhou C (2013) Estimation and diminution of co2 emissions by clean
development mechanism option at power sector in Oman International Journal of Energy and
environment 4:641-652
Sulbaek Andersen MP, Kyte M, Andersen ST, Nielsen CJ, Nielsen OJ (2017) Atmospheric Chemistry
of (CF3)2CF-C≡N: A Replacement Compound for the Most Potent Industrial Greenhouse Gas,
SF6 Environmental science & technology 51:1321-1329
Sultana H, Ali N, Iqbal MM, Khan AM (2009) Vulnerability and adaptability of wheat production in
different climatic zones of Pakistan under climate change scenarios Climatic Change 94:123-
142
Timilsina GR, Shrestha A (2009) Transport sector CO 2 emissions growth in Asia: underlying factors
and policy options Energy Policy 37:4523-4539
UNFCCC Report of the Conference of the Parties on its twenty-first session, held in Paris from 30
November to 13 December 2015. In: Addendum. Part Two: Action taken by the Conference of
the Parties at its twenty-first session, 2015.
Van der Hoeven M (2012) World energy outlook 2012 Paris: International Energy Agency
Verchot LV et al. (2010) Reducing forestry emissions in Indonesia
Vogel H, Flerus B, Stoffner F, Friedrich B (2017) Reducing Greenhouse Gas Emission from the
Neodymium Oxide Electrolysis. Part I: Analysis of the Anodic Gas Formation Journal of
Sustainable Metallurgy 3:99-107
Wang J, Mendelsohn R, Dinar A, Huang J, Rozelle S, Zhang L (2009) The impact of climate change on

35
China's agriculture Agricultural Economics 40:323-337
Webb AR (2003) Statistical pattern recognition. John Wiley & Sons,
Weisser D (2007) A guide to life-cycle greenhouse gas (GHG) emissions from electric supply
technologies Energy 32:1543-1559
Wigand C et al. (2017) A climate change adaptation strategy for management of coastal marsh systems
Estuaries and Coasts 40:682-693
Woodcock J et al. (2009) Public health benefits of strategies to reduce greenhouse-gas emissions: urban
land transport The Lancet 374:1930-1943
Wright J, Ma Y, Mairal J, Sapiro G, Huang TS, Yan S (2010) Sparse representation for computer vision
and pattern recognition Proceedings of the IEEE 98:1031-1044
Xiao X, Boles S, Frolking S, Li C, Babu JY, Salas W, Moore B (2006) Mapping paddy rice agriculture
in South and Southeast Asia using multi-temporal MODIS images Remote Sensing of
Environment 100:95-113
Yu W et al. (2010) Climate change risks and food security in Bangladesh. Routledge,
Yuksel I, Kaygusuz K (2011) Renewable energy sources for clean and sustainable energy policies in
Turkey Renewable and Sustainable Energy Reviews 15:4132-4144
Zadegan SMR, Mirzaie M, Sadoughi F (2013) Ranked k-medoids: A fast and accurate rank-based
partitioning algorithm for clustering large datasets Knowledge-Based Systems 39:133-143
Zhang, Chen Z, Qiao H, Chen B, Hayat T, Alsaedi A (2015) China's non-CO 2 greenhouse gas emissions:
Inventory and input–output analysis Ecological Informatics 26:101-110
Zhang Q, Zhao X, Lu H, Ni T, Li Y (2017) Waste energy recovery and energy efficiency improvement
in China’s iron and steel industry Applied Energy 191:502-520